Abstract
Under cyclic moving load action, tensile-dominant structures are prone to crack initiation due to cumulative damage effects. The presence of cracks leads to structural stiffness degradation and nonlinear redistribution of dynamic characteristics, thereby compromising str18uctural integrity and service performance. The current research on the dynamic behavior of cracked structures predominantly focuses on transient analysis through high-fidelity finite element models. However, the existing methodologies encounter two critical limitations: computational inefficiency and a trade-off between model fidelity and practicality. Thus, this study presents an innovative analytical framework to investigate the dynamic response of cracked simply supported beams subjected to moving loads. The proposed methodology conceptualizes the cracked beam as a system composed of multiple interconnected sub-beams, each governed by the Euler–Bernoulli beam theory. At crack locations, massless rotational springs are employed to accurately capture the local flexibility induced by these defects. The transfer matrix method is utilized to derive explicit eigenfunctions for the cracked beam system, thereby facilitating the formulation of coupled vehicle–bridge vibration equations through modal superposition. Subsequently, dynamic response analysis is conducted using the Runge–Kutta numerical integration scheme. Extensive numerical simulations reveal the influence of critical parameters—particularly crack depth and location—on the coupled dynamic behavior of the structure subjected to moving loads. The results indicate that at a constant speed, neither crack depth nor position alters the shape of the beam’s vibration curve. The maximum deflection of beams with a 30% crack in the middle span increases by 14.96% compared to those without cracks. Furthermore, crack migration toward the mid-span results in increased mid-span displacement without changing vibration curve topology. For a constant crack depth ratio (γi = 0.3), the progressive migration of the crack position from 0.05 L to 0.5 L leads to a 26.4% increase in the mid-span displacement (from 5.3 mm to 6.7 mm). These findings highlight the efficacy of the proposed method in capturing the complex interactions between moving loads and cracked concrete structures, offering valuable insights for structural health monitoring and assessment.
1. Introduction
Cracks represent one of the most prevalent forms of structural degradation in structure engineering, significantly impacting stiffness distribution and dynamic characteristics, particularly in members such as concrete girders. The emergence of cracks induces localized stiffness reduction in girders, thereby altering the overall stiffness distribution and affecting the vibration behavior of the structure. This phenomenon manifests as changes in modal shapes and natural frequencies. Zhou et al. [1] quantitatively assessed this effect, demonstrating that the final equivalent flexural rigidity of the girders is 30% of the initial equivalent flexural rigidity, and the final dynamic stiffness is approximately 84% of the initial dynamic stiffness. The study by Zhang et al. [2] further revealed the impact of shear cracking on the shear stiffness of concrete box girder bridges. After the first diagonal crack appears, the shear stiffness decreases significantly, dropping to approximately 40% of the original stiffness. Such stiffness deterioration not only alters structural dynamic properties but also accelerates failure mechanisms under dynamic loading conditions [3,4]. Notably, moving loads induce more severe structural responses compared to static equivalents, leading to greater deflections and higher stress concentrations [5]. Therefore, it is meaningful to analyze the dynamic response in cracked concrete structures subjected to moving loads.
The equivalent reduced section method has been developed for seventy years, which aims to quantify the stiffness reduction in a cracked region using a local bending moment and a reduced section [6]. However, the limitations of the equivalent section method in practical applications became increasingly apparent, prompting Dimarogonas et al. [7] to propose a more sophisticated approach utilizing massless torsional springs based on fracture mechanics principles. This innovation laid the foundation for the local flexibility method, which has since been extensively developed. Zhong and Oyadiji [8] approximated closed-form analytical expressions are derived for the natural frequencies of an arbitrary mode of vibration of a cracked simply supported beam using Rayleigh’s method, and studied the effects of crack depth and crack location on the natural frequency of the beam, while Aydin et al. [9] investigated the effects of crack depth, crack location, total number of cracks, material property distribution, and boundary conditions on the natural frequencies of damaged functionally graded material beams. Li et al. [10] further enhanced computational efficiency through their innovative approach to free vibration analysis in variable-section beams with multiple cracks and concentrated masses.
Recent theoretical developments have significantly enhanced analytical capabilities. Chondros et al. [11] formulated a comprehensive vibration theory for Euler–Bernoulli beams with single or double-edge cracks. Lin et al. [12] introduced an efficient transfer matrix method for analyzing multi-cracked beam structures, maintaining computational efficiency through constant matrix dimensionality. Complementary approaches by Bakhtiari-Nejad et al. [13] and Lin [14] have provided additional analytical tools for frequency analysis and inverse problem solutions. Contemporary research by Lee et al. [15] and Nguyen [16] has expanded the methodological repertoire, while Liu D et al. [17] applied the sub-domain Chebyshev–Ritz method to study the free vibration of beams with open cracks at the clamped end. While the dynamic response of intact bridges under moving vehicle loads has been extensively investigated [18,19,20,21], the corresponding analysis of cracked bridge structures remains relatively underdeveloped. Mahmoud and Zaid [22] pioneered the application of iterative modal analysis for assessing crack effects in simply supported beams under moving mass conditions. Subsequent studies by Nguyen and Tran [23], Law et al. [24], and Zhou et al. [25] have progressively refined our understanding of vehicle–bridge interaction in damaged structures. Shafiei and Khaji [26] modeled a cracked beam using beam segments connected by massless linear elastic rotational springs with cross-sectional flexibility, assumed that each segment of the continuous beam satisfies the Timoshenko beam theory, and finally investigated the effects of crack parameters and moving load velocity on the bridge response. Recent contributions by Pala et al. [27], Saimi et al. [28], and Ghannadiasl et al. [29] have introduced sophisticated analytical models incorporating advanced beam theories and comprehensive boundary conditions. However, few studies have systematically quantified how crack location and depth influence the maximum deflection characteristics induced by moving vehicles.
This study presents a novel analytical approach for evaluating the dynamic response of cracked simply supported beams under moving loads based on the Euler–Bernoulli beam theory. The proposed methodology incorporates massless rotational springs to accurately represent crack-induced local flexibility. Through the integration of transfer matrix methods and modal superposition techniques, explicit eigenfunctions are derived, enabling the establishment of coupled vehicle–bridge vibration equations. The dynamic response is subsequently solved using the Runge–Kutta method. Numerical simulations demonstrate the efficacy of this approach in accurately capturing the dynamic response of cracked bridges subjected to vehicular loads. Furthermore, the analysis highlights the substantial influence of crack depth and location on the deflection characteristics.
2. Theoretical Model
2.1. Mode Shape Function of a Damaged Beam with Cracks
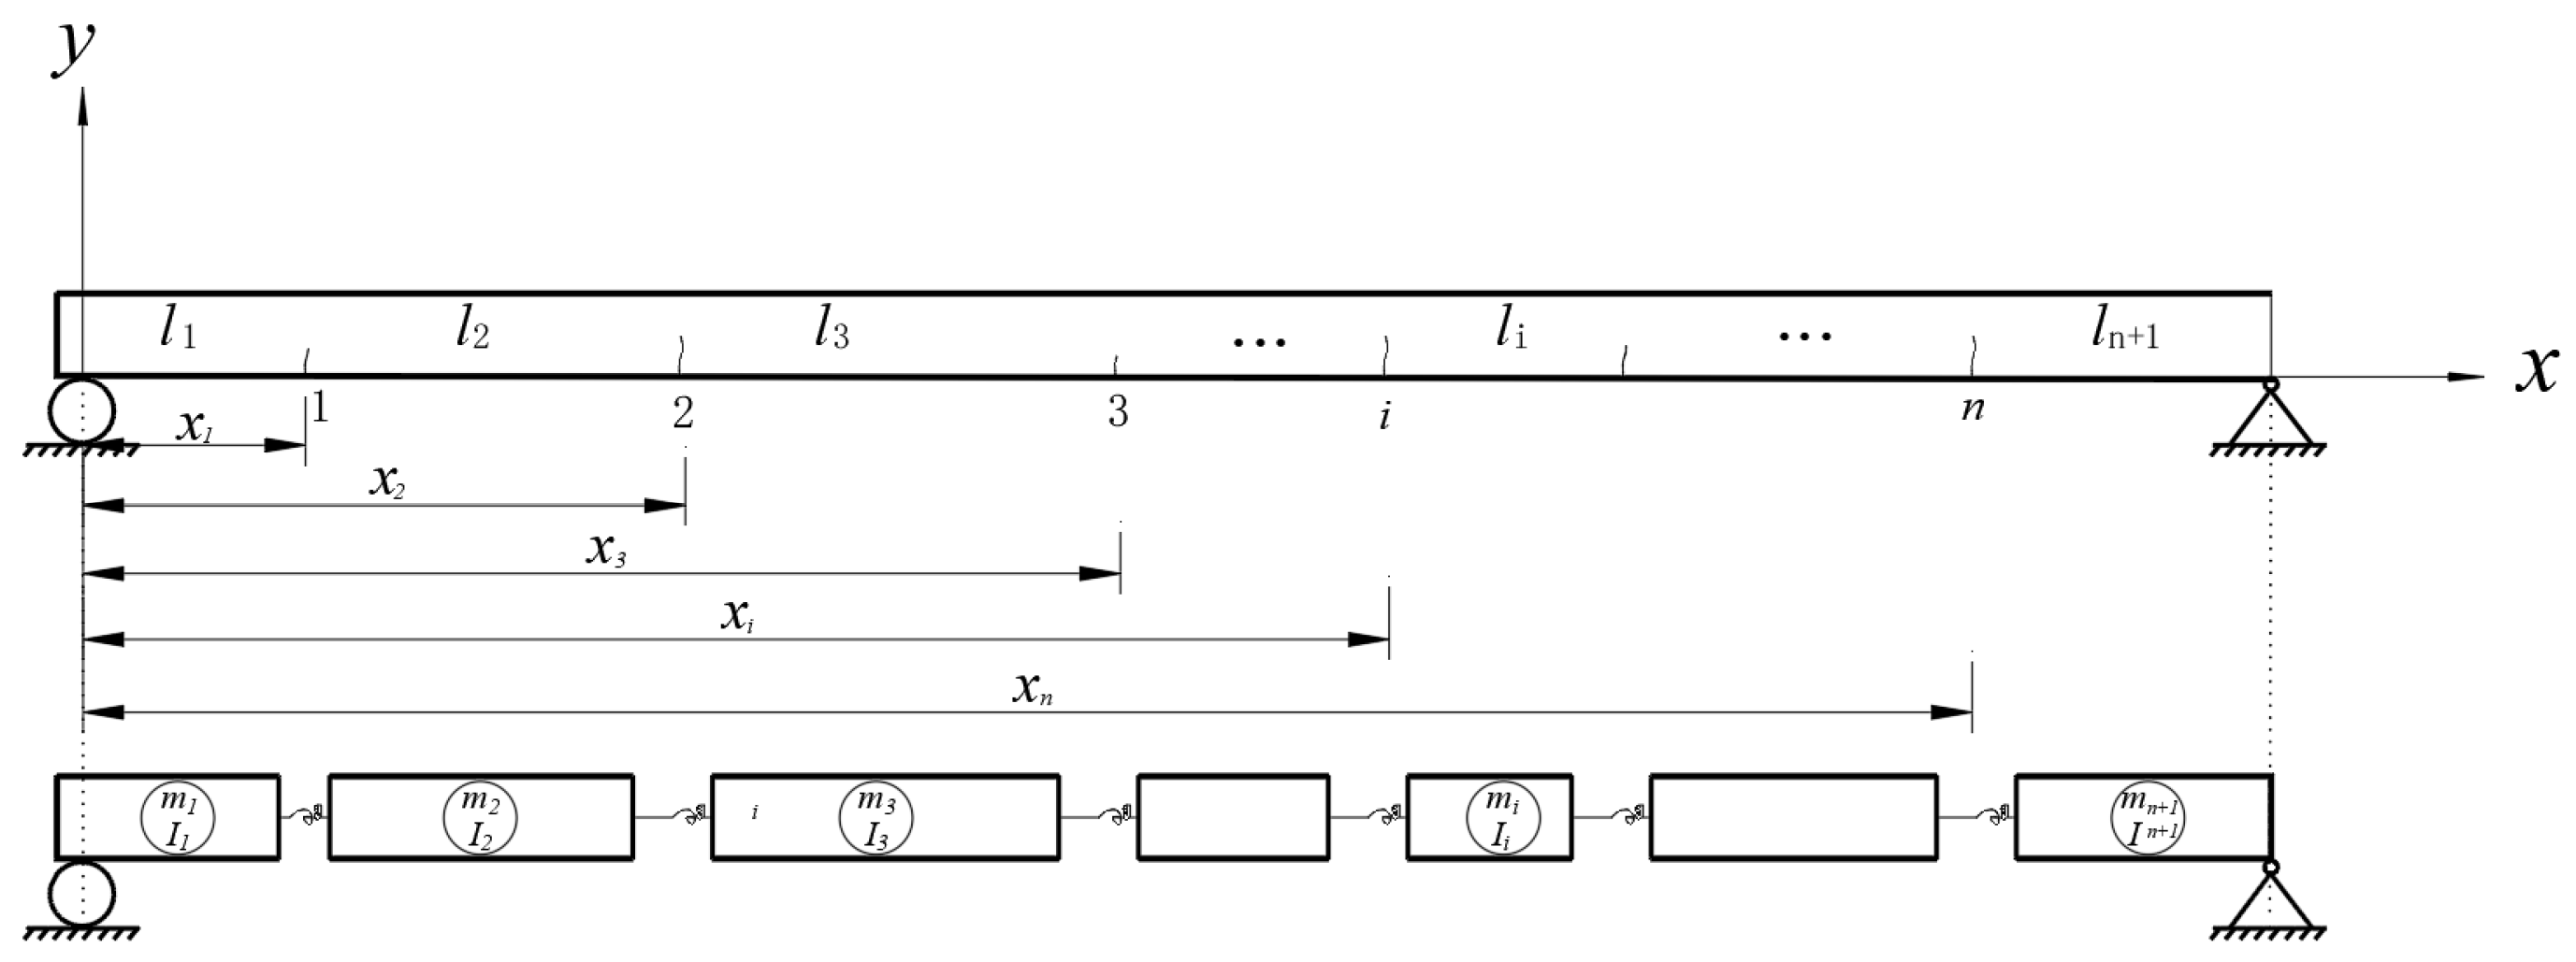
A simply supported Euler–Bernoulli beam with n transverse cracks is illustrated in Figure 1. The beam is characterized by an isotropic material composition and a uniform rectangular cross-section. For analytical simplification, all the cracks are assumed to remain open throughout the loading conditions. Each transverse crack is represented as a massless rotational spring in the theoretical model, effectively capturing the local flexibility induced by the crack. The geometric parameters of the system are defined as follows: denotes the length of the i-th beam segment bounded by adjacent cracks, and represents the coordinate of the i-th crack location along the beam axis.
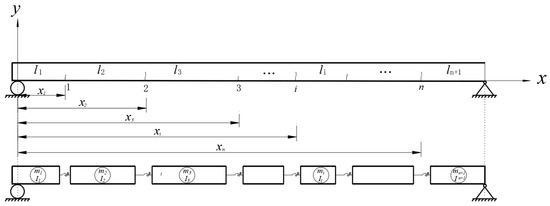
Figure 1.
n-crack simply supported beam.
The presence of n transverse cracks partitions the beam into n + 1 distinct segments. Based on the fundamental principles of the Euler–Bernoulli beam theory, the governing differential equation for undamped flexural vibration within each homogeneous segment can be expressed as follows:
where ; ; ; represents Young’s modulus of the beam material; denotes the cross-sectional moment of inertia; corresponds to the mass per unit length of the beam; and signifies the natural frequency of the cracked beam.
The general solution to the governing differential equation (Equation (1)) can be expressed in the following form:
where represents the undetermined coefficients of the general solution.
According to the equilibrium conditions of displacement, bending moment, and shear force at the -th crack of the beam, it can be concluded that
To accurately characterize the localized flexibility introduced by transverse cracks, a massless rotational spring model is employed in this study. The discontinuity in slope at the j-th crack location within the i-th beam segment can be mathematically expressed as follows:
where represents the dimensionless local flexibility coefficient associated with the i-th crack. For a beam with a rectangular cross-section containing a single-edge crack, the flexibility coefficient can be expressed as follows [10]:
where denotes the total height of the beam’s cross-section and represents the normalized crack depth ratio, defined as , with being the absolute depth of the i-th crack.
By systematically integrating the governing equations (Equations (2)–(4)) through matrix operations, the transfer matrix relationship between adjacent beam segments can be derived as follows:
where ; represents the transfer matrix corresponding to the i-th crack, whose matrix elements have been rigorously derived in Ref. [12]. Consequently, for a multi-cracked beam system containing n transverse cracks, the global transfer relationship between the state vectors at the right and left ends can be expressed as follows:
where is as follows:
Based on the fundamental principles of material mechanics, the bending moment and shear force at any cross-section of the beam can be derived from the following relationships:
Considering a simply supported beam as a representative case, the corresponding boundary conditions can be mathematically expressed as follows:
At x1 = 0 (left support)
At xn+1 = ln+1 (right support)
By commencing the analysis with the left support boundary conditions and integrating the governing equations (Equation (2)) alongside the boundary conditions (Equation (11a,b)), the following relationship can be derived:
By substituting the boundary condition solution (Equation (12)) into the transfer matrix equation (Equation (8)), the following relationship can be obtained:
To satisfy the boundary conditions at the right support, the application of Equation (11c,d) in conjunction with the governing equation (Equation (2)) yields the following system of equations:
The governing frequency equation is derived through the substitution of the characteristic Equation (13) into the boundary condition matrix (14), yielding the following:
where the stiffness matrix components are defined as follows:
The existence of non-trivial solutions requires satisfaction of the following frequency determinant condition:
The n-th order natural frequency of the whole beam is analytically determined through the eigenvalue analysis of Equation (18), while the complete set of mode shapes can be systematically reconstructed by substituting the solved eigenvalues back into the modal superposition Equation (2) with appropriate normalization.
2.2. Analytical Model of Vehicle—Cracked Beam Bridge Coupled System
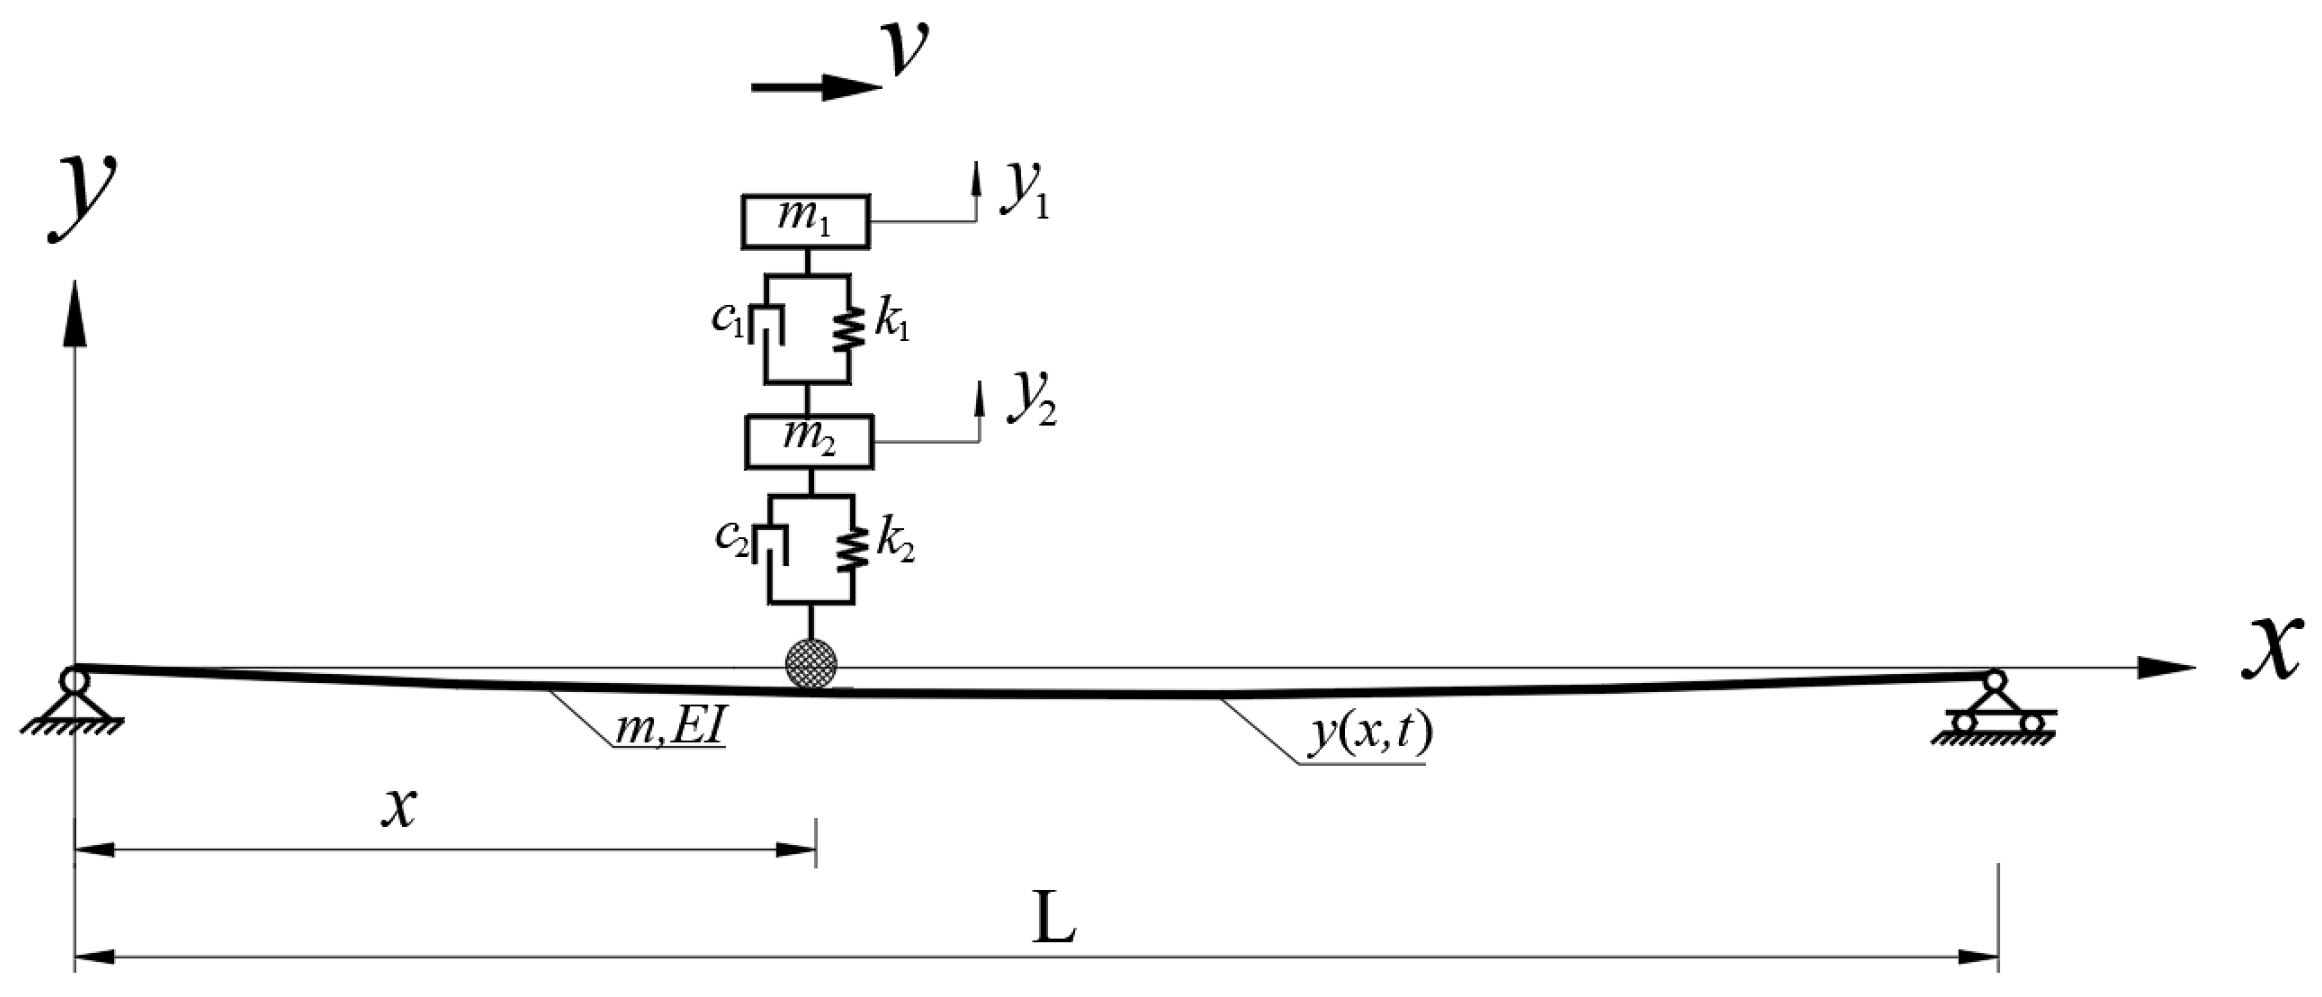
As illustrated in Figure 2, the vehicle is modeled as a two-degree-of-freedom spring–damper–mass system. In this schematic representation, m1 denotes the mass of the vehicle body (sprung mass), while m2 represents the combined mass of the bogie structure and wheel set (unsprung mass). The system parameters are defined as follows: k1 signifies the suspension stiffness, k2 signifies the tire stiffness, c1 represents the suspension viscous damping coefficient, c2 represents the tire viscous damping coefficient, and v indicates the vehicle’s traveling velocity. The dynamic response of the system is characterized by y(x,t), which denotes the vertical deflection of the bridge’s center line at position x and time t. Additionally, y1(t) and y2(t) represent the absolute vertical displacements of masses m1 and m2, respectively, measured relative to a fixed reference frame.
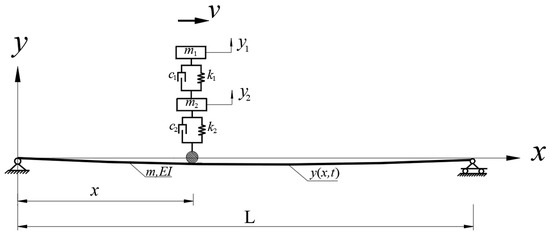
Figure 2.
A 1/4 vehicle–bridge coupling model.
Based on the principles of structural dynamics and vehicle–bridge interaction theory, the governing differential equations for the vertical coupled vibration of the vehicle–bridge system can be derived as follows:
where is the Dirac function.
The vertical displacement y(x,t) of the beam can be expressed as a linear combination of the mode shape functions as Equation (23), and can be obtained from the solution of the eigenvalue problem (Equation (16)):
Substitute Equation (23) into Equations (19), (21), and (22); multiply both sides based on the orthogonality of the vibration mode; and integrate from 0 to L:
where mb represents the mass of the unit length beam; represents the i-th natural frequency of the bridge; and represents the i-th vibration modal damping ratio.
Through the systematic integration of the cracked beam’s eigenvalue solutions from Equation (17) and Equation (18) with the vehicle subsystem dynamics governed by Equations (25) and (26), a matrix equation for the cracked beam–vehicle coupled vibration is established as Equation (27).
where is the displacement vector containing all degrees of freedom of the coupled system , represents the mass matrix of the vehicle–cracked beam coupled system, is the damping matrix of the vehicle–cracked beam coupled system, signifies the stiffness matrix of the vehicle–cracked beam coupled system, represents the inertial load vector induced by vehicle motion and dynamic interaction.
2.3. Algorithm for Coupled Analysis of Cracked Beam Bridge–Vehicle Interaction
2.3.1. Semi-Interval Iterative Method for Analyzing Dynamic Characteristics of Cracked Beam Bridges
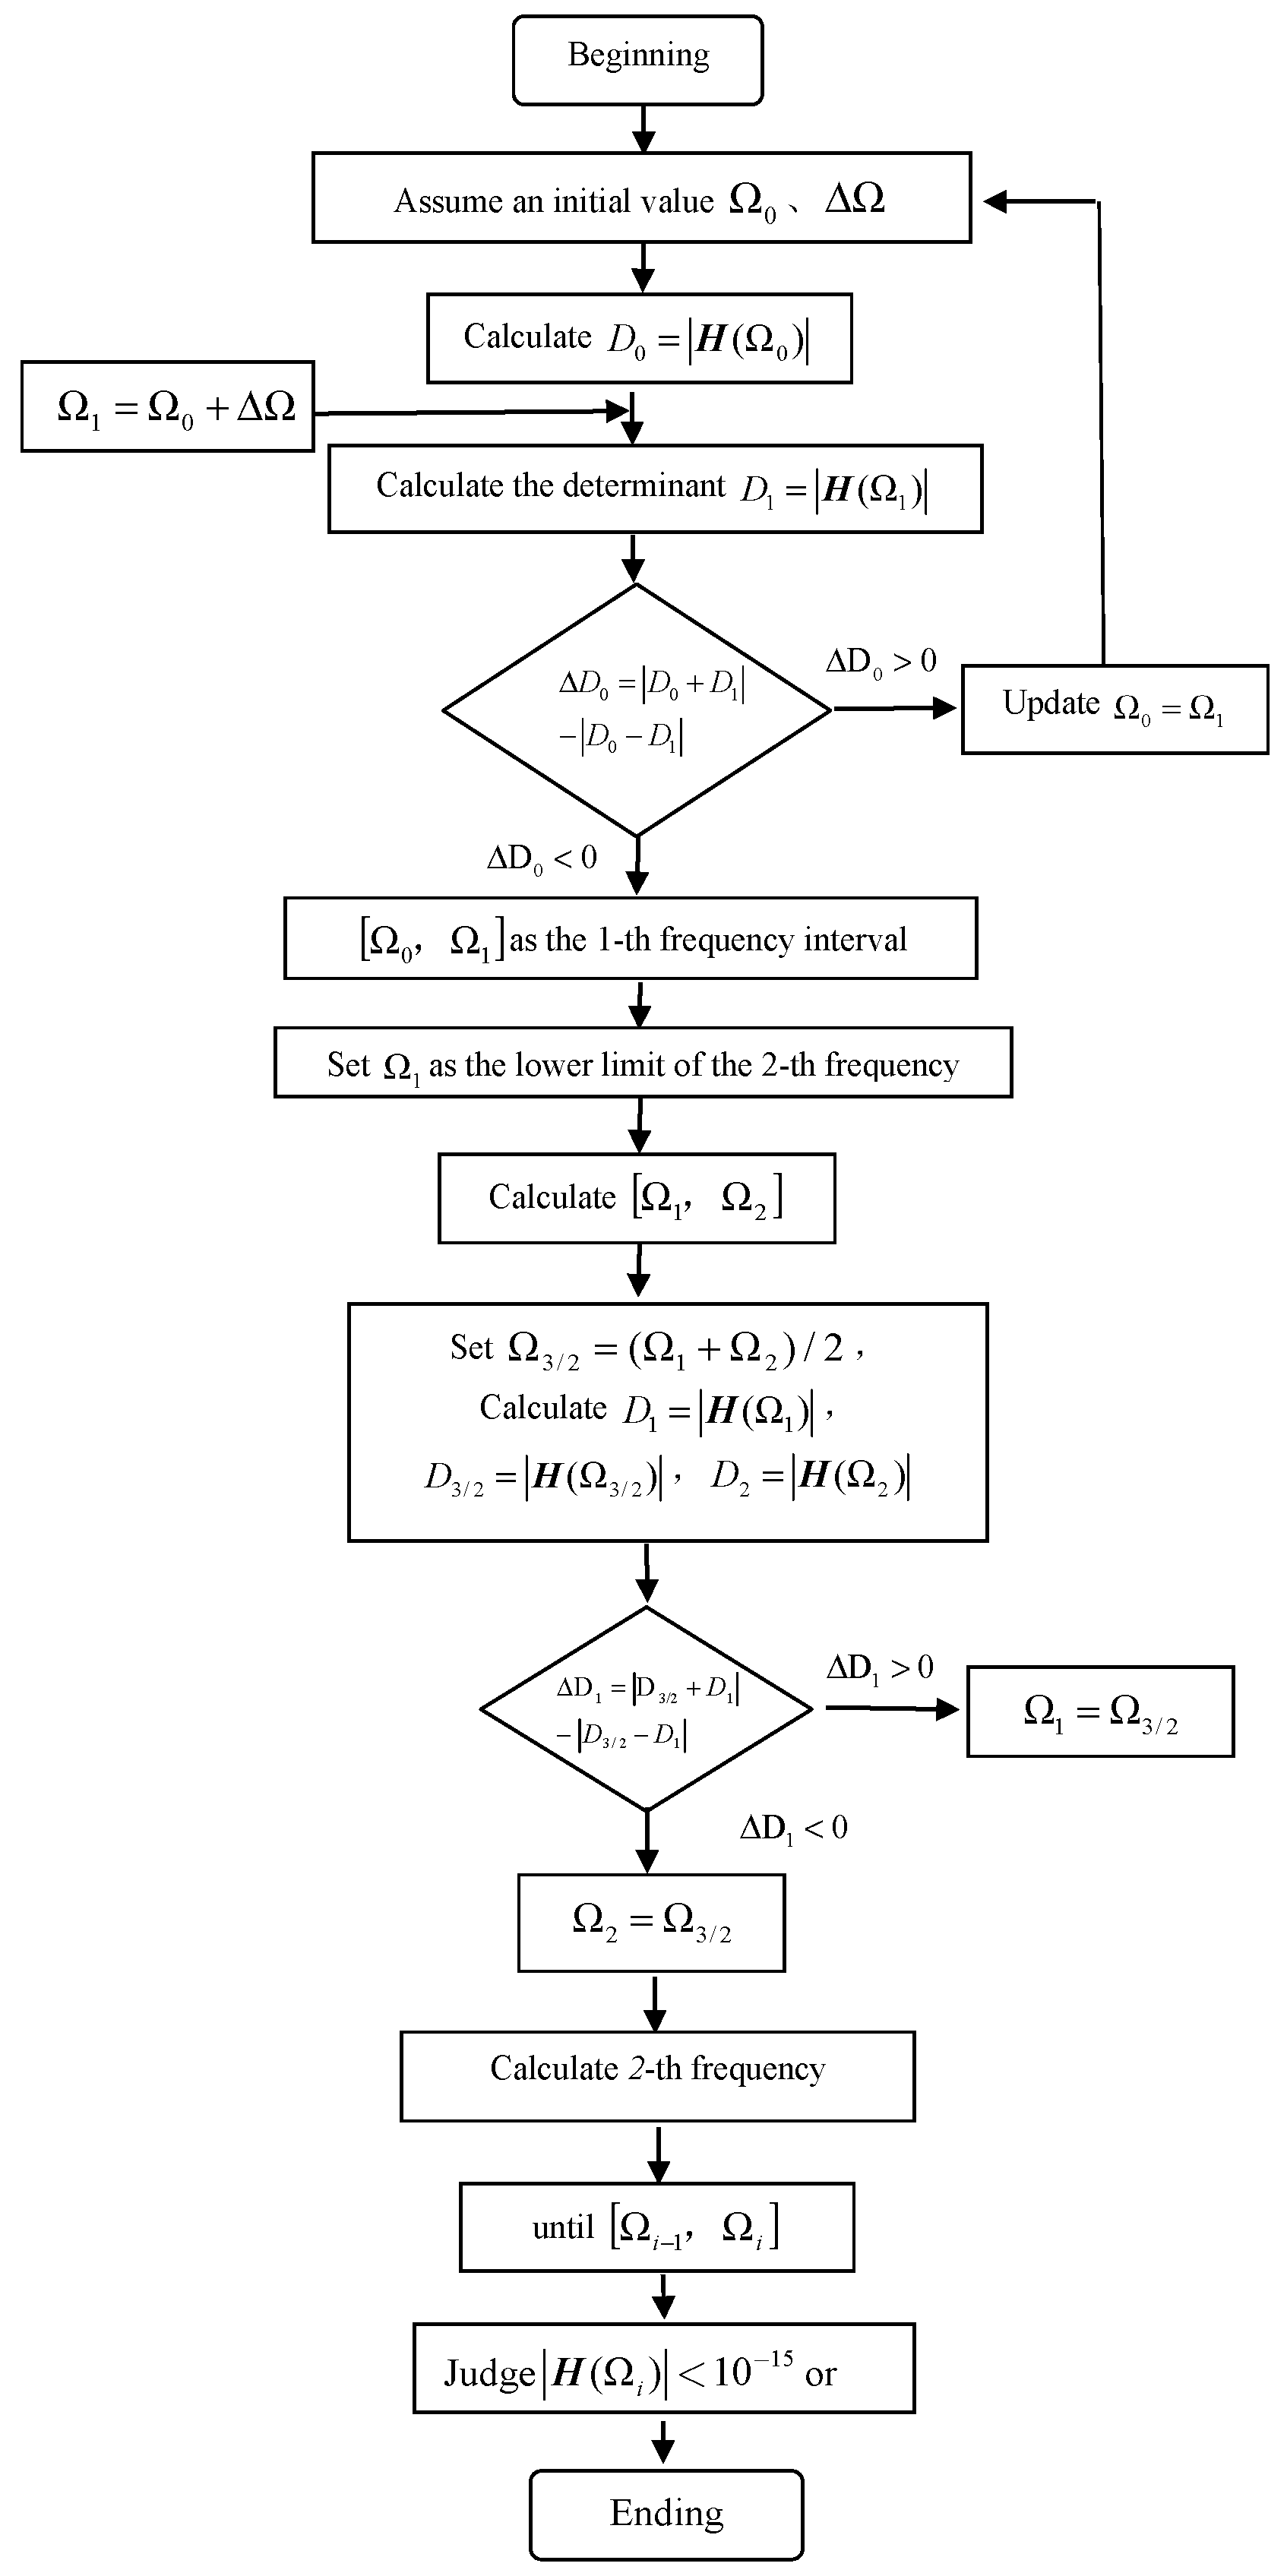
According to the frequency equation for a cracked simply supported beam, as presented in Equation (18), the semi-interval iteration method from Ref. [30] can be employed to determine the arbitrary-order natural frequencies of the cracked simply supported beam. These natural frequencies are subsequently substituted back into Equation (15) to derive the corresponding natural modes of vibration. The calculation procedure is outlined as follows:
(1) Assume 0.1 times the fundamental frequency of the common beam bridge as the initial value and compute the determinant value , recording it accordingly .
(2) Introduce a frequency increment (denoted as ), set , and then calculate . If and exhibit different signs, conclude that constitutes the first angular frequency interval. Conversely, if and share the same signs, update ; repeat these steps until and display differing signs, thereby determining the first-order angular frequency interval .
(3) Designate as the lower limit of the second-order frequency range and apply the methodology described in step (2) to ascertain this second-order frequency range .
(4) Continue repeating step (3) to obtain subsequent i-th order angular frequency intervals .
(5) Let denote this new interval’s midpoint; calculate , , , along with its derivatives if necessary. If and have identical signs, retain ; if and differ in sign, adjust accordingly so that a new interval can be established.
(6) Repeat step (5) until achieving a target difference within specified limits for each frequency interval. Substitute median values from these angular frequency ranges into their respective matrices such that their determinants approach zero (), thus confirming that this median represents the i-th order angular frequency.
Figure 3 illustrates the computational flowchart for deriving the modal analytical for the dynamic characteristics of the cracked beam.
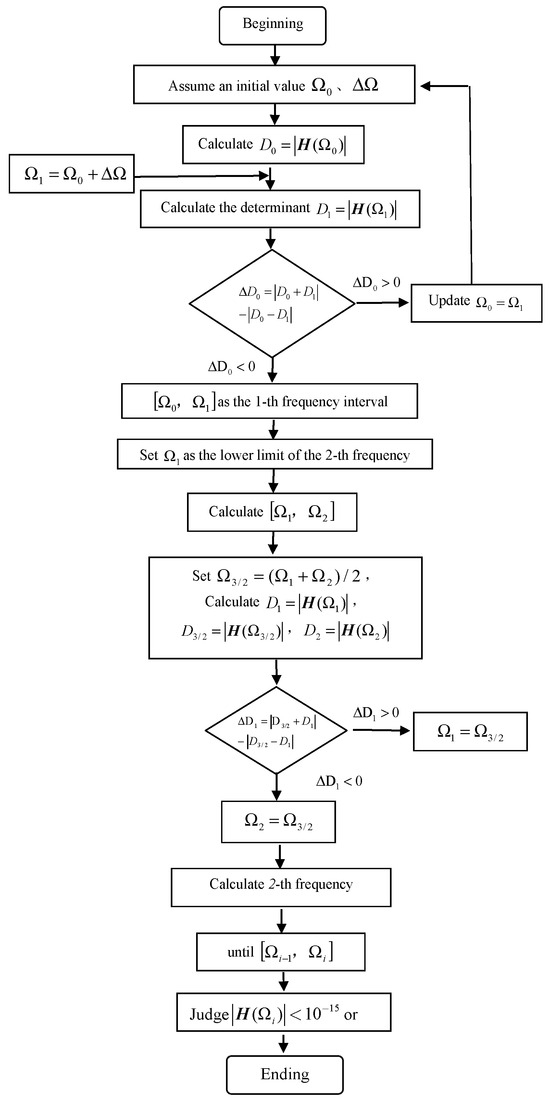
Figure 3.
Flowchart of analytical solution for dynamic characteristics of cracked beam.
2.3.2. Algorithm Analytical for the Coupled System of Vehicle–Cracked Beam Bridge
Equation (27) represents a second-order variable coefficient differential equation system. To facilitate a numerical solution, introduce the state vector , and transform Equation (27) into a set of first-order differential equations:
In the state-space formulation, represents the time-varying mass matrix that depends on the instantaneous position of the moving load. For any time instant t, the existence of and its inverse is guaranteed under normal operating conditions. Consequently, the state-space equations (Equation (28)) can be reformulated as follows:
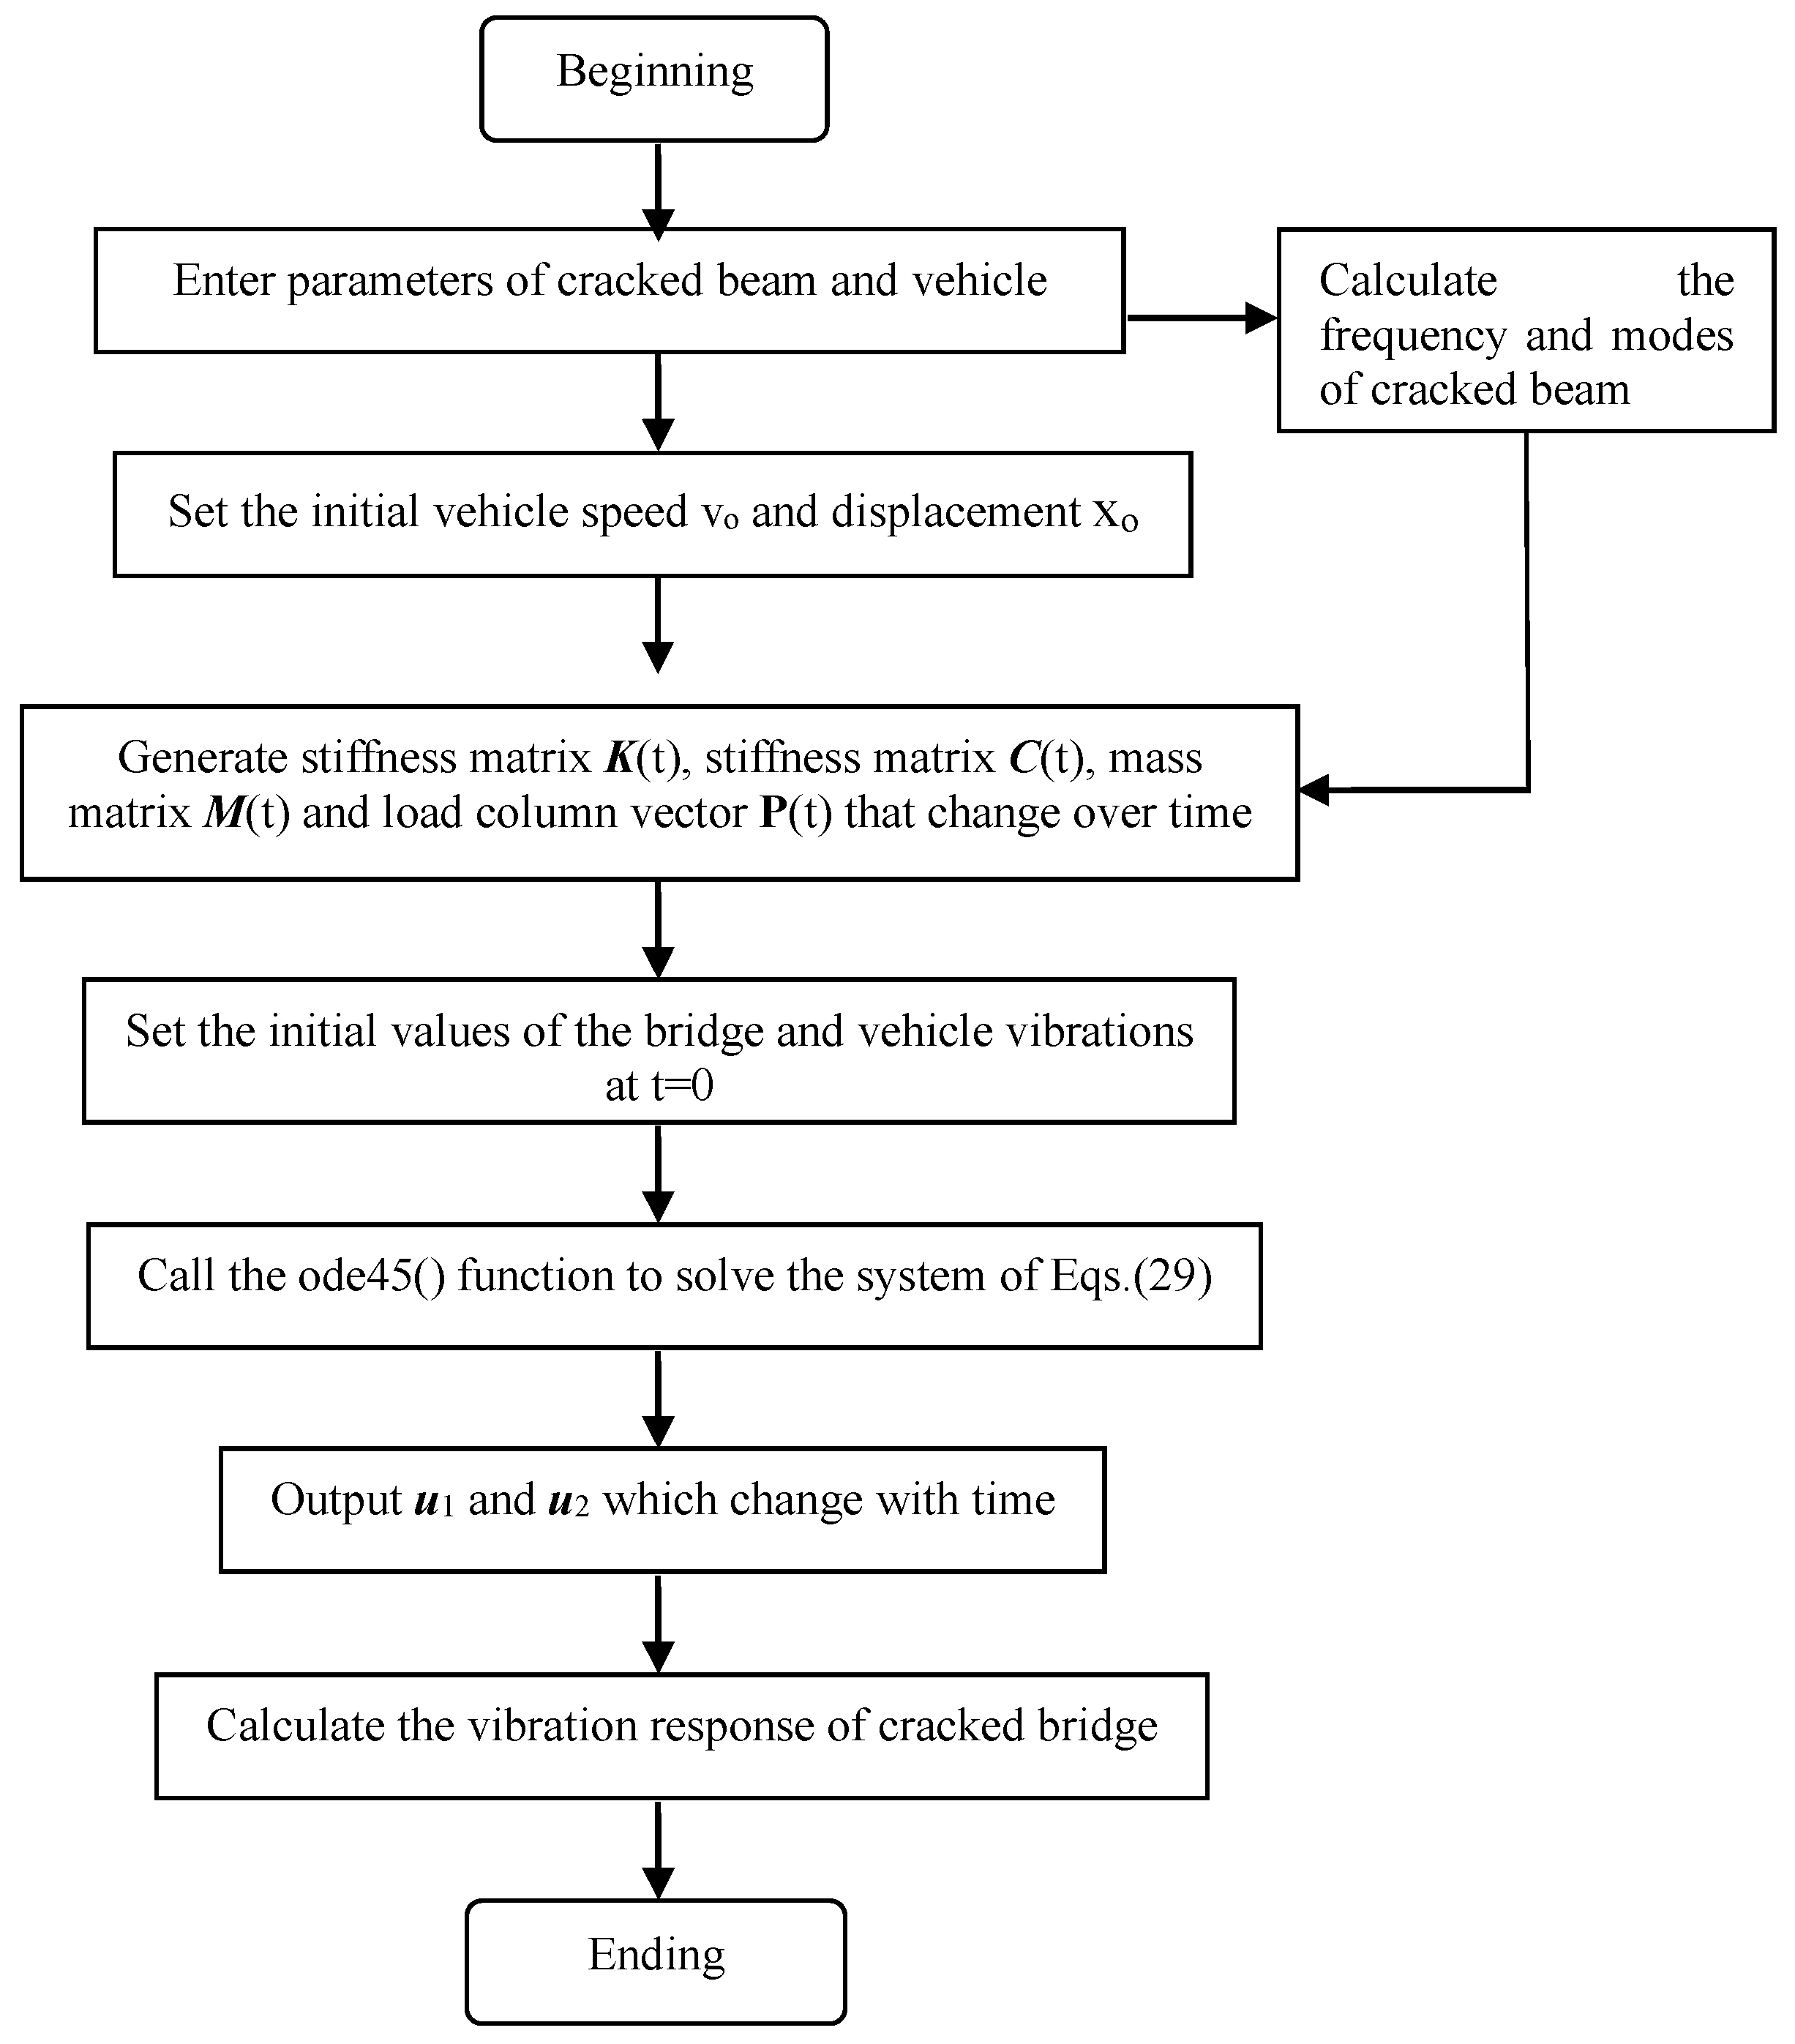
The system of Equation (29) can be solved for its analytical solution by writing a program using the Runge–Kutta method, the computational flowchart for the vehicle–cracked simply supported beam coupled system is illustrated in Figure 4.

Figure 4.
Flowchart of analytical solution for vehicle–cracked beam coupled system.
3. Numerical Simulation and Discussions
In this paper, unless otherwise specified, all the numerical results are based on the assumption of a uniform Euler–Bernoulli beam and a 1/4 vehicle model. The bridge data from Ref. [31] and the vehicle data from Ref. [32] are as follows: beam length , height , width , section moment of inertia , modulus of elasticity , material density , mass of the vehicle body , sum of suspension and tire mass , spring stiffness , spring stiffness , damping , and damping . For simplicity, let us denote the relative crack depth as and the relative crack position as .
3.1. Numerical Validation for Cracked Beam Subjected to Moving Load
3.1.1. Cracked Beam Eigenfrequency Validation
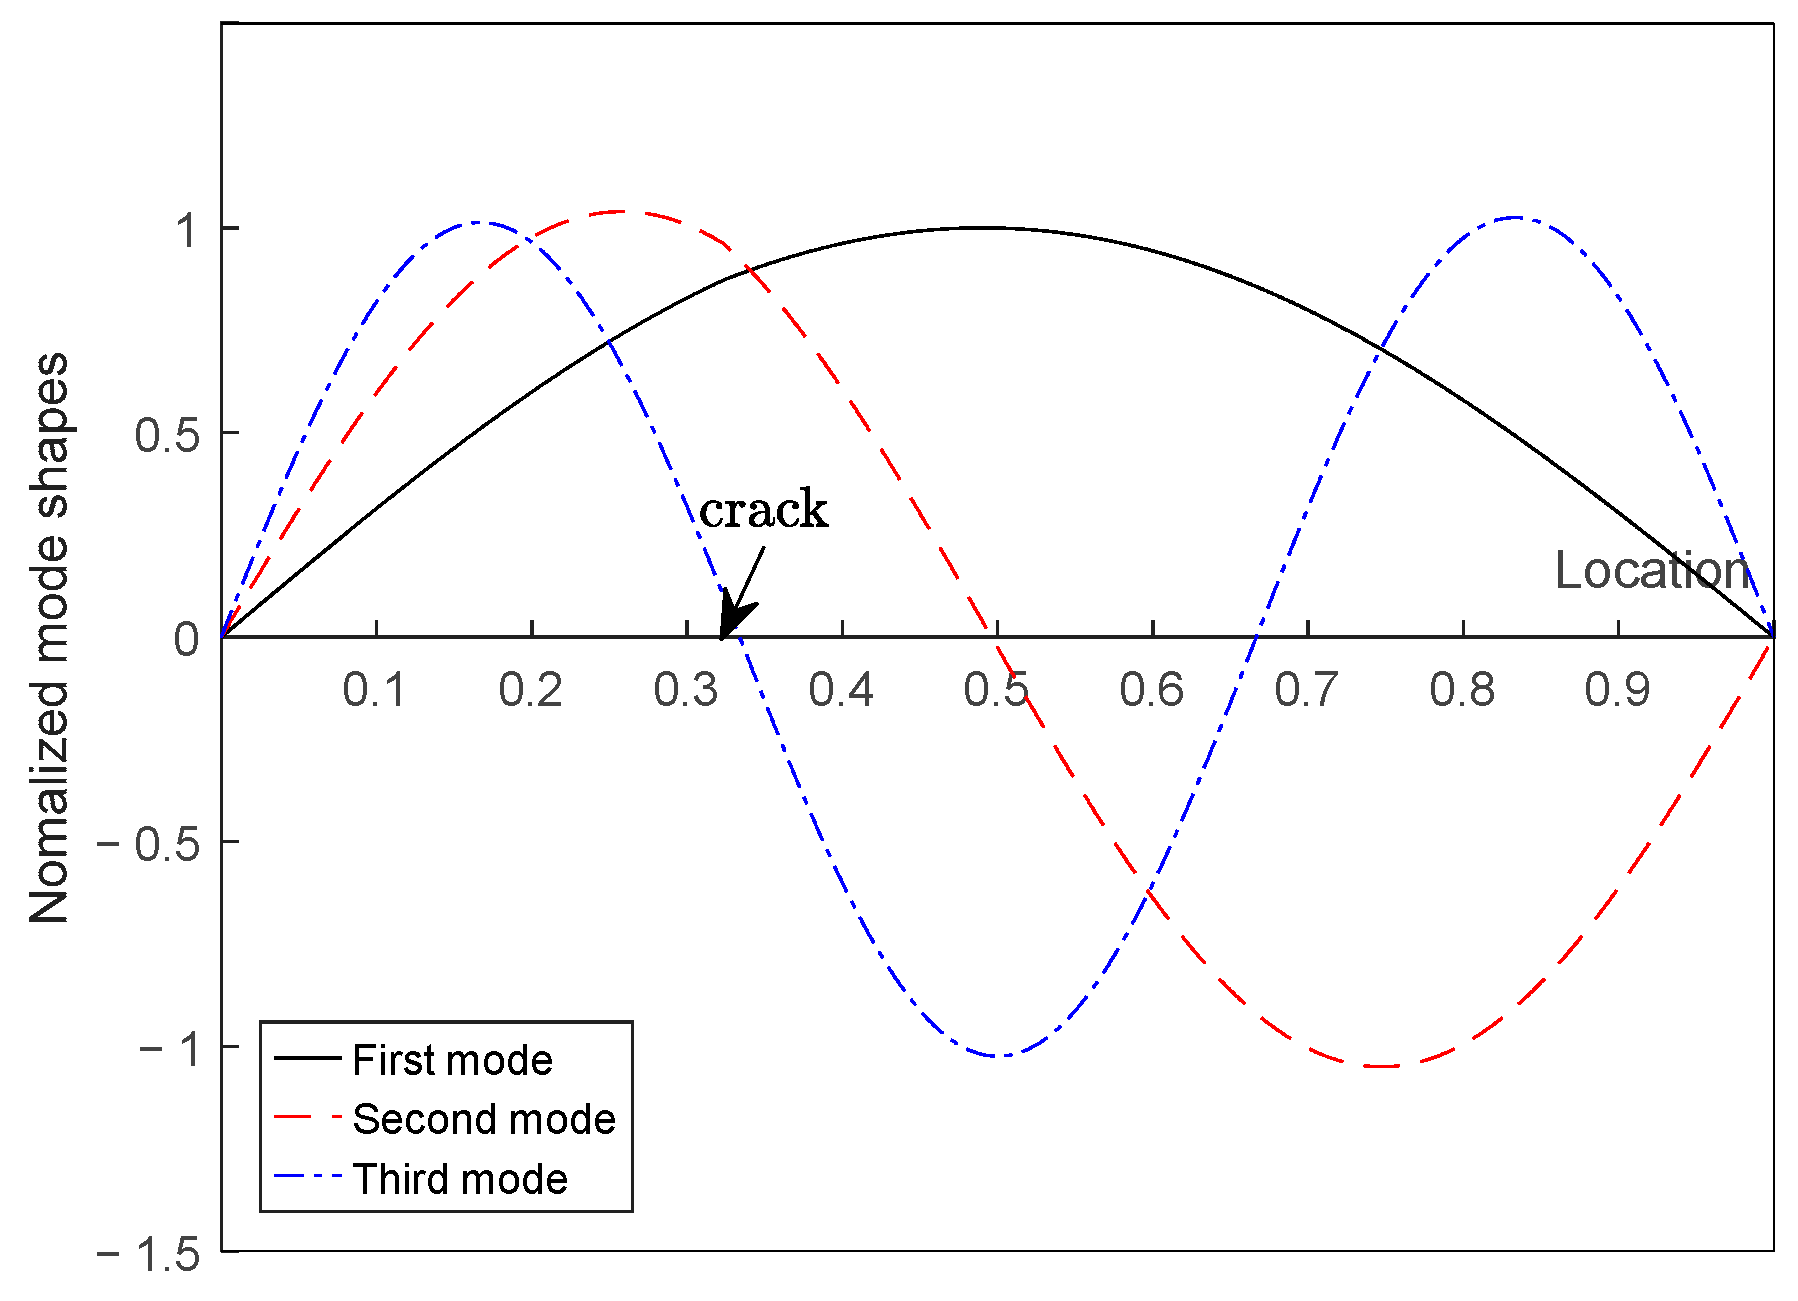
To rigorously validate the proposed methodology, a systematic comparison was conducted between the numerical predictions and experimental benchmarks from Ref. [33]. The validation case considers a simply supported steel beam with the following specifications:
Geometric parameters—beam length , cross-sectional height , width ;
Material properties—modulus of elasticity , material density ;
Crack configuration—the crack is located at the position with crack depth (single-sided open crack).
The computational framework yields the first three modal shapes (as shown in Figure 5) natural frequencies: , , and . The difference between the first two natural frequencies derived from the transfer matrix method and the measured frequency reported in Ref. [32] is a mere 0.63% as Table 1. As evidenced by the sub 0.63% discrepancies for the first two modes (Table 1), the proposed method demonstrates excellent agreement with experimental measurements from Ref. [33].
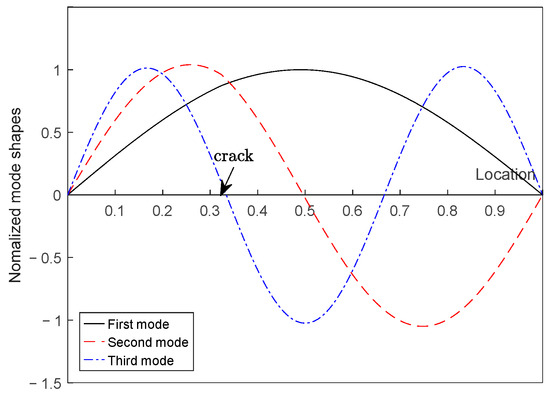
Figure 5.
Normalized mode shapes of a simply supported beam with a crack.

Table 1.
Comparison of frequency of cracked simply supported beam.
3.1.2. Verification of Vehicle–Cracked Beam Coupling
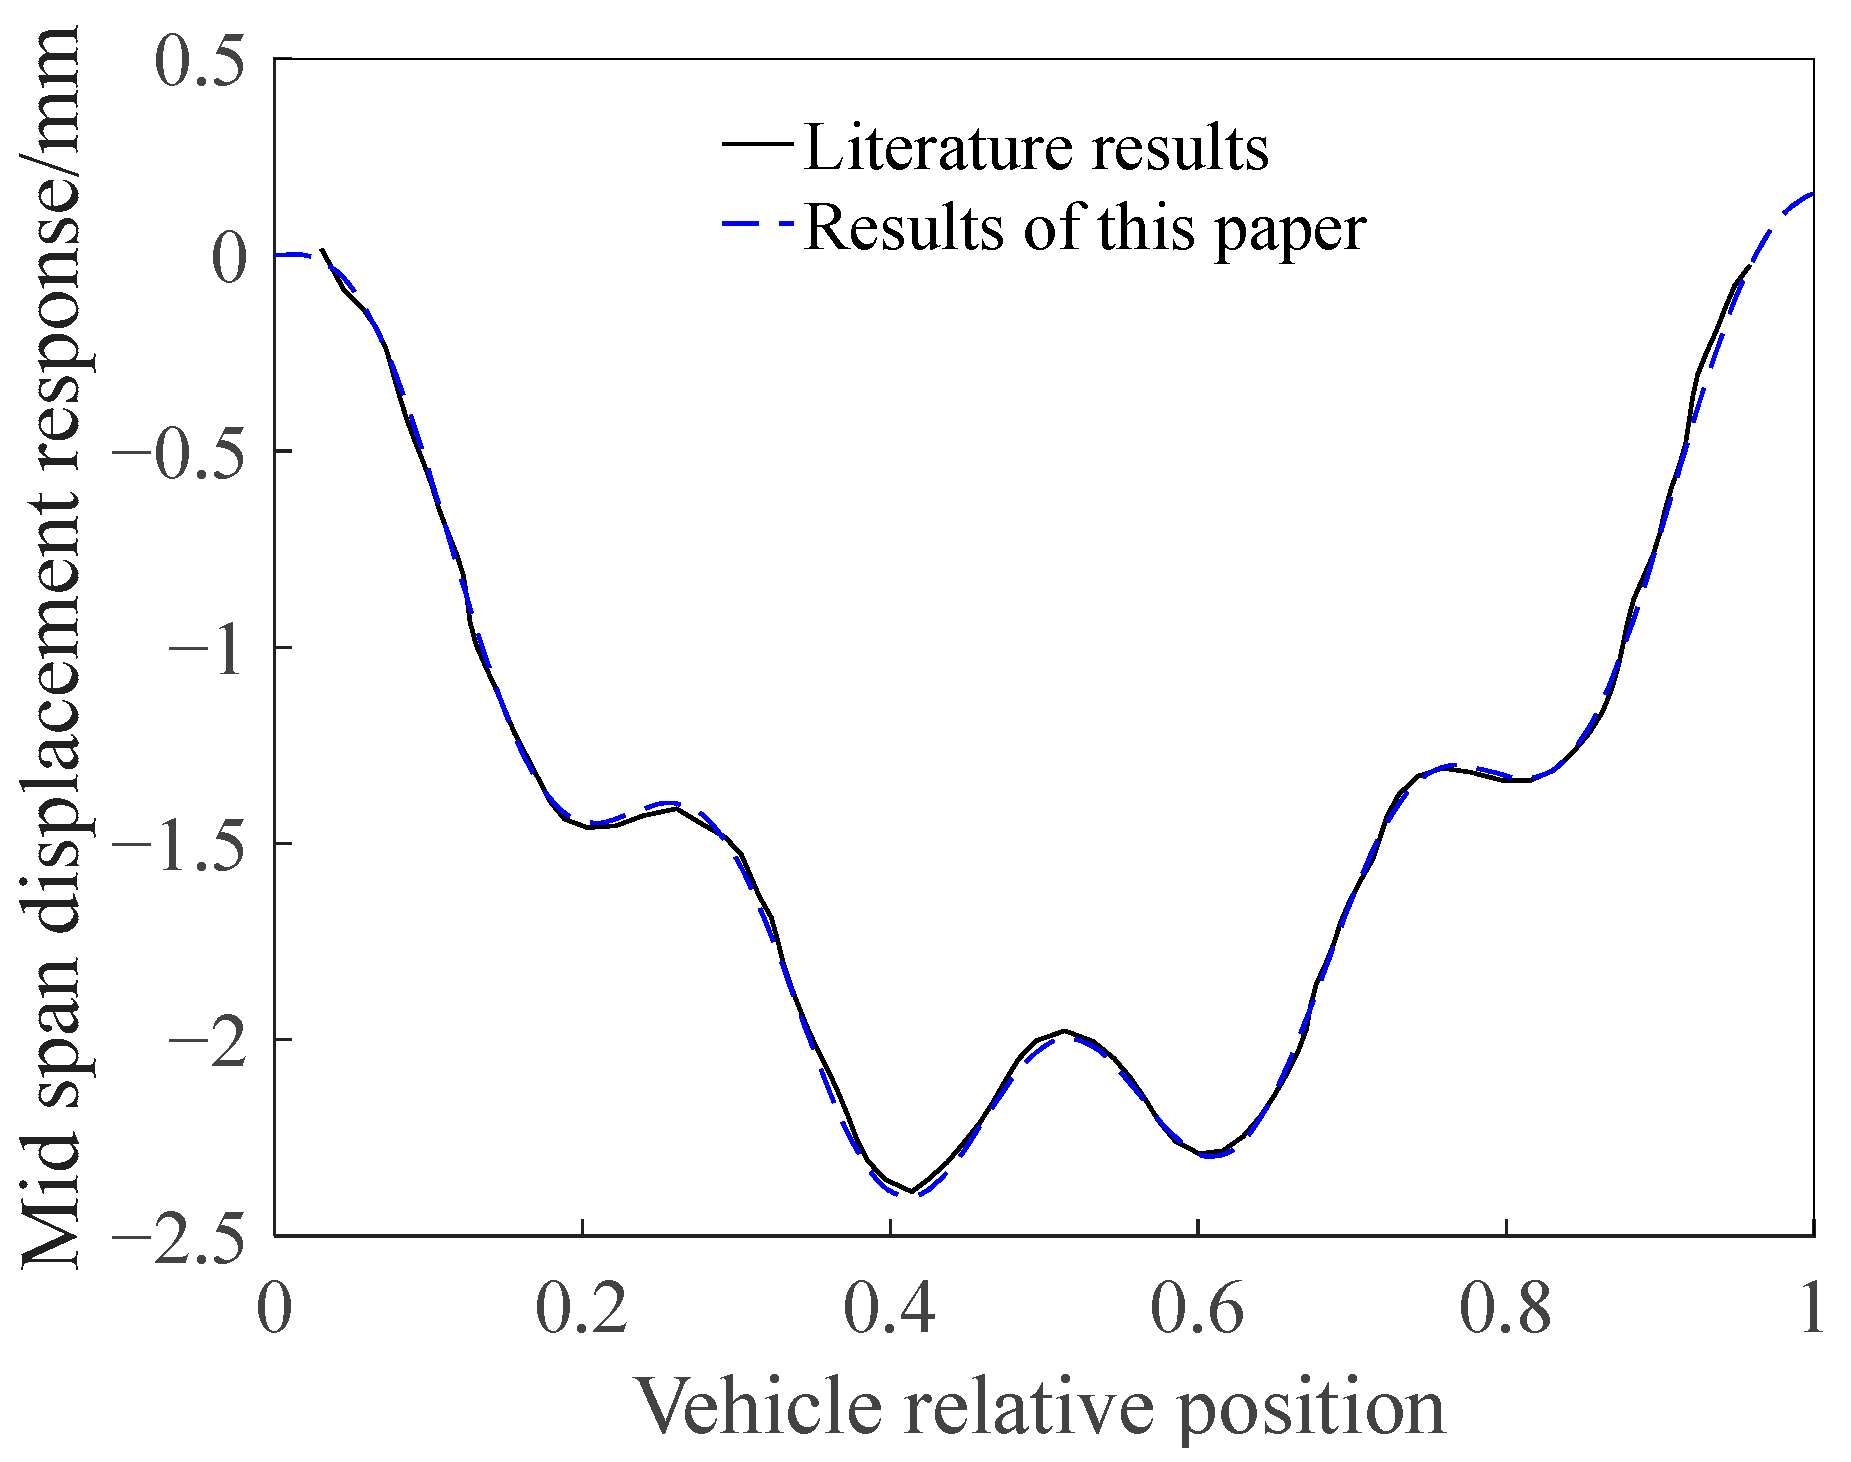
To validate the proposed vehicle–cracked Beam coupling methodology, a comparative analysis was conducted against the benchmark results reported in Ref. [34]. The validation framework employs a simply supported beam characterized by the following parameters (Figure 6): beam length L = 20 m, cross-sectional moment of inertia I = 0.3229 m4, modulus of elasticity E = 3.0 × 10⁹ N/m2, and mass per unit length m = 2.5 × 10³ kg/m. The vehicle parameters comprise the vehicle body mass m1 = 32,025 kg, combined suspension and tire mass m2 = 1425 kg, spring stiffness k1 = 6.5 × 10⁵ N/m, and traversing velocity v = 100 km/h. Damping effects in both the vehicle and bridge subsystems were neglected to isolate the fundamental dynamic coupling behavior. Numerical simulations were specifically focused on quantifying the transient mid-span vertical displacement response under moving vehicle excitation.
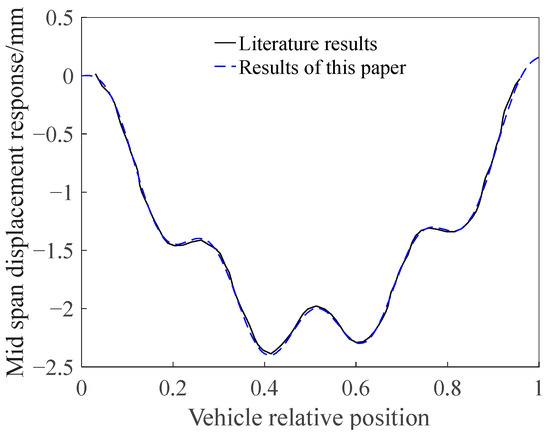
Figure 6.
Comparison of the intermediate deflection across the span response.
As illustrated in Figure 6, the computational results derived from the present method exhibit excellent agreement with the reference solution from Ref. [34]. The experimentally validated algorithm exhibits adequate numerical accuracy, with a maximum error of less than 2.5%, making it suitable for application in vehicle–cracked beam interaction problems. This consistency rigorously substantiates the predictive capability of the proposed analytical method in characterizing the essential dynamics of vehicle–cracked beam interactions. The validated methodology thereby establishes a reliable framework for further applications in coupled dynamic systems.
3.2. Analysis of Time History Curve
3.2.1. Influence of the Crack Depth
Figure 7 systematically investigates the mid-span displacement response characteristics under varying vehicle speeds (v) for four structural scenarios: an intact beam and beams with progressive crack depths (). The parametric analysis reveals three critical observations:
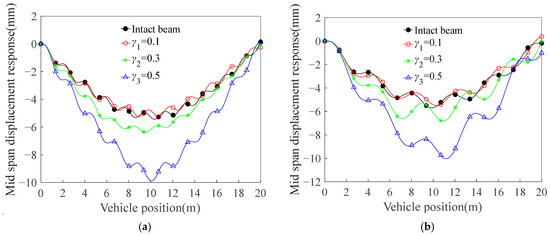
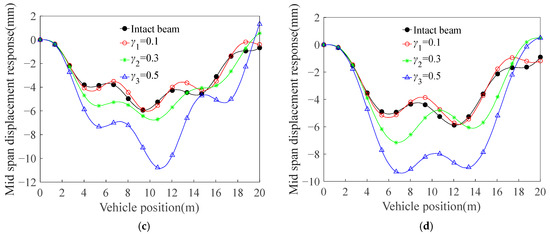
Figure 7.
The intermediate deflection response across the span under different vehicle speeds and crack depths: (a) v = 10 m/s; (b) v = 20 m/s; (c) v = 30 m/s; (d) v = 40 m/s.
(1) Under constant beam length conditions, the vehicle velocity exhibits a significant influence on the mid-span displacement response. A distinct inverse correlation is observed between the excitation velocity and oscillation frequency of the displacement curves. This phenomenon arises because lower velocities prolong the vehicle’s dwell time on the bridge structure, thereby allowing sufficient temporal development of high-frequency vibrations induced by vehicle–bridge coupling effects. Conversely, at elevated velocities, the transient nature of moving loads restricts the temporal window for high-frequency vibration development, resulting in attenuated oscillation characteristics manifested as smoother response profiles.
(2) Comparative analysis reveals that crack existence does not fundamentally alter the shape characteristics of mid-span displacement response curves when maintaining identical vehicle velocities. Notably, both intact and cracked beams demonstrate comparable waveform patterns in their vibration responses, indicating that crack formation primarily affects response amplitude rather than the fundamental vibration mode of the structure.
(3) Progressive increase in crack depth produces a corresponding amplification of mid-span dynamic displacements. Particularly noteworthy is the nonlinear escalation observed when crack depth reaches 50% of beam height—this critical threshold triggers substantial displacement enhancement. Quantitative analysis at specific velocity conditions reveals maximum deflections of 5.891 mm (intact), 6.015 mm (cracked), 6.915 mm (cracked), and 9.891 mm (cracked), representing relative increases of 2.10%, 14.96%, and 43.04% compared to the intact configuration. These findings emphasize the critical need for early-stage crack detection and progressive damage mitigation strategies in bridge maintenance programs, particularly for structural systems exhibiting crack depths that reach 30% of component dimensions.
3.2.2. Influence of the Crack Location
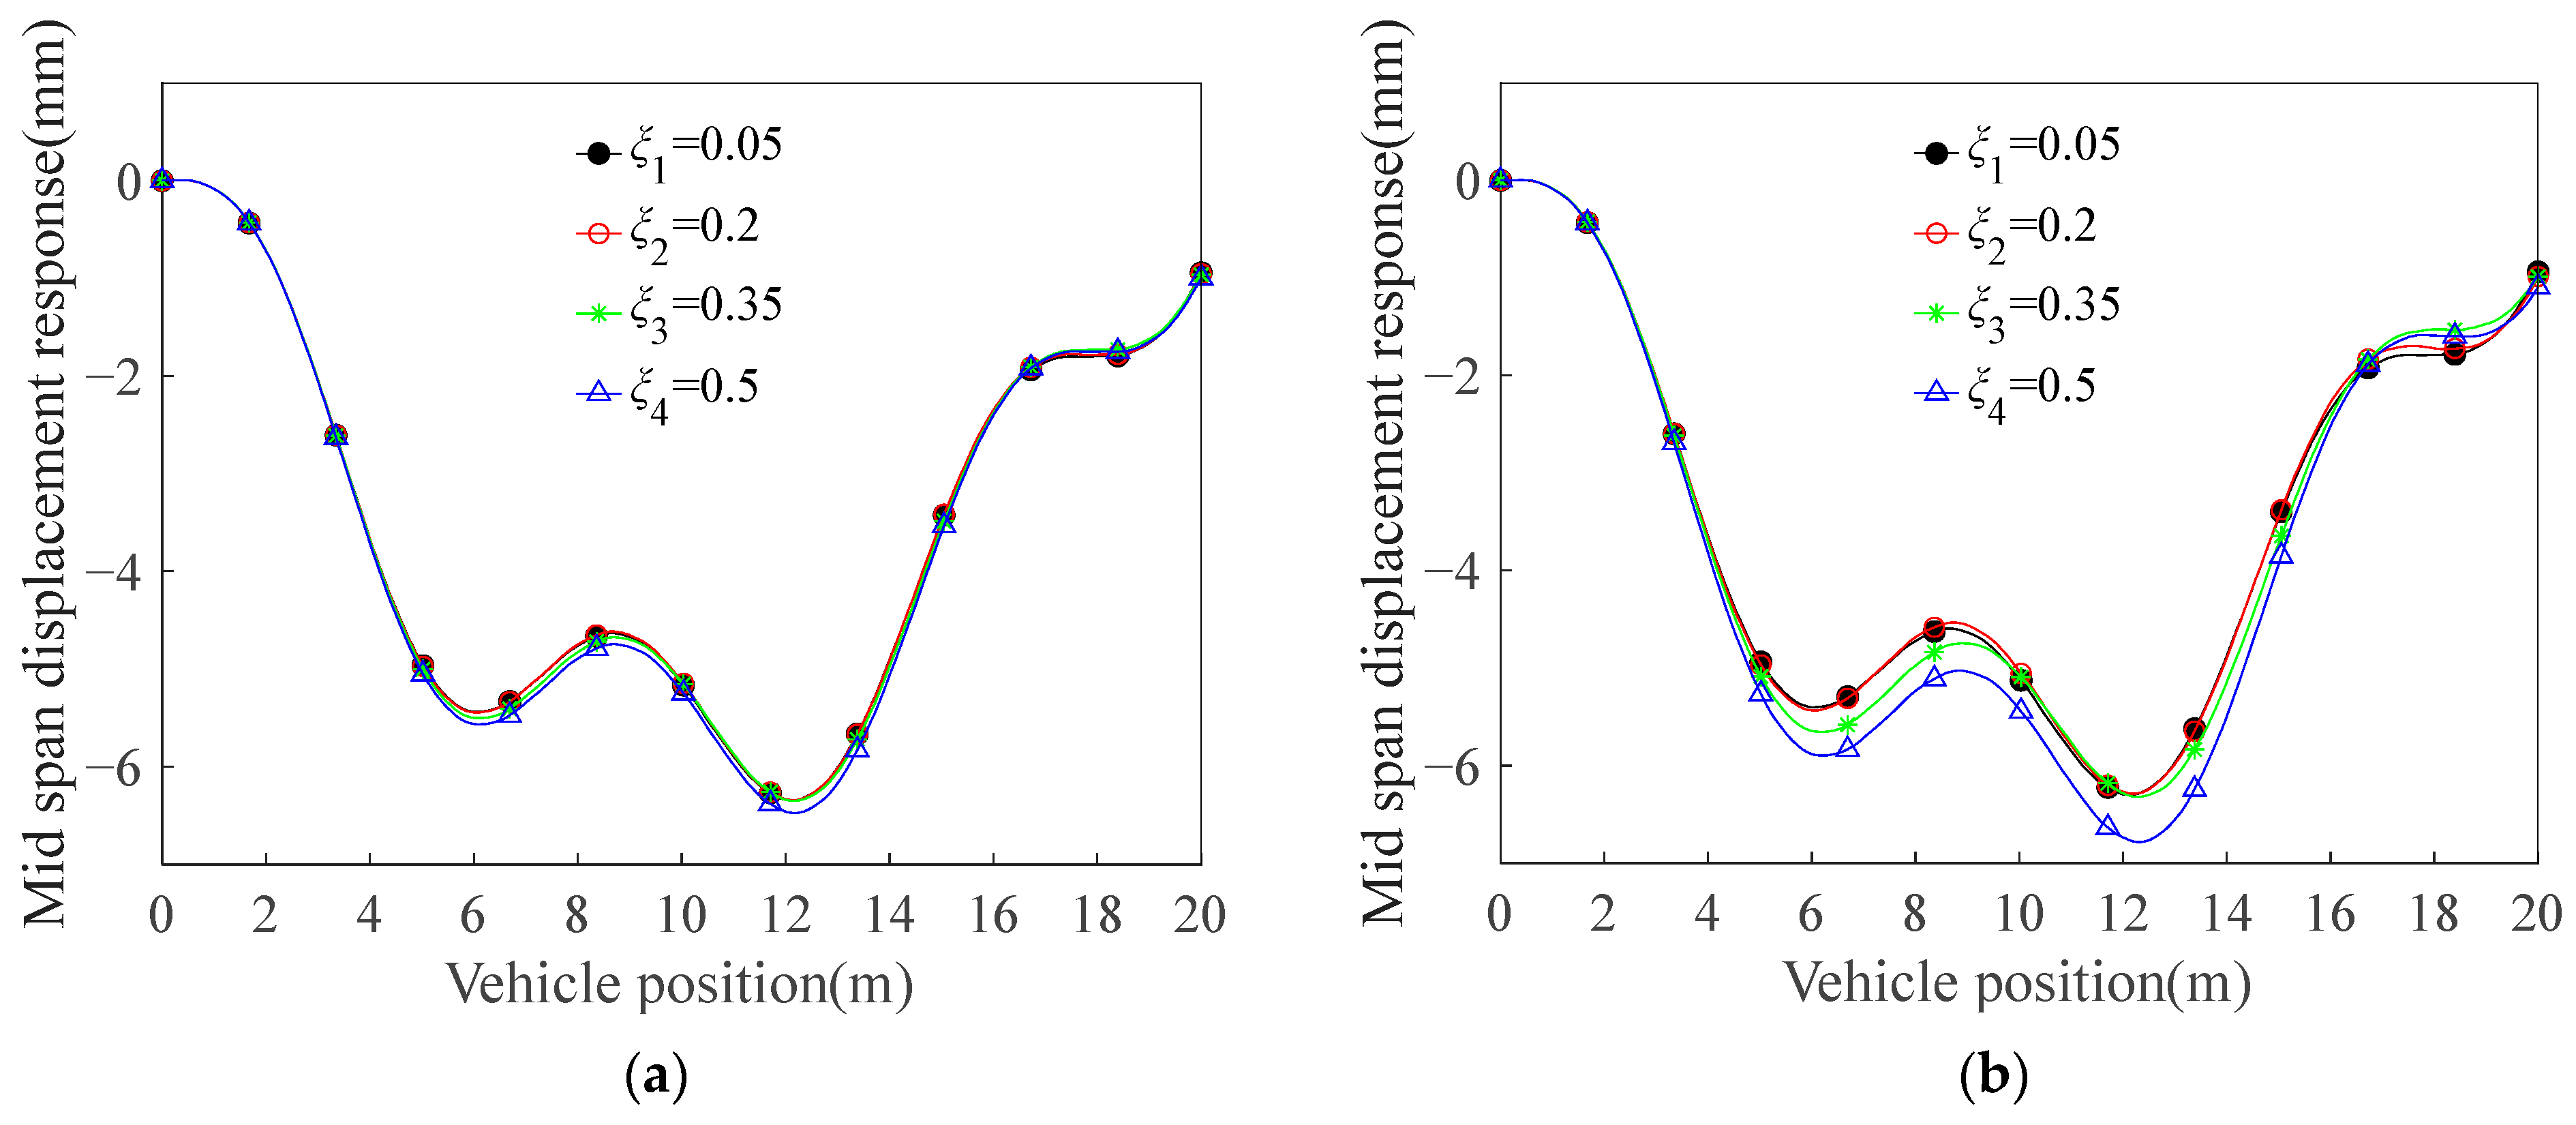
Figure 8 illustrates the dynamic evolution of mid-span displacement responses under four distinct crack configurations (depth ratios = 0.1, 0.2, 0.3, 0.4, and 0.5) at a constant vehicle speed of 40 m/s, with particular emphasis on crack position effects ( = 0.05, 0.20, 0.35, and 0.50). The analysis reveals two critical observations:
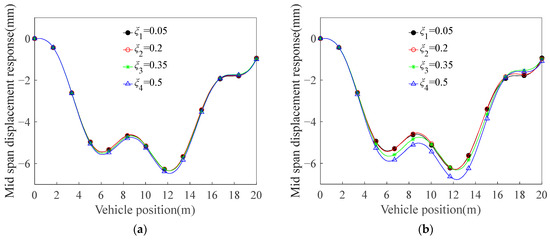
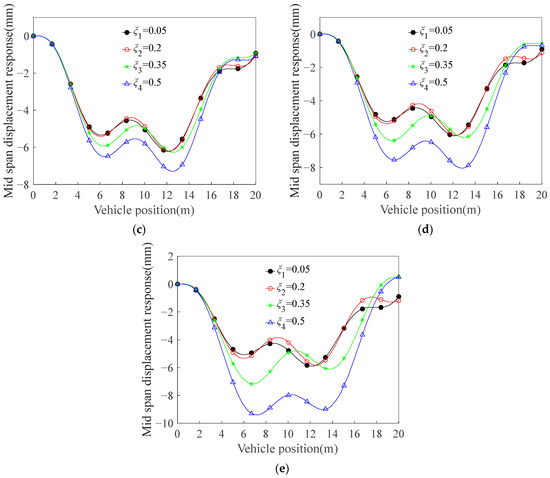
Figure 8.
The intermediate deflection response across the span under different crack depths and crack positions: (a) ; (b) ; (c) ; (d) ; (e) .
(1) Spatial–Temporal Response Characteristics
The displacement time history exhibits periodic troughs when the moving vehicular excitation traverses from beam extremities toward the mid-span region. Maximum displacement amplitudes (The maximum deflection occurs at 7.22 m of the beam, with an amplitude of 9.44 mm, i.e., = 9.4 mm at s = 7.22 m) occur when crack locations satisfy = 0.5, demonstrating a 98.9% amplification compared to intact beam conditions.
(2) Crack Position Sensitivity
For constant crack depth , progressive crack migration from = 0.05 to = 0.5 increases the intermediate deflection across the span by 26.4% (5.3~6.7 mm). Notwithstanding these conspicuous variations in dynamic displacement response in different crack depth, the shape of the time history curve of the vibration system remains almost unchanged.
3.3. Maximum Deflection Analysis
(1) crack depth
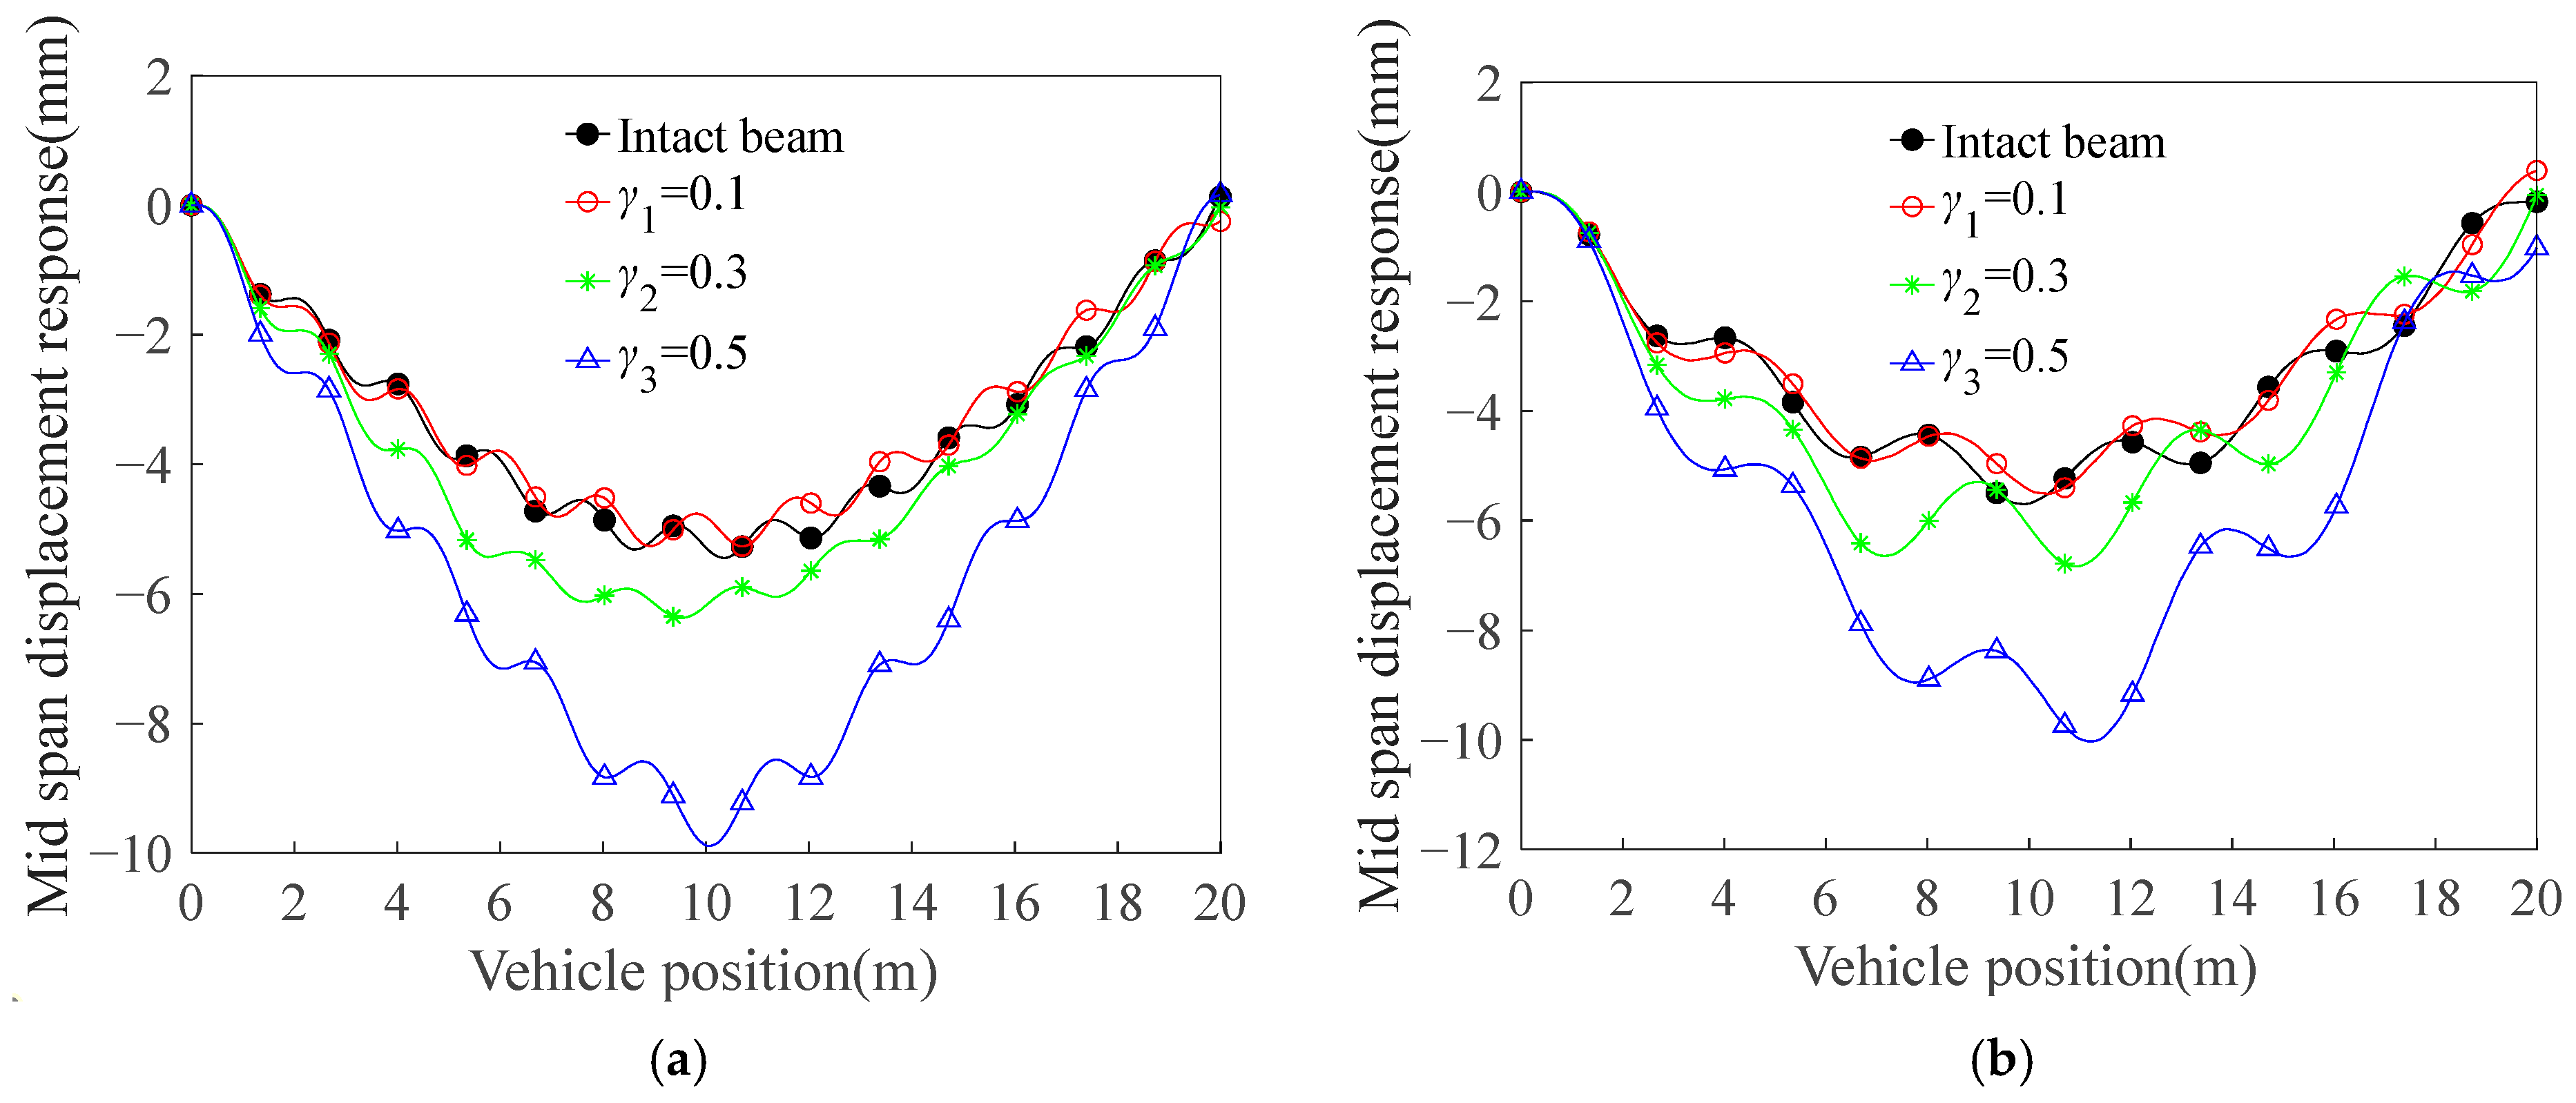
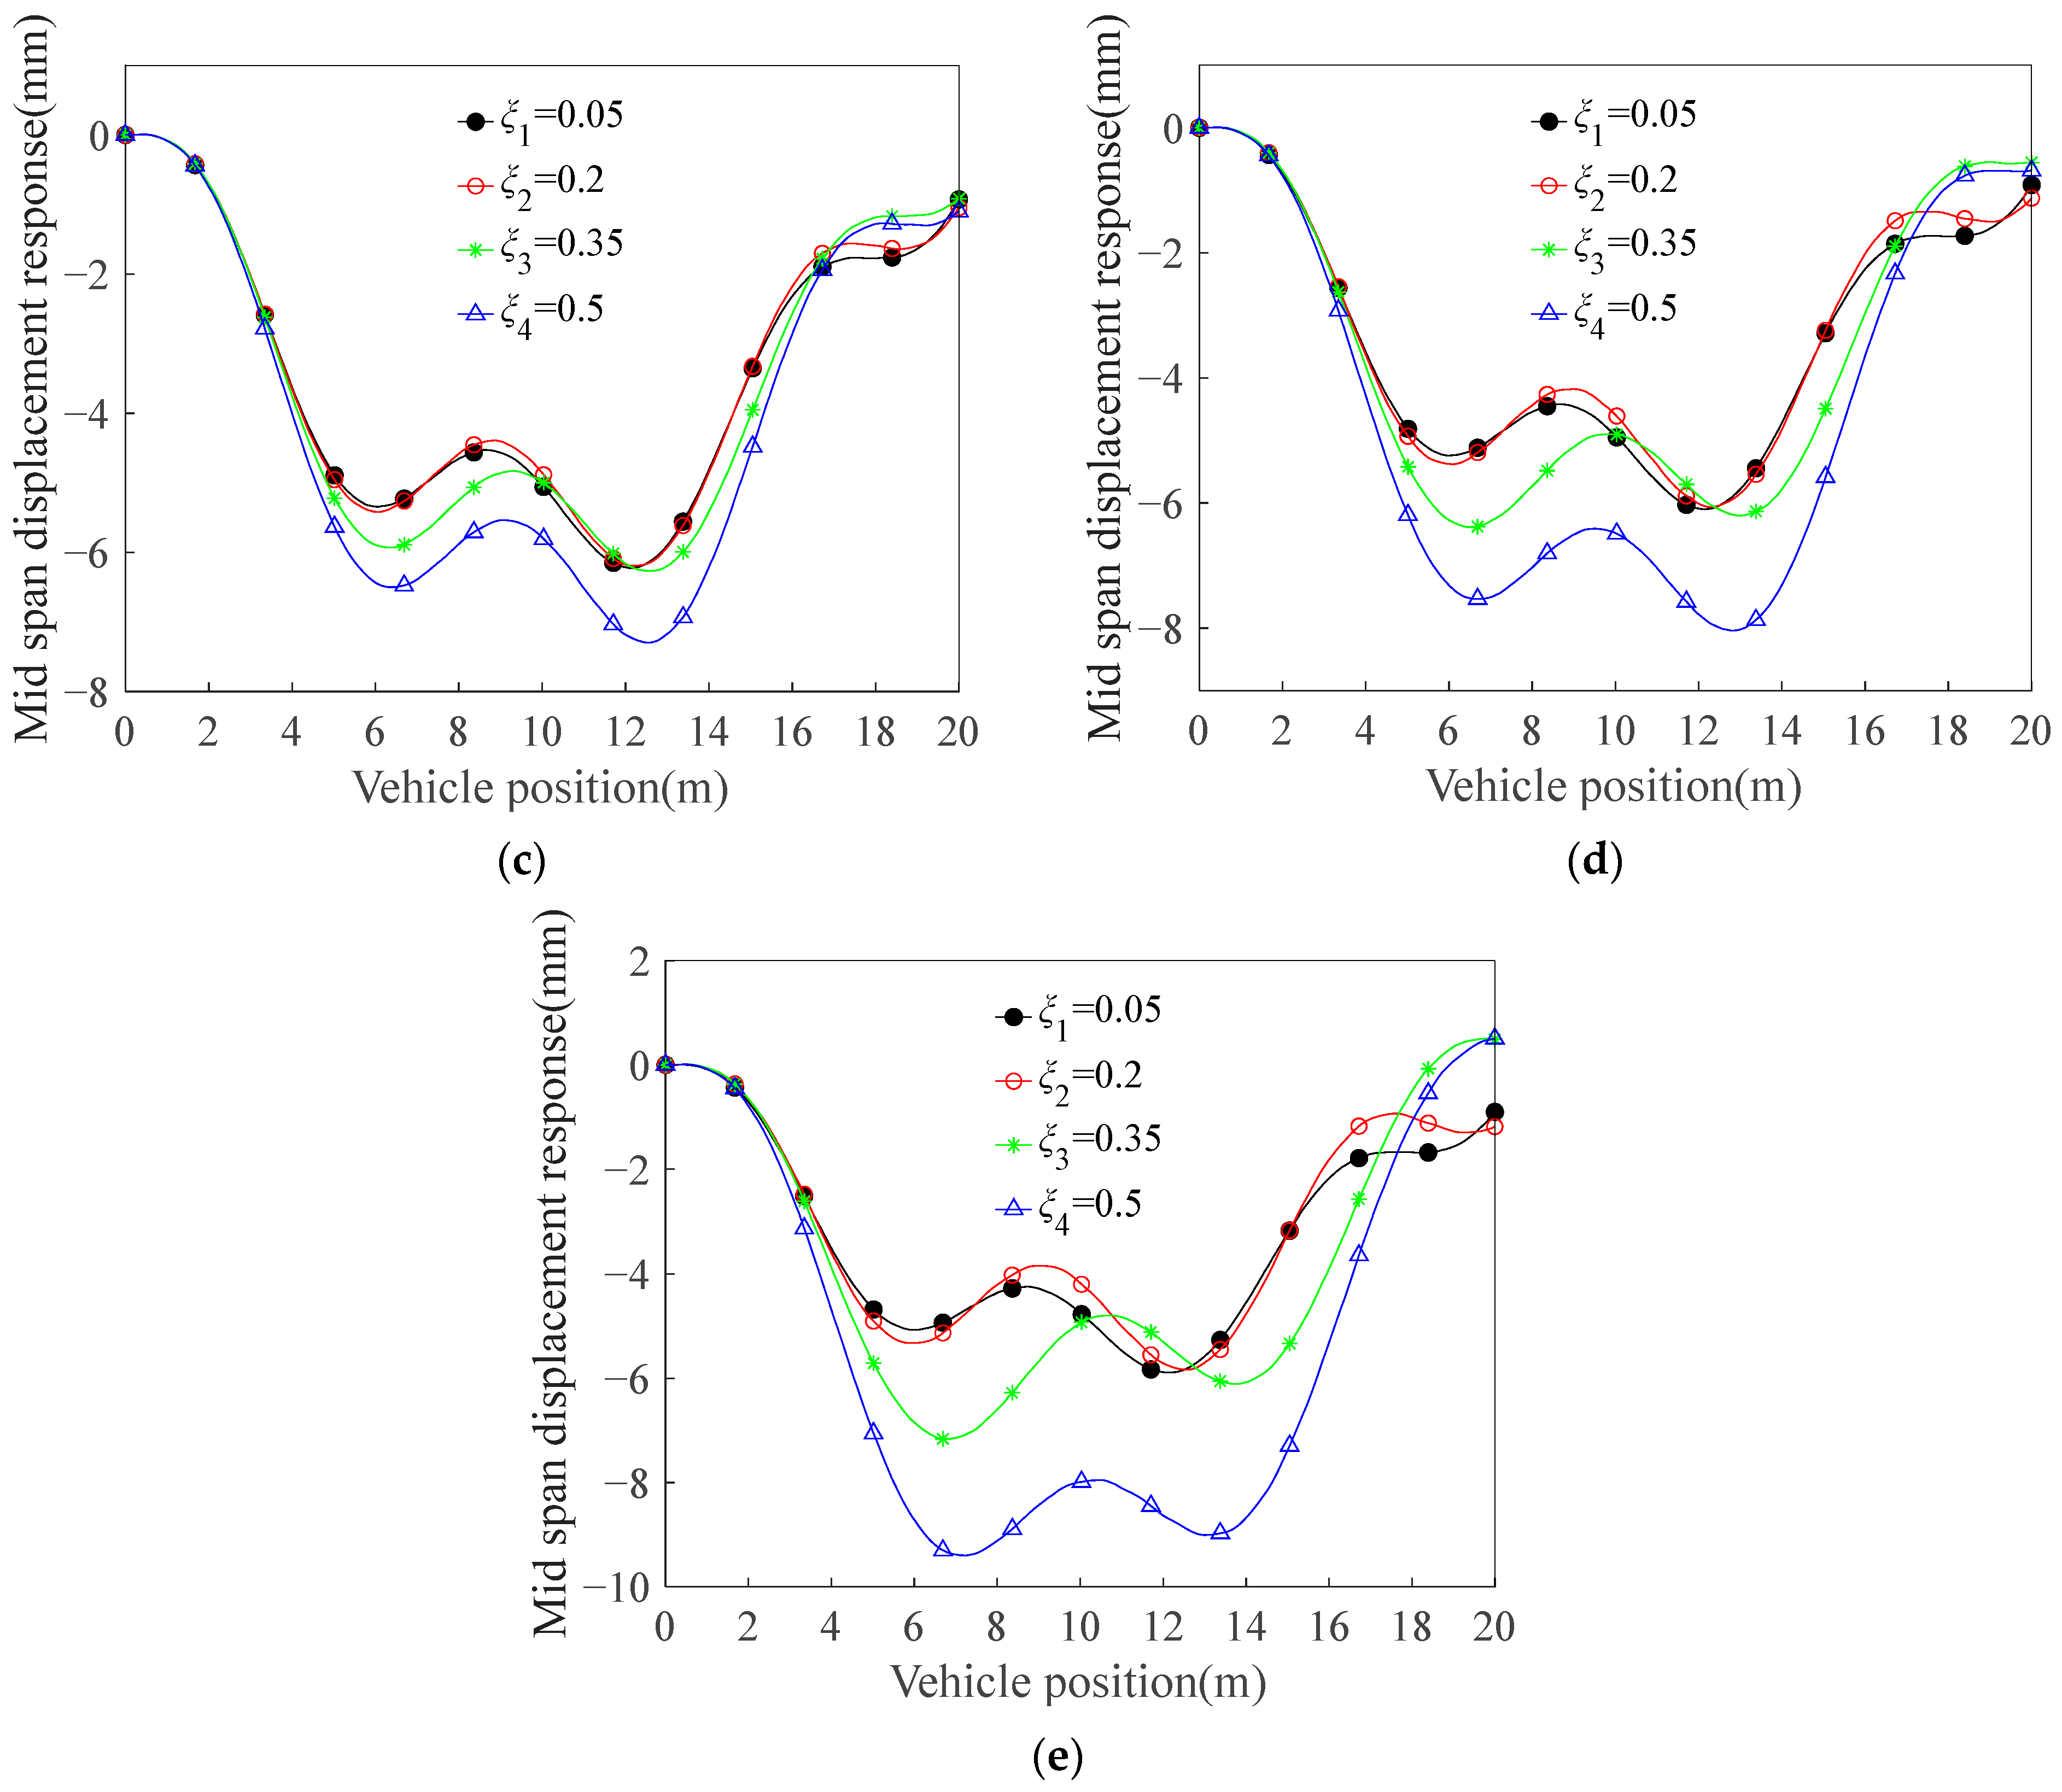
A systematic parametric investigation was performed on deflection distributions across the beam span under progressive stiffness degradation (crack depth: 0~50% section height). Through numerical simulations at constant vehicle velocity (v = 40 m/s), spanwise deflection profiles were quantified as illustrated in Figure 9.
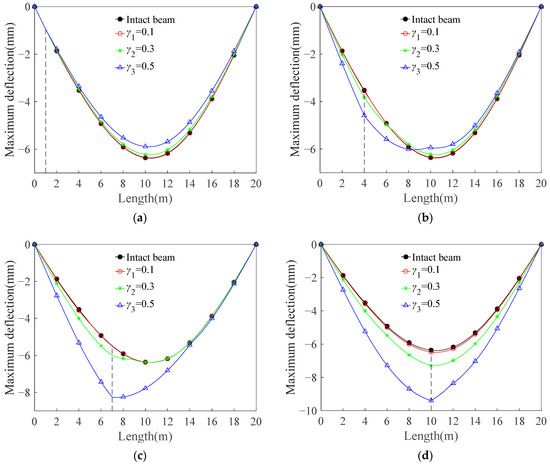
Figure 9.
Effect of crack depth on maximum deflection at different crack positions (vertical dashed line indicates crack location): (a) ; (b) ; (c) ; (d) .
Figure 9 delineates the normalized maximum deflection distribution along the beam’s longitudinal axis, comparing four crack configurations ( = 0, 0.1, 0.3, and 0.5) positioned at = 0.05, 0.20, 0.35, and 0.50 against the baseline intact beam. Comparative analysis reveals that mid-span proximal cracks ( ≥ 0.35) induce global deflection amplification proportional to crack depth, with particularly pronounced escalation (47.8% peak increase) at = 0.5 h. Conversely, quarter-span cracks ( ≤ 0.20) manifest localized displacement concentration (<3% variation at = 0.3 h) while maintaining near-baseline deflection levels in non-adjacent zones.
Intact beams maintain uniform flexural rigidity (EI = constant), whereas cracked sections exhibit progressive rigidity reduction as the crack depth increases. When cracks develop, the region adjacent to the crack experiences damage or a reduction in structural integrity, leading to a decrease in stiffness within that area. Consequently, the displacement near the crack is relatively pronounced, whereas locations further away from the crack exhibit smaller displacements due to their enhanced stiffness.
(2) Crack location
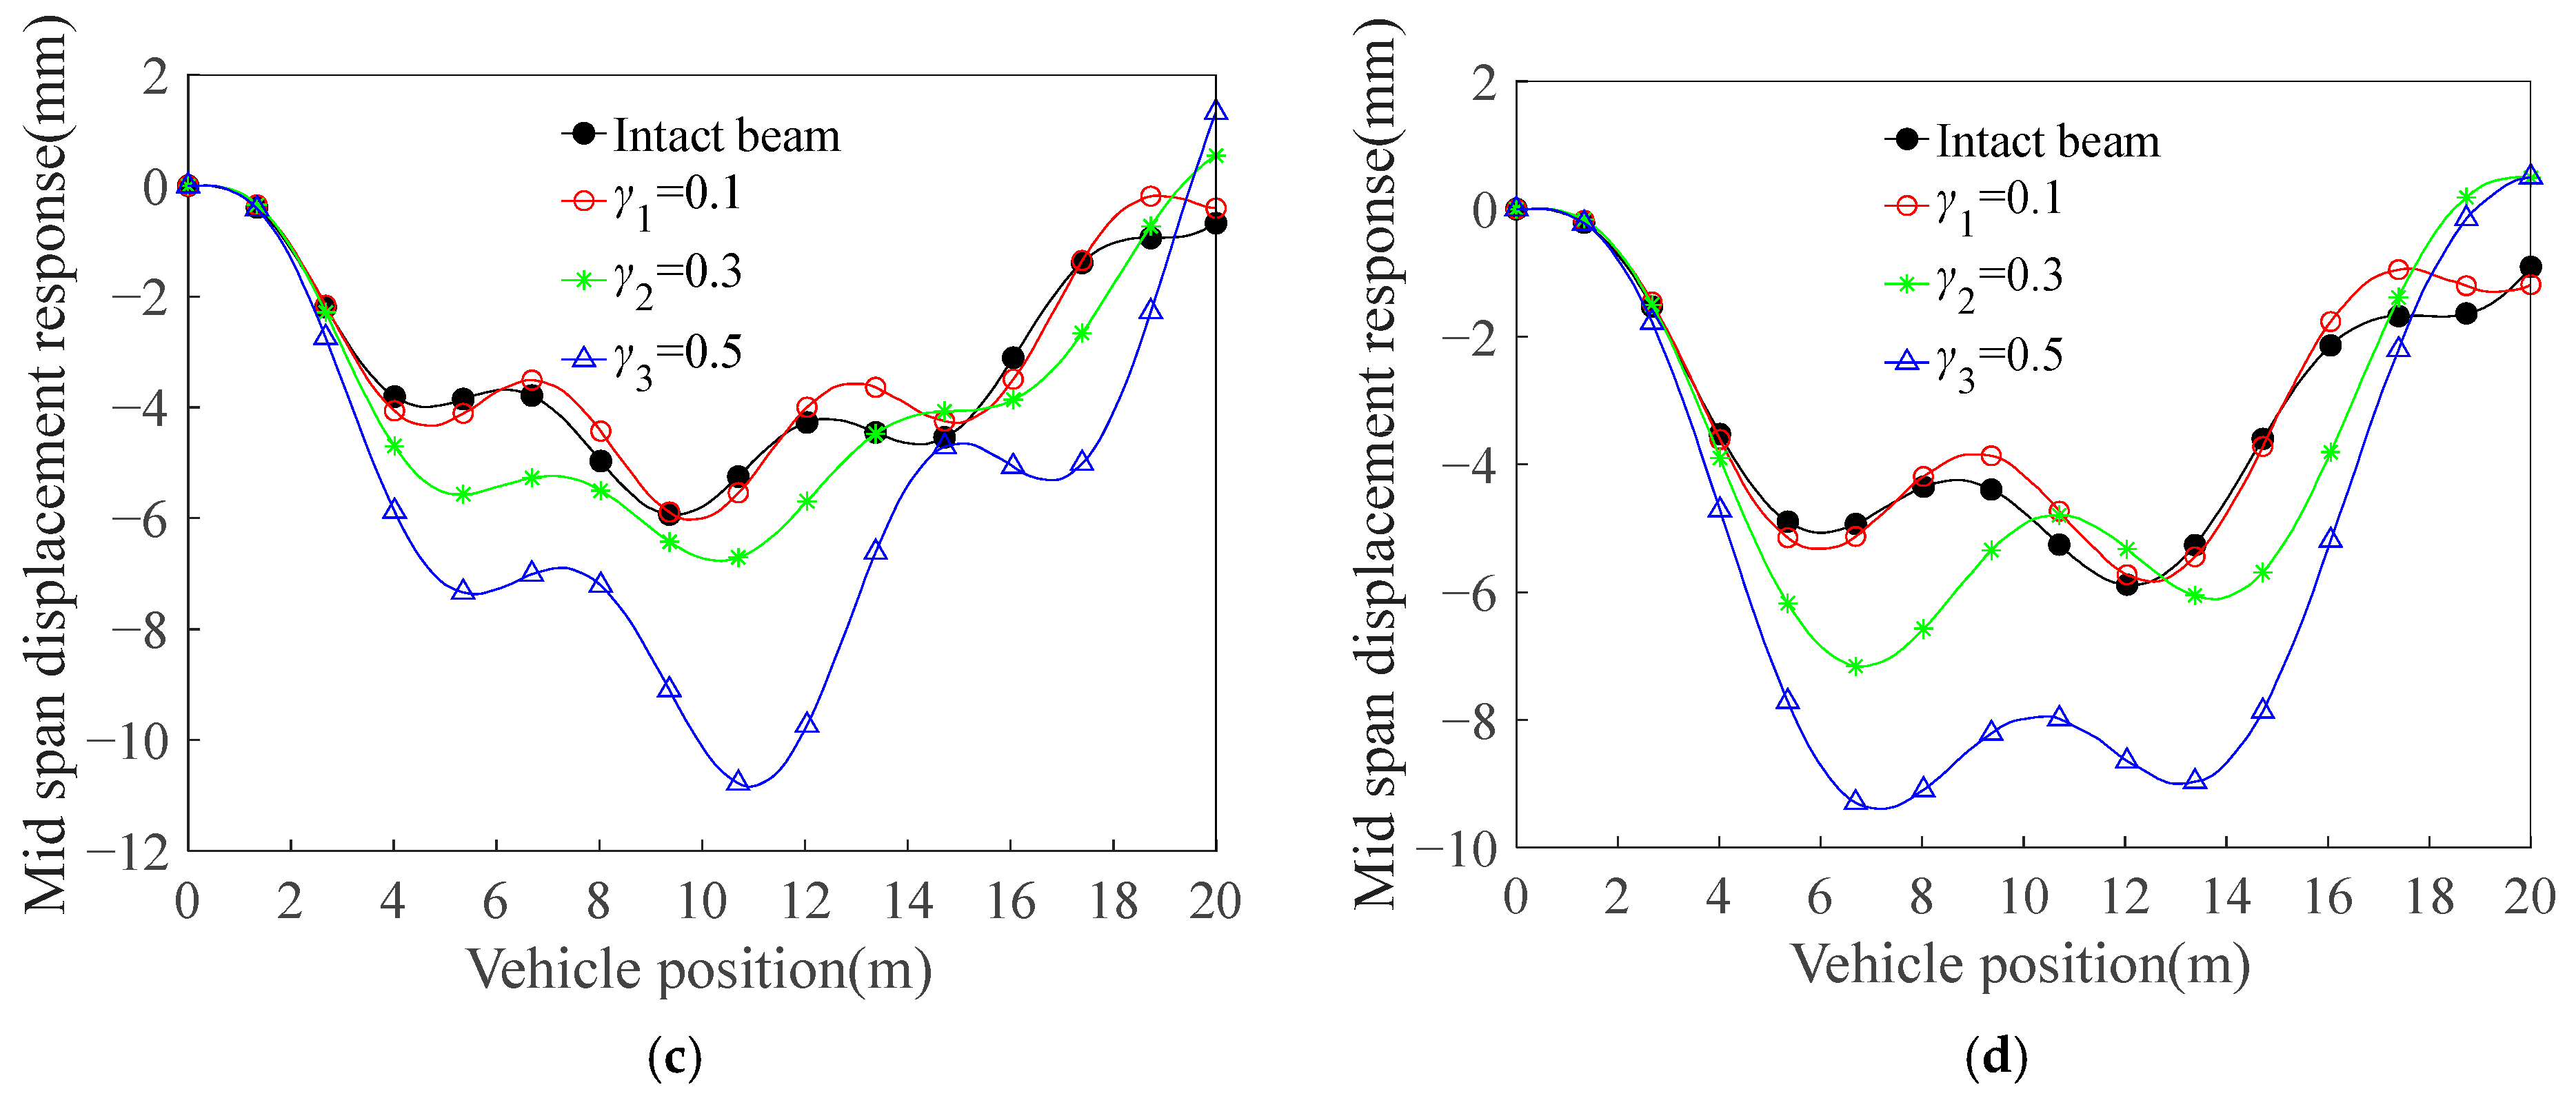
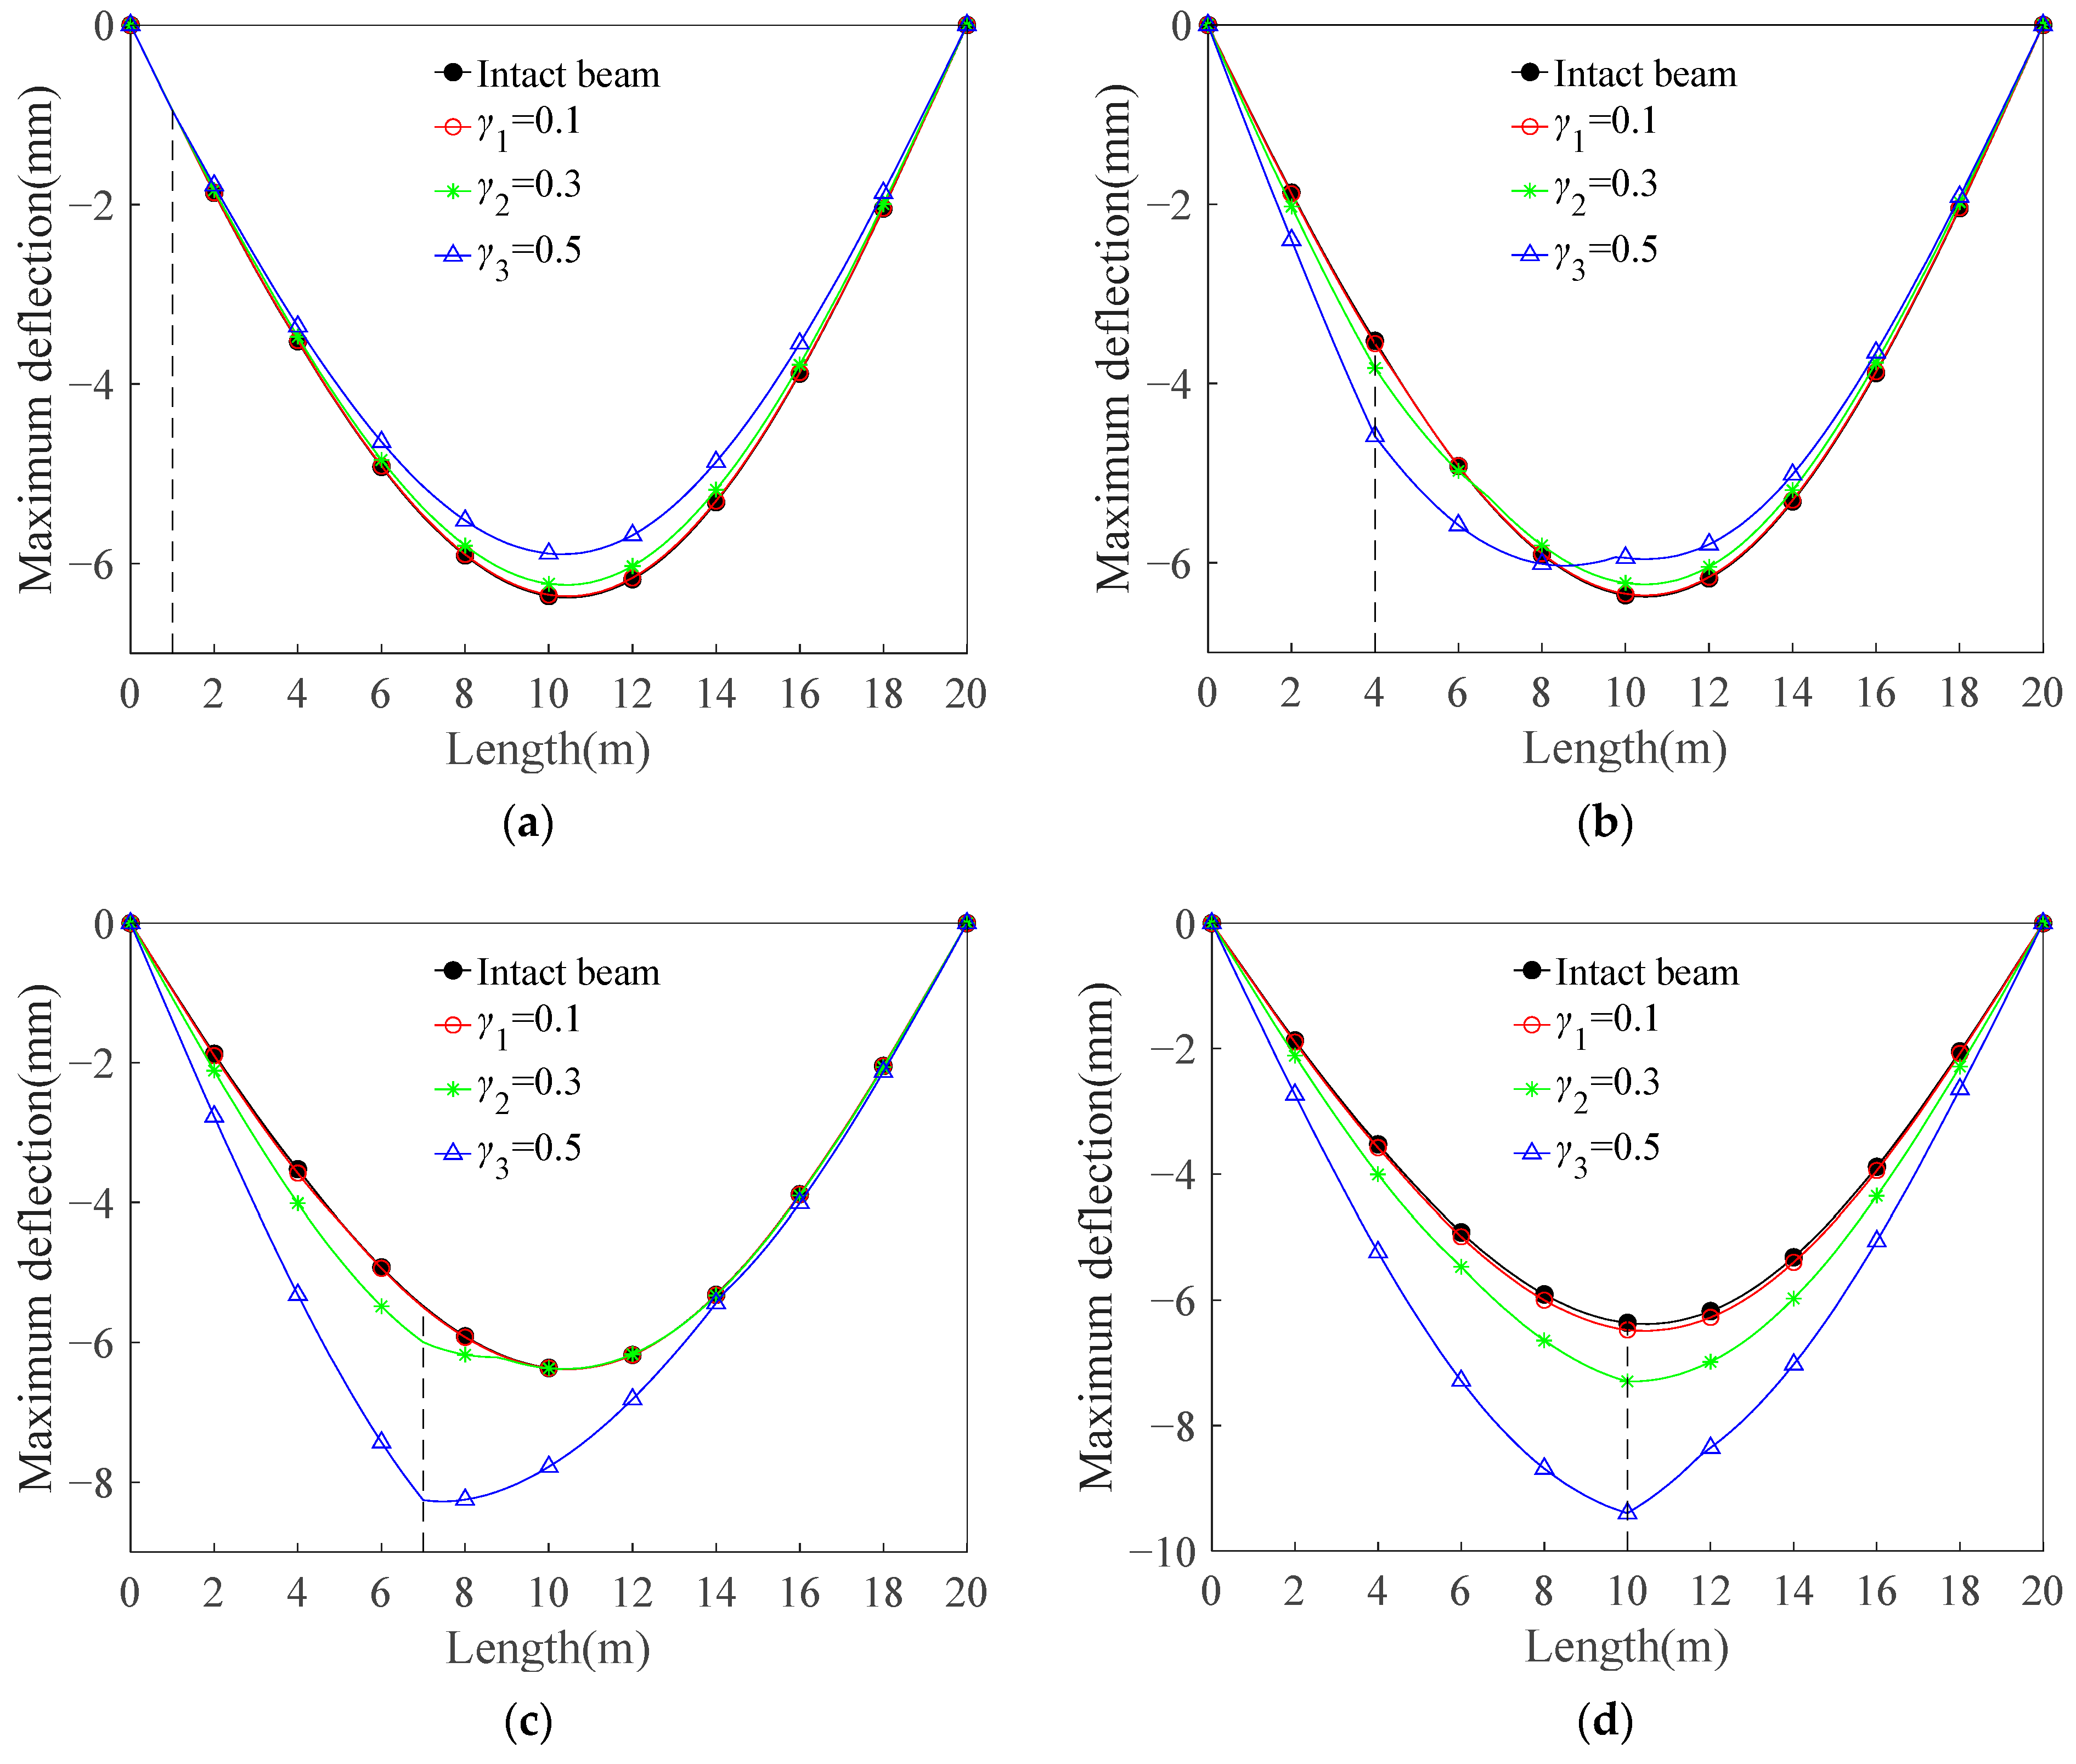
A systematic computational investigation was performed to quantify the maximum deflection distribution along the beam span under varying crack configurations. Deflection profiles were numerically acquired at a vehicular speed of 40 m/s, with detailed spatial distributions documented in Figure 10.
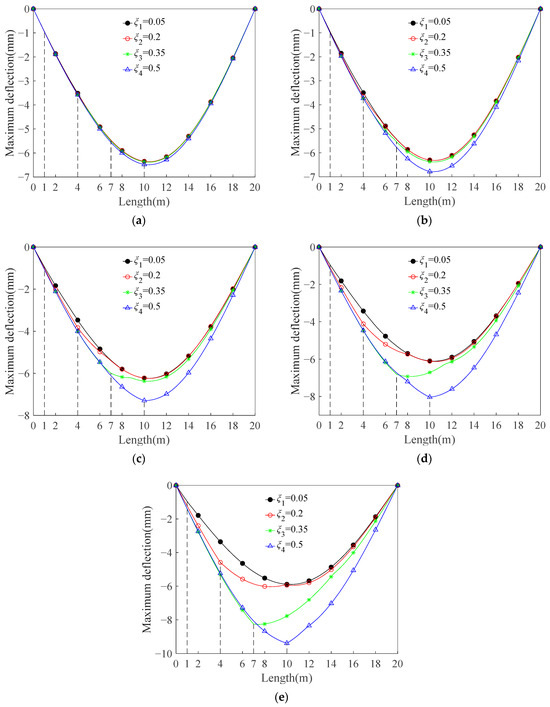
Figure 10.
Effect of crack location on maximum deflection under different crack depths (vertical dashed line indicates crack location): (a) ; (b) ; (c) ; (d) ; (e) .
The parametric study encompasses five crack depth ratios ( = 0.1, 0.2, 0.3, 0.4, and 0.5) and four normalized crack positions ( = 0.05, 0.2, 0.35, and 0.5). An analysis of Figure 10 reveals three critical observations:
(1) For shallow cracks ( = 0.1 to 0.3) and deep mid-span cracks ( = 0.5 at = 0.5), the maximum deflection consistently localizes at the mid-span section.
(2) For deep cracks ( ≤ 0.3) positioned at ≤ 0.2, the cracked beam retains the vibration characteristics of an intact beam (peak values within 2.8~3.4% variance as shown in Figure 10b, with the maximum response still occurring at the mid-span position). Conversely, when the cracks are positioned at > 0.2, the maximum deflection of the cracked beam occurs at the crack position, and the peak dynamic deflection at the crack exceeds that at the mid-span.
(3) A deflection migration phenomenon emerges when cracks exceeding = 0.4 are located near mid-span ( = 0.35), where the maximum deflection shifts toward the crack location, surpassing mid-span values by 6.1% as shown in Figure 10d.
(3) Vehicle speed
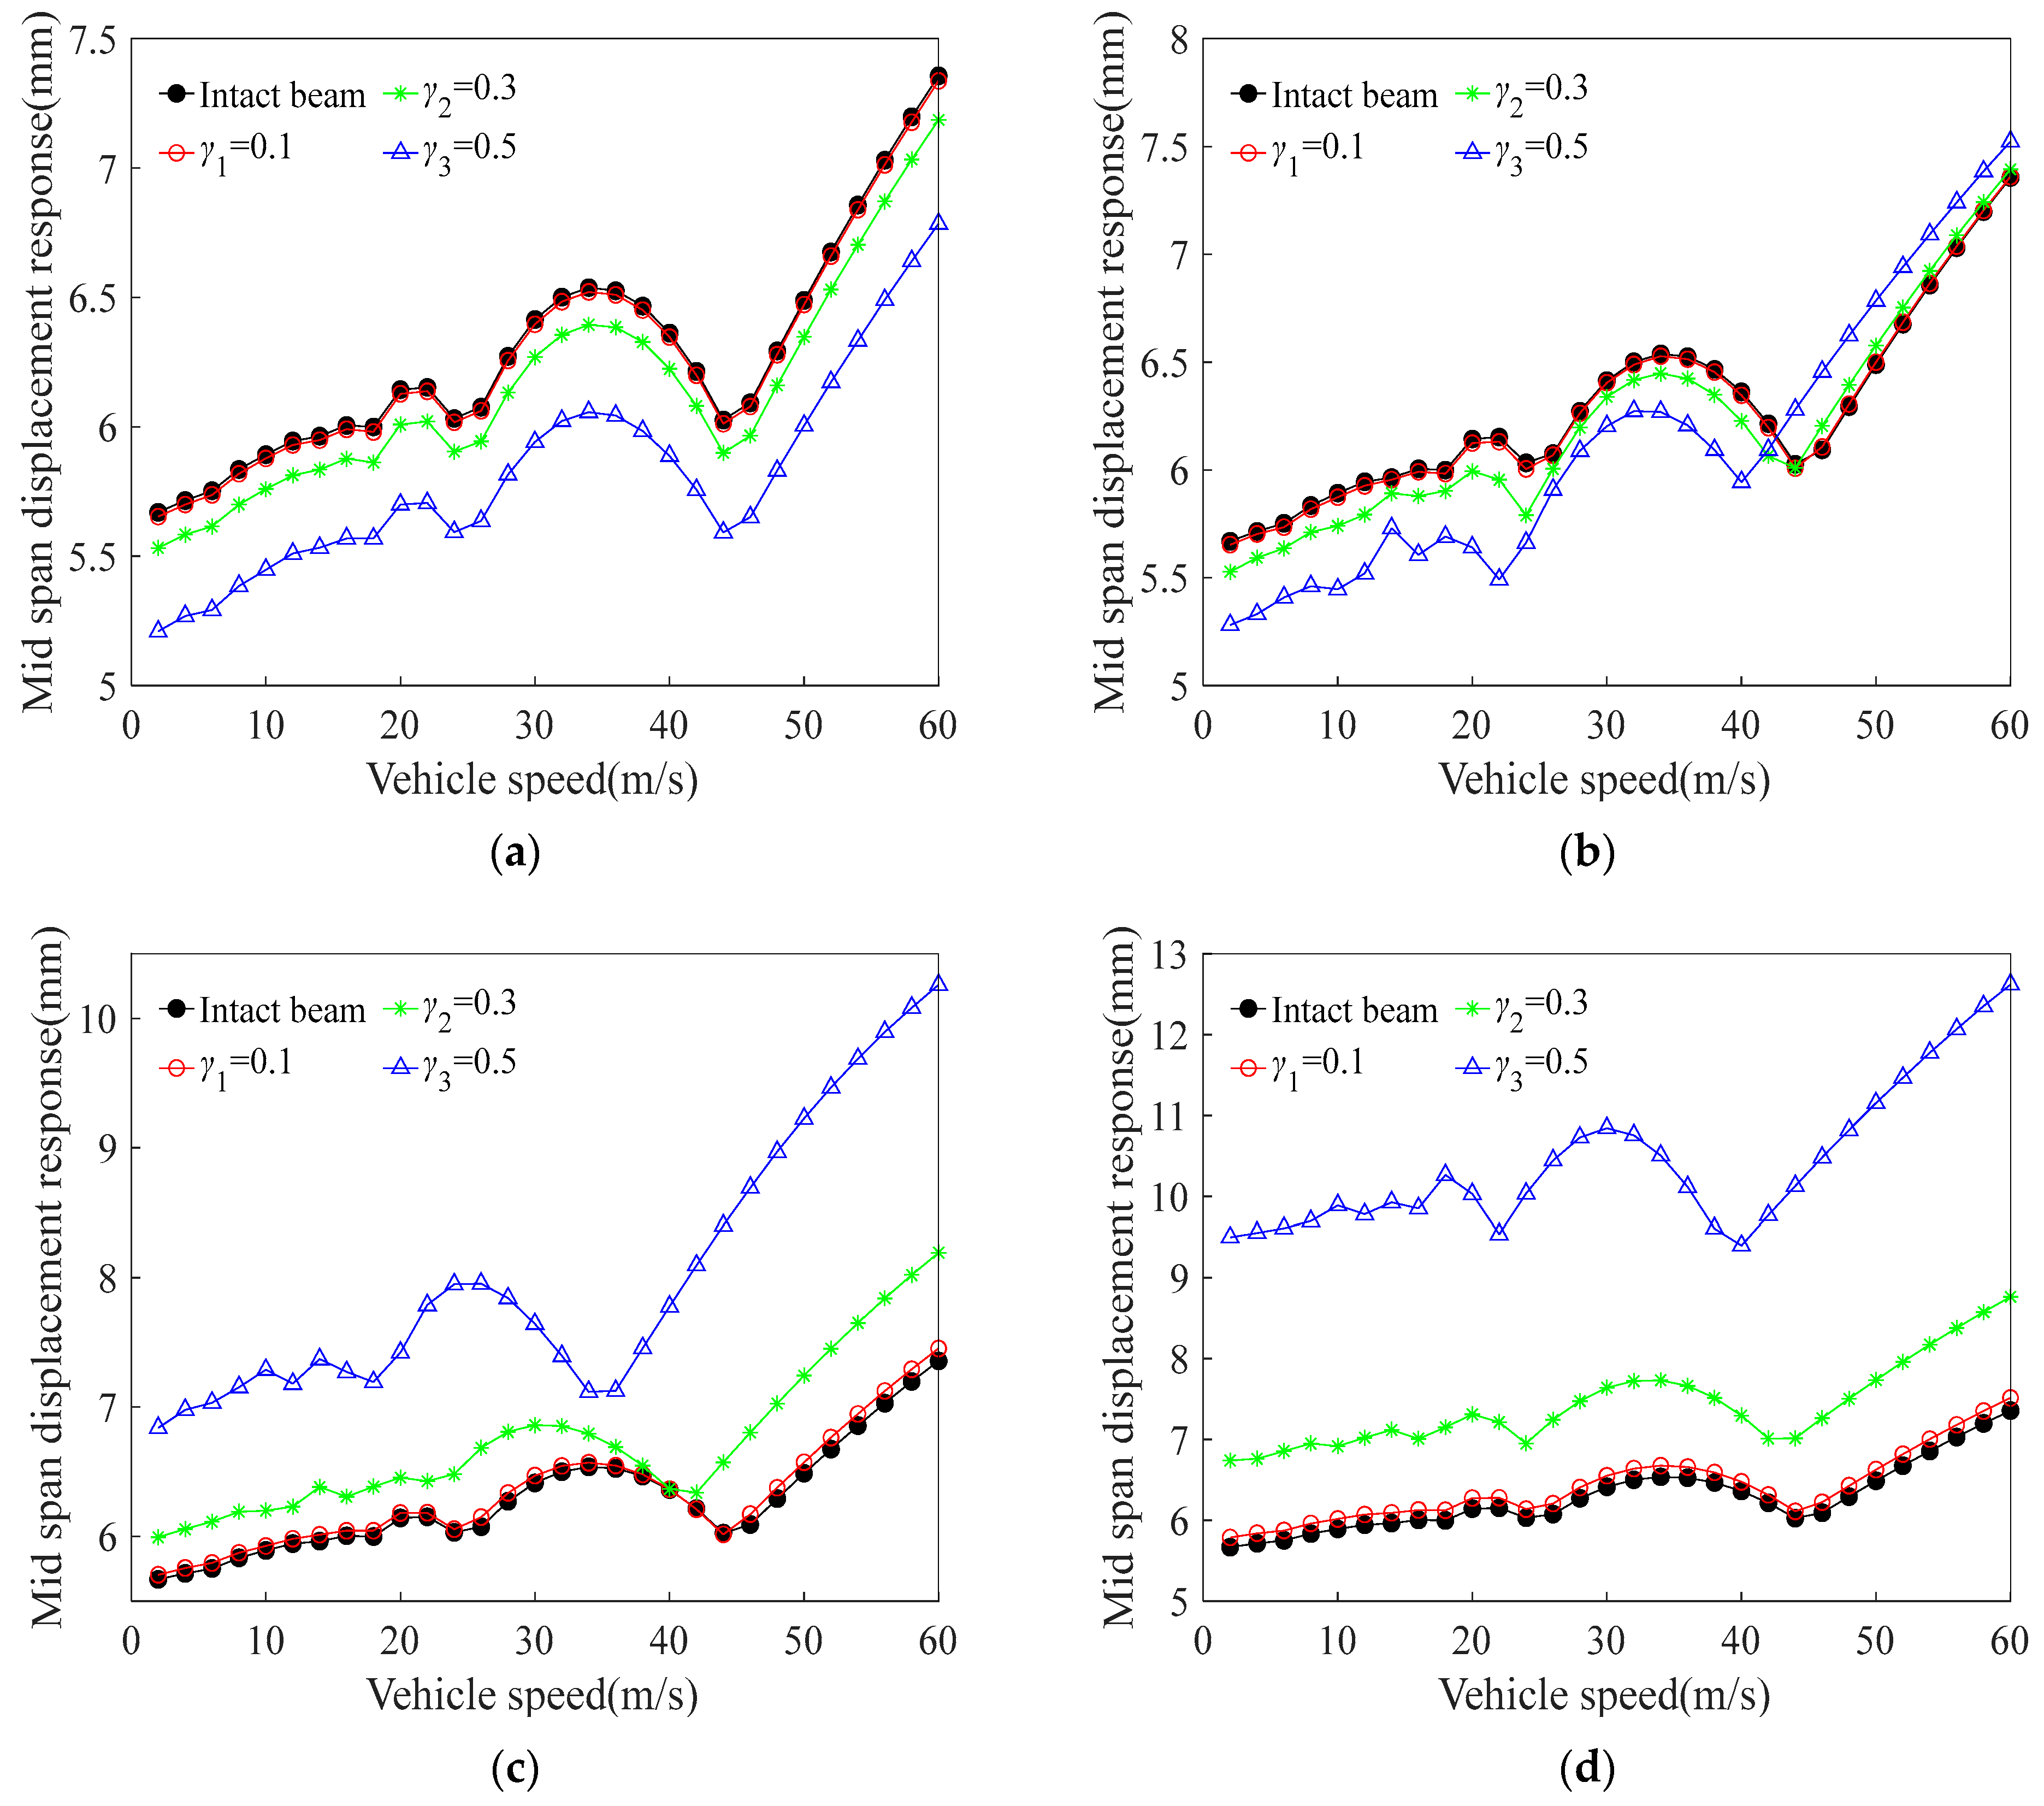
Figure 11 systematically compares the intermediate deflection across the span characteristics across four structural conditions (intact beam and three cracked configurations) under vehicular speeds spanning 2~60 m/s with 2 m/s increments. Key findings from the speed-dependent analysis reveal the following:
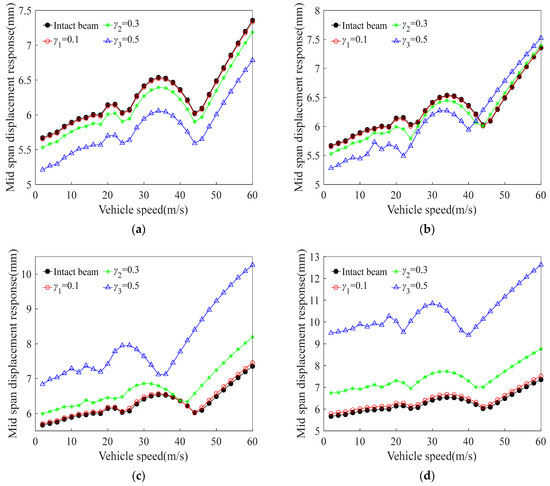
Figure 11.
Effect of cracks on maximum deflection at different vehicle speeds: (a) ; (b) ; (c) ; (d) .
(1) Crack proximity effects:
For cracks positioned beyond the beam’s mid-span region ( ≤ 0.05), the maximum intermediate deflection across the span decreases by 7.5% with increasing crack depth ( = 0.1→0.5). Conversely, cracks adjacent to mid-span ( ≥ 0.35) induce 37.6~68.0% deflection amplification under equivalent depth progression.
(2) Speed-deflection coupling:
The relationship between vehicle speed and the maximum deflection at the intermediate across the span is notably intricate. As vehicle speed increases, the maximum deflection observed at mid-span exhibits a nonlinear growth pattern. The rate at which the maximum dynamic deflection attains its peak value is influenced by both the depth and location of the crack. When = 0.35, the intact beam reaches its minimum deflection at a velocity of 44 m/s, whereas the cracked beam with = 0.5 achieves its minimum at a velocity of 34 m/s.
4. Conclusions
This paper presents a method for analyzing the dynamic response of a cracked simply supported beam subjected to moving loads based on the Euler–Bernoulli beam theory and employing analytical formulations. The effectiveness of this method was validated through comparisons with reference literature results. Furthermore, the influence of varying crack depths and positions on the dynamic response of a bridge was examined. The following conclusions are drawn:
(1) Speed-Invariant Crack Effects
When the speed is constant, the depth and position of the crack will not change the shape of the bridge vibration curve; at the same speed, the maximum deflection of beams with 10%, 30%, and 50% cracks in the middle span increases by 2.10%, 14.96%, and 43.04%, respectively, compared with those without cracks.
(2) Crack Location–Displacement Coupling Relationship
Crack migration toward mid-span ( = 0.05→0.5) linearly increases mid-span displacement without modifying the vibration curve shape. Critical threshold occurs at crack depth ≥ 40% and position ≤ 0.35 where maximum deflection shifts from mid-span to crack location (6.1% positional deviation).
Crack Depth–Vehicle speed Relationship
The rate at which the maximum dynamic deflection attains its peak value is influenced by both the depth and location of the crack. When = 0.35, the intact beam reaches its minimum deflection at a velocity of 44 m/s, whereas the cracked beam with = 0.5 achieves its minimum at a velocity of 34 m/s.
Author Contributions
Conceptualization, S.G.; Software, Z.G. (Zhisheng Gui), M.T., Y.X. and W.F.; Investigation, H.Z., Z.G. (Zhisheng Gui), M.T., Z.G. (Zhongzhao Guo), K.Z. and W.F.; Resources, Y.X.; Writing—original draft, H.Z. and M.T.; Writing—review & editing, S.G., H.Z. and Z.G. (Zhongzhao Guo); Supervision, S.G. All authors have read and agreed to the published version of the manuscript.
Funding
This study is financially supported by the National Natural Science Foundation of China (No. 52068024, 52108141) and the Jiangxi Provincial Natural Science Foundation (No. 20224BAB214066).
Data Availability Statement
The original contributions presented in the study are included in the article, further inquiries can be directed to the corresponding author/s.
Acknowledgments
During the preparation of this work, the authors used ChatGPT-3.5 in order to improve the readability and language of the manuscript. After using this tool, the authors reviewed and edited the content as needed and take full responsibility for the content of this manuscript.
Conflicts of Interest
The authors declare no conflict of interest.
References
- Zhou, Y.; Zhao, Y.; Yao, H.; Jing, Y. Full-Scale Experimental Investigation of the Static and Dynamic Stiffness of Prestressed Concrete Girders. Shock Vib. 2019, 2019, 7646094. [Google Scholar] [CrossRef]
- Zheng, K.; Zhou, S.; Zhang, Y.; Wei, Y.; Wang, J.; Wang, Y.; Qin, X. Simplified evaluation of shear stiffness degradation of diagonally cracked reinforced concrete beams. Materials 2023, 16, 4752. [Google Scholar] [CrossRef] [PubMed]
- Tan, G.; Shan, J.; Wu, C.; Wang, W. Free vibration analysis of cracked Timoshenko beams carrying spring-mass systems. Struct. Eng. Mech. A Int. J. 2017, 63, 551–565. [Google Scholar]
- Yang, J.; Chen, Y.; Xiang, Y.; Jia, X.L. Free and forced vibration of cracked inhomogeneous beams under an axial force and a moving load. J. Sound Vib. 2008, 312, 166–181. [Google Scholar] [CrossRef]
- Lin, H.-P.; Chang, S.-C. Forced responses of cracked cantilever beams subjected to a concentrated moving load. Int. J. Mech. Sci. 2006, 48, 1456–1463. [Google Scholar] [CrossRef]
- Zheng, T.; Ji, T. An approximate method for determining the static deflection and natural frequency of a cracked beam. J. Sound Vib. 2012, 331, 2654–2670. [Google Scholar] [CrossRef]
- Dimarogonas, A.D. Vibration of cracked structures: A state of the art review. Eng. Fract. Mech. 1996, 55, 831–857. [Google Scholar] [CrossRef]
- Zhong, S.; Oyadiji, S.O. Analytical predictions of natural frequencies of cracked simply supported beams with a stationary roving mass. J. Sound Vib. 2008, 311, 328–352. [Google Scholar] [CrossRef]
- Aydin, K. Free vibration of functionally graded beams with arbitrary number of surface cracks. Eur. J. Mech. A-Solid. 2013, 42, 112–124. [Google Scholar] [CrossRef]
- Li, Q.S. Free vibration analysis of non-uniform beams with an arbitrary number of cracks and concentrated masses. J. Sound Vib. 2002, 252, 509–525. [Google Scholar] [CrossRef]
- Chondros, T.G.; Dimarogonas, A.D.; Yao, J. A continuous cracked beam vibration theory. J. Sound Vib. 1998, 215, 17–34. [Google Scholar] [CrossRef]
- Lin, H.P.; Chang, S.C.; Wu, J.D. Beam vibrations with an arbitrary number of cracks. J. Sound Vib. 2002, 258, 987–999. [Google Scholar] [CrossRef]
- Bakhtiari-Nejad, F.; Khorram, A.; Rezaeian, M. Analytical estimation of natural frequencies and mode shapes of a beam having two cracks. Int. J. Mech. Sci. 2014, 78, 193–202. [Google Scholar] [CrossRef]
- Lin, H.P. Direct and inverse methods on free vibration analysis of simply supported beams with a crack. Eng. Struct. 2003, 26, 427–436. [Google Scholar] [CrossRef]
- Lee, J.W.; Lee, J.Y. A transfer matrix method capable of determining the exact solutions of a twisted Bernoulli–Euler beam with multiple edge cracks. Appl. Math. Model 2017, 41, 474–493. [Google Scholar] [CrossRef]
- Nguyen, K.V. Mode shapes analysis of a cracked beam and its application for crack detection. J. Sound Vib. 2014, 333, 848–872. [Google Scholar] [CrossRef]
- Liu, D.; Jiang, J.; Han, H.; Sun, G.; Huo, R.; Zhou, D. Free vibration analysis of beams with an open crack at clamped end by the sub-domain Chebyshev–Ritz method. IJST-T Civ. Eng. 2023, 47, 415–430. [Google Scholar] [CrossRef]
- Huang, H.; Zheng, H.; Deng, J.; Li, W.; Li, Y. Random analysis of coupled vehicle–bridge systems with local nonlinearities based on explicit time-domain method. Nonlinear Dynam. 2022, 108, 81–95. [Google Scholar] [CrossRef]
- Law, S.S.; Zhu, X.Q. Bridge dynamic responses due to road surface roughness and braking of vehicle. J. Sound Vib. 2005, 282, 805–830. [Google Scholar] [CrossRef]
- Yu, P.; Yu, C.; Ren, Z.; Wang, L. Vehicle–Bridge Coupling Vibration of Long-Span Concrete-Filled Steel Tubular Arch Bridge. Int. J. Struct. Stab. Dyn. 2025, 25, 2550064. [Google Scholar] [CrossRef]
- Zhang, Y.; Duan, J.; Liu, Y.; Chen, Z.; Su, Y.; Liu, S. Dynamic Analysis of a Vehicle–Bridge System Under Excitation of Random Road Irregularities. Buildings 2024, 14, 3413. [Google Scholar] [CrossRef]
- Mahmoud, M.A.; Abou Zaid, M.A. Dynamic response of a beam with a crack subject to a moving mass. J. Sound Vib. 2002, 256, 591–603. [Google Scholar] [CrossRef]
- Nguyen, K.V.; Tran, H.T. Multi-cracks detection of a beam-like structure based on the on-vehicle vibration signal and wavelet analysis. J. Sound Vib. 2010, 329, 4455–4465. [Google Scholar] [CrossRef]
- Law, S.S.; Zhu, X.Q. Dynamic behavior of damaged concrete bridge structures under moving vehicular loads. Eng. Struct. 2004, 26, 1279–1293. [Google Scholar] [CrossRef]
- Zhou, L.; Liu, H. Response of cracked simply supported concrete beam with moving vehicle load. Struct. Concr. 2016, 17, 875–882. [Google Scholar] [CrossRef]
- Shafiei, M.; Khaji, N. Analytical solutions for free and forced vibrations of a multiple cracked timoshenk o beam subject to a concentrated moving load. Acta Mech. 2011, 221, 79–97. [Google Scholar] [CrossRef]
- Pala, Y.; Reis, M. Dynamic response of a cracked beam under a moving mass load. J. Eng. Mechasce 2013, 139, 1229–1238. [Google Scholar] [CrossRef]
- Saimi, A.; Bensaid, I.; Fellah, A. Effect of crack presence on the dynamic and buckling responses of bidirectional functionally graded beams based on quasi-3D beam model and differential quadrature finite element method. Arch. Appl. Mech. 2023, 93, 3131–3151. [Google Scholar] [CrossRef]
- Ghannadiasl, A.; Khodapanah Ajirlou, S. Dynamic analysis of multiple cracked Timoshenko beam under moving load–analytical method. J. Vib. Control 2022, 28, 379–395. [Google Scholar] [CrossRef]
- Wang, W.J.; Lv, Z.R.; Liu, J.K. The dynamic response and time-frequency analysis of the bridge with breathing cracks. J. Vib. Shock 2013, 32, 12–16. (In Chinese) [Google Scholar]
- Tan, G.J.; Liu, Z.Y.; Wang, L.L.; Wang, L.S.; Cheng, Y.C. Free vibration analysis of a small or medium-span cracked simply supported bridge considering bridge-vehicle interaction. J. Vib. Eng. 2016, 29, 831–841. (In Chinese) [Google Scholar]
- Gui, S.R.; Chen, S.S.; Xu, S.Q. Comparison of three models for vehicle-bridge coupled vibration of simple beam bridge subjected to moving load. J. East China Jiaotong Univ. 2007, 24, 35–39. (In Chinese) [Google Scholar]
- Shi, L.N.; Yan, W.M.; He, H.X.; Chen, Y.J. Sensitivity of natural frequency and dynamic characteristics of the beam with open cracks to crack parameters. J. Vib. Meas. Diagn. 2016, 36, 881–889+1022. (In Chinese) [Google Scholar]
- Luo, J.B.; Xiao, Y.G.; Qian, C.Z. Nonlinear dynamic characteristics analysis of cracked beams under moving vehicle loads. J. Railw. Sci. Eng. 2009, 6, 36–39. (In Chinese) [Google Scholar]
Disclaimer/Publisher’s Note: The statements, opinions and data contained in all publications are solely those of the individual author(s) and contributor(s) and not of MDPI and/or the editor(s). MDPI and/or the editor(s) disclaim responsibility for any injury to people or property resulting from any ideas, methods, instructions or products referred to in the content. |
© 2025 by the authors. Licensee MDPI, Basel, Switzerland. This article is an open access article distributed under the terms and conditions of the Creative Commons Attribution (CC BY) license (https://creativecommons.org/licenses/by/4.0/).