Article

Day–Night Synergy Between Built Environment and Thermal Comfort and Its Impact on Pedestrian Street Vitality: Beijing–Chengdu Comparison

1
Economic and Technological Development Zone, Hebei University of Engineering, Taiji Road 19, Handan 056003, China
2
Stuart Weitzman School of Design, Department of Architecture, University of Pennsylvania, Main Campus, Philadelphia, PA 19103, USA
*
Author to whom correspondence should be addressed.
Buildings 2025, 15(12), 2118; https://doi.org/10.3390/buildings15122118
Submission received: 22 May 2025 / Revised: 11 June 2025 / Accepted: 15 June 2025 / Published: 18 June 2025
(This article belongs to the Topic Sustainable Built Environment, 2nd Volume)

Abstract

With the acceleration of urbanization, existing studies have primarily focused on the influence of either built environment factors or thermal comfort on street vitality, while their synergistic effects remain underexplored. This study selects four pedestrian commercial streets in Beijing and Chengdu for dual validation to reveal the varying impacts of built environment elements on street vitality under different climatic conditions and to uncover the diurnal dynamic effects. The key findings include the following: (1) the shop width (optimal between 8 and 14 m) and the number of items of street furniture are the core drivers of vitality across time and space; (2) although the visibility of greenery is often recommended to boost vitality, its influence is nonlinear and closely tied to thermal comfort; (3) thermal comfort and street width dynamically affect the spatiotemporal variations in vitality; and (4) daytime vitality is mainly driven by spatial comfort related to commercial density, furniture, and thermal comfort, while nighttime vitality relies more on the synergy between street width and shop transparency. This study aims to support differentiated street design across climates, enhancing both economic vitality and sustainable urban development.

1. Introduction

Urbanization has become a dominant global trend, with projections indicating that by 2025, 66% of the world’s population will reside in urban areas [1]. Cities are undergoing an irreversible expansion, a process reflected not only in population growth but also in the intensification of infrastructure development, housing demand, and economic activities. As large cities increasingly emerge as consumption hubs [2], a new consumption-driven economy has flourished. The construction of new commercial centers is now seen as critical for promoting employment, improving service provision, enhancing quality of life, and ultimately, boosting urban competitiveness and sustainable development.
In this context of rapid urban expansion and evolving economic landscapes, pedestrian-oriented commercial streets featuring multifunctionality, open layouts, and walkable designs have become vital carriers of urban vitality [3]. Compared with traditional commercial patterns, these spaces not only encourage the development of walkable and sustainable communities but also preserve the city’s original urban fabric and architectural identity [4], serving as unique commercial landmarks. Moreover, they play a crucial role in attracting investment and fostering cultural tourism. As a result, designing pedestrian commercial spaces that enhance micro-scale public space vitality, improve citizens’ well-being, and sustain long-term street vitality has emerged as a critical focus in contemporary urban design research.
However, the processes of urbanization have also transformed urban forms, encroached upon green spaces, altered building facades, and intensified urban heat island effects, thereby exacerbating environmental degradation, global warming, and extreme climate events [5,6,7,8]. Growing recognition of the socioeconomic impacts of environmental conditions has shifted attention to the urban thermal environment—defined as the microclimate characteristics (e.g., air temperature, humidity, solar radiation, wind velocity) within built-up areas that directly influence human thermal comfort and physiological responses [9,10,11]. Built environments, particularly at the micro-scale of commercial streets, are now seen not only as part of the problem but also as part of the solution. Pedestrians’ thermal comfort within these environments has become a latent factor influencing street vitality. While numerous studies have confirmed that built environment factors affect pedestrian vitality, they often overlook the complex interactions among these variables [12]. Although strategies such as increasing the greenery and street furniture are widely recommended to enhance street vitality [13], their effectiveness may diminish under extreme thermal conditions if climatic factors are ignored.
Existing research has predominantly analyzed thermal comfort and built environment factors in isolation, emphasized large-scale urban vitality, and rarely conducted micro-scale studies of pedestrian commercial streets or cross-city comparative analyses. Addressing these gaps, this study integrates thermal environmental factors into the analysis of the built environment impacts on the vitality of pedestrian commercial streets. We hypothesize that certain built environment factors interact with thermal comfort to jointly influence street vitality.
Focusing on China, the world’s largest developing country and a hotspot for urban commercial transformation, we selected four representative pedestrian commercial streets: Sanlitun South District and Nanluoguxiang in Beijing, and Taikoo Li and Kuanzhai Alley in Chengdu. These streets were chosen following a multi-criteria design: they share comparable commercial positioning (premier mixed-use destinations), design typologies (modern open block vs. traditional courtyard layouts), and urban prominence, yet they lie in distinct climatic zones (temperate monsoon in Beijing vs. humid subtropical in Chengdu).
Although there are differences in the current definitions and expressions of vitality for pedestrian commercial streets, the core perspective emphasizes the harmonious relationship and interaction between humans and the urban environment. Street vitality refers to the attractiveness and activity level formed by various elements and behaviors in the street space. Behavioral changes directly determine the performance of vitality: the efficiency of path selection is related to the number of pedestrians, the comfort of staying positions affects the length of stay, and the richness of activity types determines the diversity of behaviors. Drawing on Gehl’s concept of vitality [14], due to the similar research scale, shared goal of enhancing street vitality, and strong operational feasibility, this study adopts the small public space vitality assessment method proposed by Tong Niu [15]. We quantitatively measure the micro-scale street vitality and employ machine learning algorithms to analyze the relationships between built environment factors and street vitality. A heat environment–street vitality response model is constructed.

1.1. Climate Environment and Its Impact on Urban Vitality

The climate environment plays a fundamental role in shaping the vitality of public spaces by influencing human thermal comfort, activity willingness, and behavioral patterns. With the ongoing urbanization process, there is growing scholarly interest in the relationship between urban climate and spatial vitality [16,17]. Recent studies in this domain can be categorized into two key areas.
(I) Direct impact of thermal comfort. Under the dual pressures of rapid urbanization and global warming, urban residents are increasingly exposed to extreme urban heatwave events. Consequently, research has shifted toward understanding the deteriorating urban thermal environment and its effects on human well-being [16], highlighting variations in thermal comfort across different regions and architectural typologies [18,19]. Empirical findings indicate that thermal conditions significantly influence psychological, physiological, and behavioral responses [20,21], with dynamic thermal experiences shaping human perceptions of the built environment [22,23].
(II) Spatial heterogeneity of the microclimate. This research stream focuses on how urban morphology modifies the climate environment, thereby affecting human experiences. Studies have identified specific local climate zone typologies that enhance thermal comfort and reduce cooling loads, ultimately influencing resident behavior [24]. While the existing research predominantly examines parks, plazas, and green spaces [25,26], studies on streets primarily explore the street canyon effect, morphological orientation, and street width as key determinants of microclimate variations [27,28,29].
The current research primarily focuses on the direct physiological impacts of climate on the human body. As urban morphological changes increasingly influence climatic conditions, the research paradigm has gradually shifted from static analyses to dynamic regulation, and from seasonal behavioral studies to climate-adaptive design approaches. However, a critical research gap remains: existing studies tend to isolate the effects of either thermal conditions or singular built environment factors on pedestrian street vitality, without examining the combined influences of thermal environments and built environment characteristics. Urban streets are not only contributors to thermal comfort challenges; they must also be recognized as integral components that jointly shape pedestrians’ walking experiences alongside thermal conditions.

1.2. The Relationship Between the Built Environment and Urban Vitality

Public spaces play a crucial role in fostering interpersonal interactions. Vitality reflects whether the physical environment of a public space is lively and attractive at the human scale, and it also serves as an indicator of individuals’ sense of well-being in urban life. The study of vitality has progressively shifted from qualitative assessments toward quantitative analyses [30], especially following the insights offered by space syntax in revealing the profound relationships between spatial morphology and street vitality. Building on this foundation, recent research has exhibited the following emerging trends.
(I) Diverse activities and refined user demands. Given the varied interactions between individuals and the built environment, research has shifted toward a differentiated perception framework based on the human–environment interaction theory. This includes examining age stratification effects, such as differences in street perception between adolescents and the elderly [31,32], as well as variations in user types, distinguishing between workers and tourists [33,34]. Additionally, studies explore pedestrian mobility patterns, addressing the distinct needs of runners and cyclists [35,36]. This refined perspective expands the understanding of urban vitality’s value across diverse user groups.
(II) Diverse data sources and advanced collection methods. Advancements in data acquisition and computation have addressed the limitations of traditional observational methods, enabling multi-modal analyses. Studies on spatiotemporal heterogeneity employ temporal and spatial data [37,38], while social media trajectories and mobile platform data enhance research on human mobility patterns [39,40,41]. Urban planning studies utilize land use data and remote sensing imagery [42,43,44,45], whereas deep learning techniques (e.g., PSPNet model) aid in street-level morphological analysis [46,47,48]. Additionally, audiovisual data integration supports multi-sensory research, offering a more comprehensive understanding of urban vitality [49,50].
(III) Interdisciplinary approaches and nonlinear modeling. As linear regression models face increasing scrutiny for their inability to capture complex urban interactions, research has embraced machine learning frameworks to uncover the nonlinear relationships between built environment attributes and urban vitality [51,52]. Techniques such as light gradient boosting machine (LightGBM), decision tree models, random forests (RF), and gradient boosting regression trees (GBRT) are now widely applied [53,54,55,56,57]. Recent studies also emphasize threshold effects and synergistic factor interactions [58,59], while innovations in spatial econometrics have led to the adoption of multiscale geographically weighted regression (MGWR) and geographically weighted random forest (GWRF), enhancing the spatial precision of variable associations [60,61,62]. These advancements collectively enable a more granular and comprehensive exploration of the complex dynamics between the built environment and street vitality, shaping the future of urban research.
However, the existing research has predominantly focused on cross-city analyses or studies within megacities [63,64,65,66,67], while comparatively less attention has been paid to the vitality of small-scale, high-utilization public spaces within cities. With advances in technology and improvements in data resolution, it has now become feasible to investigate the vitality of micro-scale pedestrian commercial streets. This enables a more nuanced analysis of the synergistic relationships between built environment factors and thermal comfort at finer spatial scales, thereby supporting more refined and responsive urban management.
This study aims to answer the following questions:
  • How do individual built environment factors influence the vitality of pedestrian commercial streets and what trends do they exhibit?
  • How do the interactions among different built environment factors affect street vitality?
Unlike previous studies that focus on city-scale vitality, this research examines vitality at the human scale (<500 m) of commercial streets. The findings will advance sustainable urban thermal environment improvements and urban renewal practices, offering insights into how thermal comfort and built environment interactions shape pedestrian vitality across different climatic zones and stages of urban development. Ultimately, this study contributes to enhancing the pedestrian experience and promoting sustainable urban futures.

2. Data and Methods

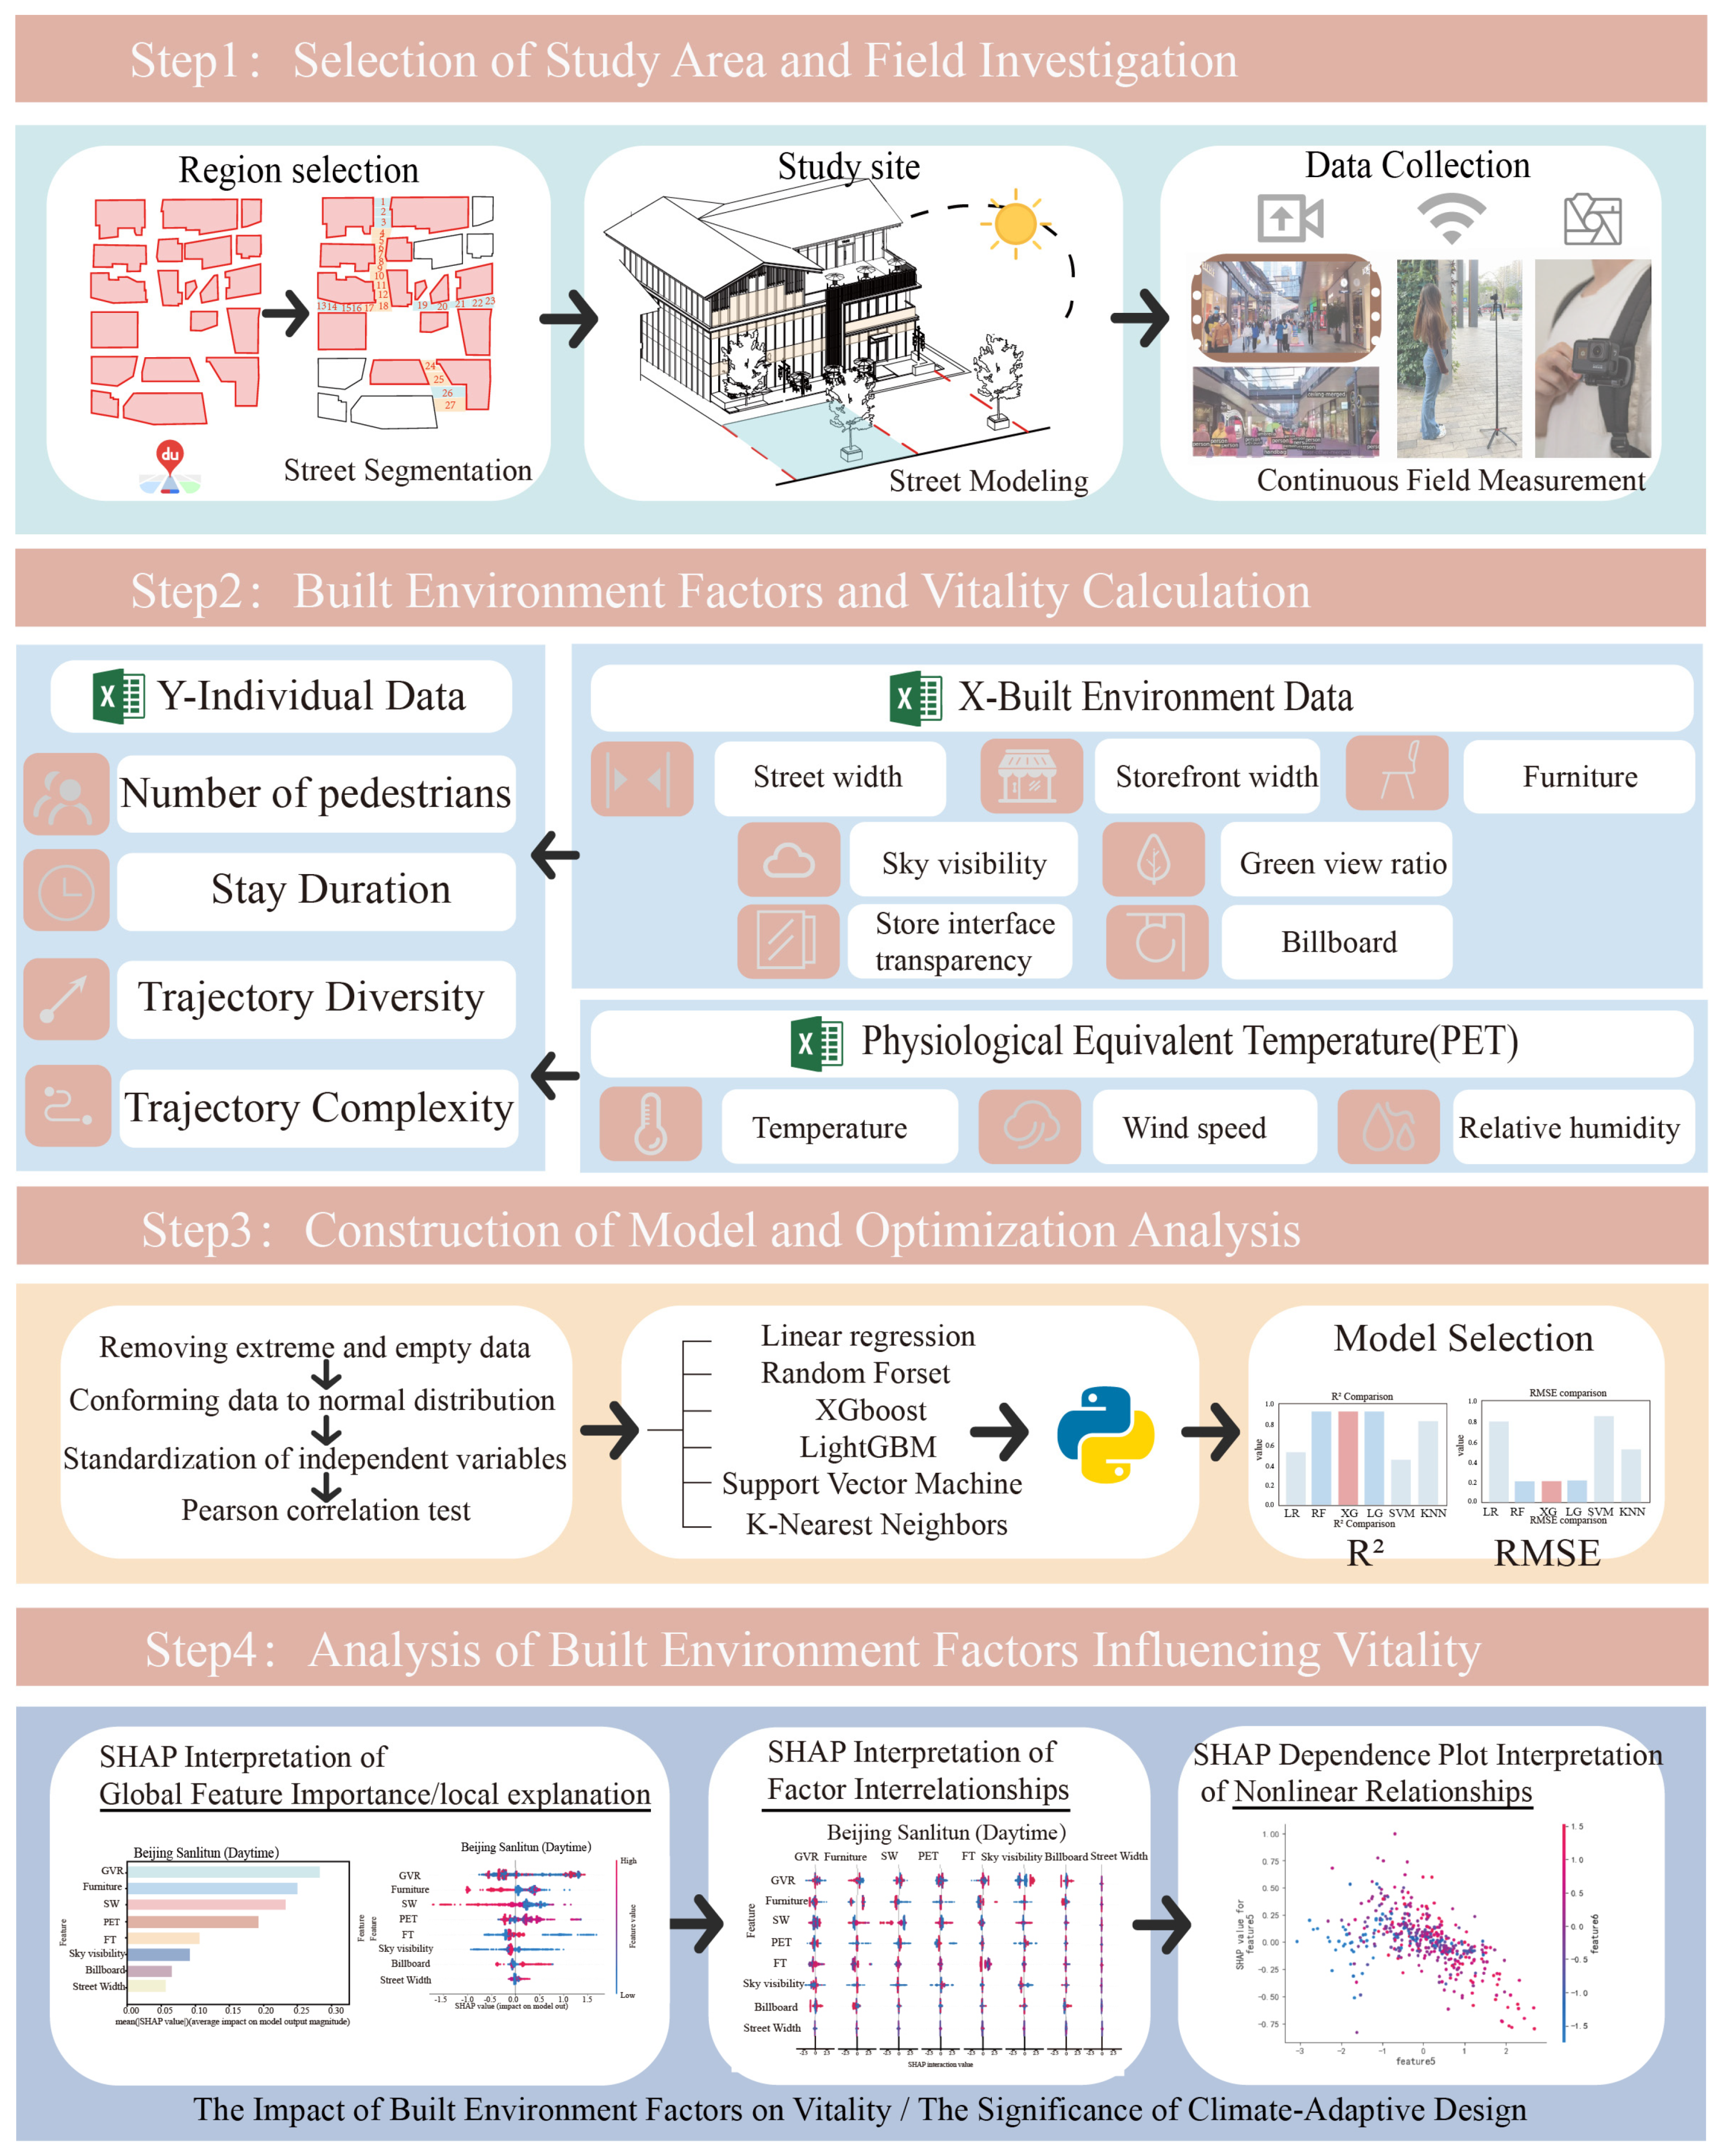
2.1. Research Framework
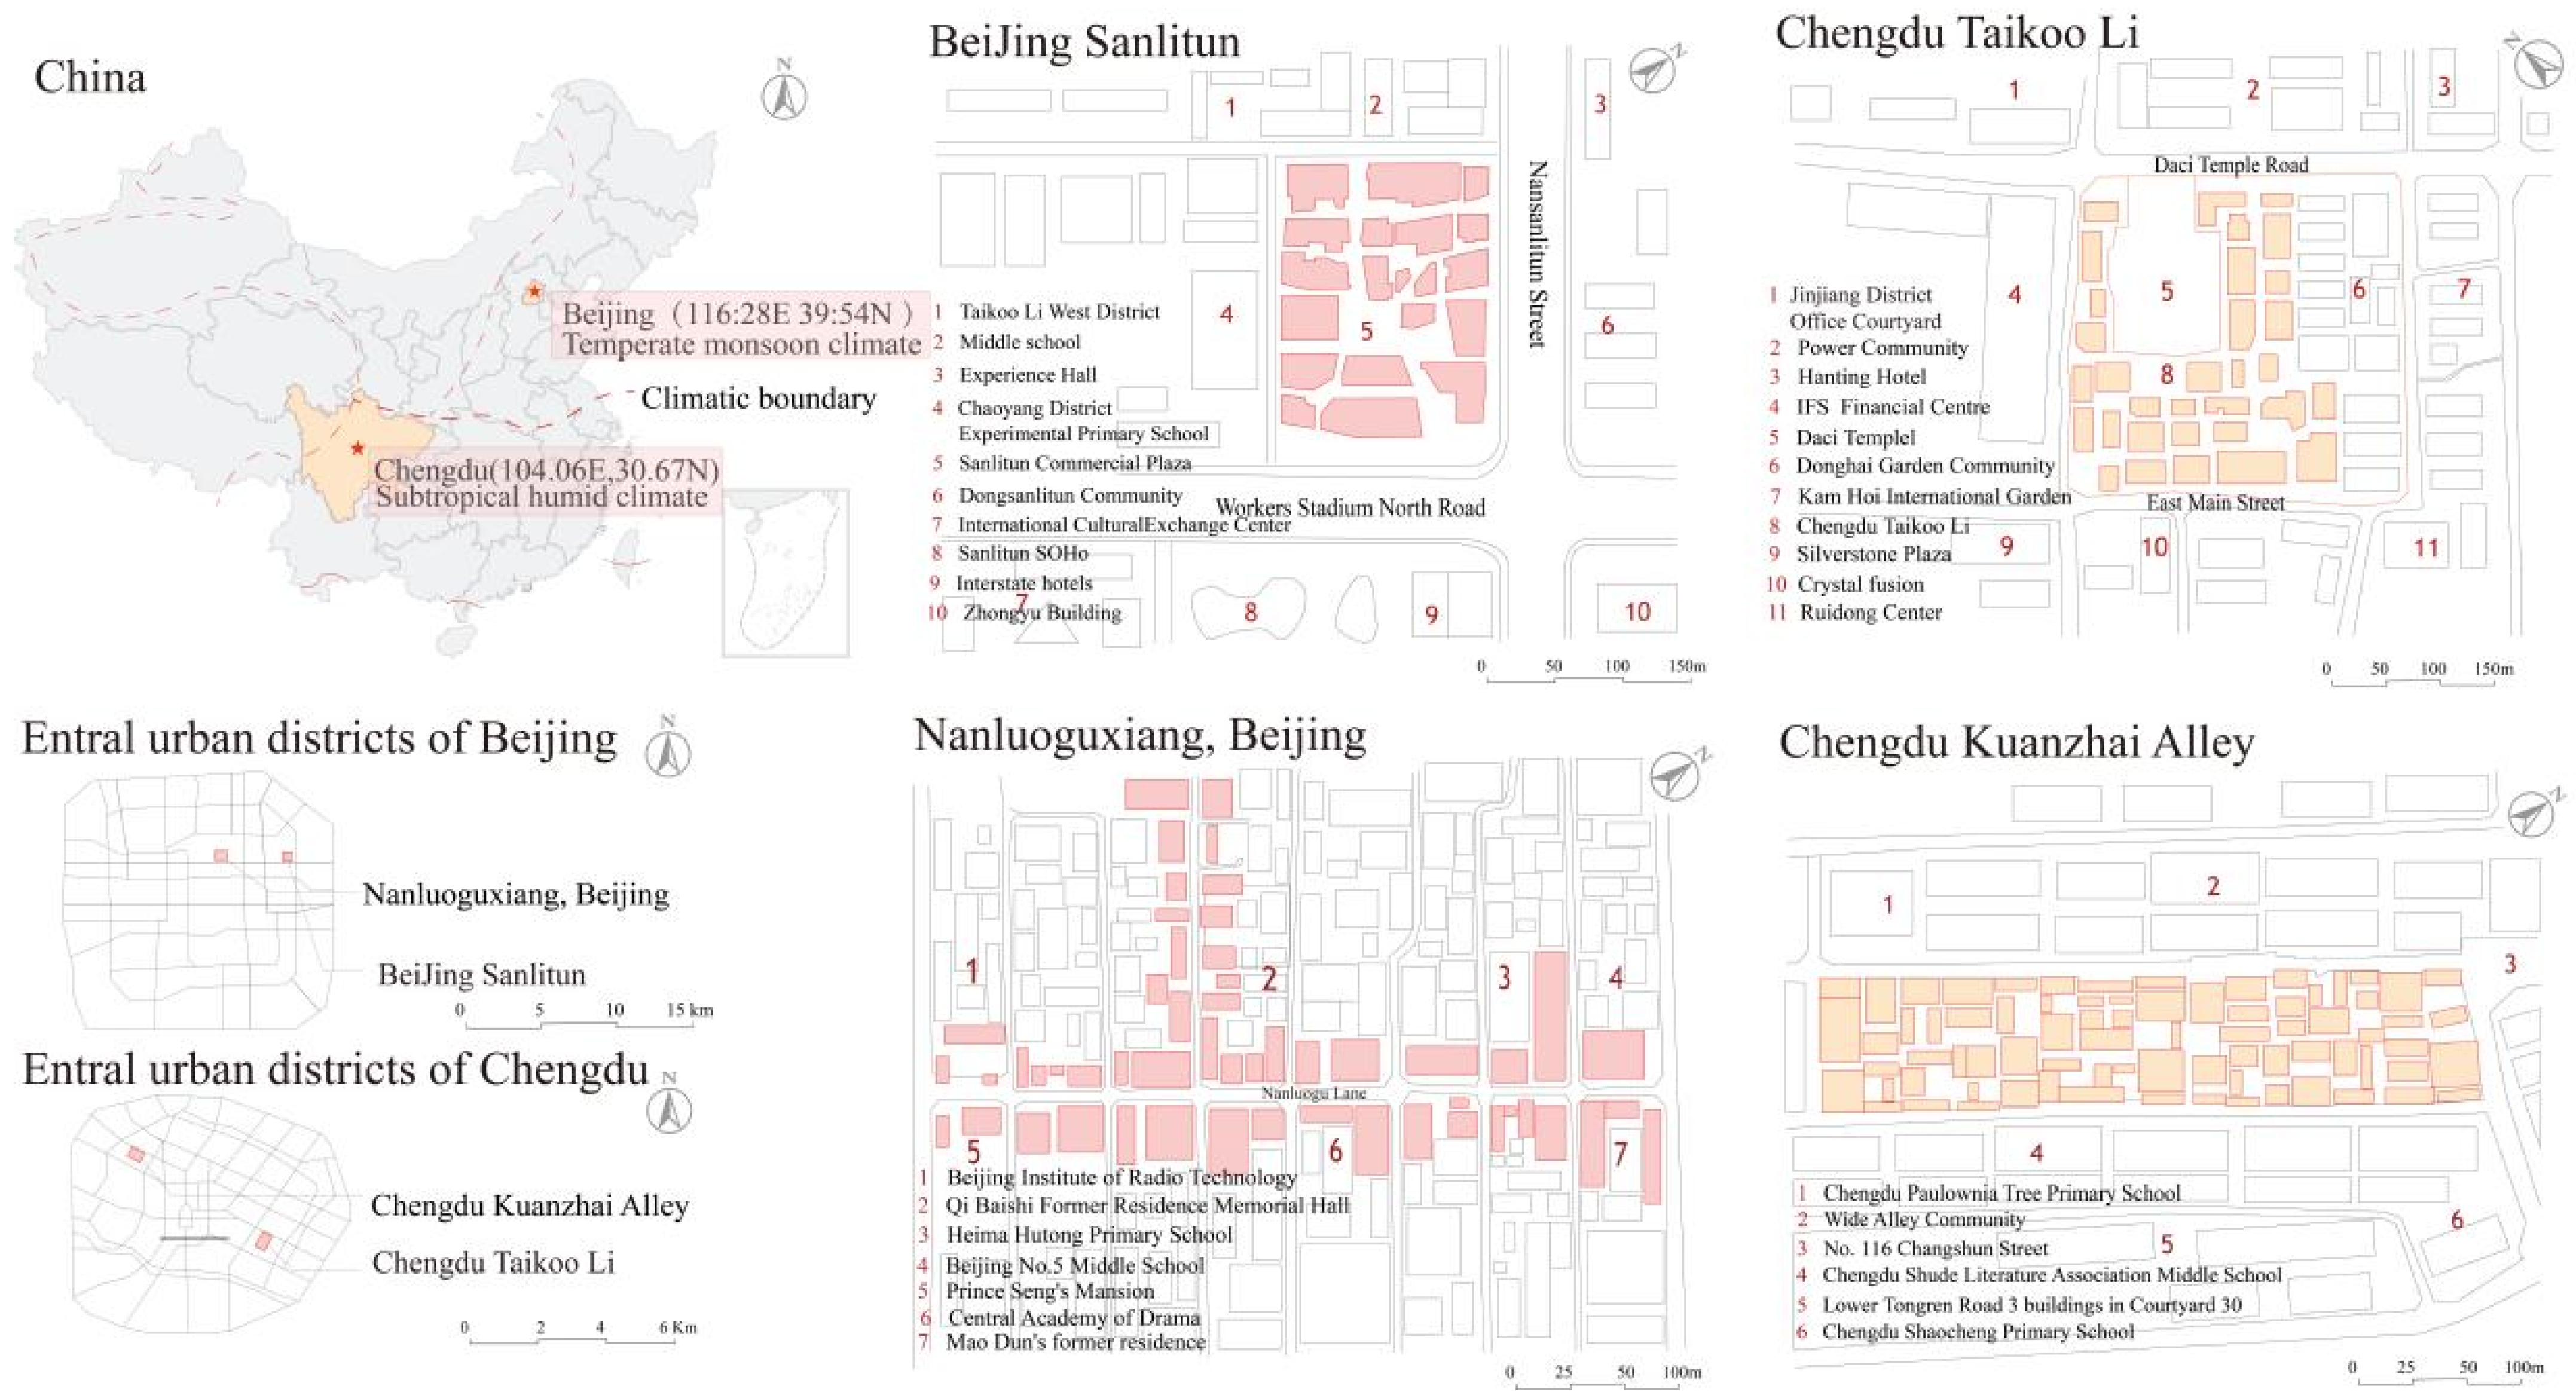
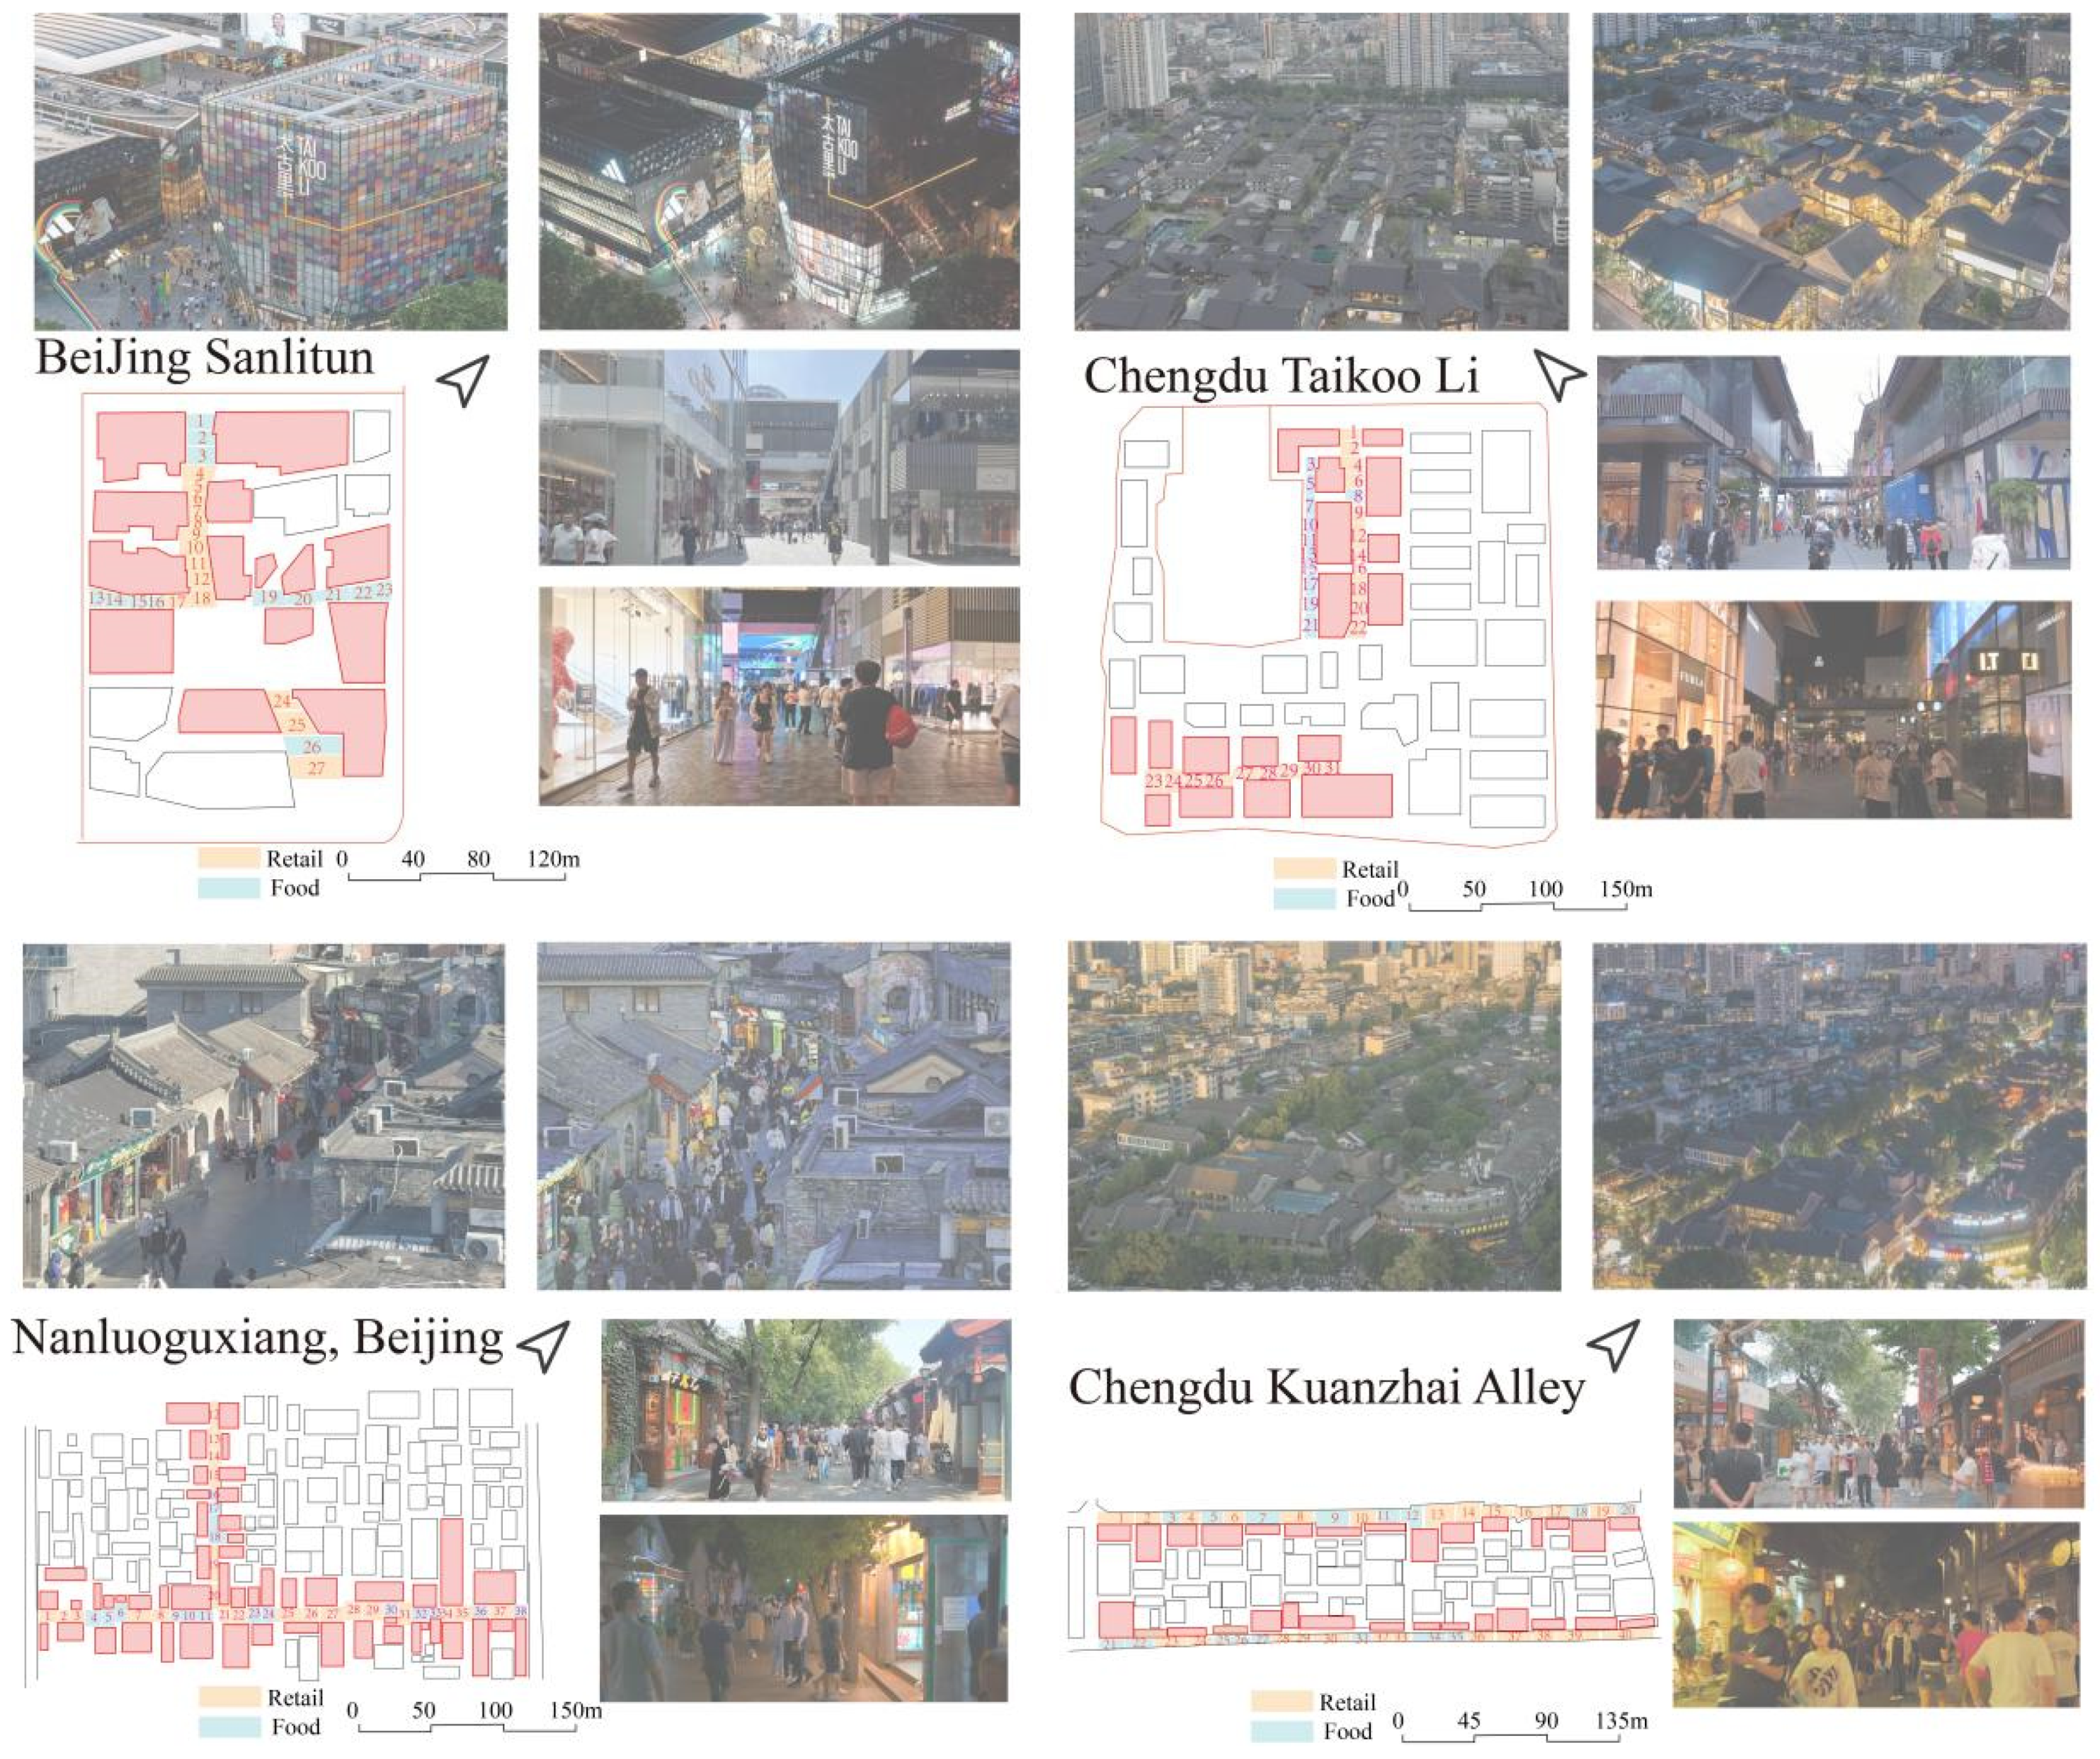
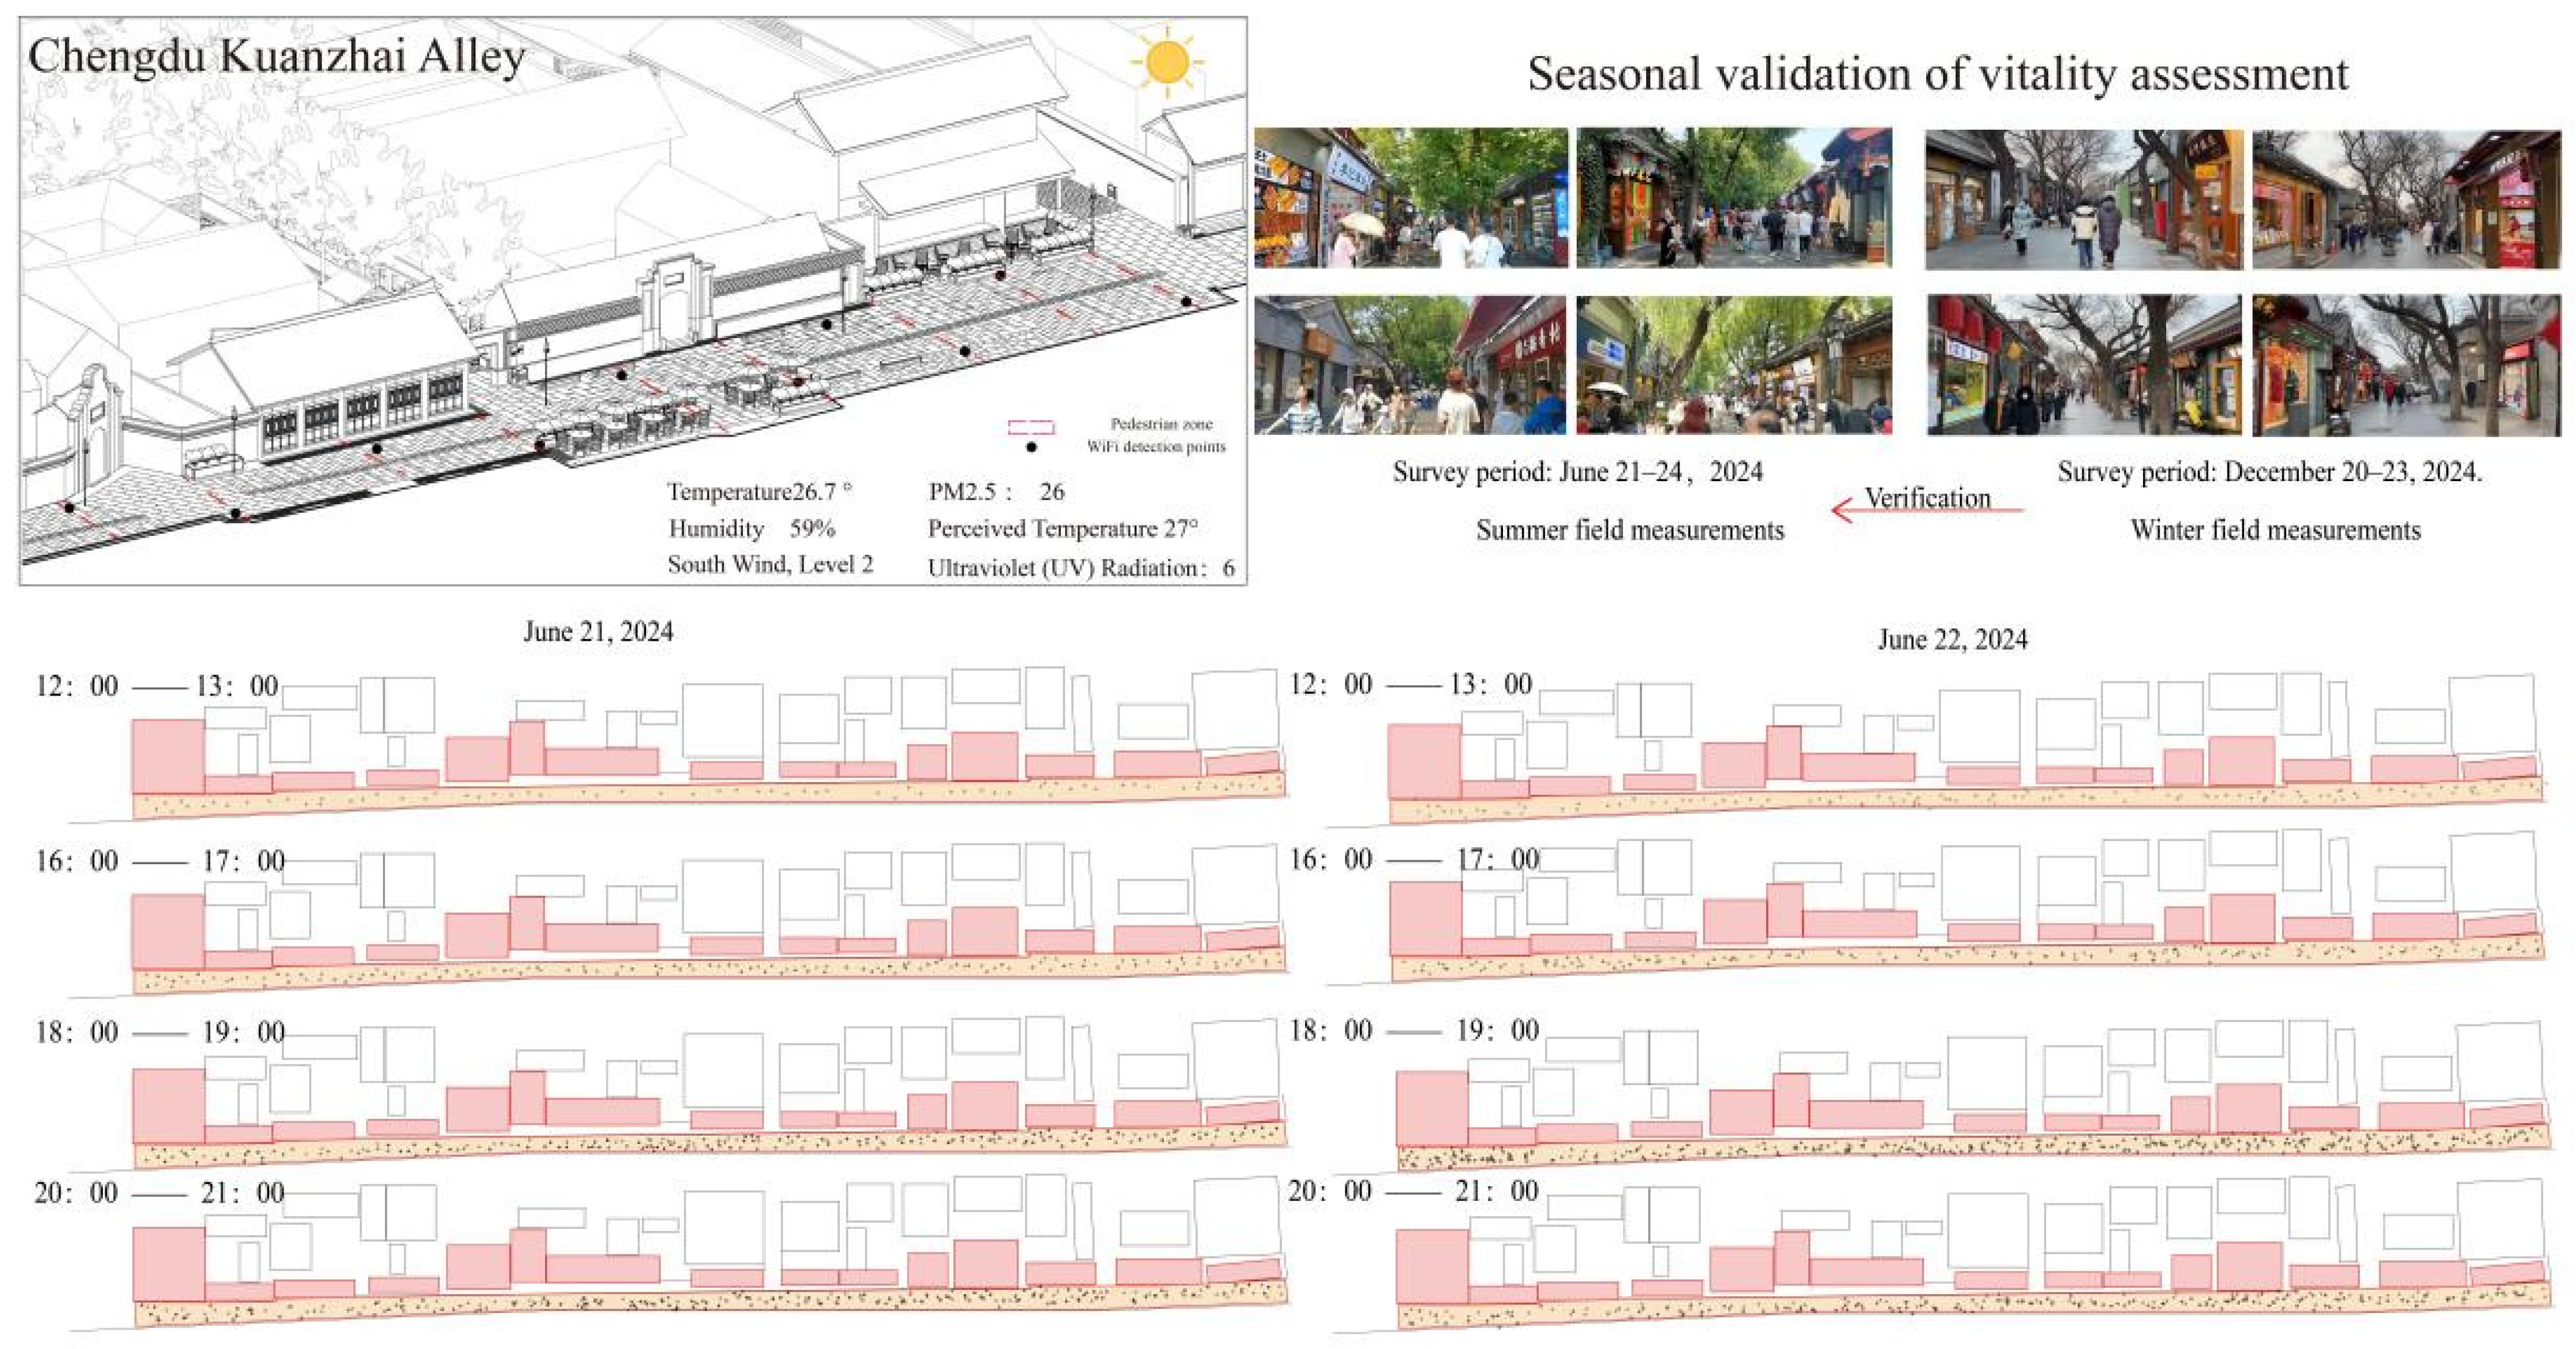
This study, grounded at the pedestrian scale, investigates the synergistic effects of built environment factors on street vitality within recently developed pedestrian commercial streets. It focuses on the following: (1) identifying key built environment factors and thermal comfort indicators to independently assess their impacts on pedestrian street vitality; (2) conducting cross-temporal and cross-city validations between Beijing and Chengdu to achieve a more comprehensive understanding of street vitality; and (3) employing interpretable machine learning algorithms to deeply explore the interactive influences of built environment factors on street vitality. Overall, this study aims to establish a thermal environment–street vitality response model to support dynamic and precise urban street renewal, ultimately enhancing urban competitiveness and attracting investment and consumption.
The experimental design is outlined in Figure 1 and proceeds as follows.
(I) Selection of study area and field investigation: To address the research questions, Beijing and Chengdu, representing different climatic regions, were selected as study sites. Preliminary surveys were conducted to identify the most prominent main streets in each city’s pedestrian commercial areas, resulting in four street samples for the field observation.
(II) Built environment factors and vitality calculation: Data were systematically collected and categorized. Based on extensive references to prior studies, specific built environment factors were selected, including the physiological equivalent temperature (PET) for thermal comfort, storefront width, facade permeability, sky view factor, street width, quantity of street furniture, green view index, and billboard density. Video data were used for validation, and all the data were matched to basic spatial research units.
(III) Construction of model and optimization analysis: To ensure data validity, additional rounds of data collection were conducted within a six-month period across the four commercial areas and cross-checked with the initial data. After data cleaning, the independent variables were standardized, and Pearson correlation tests along with collinearity analyses were performed. Six machine learning algorithms—linear regression, random forest, XGBoost, LightGBM, support vector machines, and k-nearest neighbors—were tested. Comparative evaluation identified the optimal model, which was subsequently fine-tuned through parameter optimization.
(IV) Analysis of built environment factors influencing vitality: Using Shapley additive explanation (SHAP), the influence of each built environment factor on street vitality was analyzed. The results were classified and synthesized to derive conclusions, offering new insights for advancing future research on pedestrian commercial street vitality.

2.2. Study Area

This research focuses on two major cities in China—Beijing and Chengdu, which are the largest developing cities globally. In Beijing, the study investigates the south area of Sanlitun Taikoo Li (referred to as Beijing Sanlitun) and Nanluoguxiang. In Chengdu, the study examines Taikoo Li and Kuan Zhai Alley. The specific locations are illustrated in the Figure 2 below.
The reasons for selecting these sites are as follows.
(I) Representative cities: Both Beijing and Chengdu are key representatives of China’s urban landscape. With dense populations, they serve as significant economic and cultural centers, possessing advanced infrastructure and high levels of technological development. Beijing is classified as an Alpha+ city in the global urban hierarchy, while Chengdu is a Beta+ city [1], reflecting their differing stages of development and offering an opportunity to expand the research’s scope.
(II) Distinct urban characteristics: These cities also represent different urban lifestyles. Beijing is known for its fast-paced life and high living costs, while Chengdu is characterized by a slower pace of life and lower costs. Additionally, Beijing’s climate is categorized as temperate monsoon, while Chengdu has a humid subtropical climate. Despite these differences, both cities have experienced extreme weather events in recent years. From 2022 to 2024, both cities recorded an average of five days annually with temperatures exceeding 40 °C, with an increasing trend in these extreme heat events [68].
The four commercial districts selected for this study are well-known in recent years, located in areas with similar regional conditions, and blend well with surrounding street patterns. These districts feature a combination of international brands and local stores and are designed to attract the new generation of consumers. They align with the trend of experiential shopping, serving as open-air pedestrian streets for relaxation and socializing. Among them, Beijing Sanlitun and Chengdu Taikoo Li lean toward modern design and share similarities, as they are being developed by the same real estate company. In contrast, Nanluoguxiang and Kuan Zhai Alley combine traditional and modern design elements, offering a similar design concept. The comparison of these four areas provides a representative case study of new consumer trends in modern urban environments.

2.3. Data Processing and Verification

The field observation for this study was conducted over four consecutive days from 21 June to 24 June 2024 (from Friday to Monday, with clear weather on all days). Data were collected during four distinct time intervals each day, using Beijing Standard Time, specifically from 12:00 to 14:00 (Time interval A), 15:00 to 17:00 (Time interval B), 18:00 to 20:00 (Time interval C), and 20:00 to 22:00 (Time interval D).
The data for this study were recorded at 25 min intervals using measurement equipment in compliance with the ISO 7730 standards [69]. Taking an average human height of 1.75 m as the reference, all the sensors were positioned at a height of 1.5–1.8 m above ground. Measurements were taken along the central axis of the street, where the street views were photographed and meteorological parameters collected, while video recordings were also made. To ensure the accuracy of the climatic factors, data from small-scale climate monitoring stations in both Beijing and Chengdu were also recorded. These stations operated under clear, breezy conditions (wind speed ≤ 2 m/s) with a sampling frequency of one minute. Four measurement locations were selected, and handheld meteorological devices were used to monitor the climate conditions at a height of 1.5 m above the ground. The following measurement parameters, along with their associated errors and resolution, were recorded: temperature error ± 0.5 °C (resolution 0.1 °C); relative humidity error ± 3% Rh (resolution 0.1 Rh); wind speed error ± 5% m/s (resolution 0.1 m/s). A comparison between the measured data and the simulated data revealed minimal discrepancies at the four measurement points, confirming the accuracy of the thermal environmental climate data.
Vector street maps of the selected streets were generated using Open Street Map and Baidu Maps, with the locations of the shops marked as shown in Figure 3. In China, pedestrian sidewalks typically have a width of less than 50 m. A 100 m range was found to be an appropriate choice for collecting data along the street [70]. Based on the pedestrian scale and the concept of cellular automata, the urban streets were divided into several basic research units, with each unit containing the collected data. The division was not based on fixed numerical values but rather on the width of the shops on the south or east side of the street, which allowed for more precise quantification of the data and differentiation of the vitality characteristics within each unit. Additionally, this approach facilitated easier comparison of the data between units, improving the accuracy of the spatial decay pattern research.
Additional data collection was carried out from 20 December to 24 December 2024, across the four pedestrian streets, to verify the previously collected data. The expanded dataset exhibited close alignment with the initial measurements. This systematic enhancement of the sampling procedures effectively addressed the temporal constraints inherent in longitudinal observations, which ensured the establishment of a robust analytical framework characterized by methodological rigor and temporal representativeness.

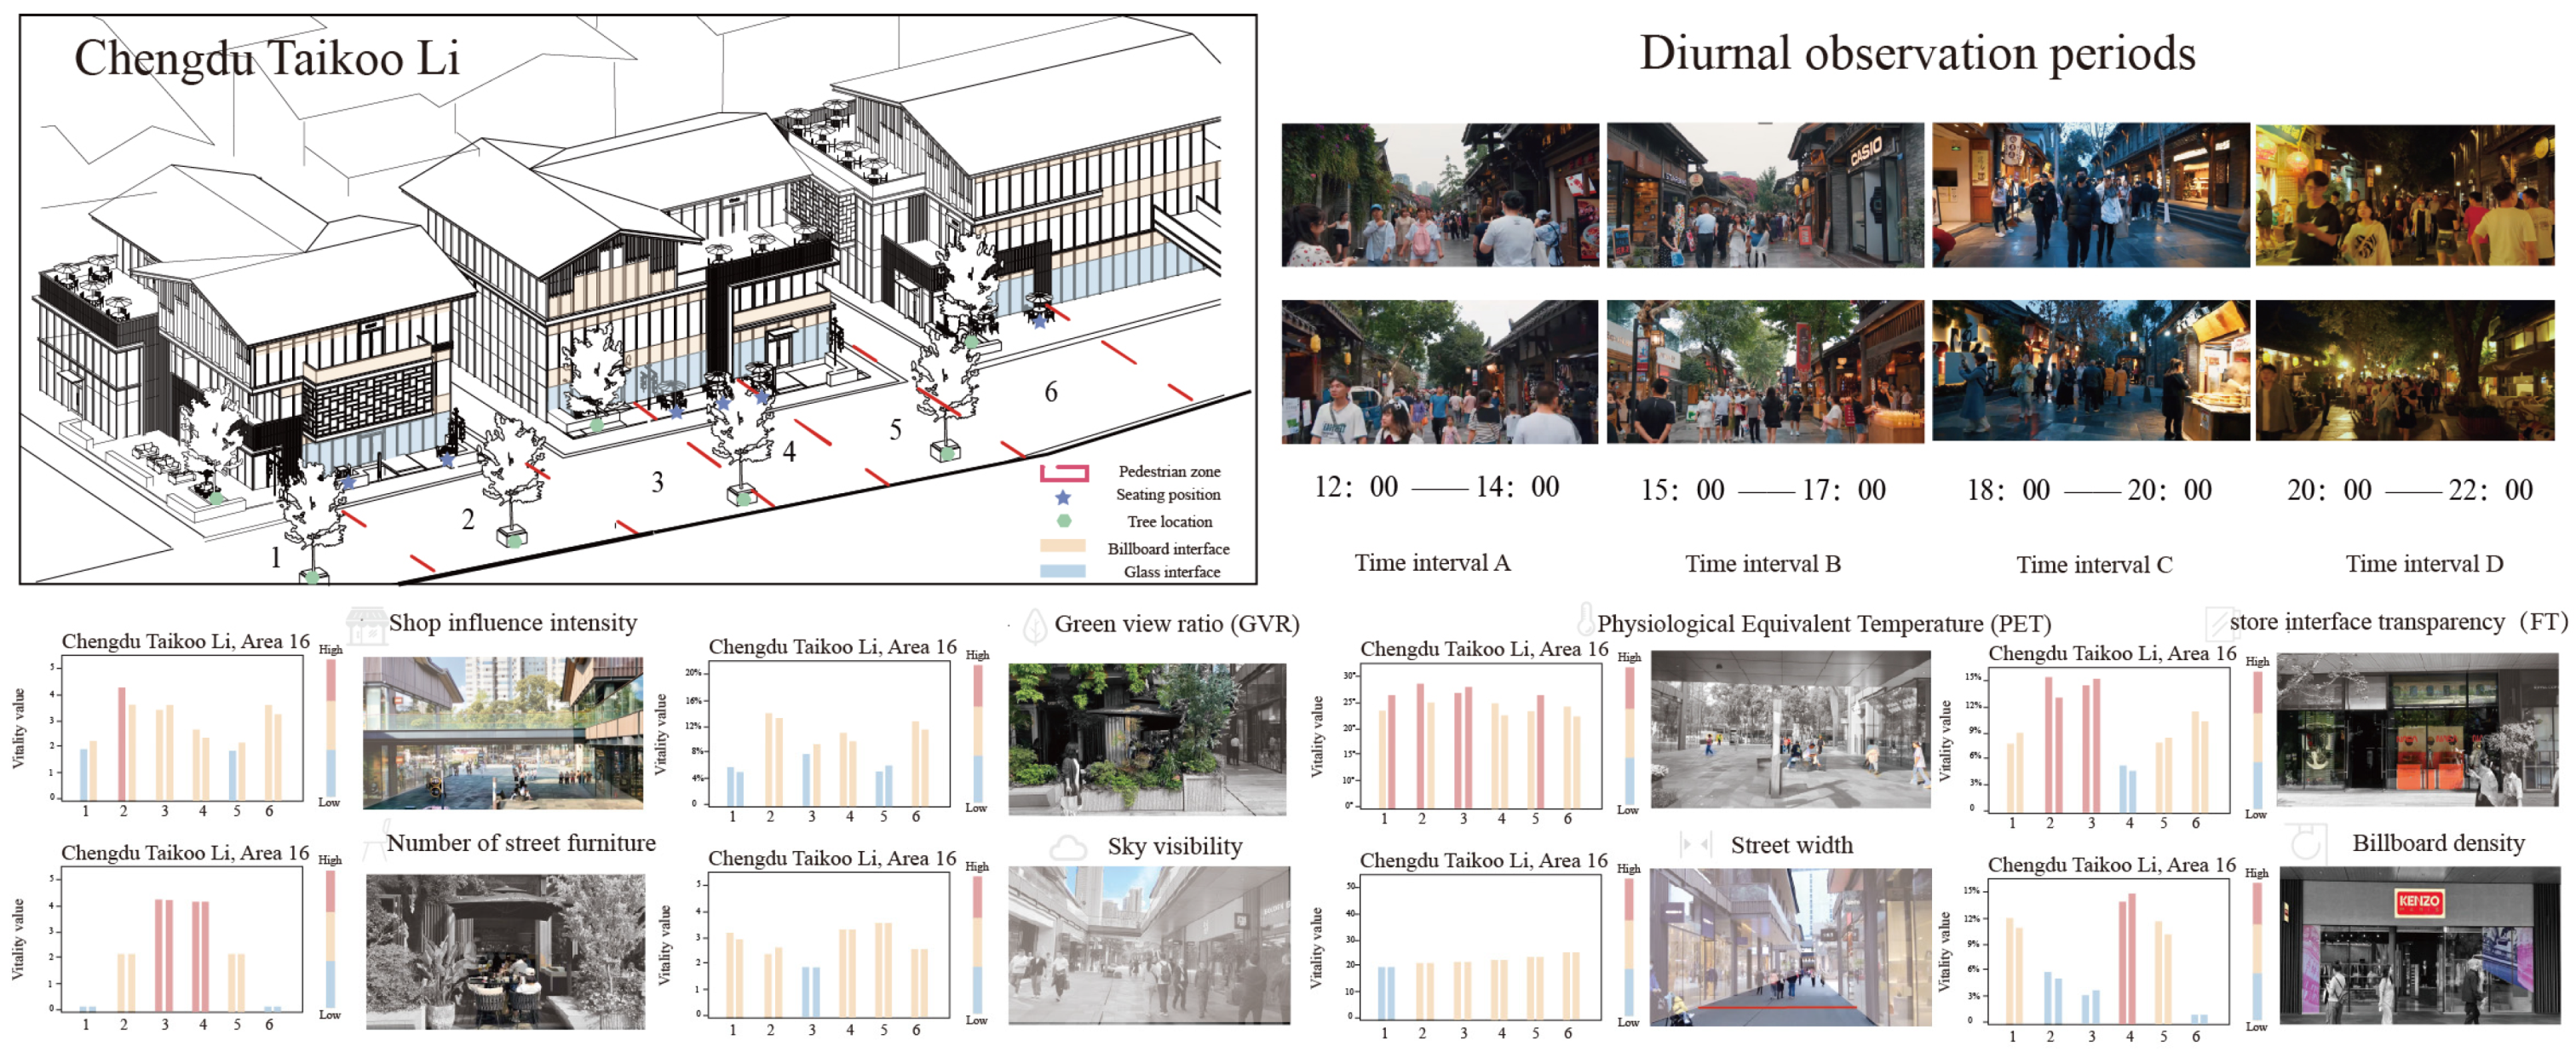
2.3.1. Independent Variables

Accurate interpretation of urban built environments requires a multimodal approach. This study combines static image analysis with temporal object tracking. Initially, panoramic street images (2048 × 1024 pixels) were split into four orthogonal views using PTgui Pro. Pre-trained weights from the Beijing and Chengdu Baidu Street View dataset were employed, and SFANet was utilized for real-time semantic segmentation of the street views. This model incorporates adaptive receptive field fusion and boundary-aware loss functions to address the challenges of recognizing scale-variant objects in real-time semantic segmentation, achieving an mIoU of 83.6% in the cross-city validation [71,72,73]. Additionally, temporal–spatial validation was conducted through video analysis based on YOLOv5 (25 fps, 1920 × 1080 resolution). This dual-modal approach (as shown in Figure 4) enables cross-validation between geographical spatial features and motion dynamics [74], and it demonstrates a 12.4% improvement in the environmental perception accuracy over unimodal methods through the integration of spatiotemporal graph convolution networks.
  • Shop width (SW)
The width of storefronts along commercial pedestrian streets is closely related to the customer carrying efficiency [75]. In this study, the storefront width is defined as a standardized metric, calculated by dividing the total length of all the storefronts along one side of the street by the continuous length of the commercial interface on that side. This study primarily focuses on examining the spatial compatibility between individual storefront units and the street space. The calculation formulas for the relevant independent variables in each research unit are shown in Table 1 and Figure 5.
2.
Street width
The cross-section of pedestrian commercial streets is closely related to their pedestrian capacity [76,77,78]. A wider street allows for more pedestrians, facilitates social interactions, and reduces congestion and pedestrian conflicts. In this study, the street width is calculated as the average width, determined by dividing the total street area by the length of the line connecting the midpoints of the street entrances and exits.
3.
Green view ratio (GVR)
The green view ratio (GVR) of a street contributes to the rhythm of the street’s facade and helps to create shaded spaces. When the GVR increases, the revenue of cafes along the street increases by 22% [79,80]. This study quantifies the proportion of green plants visible to pedestrians using street view image segmentation algorithms, as shown in Figure 4.
4.
Sky visibility
High sky visibility can enhance the openness of a street, providing good ventilation and natural light. However, excessive visibility can lead to overheating during the summer and reduce the time pedestrians spend in the area [81]. This experiment uses street view image segmentation algorithms to quantify the proportion of sky area in pedestrians’ visual field.
5.
Number of items of street furniture
Adequate street furniture provides resting space for pedestrians and indirectly promotes temporary activities [14]. In recent years, artistic street furniture has attracted pedestrian flow and become a popular feature for social media check-ins, enhancing the commercial street’s popularity. This study uses street view image recognition algorithms to quantify the number of street furniture items visible in pedestrians’ visual field.
6.
Physiological equivalent temperature (PET)
Pedestrian exposure to heat affects outdoor activities and physical health [21]. Based on the human thermal balance model, this study considers factors such as the air temperature, humidity, and wind speed. Using ENVI-met 5.3.1, numerical simulations of typical summer days are conducted to calculate the thermal comfort index (PET).
7.
Store interface transparency (FT)
Store transparency enhances the accessibility of the store’s interior from the outside, enriches the facade effect of the street, sparks pedestrians’ interest in exploring, and increases the store entry rate [82,83]. This study uses street view image segmentation algorithms to quantify the proportion of transparent storefront interface areas in pedestrians’ visual field.
8.
Billboard density
Billboards are key mediums for delivering promotional information and guiding consumer decisions, effectively attracting pedestrian attention. They can also help pedestrians locate destinations or access necessary services [35]. This experiment uses street view image segmentation algorithms to quantify the proportion of billboard area in pedestrians’ visual field.

2.3.2. Dependent Variable

Wi-Fi probe technology has been widely applied in pedestrian trajectory tracking and crowd behavior analysis, particularly in commercial and urban mobility applications [84,85,86,87]. By capturing unique identifiers (such as MAC addresses) along with the metadata, signal strength (RSSI), and timestamps, this technology enables spatial distribution modeling of the signal strength, analysis of the dwell time and movement trajectories, and simultaneous detection of the same device across multiple sensors. This approach enhances spatial positioning accuracy and minimizes measurement errors.
This study’s Wi-Fi-based pedestrian trajectory detection is illustrated in Figure 6.
This study deployed monitoring points at the cross-sections of each research unit and simultaneously conducted 5 min Wi-Fi detection data collection and video recording during each time period. A signal strength threshold was set to filter out weaker indoor signals, ensuring the coverage of pedestrian trajectory points in open outdoor areas. Fixed cameras, positioned with a vertical downward angle of ≥45°, were used for the bidirectional video recording. Subsequently, 1500 continuous frames (at a frame rate of 24 fps) from periods with stable lighting and no sudden obstructions were selected. These frames were annotated using the YOLOv5 model and manually verified. A transformation matrix was established based on the grid lines of the pavement tiles to convert the video coordinates into a 2D plane coordinate system. The video and probe timestamps were synchronized using the NTP protocol (with an error < 100 ms), covering the study area. Transient connections with a stay time of <10 s were discarded to eliminate the impact of brief transit on pedestrian vitality. Finally, the pedestrian trajectories were obtained through DBSCAN clustering (eps = 1.5 m, min_samples = 3).
This study adopts the small public space vitality assessment method proposed by Tong Niu [15]. This method integrates five quantifiable indicators—pedestrian count, duration of stay, movement speed, trajectory diversity, and trajectory complexity—to calculate street vitality. The calculation formula is as follows (1):
S p a t i a l   V i t a l i t y = 0.582 N u m + 0.254 D u r + 0.307 T D + 0.159 T C
(Num) represents the number of pedestrians, (Dur) denotes the duration of movement, (TD) signifies the trajectory diversity, and (TC) reflects the trajectory complexity.
To ensure data accuracy, Wi-Fi probe data undergoes privacy processing before being analyzed. Pedestrian movement duration is then classified, and the average movement speed is estimated based on the storefront width. Subsequently, the trajectory data is extracted, and coordinate transformations are applied to calculate the trajectory diversity and complexity. Finally, the video recordings are processed using classification and object detection techniques to determine the pedestrian count within the study area.

2.4. Interpretable Machine Learning Approach

This study employs six classical machine learning regression models, including linear regression (MLR), random forest (RF), extreme gradient boosting (XGBoost), light gradient boosting machine (LightGBM), support vector machine (SVM), and k-nearest neighbors (KNNs). Among them, multiple linear regression (MLR) serves as the baseline model to establish a fundamental prediction reference for comparison with more complex algorithms. The core purpose of applying these machine learning methods is to quantitatively explore the nonlinear and linear relationships between the urban built environment indicators (as independent variables) and the target dependent variable (as street vitality). This study aims to reveal how spatial elements impact the core research object through predictive modeling. The algorithm integration is implemented using Python 3.7.
To ensure the modeling reliability, a dual-modal analysis approach is applied during data preprocessing: (1) the Kolmogorov–Smirnov test is used to identify the variable distribution characteristics, with logarithmic transformation applied to skewed data; (2) z-score normalization is adopted to eliminate dimensional differences; and (3) Pearson correlation coefficient analysis (|r| > 0.7) is used to filter features and remove redundant variables. Regarding the dataset, assuming there are N samples in total (N needs to be determined based on the actual data collection, e.g., if 100 street sections were surveyed, N = 100), the dataset is split into 80% for model training and 20% for validation.
Hyperparameter tuning is conducted using a grid search with 10-fold cross-validation. The optimal XGBoost model parameters are set as follows: maximum tree depth = 5, learning rate = 0.2, and number of iterations = 300. Model performance is evaluated using the R2 (representing the proportion of variance in the dependent variable explained by the model) and mean squared error (MSE, measuring the average squared difference between predicted and actual values). Among these methods, MLR is simple and interpretable for linear relationships; RF and XGBoost/LightGBM are tree-based ensemble methods good at handling nonlinear data and avoiding overfitting through ensemble learning; SVM finds optimal hyperplanes for classification/regression in high-dimensional space; and KNN relies on local similarity for prediction. They are selected to comprehensively capture both linear and nonlinear patterns in the data and compare the performance across algorithmic paradigms (parametric like MLR vs. non-parametric like RF, ensemble vs. single-model), as shown in Figure 7. With XGBoost achieving the best predictive accuracy (MSE = 1.24, R2 > 0.85), it suggests tree-based ensemble methods are more adept at fitting the complex relationships in this study’s dataset compared to traditional linear models (MLR) and other single models (SVM, KNN) in this context.
To address the “black box” nature of machine learning models, this study incorporates the Shapley additive explanations (SHAPs) framework (grounded in game theory, where each feature’s contribution to predictions is analogous to a player’s contribution in a cooperative game) [55,71,88]. This study implements a dual interpretability framework combining cooperative game theory and conditional expectation visualization. Shapley additive explanations (SHAPs) systematically attribute predictive contributions to individual covariates through cooperative game theory principles, enabling quantifiable interpretation of machine learning outputs. Furthermore, the partial dependence plots (PDPs) are enhanced with three-dimensional surface mapping to characterize the nonlinear covariate effects—by iteratively modifying target variables while holding auxiliary predictors constant at empirical distribution percentiles, these visual analytics reveal marginal effect heterogeneity across built environment parameters. To enhance the methodological robustness, bivariate interaction analysis is conducted between the primary drivers identified through the SHAP value rankings (top 15% contributors) and the complementary urban morphology indicators, employing tensor decomposition techniques to disentangle the synergistic effects in high-dimensional feature spaces.
Regarding excluded algorithms like generalized additive models (GAMs/GAMMs) and Bayesian additive regression tree (BART): GAMs are flexible for modeling nonlinear relationships but can be computationally expensive and complex to tune with large datasets; and BART, while powerful for Bayesian inference and handling uncertainty, has a steeper learning curve and higher computational demands. Given this study’s focus on balancing interpretability, computational efficiency, and comparative analysis of mainstream algorithms, and considering the dataset size and available computational resources, these algorithms are prioritized for exclusion to maintain the methodological feasibility and clarity in terms of result interpretation.

3. Results

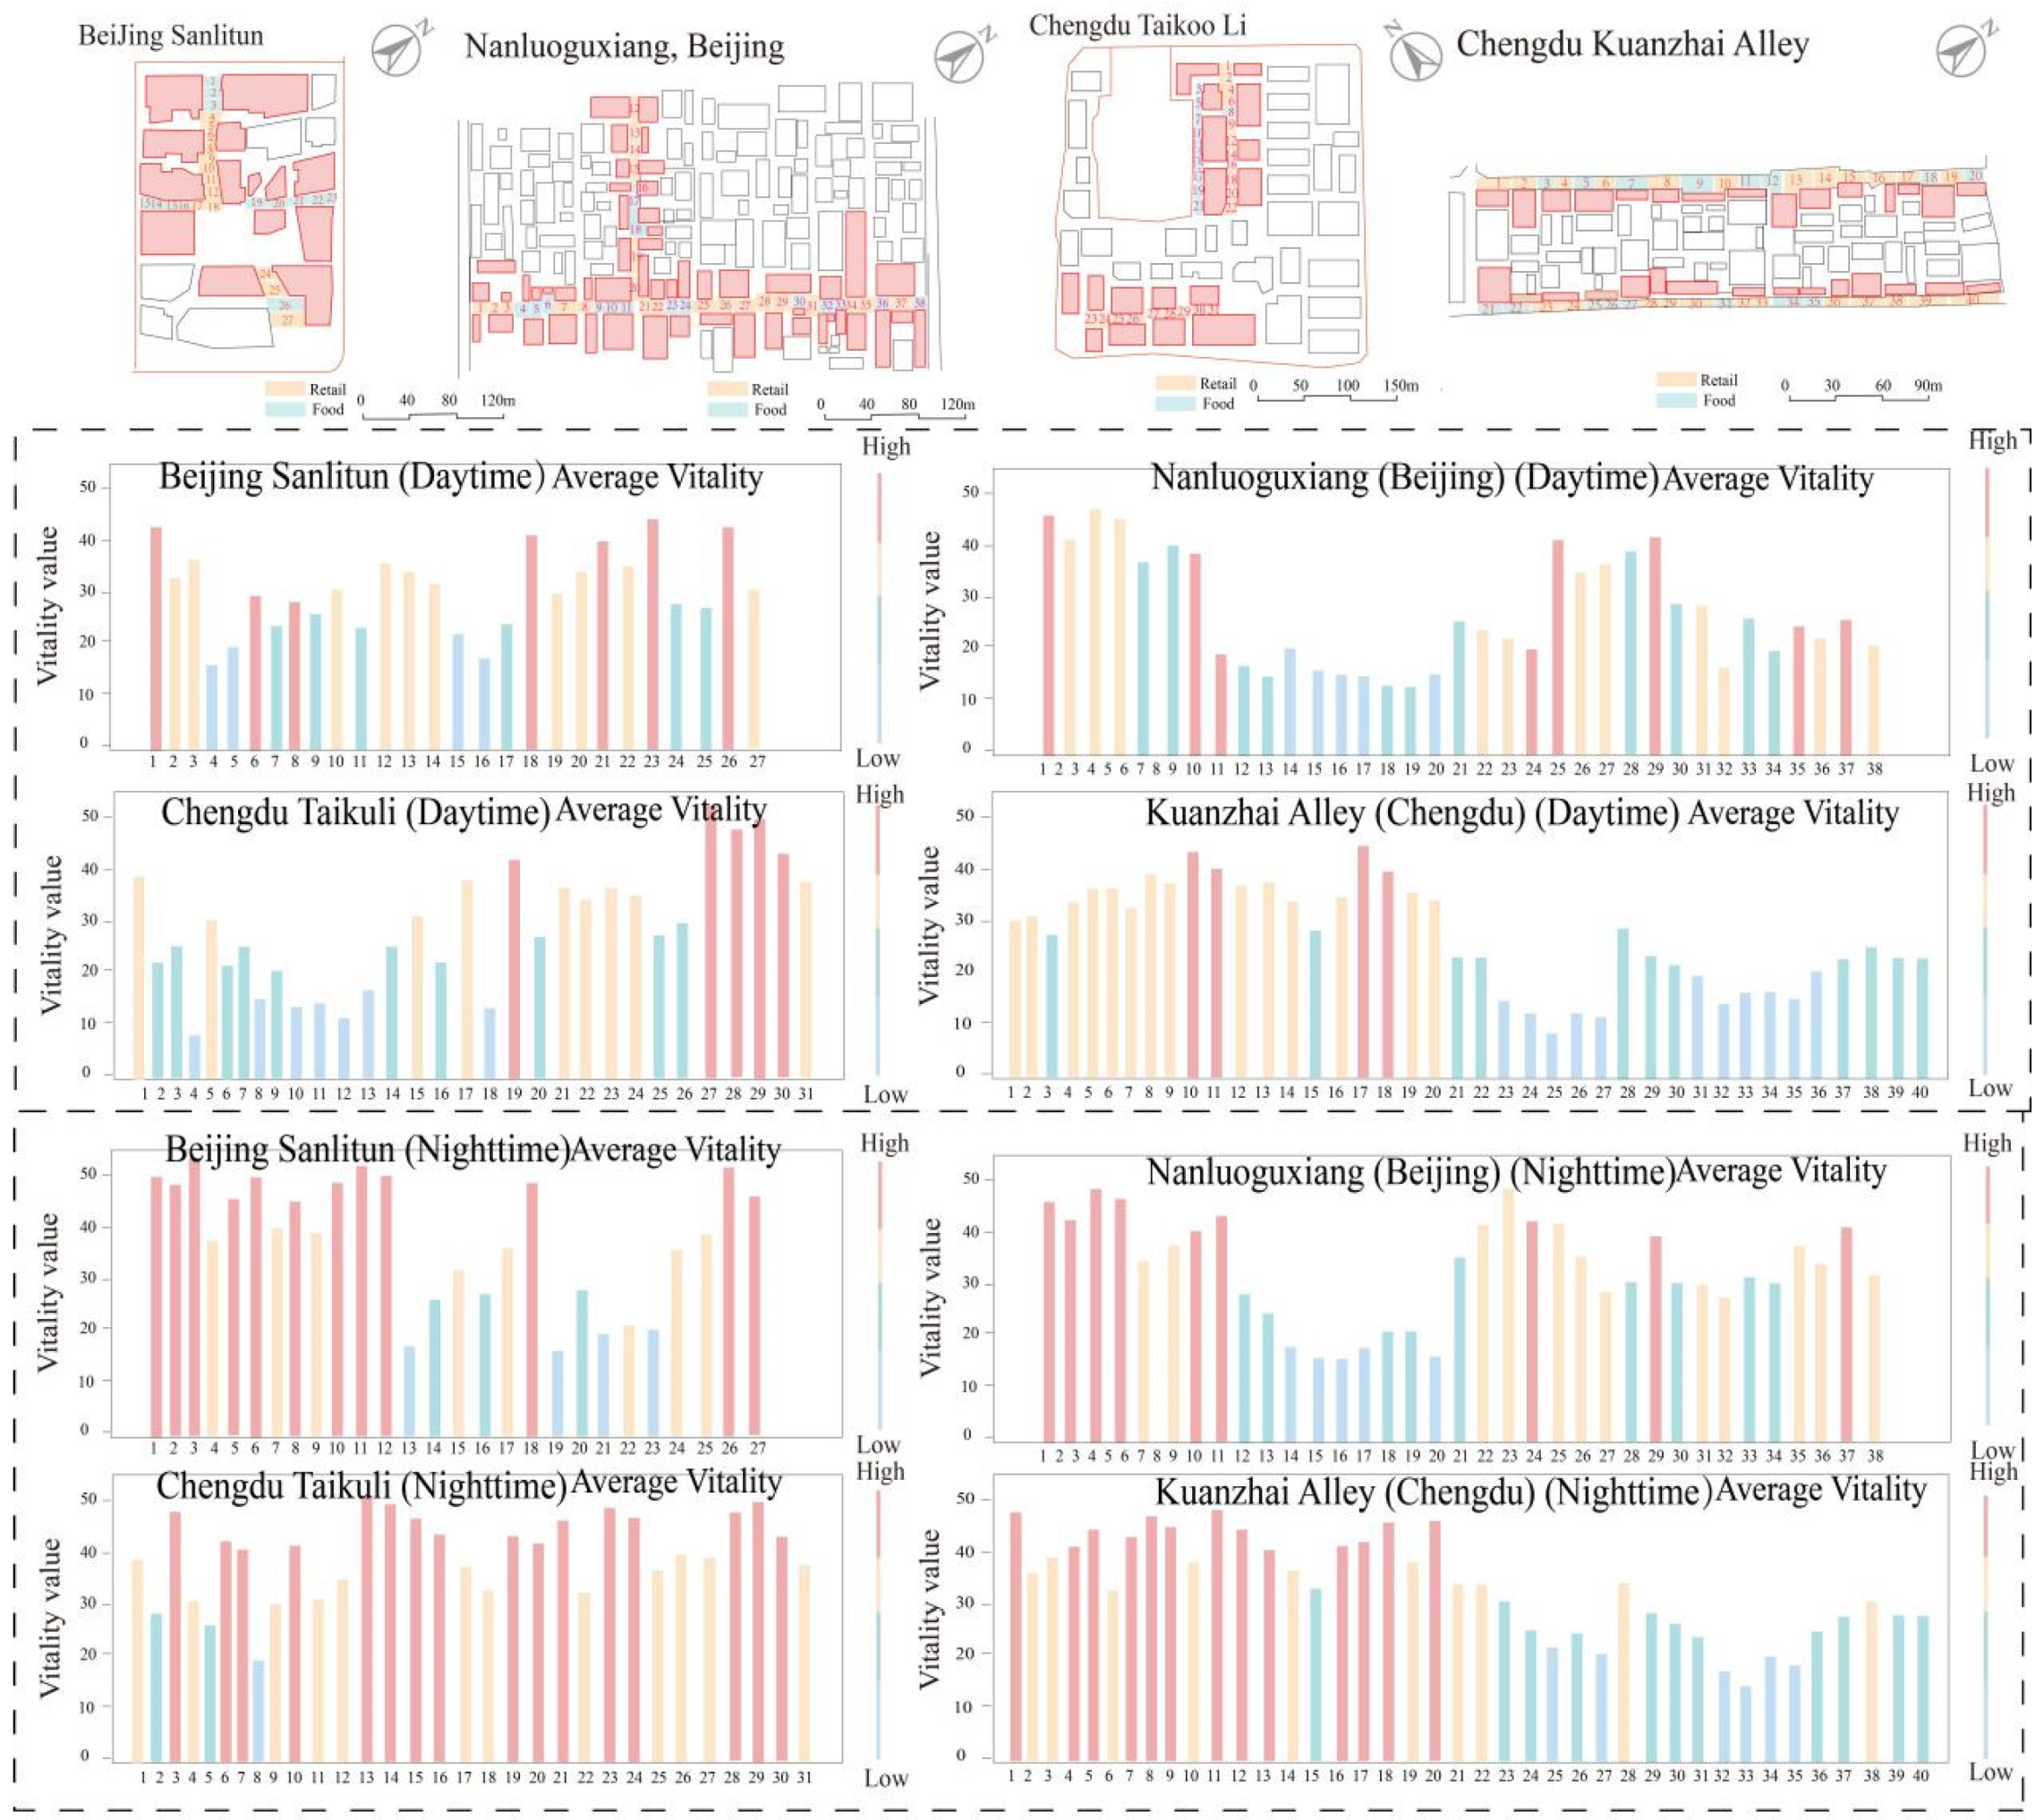
3.1. Spatiotemporal Dynamics of Pedestrian Commercial Street Vitality

As shown in Figure 8, the vitality values of the different commercial streets exhibit variation across the day–night cycle. The vitality of the commercial streets gradually increases throughout the day, with the nighttime vitality surpassing daytime levels, showing an average increase of 0.25 times. During the day, the vitality fluctuation across various areas of the commercial streets remains relatively stable, indicating a steady flow of pedestrians, with retail zones exhibiting higher vitality values. At night, the vitality fluctuations are more pronounced, especially in hotspot areas, where the vitality peaks, and the vitality in dining zones is higher.
Overall, the street vitality in Beijing is higher than in Chengdu, reflecting a more intense commercial atmosphere in the capital. However, Chengdu exhibits greater vitality persistence in the commercial street dining establishments, particularly during the daytime, where its vitality surpasses that of Beijing. This contrast highlights the distinct vitality characteristics of the two cities. Additionally, Sanlitun in Beijing and Taikoo Li in Chengdu demonstrate significantly higher overall vitality compared to Nanluoguxiang and Kuanzhai Alley, indicating that modern commercial streets more effectively stimulate commercial activity and attract larger crowds.

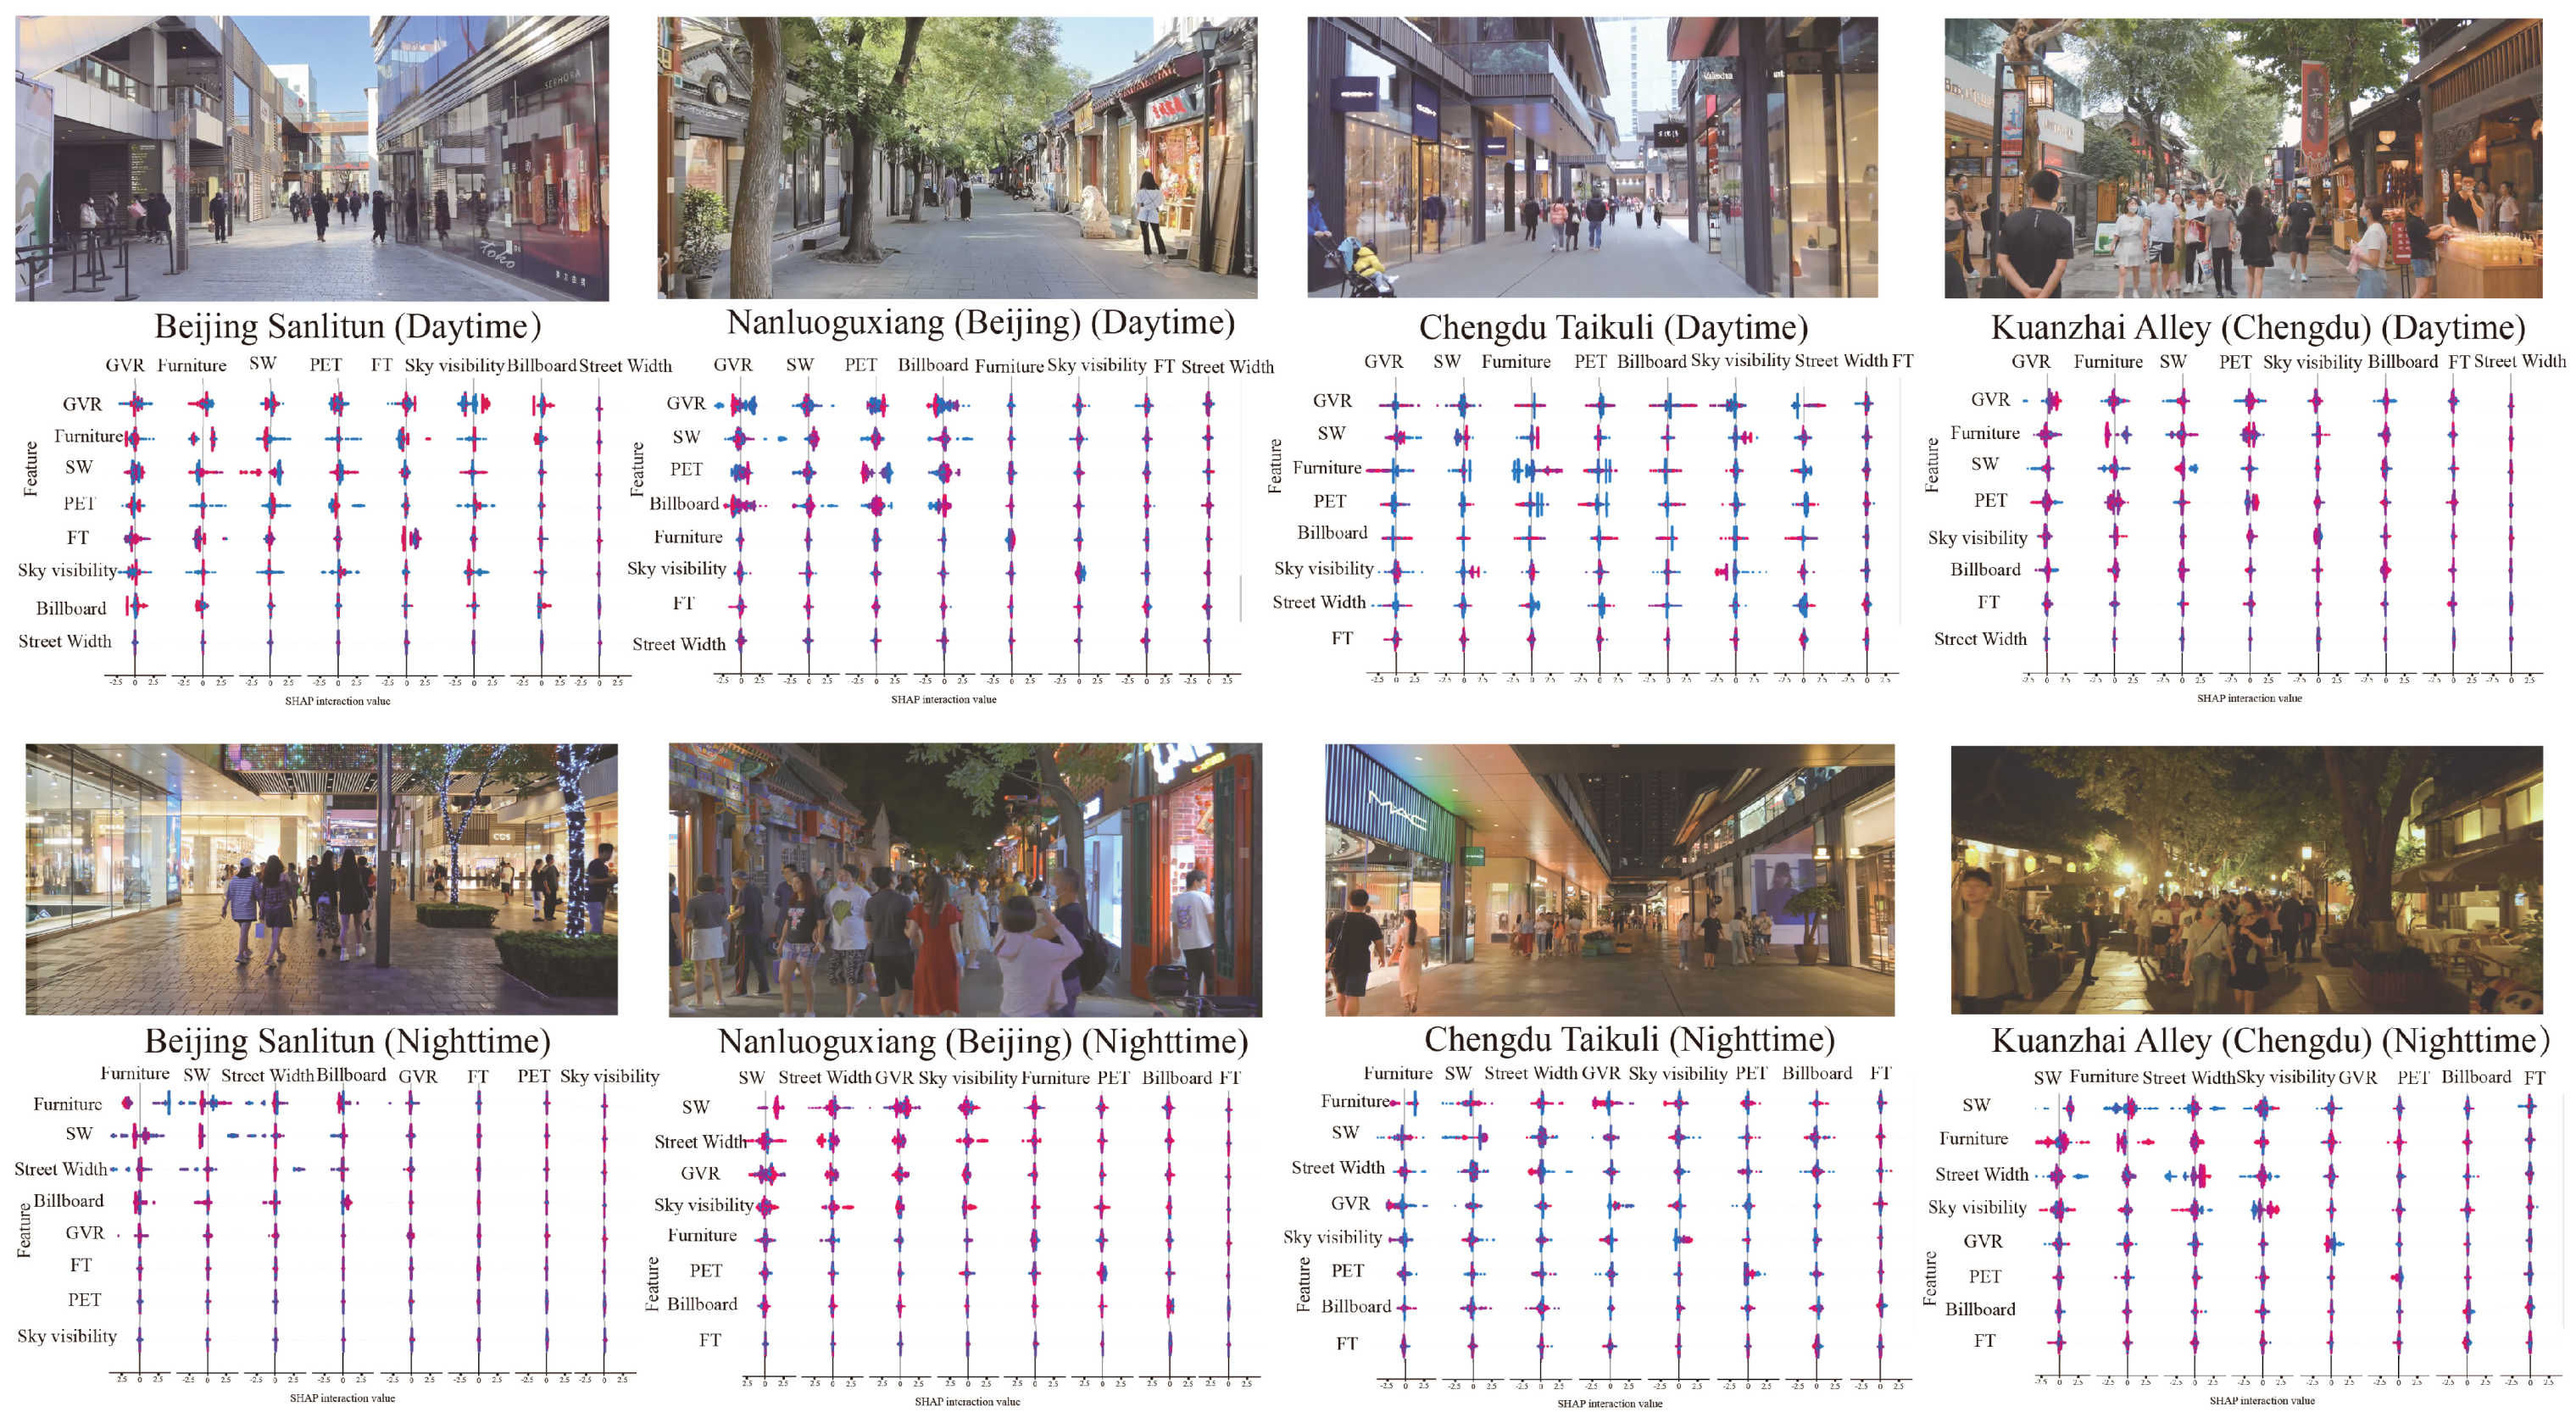
3.2. Vitality Impact Magnitude of Individual Built Environment Factors

This study employs the SHAP (Shapley Additive Explanation) values to rank the global importance of the built environment factors, as shown in Figure 9. Across the four study areas, all eight built environment factors influence street vitality. Figure 10 is the SHAP summary diagram of the built environment factors for pedestrian commercial streets. The x-axis of the SHAP summary plot represents the SHAP values, which indicate the importance ranking of each feature in the XGBoost model, while the y-axis shows the contribution of each factor to the vitality. Positive values indicate an enhancement of street vitality, whereas negative values suggest a reduction. The color gradient from blue (low values) to red (high values) represents the feature value distribution.
The results indicate that the shop width, street furniture, and green view ratio (GVR) exhibit strong positive effects on the street vitality. The store width enhances the vitality regardless of the diurnal variation, with an importance range of 0.14–0.32. Higher values for this factor (shown in red) are generally associated with higher vitality. During the daytime, the store width is more pronounced in Beijing’s Sanlitun and Chengdu’s Taikoo Li, whereas at night, the high store density areas in Beijing’s Nanluoguxiang and Chengdu’s Taikoo Li continue to show strong positive effects, underscoring the crucial role of the store influence on the street vitality.
Street furniture ranks as the second most important factor. In daytime analyses of Beijing’s Sanlitun and Chengdu’s Taikoo Li, areas with more street furniture consistently exhibit higher SHAP values, indicating their supportive role in vitality. At night, the impact of street furniture becomes even more pronounced, with high feature value areas showing strong positive effects (importance range: 0.10–0.31).
The GVR has a generally strong influence on the vitality during the daytime, particularly in Chengdu’s Kuanzhai Alley and Beijing’s Nanluoguxiang, where the high GVR areas correspond to higher SHAP values, signifying its positive role. However, its influence weakens at night (importance range: 0.04–0.28). Regionally, the GVR has a stronger effect on Beijing’s streets compared to Chengdu’s, where its influence on street vitality is reduced by 40%.
The thermal comfort (PET) and sky openness exert moderate effects on the vitality. Thermal comfort has a greater impact during the day, with higher PET values (indicating high temperatures) negatively affecting the vitality, whereas at night, when the temperatures are more favorable, the street vitality is not constrained by heat stress (importance range: 0.03–0.25). Beijing, prone to extreme heat, experiences stronger negative effects of thermal comfort on vitality during the day, which diminishes at night as conditions become more suitable. Conversely, Chengdu’s milder climate results in a lower overall impact of thermal comfort, with the vitality being less constrained by temperature fluctuations throughout the day.
The sky visibility generally enhances the street vitality, with an importance range of 0.04–0.16. During the day, greater sky visibility has a significant positive effect, as open spaces and unobstructed views enhance the attractiveness of streets. However, at night, areas with high sky visibility (marked in red) exhibit diminished vitality. In Chengdu, the impact of the sky visibility on the street vitality is relatively minor, especially at night, where the buildings and pedestrian density play a more decisive role in shaping the street dynamics rather than the natural landscapes.
The street width influences the street vitality predominantly at night, showing a clear temporal pattern, whereas its impact during the daytime is negligible. The advertising signage and store transparency have relatively minor effects on the street vitality. Billboards contribute to street attractiveness (importance range: 0.01–0.13). Notably, in Beijing’s Sanlitun during the day, areas with high billboard density often correspond to lower vitality (marked in blue), suggesting that in bustling commercial districts, excessive signage may obstruct views and reduce the sense of openness, thereby diminishing the street appeal.
Among all the factors, the store transparency has the least impact on the street vitality (importance range: 0.01–0.11). Its positive influence is primarily observed during the daytime when high-transparency storefronts attract more pedestrians, encouraging shopping and longer stays.

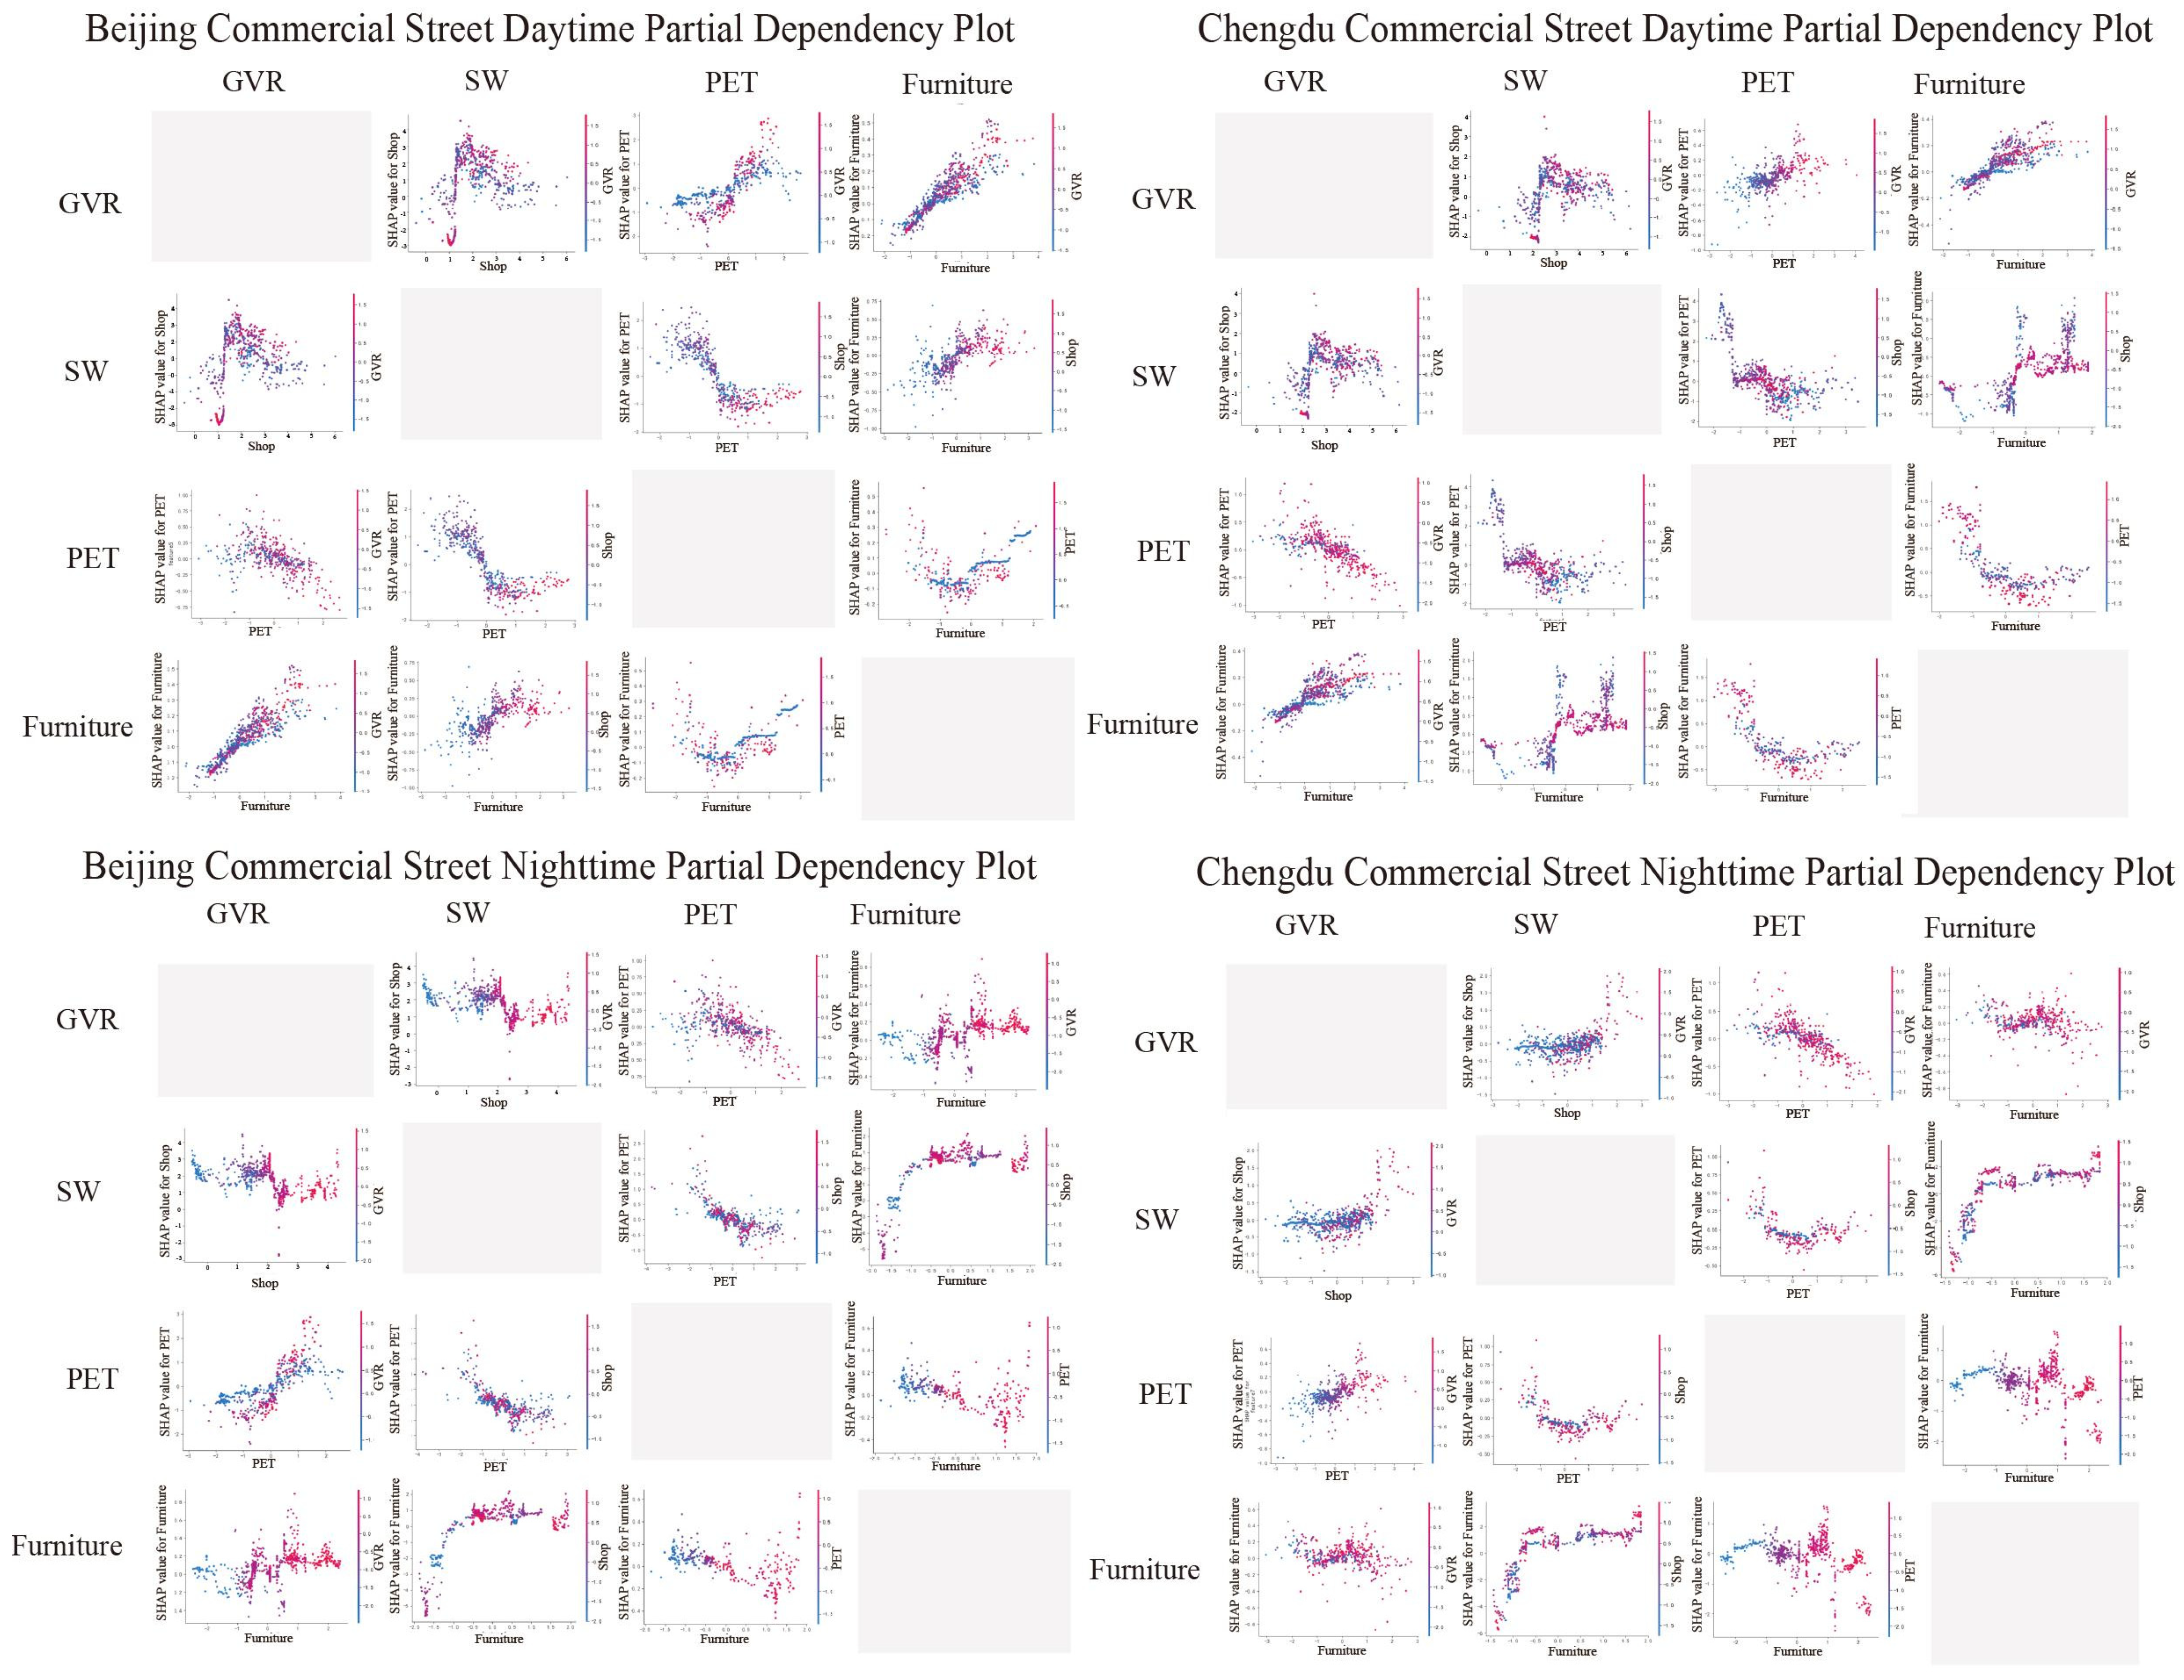
3.3. Synergistic Effects of Built Environment Factors on Street Vitality

To deeply understand the complexity of the impacts of multiple built environment factors on street vitality—stemming from synergistic or antagonistic interactions between various variables—and avoid the single-factor explanations of previous studies [28,64], this research leverages the foundation of nonlinear research [20,31]. Using XGBoost, we analyzed the interactions among these factors, as shown in Figure 11. The interactions between these factors vary under day–night conditions. However, by separately analyzing the importance of each factor, recurring patterns can be identified.
Specifically, the influence of commercial street shops exhibits a positive correlation with the number of items of street furniture during the day. Areas with a strong shop presence, combined with street furniture, jointly enhance the street vitality, suggesting that the combination of commercial and comfort facilities attracts more pedestrian flow. The influence of the shops and street width also shows a significant positive effect at night, working in synergy to promote street vitality. On the other hand, the negative correlation between the shops and the thermal comfort is more pronounced, with higher temperatures inhibiting street vitality.
Regarding street furniture, its quantity is strongly positively correlated with the greenery visibility during the day. High interaction zones (depicted in red) typically align with higher street vitality, indicating that a combination of greenery and furniture enhances the street’s attractiveness. At night, however, the furniture and street width work together to boost the street vitality, while the effect of the greenery visibility diminishes. The street width provides a sense of safety, and the street furniture offers spaces for pedestrians to linger, further promoting vitality. The sky openness predominantly affects the street vitality during the day, especially in environments with higher greenery visibility and better street furniture. At night, the combined influence of the billboards and street width, along with the interplay of commercial activities and street amenities, enhances the street vitality.
In summary, during the day, the shop width, the quantity of items of furniture, and the greenery visibility collaboratively enhance the street vitality, with the thermal comfort negatively impacting it. At night, the shop width, furniture quantity, street width, and billboard area work synergistically to promote street vitality, with the influence of the thermal comfort diminishing.
To enhance the interpretability of the model, partial dependence plots (PDPs) were utilized to analyze the nonlinear effects of the feature variables. Based on the ranking of the important built environment factors and their interaction relationships, this study focused on the four highest-ranked built environment factors in commercial streets in both Beijing and Chengdu during the day and night: shop width, furniture quantity, thermal comfort index, and greenery visibility. Figure 12 illustrates this relationship, with the x-axis representing the degree of influence of built environment factors, the y-axis indicating the SHAP values reflecting their impact on street vitality, and the color scale denoting the influence of another built environment factor.
Regarding the shop width, when the width is relatively narrow, i.e., less than 8 m (value < 2), the SHAP value increases sharply, indicating that the increase in the number of shops significantly contributes to the street vitality. At a shop frontage width of 8 m (value = 2), the SHAP value reaches its peak, suggesting that the optimal shop frontage maximizes the street vitality. However, when the shop frontage exceeds 14 m (value > 3.5), the SHAP value slightly decreases and stabilizes, indicating that excessively wide shop frontages may not further significantly enhance the street vitality, potentially exhibiting diminishing marginal effects. During the day, there is a positive correlation between the shop frontage width and the greenery visibility, indicating that commercial areas with higher greenery contribute more to street vitality. However, at night, this correlation weakens, particularly in Chengdu, suggesting that the attractiveness of shops at night is more influenced by other factors, such as the street width and pedestrian flow, rather than the greenery visibility.
As for street furniture, areas with fewer furniture items (furniture quantity < 0) tend to have negative SHAP values, suggesting that a lack of street furniture may have a detrimental effect on street vitality, especially in areas with low greenery. On the other hand, when street furniture is more abundant (furniture quantity > 2), the SHAP values are predominantly positive, indicating that more furniture enhances street vitality. This positive effect is even more pronounced in areas with higher greenery. The correlation between the street furniture and the shop width is positive, with higher shop impact intensity areas also showing a higher utilization of street furniture. This correlation remains strong at night, indicating that active commercial areas continue to attract people who make use of street facilities.
For greenery visibility, the data shows that when the greenery visibility is low (i.e., <5%), the majority of points are concentrated in the low or even negative SHAP value range, indicating that low greenery levels do not significantly contribute to street vitality. However, when greenery visibility is high (i.e., >15%), the SHAP values increase substantially, with most points concentrated in the positive range, indicating that higher greenery visibility significantly promotes street vitality. Therefore, the effect of the greenery visibility on the street vitality shows a nonlinear enhancement, where the impact is minimal or even negative when the greenery visibility is low but becomes significantly positive once a threshold level of greenery is reached. The greenery visibility also exhibits a negative correlation with the thermal comfort during the day, meaning that higher greenery reduces the negative effects of heat on street vitality. At night, this negative correlation weakens, particularly in Beijing, suggesting that after temperatures drop, the role of greenery in moderating the thermal environment diminishes.
Regarding thermal comfort, in environments with lower PET (cooler conditions), it has a positive effect on the street vitality. However, as the PET approaches moderate levels, the SHAP values rapidly decline, indicating a reduction in the positive contribution to the street vitality. In environments with higher PET (hotter conditions), the thermal comfort exerts a significant suppressive effect on the street vitality. The thermal comfort is generally negatively correlated with the shop width. During the day, in low PET conditions (cool weather), areas with a high shop width (red) correspond to higher SHAP values, indicating that the shop activity works synergistically with the thermal comfort to enhance street vitality. Conversely, in high PET conditions (hot weather), even in areas with a high shop width (red), the SHAP values remain negative, suggesting that in high-temperature environments, the positive effect of the shop intensity is constrained. At night, the influence of the thermal comfort is relatively reduced. In Beijing, the negative correlation weakens, but Chengdu still maintains a certain level of negative correlation, indicating that the higher nighttime temperatures in Chengdu continue to affect the street vitality.

4. Discussion

4.1. Diurnal and Nocturnal Effects of Built Environment Factors on Street Vitality

This study utilizes XGBoost to identify key factors affecting pedestrian street vitality and explores the interactions between built environment factors. By analyzing the nonlinear synergistic effects on street vitality across temporal (day and night) and spatial urban variations, this research provides a deeper understanding of the role of the city context and environmental factors. Thus, a comprehensive analysis of the relationship between the built environment and the street vitality is conducted, ultimately offering strategies to promote sustainable urban development.
From a temporal perspective, the concept of the nighttime economy, promoted by urban planners and governments, along with increasing human attention paid to nighttime vitality [43,89], urban population density, high summer air conditioning demands, and heat released from buildings at night [90], have resulted in nighttime warming. The study of built environment factors’ influence on street vitality across the day and night can expand our understanding of overall street vitality.
Based on the previous conclusions, during the day, the shop width and furniture quantity generally contribute to the higher street vitality, while the thermal comfort has a more significant influence on the vitality during the day. Excessive PET (high thermal environment) may suppress pedestrian activity. However, the relationship between the green visibility and the PET shows a negative correlation, meaning that areas with higher green coverage typically have lower temperatures, mitigating the negative effects of heat. Yet, the relationship between the shop width and the green visibility is complex and nonlinear; areas with higher greenery do not necessarily have higher commercial vitality. Excessive greenery (green visibility > 30%) may reduce the use of commercial spaces. Similarly, the number of items of street furniture, when within an optimal range, enhances the street vitality, though too much furniture can lead to overcrowding, reducing accessibility. The shop transparency during the day can enhance street visual appeal and interaction, thereby increasing the street vitality.
At night, due to the typical temperature drop and increased comfort, pedestrian activity is less restricted by thermal conditions. The street width becomes crucial, but excessively wide street widths may suppress street vitality. The shop width and furniture quantity remain key factors affecting the street vitality, and their contribution to vitality is more significant at night. The concentration of pedestrian activity at night tends to be higher in areas with a strong shop influence, which may be linked to increased dining, night markets, and leisure activities. The furniture quantity also plays a more significant role at night, likely due to the longer duration of pedestrian activity and the increased demand for resting facilities. In contrast, the contribution of street furniture may be partially offset by the high temperatures during the day. The green visual perception loses some of its impact on the street vitality at night, and the influence of the sky openness increases, likely due to the cooling effect of open skies at night. Additionally, the billboard intensity becomes a visual focal point, attracting more foot traffic.

4.2. Differences in the Impact of Built Environment Factors on Street Vitality Across Different Cities

From a spatial perspective, cities exhibit significant differences in their geographical location, climate conditions, historical culture, and developmental status [91,92], which lead to diverse characteristics. Research on the influence of built environment factors on street vitality from a cross-city perspective broadens our understanding of street vitality.
In Beijing, areas with a wider shop width exhibit higher vitality, though the relationship follows a nonlinear trend, where an excess of shops may lead to increased competition or over-commercialization, diminishing the overall experience. The influence of furniture is stronger during the day, but at night, its impact diminishes, though it still provides a comfortable space for social interaction and rest. Additionally, in areas such as Beijing’s Sanlitun and Nanluoguxiang, green visibility and thermal comfort significantly affect street vitality. High thermal comfort during the day reduces street vitality, and an excessively hot environment inhibits pedestrian movement. Overall, Beijing’s streets focus on environmental comfort and green spaces during the day, while at night, the shop appeal increases, and the interaction of billboards and street width plays a more crucial role in shaping street vitality.
In Chengdu, the street vitality remains strong at night, suggesting active nighttime consumption. Chengdu’s humid climate means that the PET has a smaller impact on vitality, although it still affects pedestrian comfort. Chengdu’s streets are more heavily landscaped, offering a comfortable walking environment. The combination of furniture and shops enhances vitality during both day and night, and the street furniture in Chengdu is particularly suited for long-duration stays, thus enhancing social functions. At night, shop transparency and street width have a more pronounced influence on vitality compared to Beijing, likely due to Chengdu’s richer nightlife. In general, Chengdu’s Taikoo Li and Kuanzhai Alley are less dependent on green visibility and thermal comfort, with greenery primarily mitigating high temperatures. Street vitality in Chengdu is more driven by shop influence and furniture facilities, with a stronger nighttime economy.

4.3. Limitations and Perspectives

The limitations of this study are constrained by technology and human resources. In terms of the data collection, the temporal coverage of meteorological data is limited. Future research should extend the temporal analysis to include all four seasons and spatially expand to pedestrian commercial streets in cities beyond temperate and subtropical monsoon climates. This may involve exploring streets in both developed and developing countries to propose site-specific design strategies and evaluate the impact of commercial street development on sustainable urban growth. In terms of the research methods, due to privacy restrictions, there are challenges in quantifying pedestrian behavior, requiring exploration of more reasonable data collection methods. The quantitative study of commercial factors in pedestrian commercial streets needs to establish evaluation models and widely applicable quantitative methods.
This study uses explainable machine learning techniques to explore the nonlinear relationship between built environment factors and street vitality, expanding the research scope by considering the diurnal variations of pedestrian commercial streets and the spatial variations between two different cities. Future research should further broaden the scope by incorporating additional built environment elements such as harmful gases, carbon emissions, and energy consumption. The relationship between vitality and energy consumption, as well as pedestrian perceptions, should also be explored. Additionally, future studies should consider pedestrians’ preferences for street facades, colors, maintenance structures, and vegetation, while taking into account the specific needs of different age groups to better meet the diverse experiences of commercial streets.

5. Conclusions

The progress of urbanization has fueled commercial prosperity, and pedestrian commercial streets, as central urban public spaces, have become a focal point for research on vitality enhancement. Improving street vitality is key to enhancing urban competitiveness and promoting the flourishing of experience-based economies. However, high-density urban development also leads to ecological sustainability challenges, particularly in the context of extreme heat and its impacts on urban development. This study explores the interactions between built environment factors, including thermal comfort, under varying climatic conditions and urban development stages, and their effects on pedestrian commercial street vitality. The key findings are as follows.
Shop width and furniture quantity: Regardless of the time (day or night) or city variations, the shop width and the number of items of furniture are the most effective factors in enhancing street vitality. The vitality peaks when the shop width is between 8 and 14 m, and these factors show a synergistic effect, meaning areas with wider shop frontages also tend to have higher street furniture usage.
Green visibility: The influence of green visibility on street vitality is stronger during the day compared to at night. Green visibility shows a nonlinear enhancement effect, where its positive impact increases significantly once it exceeds 15%. However, areas with higher greenery do not necessarily exhibit higher commercial vitality, and excessive greenery (green visibility > 30%) may reduce commercial space usage. In high-greenery areas, the street furniture has a more pronounced positive impact, and green plants help mitigate the inhibitory effects of extreme heat on street vitality. This is particularly evident in cities like Beijing, though at night the effect diminishes.
Day and night influences: During the day, street vitality is most influenced by factors like the shop width, thermal environment, and greenery. At night, vitality is primarily affected by the shop width, furniture quantity, street width and signage. The thermal environment and street width are the key factors that change between day and night, and the interactions between built environment factors vary with the diurnal cycle. Optimizing street vitality requires considering these dynamic factors and adopting targeted design strategies for different times of day.
City-specific influences: In Beijing, street vitality is more significantly influenced by the street width, furniture, and green visibility, with nighttime commercial activity depending on the combination of the street width and shop transparency. During the day, optimizing the greenery and furniture helps improve comfort. In Chengdu, the street vitality at night is more influenced by the combination of shop transparency and street width. This suggests that in optimizing the street design, the daytime pedestrian street vitality should focus more on spatial comfort influenced by commercial storefronts, street furniture, and thermal comfort. At night, however, greater attention should be paid to the synergistic interaction between street width and shop transparency.
This study, through analyzing the nonlinear driving forces behind street vitality in two cities, extends the research perspectives for sustainable urban design and urban renewal. It provides design recommendations that promote street vitality through scientific urban planning, emphasizing the importance of considering climatic impacts. It encourages context-specific design approaches to avoid overdevelopment and blind construction. The insights from this research offer valuable, data-driven guidance for planning departments and could help develop a “climate-vitality” response design database, supporting dynamic and precise street updates, and ultimately, providing sustainable development guidelines for urban streets. This will foster ongoing understanding of the built environment’s impact on human life and encourage the harmonious development of human economic progress alongside ecological and climatic stability.

Author Contributions

Conceptualization, J.Z. (Jinjiang Zhang) and H.L. (Haitao Lian); methodology, J.Z. (Jinjiang Zhang) and X.L.; software, X.L.; validation, J.Z. (Jinjiang Zhang); for-mal analysis, X.L.; investigation, H.L. (Haozhe Li); resources, J.Z. (Junhan Zhang); data curation, H.L. (Haozhe Li); writing—original draft preparation, X.L.; writing—review and editing, X.L.; visualization, X.L.; supervision, X.L., H.L. (Haitao Lian) and J.Z. (Junhan Zhang); project administration, J.Z. (Jinjiang Zhang); funding acquisition, H.L. (Haitao Lian). All authors have read and agreed to the published version of the manuscript.

Funding

This work was supported by the Social Science Foundation of Hebei Province, China (Grant No. HB19YS039).

Data Availability Statement

Data will be made available on request.

Acknowledgments

We thank the reviewers for the positive and constructive comments regarding our paper. We would also like to thank Haonan Yu, Wenyu Zhou, Ranran Hu, Zeyu Ma and Zhenghui Han for their assistance with the GPS data collection.

Conflicts of Interest

The authors declare no conflict of interest.

References

  1. Ghazi, N.M.; Abaas, Z.R. Toward liveable commercial streets: A case study of Al-Karada inner street in Baghdad. Heliyon 2019, 5, e01862. [Google Scholar] [CrossRef] [PubMed]
  2. United Nations Human Settlements Programme (UN-Habitat). World Cities Report 2024; United Nations Human Settlements Programme: Nairobi, Kenya, 2024. [Google Scholar]
  3. Ji, Y.; Wang, Z.; Zhu, D. Exploring the impact of urban amenities on business circle vitality using multi-source big data. Land 2024, 13, 1616. [Google Scholar] [CrossRef]
  4. Xing, H.; Meng, Y. Revealing deep semantic commercial patterns: Insights from urban landscape depiction. Comput. Environ. Urban Syst. 2020, 79, 101404. [Google Scholar] [CrossRef]
  5. Li, X.; Li, Y.; Jia, T.; Zhou, L.; Hijazi, I.H. The six dimensions of built environment on urban vitality: Fusion evidence from multi-source data. Cities 2022, 121, 103482. [Google Scholar] [CrossRef]
  6. Wagner, P.; Schäfer, K. Influence of mixing layer height on air pollutant concentrations in an urban street canyon. Urban Clim. 2017, 22, 64–79. [Google Scholar] [CrossRef]
  7. He, B.J.; Ding, L.; Prasad, D. Enhancing urban ventilation performance through the development of precinct ventilation zones: A case study based on the Greater Sydney, Australia. Sustain. Cities Soc. 2019, 47, 101472. [Google Scholar] [CrossRef]
  8. Gu, X.; Wu, Z.; Liu, X.; Qiao, R.; Jiang, Q. Exploring the nonlinear interplay between urban morphology and nighttime thermal environment. Sustain. Cities Soc. 2024, 101, 105176. [Google Scholar] [CrossRef]
  9. Liu, Z.; Liu, C. The association between urban density and multiple health risks based on interpretable machine learning: A study of American urban communities. Cities 2024, 153, 105170. [Google Scholar] [CrossRef]
  10. He, J.; Shi, Y.; Xu, L.; Lu, Z.; Feng, M.; Tang, J.; Guo, X. Exploring the scale effect of urban thermal environment through XGBoost model. Sustain. Cities Soc. 2024, 114, 105763. [Google Scholar] [CrossRef]
  11. Weilnhammer, V.; Schmid, J.; Mittermeier, I.; Schreiber, F.; Jiang, L.; Pastuhovic, V.; Heinze, S. Extreme weather events in Europe and their health consequences–A systematic review. Int. J. Hyg. Environ. Health 2021, 233, 113688. [Google Scholar] [CrossRef]
  12. Han, Y.; Qin, C.; Xiao, L.; Ye, Y. The nonlinear relationships between built environment features and urban street vitality: A data-driven exploration. Environ. Plan. B Urban Anal. City Sci. 2024, 51, 195–215. [Google Scholar] [CrossRef]
  13. Loo, B.P.; Fan, Z. Social interaction in public space: Spatial edges, moveable furniture, and visual landmarks. Environ. Plan. B Urban Anal. City Sci. 2023, 50, 2510–2526. [Google Scholar] [CrossRef]
  14. Gehl, J. Life Between Buildings; Island Press: Washington, DC, USA, 2011. [Google Scholar]
  15. Niu, T.; Qing, L.; Han, L.; Long, Y.; Hou, J.; Li, L.; Teng, Q. Small public space vitality analysis and evaluation based on human trajectory modeling using video data. Build. Environ. 2022, 225, 109563. [Google Scholar] [CrossRef]
  16. Ren, Z.; Fu, Y.; Dong, Y.; Zhang, P.; He, X. Rapid urbanization and climate change significantly contribute to worsening urban human thermal comfort: A national 183-city, 26-year study in China. Urban Clim. 2022, 43, 101154. [Google Scholar] [CrossRef]
  17. Pu, R. Assessing scaling effect in downscaling land surface temperature in a heterogenous urban environment. Int. J. Appl. Earth Obs. Geoinf. 2021, 96, 102256. [Google Scholar] [CrossRef]
  18. Wang, Z.; Yang, Y.; Liu, C.; Zhou, F.; Hao, H. Human thermal comfort model and evaluation on building thermal environment. Energy Build. 2024, 323, 114796. [Google Scholar] [CrossRef]
  19. Li, J.; Lin, S.; Kong, N.; Ke, Y.; Zeng, J.; Chen, J. Nonlinear and synergistic effects of built environment indicators on street vitality: A case study of humid and hot urban cities. Sustainability 2024, 16, 1731. [Google Scholar] [CrossRef]
  20. Wu, W.; Tan, W.; Chen, W.Y.; Wang, R. Disentangling the non-linear impacts of natural attributes of urban built environment on life satisfaction. Cities 2024, 155, 105496. [Google Scholar] [CrossRef]
  21. Xu, J.; Xu, X.; Wang, Z.; Chen, H.; Ren, Q.; Huang, H.; Cui, Y.; An, R.; Liu, Y. Investigating thermal exposure during daily walking through a human-scale approach: An analysis of a hot summer in Wuhan. Build. Environ. 2024, 264, 111932. [Google Scholar] [CrossRef]
  22. Li, Y.; Li, Z.; Ren, C. Diversity of summertime thermal and environmental perceptions in residential public spaces: A walking-based assessment in Hong Kong’s public housing estates. Build. Environ. 2025, 271, 112594. [Google Scholar] [CrossRef]
  23. Zhang, Y.; Zheng, Z.; Zhang, S.; Fang, Z.; Lin, Z. Exploring thermal comfort and pleasure in outdoor shaded spaces: Inspiration for improving thermal index models. Build. Environ. 2024, 265, 111933. [Google Scholar] [CrossRef]
  24. Madhavan, G.R.; Kannamma, D. Multi-objective method of selecting performance-based local climatic zones using binomial logistic regression in warm and humid climate. Front. Archit. Res. 2024, 13, 184–200. [Google Scholar] [CrossRef]
  25. Geng, X.; Zhang, D.; Sun, W.; Yuan, Y.; Li, C.; Yu, Z. Heterogeneous impact of background meteorological factors on the cooling effect of two types of typical urban parks: Evidence from Shanghai, China. Build. Environ. 2024, 265, 112024. [Google Scholar] [CrossRef]
  26. Wu, C.; Eldesoky, A.H.; Morello, E. Understanding the effect of built-up and green spaces upon air quality at multiple spatial scales: A systematic literature review. Landsc. Urban Plan. 2025, 257, 105304. [Google Scholar] [CrossRef]
  27. Elkhayat, K.; Abdelhafez, M.H.H.; Altaf, F.; Sharples, S.; Alshenaifi, M.A.; Alfraidi, S.; Ragab, A. Urban geometry as a climate adaptation strategy for enhancing outdoor thermal comfort in a hot desert climate. Front. Archit. Res. 2024, in press. [Google Scholar]
  28. Bai, M.; Hu, R.; Lian, H.; Zhou, W. Correlation study of commercial street morphology and pedestrian activity in cold region summers under thermal comfort guidance: A case study of Sanlitun, Beijing. Buildings 2024, 14, 1751. [Google Scholar] [CrossRef]
  29. Zhou, W.; Zhang, J.; Li, X.; Guo, F.; Zhu, P. Influence of environmental factors on pedestrian summer vitality in urban pedestrian streets in cold regions guided by thermal comfort: A case study of Sanlitun—Beijing, China. Sustainability 2024, 16, 10419. [Google Scholar] [CrossRef]
  30. Jiang, Y.; Han, Y.; Liu, M.; Ye, Y. Street vitality and built environment features: A data-informed approach from fourteen Chinese cities. Sustain. Cities Soc. 2022, 79, 103724. [Google Scholar] [CrossRef]
  31. Wu, F.; Li, W.; Qiu, W. Examining non-linear relationship between streetscape features and propensity of walking to school in Hong Kong using machine learning techniques. J. Transp. Geogr. 2023, 113, 103698. [Google Scholar] [CrossRef]
  32. Gaglione, F.; Gargiulo, C.; Zucaro, F. Where can the elderly walk? A spatial multi-criteria method to increase urban pedestrian accessibility. Cities 2022, 127, 103724. [Google Scholar] [CrossRef]
  33. Zhao, B.; Deng, M.; Shi, Y. Inferring nonwork travel semantics and revealing the nonlinear relationships with the community built environment. Sustain. Cities Soc. 2023, 99, 104889. [Google Scholar] [CrossRef]
  34. Wang, L.; Huang, W. Visitors’ consistent stay behavior patterns within free-roaming scenic architectural complexes: Considering impacts of temporal, spatial, and environmental factors. Front. Archit. Res. 2024, 13, 990–1008. [Google Scholar] [CrossRef]
  35. Hahm, Y.; Yoon, H.; Choi, Y. The effect of built environments on the walking and shopping behaviors of pedestrians: A study with GPS experiment in Sinchon retail district in Seoul, South Korea. Cities 2019, 89, 1–13. [Google Scholar] [CrossRef]
  36. Shi, T.; Gao, F. Utilizing multi-source geospatial big data to examine how environmental factors attract outdoor jogging activities. Remote Sens. 2024, 16, 3056. [Google Scholar] [CrossRef]
  37. Lian, H.; Li, X.; Zhou, W.; Zhang, J.; Li, H. Pedestrian vitality characteristics in pedestrianized commercial streets—Considering temporal, spatial, and built environment factors. Front. Archit. Res. 2025, 14, 630–653. [Google Scholar] [CrossRef]
  38. Chen, W.; Wu, A.N.; Biljecki, F. Classification of urban morphology with deep learning: Application on urban vitality. Comput. Environ. Urban Syst. 2021, 90, 101706. [Google Scholar] [CrossRef]
  39. Li, Z.; Zhao, G. Revealing the spatio-temporal heterogeneity of the association between the built environment and urban vitality in Shenzhen. ISPRS Int. J. Geo-Inf. 2023, 12, 433. [Google Scholar] [CrossRef]
  40. Angel, A.; Plaut, P. Tempo-spatial analysis of pedestrian movement in the built environment based on crowdsourced big data. Cities 2024, 149, 104917. [Google Scholar] [CrossRef]
  41. Qiao, S.; Yeh, A.G.O. Understanding the effects of environmental perceptions on walking behavior by integrating big data with small data. Landsc. Urban Plan. 2023, 240, 104879. [Google Scholar] [CrossRef]
  42. Zhang, Y.; Li, Y.; Zhang, F. Multi-level urban street representation with street-view imagery and hybrid semantic graph. ISPRS J. Photogramm. Remote Sens. 2024, 218, 19–32. [Google Scholar] [CrossRef]
  43. Zhang, A.; Li, W.; Wu, J.; Lin, J.; Chu, J.; Xia, C. How can the urban landscape affect urban vitality at the street block level? A case study of 15 metropolises in China. Environ. Plan. B Urban Anal. City Sci. 2021, 48, 1245–1262. [Google Scholar] [CrossRef]
  44. Liu, J.; Li, Y.; Xu, Y.; Zhuang, C.C.; Hu, Y.; Yu, Y. Impacts of built environment on urban vitality in cultural districts: A case study of Haikou and Suzhou. Land 2024, 13, 840. [Google Scholar] [CrossRef]
  45. Mouratidis, K.; Poortinga, W. Built environment, urban vitality and social cohesion: Do vibrant neighborhoods foster strong communities? Landsc. Urban Plan. 2020, 204, 103951. [Google Scholar] [CrossRef]
  46. Zhao, K.; Guo, J.; Ma, Z.; Wu, W. Exploring the spatiotemporal heterogeneity and stationarity in the relationship between street vitality and built environment. Sage Open 2023, 13, 21582440231152226. [Google Scholar] [CrossRef]
  47. Li, T.; Xu, H.; Sun, H. Spatial Patterns and Multi-Dimensional Impact Analysis of Urban Street Quality Perception under Multi-Source Data: A Case Study of Wuchang District in Wuhan, China. Appl. Sci. 2023, 13, 11740. [Google Scholar] [CrossRef]
  48. Ki, D.; Chen, Z.; Lee, S.; Lieu, S. A novel walkability index using google street view and deep learning. Sustain. Cities Soc. 2023, 99, 104896. [Google Scholar] [CrossRef]
  49. Ito, K.; Kang, Y.; Zhang, Y.; Zhang, F.; Biljecki, F. Understanding urban perception with visual data: A systematic review. Cities 2024, 152, 105169. [Google Scholar] [CrossRef]
  50. Gao, F.; Chen, X.; Liao, S.; Chen, W.; Feng, L.; Wu, J.; Li, S. Crafting a jogging-friendly city: Harnessing big data to evaluate the runnability of urban streets. J. Transp. Geogr. 2024, 121, 104015. [Google Scholar] [CrossRef]
  51. Xie, H.; He, Y.; Wu, X.; Lu, Y. Interplay between auditory and visual environments in historic districts: A big data approach based on social media. Environ. Plan. B Urban Anal. City Sci. 2022, 49, 1245–1265. [Google Scholar] [CrossRef]
  52. Yang, Y.; Wang, H.; Qin, S.; Li, X.; Zhu, Y.; Wang, Y. Analysis of urban vitality in Nanjing based on a plot boundary-based neural network weighted regression model. ISPRS Int. J. Geo-Inf. 2022, 11, 624. [Google Scholar] [CrossRef]
  53. Zhu, Y.; Zhang, Y.; Biljecki, F. Understanding the user perspective on urban public spaces: A systematic review and opportunities for machine learning. Cities 2025, 156, 105535. [Google Scholar] [CrossRef]
  54. Liu, Y.; Guo, X. A dynamic prediction framework for urban public space vitality: From hypothesis to algorithm and verification. Sustainability 2024, 16, 2846. [Google Scholar] [CrossRef]
  55. Angel, A.; Cohen, A.; Nelson, T.; Plaut, P. Evaluating the relationship between walking and street characteristics based on big data and machine learning analysis. Cities 2024, 151, 105111. [Google Scholar] [CrossRef]
  56. Chen, E.; Ye, Z. Identifying the nonlinear relationship between free-floating bike sharing usage and built environment. J. Clean. Prod. 2021, 280, 124281. [Google Scholar] [CrossRef]
  57. Gong, H.; Wang, X.; Wang, Z.; Liu, Z.; Li, Q.; Zhang, Y. How did the built environment affect urban vibrancy? A big data approach to post-disaster revitalization assessment. Int. J. Environ. Res. Public Health 2022, 19, 12178. [Google Scholar] [CrossRef]
  58. Huang, X.; Gong, P.; Wang, S.; White, M.; Zhang, B. Machine learning modeling of vitality characteristics in historical preservation zones with multi-source data. Buildings 2022, 12, 1978. [Google Scholar] [CrossRef]
  59. Doan, Q.C.; Ma, J.; Chen, S.; Zhang, X. Nonlinear and threshold effects of the built environment, road vehicles and air pollution on urban vitality. Landsc. Urban Plan. 2025, 253, 105204. [Google Scholar] [CrossRef]
  60. Gao, F.; Deng, X.; Liao, S.; Liu, Y.; Li, H.; Li, G.; Chen, W. Portraying business district vibrancy with mobile phone data and optimal parameters-based geographical detector model. Sustain. Cities Soc. 2023, 96, 104635. [Google Scholar] [CrossRef]
  61. Wang, Z.; Liu, S.; Lian, H.; Chen, X. Investigating the nonlinear effect of land use and built environment on public transportation choice using a machine learning approach. Land 2024, 13, 1302. [Google Scholar] [CrossRef]
  62. Zhang, Y.; Ge, J.; Wang, S.; Dong, C. Optimizing urban green space configurations for enhanced heat island mitigation: A geographically weighted machine learning approach. Sustain. Cities Soc. 2025, 119, 106087. [Google Scholar] [CrossRef]
  63. Jin, A.; Ge, Y.; Zhang, S. Spatial characteristics of multidimensional urban vitality and its impact mechanisms by the built environment. Land 2024, 13, 991. [Google Scholar] [CrossRef]
  64. Li, M.; Pan, J. Assessment of influence mechanisms of built environment on street vitality using multisource spatial data: A case study in Qingdao, China. Sustainability 2023, 15, 1518. [Google Scholar] [CrossRef]
  65. Li, Y.; Yabuki, N.; Fukuda, T. Exploring the association between street built environment and street vitality using deep learning methods. Sustain. Cities Soc. 2022, 79, 103656. [Google Scholar] [CrossRef]
  66. Wang, H.; Tang, J.; Xu, P.; Chen, R.; Yao, H. Research on the influence mechanism of street vitality in mountainous cities based on a Bayesian network: A case study of the main urban area of Chongqing. Land 2022, 11, 728. [Google Scholar] [CrossRef]
  67. Xie, Y.; Zhang, J.; Li, Y.; Zhu, Z.; Deng, J.; Li, Z. Integrating multi-source urban data with interpretable machine learning for uncovering the multidimensional drivers of urban vitality. Land 2024, 13, 2028. [Google Scholar] [CrossRef]
  68. Zhang, Y.; Sun, Y.; Hu, T. Changes in extreme high temperature warning indicators over China under different global warming levels. Sci. China Earth Sci. 2024, 67, 1895–1909. [Google Scholar] [CrossRef]
  69. ISO 7730; Ergonomics of the Thermal Environment—Analytical Determination and Interpretation of Thermal Comfort Using Calculation of the PMV and PPD Indices and Local Thermal Comfort Criteria. International Organization for Standardization: Geneva, Switzerland, 2005.
  70. Ye, Y.; Richards, D.; Lu, Y.; Song, X.; Zhuang, Y.; Zeng, W.; Zhong, T. Measuring daily accessed street greenery: A human-scale approach for informing better urban planning practices. Landsc. Urban Plan. 2019, 191, 103434. [Google Scholar] [CrossRef]
  71. Yue, H. Investigating the influence of streetscape environmental characteristics on pedestrian crashes at intersections using street view images and explainable machine learning. Accid. Anal. Prev. 2024, 205, 107693. [Google Scholar] [CrossRef]
  72. Weng, X.; Yan, Y.; Chen, S.; Xue, J.H.; Wang, H. Stage-aware feature alignment network for real-time semantic segmentation of street scenes. IEEE Trans. Circuits Syst. Video Technol. 2021, 32, 4444–4459. [Google Scholar] [CrossRef]
  73. Tang, J.; Long, Y. Measuring visual quality of street space and its temporal variation: Methodology and its application in the Hutong area in Beijing. Landsc. Urban Plan. 2019, 191, 103436. [Google Scholar] [CrossRef]
  74. Raghu, D.; Bucher, M.J.J.; De Wolf, C. Towards a ‘resource cadastre’ for a circular economy—Urban-scale building material detection using street view imagery and computer vision. Resour. Conserv. Recycl. 2023, 198, 107140. [Google Scholar] [CrossRef]
  75. Gao, Y.; Du, D.; Furuya, N. Micro-scale built environment and pedestrian behavior: A focus on sidewalks in commercial districts in Tokyo. Front. Archit. Res. 2025, 14, 416–428. [Google Scholar] [CrossRef]
  76. Hang, J.; Sandberg, M.; Li, Y.; Claesson, L. Flow mechanisms and flow capacity in idealized long-street city models. Build. Environ. 2010, 45, 1042–1053. [Google Scholar] [CrossRef]
  77. Millard-Ball, A. The width and value of residential streets. J. Am. Plan. Assoc. 2022, 88, 30–43. [Google Scholar] [CrossRef]
  78. Liu, F.; Kang, J. Relationship between street scale and subjective assessment of audio-visual environment comfort based on 3D virtual reality and dual-channel acoustic tests. Build. Environ. 2018, 129, 35–45. [Google Scholar] [CrossRef]
  79. Arando, F.; Heris, M.P.; Zulian, G.; Udías, A.; Mentaschi, L.; Chrysoulakis, N.; Maes, J. Urban heat island mitigation by green infrastructure in European Functional Urban Areas. Sustain. Cities Soc. 2022, 77, 103564. [Google Scholar] [CrossRef]
  80. Han, Y.; Hegyi, A.; Yuan, Y.; Hoogendoorn, S.; Papageorgiou, M.; Roncoli, C. Resolving freeway jam waves by discrete first-order model-based predictive control of variable speed limits. Transp. Res. Part C Emerg. Technol. 2017, 77, 405–420. [Google Scholar] [CrossRef]
  81. Hailong, Z.; Shanyou, Z.; Mingjiang, W.; Zhaoying, Z.; Guixin, Z. Sky View Factor estimation based on 3D urban building data and its application in urban heat island—Illustrated by the case of Adelaide. Remote Sens. Technol. Appl. 2015, 30, 899–907. [Google Scholar]
  82. Mehta, V. Evaluating public space. J. Urban Des. 2014, 19, 53–88. [Google Scholar] [CrossRef]
  83. Kalantari, S.; Xu, T.B.; Govani, V.; Mostafavi, A. Analyzing the effects of storefront window display transparency on perceived store attractiveness and approach behavior. J. Retail. Consum. Serv. 2022, 69, 103080. [Google Scholar] [CrossRef]
  84. Wang, W.; Chen, J.; Hong, T.; Zhu, N. Occupancy prediction through Markov based feedback recurrent neural network (M-FRNN) algorithm with WiFi probe technology. Build. Environ. 2018, 138, 160–170. [Google Scholar] [CrossRef]
  85. Niu, K.; Wang, X.; Zhang, F.; Zheng, R.; Yao, Z.; Zhang, D. Rethinking Doppler effect for accurate velocity estimation with commodity WiFi devices. IEEE J. Sel. Areas Commun. 2022, 40, 2164–2178. [Google Scholar] [CrossRef]
  86. Gao, R.; Li, W.; Xie, Y.; Yi, E.; Wang, L.; Wu, D.; Zhang, D. Towards robust gesture recognition by characterizing the sensing quality of WiFi signals. Proc. ACM Interact. Mob. Wearable Ubiquitous Technol. 2022, 6, 1–26. [Google Scholar] [CrossRef]
  87. Wu, W.; Ma, Z.; Guo, J.; Niu, X.; Zhao, K. Evaluating the effects of built environment on street vitality at the city level: An empirical research based on spatial panel Durbin model. Int. J. Environ. Res. Public Health 2022, 19, 1664. [Google Scholar] [CrossRef]
  88. Lundberg, S.M.; Lee, S.I. A unified approach to interpreting model predictions. Adv. Neural Inf. Process. Syst. 2017, 30, 4768–4777. [Google Scholar]
  89. Wu, C.; Ye, Y.; Gao, F.; Ye, X. Using street view images to examine the association between human perceptions of locale and urban vitality in Shenzhen, China. Sustain. Cities Soc. 2023, 88, 104291. [Google Scholar] [CrossRef]
  90. Li, H.; Li, Y.; Wang, T.; Wang, Z.; Gao, M.; Shen, H. Quantifying 3D building form effects on urban land surface temperature and modeling seasonal correlation patterns. Build. Environ. 2021, 204, 108132. [Google Scholar] [CrossRef]
  91. Wang, Z.; Wang, X.; Liu, Y.; Zhu, L. Identification of 71 factors influencing urban vitality and examination of their spatial dependence: A comprehensive validation applying multiple machine-learning models. Sustain. Cities Soc. 2024, 108, 105491. [Google Scholar] [CrossRef]
  92. Sun, B.; Ermagun, A.; Dan, B. Built environmental impacts on commuting mode choice and distance: Evidence from Shanghai. Transp. Res. Part D Transp. Environ. 2017, 52, 441–453. [Google Scholar] [CrossRef]
Figure 1. Research framework.
Buildings 15 02118 g001
Figure 2. Study area.
Buildings 15 02118 g002
Figure 3. Selection of streets.
Buildings 15 02118 g003
Figure 4. Segmentation operation diagram.
Buildings 15 02118 g004
Figure 5. Schematic diagram of field measurements of the built environment of streets.
Buildings 15 02118 g005
Figure 6. Diagram of the street space validation and vitality recording.
Buildings 15 02118 g006
Figure 7. Comparison of the predictive performance of different machine learning models.
Buildings 15 02118 g007
Figure 8. Diurnal and nocturnal average vitality of commercial streets.
Buildings 15 02118 g008
Figure 9. Importance of various built environment elements of the street.
Buildings 15 02118 g009
Figure 10. SHAP summary diagram of the built environment factors for pedestrian commercial streets.
Buildings 15 02118 g010
Figure 11. Interaction diagram of built environment factors.
Buildings 15 02118 g011
Figure 12. Nonlinear effects of the synergistic interaction of built environment factors.
Buildings 15 02118 g012
Table 1. Calculation methods for built environment element indicators.
Spatial Element IndicatorsCalculation MethodSources
Shop width (SW)( S W i ) storefront width of shop i, ( S i ) total street-facing frontage of all shops on one side of shop i, ( D i ) street-facing width of the commercial street for shop i.
S W i = S i D i
Data for storefront lengths and commercial interface length from field measurement of the commercial pedestrian streets under study, or from architectural plans/drawings of the street and shop units.
Street width( W i ) Street width of pedestrian commercial street area i, ( A i ) total area of pedestrian commercial street area i, ( L i ) street length of pedestrian commercial street area i.
W i = A i L i
Total street area come from urban planning GIS data, or be calculated via field-measured length and width (if regular shape), length of the line connecting midpoints of entrances/exits from field measurement or spatial mapping tools.
Green view ratio (GVR)(GVR) green view ratio, ( A g ) area of greenery in the pedestrian’s field of view, ( A t ) total visual area in the pedestrian’s field of view.
G V R = A g A t
Street view image segmentation algorithms,
street view images from on-site photography (using cameras to capture pedestrian-level views of the street) or from existing street view datasets (e.g., Google Street View).
Sky visibility(GVR) sky visibility, ( A S ) area of the sky in the pedestrian’s field of view, ( A t ) total visual area in the pedestrian’s field of view.
S V = A S A t
Relying on street view image segmentation algorithms. Street view images from on-site capture or existing street view data sources.
Number of items of street furniture(N) number of items of street furniture in the pedestrian’s field of view, ( f k ) the piece of street furniture, (M) total number of street furniture in the pedestrian’s field of view.
M = K = 1 n f k
Street view image recognition algorithms (involve object detection models like YOLO, trained to identify street furniture types), street view images from on-site photography or existing datasets.
Physiological equivalent temperature (PET)(PET) physiological equivalent temperature, an indicator of thermal comfort, (T) air temperature (°C), (RH) relative humidity (%), (WS) wind speed (m/s), (M) human metabolic rate (typically standardized to a sedentary state, ~80 W/m2), (R) radiant heat exchange (including solar and long-wave radiation, W/m2), (C) clothing thermal resistance (typically set at 0.5 clo for summer).
P E T = f ( T , R H , W S , M , R , C )
Air temperature, humidity, wind speed data from meteorological stations (either local fixed stations near the study area or mobile weather sensors deployed in the field).
ENVI-met software (with input data from the aforementioned meteorological factors and possibly 3D models of the street environment built from architectural and urban data).
Store interface transparency (FT)(FT) sore interface transparency, ( A t r ) area of transparent shop interfaces in the pedestrian’s field of view, ( A t ) total visual area in the pedestrian’s field of view.
F T = A t r A t
Street view image segmentation algorithms.
Street view images from on-site capture (pedestrian-level photos of storefronts) or existing street view resources.
Billboard density(BD) billboard density, ( A b ) area of billboards in the pedestrian’s field of view, ( A t ) total visual area in the pedestrian’s field of view.
B D = A b A t
Street view image segmentation algorithms,
street view images from on-site photography or existing street view datasets.
Disclaimer/Publisher’s Note: The statements, opinions and data contained in all publications are solely those of the individual author(s) and contributor(s) and not of MDPI and/or the editor(s). MDPI and/or the editor(s) disclaim responsibility for any injury to people or property resulting from any ideas, methods, instructions or products referred to in the content.

