Article

Development and Demonstration of the Operational Sustainability Index (OPSi): A Multidimensional Metric for Building Performance Evaluation

by
Oluwafemi Awolesi
1,2,* and
Margaret Reams
2
1
Bert S. Turner Department of Construction Management, Louisiana State University, Baton Rouge, LA 70803, USA
2
Department of Environmental Sciences, Louisiana State University, Baton Rouge, LA 70803, USA
*
Author to whom correspondence should be addressed.
Buildings 2025, 15(12), 2111; https://doi.org/10.3390/buildings15122111
Submission received: 17 May 2025 / Revised: 12 June 2025 / Accepted: 15 June 2025 / Published: 18 June 2025
(This article belongs to the Section Building Energy, Physics, Environment, and Systems)

Abstract

In promoting sustainable cities and societies, accelerating the shift from sustainable building design to sustainable building operations is essential. A persistent challenge lies in the absence of a unified, multidimensional metric that enables meaningful performance comparisons across buildings of similar types and functions, both regionally and globally. This study develops and demonstrates the operational sustainability index (OPSi)—a novel metric grounded in case study research that integrates indoor environmental quality (IEQ) and energy utility quality (EUQ). OPSi is applied to six buildings in three comparative cases: (1) LEED-certified and non-certified dormitories, (2) LEED-certified and non-certified event buildings, and (3) male- and female-occupied multifamily housing units. Results show that the LEED-certified dormitory underperformed in two of five OPSi variants compared to its non-certified counterpart despite achieving up to 18% higher objective IEQ performance. The LEED-certified event building outperformed its non-certified counterpart across all OPSi metrics, with up to 88% higher objective IEQ scores. Findings also include higher energy performance in male-occupied housing units than in female-occupied ones, highlighting behavioral differences worthy of future study. This research addresses longstanding criticisms of green certification systems—particularly their limited capacity to holistically measure post-certification operational performance—by offering a practical and scalable evaluation framework. OPSi aligns with global sustainability goals, including SDG 11 (Sustainable Cities and Communities) and SDG 7 (Affordable and Clean Energy), and supports smart, data-driven decision-making. Future applications may extend OPSi to include carbon life cycle assessment and maintenance metrics to further strengthen building sustainability in urban contexts.

1. Introduction

The building industry accounts for approximately 40% of global greenhouse gas emissions—a figure that likely rises further when the entire building lifecycle is considered [1,2]. Beyond operational demands, building materials carry significant embodied energy, beginning at extraction and often magnified by long-distance transport [3]. Together, these factors increase both total energy consumption and associated costs.
Over the past three decades, there has been a strong emphasis on embedding sustainable principles into building design to reduce the carbon footprint in the building sector [4,5]. Several green certification schemes have emerged to guide this shift, notably LEED, which originated in the United States and has achieved global adoption since its introduction in the late twentieth century [6]. Other notable schemes include BREEAM, CASBEE, Green Star, Green Mark, Passivhaus, Three Star, Minergie, and Display Energy Certification, originating, respectively, from the United Kingdom, Japan, Australia, Singapore, Germany, China, Switzerland, and the European Union [7].
These schemes typically prioritize core sustainability criteria, including sustainable siting (eco-friendly land development and management), energy conservation (reducing consumption and adopting renewables), water efficiency (minimizing potable water use), and indoor environmental quality (IEQ) [8]. Policymakers have estimated that adhering to these green standards can yield operating cost savings ranging from at least 10% to as high as 97%, depending on the certification level and the extent of sustainable design implementation [9].
Importantly, these certification schemes apply not only to new buildings but also to existing structures considering retrofitting. However, a major deterrent remains: the high documentation and implementation costs required for certification. For example, Uğur and Leblebici [10] found that LEED Gold and Platinum buildings incurred additional construction costs of 7.43% and 9.43%, respectively.
While certification remains largely voluntary, municipalities are now integrating green building principles into their building codes without mandating full certification [11]. Beyond upfront costs, another key critique of certification schemes is the difficulty of assessing operational performance holistically. Questions persist about whether certified buildings consistently deliver on their promised benefits [12,13,14].
Among the most widely adopted post-construction certification models is LEED for operations and maintenance (LEED O+M) [15]. This framework evaluates existing buildings based on performance in energy, water, transportation, and waste management. However, its IEQ component primarily emphasizes air quality indicators (such as CO2 and PM2.5) and requires only a single occupant satisfaction survey per annual performance period. This limited frequency and narrow focus undermine the reliability of IEQ assessments and fail to capture seasonal or short-term variations in occupant experiences. Consequently, LEED O+M—despite its broad scope—offers an incomplete and static view of actual building performance.
Programs like ENERGY STAR in the U.S. provide operational benchmarking for commercial buildings, with a score ≥75% indicating top energy performance, but they focus solely on energy [16]. The Home Energy Rating System (HERS), also prominent in the U.S., targets residential buildings and narrowly focuses on energy performance; its score can influence resale value, as energy-efficient homes often command a premium [17].
Among the core sustainability categories, three stand out for operational assessment: indoor environmental quality, energy efficiency, and water efficiency. Yet research shows that certification alone does not guarantee superior operational performance, particularly when certified buildings are compared to uncertified counterparts. For example, Clay et al. [18] found that LEED-certified federal retrofits did not achieve statistically significant average energy savings, although buildings with higher energy scores showed meaningful improvements. Similarly, a Korean study reported that certified non-residential buildings had energy use intensities (EUIs) nearly 50% lower than general buildings [19]. In a Canadian longitudinal study, Issa et al. [20] discovered that LEED-certified schools had 28% lower total energy costs than non-certified schools, though the savings often failed to offset higher construction costs.
Other studies show contradictory results. In a study of 100 certified commercial and institutional buildings, Newsham et al. [21] found that while LEED buildings used 18–39% less energy, 28–35% consumed more energy than similar uncertified buildings. More recently, Vosoughkhosravi et al. [22] reported that a LEED Silver-certified residential college building consumed more electricity, gas, and water over five years than seven non-LEED-certified ones. In a review of 44 papers, Amiri et al. [12] found that 23% of the studies concluded that LEED certification improved energy efficiency, while 18% reached the opposite conclusion. They also observed that lower operational performance was frequently associated with lower-level certifications.
These and other studies demonstrate that comparative research on energy performance often yields mixed results. Similar mixed patterns have emerged regarding indoor environmental quality (IEQ), where green certification does not consistently translate to superior performance [22].
IEQ is typically assessed in three ways: (a) subjectively, through occupant satisfaction surveys covering the four critical components (4CCs)—thermal comfort (Tc), indoor air quality (IAQ), acoustic comfort (Ac), and lighting comfort (Lc), sometimes including aesthetics and cleanliness; (b) objectively, through sensor-based physical measurements; or (c) via dual-method approaches. A major innovation in the dual-method approach is the development of protocol-based weighting schemes (or models) to yield composite IEQ scores, as summarized in Equation (1) [23,24]:
I E Q o v e r a l l = i = 1 k w i   · C i
where w i represents the weight assigned to component i , C i is the score or value of component i , and k is the total number of IEQ components considered in the model.
Weighting is often achieved using either straightforward or complex approaches [25,26]. Several studies employ regression analysis on Likert-scale satisfaction responses to component-specific survey questions relative to overall satisfaction or use the analytical hierarchy process (AHP) to assess their relative importance through pairwise comparisons [27,28].
While the IEQ models aim to quantify overall IEQ, scholars like Piasecki et al. [29] have argued that many become unnecessarily complex, introducing subjectivity due to variability in occupant perceptions. They advocate for crude weighting schemes that assign equal weights to each IEQ component, yielding simpler and often more practical results. Supporting studies [24,28] suggest that minor adjustments to category weights rarely change overall IEQ outcomes, making equal weighting a robust approach. Additionally, regression-derived weightings can be problematic, as they assume linear relationships and may exclude variables with minimal or negative coefficients [30,31], potentially dismissing meaningful contributors.
We propose that multiple linear regression (MLR) analysis be used primarily to understand statistically significant relationships between the 4CCs and overall satisfaction, while equal-weighted IEQ models should be employed independently to generate composite scores—particularly when working with sample sizes of at least 20 participants.
Energy performance assessments typically rely on utility bills or energy meters, calculating energy use intensity (EUI) benchmarked against design estimates or industry standards [32,33]. While useful, EUI benchmarks can emphasize competitive comparisons and overlook operational nuances or occupant needs. This is especially problematic in regions with extreme weather conditions, which elevate HVAC demands, operating costs, and thermal discomfort. Therefore, region-specific metrics are critical for estimating building energy performance. Furthermore, since dissatisfaction with rising energy costs can affect occupant well-being [34,35,36], incorporating metrics that capture user perceptions may offer valuable insights into how satisfaction or dissatisfaction evolves over time.
Although some studies have employed quantitative models, IoT-enabled tracking, or simulations to examine IEQ–energy relationships [37,38], most have failed to provide a unified framework that integrates IEQ, energy, and water into a holistic operational performance metric. The preceding examples suggest that researchers often independently assess operational variables to evaluate building performance. While relatively few studies have measured at least two of the most critical operational variables concurrently, those that aim for holistic integration often do so based on differing rationales and sometimes flawed methodologies.
For example, Wang and Zheng [32] and Roumi et al. [39] independently explored the relationship between daily energy consumption and IEQ parameters using similar statistical models, but their findings diverged. The former identified relative humidity as the most energy-sensitive parameter, whereas the latter found that sufficient artificial lighting was the most energy-intensive.
Geng et al. [40] proposed the environmental energy efficiency (EEE) model to evaluate the trade-off between IEQ and energy consumption. This model was later adopted or modified in recent studies and applied to various building types [41,42]. However, the adopted energy performance metric underlying the overall EEE calculation exhibits a critical methodological flaw that limits its applicability for buildings that deviate significantly from the adopted EUI benchmark—an oversight that can compromise the validity of its conclusions. Additionally, the performance grading system of the final EEE model lacks clear intervention pathways, further reducing its practical value for informing energy policy and decision-making.
Recently, Perera et al. [43] proposed integrating IEQ and energy efficiency as a promising future research direction to support improved building design and construction. However, their proposal lacks sufficient clarity regarding the development pathway, application framework, and procedural guidance.
A recently published study proposed the concept of sustainable indoor environmental quality (IEQs) as an early attempt to integrate IEQ and energy efficiency into a singular operational sustainability indicator [44]. While promising, the approach had two key limitations. First, it relied on a simple additive combination of IEQ and energy metrics, which may fail to reflect the complex trade-offs and interdependencies between human comfort and energy demand. Second, the IEQs metric was not multidimensional, limiting the flexibility and robustness of the evaluation. Building on the foundational logic of this earlier work—and addressing its structural weaknesses—this study introduces the operational sustainability index (OPSi). OPSi incorporates a more productive and flexible combination approach, allowing for customizable dimensions and scoring variants, thereby providing stronger construct validity and broader applicability across different building types and regions.
Sustainable building operations refer to the consistent and long-term performance of buildings in minimizing environmental impact while maximizing occupant comfort and energy/resource efficiency [45,46]. This includes maintaining optimal indoor environments, achieving energy/water performance goals, and responding to user feedback post-occupancy—regardless of whether the building is newly constructed or retrofitted.
To advance sustainable cities and societies, there is an urgent need to shift from sustainable building design to sustainable building operations. A promising way to achieve this is by developing a uniform metric that enables consistent evaluation of operational performance across buildings of similar types and functions, adaptable to diverse climates and regions.
This study aims to develop and demonstrate the operational sustainability index (OPSi)—a novel, multidimensional framework for evaluating the operational performance of existing buildings. By integrating sensor-based environmental monitoring, user satisfaction surveys, and utility data into a unified scoring model, OPSi enables fair performance comparisons across building types and regions. Using three comparative case studies involving six buildings in a humid subtropical region (Cfa zone according to the Köppen climate classification) in the United States, the study highlights the practical applicability and critical advantages of OPSi over traditional benchmarks like LEED O+M and ENERGY STAR. The outcomes point to OPSi’s potential in guiding climate-responsive and occupant-centered strategies for sustainable building operations.

2. Methodology

The methodology for this research involves two main phases. The first phase includes field measurements of environmental variables, the distribution of survey questionnaires, and the collection of energy usage data. The second phase focuses on the development and implementation of multiple dimensions of the operational sustainability index (OPSi). The overall methodological approach is summarized in Figure 1. Collected data were analyzed using Excel and Python (version 3.11) environments following meticulous quality checks, and multiple linear regression was performed to examine the relationships between IEQ factors and overall user experience satisfaction.

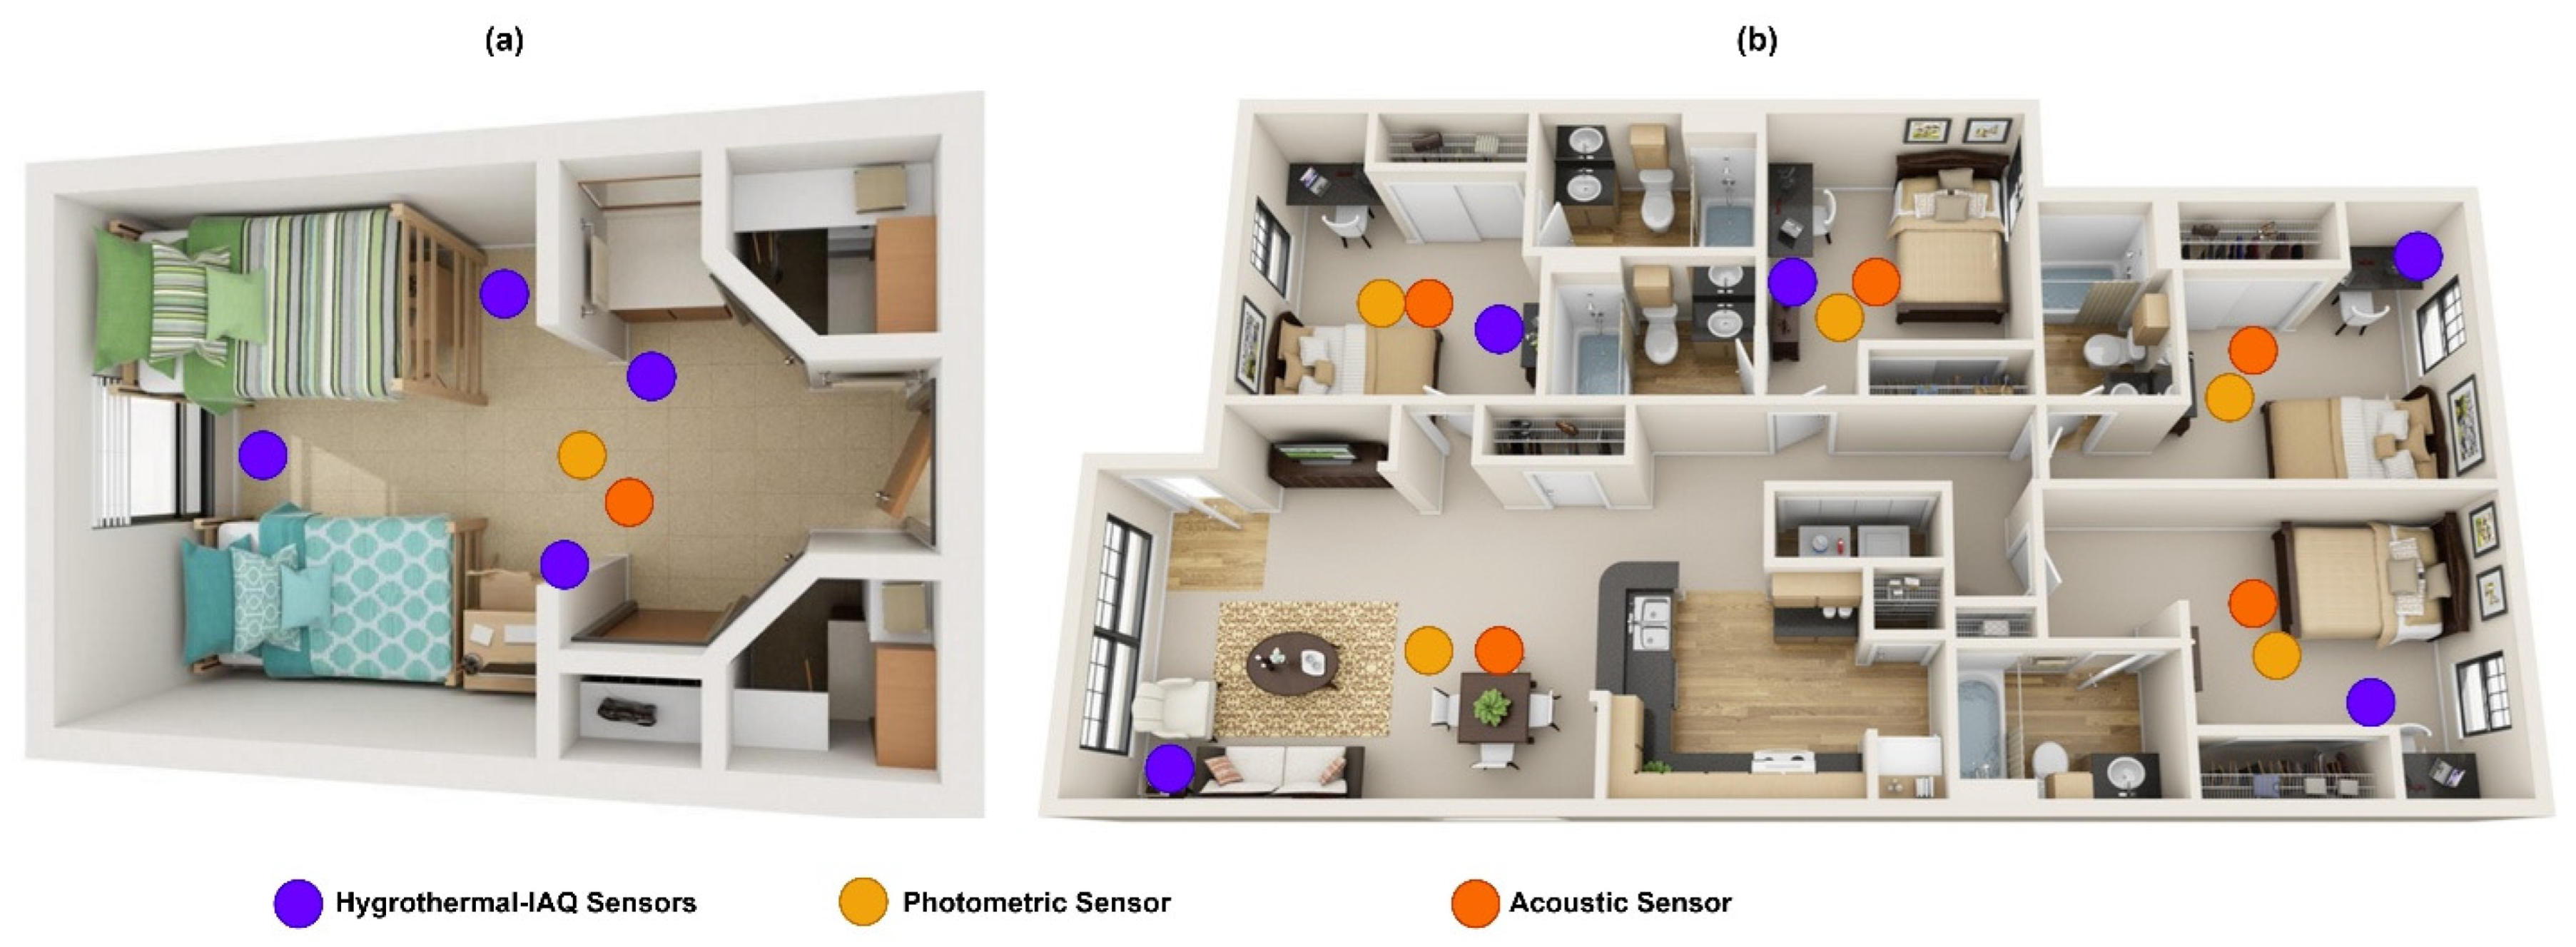
2.1. Data Collection

The case study buildings are located in Baton Rouge, the capital city of Louisiana, which is situated in the southeastern United States and experiences distinct seasonal changes, with a cooling season typically spanning from April to September or October and a heating season usually extending from mid-November to mid-March [47]. Although October is often considered a transition month, shifts in local climate patterns can bring about a faster or slower transition. Over the past three years, Baton Rouge has experienced heating degree days ranging from 1067 to 1669 and cooling degree days ranging from 2708 to 3496, with January consistently recording the highest heating degree days and August the highest cooling degree days.
Case I: Institutional Dormitories
This case features two student residence halls:
  • A LEED Silver-certified dormitory (LCD) constructed in 2015 with a total floor area of 110,000 ft2;
  • A non-certified dormitory (NCD) constructed in 2008 with 70,000 ft2.
Most dormitories at the university rely on centralized chilled and heated water systems for seasonal cooling and heating, with changeovers based on prevailing weather patterns. Due to the slow transition capability between cooling and heating, the facilities team makes system-wide decisions about when to activate heating or cooling. However, the two dormitory buildings in this study are fitted with individual room-level thermal controls, offering more precise occupant control over indoor temperature settings.
Representative zones in LCD and NCD were selected for environmental monitoring—two dorm rooms and one corridor per building. Sensor equipment was used with the following specifications: temperature (measuring range [MR] 0–50 °C; accuracy [Ay] ±1 °C), humidity (MR 0–99.9%; Ay ±5%), CO2 (MR 0–5000 ppm; Ay ±5% ± 50 ppm), PM2.5 (MR 0–999 µg/m3; Ay ±10 µg/m3), formaldehyde (MR 0–2 mg/m3; Ay ±0.03 mg/m3), illuminance (MR 1–100,000 lx; Ay ±(4% + 2 lx)), and sound pressure level (MR 30–130 dB; Ay ±3.0 dB–±5.0 dB). Hygrothermal-IAQ sensors were placed in occupant breathing zones and corridor locations, with 30 min data logging over one representative month during both the heating and cooling seasons. Lighting and acoustic measurements were taken on a single day at 0.75 m (rooms) and 1.55 m (corridors). The layout of typical rooms and sensor placements are illustrated in Figure 2.
Case II: Public Event Spaces
This case includes two buildings primarily used for events:
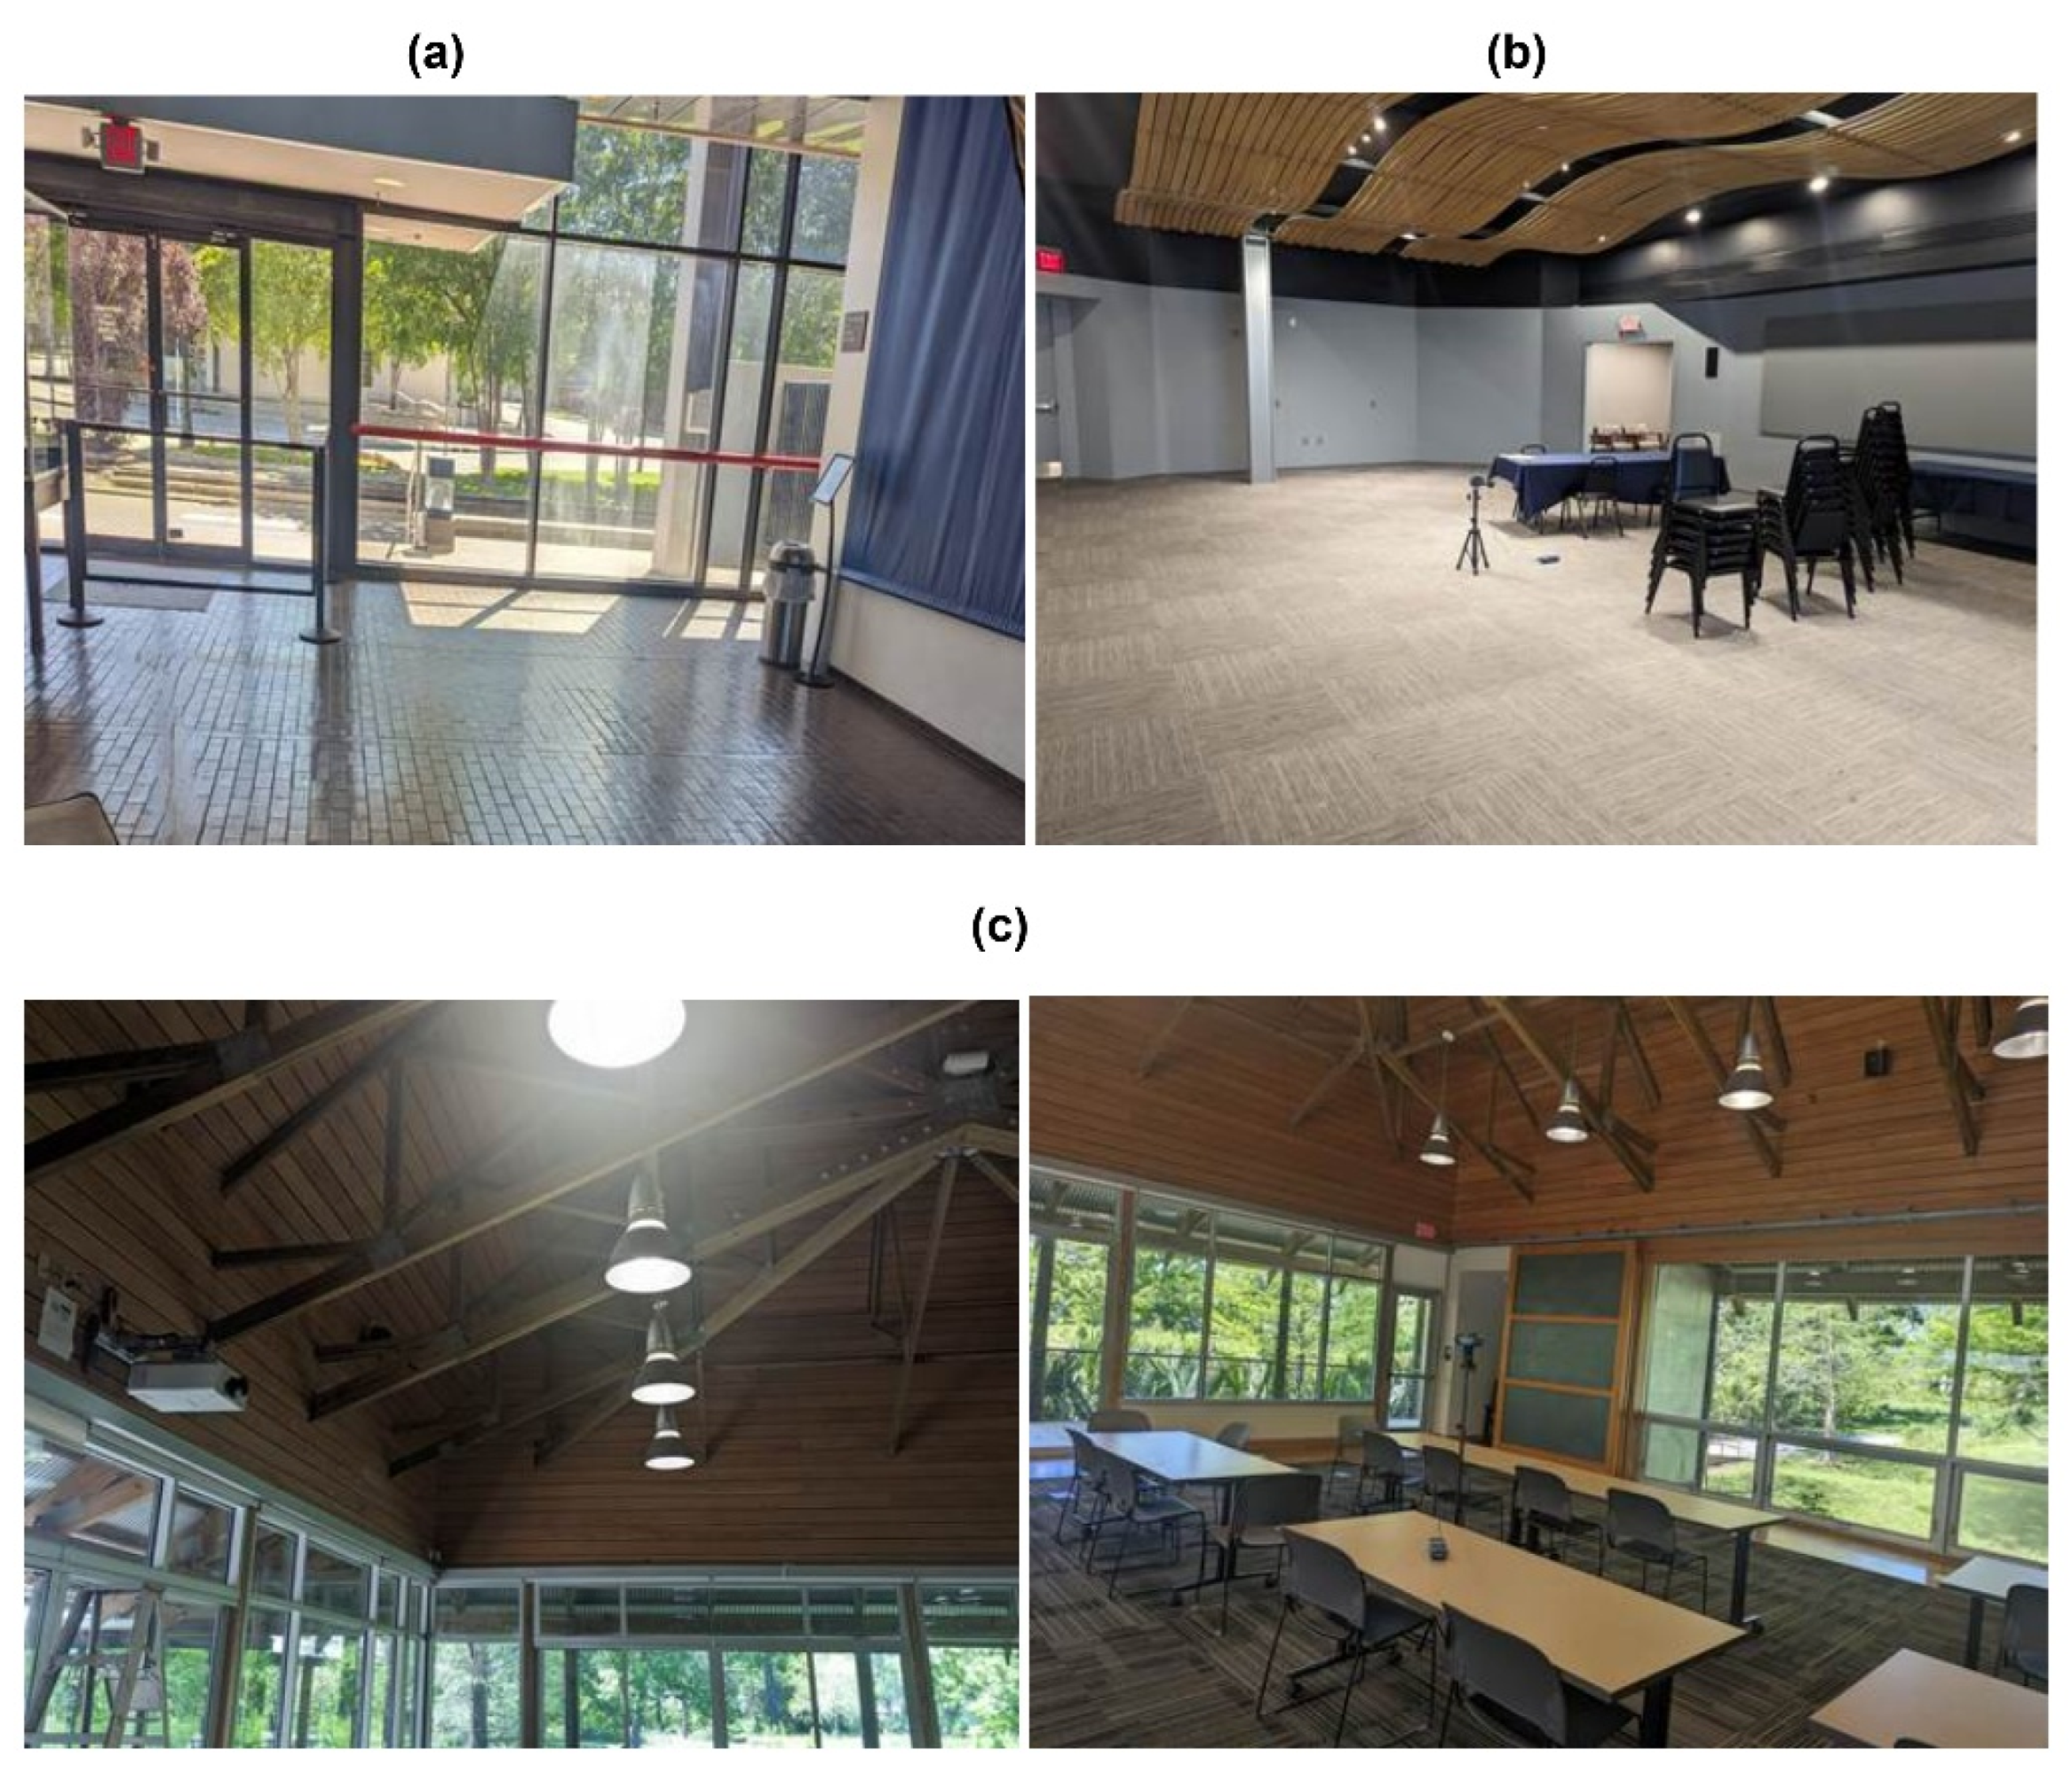
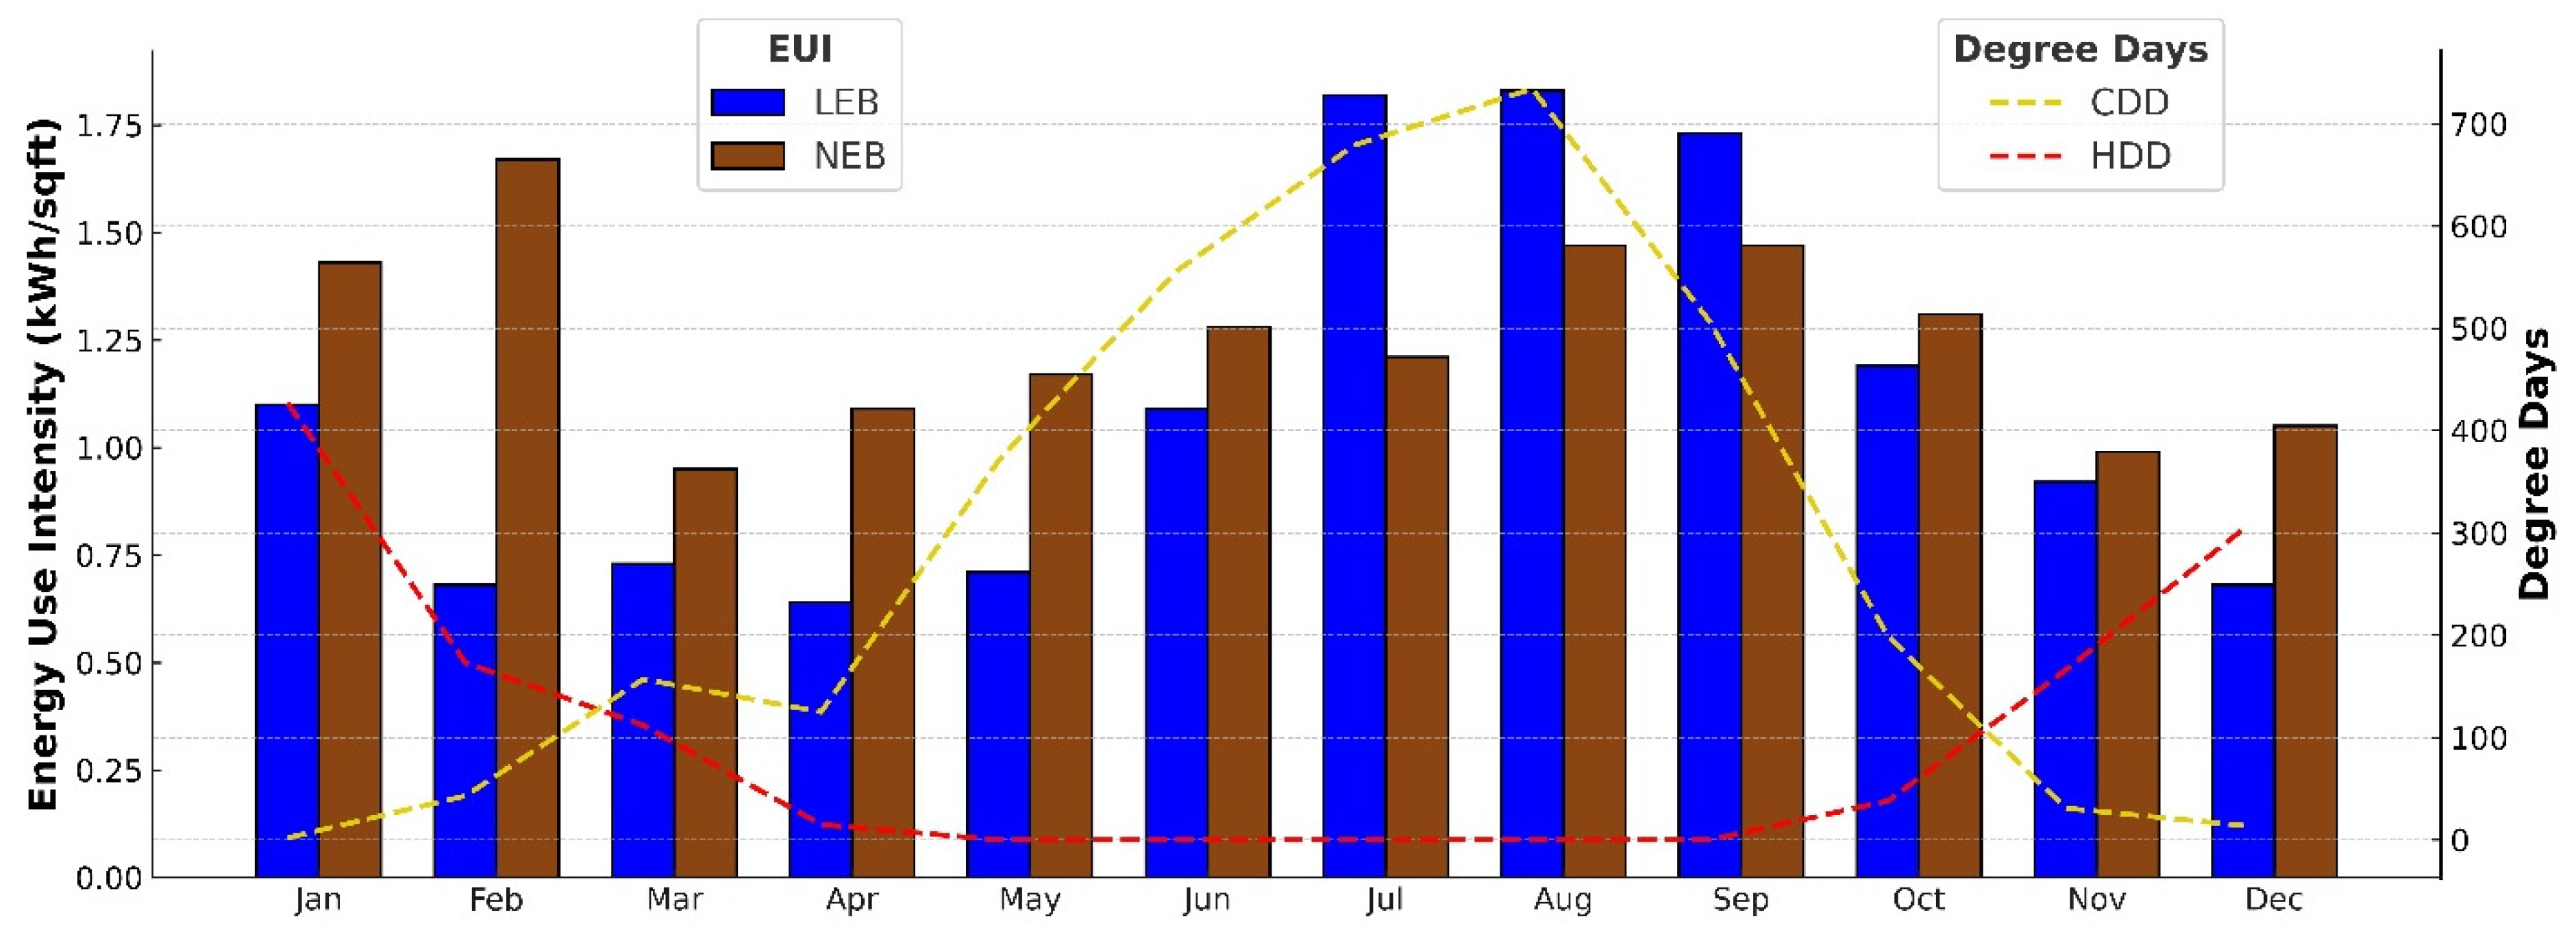
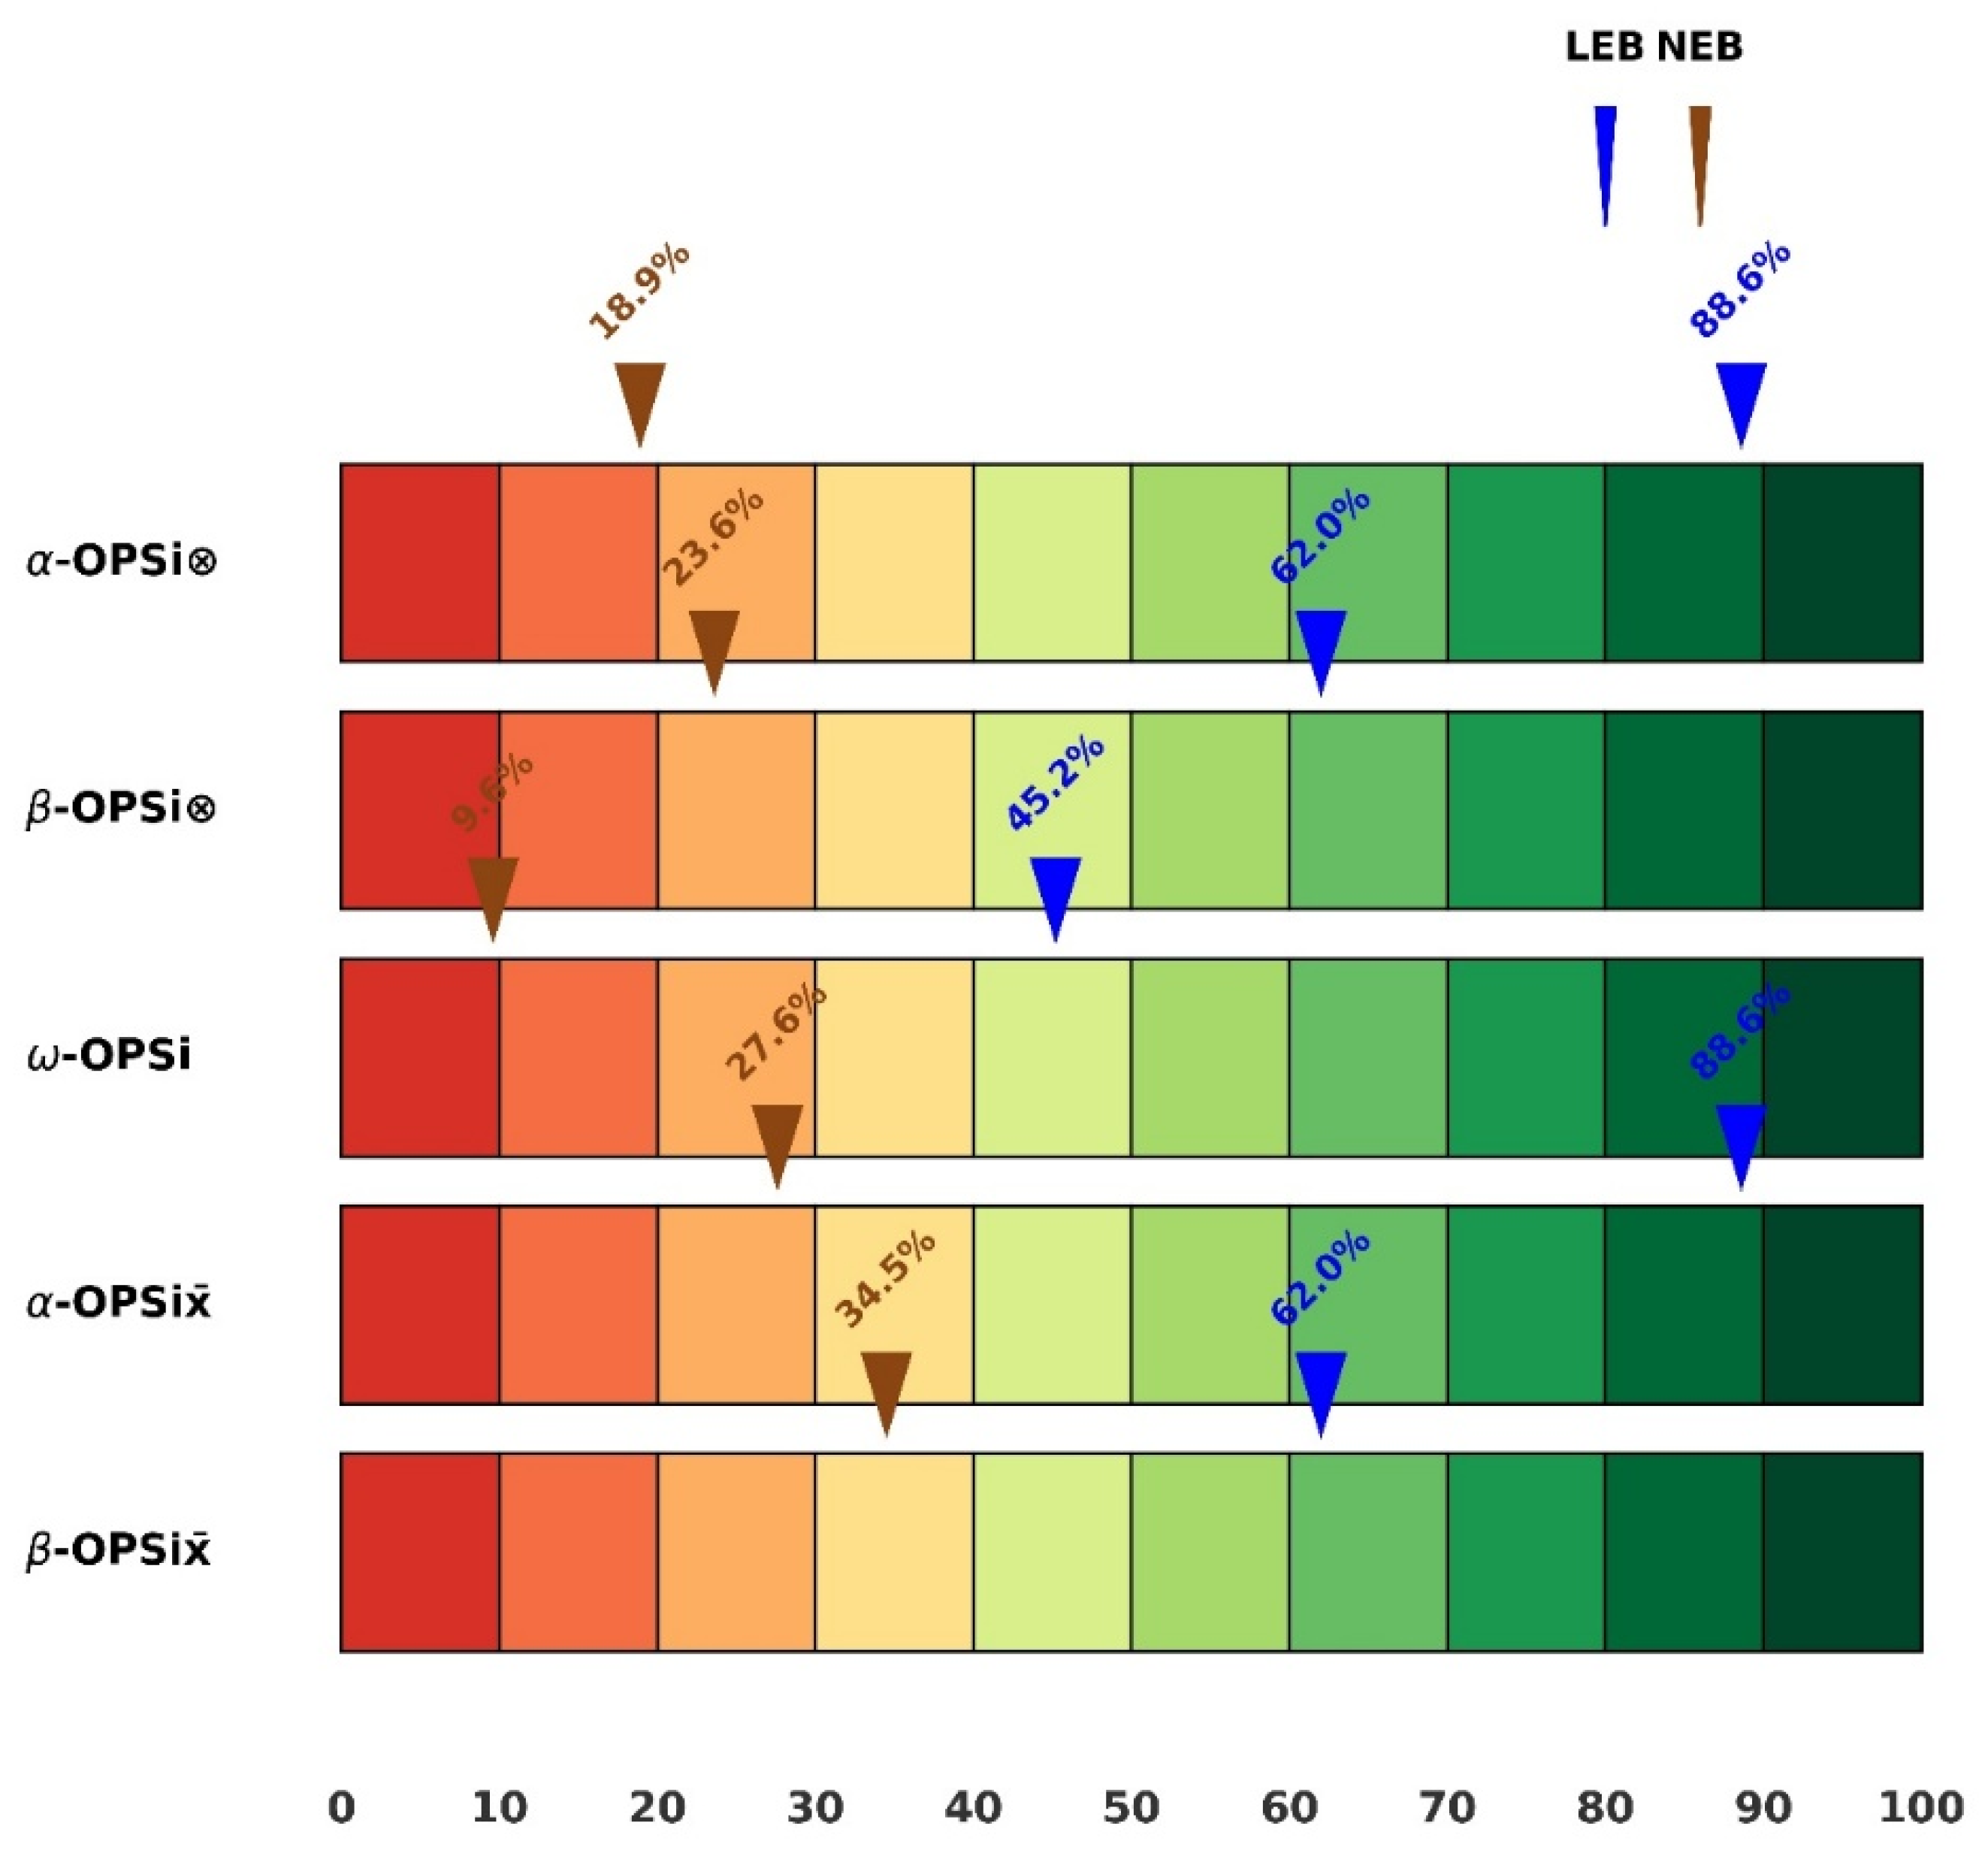
  • A LEED-certified event building (LEB) completed in 2014 (single-floor, 2100 ft2);
  • A non-certified event building (NEB) built in the 1980s (two-story, 60,000 ft2), comprising a conference room and a lobby.
LEB is equipped with two high-efficiency electric heat pumps for cooling and heating and utilizes a direct digital control (DDC) automated control system to optimize HVAC operations. The DDC system enables real-time adjustments, energy savings, and improved indoor air quality, contributing to a quieter and healthier indoor environment.
In contrast, NEB uses a centralized chilled water-cooling system, partially managed by a building automation system (BAS). Despite having some energy-saving practices in place—including occupancy sensors for lighting and partial LED retrofits—the system has several operational inefficiencies. Prior audits revealed that chilled water temperature setpoints were set too low, and conflicting heating and cooling schedules resulted in unnecessary energy use. The building relies on outdated variable air volume (VAV) boxes, potentially compromising energy efficiency and thermal comfort.
Monitoring protocols were consistent with Case I. Hygrothermal-IAQ equipment was placed between 0.75 m and 1.55 m heights to simulate standing and seated positions in public use areas. One-month monitoring occurred during both heating and cooling seasons. Figure 3 provides interior views of the event spaces and equipment setups.
Case III: Multifamily Housing
This case compares two gender-specific residential units:
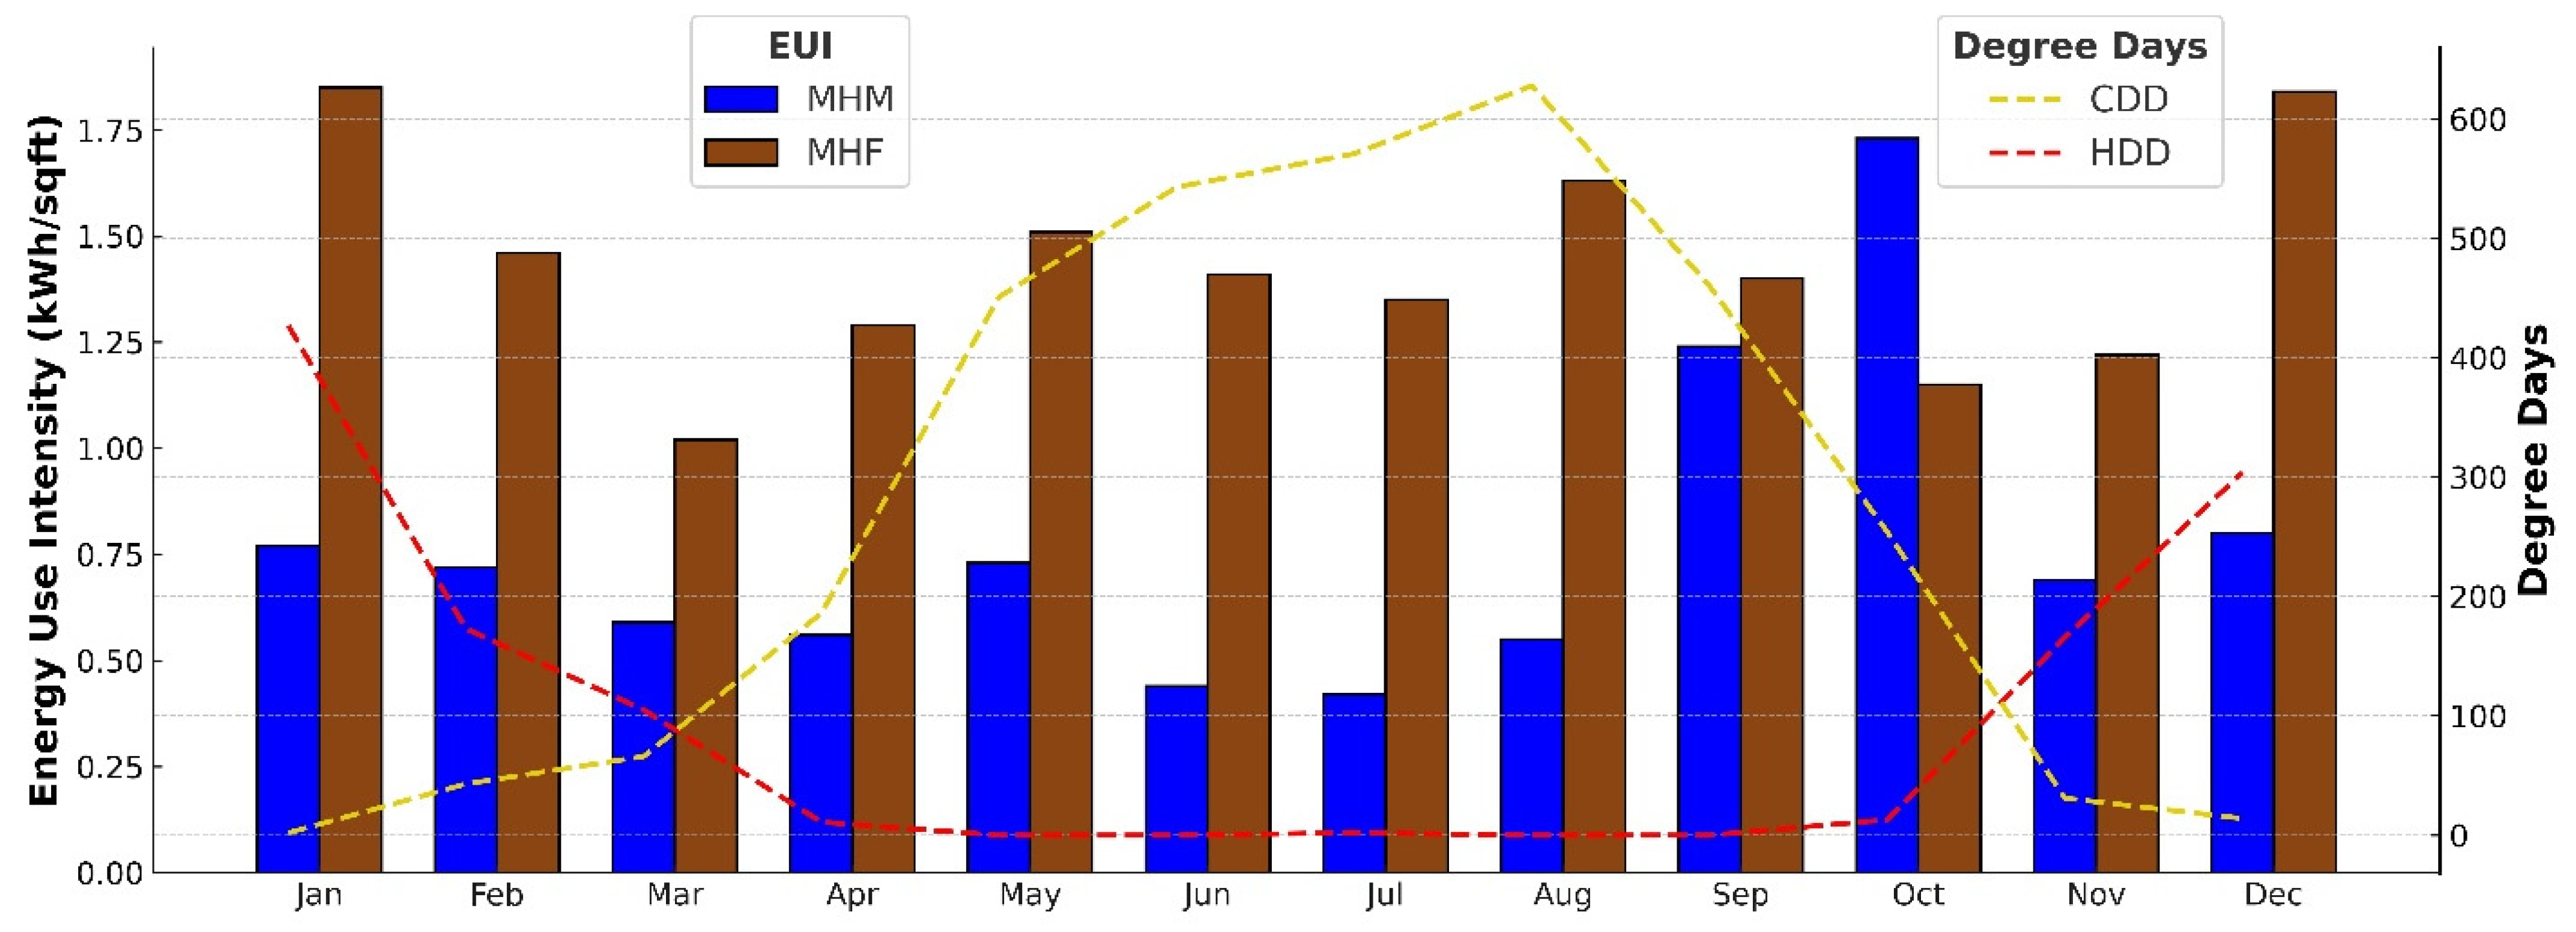
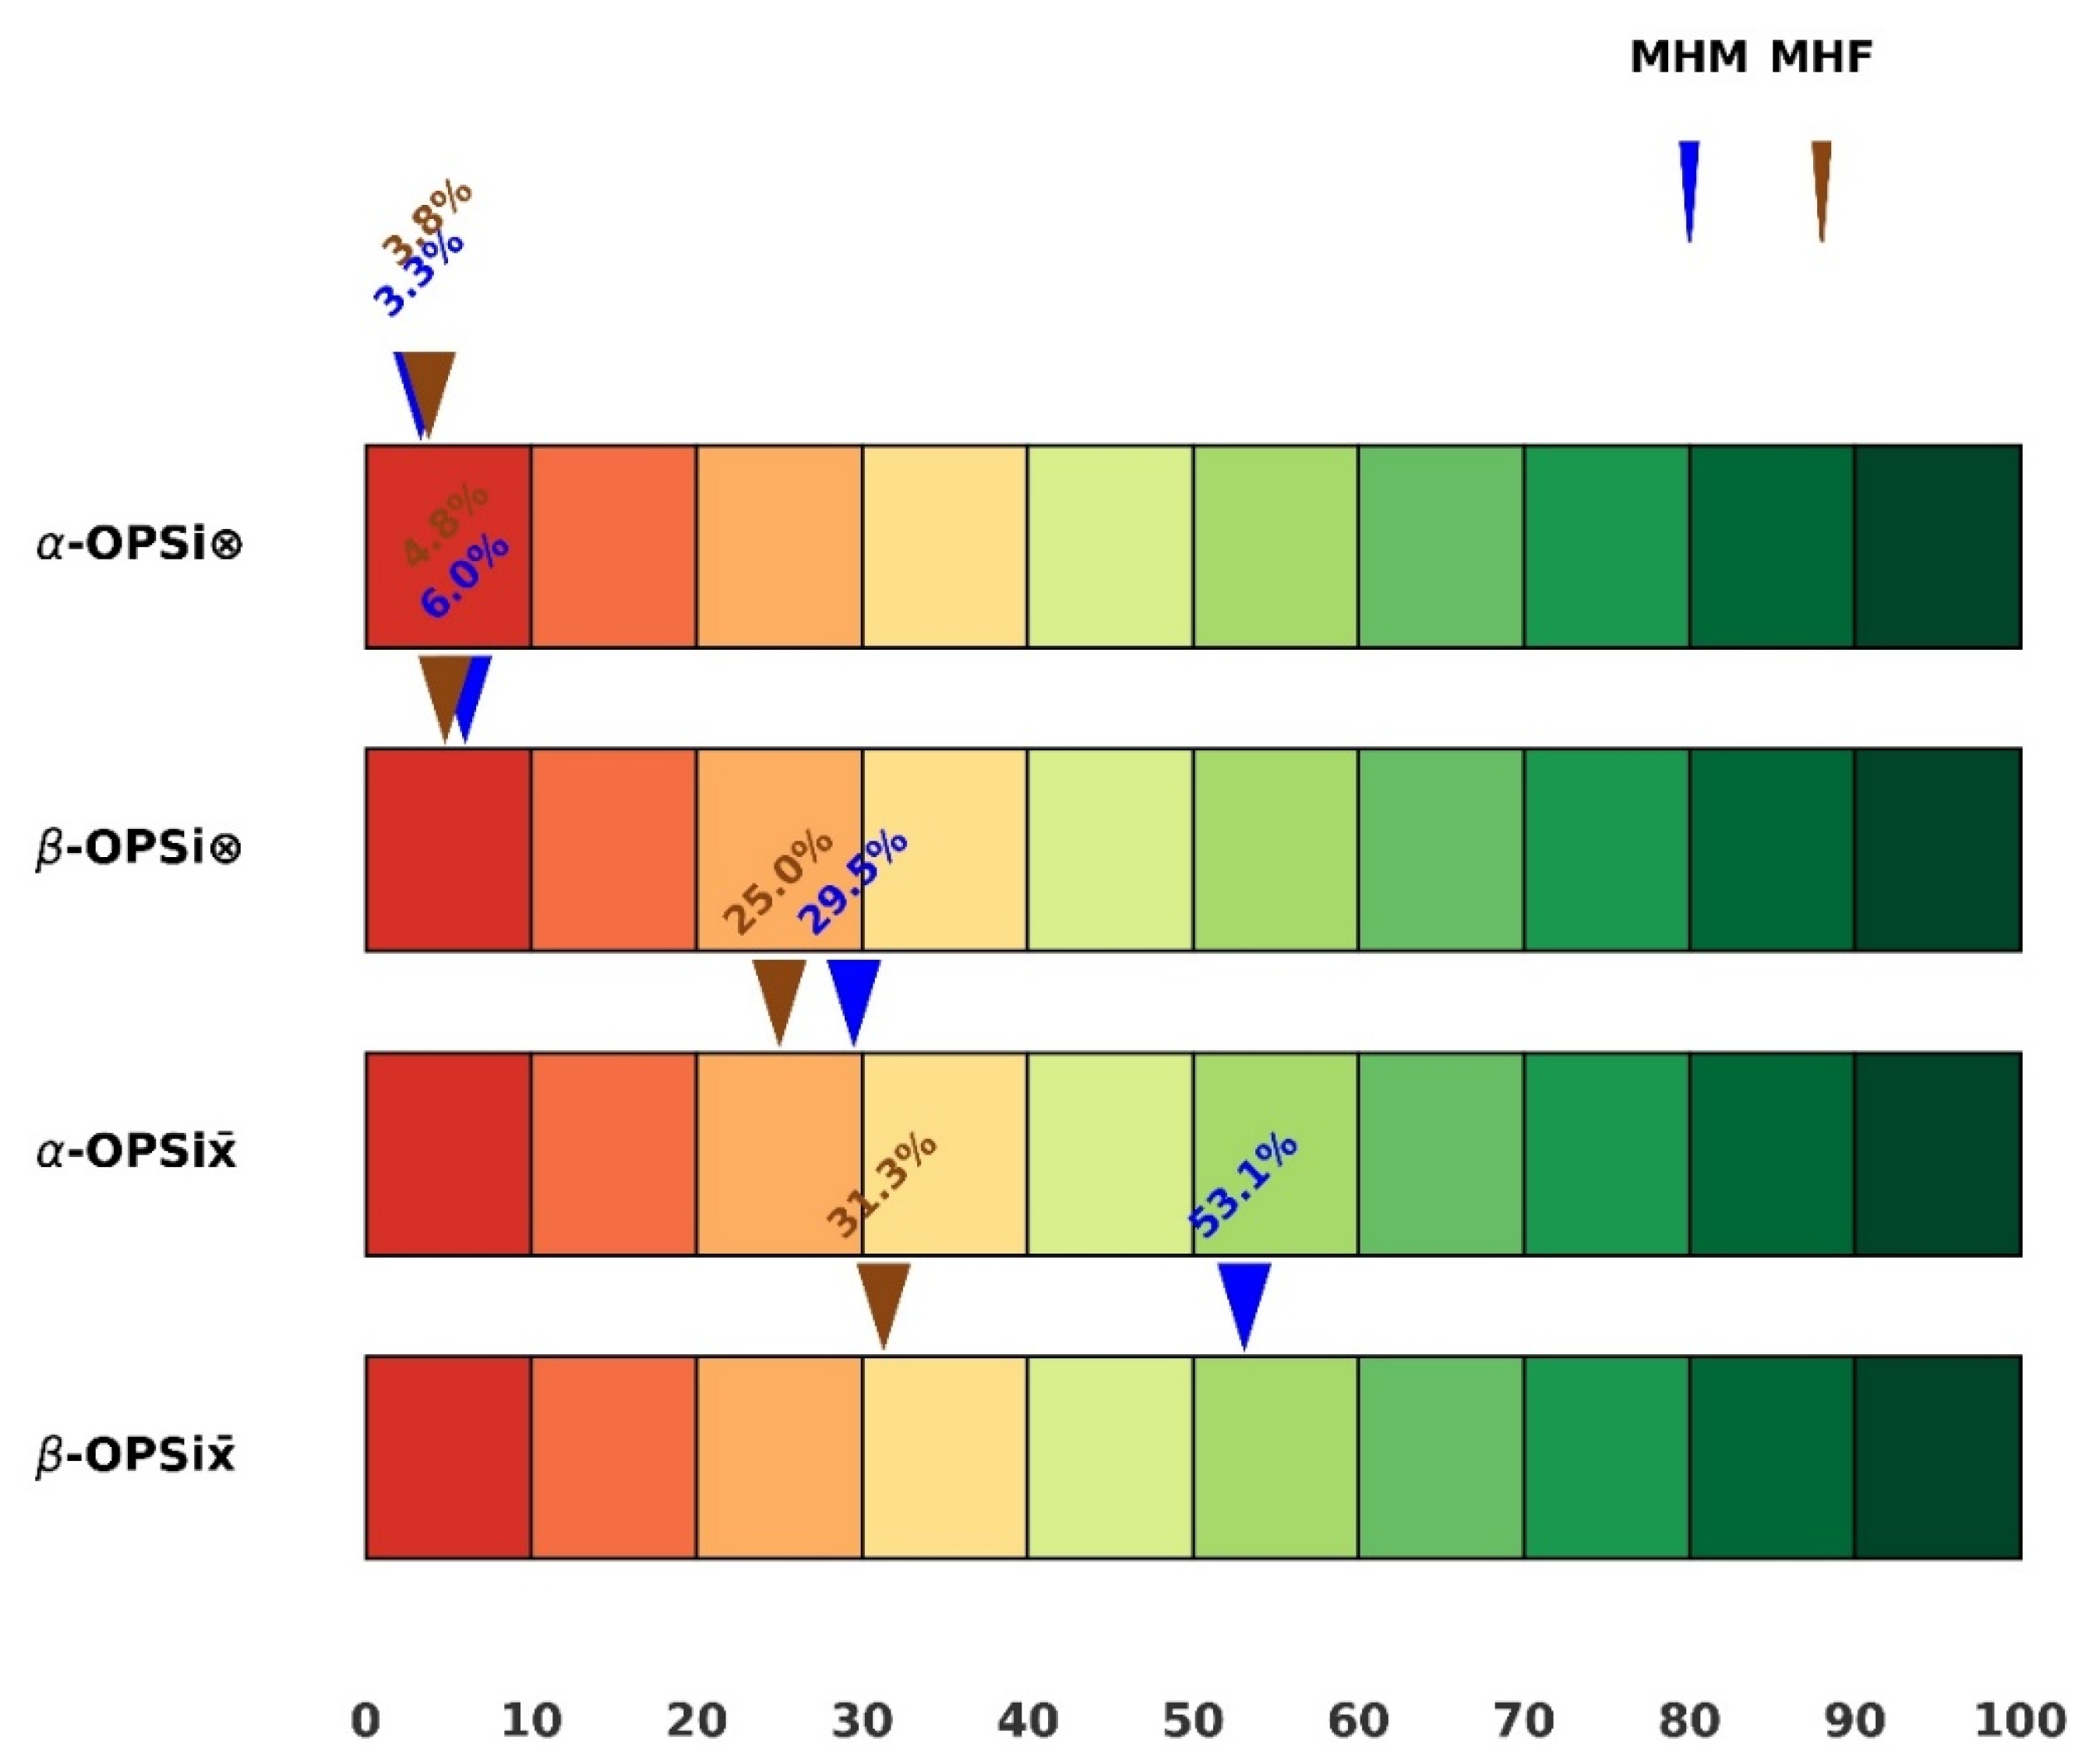
  • A male-occupied unit (MHM) with four bedrooms (1100 ft2);
  • A female-occupied unit (MHF) with four bedrooms (1300 ft2).
Both units were constructed in the early 2000s and use electric heat pumps for both cooling and heating. Each space is also naturally ventilated via operable windows, supported by internal blinds to moderate daylighting. Due to privacy constraints, environmental data collection occurred on a single day per unit, approximately two weeks apart. Sensors were placed in each bedroom and shared living spaces. A typical layout of the unit with sensor overlay is presented in Figure 2.
All buildings used mechanical systems for heating and cooling. The residential buildings had glazed windows with blinds, while the event buildings had approximately 50% to 70% glazed façade. The dormitories were predominantly constructed with thick concrete envelopes, whereas the multifamily housing units primarily used wood-insulated envelopes.
Energy usage data for Cases I and II were obtained from facility managers, while multifamily housing users provided energy data for Case III. This study used one year of energy consumption data: April 2023–March 2024 for Case I, March 2023–February 2024 for Case II, and November 2023–October 2024 for Case III, with environmental monitoring occurring within these periods.
Survey questions were administered both online and in person, focusing on the 4CCs (thermal comfort, indoor air quality, acoustic comfort, and lighting comfort) for building users, and on energy use and costs for facility managers. A five-point Likert scale (1 = Very Dissatisfied to 5 = Very Satisfied) was used. Table 1 summarizes respondent distribution and survey questions. Notably, dormitory users were long-term residents, whereas event-building users were occasional visitors, typically for short stays (e.g., a few hours on a single day). Due to the unintentional sharing of a single survey link with multifamily housing occupants, which made it difficult to separate male and female responses, subjective survey data were excluded from Case III analyses.

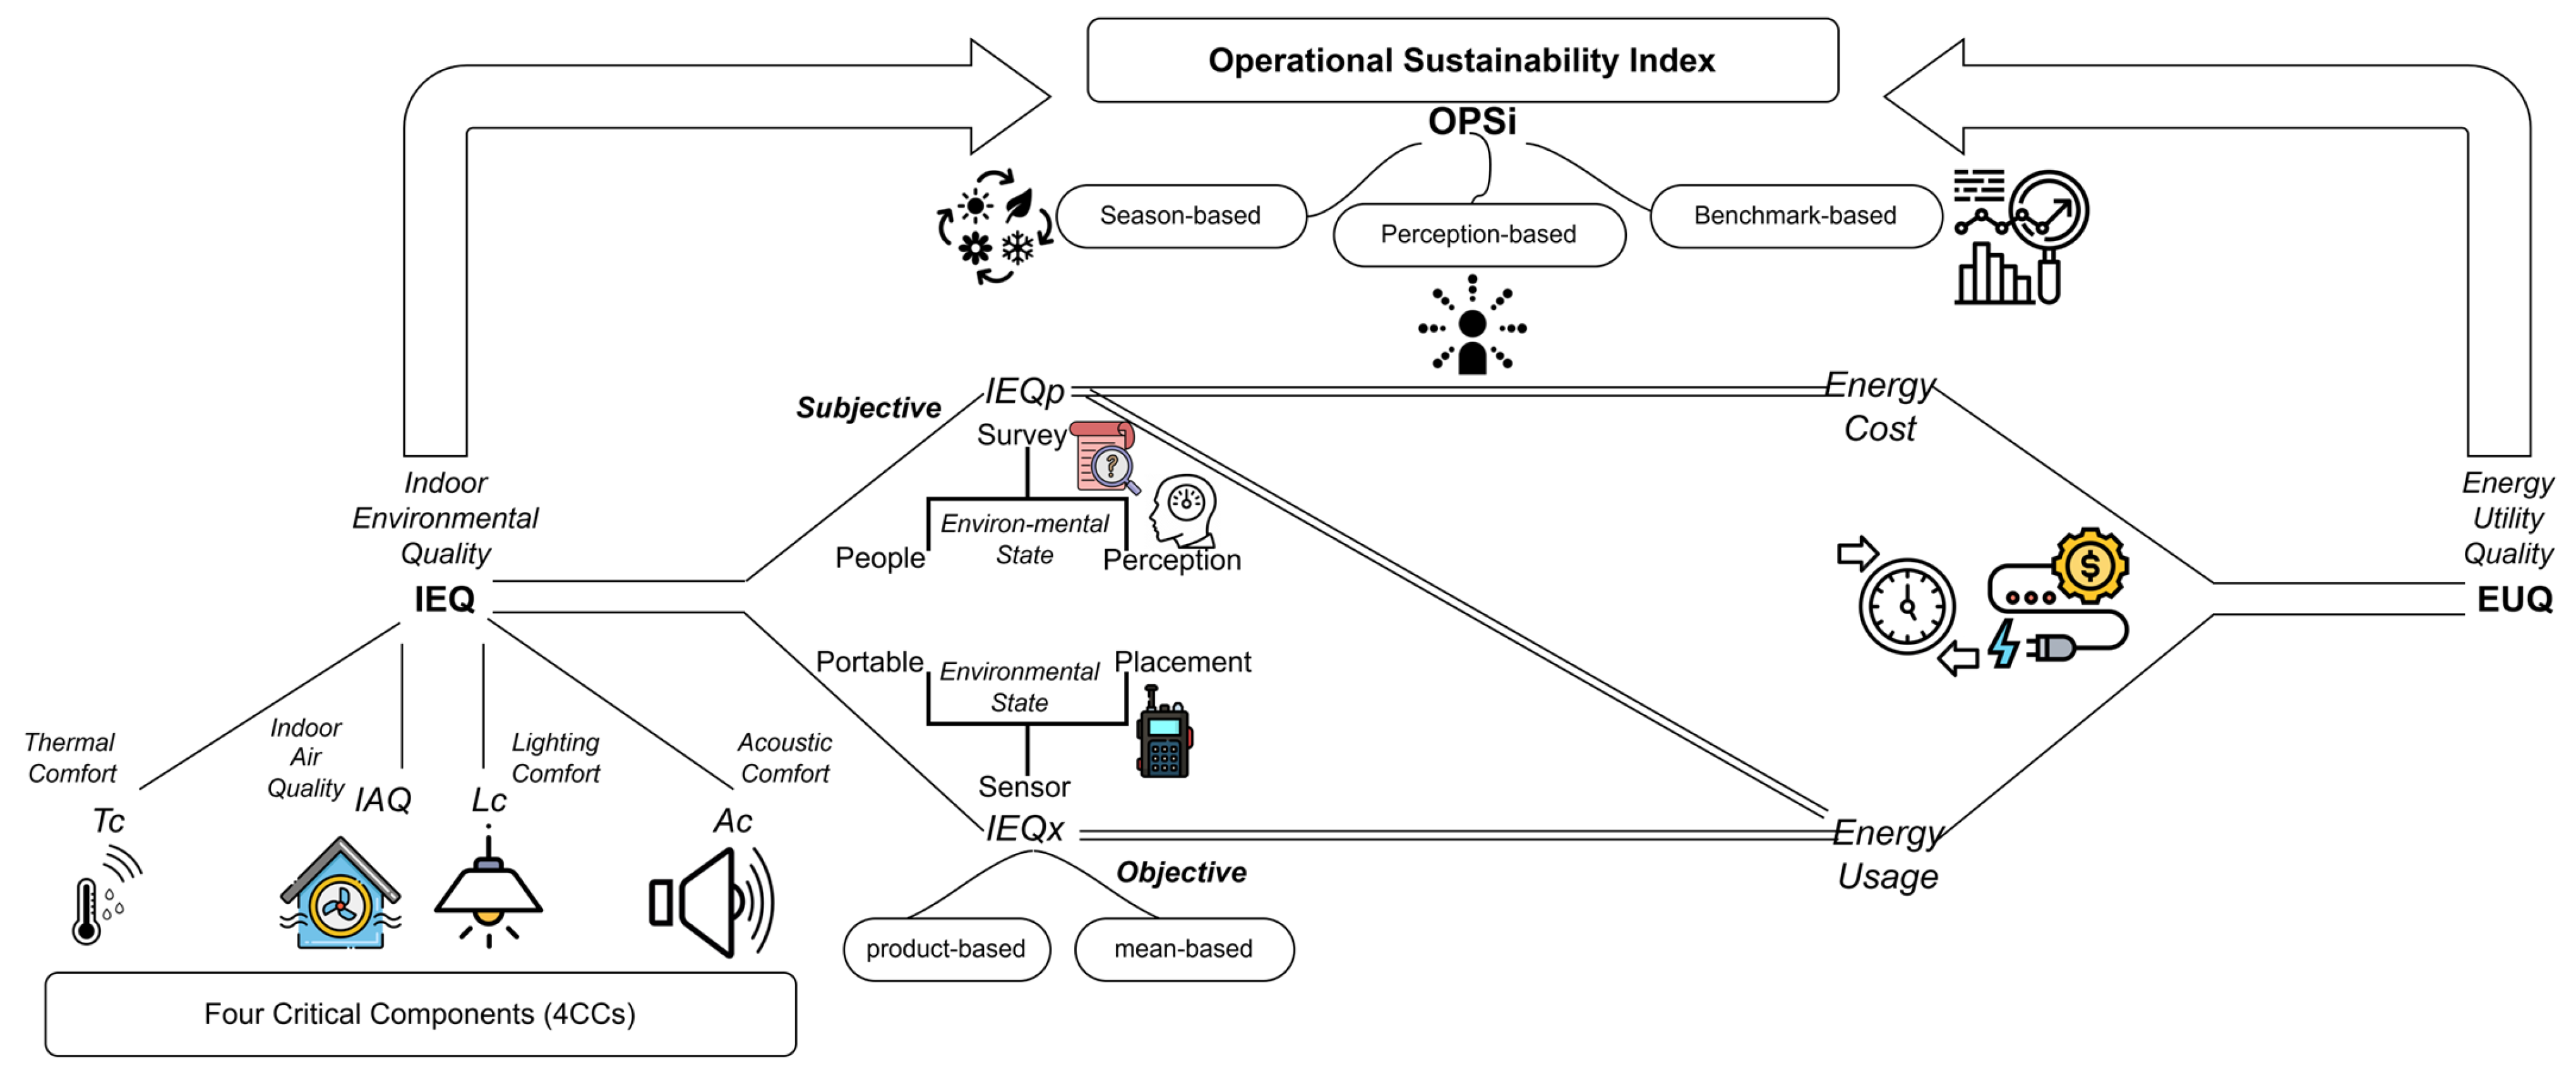
2.2. Development of the Operational Sustainability Index

The development of the operational sustainability index (OPSi) begins with the formulation of two core components: the indoor environmental quality (IEQ) model and the energy utility quality (EUQ) model, which are subsequently integrated into composite OPSi variants. This framework builds on foundational work established in Awolesi’s earlier study [44], which introduces an operational metric combining environmental comfort and energy use indicators.
In the current study, the IEQ model exists in two forms, incorporating either objective sensor-based measurements or subjective occupant satisfaction ratings across four critical comfort components: thermal, air quality, acoustic, and lighting. The EUQ model integrates quantitative energy consumption data, assessed using performance benchmarking and seasonal comparisons, to reflect operational efficiency. In addition, qualitative perceptions of energy cost and satisfaction were collected to complement the quantitative analysis and expand the suite of OPSi variants designed for flexible application in diverse building contexts.
These models were selected for their practical relevance, scalability across building types, and alignment with real-world post-occupancy evaluation needs. Alternative metrics—such as carbon emissions or lifecycle environmental impacts—were not included, as they lie beyond the scope of this study. The focus here is on measurable operational indicators that facilitate direct, building-to-building comparisons. Moreover, in contexts where energy sources remain consistent, energy use intensity (EUI) rankings closely mirror those of carbon emissions intensity, making EUI a valid proxy for comparative performance evaluation across case study buildings.

2.2.1. Indoor Environmental Quality Models

This study employs two main dimensions of IEQ:
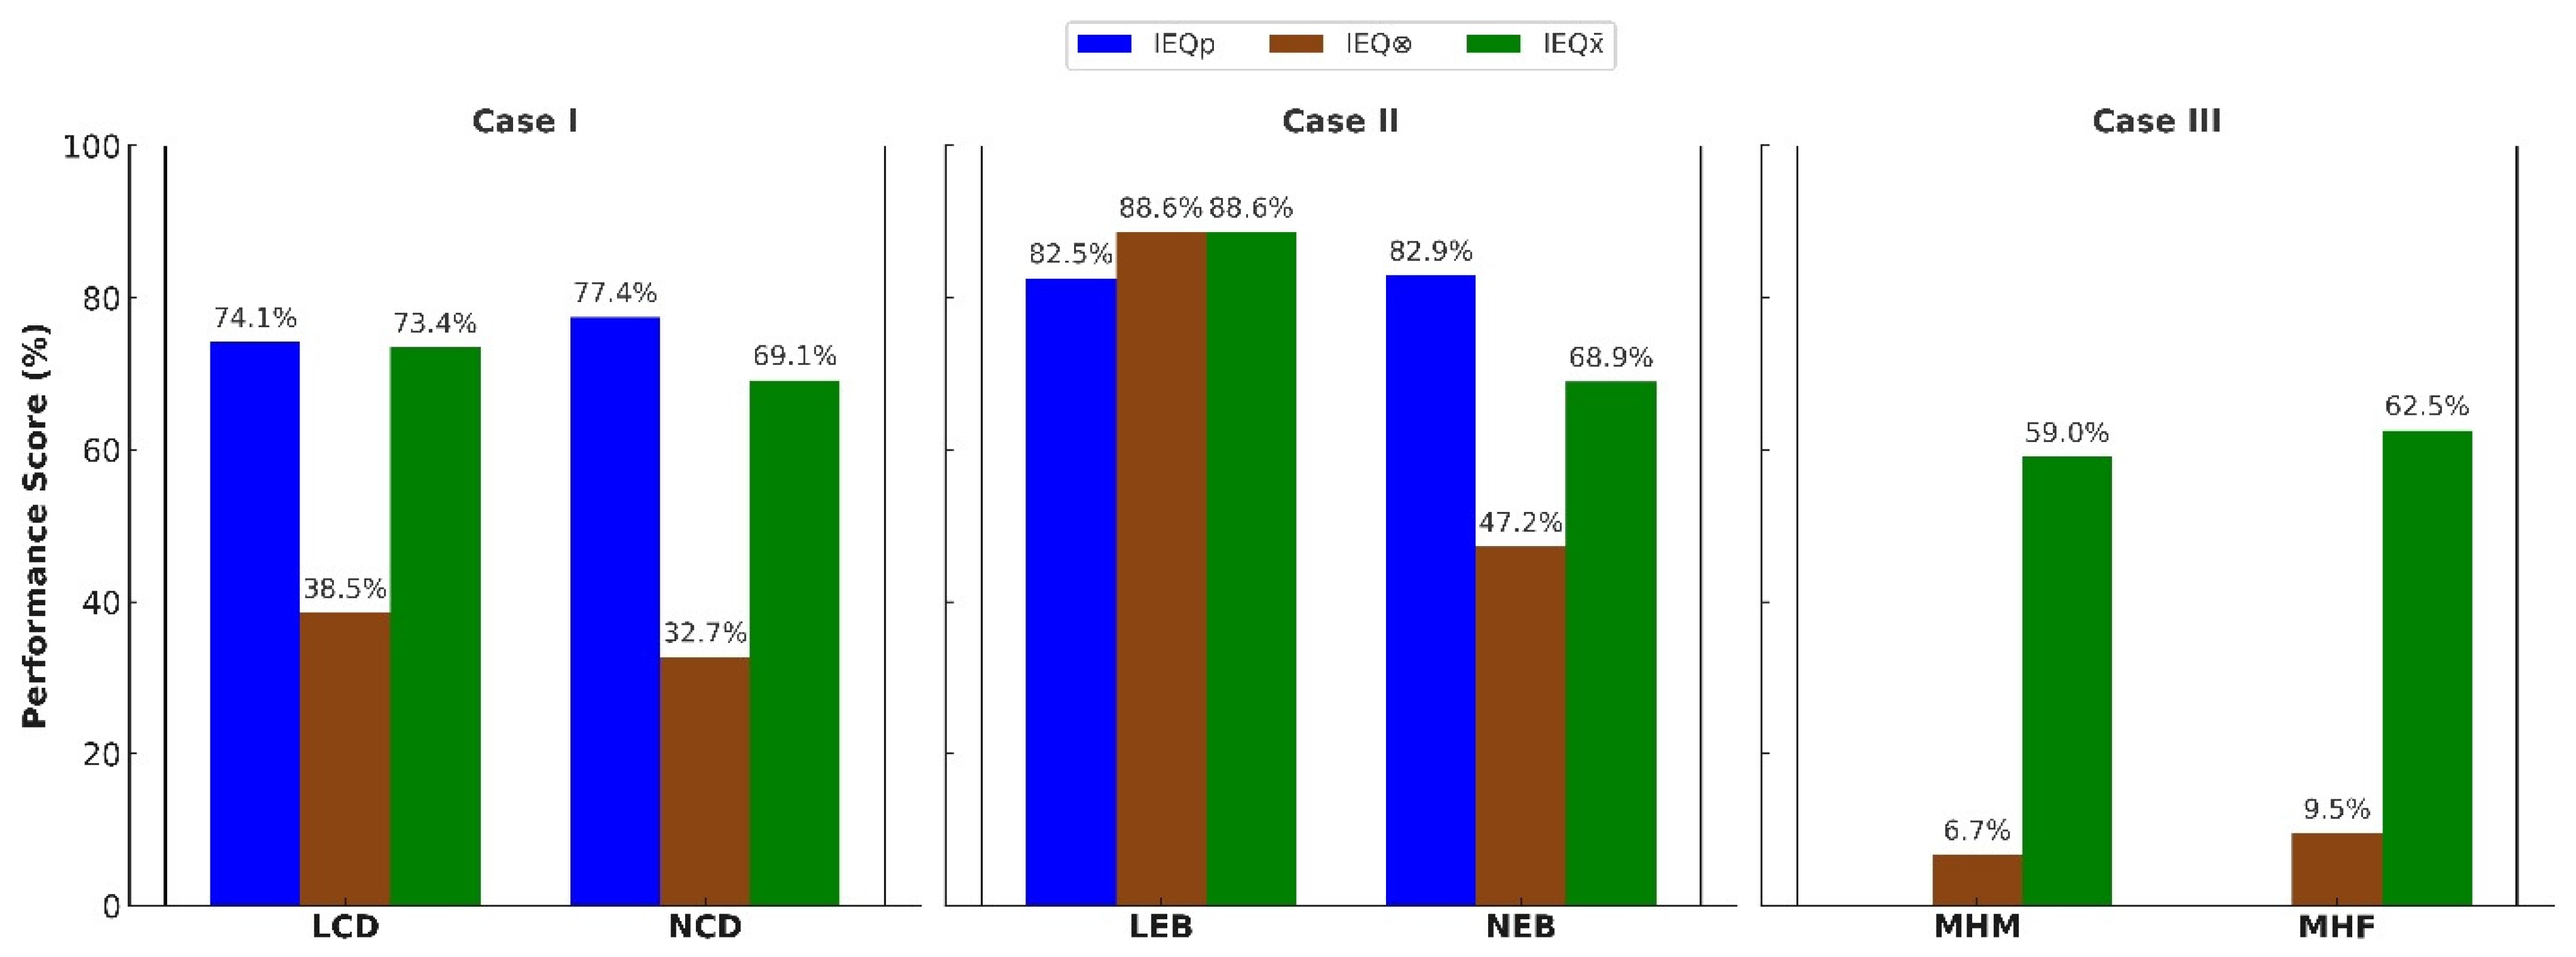
  • The subjective dimension (IEQp), derived from the overall mean response value (MRV) associated with survey questions on the four critical components (4CCs);
  • The objective dimension (IEQx), calculated using a protocol summarized in Equations (2)–(13), adapted from Mujan et al. [48].
As presented in Equations (2) and (3), thermal comfort (Tc) is derived from the PPD-PMV model, which predicts the average thermal sensation of a large group on a scale from −3 (cold) to +3 (hot), with −0.5 to +0.5 considered optimal [49]. While the Predicted Percentage Dissatisfied with the thermal environment (PPDTc) can be calculated using Equation (2), this study used the thermal comfort software developed by the Center for the Built Environment (CBE), compliant with the latest version of ASHRAE Standard 55 [50]. This software incorporates variables such as operative temperature, air velocity, clothing insulation, and metabolic rate.
P P D T c = 100 95 · e x p ( 0.03353 · P M V 4 0.2179 · P M V 2 )
T c = 100 P P D T c
For all cases, a fixed air velocity of 0.15 m/s was used.
  • For Case I (April–May), 0.5 clo was applied for dorm rooms and 0.54 clo for corridors during the cooling season, and 0.9 clo for the heating season (January–February), in line with field observations literature [51], and the mean seasonal air temperature was adopted as the operative temperature. Metabolic rates of 1.0 met and 1.2 met were used for dorm rooms and corridors, respectively, reflecting activities such as eating, reading, sitting, and sleeping in dorm rooms and fleeting standing and sitting in corridors [52].
  • In Case II, an average metabolic rate of 1.1 met was assumed for both heating and cooling seasons, reflecting typical activities such as sitting and relaxed standing in event buildings, consistent with ASHRAE Standard 55 [50]. Clothing insulation values of 0.57 clo and 0.9 clo were used for the cooling (March–April) and heating (November) seasons, respectively, based on existing recommendations [53,54].
  • For Case III, measured in the transition month of October, 0.75 clo was used, with metabolic rates of 1.0 met for bedrooms and 1.5 met for living rooms.
Applying the normalization steps in Equations (4)–(8), IAQ was assessed with a focus on three pollution indicators (Iz, where z = CO2, PM2.5, and formaldehyde [HCHO]), popular in several green building certification schemes. For these indicators, logarithmic performance scales were applied. For instance, an upper limit of 15,000 ppm was set for CO2, and log C C O 2 C a t m denotes the logarithmic ratio of indoor CO2 concentration (ppm) relative to the adopted outdoor reference concentration of 415 ppm.
I C O 2 = 100 70 · log C C O 2 C a t m
The U.S. EPA [55] noncancer reference concentration for long-term exposure—0.007 mg/m3 of HCHO—was adopted as the threshold for multifamily housing spaces and dorm rooms, as shown in Equation (5). For other spaces, the WHO [56] short-term exposure guideline of 0.1 mg/m3 was used as the permissible limit, as indicated in Equation (6). Here, C H C H O represents the measured formaldehyde concentration in mg/m3.
I H C H O = 0 , i f   C H C H O   0.007 100 118 · log C H C H O 0.001 , i f   C H C H O < 0.007
I H C H O = 0 , i f   C H C H O > 0.1 100 50 · log C H C H O 0.001 , i f   C H C H O 0.1
As indicated in Equation (7), where C P M 2.5 represents the concentration of particles <2.5 µm measured in μg/m3, values at or below 10 µg/m3—as recommended by the WHO [57]—were considered optimal for PM2.5, while values exceeding this threshold were adjusted using a logarithmic scale. For indicators measured across both seasons, seasonal averages were calculated and incorporated into the respective equations to ultimately derive the overall IAQ performance score, as shown in Equation (8).
I P M 2.5 = 100 , i f   C P M 2.5   10 100 85 · log C P M 2.5 10 , i f   C P M 2.5 > 10
I A Q = m e a n   I C O 2 , I H C H O , I P M 2.5
The predicted percentage dissatisfied with lighting conditions (PPDLc) was calculated using Equation (9), based on a regression model developed from reported case studies [58,59]. This model relates to illuminance (Lx) levels, with an assumed upper limit of 1400 lx. The resulting value was then subtracted from 100 to estimate the percentage of occupants satisfied with the lighting conditions in the building, according to Equation (10).
P P D L c = 100 1 + e x p ( 1.017 + 0.00558 · L x )
L c = 100 P P D L c
The predicted percentage dissatisfied with acoustic conditions (PPDAc) was calculated by determining the numerical difference between the actual and design sound levels (SLs) for the examined spaces, doubling the resulting value, and then subtracting this from 100 to estimate the percentage of occupants satisfied with the acoustic environment. Equations (11) and (12) are based on reported methods [48,60,61]. Following the ANSI S12.2 standard [62], a design sound level of 40 dB was used for multifamily housing units and dorm rooms, while 45 dB was applied for other spaces across cases.
P P D A c = 2 · A c t u a l   S L D e s i g n   S L
A c = 100 P P D A c
The objective indoor environmental quality, IEQx, was then calculated by averaging the performance scores of the 4CCs:
I E Q x = 0.25 · ( T c + I A Q + L c + A c )
The calculated values for thermal comfort, air quality, acoustic comfort, and lighting for all monitored spaces are presented in Appendix A (Table A1).
To further examine the effect of combination methods, IEQx was subdivided into two categories:
  • Mean-based combination (IEQ x ¯ );
  • Product-based combination (IEQ⮾).
Accounting for the n spaces evaluated in each building, according to Equations (14) and (15), respectively:
I E Q x ¯ = i = 1 n I E Q x i n
I E Q = i = 1 n I E Q x i

2.2.2. Energy Utility Quality Models

In Louisiana and similar regions across the United States, historical data and climate model projections consistently show that substantially more energy—and, therefore, more money—is consumed in both residential and commercial buildings during the cooling season to meet indoor comfort demands [63,64,65,66]. This pattern is largely driven by the long, hot, and humid summers, in contrast to the shorter, milder winters of the heating season. As a result, a building can be considered energy-efficient when its average energy consumption during the heating season is lower than during the cooling season.
In the United States, EUI remains the primary metric for assessing energy performance and is typically benchmarked against standards such as the U.S. Commercial Buildings Energy Consumption Survey (CBECS) [67]. The CBECS survey provides comprehensive data on building characteristics and energy usage to evaluate efficiency. However, additional metrics that account for regional diversity are essential for more equitable and accurate assessments.
Thus, this study is the first to apply a two-dimensional energy utility quality (EUQ) metric derived from EUI to gauge building energy performance. These two dimensions are as follows:
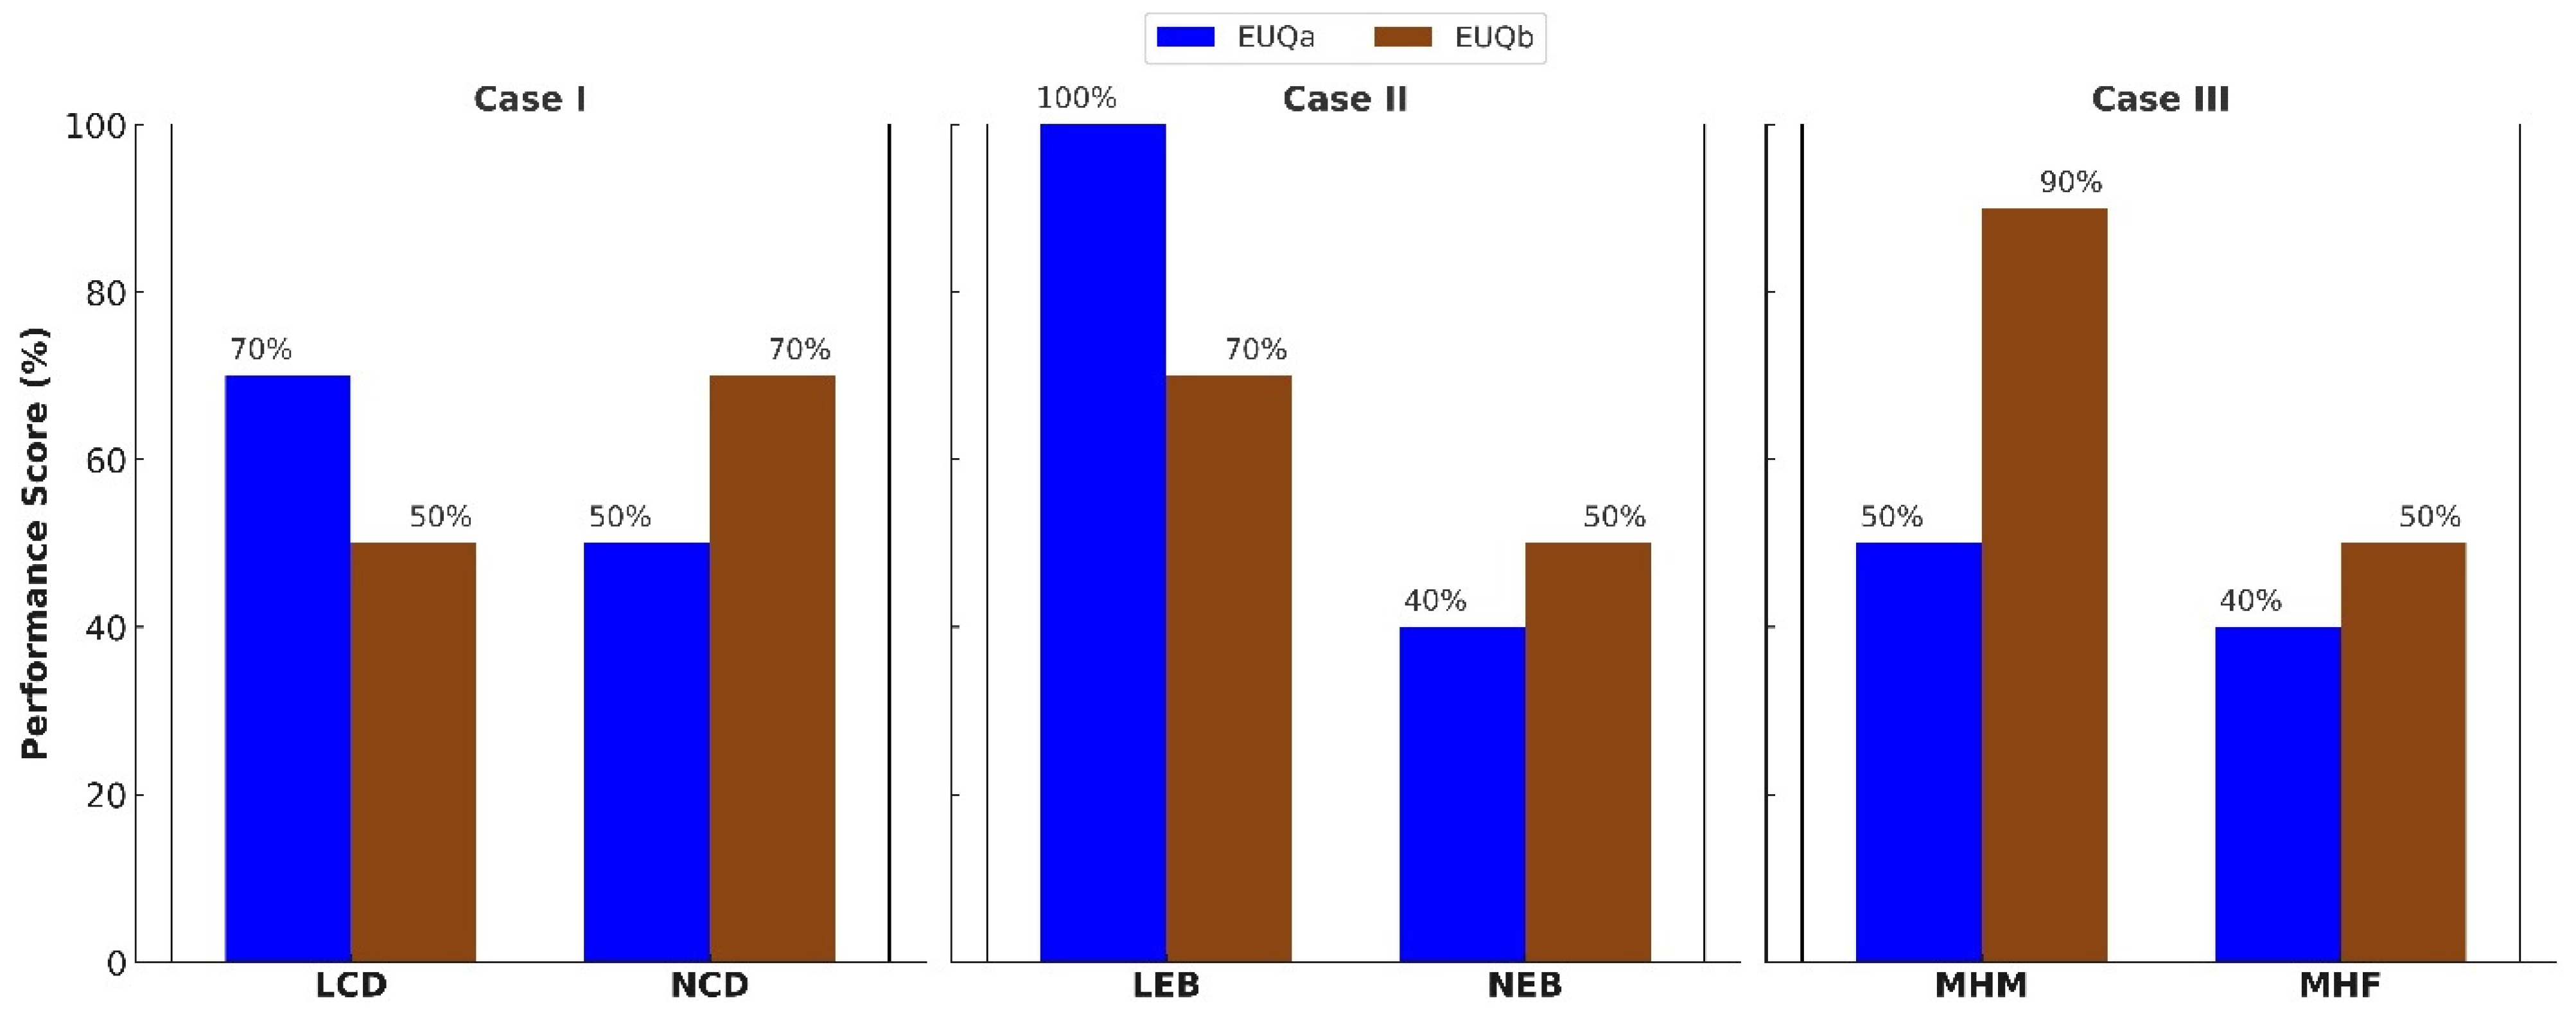
  • EUQa: a seasonal comparison metric;
  • EUQb: a benchmark-based deviation metric.
EUQa is computed using Equation (16), where E H S and E C S represent the average EUI for the heating and cooling seasons, respectively.
E U Q a = E H S E C S E C S × 100 %
Positive EUQa values indicate higher EUI during the heating season compared to the cooling season, suggesting inefficiency. Negative values suggest better efficiency during the heating season and potentially higher climate resilience. A quasi-neutral range, defined as −4.9% to +4.9%, reflects balanced seasonal energy use.
EUQb, the benchmark-based EUQ, is calculated as the numerical deviation of a building’s annual EUI from its adopted benchmark, according to Equation (17).
E U Q b = E U I b u i l d i n g   E U I b e n c h m a r k E U I b e n c h m a r k × 100 %
For this study,
  • Case I reference benchmark = 57.9 kBTU/sqft (or 16.97 kWh/sqft);
  • Case II reference benchmark = 56.2 kBTU/sqft (or 16.47 kWh/sqft);
  • Case III reference benchmark = 59.6 kBTU/sqft (or 17.47 kWh/sqft).
  • These cases are based on the CBECS database for buildings with comparable functions. Positive EUQb values indicate that the building consumes more energy than the benchmark (relative inefficiency), whereas negative values indicate relative efficiency. A quasi-neutral range is defined as ±9.9% deviation from the benchmark.
EUQ Scoring System
Following preliminary consultations with building science and environmental policy experts—whose combined professional experience spans approximately 40 years—a scoring scale was developed to classify EUQ results, as shown in Table 2. This scale covers a continuum from extreme inefficiency to extreme efficiency, with higher efficiency levels aligning with the performance of top-rated certified green buildings [12,68,69].

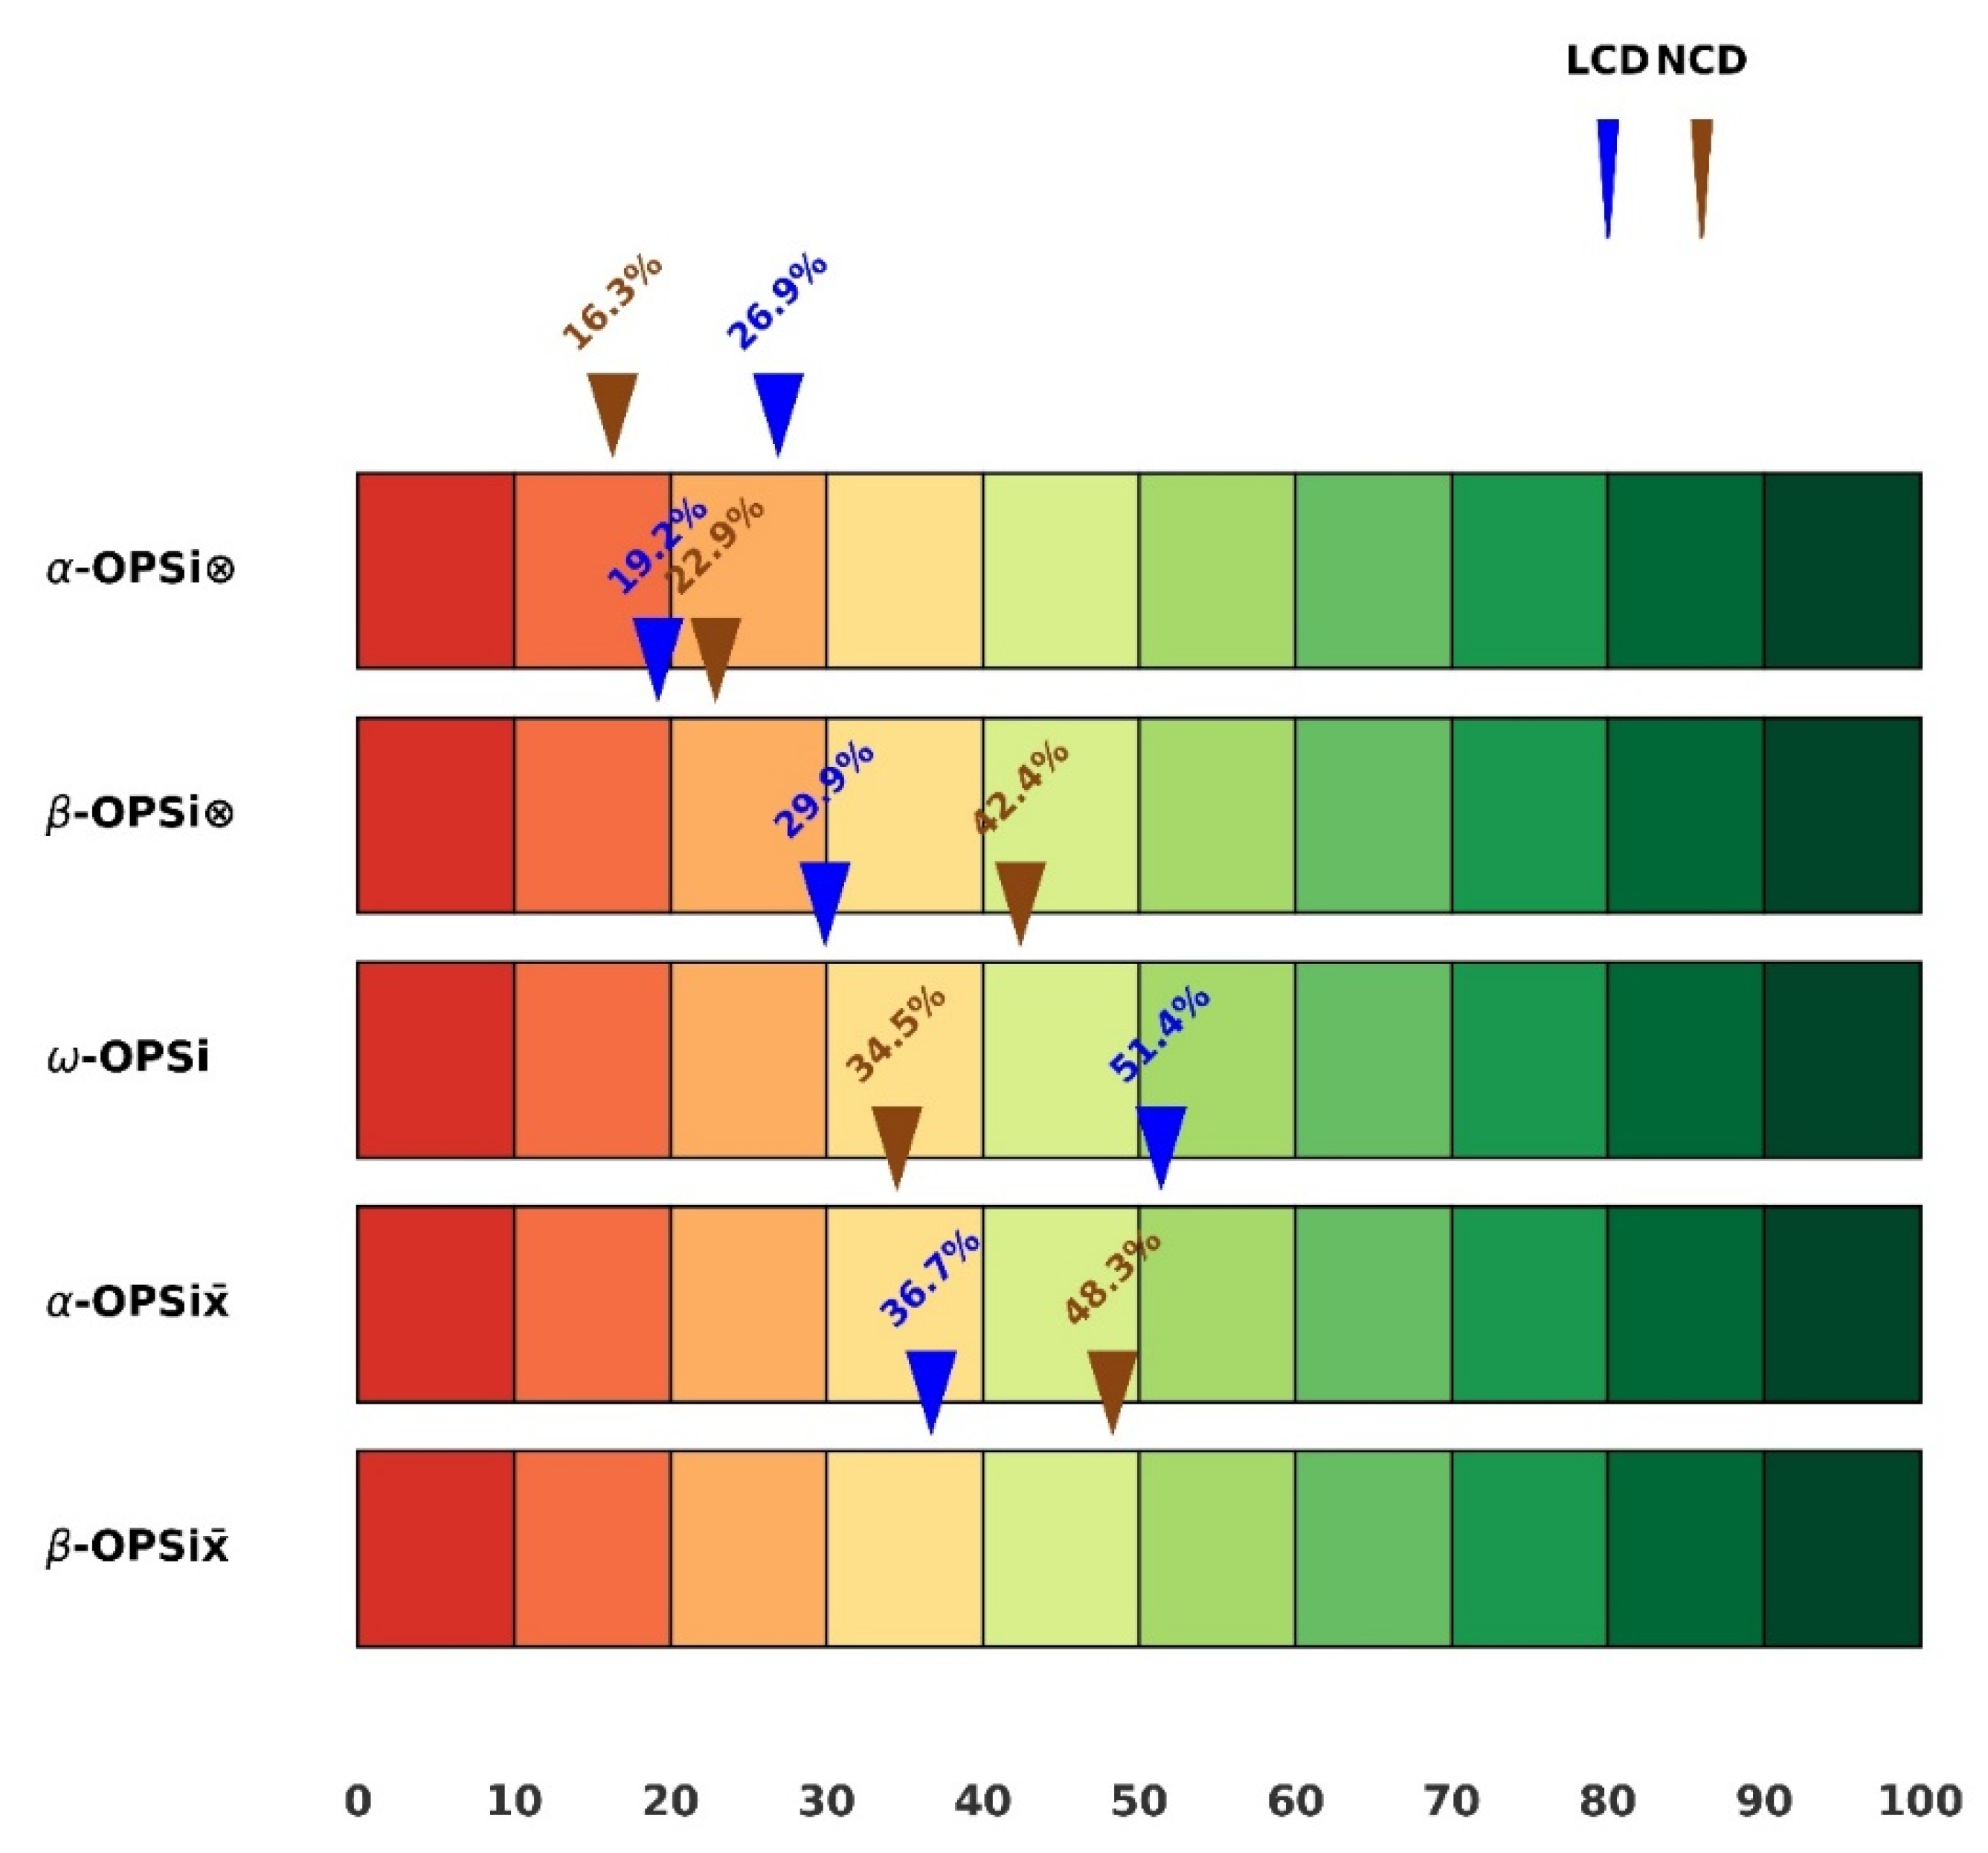
2.2.3. Variants of OPSi

The OPSi metric consists of five variants, including one subjective and four objective formulations. The subjective operational sustainability index (ω-OPSi) is calculated as the product of the subjective IEQ score (IEQp) and the percentage mean response values for energy usage satisfaction (MRVEUS) and energy cost satisfaction (MRVECS), as presented in Equation (18):
ω O P S i = I E Q p × M R V E U S × M R V E C S
The combined MRVs can be interpreted as a perceptive valuation of EUQ. The importance of ω-OPSi lies in its ability to incorporate the perceptions of building stakeholders, ensuring their views on building performance are considered alongside—or even in the absence of—the objective OPSi variants. In essence, ω-OPSi serves as the “human sensor” for evaluating whole-building operational performance.
The first objective OPSi variant is α-OPSi⮾, defined as:
α O P S i = E U Q a × I E Q
The second variant is β-OPSi⮾, expressed as:
β O P S i = E U Q b × I E Q
The third variant is α-OPSi x ¯ , defined as:
α O P S i x ¯ = E U Q a × I E Q x ¯
The fourth and final objective variant is β-OPSi x ¯ , calculated as:
β O P S i x ¯ = E U Q b × I E Q x ¯
Together, these four objective variants enable a comprehensive assessment of building performance by integrating performance scores from the EUQ and IEQx dimensions using different aggregation strategies. To facilitate interpretation—particularly for the IEQ and OPSi performance metrics—a tiered evaluation system was employed to categorize performance scores into three levels:
  • Super-Optimal: 95% < Performance ≤ 100%;
  • Optimal: 75% < Performance ≤ 95%;
  • Suboptimal: 0% ≤ Performance ≤ 75%.

3. Results

3.1. Indoor Environmental Quality

Figure 4 presents the comparative performance of the studied buildings across multiple metrics. In Case I, the subjective IEQ score (IEQp) was 74.1% for LCD and 77.4% for NCD. However, the product-based objective score (IEQ⮾) was lower, at 38.5% for LCD and 32.7% for NCD. For the mean-based objective score (IEQ x ¯ ), LCD achieved 73.4%, while NCD recorded 69.1%.
In Case II, LEB was slightly outperformed by NEB in IEQp, with the former at 82.5% and the latter at 82.9%. However, LEB surpassed NEB in both IEQ⮾ and IEQ x ¯ , maintaining a consistent 88.6% in both metrics. For Case III, the multifamily housing occupied by males (MHM) and females (MHF) showed low IEQ⮾ scores, both below 10%, although MHF slightly outperformed MHM. Regarding IEQ x ¯ , MHF again outperformed MHM, achieving 62.5% compared to 59.0% attained by MHM.
Overall, the non-certified dormitory attained an optimal IEQp rating, outperforming its LEED-certified counterpart. Both NEB and LEB attained optimal IEQp ratings; however, across all buildings, only LEB reached an optimal level in both IEQ⮾ and IEQ x ¯ , with the others classified as suboptimal.
In regression analysis, key predictors of occupant satisfaction varied across cases. For LCD, artificial lighting emerged as the strongest positive predictor of overall experience satisfaction (p = 0.006) within a model explaining 63.5% of the variance (R2 = 63.5%), alongside temperature and IAQ as significant factors (p < 0.05). In contrast, for NCD, acoustics was the sole significant predictor (p = 0.012)—with a model fit of R2 = 64.5%—despite having only borderline significance in LCD (p = 0.071).
For LEB, the MLR model performed poorly, explaining only 2.1% of the variance (R2 = 2.1%), with none of the IEQ components significantly influencing overall satisfaction; notably, lighting and air quality showed negative correlation coefficients. For NEB, only temperature had a statistically significant positive effect on overall satisfaction (p = 0.019), with the model explaining 43.5% of the variance (R2 = 43.5%).

3.2. Energy Performance

Variations in monthly EUI for the case study buildings are presented in Figure 5, Figure 6 and Figure 7, revealing key trends: monthly EUI in LCD was often higher than in NCD; monthly EUI in LEB was consistently lower than in NEB; and monthly EUI in MHF was typically higher than in MHM. Interestingly, the two dormitories showed a reversal in their EUQa and EUQb outcomes, as illustrated in Figure 8, which also includes results for the other cases. For LCD, a quasi-neutral performance was recorded for EUQb, indicating that its EUI was within a ±10% deviation from the benchmark. In contrast, NCD achieved a 70% score in EUQb, signaling an efficient performance. However, for EUQa, NCD exhibited a measurement deviation of −1.8% (i.e., quasi-neutral), indicating that the heating season EUI was slightly lower than the cooling season EUI.
Meanwhile, LEB outperformed NEB in both EUQa and EUQb, achieving an extremely efficient rating in EUQa and an efficient rating in EUQb. NEB, on the other hand, was either quasi-neutral or slightly inefficient across both energy metrics. A similar pattern was observed for MHF, while MHM outperformed MHF by achieving a quasi-neutral EUQa and a highly efficient EUQb, indicating that the EUI for MHM was at least 50% lower than the benchmark.

3.3. Operational Sustainability Index

Different dimensions of the OPSi metric and corresponding scores for comparable building types are presented in Figure 9, Figure 10 and Figure 11. For the dormitory buildings, all derived scores were below 50%, except for LCD in terms of α-OPSi x ¯ . While overall performance scores were generally low, LCD outperformed NCD in two dimensions: α-OPSi⮾ and α-OPSi x ¯ . Meanwhile, ω-OPSi generally achieved higher values compared to the α- and β-OPSi⮾ variants but lower scores compared to the α- and β-OPSi x ¯ metrics.
Contrastingly, for the event buildings, ω-OPSi scores were lower than the other (non-subjective) OPSi variants. However, LEB consistently outperformed NEB across all dimensions, achieving its highest performance score at 88.6% for α-OPSi⮾ and α-OPSi x ¯ , thus reaching an optimal α-OPSi performance. Similar to the results in the dormitory building case, only one OPSi score exceeded 50%, with MHM recording 53.1% for β-OPSi x ¯ . Generally, MHM outperformed MHF across the various OPSi dimensions, except in α-OPSi⮾, where both recorded values below 5%.

4. Discussion

4.1. Discussion of Results

Overall, the results demonstrate the impact of adjusting metric combinations as well as the nuances between subjectivity-oriented and objectivity-oriented indices. For example, the satisfaction levels reported by occupants in LEED-certified buildings were lower than those in non-certified counterparts, even though the physical measurements of environmental variables suggested otherwise. This contrasts with the findings of Vosoughkhosravi et al. [22], which reported superior subjective IEQ in LEED-certified dormitories. Moreover, the presence of negative coefficients and non-significant p-values underscores a drawback of integrating objective IEQ models using MLR-derived coefficients, as this approach may eliminate or undervalue IEQ variables that ideally should be considered together to capture composite IEQ.
Acoustic comfort and IAQ emerged as the most common factors negatively influencing objective IEQ scores in dormitories, while lighting was the primary issue in multifamily housing, and acoustic comfort again stood out in event buildings. Importantly, IEQ⮾ scores were consistently lower than IEQ x ¯ scores, reflecting that product-based integration of spatial IEQ performance is a more stringent approach than mean-based aggregation. The identical performance scores for LEB in both IEQ⮾ and IEQ x ¯ , as well as in the pairs of α- and β-OPSi variants, highlight the challenge of comparing buildings with unequal numbers of measured spaces. For example, only one space was measured in LEB, whereas two were measured in NEB. This reinforces the need for future studies to adopt “apples-to-apples” comparisons between buildings—comparing the same number and type of spaces across cases to improve the fairness and generalizability of OPSi assessments.
The ω-OPSi metric offers valuable insights into how building stakeholders perceive energy usage and cost. For instance, occupants may report lower satisfaction in buildings with higher energy use, even when those buildings have greater operational capacity. While such biases are understandable from a residential occupant’s perspective, facility managers—particularly those overseeing and comparing multiple buildings—should assess satisfaction with a focus on EUI rather than raw energy use. Moreover, since cost dissatisfaction can stem from inflation or utility market fluctuations, these external factors should be carefully considered when interpreting survey responses.
The EUQa scores suggest that LEED-certified buildings demonstrated better climate resilience than their non-certified counterparts. To further advance sustainability and climate resilience, practical measures are recommended. These include adopting programmable or smart thermostats, installing dynamic window systems such as electrochromic glazing (which can reduce peak energy demand by 20–30% and save nearly 20% in primary energy) [70,71], or thermochromic glazing to control solar heat gain [72]. Additional strategies such as soundproofing and noise-canceling technologies can help reduce HVAC-related noise while improving ventilation and reducing exposure to materials that emit formaldehyde (such as certain building materials, cosmetics, laundry products, or unvented appliances) are also essential.
The importance of retrofitting with LED lighting, especially in housing units lacking this feature, cannot be overstated. Although payback periods vary, LED upgrades have consistently proven to enhance energy efficiency and operational sustainability [73]. Given that HVAC systems are typically the most energy-intensive in humid subtropical climates like Baton Rouge, educating building occupants on optimal thermostat settings during occupancy, non-occupancy, and peak seasons is critical. Smart thermostats, as an advanced option, are strongly recommended across all case study buildings, along with routine inspection and maintenance of HVAC systems.
Findings related to MHM and MHF also open an important research avenue: exploring how apartment units occupied by different genders may vary in terms of climate resilience and energy efficiency. This study further lays the groundwork for debating whether EUQa or EUQb is a fairer metric for assessing energy performance. EUQa is particularly meaningful when researchers account for historical climate data and projections, making it adaptable across climates. EUQb, by contrast, offers a more generalized metric, though weather normalization should be applied when using cross-regional benchmarks.
Despite the important contributions of this study, several limitations should be acknowledged. These include the use of a fixed, though practical, air velocity value; the lack of occupant survey data and cross-seasonal environmental measurements in the multifamily housing cases; the non-uniform sample sizes across similar building comparisons; and the inability to conduct environmental monitoring campaigns in all dorm rooms.

4.2. Implications for Policy and Practice

This study highlights the importance of conducting fair building type comparisons and underscores the need for future applications to extend the OPSi framework to other building types, including office buildings. The multidimensional OPSi metric offers policymakers, particularly those in the green building sector, a flexible tool to select the most appropriate dimension for their context—whether they require a more stringent or a more adaptable performance indicator. Importantly, this work addresses one of the major criticisms of green certification systems: the lack of reliable methods to gauge the operational sustainability of buildings post-certification. By offering a clear and practical framework, this study provides both the concept and the means to fill that gap.
Insights derived from the OPSi framework may also inform and enhance the metrology of existing building operation tools such as LEED O+M, particularly by integrating more frequent, occupant-centered, and multidimensional assessments into post-certification performance tracking.
Moreover, adopting expensive green certifications may not be necessary to achieve operational sustainability. City governments, through education, incentives, institutional support, and regulatory enforcement, could promote the use of affordable OPSi-based certifications, making sustainability goals more accessible and scalable.
While future research should aim to apply the OPSi metric across larger building samples and varied contexts, there is also an opportunity for innovation on the technological front. Engineers are encouraged to develop multifunctional sensor systems capable of assessing objective IEQ across multiple building zones. Ideally, these systems would be integrated with smart meters to track EUQa and EUQb and connect to a cloud-based dashboard (see Figure 12 for example of dashboard elements). Such a dashboard could allow users to compare their building’s OPSi performance with that of others locally, nationally, or even globally on an annual or biannual basis. A complementary tax credit system that rewards high-performing buildings could further strengthen the appeal and impact of such a system. Additionally, quarterly surveys of subjective IEQ satisfaction, especially in high-density buildings, are recommended to capture dynamic occupant feedback.
It is also critical that dashboard results highlight the specific factors contributing to lower IEQ scores and the months contributing to poor EUQ performance. This level of transparency would empower building owners and occupants to make informed, targeted decisions on cost-effective improvements.
However, the implementation of an integrated smart device system will face challenges, including costs, deployment logistics, and decisions on sensor placement—for example, determining optimal installation zones and heights within a building and ensuring consistent measurement angles when comparing OPSi scores across similar buildings. Furthermore, if OPSi metrics are to be used for cross-country or cross-continental benchmarking, sensor equipment must comply with standardized industry specifications, ensuring equivalent detectability and resolution.
Furthermore, while water efficiency remains an important pillar of sustainability, integrating it meaningfully into the OPSi framework presents challenges. Instead, future developments might consider incorporating basic water quality monitoring—for example, testing for lead (Pb) or coliform bacteria—to provide an added dimension of building health and performance.
Although this study does not directly calculate carbon emissions or lifecycle impacts, the OPSi framework provides a foundation for integrating such parameters in future research. For instance, EUI values can serve as effective proxies for operational carbon intensity in regions with standardized energy sources. Future OPSi variants could incorporate carbon tracking modules, ISO-aligned facilities management practices, or building maintenance records (e.g., service life estimates, repair cycles) to enrich sustainability insights. Additionally, applying OPSi at the city scale may offer innovative tools for benchmarking progress toward low-carbon urban development, helping policymakers evaluate not just green certification but real-world performance in achieving climate goals.

5. Conclusions

Through a series of methodological approaches, this study developed and demonstrated the operational sustainability index (OPSi)—a multidimensional tool for holistically evaluating the operational performance of buildings. By incorporating multiple aggregation methods and combining both objective and subjective inputs, OPSi offers flexibility for researchers, policymakers, and practitioners to adapt the framework based on building type, climate context, and data availability.
The framework holds practical value for the green building certification industry, city governments, and engineers, offering an adaptable mechanism to complement or enhance existing operational tools such as LEED O+M. Notably, OPSi provides insights into user experience, energy performance, and climate resilience—critical themes for promoting sustainable development in urban environments.
While promising, OPSi’s current application is limited by its exclusion of water use, embodied carbon, and lifecycle maintenance metrics. These areas represent important frontiers for future integration. Expanding OPSi to incorporate carbon life cycle assessment (LCA), ISO-aligned maintenance strategies, and metrics relevant to the Sustainable Development Goals (SDGs) would further strengthen its role in advancing low-carbon, resource-efficient cities.
Overall, this work contributes significantly to the growing field of operational sustainability assessment in the built environment and offers a solid foundation for future enhancements that align building operations with broader environmental sustainability objectives.

Author Contributions

O.A.: conceptualization; data curation; formal analysis; investigation; methodology; software; validation; visualization; writing—original draft; writing—review and editing; project administration. M.R.: writing—review and editing; supervision. All authors have read and agreed to the published version of the manuscript.

Funding

This research received no external funding.

Institutional Review Board Statement

Ethical approval for the involvement of human subjects in this study was granted by Louisiana State University Institutional Review Board, Reference number IRBAM-23-0856, on 30 August 2023, with no expiration date.

Data Availability Statement

All data associated with the study will be made available upon reasonable request.

Acknowledgments

Special appreciation is extended to all building stakeholders in Baton Rouge whose voluntary assistance, support, and feedback were instrumental to the success of this study.

Conflicts of Interest

The authors declare no conflict of interest.

Appendix A

Table A1. Summary of calculated 4CC values for all monitored spaces.
Case Building/SpaceThermal Comfort (Tc)Indoor Air Quality (IAQ)Acoustic Comfort (Ac)Lighting Comfort (Lc)
LCD—Room 140.0%74.1%89.0%79.1%
LCD—Room 266.7%56.6%52.8%75.2%
LCD—Corridor82.2%88.9%93.4%82.7%
NCD—Room 184.4%59.7%71.2%89.6%
NCD—Room 287.1%60.6%29.4%82.5%
NCD—Corridor69.2%68.1%67.8%59.2%
LEB—Auditorium87.2%93.7%82.0%91.5%
NEB—Lobby76.9%91.3%37.4%48.3%
NEB—Conference Room85.1%87.6%65.4%59.1%
MHM—Bedroom 175.0%47.4%100%29.8%
MHM—Bedroom 248.0%59.2%86.4%36.6%
MHM—Bedroom 344.0%50.1%100%31.0%
MHM—Bedroom 434.0%42.7%57.2%40.9%
MHM—Living Room89.0%68.6%93.2%41.4%
MHF—Bedroom 186.0%58.5%74.0%29.1%
MHF—Bedroom 287.0%52.2%87.0%37.5%
MHF—Bedroom 381.0%55.8%61.0%31.7%
MHF—Bedroom 470.0%57.4%90.6%36.0%
MHF—Living Room84.0%61.0%74.4%36.1%

References

  1. Xu, A.; Zhu, Y.; Wang, Z. Carbon emission evaluation of eight different prefabricated components during the materialization stage. J. Build. Eng. 2024, 89, 109262. [Google Scholar] [CrossRef]
  2. Khan, F.A.; Ullah, Z.; Aashan, M.; Ahmad, F.; Saad, M.; Azhar, M. Life cycle assessment and energy efficiency of building façade materials: A case study of an educational building in Pakistan. J. Eng. 2025, 2025, e70047. [Google Scholar] [CrossRef]
  3. Akbarnezhad, A.; Xiao, J. Estimation and minimization of embodied carbon of buildings: A review. Buildings 2017, 7, 5. [Google Scholar] [CrossRef]
  4. Fenner, A.E.; Kibert, C.J.; Woo, J.; Morque, S.; Razkenari, M.; Hakim, H.; Lu, X. The carbon footprint of buildings: A review of methodologies and applications. Renew. Sustain. Energy Rev. 2018, 94, 1142–1152. [Google Scholar] [CrossRef]
  5. Labaran, Y.H.; Mathur, V.S.; Muhammad, S.U.; Musa, A.A. Carbon footprint management: A review of construction industry. Clean. Eng. Technol. 2022, 9, 100531. [Google Scholar] [CrossRef]
  6. Leite Ribeiro, L.M.; Piccinini Scolaro, T.; Ghisi, E. LEED Certification in Building Energy Efficiency: A Review of Its Performance Efficacy and Global Applicability. Sustainability 2025, 17, 1876. [Google Scholar] [CrossRef]
  7. Weigert, K.; Koolbeck, M. Building Urban Futures, September 2018. Available online: https://globalaffairs.org/sites/default/files/2020-11/report_City-Carbon%20Actions-Anchored-in-Building-Codes-and-Standards_2018-09-25.pdf (accessed on 23 March 2025).
  8. Awolesi, O.; Reams, M. Green building development in the US capitals: A focused comparative analysis with Baton Rouge. Urban. Sustain. Soc. 2024, 1, 133–168. [Google Scholar] [CrossRef]
  9. NIBS. Green Building Standards and Certification Systems. Available online: https://www.wbdg.org/resources/green-building-standards-and-certification-systems (accessed on 13 April 2025).
  10. Uğur, L.O.; Leblebici, N. An examination of the LEED green building certification system in terms of construction costs. Renew. Sustain. Energy Rev. 2018, 81, 1476–1483. [Google Scholar] [CrossRef]
  11. Mazutis, D.; Sweet, L. The business of accelerating sustainable urban development: A systematic review and synthesis. J. Clean. Prod. 2022, 357, 131871. [Google Scholar] [CrossRef]
  12. Amiri, A.; Ottelin, J.; Sorvari, J. Are LEED-Certified Buildings Energy-Efficient in Practice? Sustainability 2019, 11, 1672. [Google Scholar] [CrossRef]
  13. Bernardi, E.; Carlucci, S.; Cornaro, C.; Bohne, R.A. An analysis of the most adopted rating systems for assessing the environmental impact of buildings. Sustainability 2017, 9, 1226. [Google Scholar] [CrossRef]
  14. Zhang, Y.; Wang, H.; Gao, W.; Wang, F.; Zhou, N.; Kammen, D.M.; Ying, X. A survey of the status and challenges of green building development in various countries. Sustainability 2019, 11, 5385. [Google Scholar] [CrossRef]
  15. USGBC. LEED Certification for Existing Buildings and Spaces. Available online: https://www.usgbc.org/leed/rating-systems/existing-buildings (accessed on 6 June 2025).
  16. EnergyStar.gov. Green Buildings and ENERGY STAR. Available online: https://www.energystar.gov/buildings/about-us/green-buildings-and-energy-star (accessed on 13 April 2025).
  17. Vine, E.; Barnes, B.; Ritschard, R. Implementing home energy rating systems. Energy 1988, 13, 401–411. [Google Scholar] [CrossRef]
  18. Clay, K.; Severnini, E.; Sun, X. Does LEED certification save energy? Evidence from retrofitted federal buildings. J. Environ. Econ. Manag. 2023, 121, 102866. [Google Scholar] [CrossRef]
  19. No, S.; Won, C. Comparative analysis of energy consumption between green building certified and non-certified buildings in Korea. Energies 2020, 13, 1049. [Google Scholar] [CrossRef]
  20. Issa, M.H.; Attalla, M.; Rankin, J.H.; Christian, A.J. Energy consumption in conventional, energy-retrofitted and green LEED Toronto schools. Constr. Manag. Econ. 2011, 29, 383–395. [Google Scholar] [CrossRef]
  21. Newsham, G.R.; Mancini, S.; Birt, B.J. Do LEED-certified buildings save energy? Yes, but…. Energy Build. 2009, 41, 897–905. [Google Scholar] [CrossRef]
  22. Vosoughkhosravi, S.; Dixon-Grasso, L.; Jafari, A. The impact of LEED certification on energy performance and occupant satisfaction: A case study of residential college buildings. J. Build. Eng. 2022, 59, 105097. [Google Scholar] [CrossRef]
  23. Heinzerling, D.; Schiavon, S.; Webster, T.; Arens, E. Indoor environmental quality assessment models: A literature review and a proposed weighting and classification scheme. Build. Environ. 2013, 70, 210–222. [Google Scholar] [CrossRef]
  24. Zhang, D.; Mui, K.-W.; Wong, L.-T. Ten Questions Concerning Indoor Environmental Quality (IEQ) Models: The Development and Applications. Appl. Sci. 2023, 13, 3343. [Google Scholar] [CrossRef]
  25. Leccese, F.; Rocca, M.; Salvadori, G.; Belloni, E.; Buratti, C. A multicriteria method to identify and rank IEQ criticalities: Measurements and applications for existing school buildings. Energy Built Environ. 2023, 6, 387–401. [Google Scholar] [CrossRef]
  26. Quesada-Molina, F.; Astudillo-Cordero, S. Indoor Environmental Quality Assessment Model (IEQ) for Houses. Sustainability 2023, 15, 1276. [Google Scholar] [CrossRef]
  27. Roumi, S.; Zhang, F.; Stewart, R.A.; Santamouris, M. Commercial building indoor environmental quality models: A critical review. Energy Build. 2022, 263, 112033. [Google Scholar] [CrossRef]
  28. Leccese, F.; Rocca, M.; Salvadori, G.; Belloni, E.; Buratti, C. Towards a holistic approach to indoor environmental quality assessment: Weighting schemes to combine effects of multiple environmental factors. Energy Build. 2021, 245, 111056. [Google Scholar] [CrossRef]
  29. Piasecki, M.; Kostyrko, K.; Pykacz, S. Indoor environmental quality assessment: Part 1: Choice of the indoor environmental quality sub-component models. J. Build. Phys. 2017, 41, 264–289. [Google Scholar] [CrossRef]
  30. Tang, H.; Ding, Y.; Singer, B. Interactions and comprehensive effect of indoor environmental quality factors on occupant satisfaction. Build. Environ. 2020, 167, 106462. [Google Scholar] [CrossRef]
  31. Tang, H.; Liu, X.; Geng, Y.; Lin, B.; Ding, Y. Assessing the perception of overall indoor environmental quality: Model validation and interpretation. Energy Build. 2022, 259, 111870. [Google Scholar] [CrossRef]
  32. Wang, L.; Zheng, D. Integrated analysis of energy, indoor environment, and occupant satisfaction in green buildings using real-time monitoring data and on-site investigation. Build Env. 2020, 182, 107014. [Google Scholar] [CrossRef]
  33. Jain, N.; Burman, E.; Robertson, C.; Stamp, S.; Shrubsole, C.; Aletta, F.; Barrett, E.; Oberman, T.; Kang, J.; Raynham, P.; et al. Building performance evaluation: Balancing energy and indoor environmental quality in a UK school building. Build. Serv. Eng. Res. Technol. 2019, 41, 343–360. [Google Scholar] [CrossRef]
  34. Huh, S.-Y.; Woo, J.; Lim, S.; Lee, Y.-G.; Kim, C.S. What do customers want from improved residential electricity services? Evidence from a choice experiment. Energy Policy 2015, 85, 410–420. [Google Scholar] [CrossRef]
  35. Agha-Hossein, M.M.; El-Jouzi, S.; Elmualim, A.A.; Ellis, J.; Williams, M. Post-occupancy studies of an office environment: Energy performance and occupants’ satisfaction. Build. Environ. 2013, 69, 121–130. [Google Scholar] [CrossRef]
  36. Muianga, E.A.D.; KnatzKowaltowski, D.C.C.; Silva, V.G.d.; Granja, A.D.; Moreira, D.d.C.; Ruschel, R.C. Housing transformations and their impacts on the well-being of dwellers. Ambiente Construído 2022, 22, 255–274. [Google Scholar] [CrossRef]
  37. Al-Obaidi, K.M.; Hossain, M.; Alduais, N.A.; Al-Duais, H.S.; Omrany, H.; Ghaffarianhoseini, A. A review of using IoT for energy efficient buildings and cities: A built environment perspective. Energies 2022, 15, 5991. [Google Scholar] [CrossRef]
  38. Norouziasl, S.; Jafari, A.; Zhu, Y. Modeling and simulation of energy-related human-building interaction: A systematic review. J. Build. Eng. 2021, 44, 102928. [Google Scholar] [CrossRef]
  39. Roumi, S.; Zhang, F.; Stewart, R.A.; Santamouris, M. Indoor environment quality effects on occupant satisfaction and energy consumption: Empirical evidence from subtropical offices. Energy Build. 2024, 303, 113784. [Google Scholar] [CrossRef]
  40. Geng, Y.; Lin, B.; Zhu, Y. Comparative study on indoor environmental quality of green office buildings with different levels of energy use intensity. Build. Environ. 2020, 168, 106482. [Google Scholar] [CrossRef]
  41. Zhou, Y.; Cai, J.; Xu, Y. Indoor environmental quality and energy use evaluation of a three-star green office building in China with field study. J. Build. Phys. 2021, 45, 209–235. [Google Scholar] [CrossRef]
  42. Sun, Y.; Kojima, S.; Nakaohkubo, K.; Zhao, J.; Ni, S. Analysis and Evaluation of Indoor Environment, Occupant Satisfaction, and Energy Consumption in General Hospital in China. Buildings 2023, 13, 1675. [Google Scholar] [CrossRef]
  43. Perera, I.; Hewage, K.; Rana, A.; Sadiq, R. Combining Energy Performance and Indoor Environmental Quality (IEQ) in Buildings: A Systematic Review on Common IEQ Guidelines and Energy Codes in North America. Energies 2025, 18, 1740. [Google Scholar] [CrossRef]
  44. Awolesi, O. A Multi-method Approach to Evaluating Indoor Environmental Quality and Energy Performance in Residential College Buildings in a Humid Subtropical Region. Energy Built Environ. 2025, in press. [Google Scholar] [CrossRef]
  45. Kibert, C.J. Sustainable Construction: Green Building Design and Delivery; John Wiley & Sons: Hoboken, NJ, USA, 2016. [Google Scholar]
  46. Wilkinson, S.J. Sustainable construction issues. In Developing Property Sustainably; Routledge: London, UK, 2015; pp. 147–176. [Google Scholar]
  47. Wunderground. Baton Rouge, LA Weather History. Available online: https://www.wunderground.com/history/daily/us/la/baton-rouge/KBTR (accessed on 30 March 2025).
  48. Mujan, I.; Licina, D.; Kljajić, M.; Čulić, A.; Anđelković, A.S. Development of indoor environmental quality index using a low-cost monitoring platform. J. Clean. Prod. 2021, 312, 127846. [Google Scholar] [CrossRef]
  49. Jia, L.-R.; Han, J.; Chen, X.; Li, Q.-Y.; Lee, C.-C.; Fung, Y.-H. Interaction between thermal comfort, indoor air quality and ventilation energy consumption of educational buildings: A comprehensive review. Buildings 2021, 11, 591. [Google Scholar] [CrossRef]
  50. Tartarini, F.; Schiavon, S.; Cheung, T.; Hoyt, T. CBE Thermal Comfort Tool: Online tool for thermal comfort calculations and visualizations. SoftwareX 2020, 12, 100563. [Google Scholar] [CrossRef]
  51. Zhang, Z.; Zhang, Y.; Khan, A. Thermal comfort of people in a super high-rise building with central air-conditioning system in the hot-humid area of China. Energy Build. 2020, 209, 109727. [Google Scholar] [CrossRef]
  52. ANSI/ASHRAE Standard 55; Thermal Environmental Conditions for Human Occupancy. ASHRAE: Peachtree Corners, GA, USA, 2017.
  53. Schiavon, S.; Lee, K.H. Dynamic predictive clothing insulation models based on outdoor air and indoor operative temperatures. Build. Environ. 2013, 59, 250–260. [Google Scholar] [CrossRef]
  54. Nam, I.; Yang, J.; Lee, D.; Park, E.; Sohn, J.-R. A study on the thermal comfort and clothing insulation characteristics of preschool children in Korea. Build. Environ. 2015, 92, 724–733. [Google Scholar] [CrossRef]
  55. USEPA. IRIS Toxicological Review of Formaldehyde (Inhalation). 2024. Available online: https://iris.epa.gov/static/pdfs/0419_summary.pdf (accessed on 2 October 2024).
  56. WHO. World Health Organization Guidelines for Indoor Air Quality: Selected Pollutants; World Health Organization: Geneva, Switzerland, 2010. [Google Scholar]
  57. WHO. WHO Global Air Quality Guidelines: Particulate Matter (PM2.5 and PM10), Ozone, Nitrogen Dioxide, Sulfur Dioxide and Carbon Monoxide; World Health Organization: Geneva, Switzerland, 2021. [Google Scholar]
  58. Mui, K.W.; Wong, L.T. Acceptable Illumination Levels for Office Occupants. Archit. Sci. Rev. 2006, 49, 116–119. [Google Scholar] [CrossRef]
  59. Wong, L.T.; Mui, K.W.; Hui, P.S. A multivariate-logistic model for acceptance of indoor environmental quality (IEQ) in offices. Build. Environ. 2008, 43, 1–6. [Google Scholar] [CrossRef]
  60. Hannah, L.; Page, W.H. A review of AS/NZS 2107:2016 Acoustics—Recommended design sound levels & reverberation times for building interiors. New Zealand Acoust. 2017, 30, 4–20. [Google Scholar]
  61. Ncube, M.; Riffat, S. Developing an indoor environment quality tool for assessment of mechanically ventilated office buildings in the UK—A preliminary study. Build. Environ. 2012, 53, 26–33. [Google Scholar] [CrossRef]
  62. Archtoolbox. Architectural Acoustics—Acceptable Room Sound Levels. Available online: https://www.archtoolbox.com/room-sound-levels/ (accessed on 9 February 2023).
  63. Sailor, D.J. Relating residential and commercial sector electricity loads to climate—Evaluating state level sensitivities and vulnerabilities. Energy 2001, 26, 645–657. [Google Scholar] [CrossRef]
  64. Mukherjee, S.; Nateghi, R. Climate sensitivity of end-use electricity consumption in the built environment: An application to the state of Florida, United States. Energy 2017, 128, 688–700. [Google Scholar] [CrossRef]
  65. Gesangyangji, G.; Holloway, T.; Vimont, D.J.; Acker, S.J. Future changes in state-level population-weighted degree days in the US. Environ. Res. Lett. 2024, 19, 034029. [Google Scholar] [CrossRef]
  66. EIA. U.S. States State Profiles and Energy Estimates. 2024. Available online: https://www.eia.gov/state/search/#?2=199&5=126&r=false (accessed on 19 March 2025).
  67. Lee, K.; Lim, H.; Hwang, J.; Lee, D. Development of building benchmarking index for improving gross-floor-area-based energy use intensity. Energy Build. 2025, 328, 115103. [Google Scholar] [CrossRef]
  68. Scofield, J.; Brodnitz, S.; Cornell, J.; Liang, T.; Scofield, T. Energy and Greenhouse Gas Savings for LEED-Certified U.S. Office Buildings. Energies 2021, 14, 749. [Google Scholar] [CrossRef]
  69. Turner, C.; Frankel, M. Energy Performance of LEED for New Construction Buildings. Available online: https://newbuildings.org/resource/energy-performance-leed-new-construction-buildings/ (accessed on 7 July 2024).
  70. Piccolo, A.; Marino, C.; Nucara, A.; Pietrafesa, M. Energy performance of an electrochromic switchable glazing: Experimental and computational assessments. Energy Build. 2018, 165, 390–398. [Google Scholar] [CrossRef]
  71. Cannavale, A.; Ayr, U.; Fiorito, F.; Martellotta, F. Smart electrochromic windows to enhance building energy efficiency and visual comfort. Energies 2020, 13, 1449. [Google Scholar] [CrossRef]
  72. Hong, X.; Shi, F.; Wang, S.; Yang, X.; Yang, Y. Multi-objective optimization of thermochromic glazing based on daylight and energy performance evaluation. Build. Simul. 2021, 14, 1685–1695. [Google Scholar] [CrossRef]
  73. Riffat, S.; Ahmad, M.I.; Shakir, A. Energy-Efficient Lighting Technologies for Building Applications. In Sustainable Energy Technologies and Low Carbon Buildings; Springer: Berlin/Heidelberg, Germany, 2024; pp. 185–218. [Google Scholar]
Figure 1. Methodological approach for the development of the OPSi metric.
Buildings 15 02111 g001
Figure 2. Sensor placement overlay summarizing points across rooms in (a) a dormitory and (b) a multifamily housing unit.
Buildings 15 02111 g002
Figure 3. Interior views of (a) lobby space, (b) conference room in the non-certified event building, and (c) the LEED-certified event building (auditorium).
Buildings 15 02111 g003
Figure 4. Multimetric IEQ performance across case studies.
Buildings 15 02111 g004
Figure 5. Energy use intensity in LEED-certified (LCD) and non-certified (NCD) dormitories.
Buildings 15 02111 g005
Figure 6. Energy use intensity in LEED-certified (LED) and non-certified (NED) event buildings.
Buildings 15 02111 g006
Figure 7. Energy use intensity in male-occupied (MHM) and female-occupied (MHM) multifamily housing units.
Buildings 15 02111 g007
Figure 8. Performance based on energy utility quality dimensions across case studies.
Buildings 15 02111 g008
Figure 9. Multidimensional performance of dormitory buildings based on OPSi.
Buildings 15 02111 g009
Figure 10. Multidimensional performance of event buildings based on OPSi.
Buildings 15 02111 g010
Figure 11. Multidimensional performance of multifamily housing units based on OPSi.
Buildings 15 02111 g011
Figure 12. Proposed dashboard elements configuration for OPSi.
Buildings 15 02111 g012
Table 1. Survey questions and human subjects for case study buildings.
OccupantsFacility Managers a
Case IQ1. How satisfied are you with the temperature in the building?
Q2. How satisfied are you with the artificial lighting (human-made lighting sources controlled by residents or managers) in the building?
Q3. How satisfied are you with the natural lighting in the building?
Q4. How satisfied are you with the air quality and ventilation in the building?
Q5. How satisfied are you with the noise levels in the building?
Q6. How satisfied are you with your overall experience in the building?
Q1. How satisfied are you with the energy usage of the dormitory during the heating season compared to the cooling season?
Q2. How satisfied are you with the energy cost (USD) of the dormitory during the heating season compared to the cooling season?
Case I ParticipantsLCD: 39; NCD: 31LCD: 5; NCD: 5
Case IIQ1. How satisfied are you with the temperature in this building?
Q2. How satisfied are you with the lighting in this building?
Q3. How satisfied are you with the air quality and ventilation in this building?
Q4. How satisfied are you with the noise level in this building?
Q5. How satisfied are you with your overall experience in this building?
Q1. How satisfied are you with the energy usage of the event building during the heating season compared to the cooling season?
Q2. How satisfied are you with the energy cost (USD) of the event building during the heating season compared to the cooling season?
Case II ParticipantsLEB: 38; NEB: 27LEB: 3; NEB: 3
a Note: Facility managers were presented with visualized charts depicting seasonal energy usage and costs, with the intended expectation of eliciting positive satisfaction responses in both categories.
Table 2. Energy utility quality (EUQ) scoring system.
EUQaEUQbExplanation
MeasureScoreMeasureScore
≥+20%10≥+55.0%10Highly Inefficient
+15.0% to +19.9%20+40.0% to +54.9%20Very Inefficient
+10.0% to +14.9%30+25.0% to +39.9%30Inefficient
+5.0% to +9.9%40+10.0% to +24.9%40Slightly Inefficient
−4.9% to +4.9%50−9.9% to +9.9%50Quasi-Neutral
−5.0% to −9.9%60−10.0% to −19.9%60Slightly Efficient
−10.0% to −14.9%70−20.0% to −29.9%70Efficient
−15.0% to −19.9%80−30.0% to −39.9%80Very Efficient
−20.0% to −24.9%90−40.0% to −49.9%90Highly Efficient
≤−25.0%100≤−50.0%100Extremely Efficient
Disclaimer/Publisher’s Note: The statements, opinions and data contained in all publications are solely those of the individual author(s) and contributor(s) and not of MDPI and/or the editor(s). MDPI and/or the editor(s) disclaim responsibility for any injury to people or property resulting from any ideas, methods, instructions or products referred to in the content.

