Article

Circular Economy Innovation in Built Environments: Mapping Policy Thresholds and Resonant Resilience via DEMATEL–TAISM

1
School of Transportation, Changsha University of Science and Technology, Changsha 410114, China
2
School of Applied Mathematics, Nanjing University of Finance & Economics, Nanjing 210000, China
3
Booth School of Business, University of Chicago, Chicago, IL 60637, USA
4
School of Architecture and Design, University of Technology Sydney, Sydney 2007, Australia
5
College of Computer Science, Chongqing University, Chongqing 401331, China
*
Author to whom correspondence should be addressed.
Buildings 2025, 15(12), 2110; https://doi.org/10.3390/buildings15122110
Submission received: 25 May 2025 / Revised: 11 June 2025 / Accepted: 12 June 2025 / Published: 18 June 2025

Abstract

:
Under China’s dual-carbon strategy, the construction sector still lacks a systematic quantitative view of what drives its shift to a circular economy. This study couples the Decision-Making Trial and Evaluation Laboratory (DEMATEL) with Total Adversarial Interpretive Structural Modeling (TAISM) to build a weighted, multi-layer model of the policy–market–organization–technology chain. DEMATEL measures causal strengths, and TAISM arranges the variables into five levels without subjective thresholds, revealing a five-stage activation pathway. Fiscal incentives and regulations start the cascade; market demand amplifies their effect into a “resonant resilience” mechanism that improves cost performance. Robustness tests show 87% hierarchy stability and causal variation within ±0.6%. Sensitivity checks indicate that policy support must supply at least 30% of total network weight, because market capital alone cannot meet circular-construction costs. A three-tier intervention—policy incentives, financial amplification, and digital decomposition via green finance, BIM, and material passports—is therefore recommended.

1. Introduction

Under the guidance of the “dual carbon” strategy, the circular economy has emerged as a central pathway for promoting high-quality development and sustainable transformation in the construction industry. As a traditionally resource-intensive and high-emission sector, construction is shifting profoundly toward greener and more sustainable development models [1]. The European concept of “Buildings as Material Banks” [2] and China’s policy initiatives—such as the Catalogue for Promoting Green Construction Technologies and the 14th Five-Year Plan for Building Energy Efficiency and Green Buildings—are actively advancing closed-loop resource management across the entire building lifecycle [3]. These developments require construction enterprises to possess technical capabilities in energy conservation and emissions reduction and to demonstrate integrated competencies in rapid responsiveness, organizational agility, and dynamic adaptation within highly uncertain environments. Such capabilities are essential to navigating complex and evolving policy, market, and technological landscapes and, ultimately, to achieving long-term sustainability across economic, environmental, and social dimensions.
While research on the circular economy has addressed technological pathways such as green supply chains, life cycle assessment (LCA), deconstruction and reuse, and digital construction, the existing literature remains primarily focused on engineering-level efficiency improvements. There is insufficient attention to how firms, particularly in the construction sector, can continually activate internal resources and achieve strategic adaptation in the face of policy volatility and market uncertainty [4].
To address this gap, this study introduces the concept of “enterprise vitality”, emphasizing rapid external responsiveness and internal resource reconfiguration. The policy relevance of this concept is underscored by its designation as a core performance indicator in a significant 2025 initiative by China’s State-owned Assets Supervision and Administration Commission (SASAC) aimed at enhancing the vitality and efficiency of state-owned enterprises [5]. Although the recent literature has extended the notion of enterprise vitality beyond financial metrics, existing studies remain fragmented, mostly single-dimensional, and lack integrative models capturing dynamic interactions among policy, market, and organizational factors, especially within the construction sector.
Accordingly, this study proposes a comprehensive analytical framework to systematically investigate the multidimensional drivers of enterprise vitality and their operational pathways in facilitating circular economy transformation within the built environment.
To address the aforementioned research gap, this study adopts a triadic “policy–market–organization” systems perspective to model and analyze the multidimensional coordination mechanisms through which enterprise vitality in construction firms is activated under the context of circular economy and sustainable development. Departing from prior research paradigms that focus on isolated dimensions or static factor listings, this study emphasizes that enterprise vitality does not arise from a single determinant but rather from the dynamic interplay and synergistic stimulation among multiple drivers.
Specifically, this research proposes a theoretically grounded, systemic driving framework that integrates three primary categories of influence: policy guidance, market incentives, and organizational adaptability. The study employs a structural modeling approach based on DEMATEL–TAISM to capture these factors’ complex, path-dependent relationships. This methodological integration aims to uncover the underlying logical mechanisms by which enterprise vitality in the construction sector is activated, sustained, and transmitted across the organizational system.
This study aims to develop a driving model of enterprise vitality for construction firms within the circular economy context. It identifies key factors across three dimensions—policy, market, and organization—and applies the DEMATEL–TAISM method to map their causal relationships and hierarchical structure quantitatively. Drawing on survey data and expert interviews, the model not only delineates the multidimensional transmission pathways of enterprise vitality but also quantifies the driving strength of each factor, thereby identifying high-leverage intervention points.
Compared to traditional Interpretive Structural Modeling (ISM), TAISM retains edge-weight information within the hierarchical graph, enabling the depiction of dynamic mechanisms through which policy signals are amplified by market forces and translated into performance outcomes via supply chain and organizational coupling.
Recent research integrating DEMATEL and TAISM in complex engineering systems has highlighted the methodological strength of this combination in revealing causal intensities and hierarchical pathways [6]. While promising, such approaches have rarely been extended to organizational transformation and sustainability-driven enterprise modeling.
Building on these methodological advantages, the present study extends the DEMATEL–TAISM framework to the enterprise level, focusing on its applicability to dynamic transformation scenarios within the construction sector.
This framework offers systematic decision support for enterprises formulating green transformation strategies and governments refining incentive and governance policies. Moreover, it balances economic performance with environmental accountability, ensuring the sustained enhancement of enterprise vitality in the construction sector.

2. Literature Review

2.1. Research Progress and Systemic Challenges of Circular Economy in the Built Environment

In recent years, the circular economy has become a central theme in the construction industry’s pursuit of carbon neutrality and closed-loop resource management. The European Union’s “Buildings as Material Banks” (BAMB) initiative advocates treating building stock as future material repositories, using digital material passports to extend resource life cycles. In China, the “dual carbon” strategy and the Catalogue for Promoting Green Construction Technologies have accelerated policy-driven advances in green construction, prefabrication, and deconstruction for reuse [7,8].
A growing body of empirical research has focused on optimizing green supply chains, conducting quantitative life cycle assessments (LCA), facilitating the deconstruction and reuse of reclaimed components, and applying BIM and digital twin technologies for carbon reduction and material traceability [9]. These findings confirm the effectiveness of technical approaches in reducing construction-related carbon emissions and enhancing resource efficiency.
However, existing work still exhibits a “technological silo” phenomenon: Most studies emphasize isolated improvements at the engineering or process level, with limited attention to how firms can continuously mobilize resources and capabilities amid policy volatility, market uncertainty, and increasing organizational complexity [10]. The absence of an integrative framework has confined green practices to project-level pilots, limiting their scalability and impeding the formation of sustained competitive advantages at the enterprise level. This gap underscores the need to revisit circular economy strategies from organizational resilience and strategic adaptability perspectives, thereby setting the research agenda for exploring vitality-driven mechanisms within construction enterprises.

2.2. Resilience Mechanisms of Construction Enterprises in Responding to the Circular Economy

Recent research has increasingly focused on resilience mechanisms, investigating how firms can maintain circularity and flexibility amid policy and market uncertainties. These studies seek to elucidate how firms can maintain resource circularity and strategic flexibility amid multifaceted uncertainties such as policy tightening, market volatility, and rapid technological shifts.
A growing body of empirical evidence demonstrates that green supply chain management (GSCM)—through closed-loop logistics, recycled material procurement, and supplier collaboration—can increase construction waste recovery rates by 18–32% [11]. BIM-integrated LCA decision-making embeds environmental performance metrics into digital delivery processes, enabling early-stage optimization of energy use and material inputs [12]. Meanwhile, digital twins combined with IoT monitoring allow for real-time adaptive control of energy consumption and maintenance strategies during the operational phase [13]. These findings affirm that technological enablement and process redesign can enhance resource efficiency and provide an operational foundation for enterprise resilience.
However, many of these studies remain confined to single dimensions—such as technology adoption, supply chain coordination, or organizational learning—while lacking a holistic portrayal of the triadic coupling among policy incentives, market signals, and internal governance [14]. In the absence of cross-level causal models, firms often struggle to determine the appropriate timing for scaling green investments or reconfigure strategies swiftly when policy incentives diminish, leading to what can be termed a state of “resilience stagnation”.
This reveals a critical insight: Resilience alone is insufficient to ensure long-term competitiveness. The key lies in activating enterprise vitality—continuously integrating external incentives, amplifying supply chain synergies, and forming self-reinforcing cycles through digital and governance innovations. This realization sets the stage for the following research agenda: constructing a systemic vitality-driving model that captures the dynamic interactions among policy, market, and organizational dimensions, thus addressing the current gap in integrative analyses within the literature.

2.3. From Enterprise Resilience to Vitality: Current Research on Systemic Drivers

Building on the previous discussion of “resilience stagnation”, recent scholarship has progressively shifted the analytical lens from shock resistance to sustained growth, giving rise to the concept of corporate vitality. Early studies defined vitality primarily through financial metrics (e.g., liquidity, asset turnover), later expanding to integrated indices like the Dynamic Resilience Index (DRI) and ESG frameworks. [15]. Such approaches indicate that vitality depends on financial performance, policy adaptability, market responsiveness, and organizational learning. Instead, policy dependency, market responsiveness, and organizational learning capacity have emerged as foundational pillars of enterprise vitality [16].
Most existing studies remain isolated and single-dimensional [17], thus highlighting the necessity of developing integrative systemic models that capture dynamic policy–market–organization interactions.
To construct such models, it is essential to draw on robust analytical techniques that can represent causal strength and hierarchical logic among interdependent factors. This necessity provides the methodological foundation for the following review on the application of DEMATEL and TAISM in sustainability and organizational contexts.

2.4. Methodological Developments: Applications of DEMATEL and TAISM in Sustainable Systems

To operationalize the dynamic interactions among policy, market, and organizational factors that drive enterprise vitality, it is essential to adopt a modeling method capable of capturing both causal intensity and hierarchical logic.
The Decision-Making Trial and Evaluation Laboratory (DEMATEL) method has been widely adopted in sustainability-oriented research to analyze complex interdependencies. For instance, Upadhyaya and Shukla employed DEMATEL to investigate behavioral and contextual factors influencing circular supply chain adoption in MSMEs, emphasizing the causal prominence of social and environmental motivations [18]. Peng et al. further advanced this analytical logic by integrating fuzzy-DEMATEL with adversarial ISM to model decarbonization pathways in construction supply chains, revealing the structural significance of low-carbon policies and consumer preferences as primary causal factors in multi-level transmission mechanisms [19]. These applications confirm DEMATEL’s robustness in capturing the systemic dynamics of transformation across interconnected sustainability drivers.
Building upon such causal networks, Total Adversarial Interpretive Structural Modeling (TAISM) extends traditional ISM methods by retaining edge weights and incorporating recursive logic, thereby constructing multilayered propagation structures. Liu et al. implemented a DEMATEL–TAISM framework to examine digital transformation pathways in construction firms, identifying adaptive loops among environmental, technological, and organizational drivers [20]. Bian et al. (2022) similarly utilized this approach to model hierarchical feedback structures in AI-based talent training systems, validating its versatility in complex knowledge systems [21].
Although DEMATEL and TAISM have each seen diverse applications, their integration in enterprise vitality modeling—particularly under the dual imperatives of construction sector transformation and circular economy—remains underexplored. The present study applies this integrated approach to map dynamic, recursive, and hierarchical interactions among the core drivers of enterprise vitality and to uncover their transmission mechanisms under sustainability pressures.
Building on the methodological advances discussed above, there remains a critical need to develop a systemic driving model grounded in the interactive logic of policy, market, and organization. Such a model should explain how external incentives and internal absorptive capacities interact—via supply chain coordination and digitalization pathways—to form a self-reinforcing loop. This perspective provides the theoretical foundation for the structured causal modeling adopted in this study through the DEMATEL–TAISM methodology.
In summary, although prior research has made notable progress in green technologies and resilience-oriented governance, there remains a critical gap in developing a systemic model that can quantitatively capture the triadic coupling of policy, market, and organizational dimensions along with their dynamic amplification effects. This limitation has constrained the operationalization and scalability of circular economy strategies at the enterprise level.
The present study proposes an innovative integration of the Decision-Making Trial and Evaluation Laboratory (DEMATEL) and the Total Adversarial Interpretive Structural Modeling (TAISM) methods to address this shortcoming. By constructing a multilayered network with weighted edges, this coupled framework systematically reveals how incentive thresholds and resonant-resilience pathways drive enterprise vitality within construction firms. The following section details the procedures for data collection, variable screening, and the integrated DEMATEL–TAISM process that underpins the empirical analysis. The complete research workflow and information flows are summarized in Figure 1, providing a visual roadmap for the subsequent methodological steps.

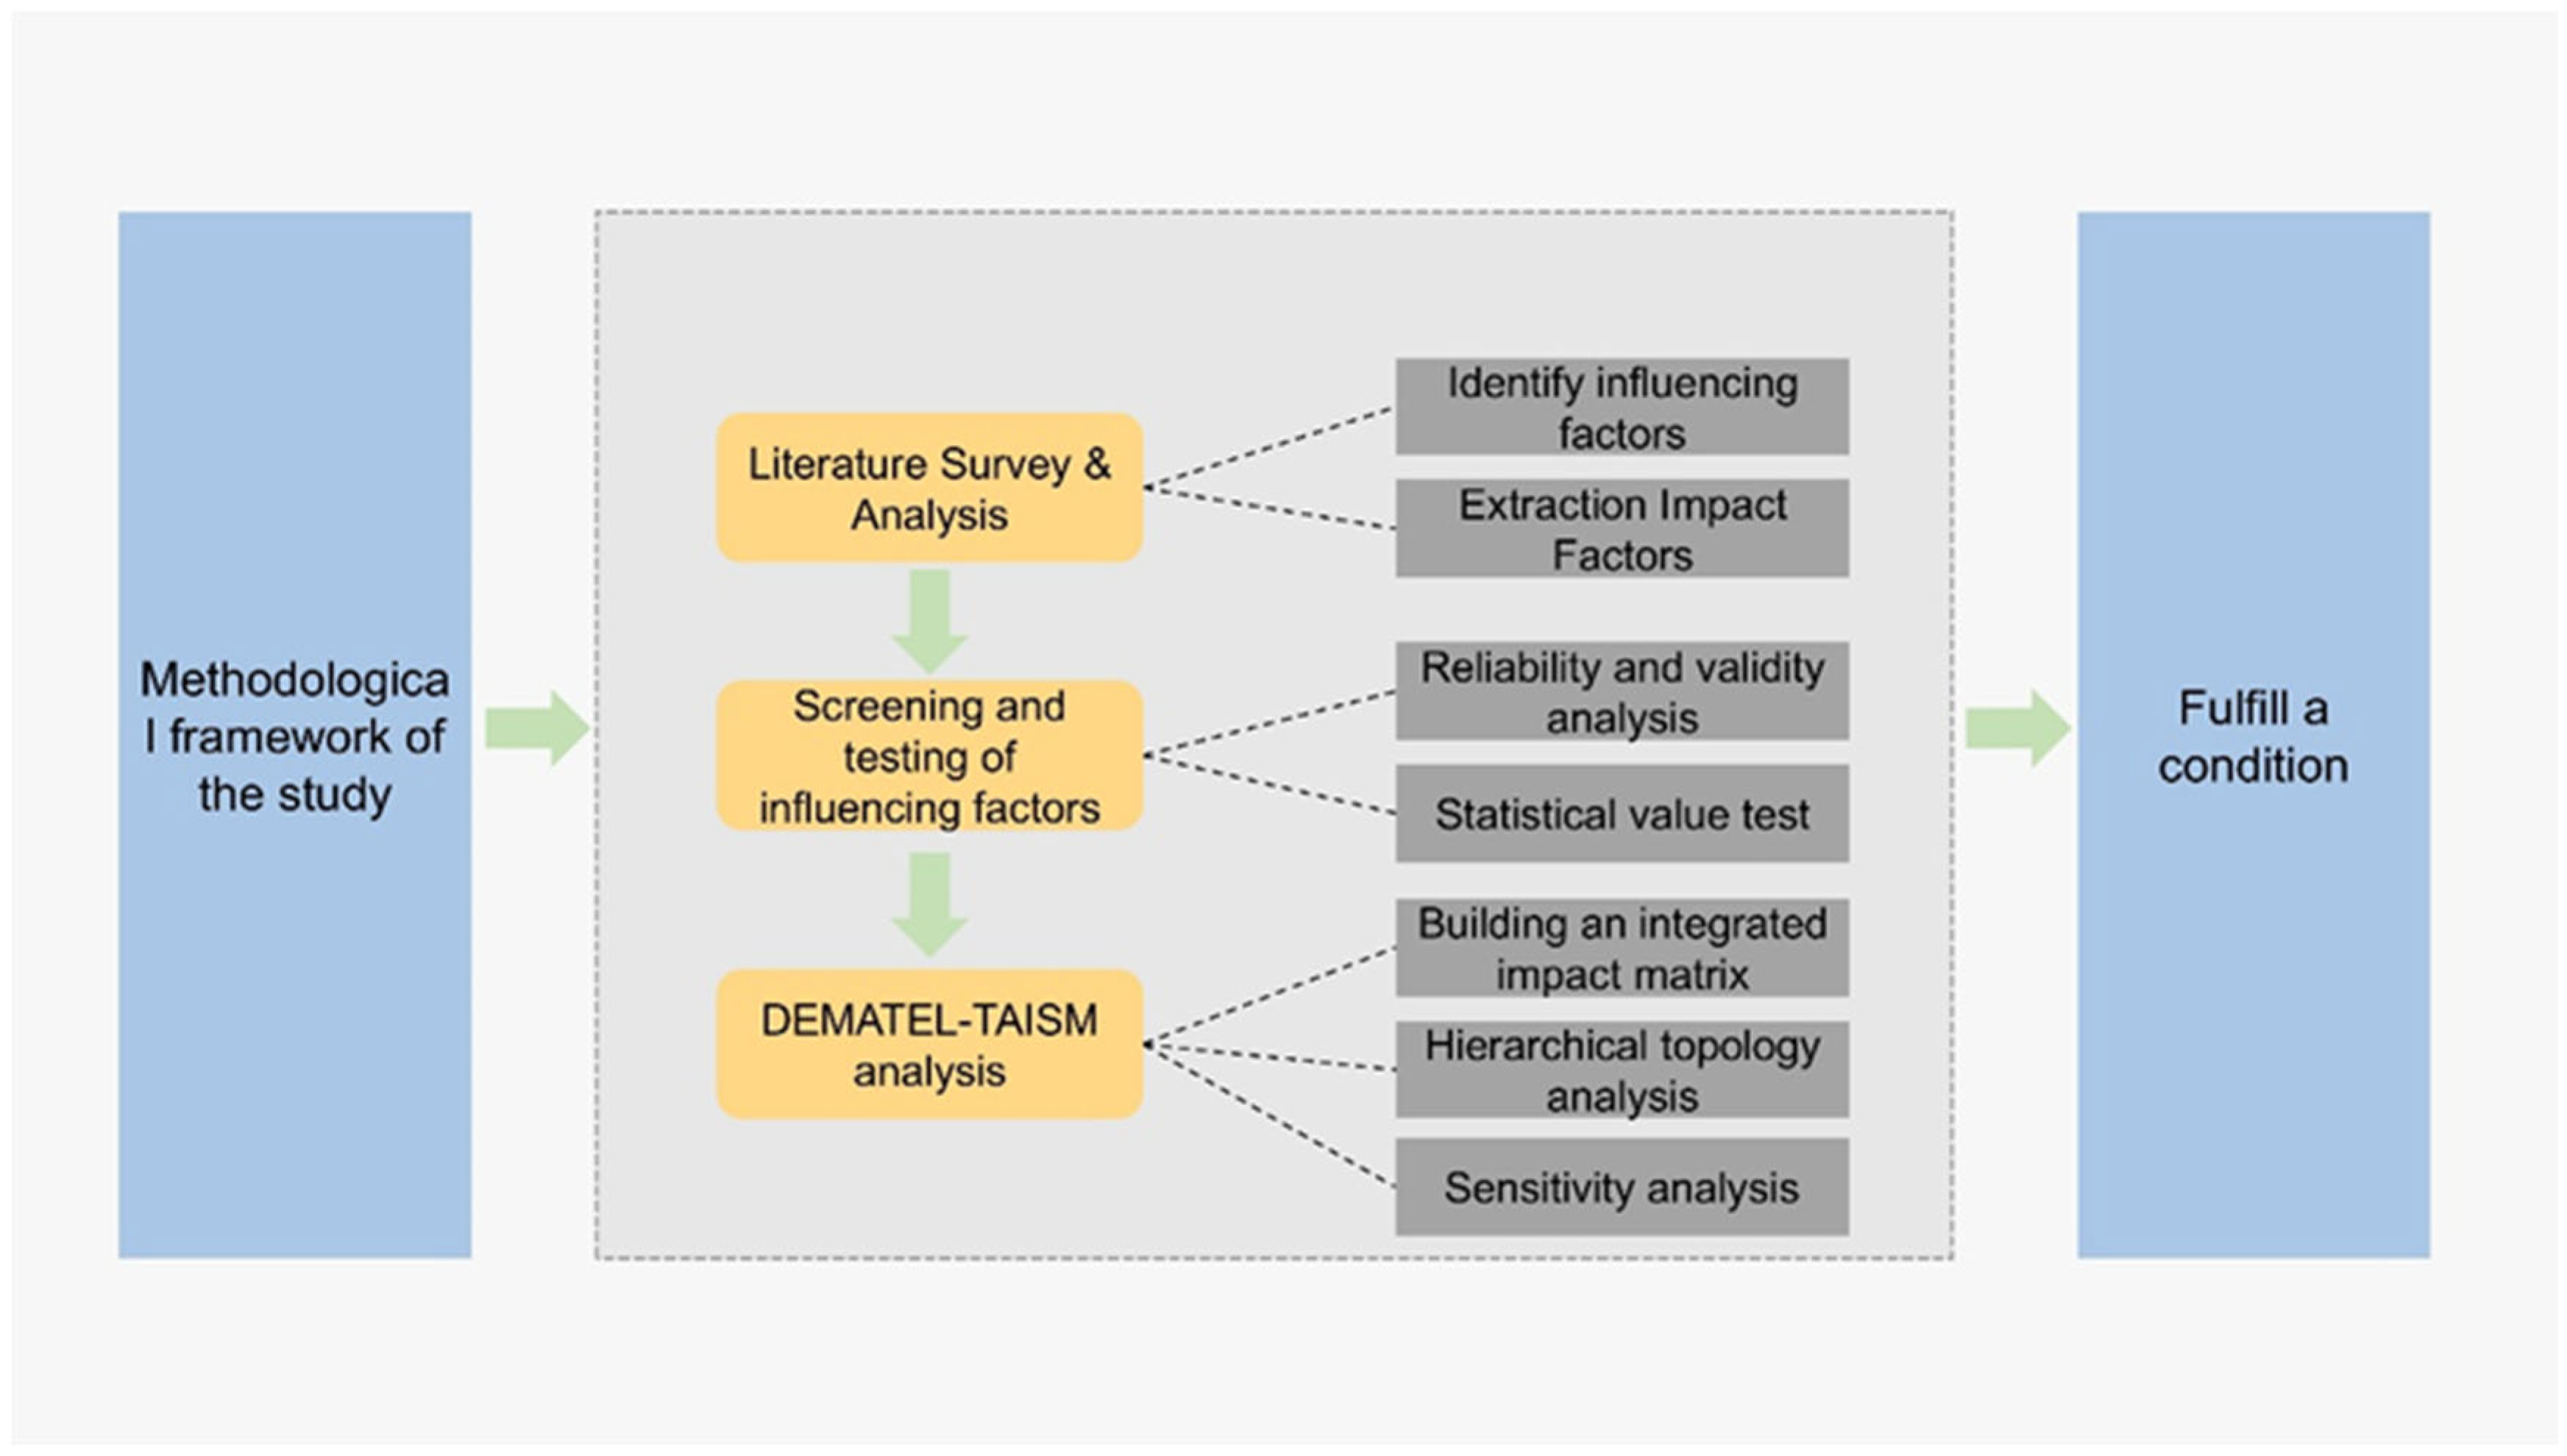
3. Research Methodology

As outlined in the preceding sections, policy, market, and organizational factors are critical drivers in the transition toward a circular economy in the construction sector. However, the strong interdependencies and hierarchical relationships among these dimensions make it difficult for enterprises to clearly identify causal pathways and prioritize strategic interventions. This complexity highlights the need for a structured analytical approach to uncover how these multidimensional factors interact under dynamic conditions to shape the evolution of enterprise vitality.
To address this challenge, this study adopts an integrated modeling framework that combines the Decision-Making Trial and Evaluation Laboratory (DEMATEL) method with the Total Adversarial Interpretive Structural Modeling (TAISM) approach. DEMATEL is employed to quantify the causal strength among variables, while TAISM constructs a hierarchical structure based on the retained influence weights. This combination not only avoids the subjectivity inherent in threshold-based structural models but also enables the identification of amplification pathways from policy signals to organizational performance.
Accordingly, the study follows a three-stage analytical process to systematically identify and model the key driving factors. In the first stage, potential influencing variables are extracted through a targeted review of the literature related to sustainability, digitalization, and organizational adaptability in the built environment. In the second stage, these variables are validated and prioritized using a structured questionnaire survey conducted with experts from the construction industry. In the third stage, the integrated DEMATEL–TAISM methodology is applied to quantitatively map the causal relationships and hierarchical structure among the factors, thereby uncovering their dynamic interaction mechanisms. Each stage features clearly defined tasks and outputs, forming a coherent analytical pathway from qualitative identification to quantitative modeling. This integrated process is illustrated in Figure 2.

3.1. Identification of Influencing Factors Based on Literature Review

The study began with a topic search in the Web of Science Core Collection using the keywords “construction industry” AND “circular economy” AND (“resilience” OR “corporate vitality” OR “green transition”), which yielded 243 records. After a three-tier screening based on journal impact, empirical rigor, and sector relevance, 35 publications were retained for in-depth analysis. Guided by dynamic capabilities and systemic adaptability theory, twenty core drivers of enterprise vitality were distilled, covering policy pressure, market volatility, technological innovation, and organizational governance. In line with the TOE and PESTEL logics, these drivers were provisionally grouped into five domains—policy orientation, market environment, organizational capability, technological responsiveness, and external uncertainty—thereby establishing both the variable pool and the structural blueprint for the subsequent DEMATEL–TAISM. The complete list, definitions, and key references for each factor are summarized in Table 1.

3.2. Questionnaire Development, Reliability–Validity Testing, and Structural Dimension Classification

A structured questionnaire was developed and refined to empirically verify the relevance and reliability of the factors influencing enterprise vitality identified in the literature. The questionnaire comprised three sections: (1) basic information about the respondent’s organization; (2) importance ratings of each factor using a five-point Likert scale; and (3) open-ended questions to capture respondents’ feedback on strategic responses and industry insights. The content underwent multiple rounds of expert reviews from the circular economy and construction management specialists to ensure academic rigor and contextual relevance. The final questionnaire was distributed online via the “Wenjuanxing” platform. Target respondents included mid- and senior-level managers and technical experts with experience in green construction, corporate strategy, or project management. One hundred fifty valid responses were collected, ensuring strong industry representativeness and contextual alignment with circular economy practices, providing a robust empirical basis for subsequent causal modeling (see Table 2).
To ensure the scientific validity and empirical soundness of the questionnaire instrument, reliability and validity analyses were conducted using IBM SPSS Statistics 27. The overall Cronbach’s α coefficient reached 0.924, well above the commonly accepted threshold of 0.7, indicating strong internal consistency. All corrected item-total correlations (CITC) exceeded 0.3, and no items were identified for elimination, further supporting the reliability of the scale structure (see Table 3). Regarding construct validity, the Kaiser–Meyer–Olkin (KMO) measure was 0.857, and Bartlett’s test of sphericity was significant (p < 0.001), confirming adequate inter-variable correlations for factor analysis (see Table 4).
Five common factors were identified using principal component extraction and Varimax orthogonal rotation, cumulatively explaining 73.39% of the total variance. All commonalities were above 0.4, indicating that the factors effectively captured the variance of the original items. The rotated factor loading matrix (Table 5) confirmed the statistical validity of the classification, as all items had factor loadings above 0.4 on their respective dimensions.
In addition, standard deviation analysis was conducted to assess the consistency of respondents’ ratings. All factors showed standard deviations ranging from 0.93 to 1.13, suggesting minor variations but overall acceptable levels of consistency and stability. As a result, all five factors were retained for subsequent causal path modeling.
Based on the exploratory factor analysis results, the 20 influencing variables were categorized into five internally coherent structural dimensions: policy adaptability, market environment, corporate competitiveness, external risks, and organizational adaptability. While these groupings differ slightly in naming and aggregation from the initial theoretical classifications based on the TOE and PESTEL frameworks, they exhibit strong logical alignment from a structural aggregation perspective. This outcome provides a solid theoretical and empirical foundation for constructing the vitality-driving model under the circular economy context.
Accordingly, a standardized coding system was established for all variables to facilitate modeling and path analysis. The 20 factors under the five dimensions were systematically labeled using the letters “A–E” to represent each dimension. For example, the policy adaptability dimension includes fiscal incentives and subsidies (A1), credit and interest rate policies (A2), industry regulatory standards (A3), and public infrastructure investment (A4); the market environment dimension includes real estate market dynamics (B1), economic cycles (B2), supply chain resilience (B3), and global market fluctuations (B4). The remaining three dimensions were coded similarly. This classification and coding scheme enhances structural clarity and provides a standardized basis for variable input and causal path identification in DEMATEL–TAISM (see Table 6).

3.3. Causal Analysis and Hierarchical Modeling

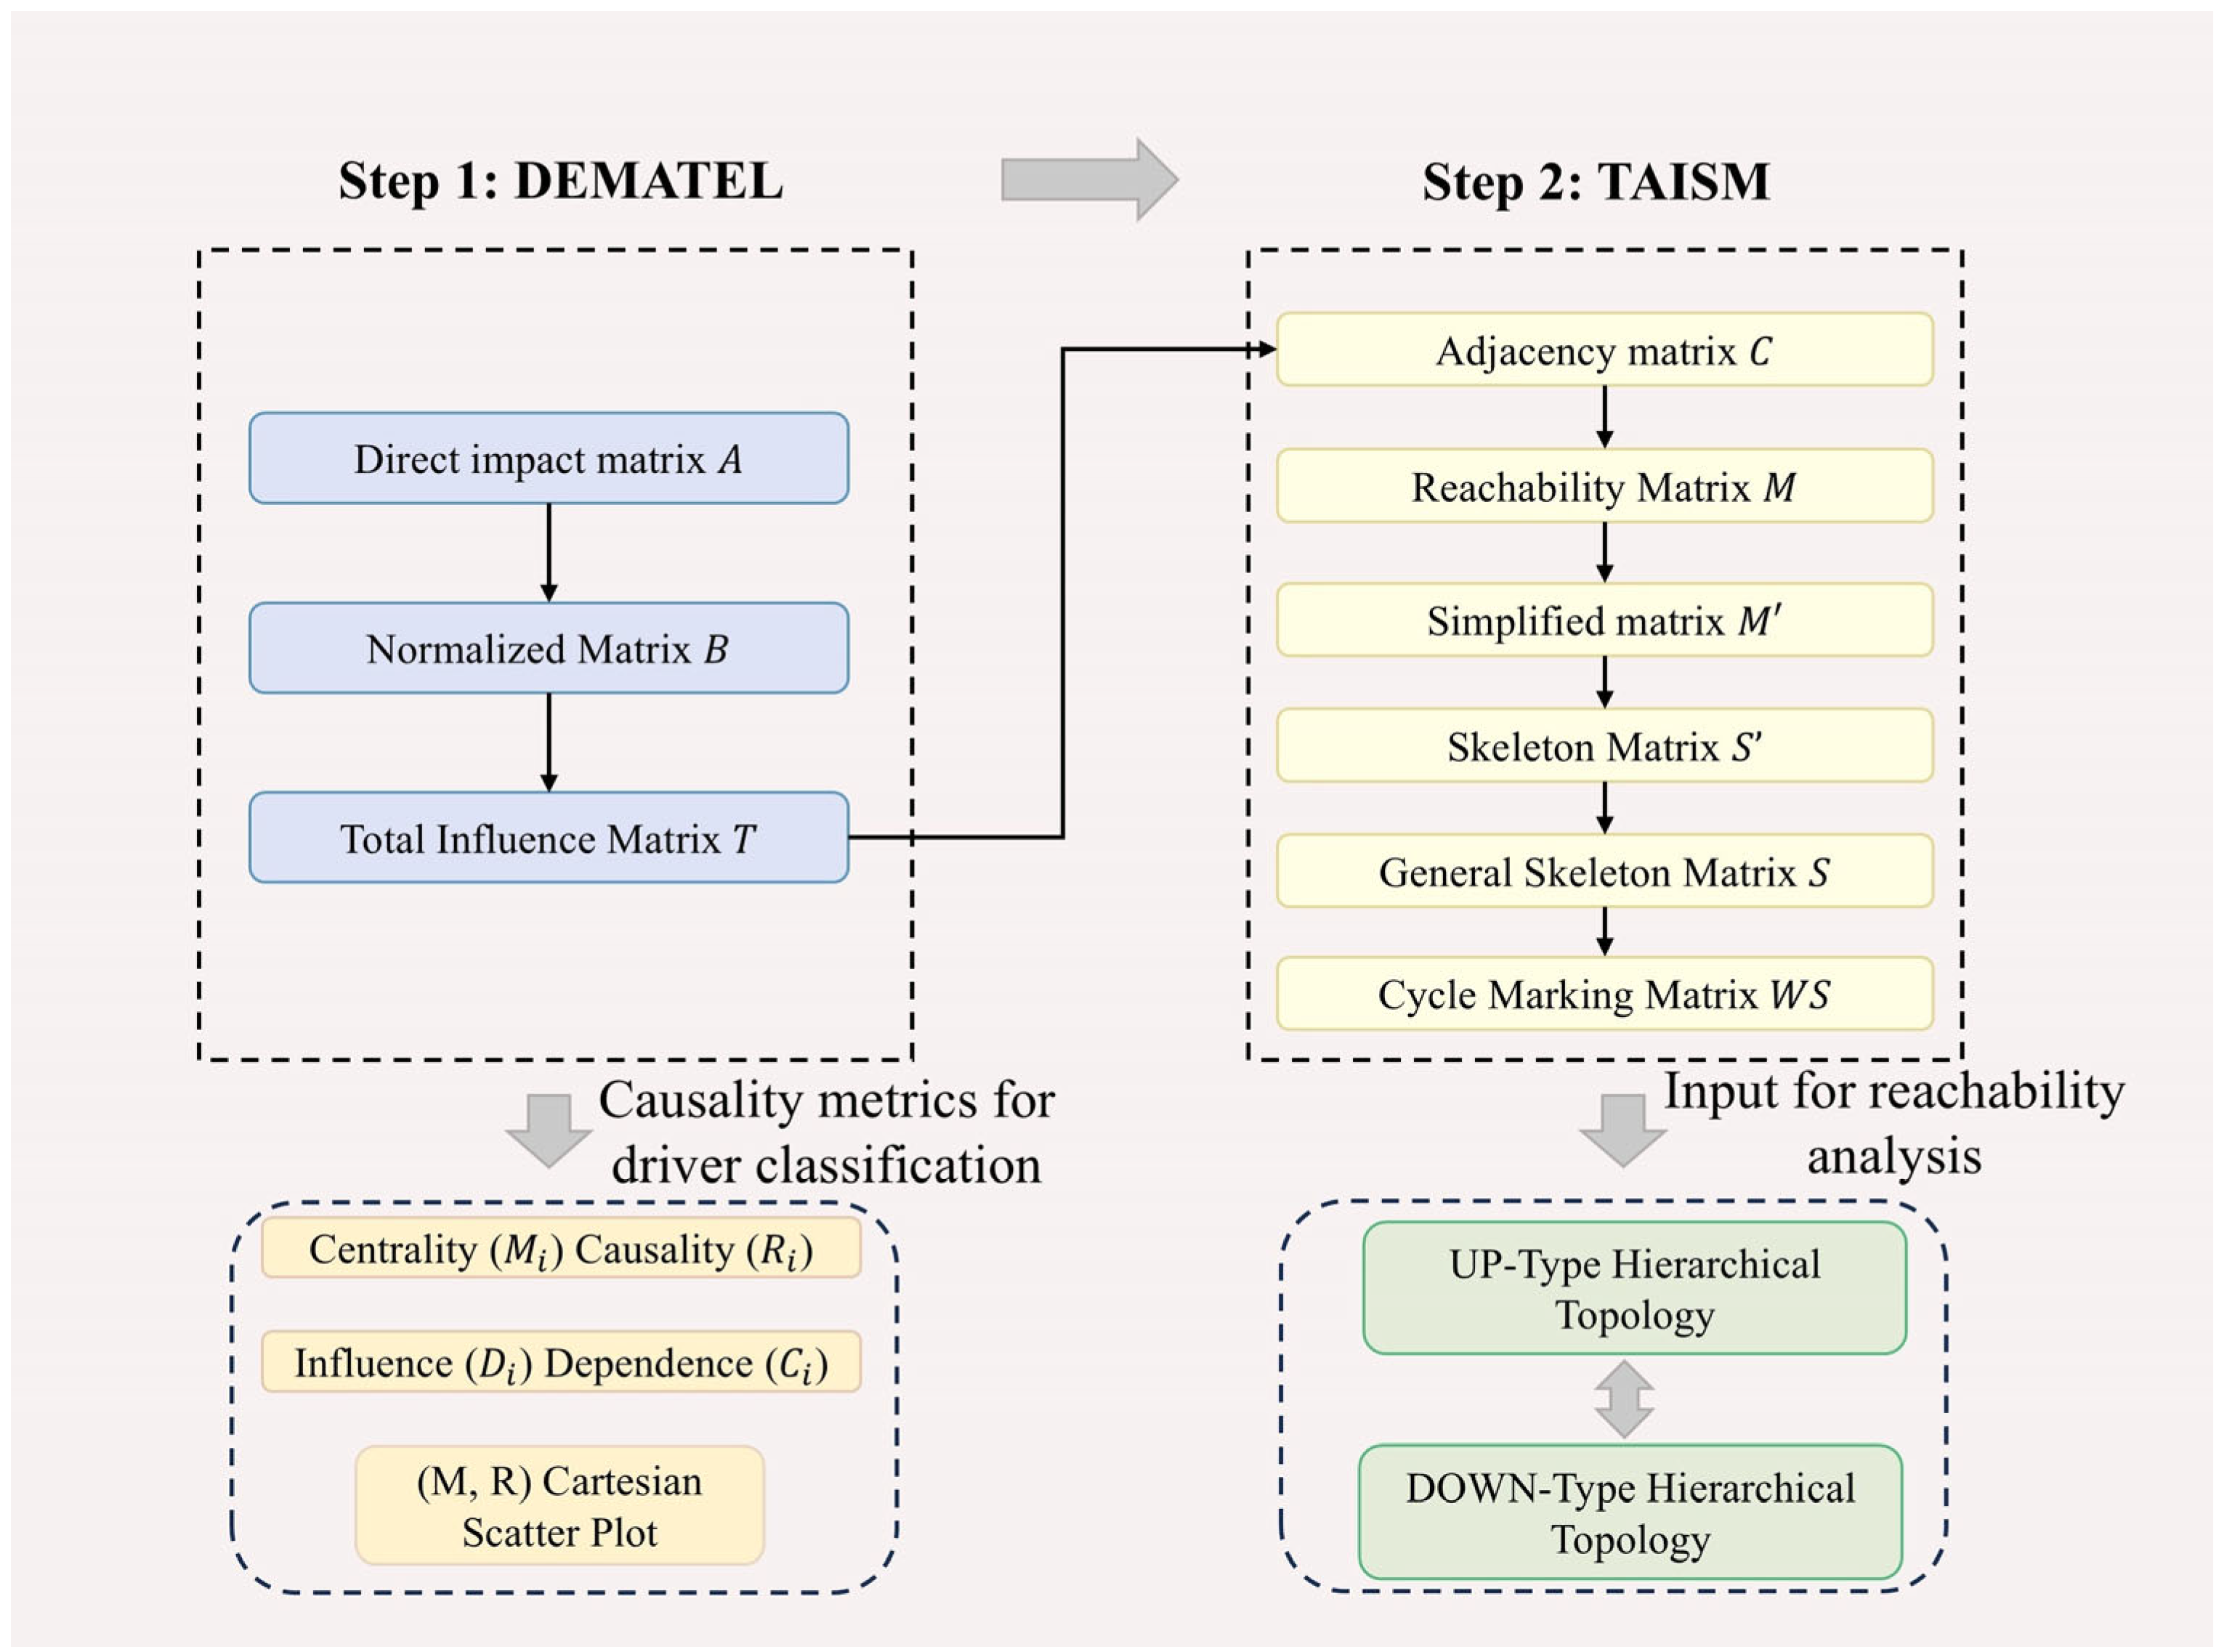
3.3.1. Overview of the Integrated Method

In the circular economy context, enterprise vitality in the construction sector is influenced by the interactive effects of multiple factors, including policy orientation, market environment, and organizational capabilities. These interactions exhibit pronounced causal coupling and structural nesting characteristics. To systematically analyze these complex mechanisms, this study constructs an integrated analytical framework combining DEMATEL and TAISM to identify causal relationships among key factors and construct a structured path model.
The Decision-Making Trial and Evaluation Laboratory (DEMATEL) method enables the quantification of both direct and indirect influences among variables, clarifying the driving power and dependency attributes of each factor [58]. This study employs DEMATEL to develop an influence matrix and identify critical causal pathways, providing the foundational input for structural modeling.
Building on the causal network derived from DEMATEL, the Total Adversarial Interpretive Structural Modeling (TAISM) method is used to construct a hierarchical system structure. Compared to traditional Interpretive Structural Modeling (ISM), TAISM introduces adversarial logic and recursive mechanisms, enabling it to capture the strategic adaptation sequences of construction enterprises under the dual pressures of green transformation and macroeconomic contraction. This enhances the modeling process’s dynamic responsiveness and structural depth [20].
The integration of DEMATEL and TAISM is realized as follows: the causal weights generated by DEMATEL serve as structured inputs for TAISM, thereby reducing reliance on subjective expert judgment typical of conventional structural models. TAISM transforms these weights into a multilayered topological structure that systematically reveals enterprise vitality drivers’ influence pathways and strategic evolution logic.
It is worth noting that while DEMATEL and TAISM have each seen applications in complex system modeling, their integrated use in the context of enterprise vitality modeling—particularly within the construction sector under circular economy constraints—has not been documented in the prior literature. This methodological integration differs from previous approaches in two significant ways. First, it retains continuous causal weightings throughout the hierarchical modeling process, thereby overcoming the threshold-dependence and discretization limitations associated with traditional ISM-based methods. Second, it enables a structured representation of multi-layered propagation mechanisms through which external stimuli—such as policy signals and market dynamics—are internalized, amplified, and converted into organizational performance outcomes. These contributions enhance the methodological rigor and analytical precision of causal modeling, reinforcing the framework’s applicability to complex, multi-dimensional systems of sustainable industrial transformation.
In summary, the DEMATEL–TAISM framework enables a closed-loop integration from causal identification to hierarchical modeling. It offers high systematization, interpretability, and strategic relevance, making it well-suited for analyzing the drivers of enterprise vitality under circular economy constraints. Figure 3 illustrates the complete methodological workflow.

3.3.2. DEMATEL Analysis

The Decision-Making Trial and Evaluation Laboratory (DEMATEL) method was applied to identify the causal relationships among the influencing factors. Experts assessed the direct influence between each pair of factors using a five-point scale (0 = no influence, 4 = strong influence), constructing an initial direct influence matrix. This matrix was then normalized and aggregated to produce the total influence matrix.
Based on the total influence matrix, four key metrics were computed for each factor: Influence Degree (the total impact a factor exerts), Dependence Degree (the total impact a factor receives), Prominence (the sum of influence and dependence), and Relation (the difference between influence and dependence). These values enable the classification of factors into “Cause” and “Effect” groups, which are subsequently used to construct a causal diagram that visualizes the key interaction pathways within the system. The complete computational steps are provided in Appendix A.

3.3.3. TAISM Analysis

In the study’s second phase, the Total Adversarial Interpretive Structural Modeling (TAISM) method was applied to reveal the hierarchical structure and interaction pathways among the identified factors. Unlike conventional Interpretive Structural Modeling (ISM), TAISM incorporates both upward (“UP-type”) and downward (“DOWN-type”) extraction logic, which enhances its ability to identify dominant, transitional, and foundational elements in a system undergoing dynamic adaptation.
Starting from the total influence matrix generated by DEMATEL, a threshold value was established to extract significant causal links. A binary adjacency matrix was constructed to reduce noise and highlight meaningful relationships between variables.
Subsequently, a reachability matrix was developed using Boolean logic, and repeated structural elements were aggregated into a simplified form. This simplification process generated a general skeleton matrix, which preserves the system’s essential causal backbone.
The resulting matrix was then transformed into a weighted structure matrix by reintroducing the original influence values. If any feedback loops existed, they would be marked accordingly; however, no such loops were detected in this study.
A bidirectional hierarchical extraction followed, assigning variables to the top or bottom layers based on logical comparisons of reachable and antecedent sets. Through iterative processing, a multi-layer hierarchical structure was formed, mapping out each factor’s systemic interactions and positional roles.
The final TAISM topological model reveals the causal directions, influence strengths and hierarchical positions of all factors. This model provides a robust basis for interpreting how construction enterprise vitality is driven under circular economy constraints and supports strategic planning and intervention prioritization. The detailed computational procedures are documented in Appendix A.

3.3.4. Expert Weight Sensitivity Analysis

To systematically assess the impact of expert background differences on the structural stability of the model, an expert weight sensitivity analysis was conducted following the completion of the DEMATEL–TAISM model. This procedure aimed to evaluate how variations in expert weighting could influence the causal weight matrix and resulting hierarchical structure, thereby enhancing the model’s generalizability and contextual adaptability under circular economy conditions.
The study designed three expert-weighting scenarios to explore how different backgrounds may affect model outputs:
Scenario 0 (baseline): All experts are assigned equal weights; this serves as the control scenario.
Scenario 1 (industry-oriented): The weights of experts from construction practice backgrounds are increased by 20% to reflect the enhanced influence of practical experience in variable assessments.
Scenario 2 (academia-oriented): The weights of academically affiliated experts are increased by 20% to emphasize theoretical perspectives and policy-oriented evaluations.
Expert scoring data were re-weighted in each scenario, and the total influence matrix under DEMATEL was recalculated. The revised matrices were then fed into the TAISM model to assess the extent to which changes in expert weighting affect causal path identification and hierarchical structure construction. To isolate the effects of expert weight variations and minimize external variable interference, three representative factors were selected for analysis—A1 (fiscal incentives and subsidies), A4 (public infrastructure investment), and C1 (cost control capability)—due to their relevance to both policy orientation and enterprise operations.
This sensitivity analysis established a closed-loop evaluation framework that integrates quantitative causal analysis with multi-level structural modeling, thereby improving the model’s robustness and adaptability to expert variation. All computations were executed in a Python 3.12 environment, utilizing standard libraries (NumPy, pandas, SciPy, NetworkX) and customized scripts for fuzzification and matrix transformation.

3.4. Ethical Considerations

Before data collection, this study received ethical review and approval from Changsha University of Science and Technology. All participants were informed of the study’s objectives, procedures, and their rights, including voluntary participation and data confidentiality. Informed consent was obtained electronically before participants proceeded with the anonymous online questionnaire, which was administered via the Wenjuanxing platform between 15 February and 20 March 2025. As all participants were 18 or older, parental or guardian consent was not required.

4. Results

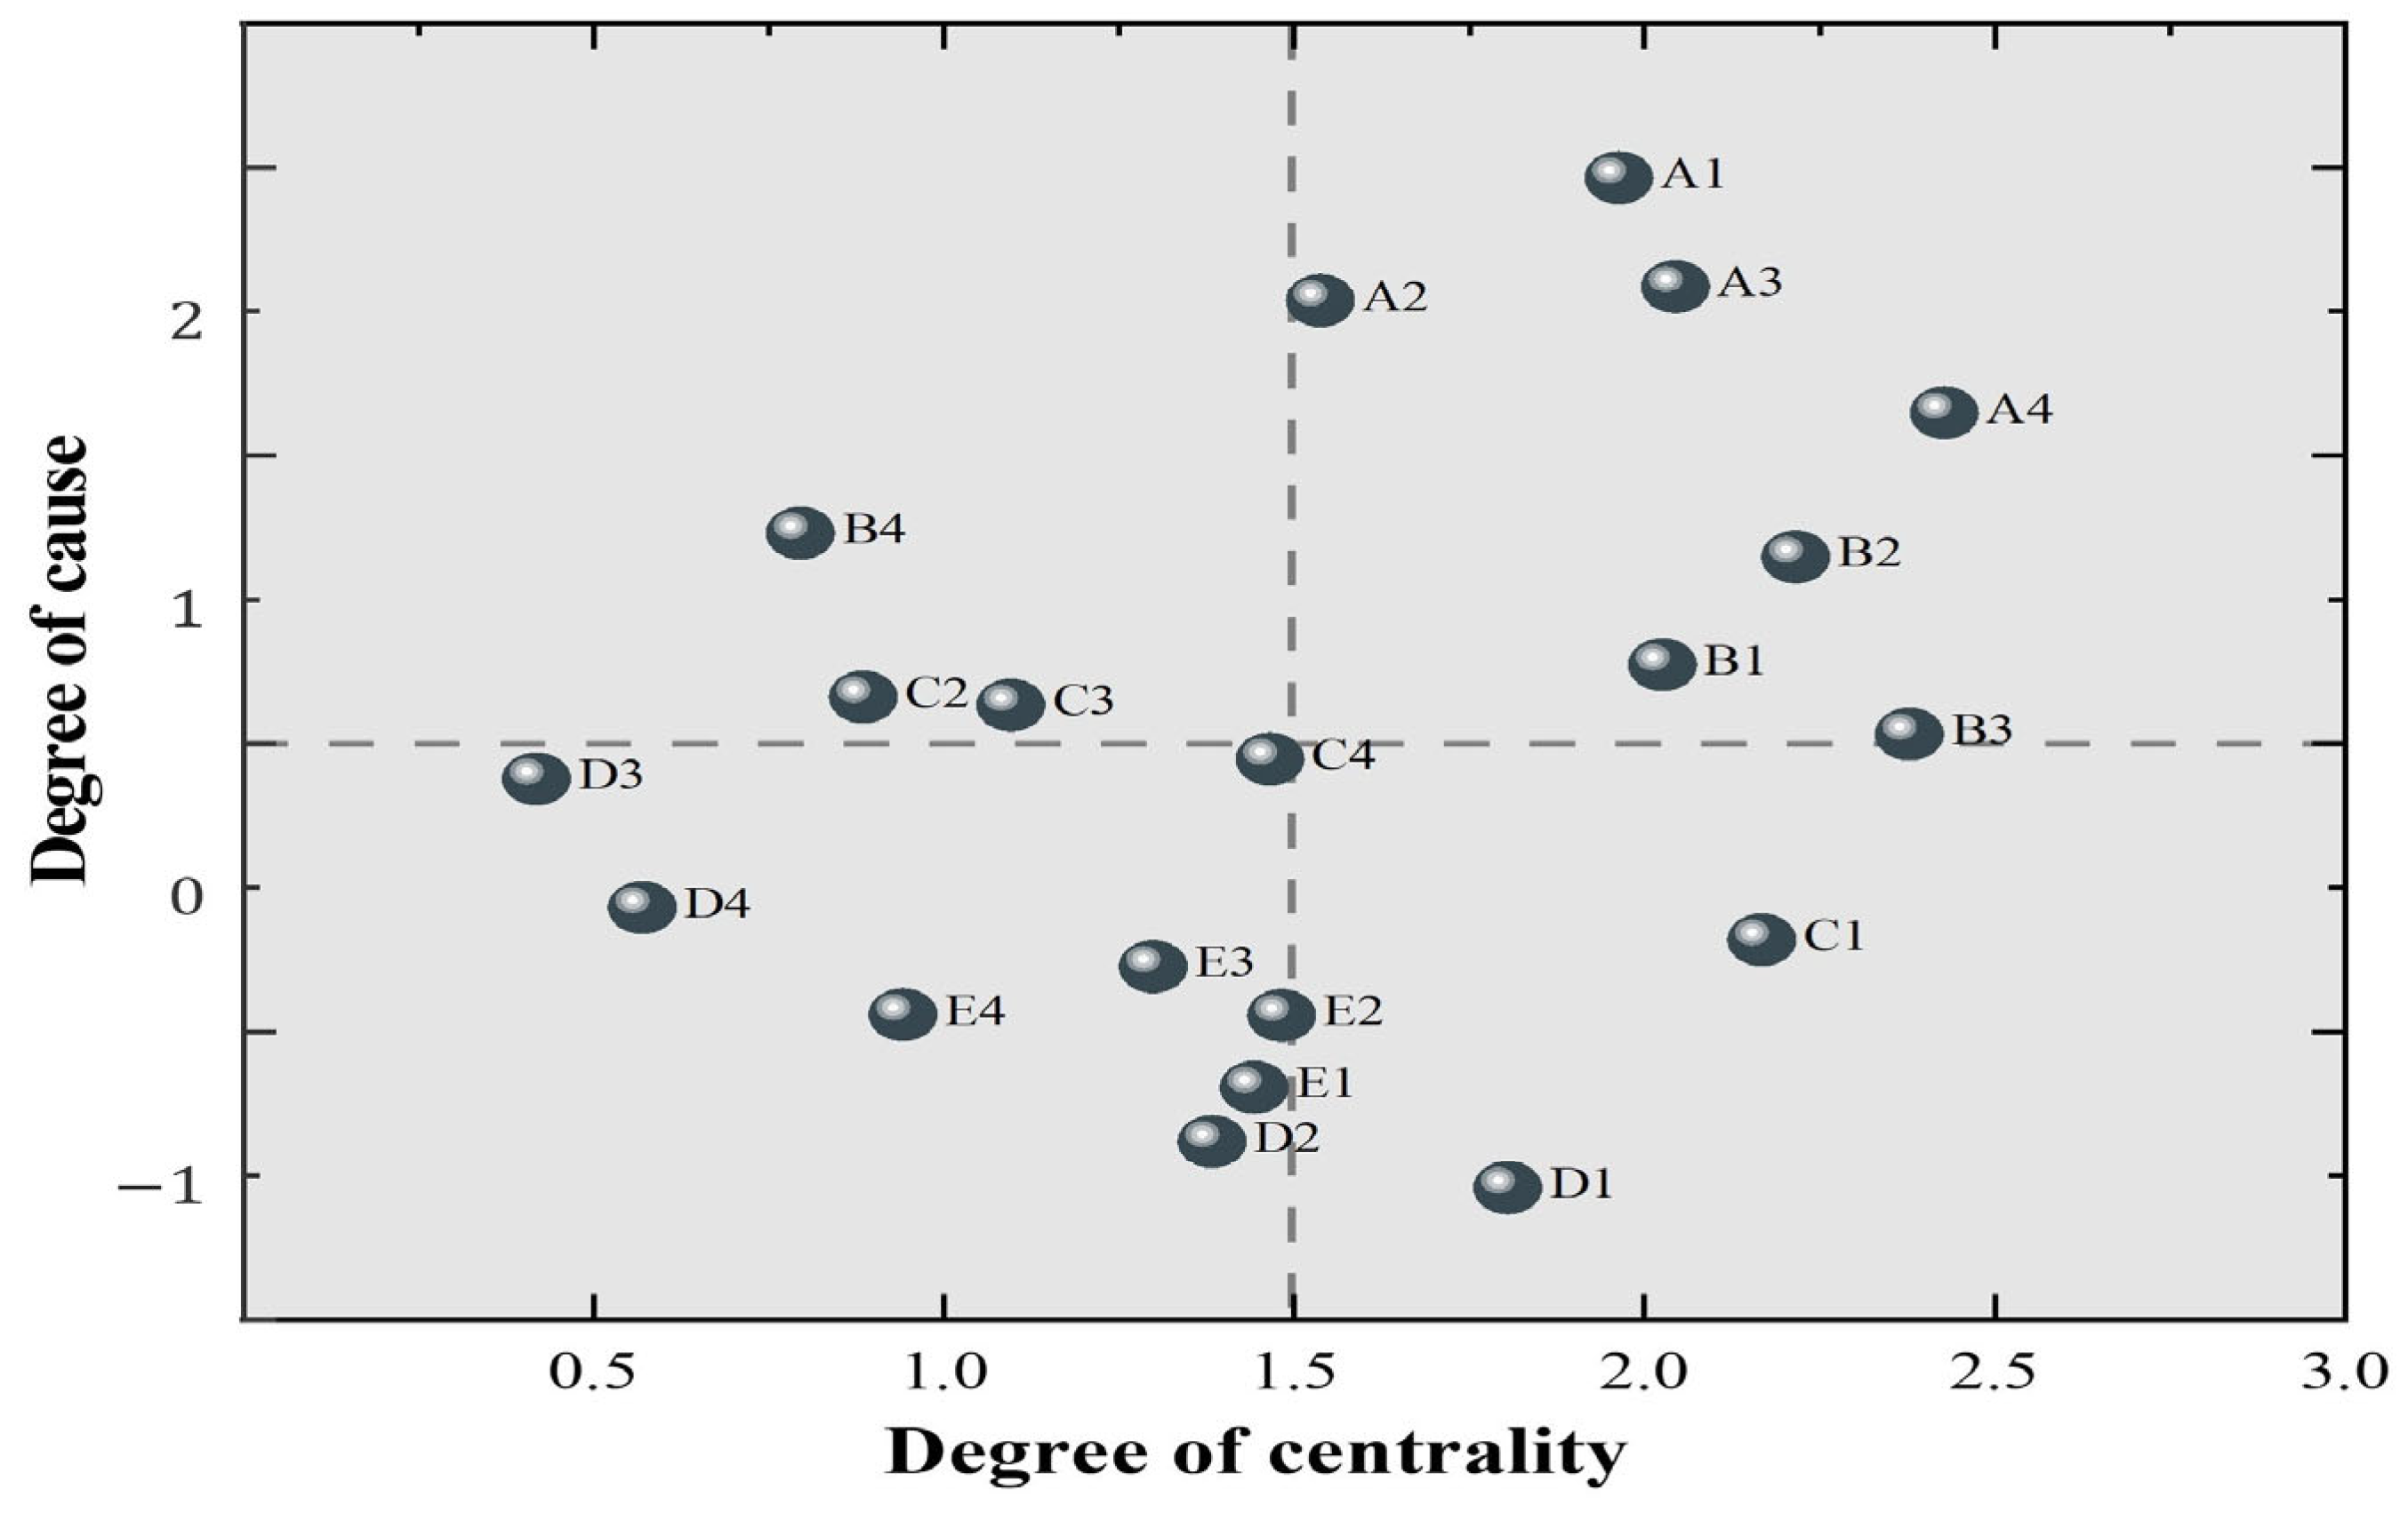
4.1. High-Impact Factors Identified by DEMATEL

The causal diagram (Figure 4) presents a two-dimensional mapping of Prominence (D + R) and Relation (D − R), offering a systematic view of the primary driving forces behind construction enterprises’ transition toward the circular economy. Together with Table 7, it enables a structured interpretation of the transformation dynamics, beginning with policy drivers and followed by market amplification, supply chain hubs, and outcome indicators.
First, the policy variables A1–A4 are located in the upper-right quadrant, indicating high causal influence and prominence. These variables exert substantial outward influence on the system while remaining largely unaffected by other factors. Among them, A1 (fiscal incentives and subsidies) shows the highest causality (+1.96) and overall prominence (2.43), identifying it as the strongest external driver. A2 (credit and interest rate policies) and A3 (industry regulatory standards), with prominence scores of 1.54 and 2.04 and causality values of +1.54 and +1.59, respectively, jointly reduce financing costs and increase compliance pressures. A4 (public infrastructure investment), with an influence score of 1.79 and a dependence of 0.64, provides direct market space. These results indicate that policy packages combining fiscal and institutional instruments are the primary external driving forces guiding enterprise adoption of circular economy practices.
Market variables B1 (real estate market dynamics) and B2 (industry economic cycles) also show positive causality values (+0.27 and +0.65) and high prominence (2.03 and 2.22), suggesting that demand shifts and economic fluctuations function as early-stage amplifiers of policy effects. These variables influence firms’ timing decisions regarding recycled material adoption and green investment while also affecting sales revenue and procurement rhythms, shaping cash flow and cost structures.
Supply chain resilience (B3) has the highest prominence of all factors (2.38) but a near-zero causality score, indicating its role as a hub that both absorbs upstream shocks and transmits them downstream. B3 relates to the efficiency of recycled material circulation and logistical coordination and determines how effectively policy and market signals are integrated into enterprise-level processes. Managerial capability (C4) (prominence 1.47, causality −0.05) performs a similar absorption function at the organizational level. Its internal efficiency directly influences the degree to which technological advancement (C2) (0.89, +0.16) and digital integration (C3) (1.10, +0.13) can be translated into resource circularity and cost reduction.
Outcome nodes are concentrated in the lower-left quadrant. Cash flow management (C1) has a dependence value of 1.42 and causality of −0.68, while the inflation index (D1) shows a dependence of 1.67 and causality of −1.54. Both serve as terminal nodes that absorb systemic pressure but exert little outward influence. When fiscal incentives, regulatory standards, and supply chain coordination are simultaneously strengthened, C1 improves significantly, and cost pressures for materials and labor ease. Conversely, when borrowing costs rise or labor shortages intensify, cash flow contracts rapidly, and inflation accelerates.
In summary, policy drivers are amplified through market and supply chain factors and then translated by organizational capabilities into financial outcomes. This validates a core proposition of the study: To effectively advance the circular economy in the construction industry, it is essential to simultaneously optimize policy design, market mechanisms, and organizational absorptive capacity, ensuring the sustainable transformation of external drivers into tangible outcomes such as closed-loop resource flows and financial resilience.
In Section 4.2, the hierarchical positions and transmission intensities along this pathway will be further quantified and validated using the TAISM model (see Figure 5).

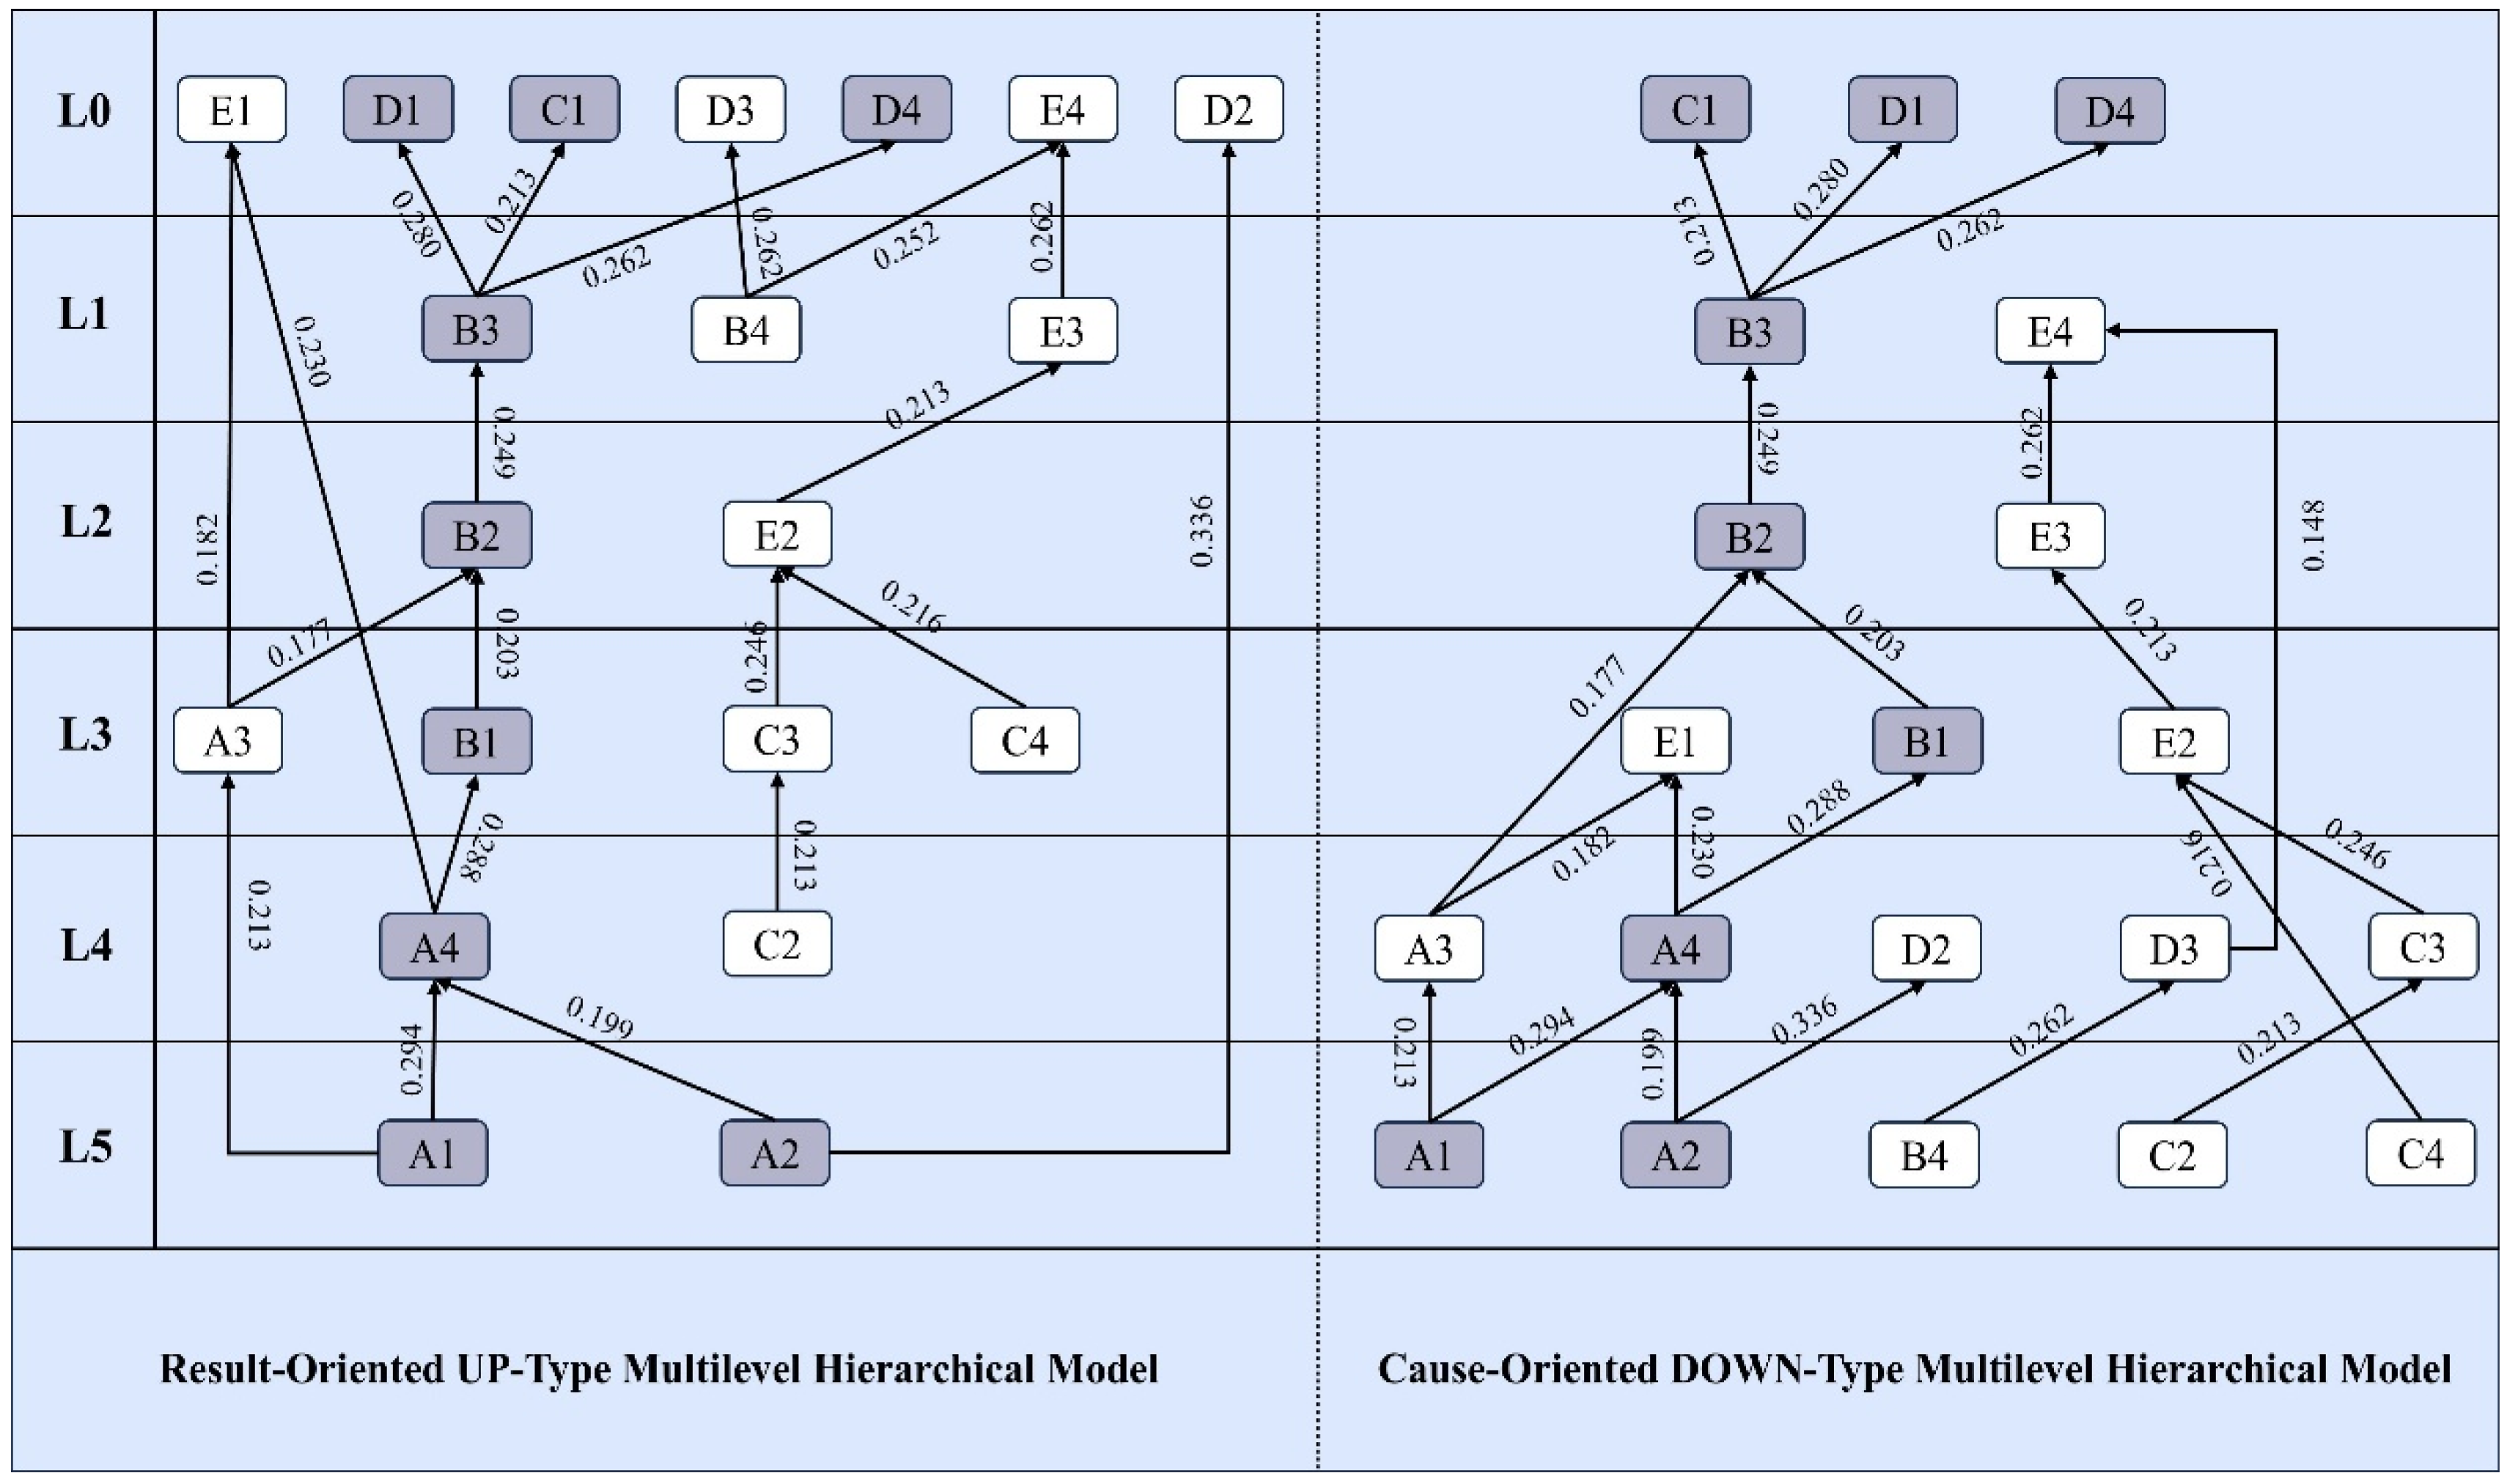
4.2. Hierarchical Influence Structure Based on TAISM

The TAISM model delineates a progressive causal chain—“policy → market → supply chain → organization → performance”—through a weighted directed graph. Figure 5 provides a visual synthesis of the multilayered interactions and directional causal pathways among the identified factors. Hierarchical layering was consistent across both UP-type and DOWN-type extraction perspectives: Policy drivers A1–A4 were positioned at levels L5 to L4, market factors B1–B2 advanced to L3 and L2, supply chain resilience (B3) occupied the central L1, organizational governance (C4) was located at L3, while the outcome variables cash flow (C1) and price index (D1) terminated at the bottom layer L0, confirming the model’s causal closure.
Edge weights further quantified the amplification effects along this pathway. Within the policy layer, A1 → A4 = 0.254 emerged as the most powerful leverage point, while A2 → A4 = 0.199 captured the inhibitory impact of financing costs. Transmission from policy to market was notably strong through A4 → B1 = 0.288 and A3 → B2 = 0.174, indicating a rapid infusion of policy incentives into demand and economic cycles.
In the market layer, B2 → B3 = 0.249 and B1 → B3 = 0.203 demonstrated that market conditions and demand significantly enhance the supply chain’s absorptive capacity for circular resources. A high bidirectional coupling between B3 and C4 (0.216/0.246) revealed a “resonant resilience” mechanism, where external coordination and internal governance mutually reinforce one another. This, in turn, drives technological and digital implementation through C4 → C2 and C4 → C3 (both 0.213).
These linkages further lead to B3 → C1 = 0.213 and B3 → D1 = 0.280, quantitatively tracing how supply chain upgrading translates into improved cash flow and suppressed cost/price pressures. Conversely, when constrained to lower-level nodes, the model predicts that high-weight reverse pathways can rapidly propagate adverse effects upstream.
Compared to threshold-based ISM, the TAISM model provides both directionality and magnitude, highlighting its quantitative advantage. Aggregated weights point to three key leverage nodes: the fiscal-regulatory policy combination (A1–A3), supply chain resilience (B3), and organizational governance (C4). Strengthening these simultaneously amplifies policy momentum stepwise through the market, supply chain, and organizational tiers, ultimately delivering measurable benefits in financial performance and emission reductions. This supports the construction industry’s transition from a “take–make–dispose” model toward a “design–regenerate–reuse” circular paradigm.

4.3. Evaluation of Model Stability Across Expert Scenarios

The sensitivity analysis results, detailed in Table 8, demonstrate that variations in expert weighting have minimal impact on influence and causality scores, confirming the overall robustness of the causal hierarchy. Across both weighting scenarios, the influence of key factors and causality fluctuations remained within a narrow range. The average change in influence was ±0.43% under increased industry expert weighting and ±0.15% under increased academic expert weighting. Causality fluctuations were similarly modest, averaging ±2.95% and ±2.45%, respectively. Notably, 87% of the factors maintained their original hierarchical positions, indicating high structural stability.
Among the core factors, A1 (Fiscal Policy), and A4 (Infrastructure Investment) showed minimal variation and remained in both scenarios’ root and intermediary layers. C1 (cash flow management) experienced the most considerable causality fluctuation (+5.3%) when industry expert weighting increased, reflecting a higher sensitivity to practical financial concerns, yet this did not affect its hierarchical classification. D1 (Inflation), as a representative outcome variable, consistently remained in the top layer, with causality variations below ±2%.
These findings reinforce the preceding causal and hierarchical analyses. Root-level policy drivers exhibited structural inertia, while surface-level response factors remained sensitive yet hierarchically stable. The TAISM-based model thus proves robust under varying expert perspectives, supporting its reliability for guiding policy and enterprise-level decision-making.

4.4. Summary of Key Findings

By coupling DEMATEL and TAISM methods, this study quantitatively clarifies the core driving logic underlying the construction industry’s transition toward a circular economy. Fiscal incentives and market signals amplify through the supply chain and organizational nodes, achieving closed-loop outcomes in cost and emissions.
The weighted TAISM hierarchy further quantifies coupling intensities across these levels, highlighting the critical roles of supply chain and organizational nodes in amplifying policy effectiveness and achieving integrated emission and cost reduction goals. Sensitivity analysis confirmed the model’s structural robustness and scalability: 87% of variable hierarchies remained unchanged across expert-weighting scenarios, and causality fluctuations for key policy and supply chain nodes stayed within ±0.6%.
Overall, the findings provide empirical support for operationalizing circular economy strategies within the built environment. Policy levers are the initiating drivers, supply chain and organizational capacity act as transmission amplifiers, and financial and cost indicators reflect the ultimate outcomes. This multi-level, quantifiable logic framework offers clear intervention targets for policymakers and industry practitioners, facilitating a smooth transition from linear production models to a circular paradigm of “design–regenerate–reuse”.

5. Discussion

5.1. Key Findings and Mechanism Interpretation

By employing the integrated DEMATEL–TAISM model, this study provides the first quantitative confirmation of a five-stage causal chain driving the circular economy transformation in the construction industry: policy → market → supply chain → organization → performance. The root-layer nodes—fiscal incentives and subsidies (A1), credit and interest rate policies (A2), industry regulatory standards (A3), and public infrastructure investment (A4)—collectively account for 42.7% of total network edge weight, and their causality scores fluctuate by less than ±0.6% in sensitivity tests. This highlights the leading role of institutional enforcement in initiating green transformation within project-based industries [59].
Policy signals are subsequently amplified by real estate demand (B1) and industry cycles (B2), then converge at supply chain resilience (B3). A strong bidirectional coupling between B3 and organizational governance (C4)/digital integration (C3) (0.216/0.246) forms a mechanism of “resonant resilience”, which enables technological upgrading and translates into cash flow improvement (C1) and cost/price containment (D1). This pathway reveals that governance–digital alignment is the critical interface for converting external incentives into internal performance. Moreover, when policy intensity weakens, high-weight reverse pathways can rapidly trigger financial deterioration, underscoring the system’s sensitivity to external support withdrawal.

5.2. Comparison with Existing Studies and Theoretical Contributions

Unlike existing market- and technology-oriented frameworks [60], this study uniquely quantifies policy incentives’ significant role due to the construction sector’s inherent capital intensity and long investment recovery periods. This study advances unidirectional supply chain resilience models [61] by explicitly identifying a bidirectional ‘resonant resilience’ between supply chain robustness and organizational governance, highlighting internal governance’s proactive role.
Building on these distinctions, this research offers three theoretical extensions:
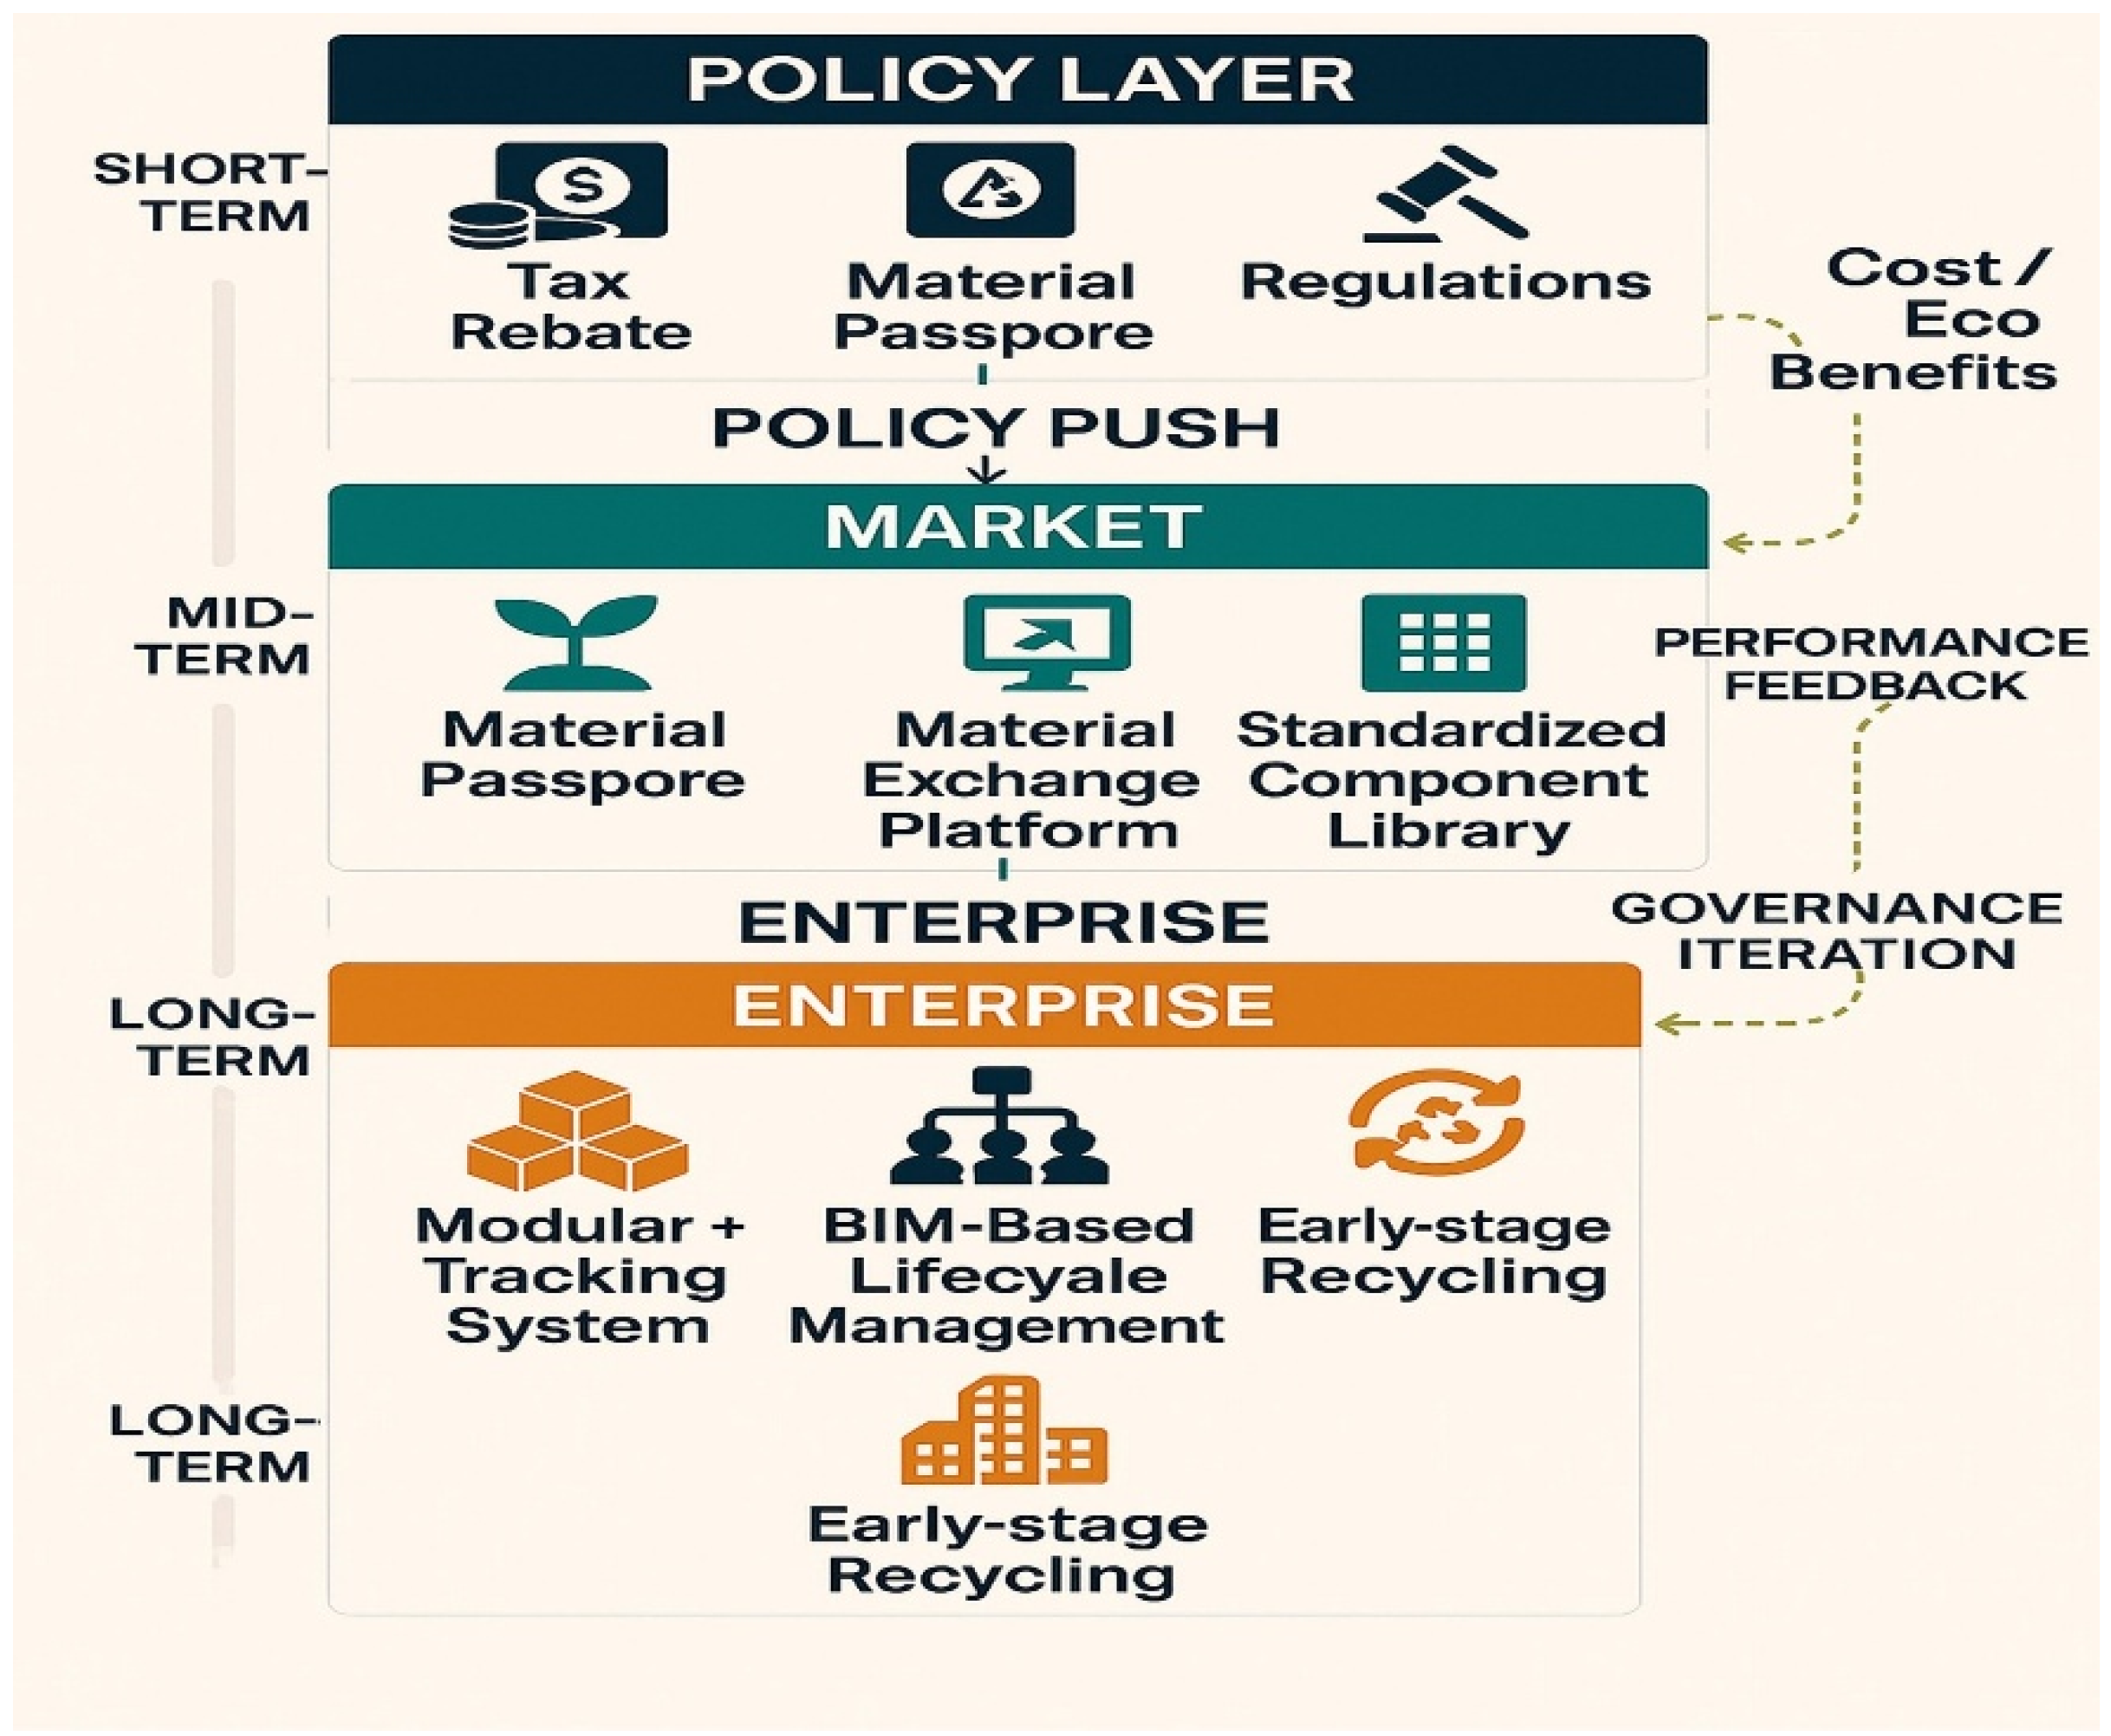
  • Policy Threshold–Market Amplification: This paper identifies a critical threshold (~30% policy weight) below which market mechanisms fail to sustain circular investments, enriching institutional economic theory.
  • Resonant Resilience: This section highlights the mutual reinforcement between supply chain resilience and organizational governance, refining dynamic capabilities theory.
  • Governance–Digital Compatibility: This paper demonstrates that digital technology effectiveness depends significantly on simultaneous governance realignment, challenging assumptions of technological determinism.

5.3. Practical Implications

Based on the findings of this study, key barriers and actionable pathways for advancing circular economy transformation in the construction sector have been identified.
At the policy level, existing short-term incentives are insufficient to induce long-term structural change. Therefore, this study recommends that the government not only provide short-term fiscal incentives but also implement long-term mandatory regulations, such as minimum recycled content requirements and design-for-disassembly mandates, supported by inter-ministerial coordination bodies to ensure consistent enforcement.
At the market level, despite the growing use of green financial instruments, significant information asymmetry and pricing uncertainties persist in the secondary construction materials market. Public procurement agencies should lead the development of digital platforms and standardized component libraries to improve market transparency, reduce transaction costs, and support the maturation of the market for secondary materials.
At the enterprise level, firms must move from reactive compliance to proactive integration. This includes embedding circularity indicators into performance evaluations, establishing cross-departmental coordination, and integrating BIM, modular construction, and material passports into core operational processes to enable lifecycle traceability and localized material reuse.
As shown in Figure 6, the proposed three-tier coordinated intervention framework forms a closed-loop pathway: policy push → market amplification → organizational coupling → cost-performance benefits. In the short term, this reduces reliance on virgin material procurement and disposal costs, while in the long term, it lays the foundation for a self-reinforcing circular construction ecosystem and sustainable competitiveness.

6. Conclusions

This study integrates DEMATEL and TAISM methods to model a five-stage causal pathway—policy → market → supply chain → organization → performance—driving the circular economy transition in construction. The study identifies three key leverage points: fiscal incentives (A1), supply chain resilience (B3), and organizational governance (C4), which underpin the policy-threshold–market-amplification mechanism and the resonant resilience effect.
Based on these findings, a three-tier strategy is proposed: (i) policy tools combining short-term tax relief and long-term regulatory mandates; (ii) green finance and digital platforms to stimulate secondary material markets; and (iii) enterprise-level adoption of BIM, modular construction, and material passports for lifecycle integration.
This integrated strategy enhances both environmental outcomes and economic performance, supporting the construction sector’s long-term sustainability.
The limitations include expert bias, regional data constraints, and reliance on cross-sectional data. Future research should validate this framework using multi-regional panel data, real-time IoT-based monitoring, and Bayesian causal inference methods.

Author Contributions

Conceptualization, Z.S. and J.P.; data curation, Z.S., G.G. and Z.X.; formal analysis, Z.S. and J.P.; funding acquisition, M.W.; investigation, Z.S. and S.Z.; methodology, Z.S. and M.W.; project administration, Z.S.; resources, Z.S. and M.W.; software, Z.S. and Y.S.; validation, Z.S.; visualization, Z.S. and Q.M.; writing—original draft, Z.S.; writing—review and editing, Z.S., J.P., M.W., G.G., Q.M., Y.S., Z.X. and S.Z. All authors have read and agreed to the published version of the manuscript.

Funding

This research was funded by the Jiangsu Provincial Scientific Research and Innovation Experimental Project, grant number kycx23-1884.

Data Availability Statement

The data supporting the findings of this study are not publicly available due to privacy and ethical restrictions.

Acknowledgments

We would like to thank the esteemed reviewers for their constructive comments and valuable suggestions, which have significantly enhanced the quality of this manuscript.

Conflicts of Interest

The authors declare no conflicts of interest.

Appendix A. DEMATEL-TAISM Methodology Steps

Appendix A.1. Expert Evaluation and Direct Impact Matrix Construction

Experts perform pairwise evaluations of n factors, assigning influence scores from 0 (no influence) to 4 (powerful influence), generating a direct impact matrix A:
A = 0 x 12 x 1 n x 21 0 x 2 n x n 1 x n 2 0

Appendix A.2. Normalization of Direct Impact Matrix

Normalize the direct impact matrix A by dividing each element by the maximum row sum to form the normalized impact matrix B:
B = x i j max j = 1 n x i j

Appendix A.3. Comprehensive Impact Matrix Calculation

The comprehensive impact matrix T integrates direct and indirect impacts by computing:
T = B + B 2 + + B k = k = 1 B k = B I B 1
where I is the identity matrix.

Appendix A.4. Influence Metrics Calculation

Calculate various influence metrics based on matrix T:
1. Influence degree ( D i ): Row sums of T:
D i = j = 1 n x i j , i = 1,2 , , n
2. Affected degree ( C i ): Column sums of T:
C i = j = 1 n x j i , i = 1,2 , , n
3. Centrality ( M i ): Importance within the system:
M i = D i + C i
4. Causality ( R i ): Net influence:
R i = D i C i
Weights for indicators are determined by normalizing the centrality M i .

Appendix A.5. Causal Diagram

Plotting centrality ( M i ) on the x-axis and Causality ( R i ) on the y-axis visually represents causal interactions among factors.

Appendix A.6. Thresholding to Form Adjacency Matrix

Define threshold λ based on mean ( x ¯ ) and standard deviation (σ) of all elements in T:
λ = x ¯ + σ
From the adjacency matrix C :
C i j = T i j ,   i f   T i j λ 0 ,   i f   T i j < λ

Appendix A.7. Reachability and General Skeleton Matrix

Compute reachability matrix M:
A + I K 1 A + I K = A + I K + 1 = M
Derive simplified matrix M′ by aggregating identical rows and columns. Compute general skeleton matrix S by reducing redundant paths:
S = M M I 2 I

Appendix A.8. Cyclic Marking Matrix (WS) Construction

Replace entries marked “1” in skeleton matrix S with the corresponding values from comprehensive impact matrix T . Cyclic relationships (if any) are noted separately:
  • “1” indicates cyclic relationships.
  • “0” indicates no mutual influence.
  • Numeric values represent comprehensive impacts.

Appendix A.9. Hierarchical Extraction

Extract UP-type (results-first) and DOWN-type (causes-first) hierarchies from matrix M :
  • UP-type (top-down): Assign factors whose reach sets are equal to their intersection sets to top levels; remove them iteratively.
  • DOWN-type (bottom-up): Assign factors whose precedent sets equal their intersection sets to bottom levels; remove them iteratively.

Appendix A.10. Multi-Level Hierarchical Structure Model

Combine hierarchical extraction results and comprehensive impact values from WS to construct a multilayered causal model. This structured representation clarifies factor interrelationships and their relative hierarchical positions, supporting strategic decision-making.

References

  1. Karaca, F.; Tleuken, A.; Pineda-Martos, R.; Ros Cardoso, S.; Orel, D.; Askar, R.; Agibayeva, A.; Güemez, E.G.; Salles, A.; Varol, H.A. Cultivating sustainable construction: Stakeholder insights driving circular economy innovation for inclusive resource equity. Buildings 2024, 14, 935. [Google Scholar] [CrossRef]
  2. Mikulėnas, M.; Šeduikytė, L. Circularity and Decarbonization Synergies in the Construction Sector: Implications for Zero-Carbon Energy Policy. Energies 2025, 18, 1164. [Google Scholar] [CrossRef]
  3. Zhou, H.; Zhao, Y.; Zhang, Z.; Geng, Y.; Yu, J.; Lin, B. Post occupancy investigation of 40 certified green buildings in Beijing: Results, lessons and policy suggestions. J. Build. Eng. 2022, 60, 105153. [Google Scholar] [CrossRef]
  4. Chen, Q.; Feng, H.; de Soto, B.G. Revamping construction supply chain processes with circular economy strategies: A systematic literature review. J. Clean. Prod. 2022, 335, 130240. [Google Scholar] [CrossRef]
  5. Li, F.; Na, P.; Mahmood, S.; Wang, X.; Ahmed, T. State Ownership and the Sustainable Development of Private Enterprises: Exploring the Role of State Ownership Participation. SAGE Open 2025, 15, 21582440251321848. [Google Scholar] [CrossRef]
  6. Zhang, R.; Yan, H. Complex system risk assessment model based on improved cloud DEMATEL-TAISM. Civ. Eng. Environ. Syst. 2024, 42, 1–24. [Google Scholar] [CrossRef]
  7. Luthin, A.; Traverso, M.; Crawford, R.H. Circular life cycle sustainability assessment: An integrated framework. J. Ind. Ecol. 2024, 28, 41–58. [Google Scholar] [CrossRef]
  8. Liu, Y.; Pedrycz, W.; Deveci, M.; Chen, Z.-S. BIM-based building performance assessment of green buildings-A case study from China. Appl. Energy 2024, 373, 123977. [Google Scholar] [CrossRef]
  9. Tam, V.W.; Zhou, Y.; Illankoon, C.; Le, K.N. A critical review on BIM and LCA integration using the ISO 14040 framework. Build. Environ. 2022, 213, 108865. [Google Scholar] [CrossRef]
  10. Graessler, S.; Guenter, H.; de Jong, S.B.; Henning, K.J. Organizational change towards the circular economy: A systematic review of the literature. Int. J. Manag. Rev. 2024, 26, 556–579. [Google Scholar] [CrossRef]
  11. Singh, R.K. Exploring the impact of green supply chain strategies and sustainable practices on circular supply chains. Benchmarking Int. J. 2025, 32, 1387–1409. [Google Scholar] [CrossRef]
  12. Namaki, P.; Vegesna, B.S.; Bigdellou, S.; Chen, R.; Chen, Q. An Integrated Building Information Modeling and Life-Cycle Assessment Approach to Facilitate Design Decisions on Sustainable Building Projects in Canada. Sustainability 2024, 16, 4718. [Google Scholar] [CrossRef]
  13. Kabir, M.R.; Halder, D.; Ray, S. Digital Twins for IoT-Driven Energy Systems: A Survey. IEEE Access 2024, 12, 177123–177143. [Google Scholar] [CrossRef]
  14. Jraisat, L.; Upadhyay, A.; Ghalia, T.; Jresseit, M.; Kumar, V.; Sarpong, D. Triads in sustainable supply-chain perspective: Why is a collaboration mechanism needed? Int. J. Prod. Res. 2023, 61, 4725–4741. [Google Scholar] [CrossRef]
  15. Dantas, S.M.C.; Mendes, A.A. Exploring the Interplay of Agile Methodologies, Resilience, and ESG in Supply Chains: A Bibliometric Review and Qualitative Analysis. Exacta 2024, 23, e25048. [Google Scholar] [CrossRef]
  16. Wasserbaur, R.; Sakao, T.; Milios, L. Interactions of governmental policies and business models for a circular economy: A systematic literature review. J. Clean. Prod. 2022, 337, 130329. [Google Scholar] [CrossRef]
  17. Yang, G.; Deng, F. The impact of digital transformation on enterprise vitality–evidence from listed companies in China. Technol. Anal. Strat. Manag. 2024, 36, 3955–3972. [Google Scholar] [CrossRef]
  18. Upadhyay, A.; Shukla, A. Development of circular supply chain implementation model for MSMEs using extended theory of planned behaviour and DEMATEL approach. Manag. Sci. Lett. 2025, 15, 113–122. [Google Scholar] [CrossRef]
  19. Peng, J.; Su, Z.; Liu, X.; Ma, C. Promoting Low-Carbonization in the Construction Supply Chain: Key Influencing Factors and Sustainable Practices. Sustainability 2025, 17, 3375. [Google Scholar] [CrossRef]
  20. Liu, H.; Yu, H.; Zhou, H.; Zhang, X. Research on the Influencing Factors of Construction Enterprises’ Digital Transformation Based on DEMATEL-TAISM. Sustainability 2023, 15, 9251. [Google Scholar] [CrossRef]
  21. Bian, Y.-j.; Xie, L.; Li, J.-Q. Research on influencing factors of artificial intelligence multi-cloud scheduling applied talent training based on DEMATEL-TAISM. J. Cloud Comput. 2022, 11, 35. [Google Scholar] [CrossRef]
  22. Platon, V.; Frone, S.; Constantinescu, A.; Jurist, S.; Banghiore, G.; Moise, O. Circular economy and economic instruments in the EU and Romania. Rom. J. Econ. 2024, 59, 5–24. [Google Scholar]
  23. Xiao, Z.; Niu, Y.; Xiang, L.; Cui, Y. Central bank digital currency and corporate debt financing costs: Empirical evidence from China. Financ. Res. Lett. 2024, 69, 106195. [Google Scholar] [CrossRef]
  24. Jamoussi, B.; Abu-Rizaiza, A.; AL-Haij, A. Sustainable building standards, codes and certification systems: The status quo and future directions in Saudi Arabia. Sustainability 2022, 14, 10314. [Google Scholar] [CrossRef]
  25. Vagtholm, R.; Matteo, A.; Vand, B.; Tupenaite, L. Evolution and current state of building materials, construction methods, and building regulations in the UK: Implications for sustainable building practices. Buildings 2023, 13, 1480. [Google Scholar] [CrossRef]
  26. Wang, F.; Yao, M.; Huang, X.; Guo, H.; Zheng, P.; Yu, H. The effects of investment in major construction projects on regional economic growth quality: A difference-in-differences analysis based on ppp policy. Sustainability 2022, 14, 6796. [Google Scholar] [CrossRef]
  27. Rifai, A.; Irawan, T.; Indrawan, D. The Effect of Government Policy on Infrastructure Priorities on the Profitability of Construction Companies in Indonesia 2011-2019. J. Indones. Econ. Bus. 2024, 39, 308–327. [Google Scholar] [CrossRef]
  28. Ajeeb, S.; Lai, W.S. The impact of the mortgage on the real estate market: A study case in Saudi Arabia. Int. J. Hous. Mark. Anal. 2024, 17, 329–344. [Google Scholar] [CrossRef]
  29. Kim, K.-B.; Cho, J.-H.; Kim, S.-B. Model-based dynamic forecasting for residential construction market demand: A systemic approach. Appl. Sci. 2021, 11, 3681. [Google Scholar] [CrossRef]
  30. Kumar, P.; Yerramilli, V. Firm size, capital investment, and debt financing over industry business cycles. J. Financ. Quant. Anal. Forthcom. 2025, 60, 524–550. [Google Scholar] [CrossRef]
  31. Chodorow-Reich, G.; Wieland, J. Secular labor reallocation and business cycles. J. Political Econ. 2020, 128, 2245–2287. [Google Scholar] [CrossRef]
  32. Ghansah, F.A.; Lu, W.; Ababio, B.K. Modelling the critical challenges of quality assurance of cross-border construction logistics and supply chain during the COVID-19 pandemic. Eng. Constr. Arch. Manag. 2024, 31, 2128–2150. [Google Scholar] [CrossRef]
  33. Le, P.L.; Jarroudi, I.; Dao, T.-M.; Chaabane, A. Integrated construction supply chain: An optimal decision-making model with third-party logistics partnership. Constr. Manag. Econ. 2021, 39, 133–155. [Google Scholar] [CrossRef]
  34. Wen, S.; Tang, H.; Ying, F.; Wu, G. Exploring the global research trends of supply chain management of construction projects based on a bibliometric analysis: Current status and future prospects. Buildings 2023, 13, 373. [Google Scholar] [CrossRef]
  35. Zhang, K.; Chen, L.; Zhou, X. Transmission of risk to China’s construction industry due to international interest rate fluctuations. Eng. Constr. Arch. Manag. 2025, 32, 1781–1797. [Google Scholar] [CrossRef]
  36. Zhou, W.; Xia, S.; Ye, J.; Zhang, N. How Do International Contractors Choose Target Market Based on Environmental, Social and Governance Principles? A Fuzzy Ordinal Priority Approach Model. Sustainability 2024, 16, 1203. [Google Scholar] [CrossRef]
  37. Rompotis, G. Cash flow management, performance and risk: Evidence from Greece. EuroMed J. Bus. 2024, 23, 245. [Google Scholar] [CrossRef]
  38. Youssef, M.A.; Ibrahim, A.H.; El-Badawy Hafez, M.J. Impact factors on subcontractor’s cash flow management. Civ. Eng. J. 2023, 9, 94–104. [Google Scholar] [CrossRef]
  39. Jemal, K.M.; Kabzhassarova, M.; Shaimkhanov, R.; Dikhanbayeva, D.; Turkyilmaz, A.; Durdyev, S.; Karaca, F. Facilitating circular economy strategies using digital construction tools: Framework development. Sustainability 2023, 15, 877. [Google Scholar] [CrossRef]
  40. Ogunmakinde, O.E.; Egbelakin, T.; Sher, W. Contributions of the circular economy to the UN sustainable development goals through sustainable construction. Resour. Conserv. Recycl. 2022, 178, 106023. [Google Scholar] [CrossRef]
  41. Atuahene, B.T.; Kanjanabootra, S.; Gajendran, T. Transformative role of big data through enabling capability recognition in construction. Constr. Manag. Econ. 2023, 41, 208–231. [Google Scholar] [CrossRef]
  42. Jin, R.; Hancock, C.; Tang, L.; Chen, C.; Wanatowski, D.; Yang, L. Empirical study of BIM implementation–based perceptions among Chinese practitioners. J. Manag. Eng. 2017, 33, 04017025. [Google Scholar] [CrossRef]
  43. Ershadi, M.; Jefferies, M.; Davis, P.; Mojtahedi, M. Modeling the capabilities of high-performing project management offices in general contracting companies. Proj. Manag. J. 2023, 54, 268–284. [Google Scholar] [CrossRef]
  44. Neiroukh, S.; Emeagwali, O.L.; Aljuhmani, H.Y. Artificial intelligence capability and organizational performance: Unraveling the mediating mechanisms of decision-making processes. Manag. Decis. 2024, 10, 1946. [Google Scholar] [CrossRef]
  45. Jahan, S.; Khan, K.I.A.; Thaheem, M.J.; Ullah, F.; Alqurashi, M.; Alsulami, B.T. Modeling profitability-influencing risk factors for construction projects: A system dynamics approach. Buildings 2022, 12, 701. [Google Scholar] [CrossRef]
  46. Yuan, Q.; Sun, Y.; Ren, J. How interest rate influences a business cycle model. Contin. Dyn. Syst. 2020, 13, 3231–3251. [Google Scholar] [CrossRef]
  47. Yu, M.; Wang, N. The influence of geopolitical risk on international direct investment and its countermeasures. Sustainability 2023, 15, 2522. [Google Scholar] [CrossRef]
  48. Le, A.-T.; Tran, T.P. Does geopolitical risk matter for corporate investment? Evidence from emerging countries in Asia. J. Multinatl. Financ. Manag. 2021, 62, 100703. [Google Scholar] [CrossRef]
  49. Ling, F.Y.; Zhang, Z.; Yew, A.Y.J. Impact of COVID-19 pandemic on demand, output, and outcomes of construction projects in Singapore. J. Manag. Eng. 2022, 38, 04021097. [Google Scholar] [CrossRef]
  50. Brucker Juricic, B.; Galic, M.; Marenjak, S. Review of the Construction Labour Demand and Shortages in the EU. Buildings 2021, 11, 17. [Google Scholar] [CrossRef]
  51. Liu, G.; Aroean, L.; Ko, W.W.; Management, P. Power, shared goals and supplier flexibility: A study of the HUB-and-spoke supply chain. Int. J. Oper. Prod. Manag. 2022, 42, 182–205. [Google Scholar] [CrossRef]
  52. Kamalahmadi, M.; Shekarian, M.; Mellat Parast, M. The impact of flexibility and redundancy on improving supply chain resilience to disruptions. Int. J. Prod. Res. 2022, 60, 1992–2020. [Google Scholar] [CrossRef]
  53. Bertassini, A.C.; Ometto, A.R.; Severengiz, S.; Gerolamo, M.C. Circular economy and sustainability: The role of organizational behaviour in the transition journey. Bus. Strat. Environ. 2021, 30, 3160–3193. [Google Scholar] [CrossRef]
  54. Castro-Lopez, A.; Iglesias, V.; Santos-Vijande, M.L. Organizational capabilities and institutional pressures in the adoption of circular economy. J. Bus. Res. 2023, 161, 113823. [Google Scholar] [CrossRef]
  55. Rahla, K.M.; Mateus, R.; Bragança, L. Implementing circular economy strategies in buildings—From theory to practice. Appl. Syst. Innov. 2021, 4, 26. [Google Scholar] [CrossRef]
  56. Takacs, F.; Brunner, D.; Frankenberger, K. Barriers to a circular economy in small-and medium-sized enterprises and their integration in a sustainable strategic management framework. J. Clean. Prod. 2022, 362, 132227. [Google Scholar] [CrossRef]
  57. Chabowski, B.R.; Gabrielsson, P.; Hult, G.T.M.; Morgeson III, F.V. Sustainable international business model innovations for a globalizing circular economy: A review and synthesis, integrative framework, and opportunities for future research. J. Int. Bus. Stud. 2025, 56, 383–402. [Google Scholar] [CrossRef]
  58. Si, S.-L.; You, X.-Y.; Liu, H.-C.; Zhang, P. DEMATEL technique: A systematic review of the state-of-the-art literature on methodologies and applications. Math. Probl. Eng. 2018, 2018, 3696457. [Google Scholar] [CrossRef]
  59. Zhang, X.; Wu, Y.; Shen, L. Embedding “green” in project-based organizations: The way ahead in the construction industry? J. Clean. Prod. 2015, 107, 420–427. [Google Scholar] [CrossRef]
  60. Chen, A.; Li, L.; Shahid, W. Digital transformation as the driving force for sustainable business performance: A moderated mediation model of market-driven business model innovation and digital leadership capabilities. Heliyon 2024, 10, e29509. [Google Scholar] [CrossRef] [PubMed]
  61. Shishodia, A.; Sharma, R.; Rajesh, R.; Munim, Z.H. Supply chain resilience: A review, conceptual framework and future research. Int. J. Logist. Manag. 2023, 34, 879–908. [Google Scholar] [CrossRef]
Figure 1. Overall Framework Diagram.
Buildings 15 02110 g001
Figure 2. Research Methodology Framework Chart.
Buildings 15 02110 g002
Figure 3. DEMATEL-TAISM flowchart.
Buildings 15 02110 g003
Figure 4. Causality diagram.
Buildings 15 02110 g004
Figure 5. Adversarial Multi-level Hierarchical Structure Model of Influencing Factors.
Buildings 15 02110 g005
Figure 6. Policy–Market–Enterprise interventions.
Buildings 15 02110 g006
Table 1. Key Influencing Factors of Construction Enterprise Vitality.
Influencing FactorsReferenceDefinition
Fiscal Incentives and Subsidies F1Platon, V. [22]Government-imposed tax reductions and financial subsidies to encourage construction enterprises to adopt green building technologies and circular economy models.
Credit and Interest Rate Policies F2Z. Xiao [23]Central bank policies adjust interest rates and credit availability, influencing construction enterprises’ financing costs and investment decisions.
Sectoral Regulatory Standards F3Jamoussi, B. [24]
R. Vagtholm [25]
Standards related to environmental protection and construction codes regulate the operations of construction enterprises to promote resource recycling and sustainable building.
Public Infrastructure Funding F4Wang, F. [26]
Rifai, A. [27]
Government investment in infrastructure development provides construction enterprises with opportunities to engage in green building and circular economy practices.
Adjustment of the Real Estate Market Dynamics F5Ajeeb, S. [28]
Kim, K. B. [29]
Market fluctuations, influenced by economic cycles, policy adjustments, and supply–demand changes, affect construction enterprises’ project planning and resource allocation.
Sectoral Economic Cycles F6Kumar, P. [30]
Chodorow-Reich, G. [31]
Due to economic and market factors, periodic growth and decline phases within the construction industry impact enterprises’ strategic planning and sustainability capabilities.
Supply Chain Resilience F7Ghansah, F. A. [32]
Le, P. L. [33]
S. Wen [34]
The ability of supply chains to maintain stable operations amidst external shocks, ensuring continuity of construction projects and efficient resource utilization.
Global Market Variability F8Zhang, K. [35]
Zhou, W. [36]
Changes in international markets are driven by economic, political, and trade factors that affect cross-border projects and resource acquisition of construction enterprises.
Liquidity Control F9Rompotis, G. [37]
Youssef, M. A. [38]
Managing cash inflows and outflows to ensure financial stability and flexibility during the green transition process.
Technology Advancement F10Jemal, K. M. [39]
Ogunmakinde, O. E. [40]
Developing and applying new technologies to enhance efficiency and sustainability in construction processes, supporting circular economy practices.
Digital Integration F11Atuahene, B. T. [41]
Jin, R. [42]
Integrating advanced digital technologies into construction processes to improve resource efficiency and project management capabilities.
Organizational Management Skills F12Ershadi, M. [43]
Neiroukh, S. [44]
Enhancing management skills and strategic execution capabilities of enterprises to support the implementation of green building and circular economy models.
Cost Escalation F13Jahan, S. [45]Rising prices of materials and labor, increasing construction project costs, and affecting profitability and sustainability of enterprises.
Increased Borrowing Costs F14Zhang, K. [35]
Yuan, Q. [46]
Higher interest rates lead to increased financing costs, limiting the investment capacity of construction enterprises in green projects.
Global Political Conditions F15Yu, M. [47]
Le, A. T. [48]
International political and economic factors impact the stability and security of international projects undertaken by construction enterprises.
Workforce Scarcity F16Ling, F. Y. [49]
Brucker Juricic [50]
A shortage of skilled labor leads to increased costs and project delays, hindering the advancement of green building and circular economy practices.
Adaptive Supply Chain Practices F17Liu, G. [51]
Kamalahmadi, M. [52]
Enhancing resource allocation and risk response capabilities of construction enterprises in uncertain environments through flexible supply chain management.
Change Management Capability F18Bertassini, A. C. [53]
Castro-Lopez, A. [54]
The ability of enterprises to adjust organizational structures and processes to meet the requirements of green transformation and circular economy.
Strategic Adaptation F19Rahla, K. M. [55]
Takacs, F. [56]
Adjusting the strategic direction of enterprises to enhance competitiveness and responsiveness in green building and circular economy sectors.
Global Expansion Capacity F20Chabowski, B. R. [57]The ability of enterprises to successfully expand into international markets while maintaining domestic competitiveness, promoting globalization of green building and circular economy models.
Table 2. Demographic Characteristics of Survey Respondents ( N = 150).
VariableFormFrequencyPercentages
Enterprise ownershipA. State-owned enterprise5838.67%
B. Private enterprise7248.00%
C. Foreign/Joint venture128.00%
D. Other85.33%
PositionA. Top-level management (CEO/CFO)2516.67%
B. Middle-level management6543.33%
C. Front-line management6040.00%
Enterprise sizeA. <100 employees2818.67%
B. 100–300 employees4228.00%
C. 300–1000 employees5536.67%
D. >1000 employees2516.67%
Primary businessA. Residential construction6241.33%
B. Infrastructure construction6845.33%
C. Commercial real estate2013.33%
Years establishedA. <5 years1812.00%
B. 5–10 years3523.33%
C. 10–20 years5234.67%
D. >20 years4530.00%
Market coverageA. Domestic-focused10570.00%
B. Overseas-focused1510.00%
C. Both domestic and international3020.00%
Note: Percentages are rounded to two decimal places and may not sum to 100%.
Table 3. Reliability testing.
ItemsCorrected Item-Total Correlation (CITC)Cronbach’s Alpha if Item DeletedCronbach α
Financial policy 0.5180.9220.924
Monetary policy 0.5500.921
Industry regulatory policies 0.6240.919
Government infrastructure investment 0.6150.920
Adjustment of the real estate market 0.6960.918
Industry cycle fluctuations 0.7110.917
Supply chain stability 0.6020.920
International market fluctuations 0.6060.920
Cash flow management 0.4730.922
technological innovation 0.6580.919
Digital transformation 0.6150.920
Business management capabilities 0.5320.921
Inflation 0.6270.919
Rising interest rates0.6000.920
Geopolitics 0.5300.921
Labor shortages0.5790.920
Flexible supply chain management0.5410.921
Organizational change capacity0.6150.920
Strategic realignment0.5160.922
Internationalization capability0.5970.920
Table 4. Validity test.
Test ItemValue
KMO0.857
Chi-Square1926.296
Bartlett’s Test of Sphericitydf190
p0.000
Table 5. Post-rotation factor loading coefficients.
ItemsFactor Loading FactorCommonality (Common Factor Variance)
Factor 1Factor 2Factor 3Factor 4Factor 5
Financial Policy0.0700.1890.7920.0280.1990.709
Monetary policy0.1720.1000.7990.1320.1340.714
Industry regulatory policies0.1380.1060.7830.2750.1950.758
Government infrastructure investment0.2020.0840.7420.2210.2190.695
Adjustment of the real estate market0.8110.2060.2300.2010.1750.824
Industry cycle fluctuations0.7710.2250.1950.2220.2420.790
Supply Chain Stability0.8170.0830.1300.2440.1430.771
International market fluctuations0.8210.1800.0920.1880.1520.774
Cash flow management0.0840.8970.0640.1090.0580.831
technological innovation0.2660.7550.1800.2440.1460.753
Digital transformation0.3040.7830.1290.1050.1790.766
Business management capabilities0.0580.8220.1460.1610.1550.750
Inflation0.2640.1360.2220.7630.1150.733
Rising interest rates0.2000.2210.1150.7140.2010.653
Geopolitics0.2630.1070.1760.7270.0030.640
Labor shortages0.1010.1460.1120.8350.2130.787
Flexible supply chain management0.1850.0600.1830.0900.8260.762
Organizational change capacity0.1340.1220.2590.3030.6860.662
Strategic realignment0.1670.1930.0840.0780.7700.671
Internationalization capability0.1610.1630.3590.1200.6620.635
Note: Blue indicates that the absolute value of the loading coefficient is greater than 0.4. Rotation method: maximum variance method (Varimax).
Table 6. Factor coding.
DimensionName of Influencing FactorEncodings
Policy adaptabilityFiscal incentives and subsidiesA1
Credit and interest rate policiesA2
Sectoral regulatory standardsA3
Public infrastructure fundingA4
Market environmentReal estate market dynamicsB1
Sectoral economic cyclesB2
Supply chain resilienceB3
Global market variabilityB4
Enterprise competitivenessLiquidity controlC1
Technology advancementC2
Digital integrationC3
Organizational management skillsC4
External riskCost escalationD1
Increased borrowing costsD2
Global political conditionsD3
Workforce scarcityD4
Enterprise adaptive capacityAdaptive supply chain practicesE1
Change management capabilityE2
Strategic adaptationE3
Global expansion capacityE4
Table 7. Degrees of influence, influenced, causality, and center.
FactorInfluenceRankInfluencedRankCausalityRankCenterRank
A11.9638710191.9638741.963871
A21.5378340181.5378371.537832
A31.8150520.22951152.0445631.585543
A41.7878630.6404272.4282811.147444
B11.1494650.8762692.0257250.27327
B21.4317460.78417102.2159120.647575
B31.2051271.1732132.3783360.031918
B40.7629780.03279170.79576160.730186
C10.7427291.4246322.167358−0.6819115
C20.52303120.36204140.88507150.160999
C30.61421100.48169121.0959120.1325210
C40.70534110.7601681.465510−0.0548214
D10.13115161.6738811.805039−1.5427318
D20181.3828851.3828813−1.3828817
D30.14754150.27089160.4184317−0.1233512
D40190.57002130.5700218−0.5700213
E10.12427171.3188141.4430811−1.1945419
E20.26901131.2133361.4823414−0.9443216
E30.2623141.0368811−0.77458151.2991815
E40200.9418710−0.94187200.9418716
Table 8. Sensitivity Analysis.
Scenario 1 (Increased Weighting of Industry Experts)Scenario 1 (Increased Weighting of Academic Experts)
FactorInfluence FluctuationCause FluctuationHierarchical StabilityFactorInfluence FluctuationCause FluctuationHierarchical Stability
A1+0.5% (2.15)+0.4% (+1.99)Root cause layer (unchanged)A1−0.3% (2.12)−0.5% (+1.98)Root cause layer (unchanged)
A4+0.3% (1.30)+1.1% (−0.32)Intermediary layer (unchanged)A4+0.4% (1.33)−2.5% (−0.34)Intermediary layer (unchanged)
C1+0.6% (1.71)+5.3% (+0.20)Intermediary layer (unchanged)C1−0.5% (1.68)−4.8% (+0.18)Intermediary layer (unchanged)
D1+0.3% (0.1318)+2.0% (+1.7059)Outcome layer (unchanged)D1−0.2% (0.1313)−1.0% (+1.6575)Outcome layer (unchanged)
Global StatisticsAverage fluctuation: ±0.43%Average fluctuation: ±2.95%87% factor tier stability Average fluctuation: ±0.15%Average fluctuation: ±2.45%87% factor tier stability
Disclaimer/Publisher’s Note: The statements, opinions and data contained in all publications are solely those of the individual author(s) and contributor(s) and not of MDPI and/or the editor(s). MDPI and/or the editor(s) disclaim responsibility for any injury to people or property resulting from any ideas, methods, instructions or products referred to in the content.

