
Research on the Method of Automatic Generation and Multi-Objective Optimization of Block Spatial Form Based on Thermal Comfort Demand


Abstract
1. Introduction
1.1. Research Background
1.2. Previous Studies
1.2.1. Advances in Thermal Comfort Assessment and Simulation Techniques
1.2.2. Algorithm Optimization and Multi-Objective Integration
2. Methods
2.1. Extraction of Typical Urban Blocks and Building Prototypes
2.1.1. Typical Urban Block Morphology and Scale
2.1.2. Extraction of Building Prototypes
2.2. Platform Construction
2.2.1. Parameter Presetting and Model Generation
2.2.2. Performance Simulation
2.2.3. Algorithm-Based Optimization Search
3. Results
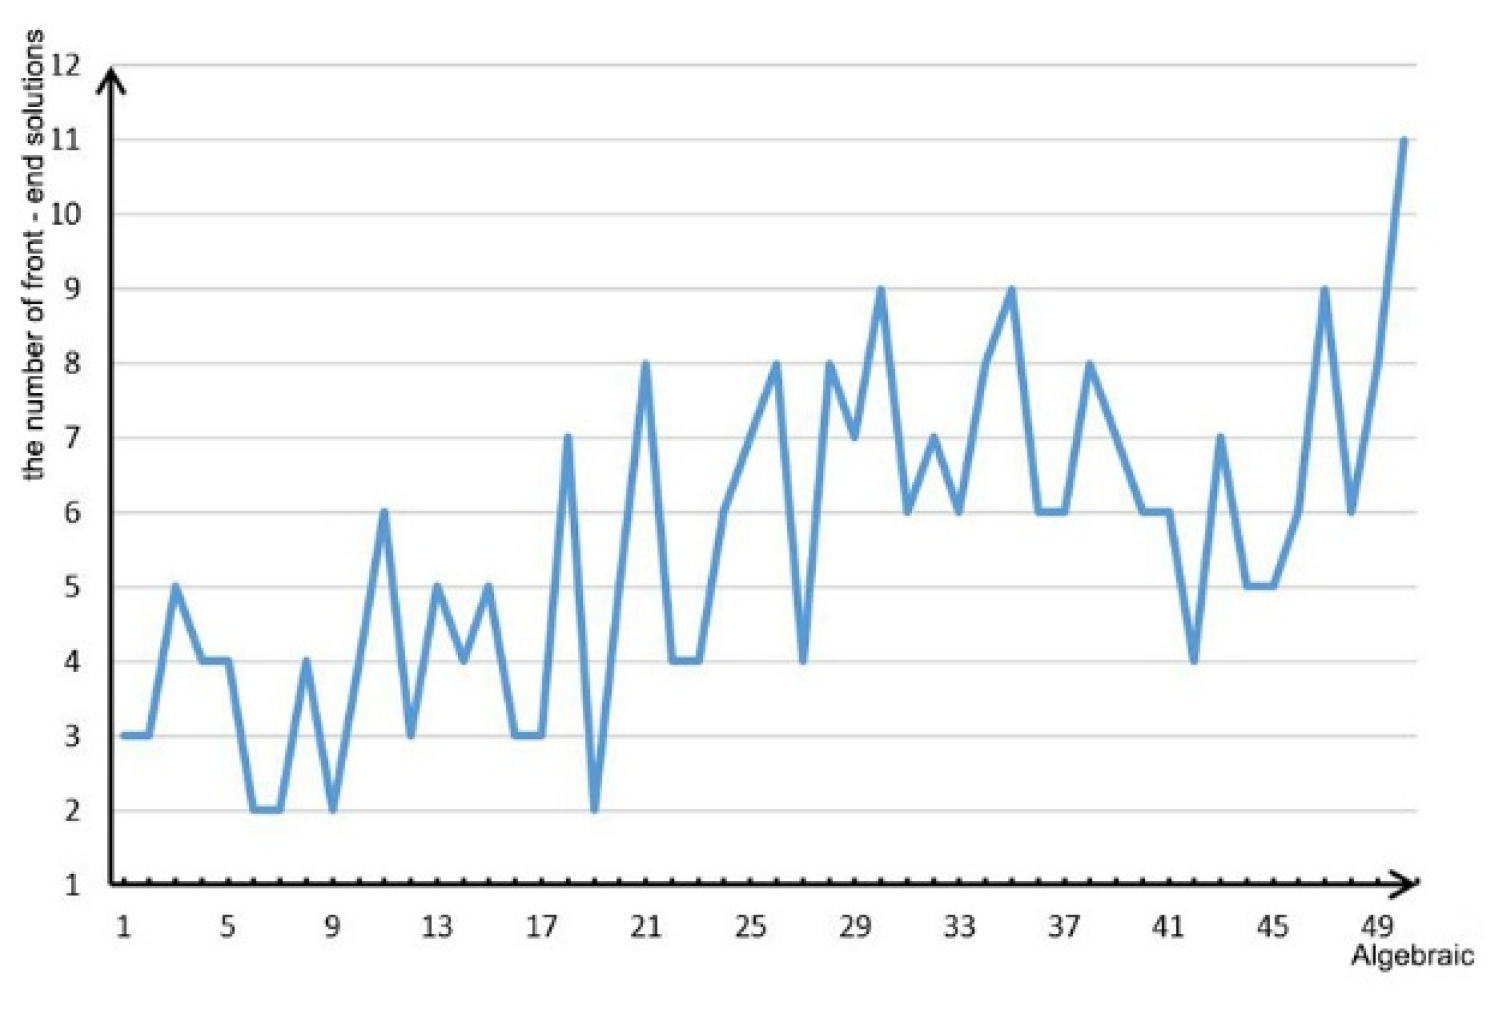
3.1. Convergence Analysis
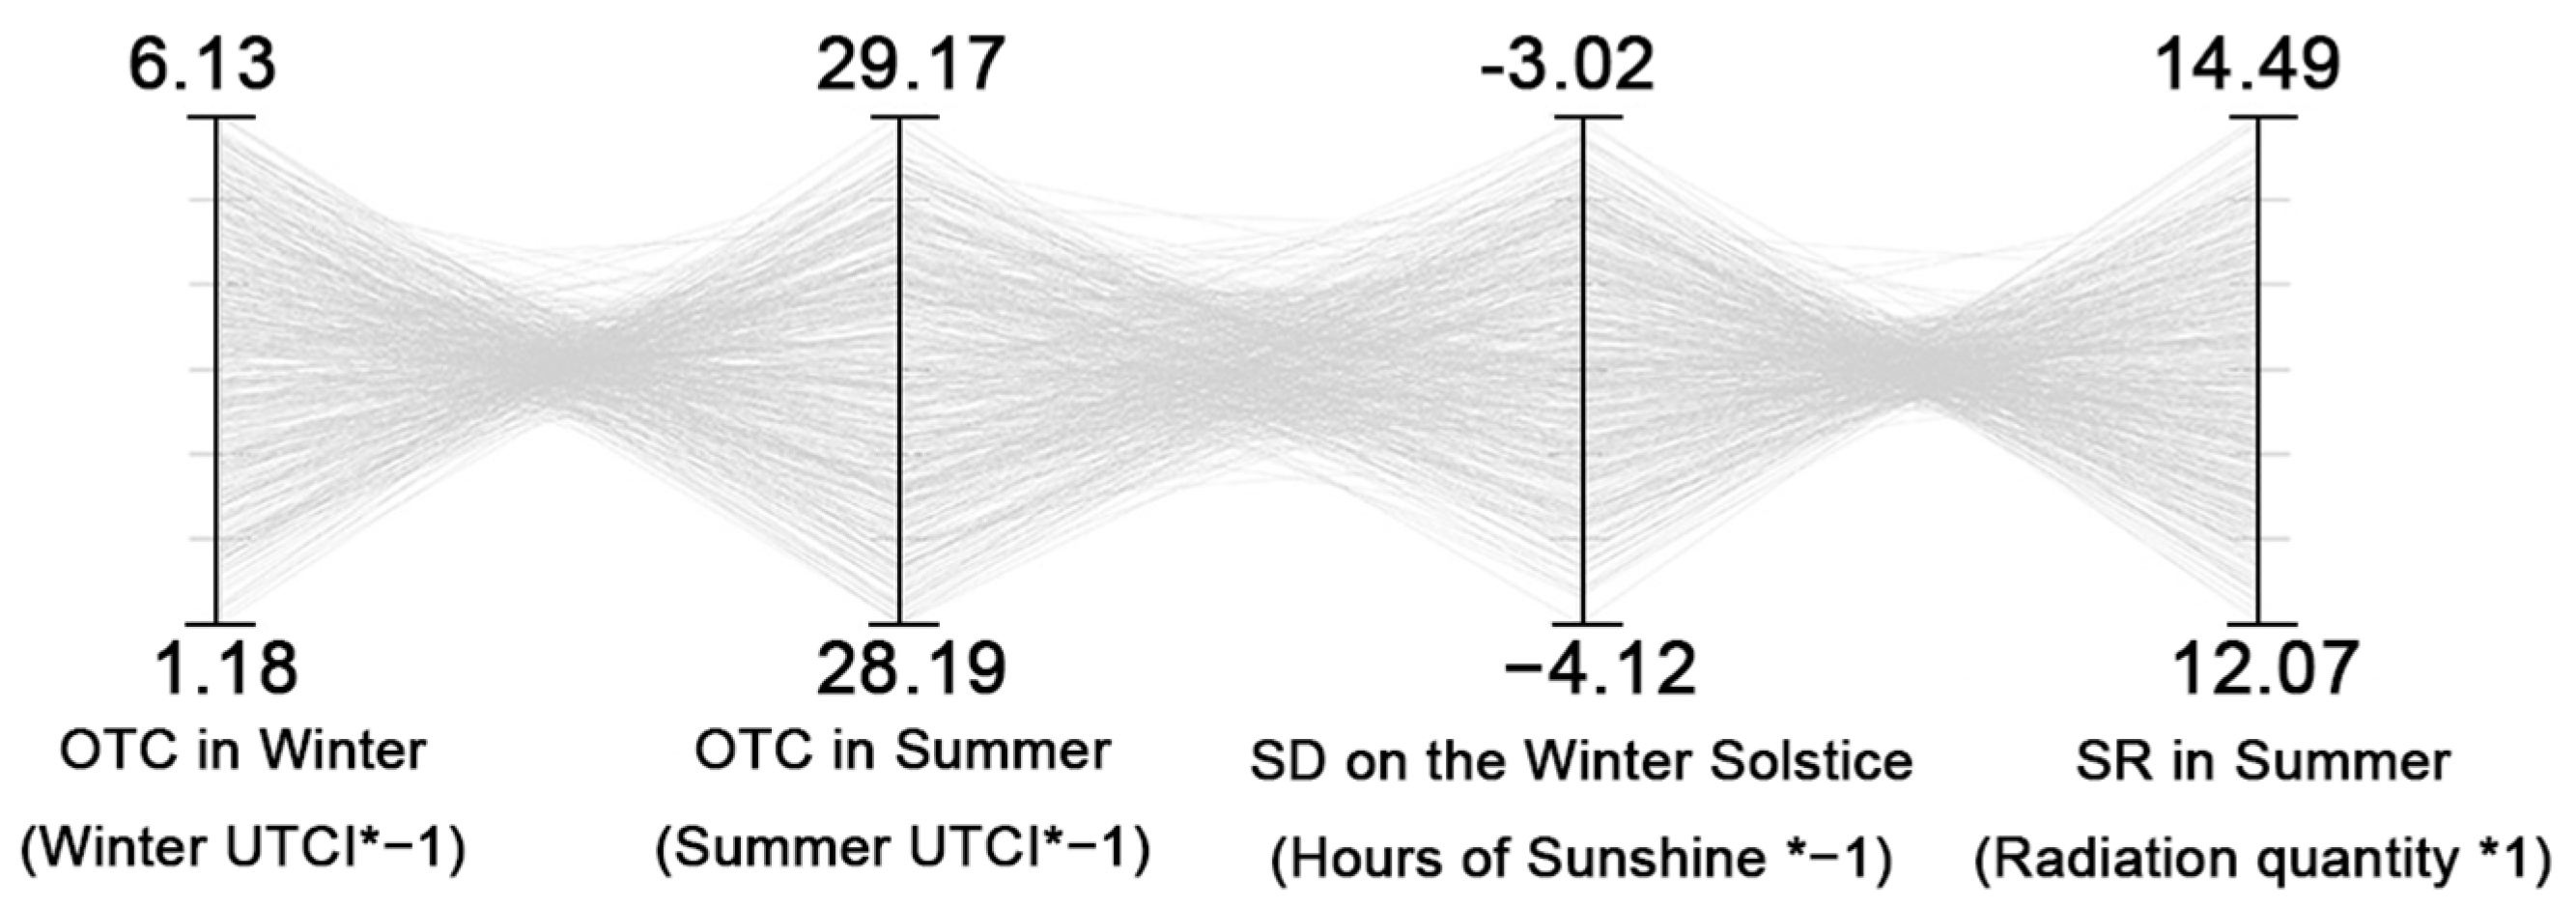
3.2. Pareto Front Analysis
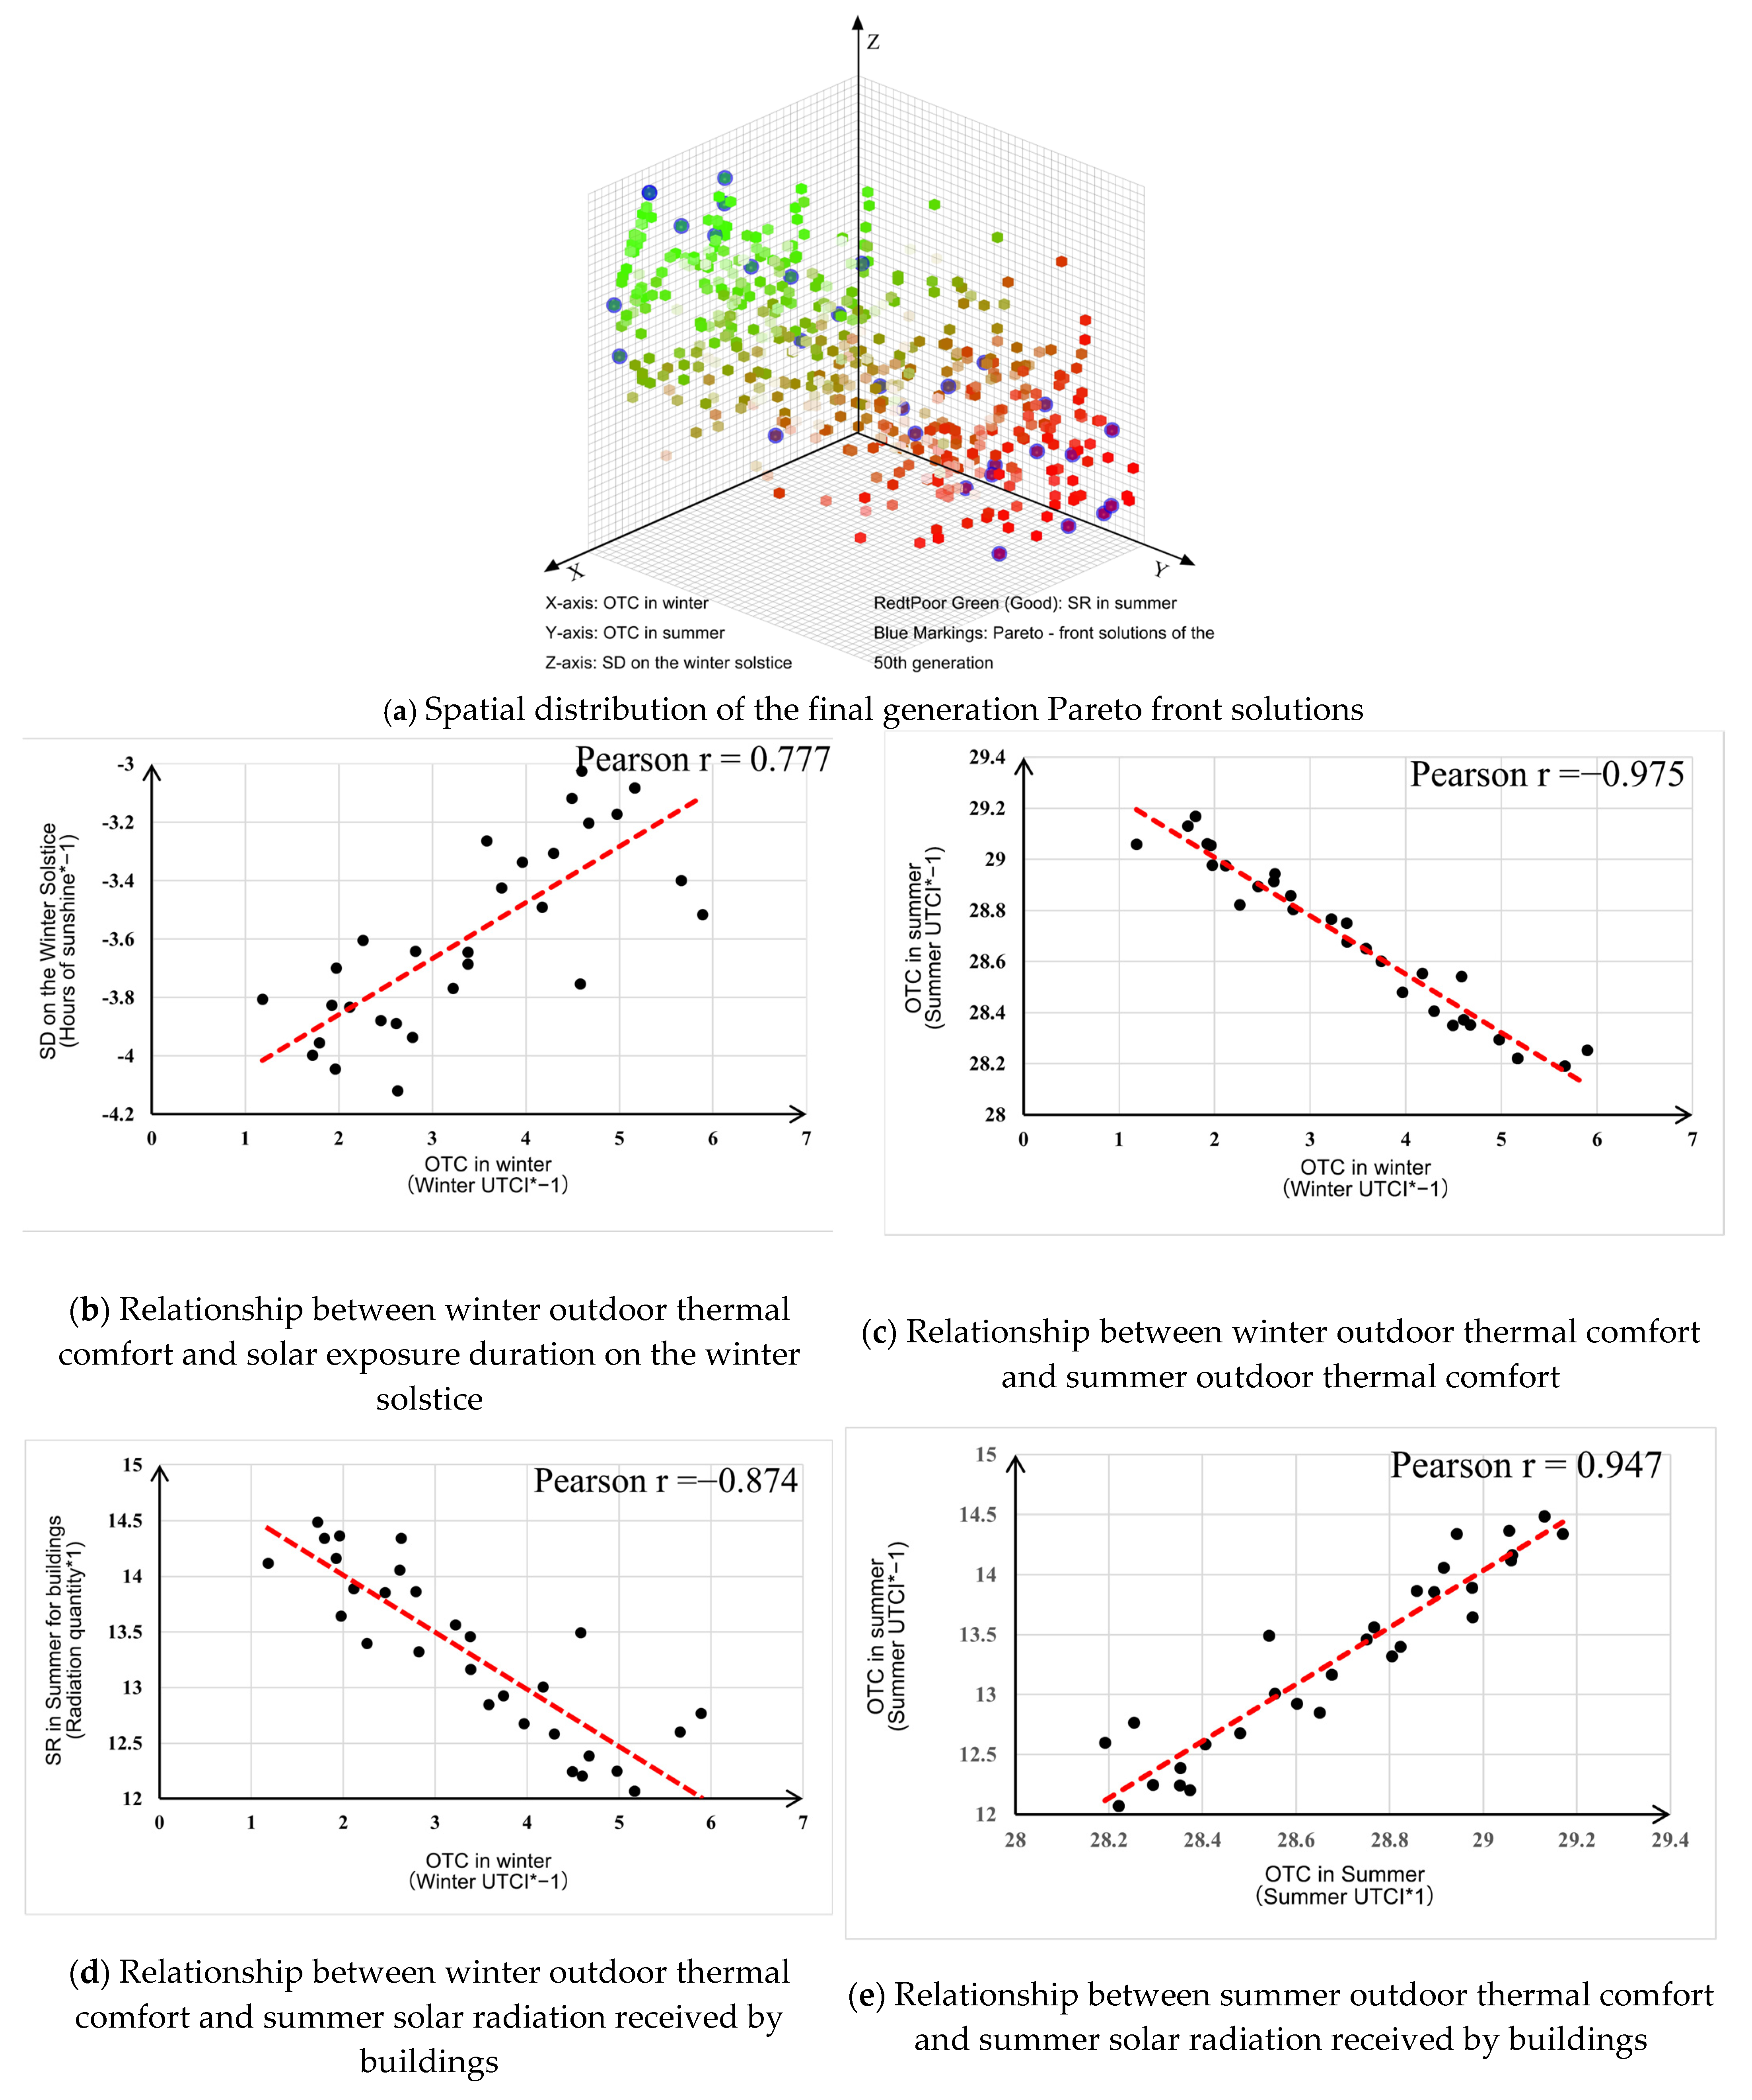
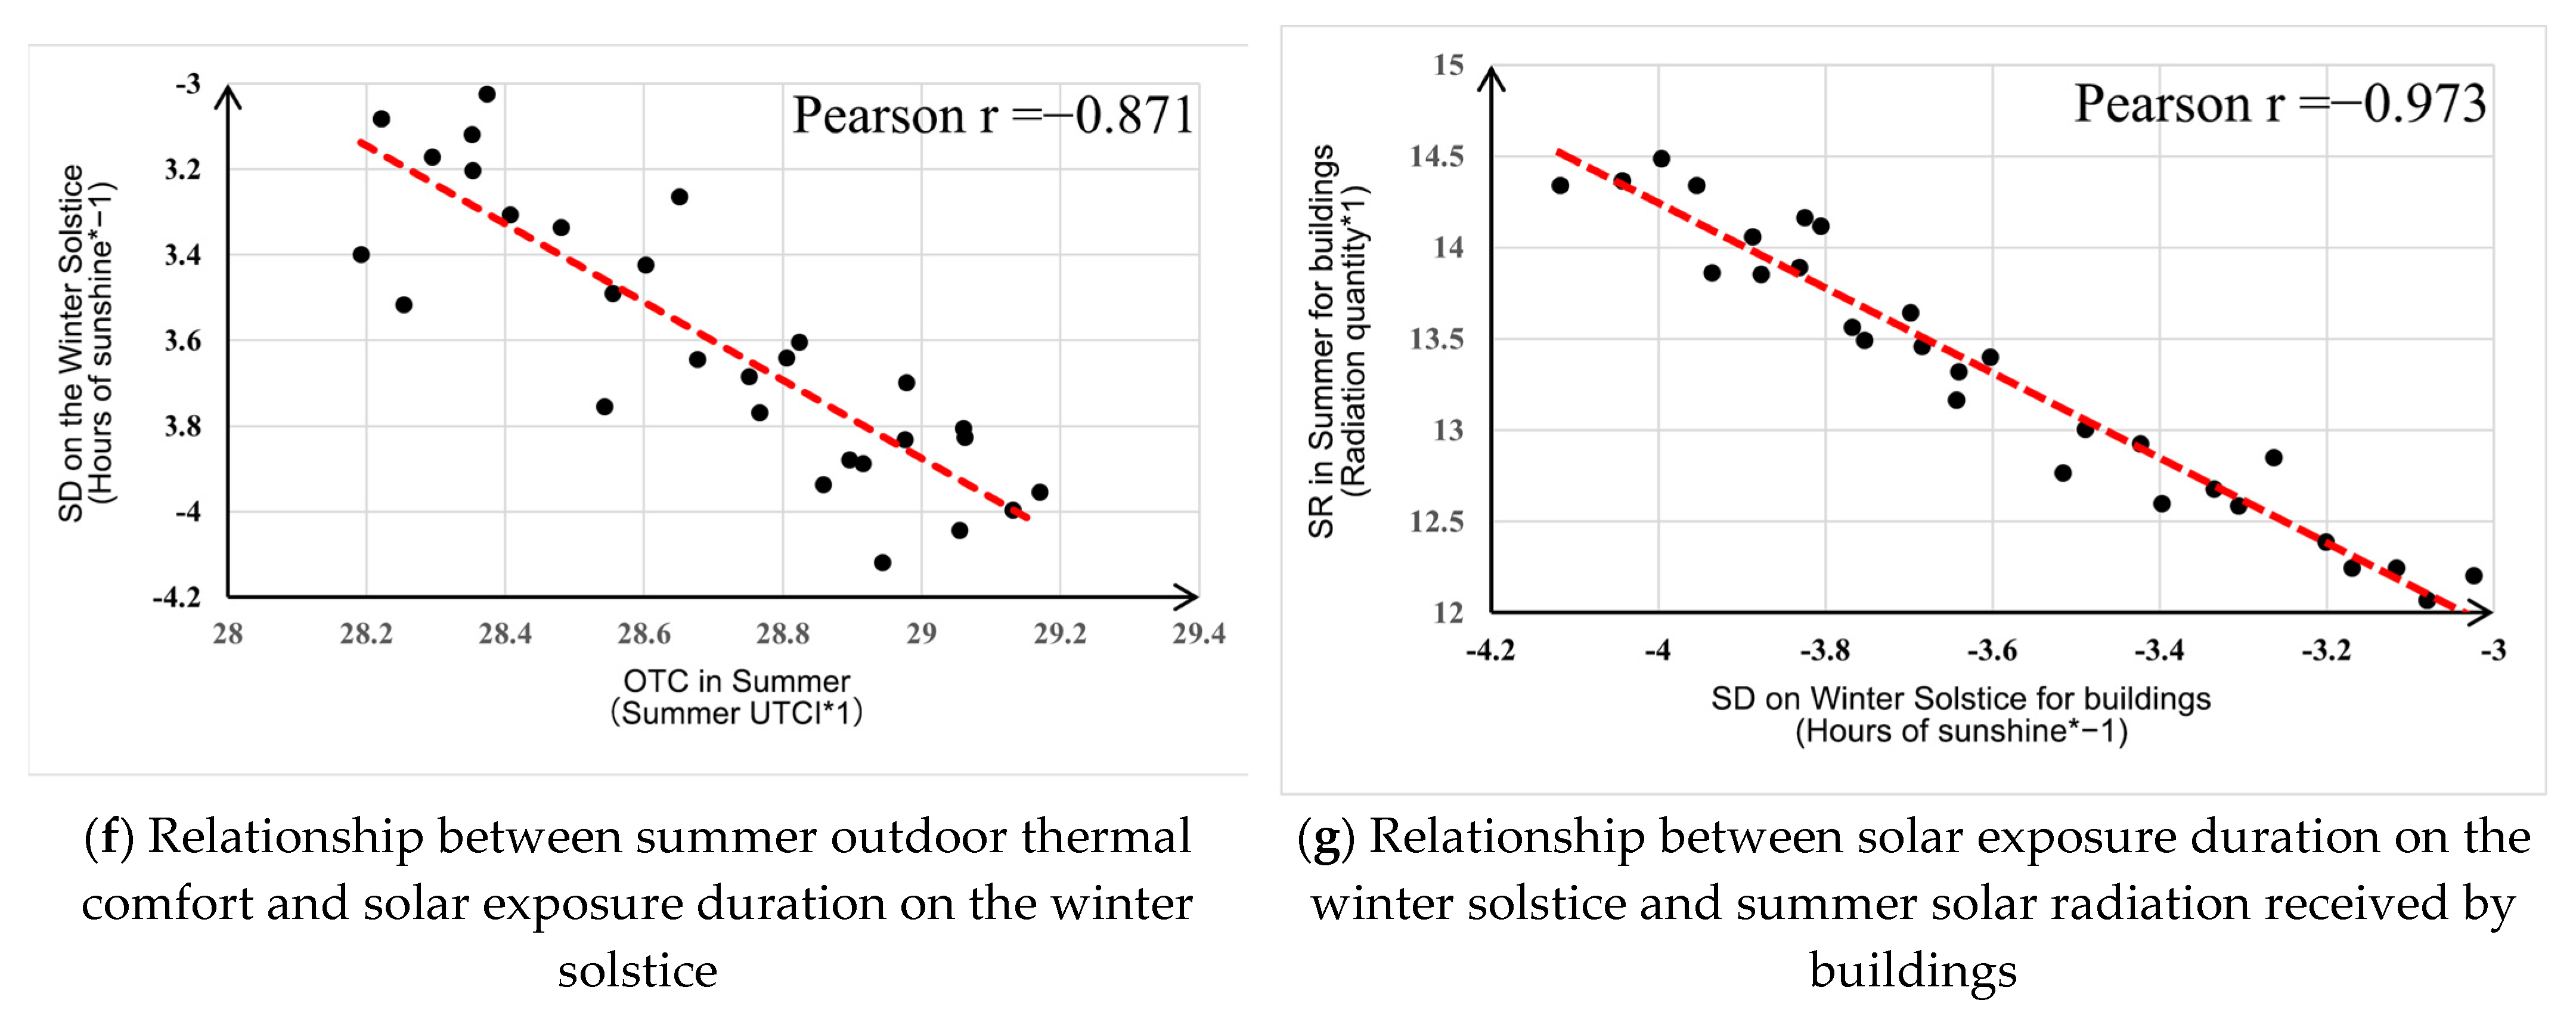
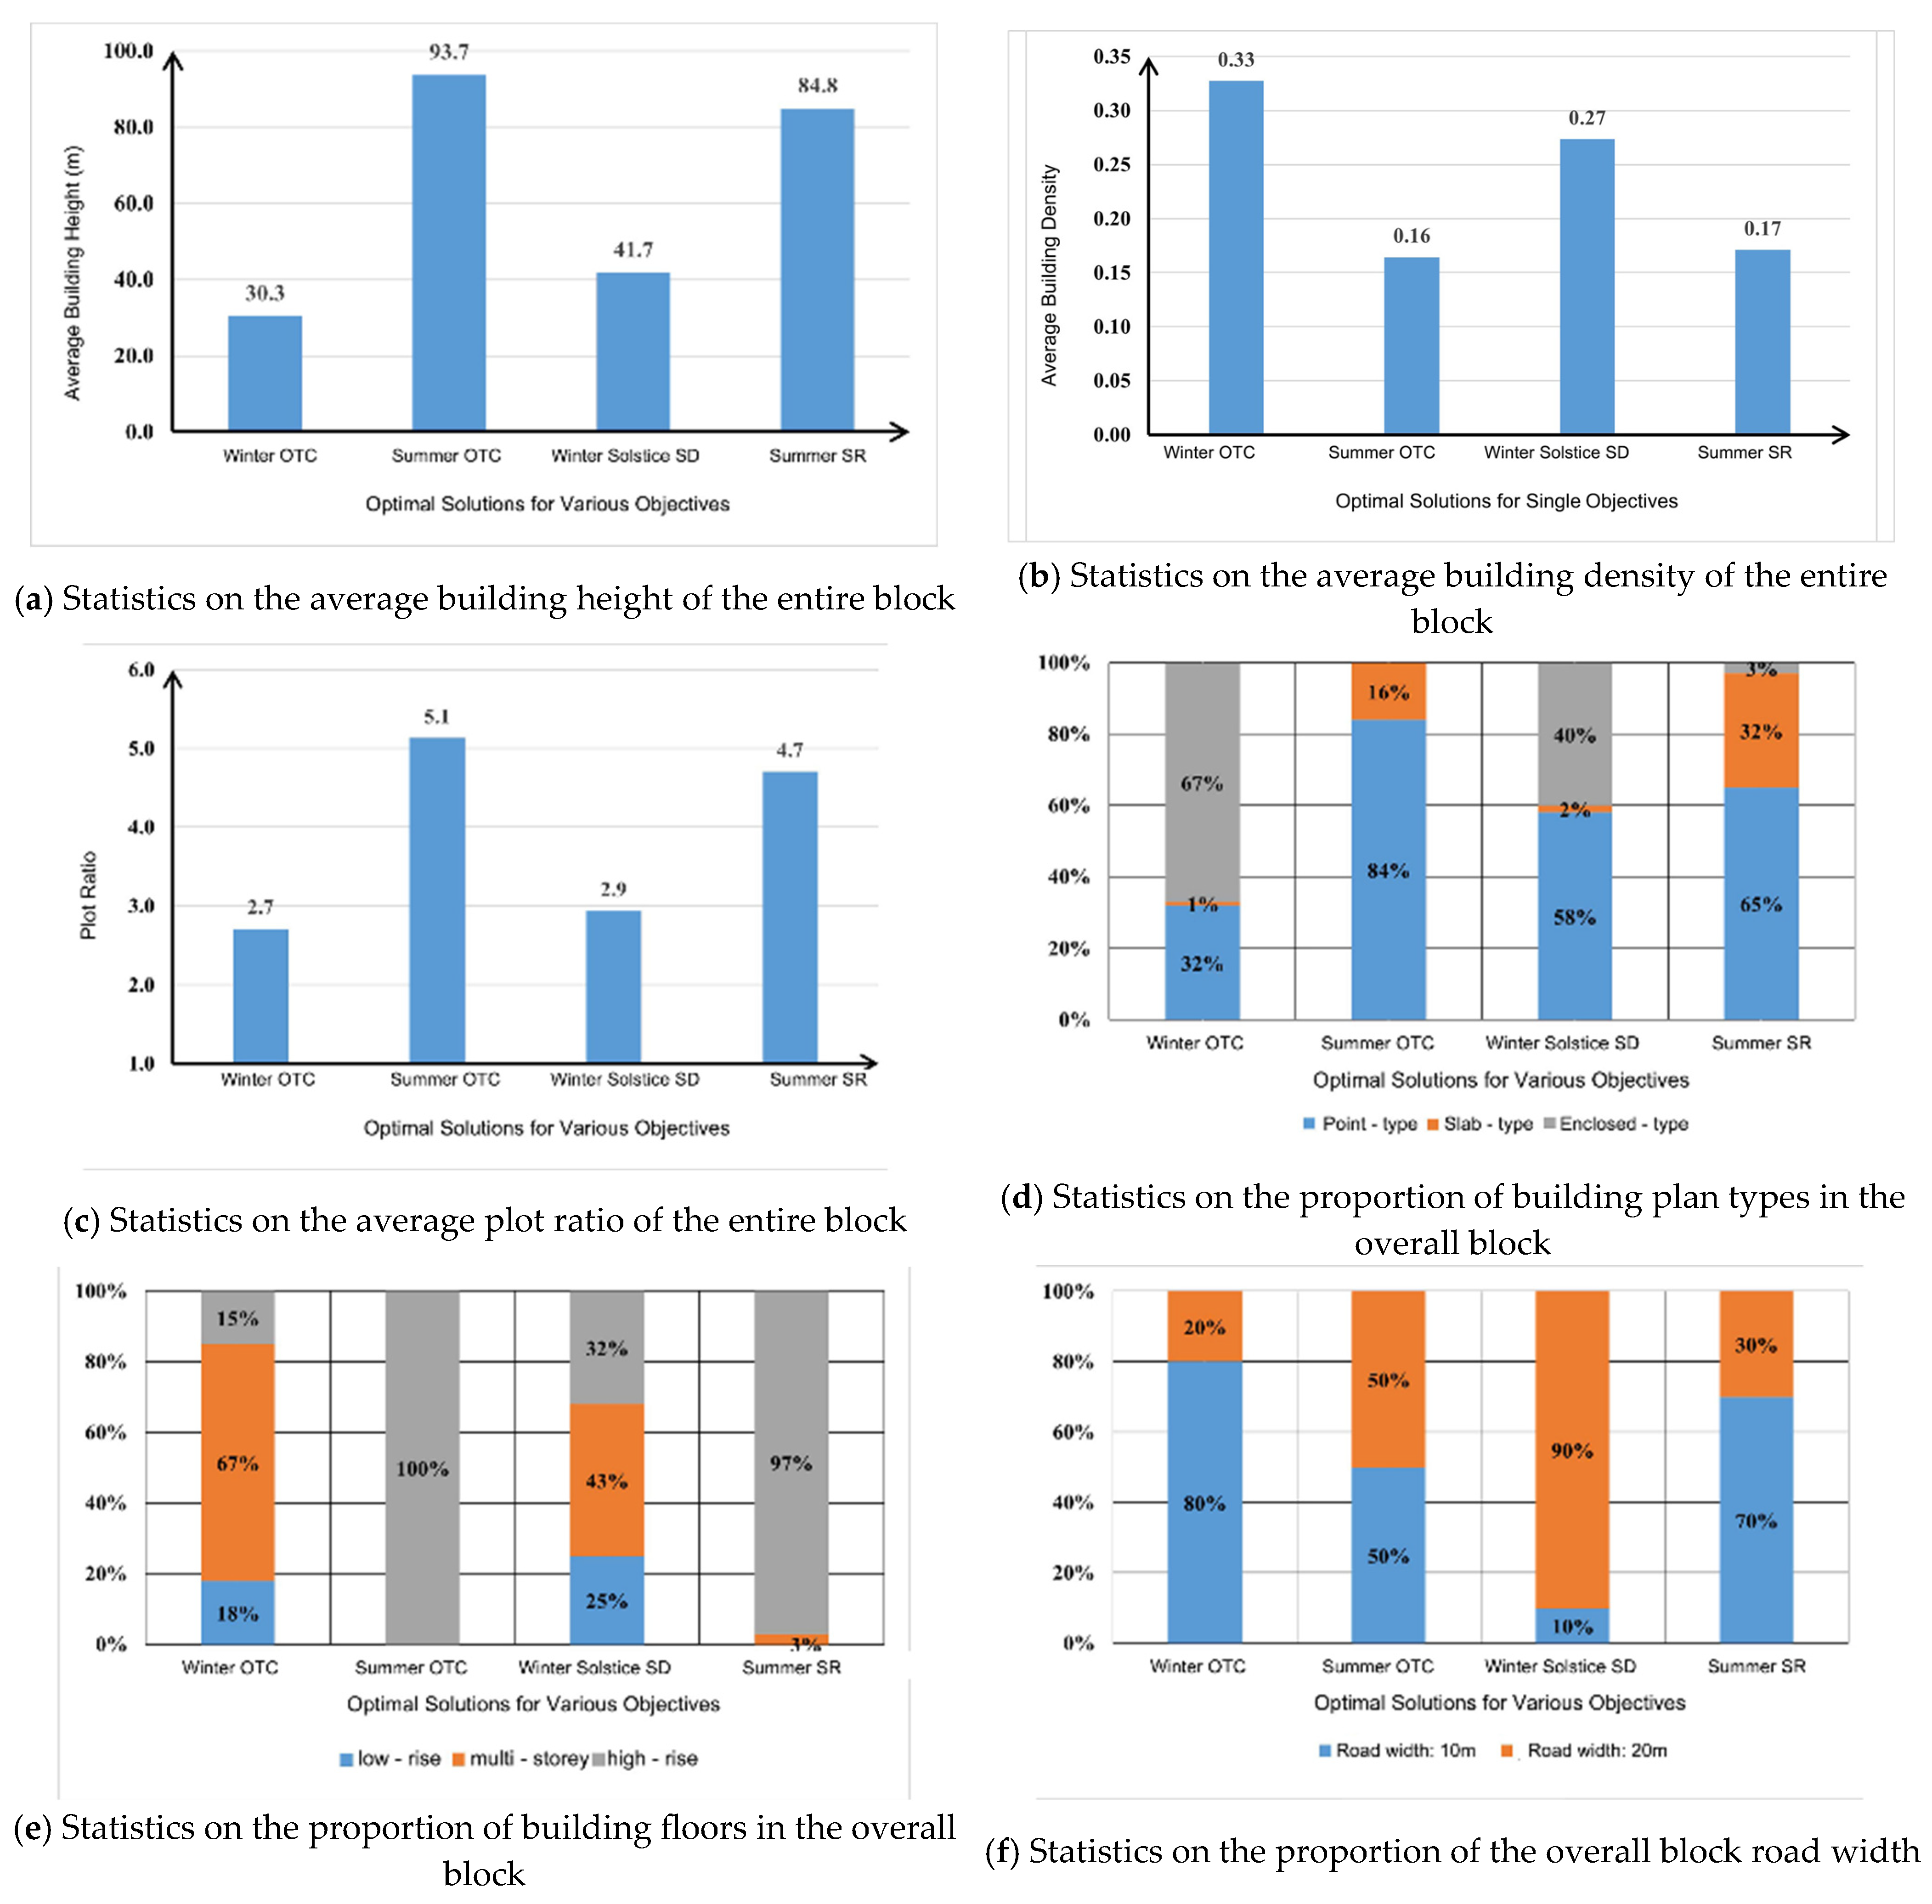
3.3. Analysis of Influencing Factors of Each Objective
4. Clustering Analysis and Scheme Screening
5. Conclusions
6. Discussion
6.1. Theoretical Contributions
6.2. Practical Implications
6.3. Limitations and Future Research
Author Contributions
Funding
Data Availability Statement
Acknowledgments
Conflicts of Interest
Abbreviations
| CFD | Computational Fluid Dynamics |
| UTCI | Universal Thermal Climate Index |
| PET | Physiological Equivalent Temperature |
| MRT | Mean Radiant Temperature |
| OTC | Outdoor Thermal Comfort |
| BCP | Building Cluster Prototypes |
| SD | Sunshine Duration |
| SR | Solar Radiation |
| FAR | Floor Area Ratio |
| BD | Building Density |
References
- Gu, X.; Wu, Z.; Liu, X.; Qiao, R.; Jiang, Q. Exploring the nonlinear interplay between urban morphology and nighttime thermal environment. Sustain. Cities Soc. 2024, 101, 105176. [Google Scholar] [CrossRef]
- Ellena, M.; Melis, G.; Zengarini, N.; Di Gangi, E.; Ricciardi, G.; Mercogliano, P.; Costa, G. Micro-scale UHI risk assessment on the heat-health nexus within cities by looking at socio-economic factors and built environment characteristics: The Turin case study (Italy). Urban Clim. 2023, 49, 101514. [Google Scholar] [CrossRef]
- Li, Y.; Schubert, S.; Kropp, J.P.; Rybski, D. On the influence of density and morphology on the urban heat island intensity. Nat. Commun. 2020, 11, 2647. [Google Scholar] [CrossRef]
- Su, Y.; Wang, Y.; Wang, C.; Zhou, D.; Zhou, N.; Feng, W.; Ji, H. Coupling relationships between urban form and performance of the outdoor environment at the pedestrian level. Build. Environ. 2021, 213, 108514. [Google Scholar] [CrossRef]
- Ming, T.; Liu, Y.; Shi, T.; Peng, C.; Chen, Y.; de Richter, R.; Fang, Y. Numerical investigation of urban heat island effect in various urban forms. Energy Built Environ. 2024, in press. [CrossRef]
- National Bureau of Statistics of China. China Statistical Yearbook 2023; China Statistics Press: Beijing, China, 2023. [Google Scholar]
- China Meteorological Administration. China Urban Climate Report 2023; Meteorological Press: Beijing, China, 2023. [Google Scholar]
- Parvar, Z.; Mohammadzadeh, M.; Saeidi, S. LCZ framework and landscape metrics: Exploration of urban and peri-urban thermal environment emphasizing 2/3D characteristics. Build. Environ. 2024, 254, 111370. [Google Scholar] [CrossRef]
- Sádaba, J.; Luzarraga, A.; Lenzi, S. Designing for climate adaptation: A case study integrating nature-based solutions with urban infrastructure. Urban Sci. 2025, 9, 74. [Google Scholar] [CrossRef]
- Liu, K.; Xu, X.; Huang, W.; Zhang, R.; Kong, L.; Wang, X. A multi-objective optimization framework for designing urban block forms considering daylight, energy consumption, and photovoltaic energy potential. Build. Environ. 2023, 242, 110585. [Google Scholar] [CrossRef]
- Thermal Environmental Conditions for Human Occupancy: ASHRAE Standard 55-2020; ASHRAE Standards Committee: Atlanta, GA, USA, 2020.
- Liu, B.; Liu, Y.; Cho, S.; Chow, D.H.C. Urban morphology indicators and solar radiation acquisition: 2011–2022 review. Renew. Sustain. Energy Rev. 2024, 199, 114548. [Google Scholar] [CrossRef]
- Yang, J.; Ren, J.; Sun, D.; Xiao, X.; Xia, J.C.; Jin, C.; Li, X. Understanding land surface temperature impact factors based on local climate zones. Sustain. Cities Soc. 2021, 69, 102818. [Google Scholar] [CrossRef]
- Xu, D.; Wang, Y.; Zhou, D.; Wang, Y.; Zhang, Q.; Yang, Y. Influences of urban spatial factors on surface urban heat island effect and its spatial heterogeneity: A case study of Xi’an. Build. Environ. 2024, 248, 111072. [Google Scholar] [CrossRef]
- Yang, J.; Yang, Y.; Sun, D.; Jin, C.; Xiao, X. Influence of urban morphological characteristics on thermal environment. Sustain. Cities Soc. 2021, 72, 103045. [Google Scholar] [CrossRef]
- Geng, Y.; Hong, B.; Du, M.; Yuan, T.; Wang, Y. Combined effects of visual-acoustic-thermal comfort in campus open spaces: A pilot study in China’s cold region. Build. Environ. 2022, 209, 108658. [Google Scholar] [CrossRef]
- Panwar, M.; Jindal, S.; Sneh. Urban heat island and building energy consumption. IOP Conf. Ser. Earth Environ. Sci. 2024, 1326, 012080. [Google Scholar] [CrossRef]
- Yi, T.; Wang, H.; Liu, C.; Li, X.; Wu, J. Thermal comfort differences between urban villages and formal settlements in Chinese developing cities: A case study in Shenzhen. Sci. Total Environ. 2022, 853, 158283. [Google Scholar] [CrossRef]
- Técher, M.; Ait Haddou, H.; Aguejdad, R. Urban heat island’s vulnerability assessment by integrating urban planning policies: A case study of Montpellier Méditerranée Metropolitan Area, France. Sustainability 2023, 15, 1820. [Google Scholar] [CrossRef]
- Budhiyanto, A.; Oktavianus, A.; Tedjokusumo, B.; Harsono, K.; Yang, I.T. Comparison of simulation-based methods and metaheuristic optimization algorithms for optimizing window design by considering daylighting and heat transfer in a tropical region of Indonesia. IOP Conf. Ser. Earth Environ. Sci. 2021, 907, 012016. [Google Scholar] [CrossRef]
- Li, Q.; Zhang, L.; Zhang, L.; Wu, X. Optimizing energy efficiency and thermal comfort in building green retrofit. Energy 2021, 237, 121509. [Google Scholar] [CrossRef]
- Rashad, M.; Khordehgah, N.; Żabnieńska-Góra, A.; Ahmad, L.; Jouhara, H. The utilisation of useful ambient energy in residential dwellings to improve thermal comfort and reduce energy consumption. Int. J. Thermofluids 2021, 9, 100059. [Google Scholar] [CrossRef]
- Chen, D.; Cheng, S.; Liu, J.; Zhang, J.; You, X. A simulation-based optimization method for truck-prohibit ramp placement along freeways. Math. Probl. Eng. 2023, 2023, 4170669. [Google Scholar] [CrossRef]
- Veisi, O.; Shakibamanesh, A.; Rahbar, M. Using intelligent multi-objective optimization and artificial neural networking to achieve maximum solar radiation with minimum volume in the archetype urban block. Sustain. Cities Soc. 2022, 86, 104101. [Google Scholar] [CrossRef]
- Zhu, S.; Ma, C.; Wu, Z.; Huang, Y.; Liu, X. Exploring the impact of urban morphology on building energy consumption and outdoor comfort: A comparative study in hot-humid climates. Buildings 2024, 14, 1381. [Google Scholar] [CrossRef]
- Li, C.; Chen, Y. A multi-factor optimization method based on thermal comfort for building energy performance with natural ventilation. Energy Build. 2023, 285, 112893. [Google Scholar] [CrossRef]
- Shan, R.; Junghans, L. Multi-objective optimization for high-performance building facade design: A systematic literature review. Sustainability 2023, 15, 15596. [Google Scholar] [CrossRef]
- Matallah, M.E.; Mahar, W.A.; Bughio, M.; Alkama, D.; Ahriz, A.; Bouzaher, S. Prediction of climate change effect on outdoor thermal comfort in arid region. Energies 2021, 14, 4730. [Google Scholar] [CrossRef]
- Yin, C. Research on Optimization Strategies of Summer Outdoor Thermal Comfort in Urban Spaces in Arid Regions Based on Parametric Design. Master’s Thesis, Xi’an University of Architecture and Technology, Xi’an, China, 2020. [Google Scholar]
- Chen, W.; Zhou, Y.; Wu, Q.; Chen, G.; Huang, X.; Yu, B. Urban building type mapping using geospatial data: A case study of Beijing, China. Remote Sens. 2020, 12, 2805. [Google Scholar] [CrossRef]
- Han, Z.; Yan, W.; Liu, G. A performance-based urban block generative design using deep reinforcement learning and computer vision. In Proceedings of the 2020 DigitalFUTURES; Springer: Singapore, 2021; pp. 134–143. [Google Scholar] [CrossRef]
- Kontsevik, G.I.; Churiakova, T.A.; Markovskiy, V.A.; Antonov, A.; Mityagin, S.A. Urban blocks modelling method. Procedia Comput. Sci. 2023, 229, 119–127. [Google Scholar] [CrossRef]
- Grasshopper. Available online: https://www.grasshopper3d.com/ (accessed on 31 May 2020).
- Food4Rhino, Ladybug Tools. Available online: https://www.food4rhino.com/app/ladybug-tools (accessed on 31 May 2020).
- Xu, S.; Zhu, P.; Guo, F.; Yan, D.; Miao, S.; Zhang, H.; Dong, J.; Fan, X. Cold coastal city neighborhood morphology design method based on multi-objective optimization simulation analysis. Buildings 2024, 14, 3176. [Google Scholar] [CrossRef]
- Wang, A.; Xiao, Y.; Liu, C.; Zhao, Y.; Sun, S. Multi-objective optimization of building energy consumption and thermal comfort based on SVR-NSGA-II. Case Stud. Therm. Eng. 2024, 63, 105368. [Google Scholar] [CrossRef]
- Clark, W.; Martin, L.; March, L. Urban space and structures. Geogr. Rev. 1972, 65, 138–141. [Google Scholar] [CrossRef]
- OpenStreetMap Contributors. OpenStreetMap. Available online: https://www.openstreetmap.org (accessed on 26 October 2024).
- Baidu Inc. Baidu Maps [Map Data]. Available online: https://map.baidu.com (accessed on 30 April 2025).
- Ergonomics of the Thermal Environment—Instruments for Measuring Physical Quantities—Part 3: Evaluation of Thermal Stress Using the Universal Thermal Climate Index (UTCI); ISO: Geneva, Switzerland, 2020.
- GB 50180-2018; Urban Residential Area Planning and Design Standards. China Architecture & Building Press: Beijing, China, 2018. (In Chinese)
- Oke, T.R. Street design and urban canopy layer climate. Energy Build. 1988, 11, 103–113. [Google Scholar] [CrossRef]
- Eddy3D. Eddy3D: A Toolkit for Decoupled Outdoor Thermal Comfort Simulations in Urban Areas. Available online: https://www.researchgate.net/publication/356780551_Eddy3D_A_toolkit_for_decoupled_outdoor_thermal_comfort_simulations_in_urban_areas (accessed on 3 November 2024).
- U.S. Department of Energy. EnergyPlus Weather Data. Available online: https://energyplus.net/weather (accessed on 3 November 2024).
- Showkatbakhsh, M.; Kaviani, S.; Weinstock, M. Evolutionary design processes with embedded homeostatic principles: Adaptation of architectural form and skin to excessive solar radiation. Comput. Aided Des. Appl. 2021, 18, 914–953. [Google Scholar] [CrossRef]


| Surveyed Case Number | A | B | C | D |
|---|---|---|---|---|
| Block Morphological Layout | 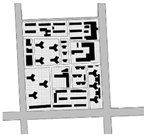 | 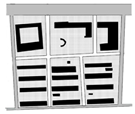 |  | 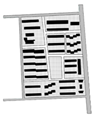 |
| Block Scale (Length × Width) | 424 m × 363 m | 241 m × 294 m | 340 m × 379 m | 370 m × 265 m |
| Number of Clusters | 11 | 6 | 8 | 8 |
| Average Size of Clusters | 125 m × 109 m | 119 m × 88 m | 112 m × 130 m | 103 m × 118 m |
| Road Morphology (Road Width) | Grid Type (6–20 m) | Grid Type (8–25 m) | Grid Type (10–20 m) | Grid Type (7–25 m) |
| Surveyed Case Serial Number | E | F | G | H |
| Block Morphology Layout | 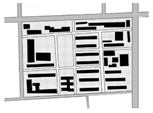 | 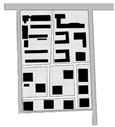 |  | 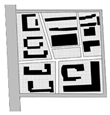 |
| Block Scale (Length × Width) | 249 m × 366 m | 380 m × 260 m | 376 m × 347 m | 295 m × 305 m |
| Number of Clusters | 11 | 6 | 7 | 6 |
| Cluster Scale (Length × Width) | 76 m × 102 m | 140 m × 114 m | 138 m × 154 m | 123 m × 114 m |
| Road Morphology (Road Width) | Grid Type (10–20 m) | Grid Type (8–25 m) | Grid Type (10–30 m) | Grid Type (10–28 m) |
| Information on Actual Blocks | Information on the Abstracted Typical Block Model | |||
|---|---|---|---|---|
| Block Morphological Layout Diagram | 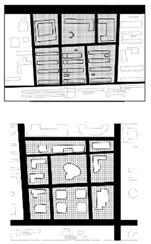 | 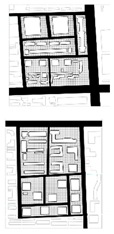 | 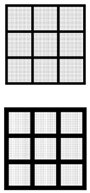 | |
| Data of the Overall Block | Form | Rectangle | Rectangle | |
| Length in the North–South Direction | An average of 334 m. | 320 m/340 m | ||
| Length in the East–West Direction | An average of 322 m. | 320 m/340 m | ||
| Extent | An average of 107,757 m2 | 102,400 m2/115,600 m2 | ||
| Information on Internal Clusters | The number of clusters | From 6 to 11 | 9 | |
| The size of the clusters | An average of 107 m × 109 m | 100 m × 100 m | ||
| Information about the Road | Form | Grid Type | Grid Type | |
| Width | 8–22 m | 10 m/20 m | ||
| Serial Number | Typical Model | Plane | Source of Type | Relevant Parameters |
|---|---|---|---|---|
| Type 1 | 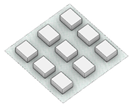 | 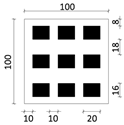 | 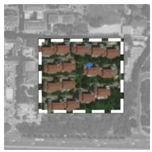 | Plane Type: Point-type Plot Ratio: 0.58–0.86 Building Density: 0.29 Number of Building Floors: 2–3 Building Height: 6–9 m |
| Type 2 | 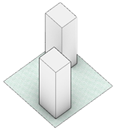 | 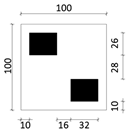 |  | Plane Type: Point-type Plot Ratio: 2.7–5.5 Building Density: 0.17 Number of Building Floors: 16–33 Building Height: 50–100 m |
| Type 3 | 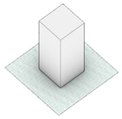 | 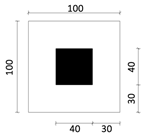 | 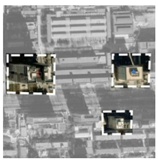 | Plane Type: Point-type Plot Ratio: 2.6–5.3 Building Density: 0.16 Number of Building Floors: 16–33 Building Height: 50–100 m |
| Type 4 | 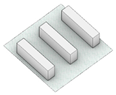 | 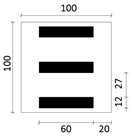 |  | Plane Type: Slab-type Plot Ratio: 1.1–1.3 Building Density: 0.22 Number of Building Floors: 5–6 Building Height: 15–20 m |
| Type 5 | 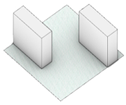 | 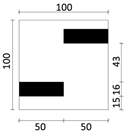 | 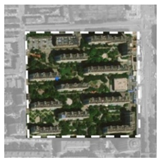 | Plane Type: Slab-type Plot Ratio: 2.6–3.2 Building Density: 0.17 Number of Building Floors: 16–20 Building Height: 48–60 m |
| Type 6 |  | 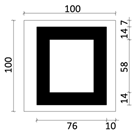 | 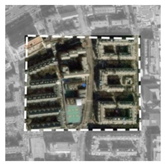 | Plane Type: Enclosed-type Plot Ratio: 1.9–3.0 Building Density: 0.38 Number of Building Floors: 5–8 Building Height: 15–24 m |
| Single-Objective Ranking | Relatively Optimal Solution Set for Outdoor Thermal Comfort in Winter | Relatively Optimal Solution Set for Outdoor Thermal Comfort in Summer | Relatively Optimal Solution Set for the Duration of Building Sunlight Exposure on the Winter Solstice | Relatively Optimal Solution Set for the Available Radiation Quantity of Buildings in Summer | |
|---|---|---|---|---|---|
| Objective: UTCI in Winter | Objective: UTCI in Summer | Objective: The Duration of Sunlight Exposure on the Winter Solstice | Objective: The Available Radiation of Buildings in Summer | ||
| Model of the Optimal Scheme for a Single Objective and the Objective Value |  |  |  |  | |
| −1.18 °C | 28.19 °C | 4.12 h | 12.07 kWh/m2 | ||
| Objective Values of the Schemes Ranked from Second to Tenth | 2 | −1.23 °C | 28.20 °C | 4.10 h | 12.09 kWh/m2 |
| 3 | −1.29 °C | 28.20 °C | 4.07 h | 12.09 kWh/m2 | |
| 4 | −1.33 °C | 28.21 °C | 4.06 h | 12.12 kWh/m2 | |
| 5 | −1.35 °C | 28.21 °C | 4.06 h | 12.15 kWh/m2 | |
| 6 | −1.37 °C | 28.22 °C | 4.05 h | 12.17 kWh/m2 | |
| 7 | −1.43 °C | 28.23 °C | 4.05 h | 12.17 kWh/m2 | |
| 8 | −1.47 °C | 28.24 °C | 4.04 h | 12.18 kWh/m2 | |
| 9 | −1.49 °C | 28.26 °C | 4.02 h | 12.20 kWh/m2 | |
| 10 | −1.51 °C | 28.27 °C | 4.00 h | 12.21 kWh/m2 | |
| Average | −1.45 °C | 28.23 °C | 4.05 h | 12.15 kWh/m2 | |
| Relatively Optimal Solution Set for Outdoor Thermal Comfort in Winter | Relatively Optimal Solution Set for Daylight Duration on the Winter Solstice | Relatively Optimal Solution Set for Outdoor Thermal Comfort in Summer | Relatively Optimal Solution Set for Building Radiation in Summer | |
|---|---|---|---|---|
| Building height |  |  |  |  |
| Building density |  | 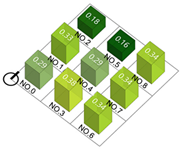 |  | 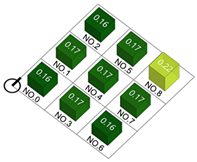 |
| Plot ratio | 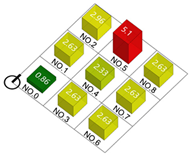 | 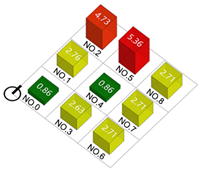 | 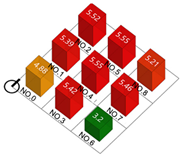 | 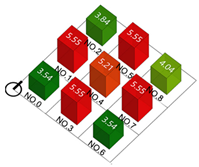 |
| Clustering | Scheme Model | |||||||||
|---|---|---|---|---|---|---|---|---|---|---|
| Cluster1 |  |  |  |  |  | |||||
| W_U: −1.868 | W_S: 3.971 | W_U: −2.628 | W_S: 4.118 | W_U: −1.227 | W_S: 3.890 | W_U: −1.791 | W_S: 3.954 | W_U: −1.717 | W_S: 3.996 | |
| S_U: 29.005 | S_R: 14.265 | S_U: 28.943 | S_R: 14.343 | S_U: 29.140 | S_R: 14.277 | S_U: 29.159 | S_R: 14.343 | S_U: 29.130 | S_R: 14.489 | |
| Cluster2 |  |  |  |  |  | |||||
| W_U: −5.374 | W_S: 3.201 | W_U: −5.333 | W_S: 3.130 | W_U: −4.984 | W_S: 3.260 | W_U: −6.129 | W_S: 3.593 | W_U: −5.166 | W_S: 3.463 | |
| S_U: 28.302 | S_R: 12.169 | S_U: 28.229 | S_R: 12.124 | S_U: 28.765 | S_R: 12.416 | S_U: 28.342 | S_R: 13.095 | S_U: 28.443 | S_R: 12.789 | |
| Cluster3 |  |  |  |  |  | |||||
| W_U: −3.325 | W_S: 3.707 | W_U: −3.221 | W_S: 3.769 | W_U: −3.221 | W_S: 3.769 | W_U: −3.537 | W_S: 3.738 | W_U: −3.501 | W_S: 3.913 | |
| S_U: 28.749 | S_R: 13.566 | S_U: 28.767 | S_R: 13.565 | S_U: 28.767 | S_R: 13.565 | S_U: 28.730 | S_R: 13.613 | S_U: 28.742 | S_R: 13.835 | |
| Cluster4 |  |  |  |  |  | |||||
| W_U: −3.961 | W_S: 3.336 | W_U: −3.506 | W_S: 3.373 | W_U: −4.403 | W_S: 3.246 | W_U: −3.064 | W_S: 3.327 | W_U: −3.084 | W_S: 3.327 | |
| S_U: 28.480 | S_R: 12.679 | S_U: 28.603 | S_R: 12.874 | S_U: 28.500 | S_R: 12.410 | S_U: 28.682 | S_R: 12.903 | S_U: 28.682 | S_R: 12.903 | |
| Cluster5 |  |  |  |  |  | |||||
| W_U: −2.390 | W_S: 3.565 | W_U: −2.745 | W_S: 3.705 | W_U: −2.012 | W_S: 3.435 | W_U: −2.739 | W_S: 3.381 | W_U: −1.929 | W_S: 3.609 | |
| S_U: 28.839 | S_R: 13.385 | S_U: 28.843 | S_R: 13.551 | S_U: 28.845 | S_R: 13.145 | S_U: 28.741 | S_R: 12.966 | S_U: 28.902 | S_R: 13.430 | |
| Cluster6 |  |  |  |  |  | |||||
| W_U: −4.670 | W_S: 3.805 | W_U: −5.620 | W_S: 3.727 | W_U: −4.090 | W_S: 3.716 | W_U: −3.879 | W_S: 3.604 | W_U: −3.828 | W_S: 3.814 | |
| S_U: 28.595 | S_R: 13.294 | S_U: 28.670 | S_R: 13.374 | S_U: 28.859 | S_R: 13.324 | S_U: 28.819 | S_R: 12.989 | S_U: 28.652 | S_R: 13.602 | |
Disclaimer/Publisher’s Note: The statements, opinions and data contained in all publications are solely those of the individual author(s) and contributor(s) and not of MDPI and/or the editor(s). MDPI and/or the editor(s) disclaim responsibility for any injury to people or property resulting from any ideas, methods, instructions or products referred to in the content. |
© 2025 by the authors. Licensee MDPI, Basel, Switzerland. This article is an open access article distributed under the terms and conditions of the Creative Commons Attribution (CC BY) license (https://creativecommons.org/licenses/by/4.0/).
Share and Cite
Xu, Z.; Wu, H.; Han, C.; Chang, J. Research on the Method of Automatic Generation and Multi-Objective Optimization of Block Spatial Form Based on Thermal Comfort Demand. Buildings 2025, 15, 2098. https://doi.org/10.3390/buildings15122098
Xu Z, Wu H, Han C, Chang J. Research on the Method of Automatic Generation and Multi-Objective Optimization of Block Spatial Form Based on Thermal Comfort Demand. Buildings. 2025; 15(12):2098. https://doi.org/10.3390/buildings15122098
Chicago/Turabian StyleXu, Zhenhua, Hao Wu, Cong Han, and Jiaying Chang. 2025. "Research on the Method of Automatic Generation and Multi-Objective Optimization of Block Spatial Form Based on Thermal Comfort Demand" Buildings 15, no. 12: 2098. https://doi.org/10.3390/buildings15122098
APA StyleXu, Z., Wu, H., Han, C., & Chang, J. (2025). Research on the Method of Automatic Generation and Multi-Objective Optimization of Block Spatial Form Based on Thermal Comfort Demand. Buildings, 15(12), 2098. https://doi.org/10.3390/buildings15122098