Article

Evaluation of the Visual Environment of Community Third Places Based on Emotional Perceptions

School of Architecture and Urban Planning, Suzhou University of Science and Technology, Suzhou 215011, China
*
Author to whom correspondence should be addressed.
Buildings 2025, 15(12), 2063; https://doi.org/10.3390/buildings15122063
Submission received: 23 May 2025 / Revised: 11 June 2025 / Accepted: 13 June 2025 / Published: 15 June 2025
(This article belongs to the Special Issue New Technologies in Assessment of Indoor Environment)

Abstract

:
A well-designed visual environment in community third places has significant positive effects on residents’ emotional well-being. Only a few studies have examined these effects; therefore, this study comprehensively explores the effect of the visual environment on emotions through perception evaluations and physio-logical feedback data in a community café. The results show that light color temperature, light illuminance, spatial scale, interface decoration, illumination mode, and table and chair layout have significant effects on perception evaluation, while physiological feedback is significantly affected by light illuminance, spatial scale, illumination mode, and indoor plants. Neutral or warm light color temperatures, moderate or larger spatial scales, more interface decorations, and arranged table and chair layouts can significantly enhance positive emotions such as joy and optimism. Larger or smaller spatial scales, mixed or natural illumination modes, and fewer indoor plants significantly improve the fixation count and saccade count. In addition, there is a weak correlation between perception evaluation of emotions and physiological feedback. The findings of this study provide a scientific basis for improving the visual environment of the community third places and promoting the emotional recovery of residents.

1. Introduction

Rapid increase in urbanization and the advent of the information age have led to increasingly fierce social competition. As a result, contemporary community residents face multidimensional pressures from adverse natural, artificial, and social environments, leading to frequent occurrences of psychological problems. The quality of the visual environment has a significant effect on physiological and psychological perception and is the main way for people to interact with the surrounding environment and obtain information [1,2].
American sociologist Ray Oldenburg defined the “first place” as the living place, the “second place” as the workplace, and the “third place” as an informal public gathering place that carries the public life of citizens besides the “first place” and “second place”, such as cafes, teahouses, pubs, gardens, etc. [3]. High-quality third places have four attributes: socialization, accessibility, comfort, and function and activity [4].
Existing studies have shown that the third place plays an important role in promoting the physical and psychological health of residents [5]. In particular, it has a positive effect on emotional perception [6], which promotes psychological recovery and relieves stress [7]. The third place has been proven to be an emotional refuge [8] that provides emotional sustenance [9] and fosters social identity, well-being, and a sense of belonging [10,11].
However, there are relatively few studies on the effect of the visual environments of community third places on emotional perception. Most existing research has primarily explored the effect of place form, materials and color, light environment, plant arrangement, and other factors of the indoor visual environment on emotional perception.
In terms of spatial scales, Kim et al. showed that spatial aspect ratio, ceiling height, and window proportions have a significant effect on emotional arousal [12]. Presti et al. showed that decreasing the distance between side walls, changing ceiling height, and increasing window height can significantly affect emotional arousal and potency [13]. Vartanian et al. showed that higher ceilings are more aesthetically pleasing and increase approach decisions, while enclosed places affect emotional perception and increase avoidance decisions [14]. Mehaffy et al. showed some effect of symmetry on emotion perception [15]. Further, Shemesh et al. showed that architectural curvature, prominence, and scale affect emotional perception [16].
Studies on materials and colors have shown that blue color increases pleasurable emotions, reduces stress levels, and decreases heart rate [17], whereas red increases emotional arousal and causes more stimulation [18]. Xu et al. showed that yellow decorations enhance pleasurable emotions and gray decorations have a calming effect [19]. Kotradyova et al. showed that wooden materials have a positive effect on the nervous system and recovery and that prolonged exposure decreases fear and anxiety and improves memory and cognitive skills [20].
Studies on light environments have shown that uncomfortable lighting not only intensifies emotional perception but also changes the type of emotion perceived [21]. Additionally, mood changes are more pronounced in naturally illuminated environments than in artificially illuminated ones [22], and appropriate natural-style lighting can enhance positive emotions [23,24,25].
In terms of plant arrangement, Yoo et al. showed that green indoor plants promote psychological stability and alleviate negative emotions [26]. Lee et al. showed that being in a plant-filled indoor environment contributes to psychological and physiological relaxation, significantly reducing tension and fatigue [27].
In addition, some scholars explored the combined effects of multiple indoor environmental factors on emotional perception. Kim et al. found that the form, color, lighting, material, and furniture elements of indoor spaces had a significant effect on emotional perception [28]. Semiha et al. examined 17 metrics, including spatial symmetry, spatial boundaries, and light illumination, and showed that spaces that are in touch with nature, easily accessible, open, and more flexible and have windows and natural lighting have a significant positive effect on mood [24]. Yan et al. showed that specific spatial elements play an important role in emotional regulation, using 18 indicators, including color, form, light, sound, air and temperature, nature, and materials [29].
Most of the existing studies have used subjective emotion scales such as Pleasure–Arousal–Dominance (PAD), Profile of Mood States (POMS), Self-Rating Anxiety Scale (SAS), Self-rating depression scale (SDS), etc. [26,27,30], or physiological indices such as Eye Movement (EM), Electroencephalogram (EEG), functional Magnetic Resonance Imaging (fMRI), Electrocardiogram (ECG), Electromyogram (EMG), Galvanic Skin Response (GSR), etc. [16,28,30,31], to measure emotional perceptions.
In summary, existing studies have affirmed the important role of third places in the physical and mental health of community residents. However, most of these studies focused on the effect of a single factor of the indoor visual environment on the perception of emotions and lacked a comprehensive research approach that combines both subjectivity and objectivity. Therefore, this study considers the community café as an example of a community third place and aims to comprehensively explore the mechanisms by which different visual environment factors and their levels affect the emotional perception of residents in community third places. This study approach involves the perception evaluation and physiological feedback data to analyze the correlation between subjective and objective data, as shown in Figure 1. The results of this research can provide a theoretical basis for the improvement of the visual environment of community third places, promoting the mental health of community residents.

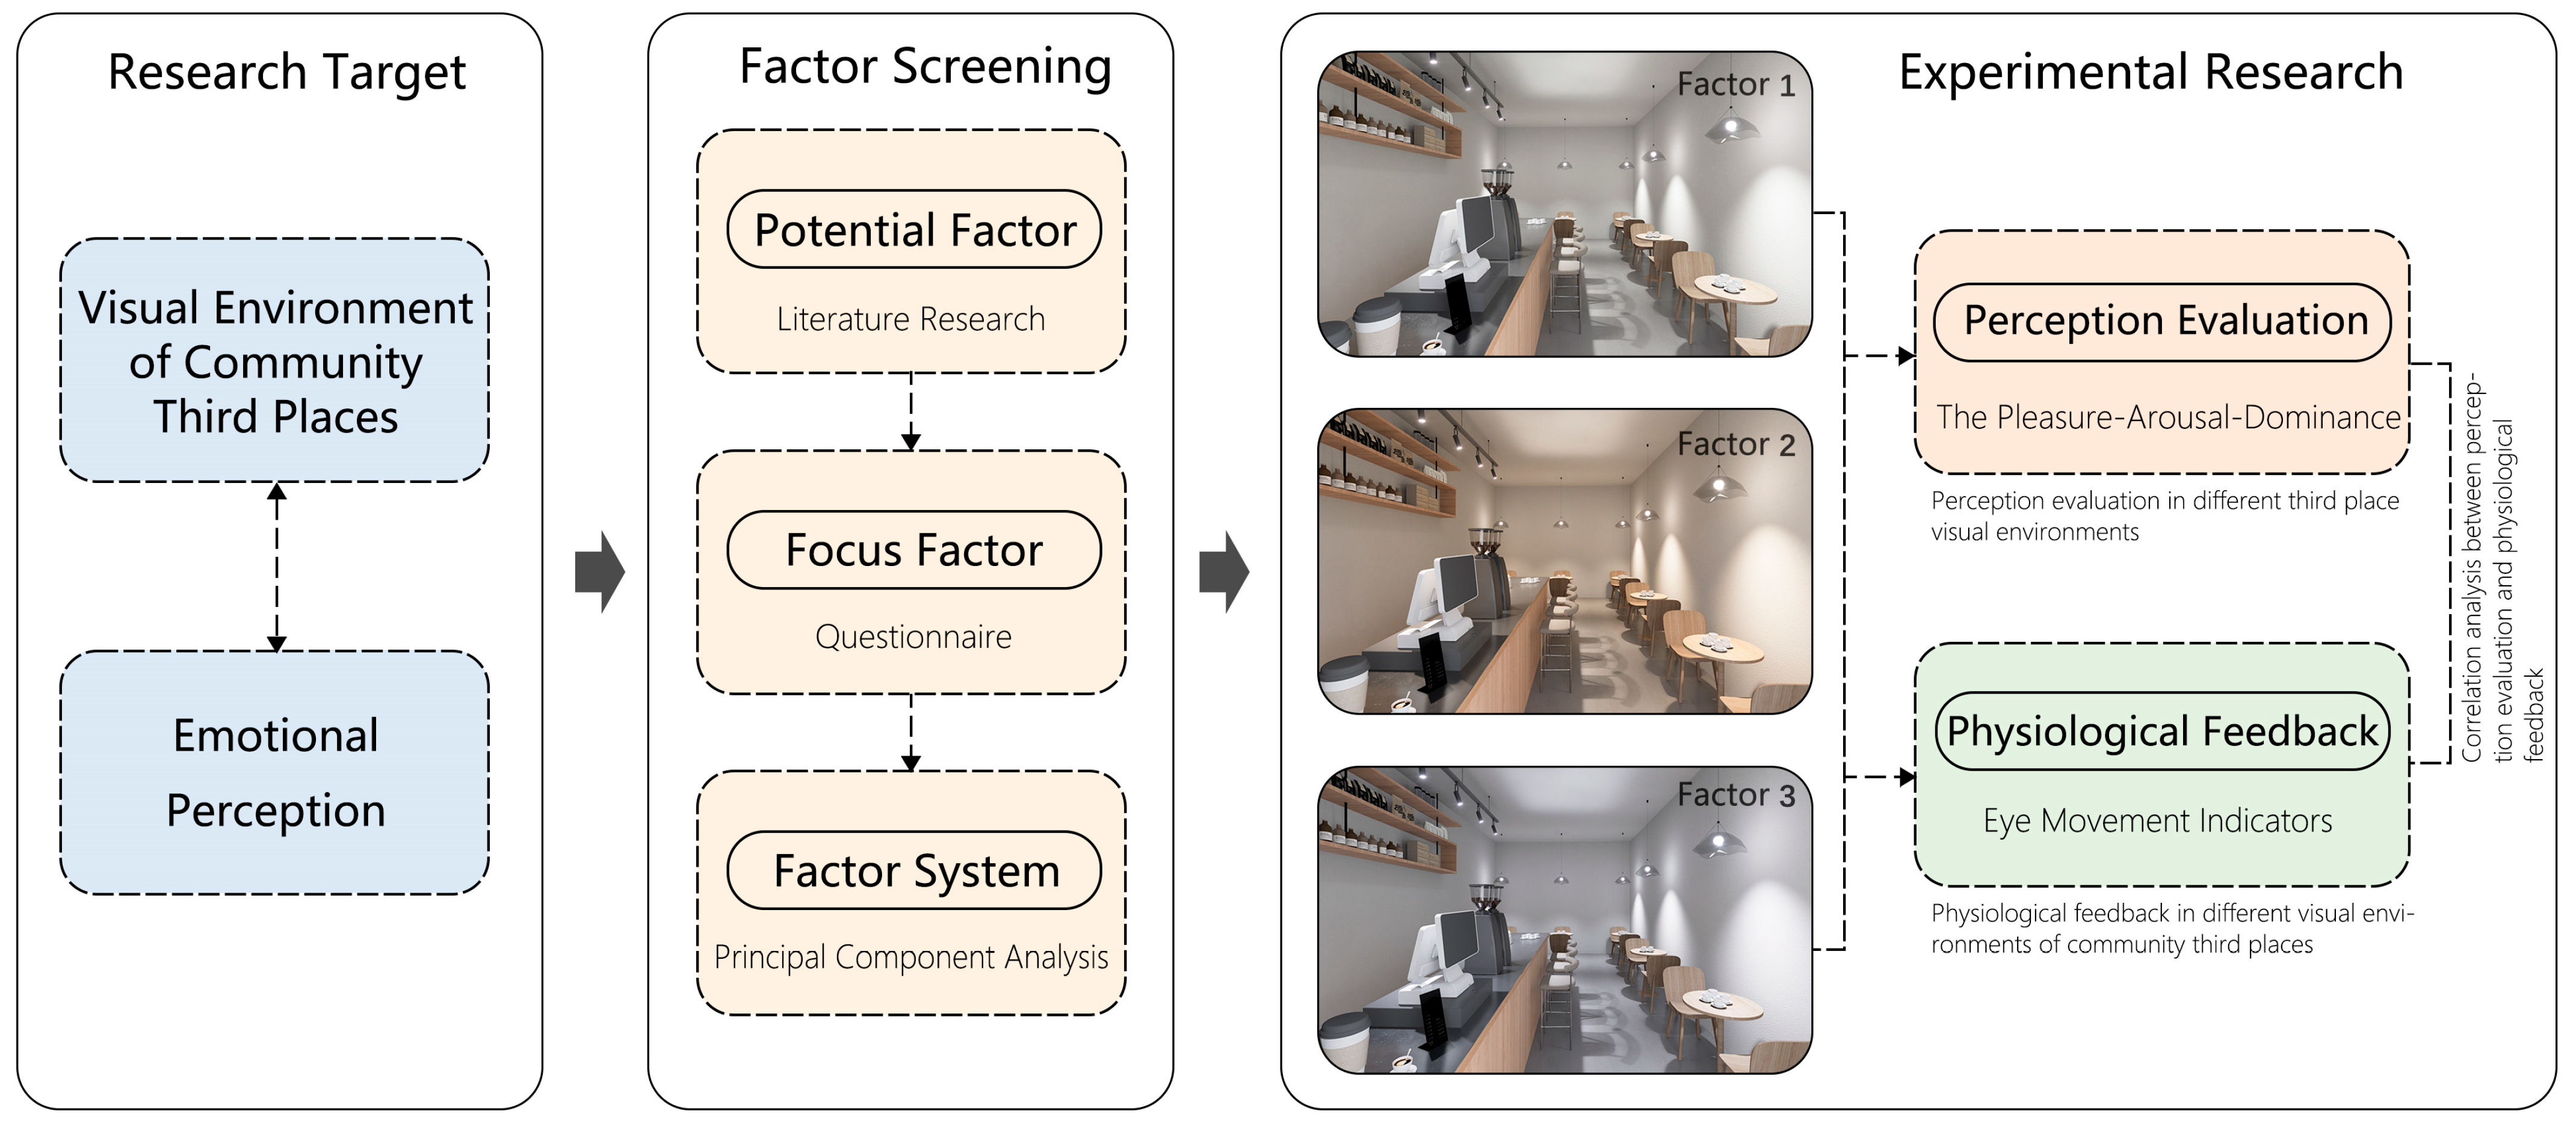
2. Materials and Methods

2.1. Selection of Visual Environment Factors

This study used community cafés, which are located close to the community and directly serve neighborhood residents, as the research sample. To reduce the complexity of the experiment, this study focused mainly on the visual environmental factors of the community cafés and excluded non-visual factors such as thermal and acoustic environments.
This study initially screened 24 potential visual environmental factors that may significantly affect emotional perception through a literature review and further narrowed them down to 8 key factors based on questionnaire results. The questionnaire employed a 7-point Likert scale (1–7), and 226 valid responses were collected. Table 1 shows the evaluation mean values of the effects of different environmental factors on the eight highest visual participants’ moods: bar layout, light color temperature, light illumination, spatial scale, interface decoration, illumination mode, table and chair layout, and indoor plants. The evaluation means ranged from 5.586 to 5.833, with standard deviations between 0.987 and 1.221. These results aligned with established studies [15,22,26,28,32].
This study utilized principal component analysis to factor down the 24 third space visual environmental factors and constructed a factor system containing 6 principal components. As shown in the Appendix A, the factors selected for this study are located in five of the principal components, so the selection is more reasonable.
This study synthesized three level parameters for each environmental factor based on the findings of the established studies and the results of field research [24,25,26,33,34,35]. Standard scenarios were used for level 1 for all environmental factors, as shown in Table 2. For control variables, all environmental factor levels are at level 1, except for the environmental factor used as a variable. The same viewpoint and rendering parameters were used to establish the café scene, as shown in Figure 2.

2.2. Evaluation Indicators

This study used a combination of subjective and objective experimental methods to analyze the perception evaluation and physiological feedback data of subjects under different levels of visual environmental factors to investigate the effect of a community third place visual environment on emotional perception.
For perception evaluation, we used the simplified Chinese version of the Pleasure–Arousal–Dominance (PAD) scale to obtain emotional perception data, as shown in Table 3. PAD was proposed by Mehrabian [36] and consists of pleasure (P), activation (A), and dominance (D), where pleasure denotes emotional potency, activation denotes emotional arousal, and dominance denotes control over the external environment.
The scale has 12 items, with 4 items in each of the three dimensions of P, A, and D. Each item is a set of lexically opposed emotion words, with scores ranging from −4 to 4. The values of P, A, and D were calculated as the averages of the total scores from the four corresponding groups of emotional words.
Table 4 shows the reference PAD values for 14 basic emotions [37]. The emotional tendency is spatially represented by the distance between a given PAD value and the coordinate positions of these 14 basic emotions, which can be calculated using the Euclidean distance algorithm, as shown in Equation (1).
L n = ( P     p n ) 2 + ( A     a n ) 2 + ( D     d n ) 2 n = [ 1 , 14 ] ,   n Z
where Ln is the coordinate distance between the measured emotion and the 14 basic emotions in the emotional space; P, A, and D are the coordinate values of the measured emotion in emotional space; and pn, an, and dn are the coordinate values for basic emotion types.
In accordance with the subject’s PAD value, Equation (1), and Table 4, the Euclidean distance, Ln, between the measured emotional state and each of the 14 basic emotions can be calculated. This distance represents the degree of emotional tendency of the measured emotion [38]. The basic emotion type with the smallest distance value was identified as the main emotional tendency of the measured emotional state.
Physiological feedback was recorded using a telemetric eye tracker (a See Pro; sampling rate, 200 Hz). The eye movement metrics used in this study included fixation (fixation count, average fixation duration), saccade (saccade count, average saccade duration, average saccade velocity, average saccade amplitude, average pupil diameter), pupil diameter, and heat maps. The significance of each metric and its correlation with the other metrics of this study are shown in Table 5.

2.3. Subjects

The experiment of this study was conducted in accordance with the Declaration of Helsinki and received human ethical approval from the institution. In this study, G*Power 3.1 software was used to determine the number of subjects required for the experiment, with parameters set at 1 − β = 0.9, α = 0.05, and effect size = 0.25. Considering the effect sizes and experimental conditions, 31 participants were enrolled for the experiment, including 15 males and 16 females, with a mean age of 24.39 years (standard deviation of 1.31). All participants were graduate students who reported normal vision and no physical discomfort, and all of them signed the informed consent form for the experiment.

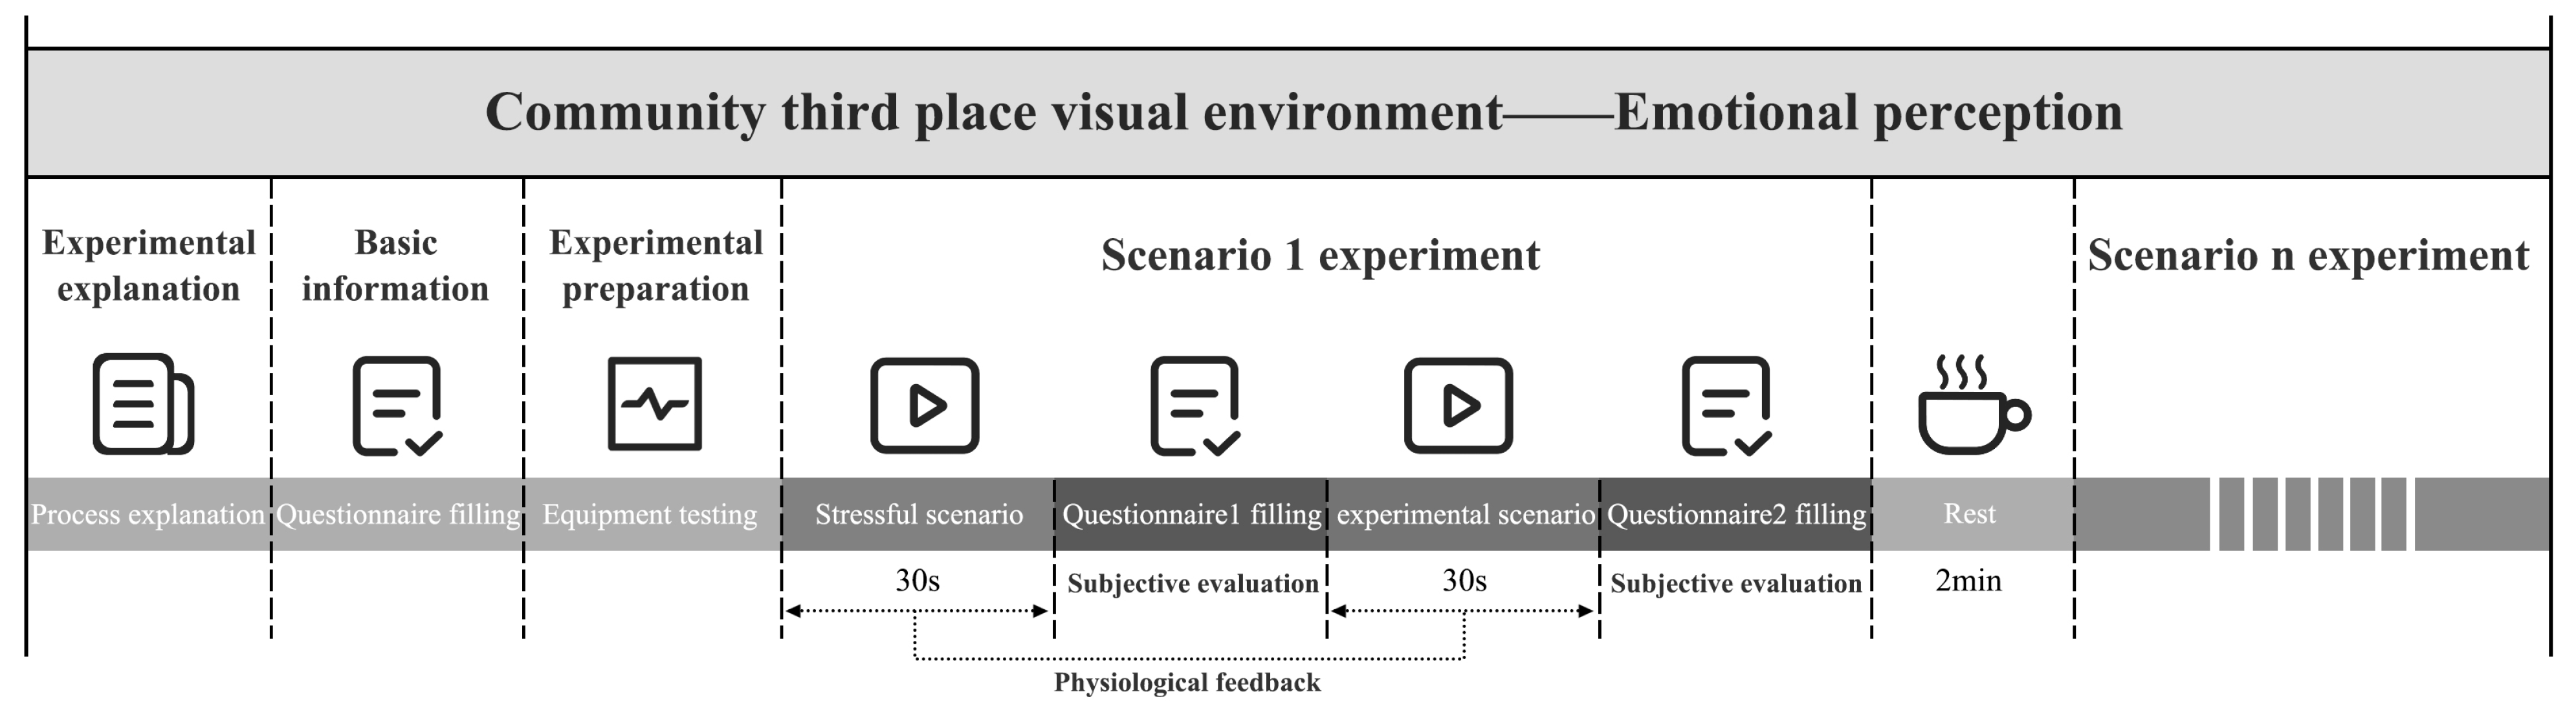
2.4. Experimental Procedure

The laboratory layout and photographs are shown in Figure 3. Before the start of the experiment, the subjects were first briefed on the experimental procedure and completed a basic information questionnaire (age and gender). Next, the eye-tracking equipment was tested and calibrated. Following this, the experiment was conducted for each scene, and the subjects first watched a 30 s video of city traffic (stressful scenario phase) and completed a PAD three-dimensional emotion scale (Questionnaire 1); then, they watched an image of the indoor scene of the café for 30 s (experimental scenario phase) and completed a PAD 3D mood scale (Questionnaire 2) while eye movement data were recorded. After a 2 min break, the next experiment began; each subject experienced 17 different visual scenes, with scene sequences played randomly, and the specific process is shown in Figure 4.
In this study, urban traffic noise videos were used as stress scenarios. Related studies have shown that traffic noise has a negative effect on physiological and psychological states and is prone to inducing worrying emotions in individuals [51,52].

3. Results

This study explored the effects of different visual environmental factors and their levels on perception evaluation and physiological feedback using a multivariate ANOVA. The multiple covariance test revealed that the VIF values were all 1, and there is no covariance problem among the environmental factors.

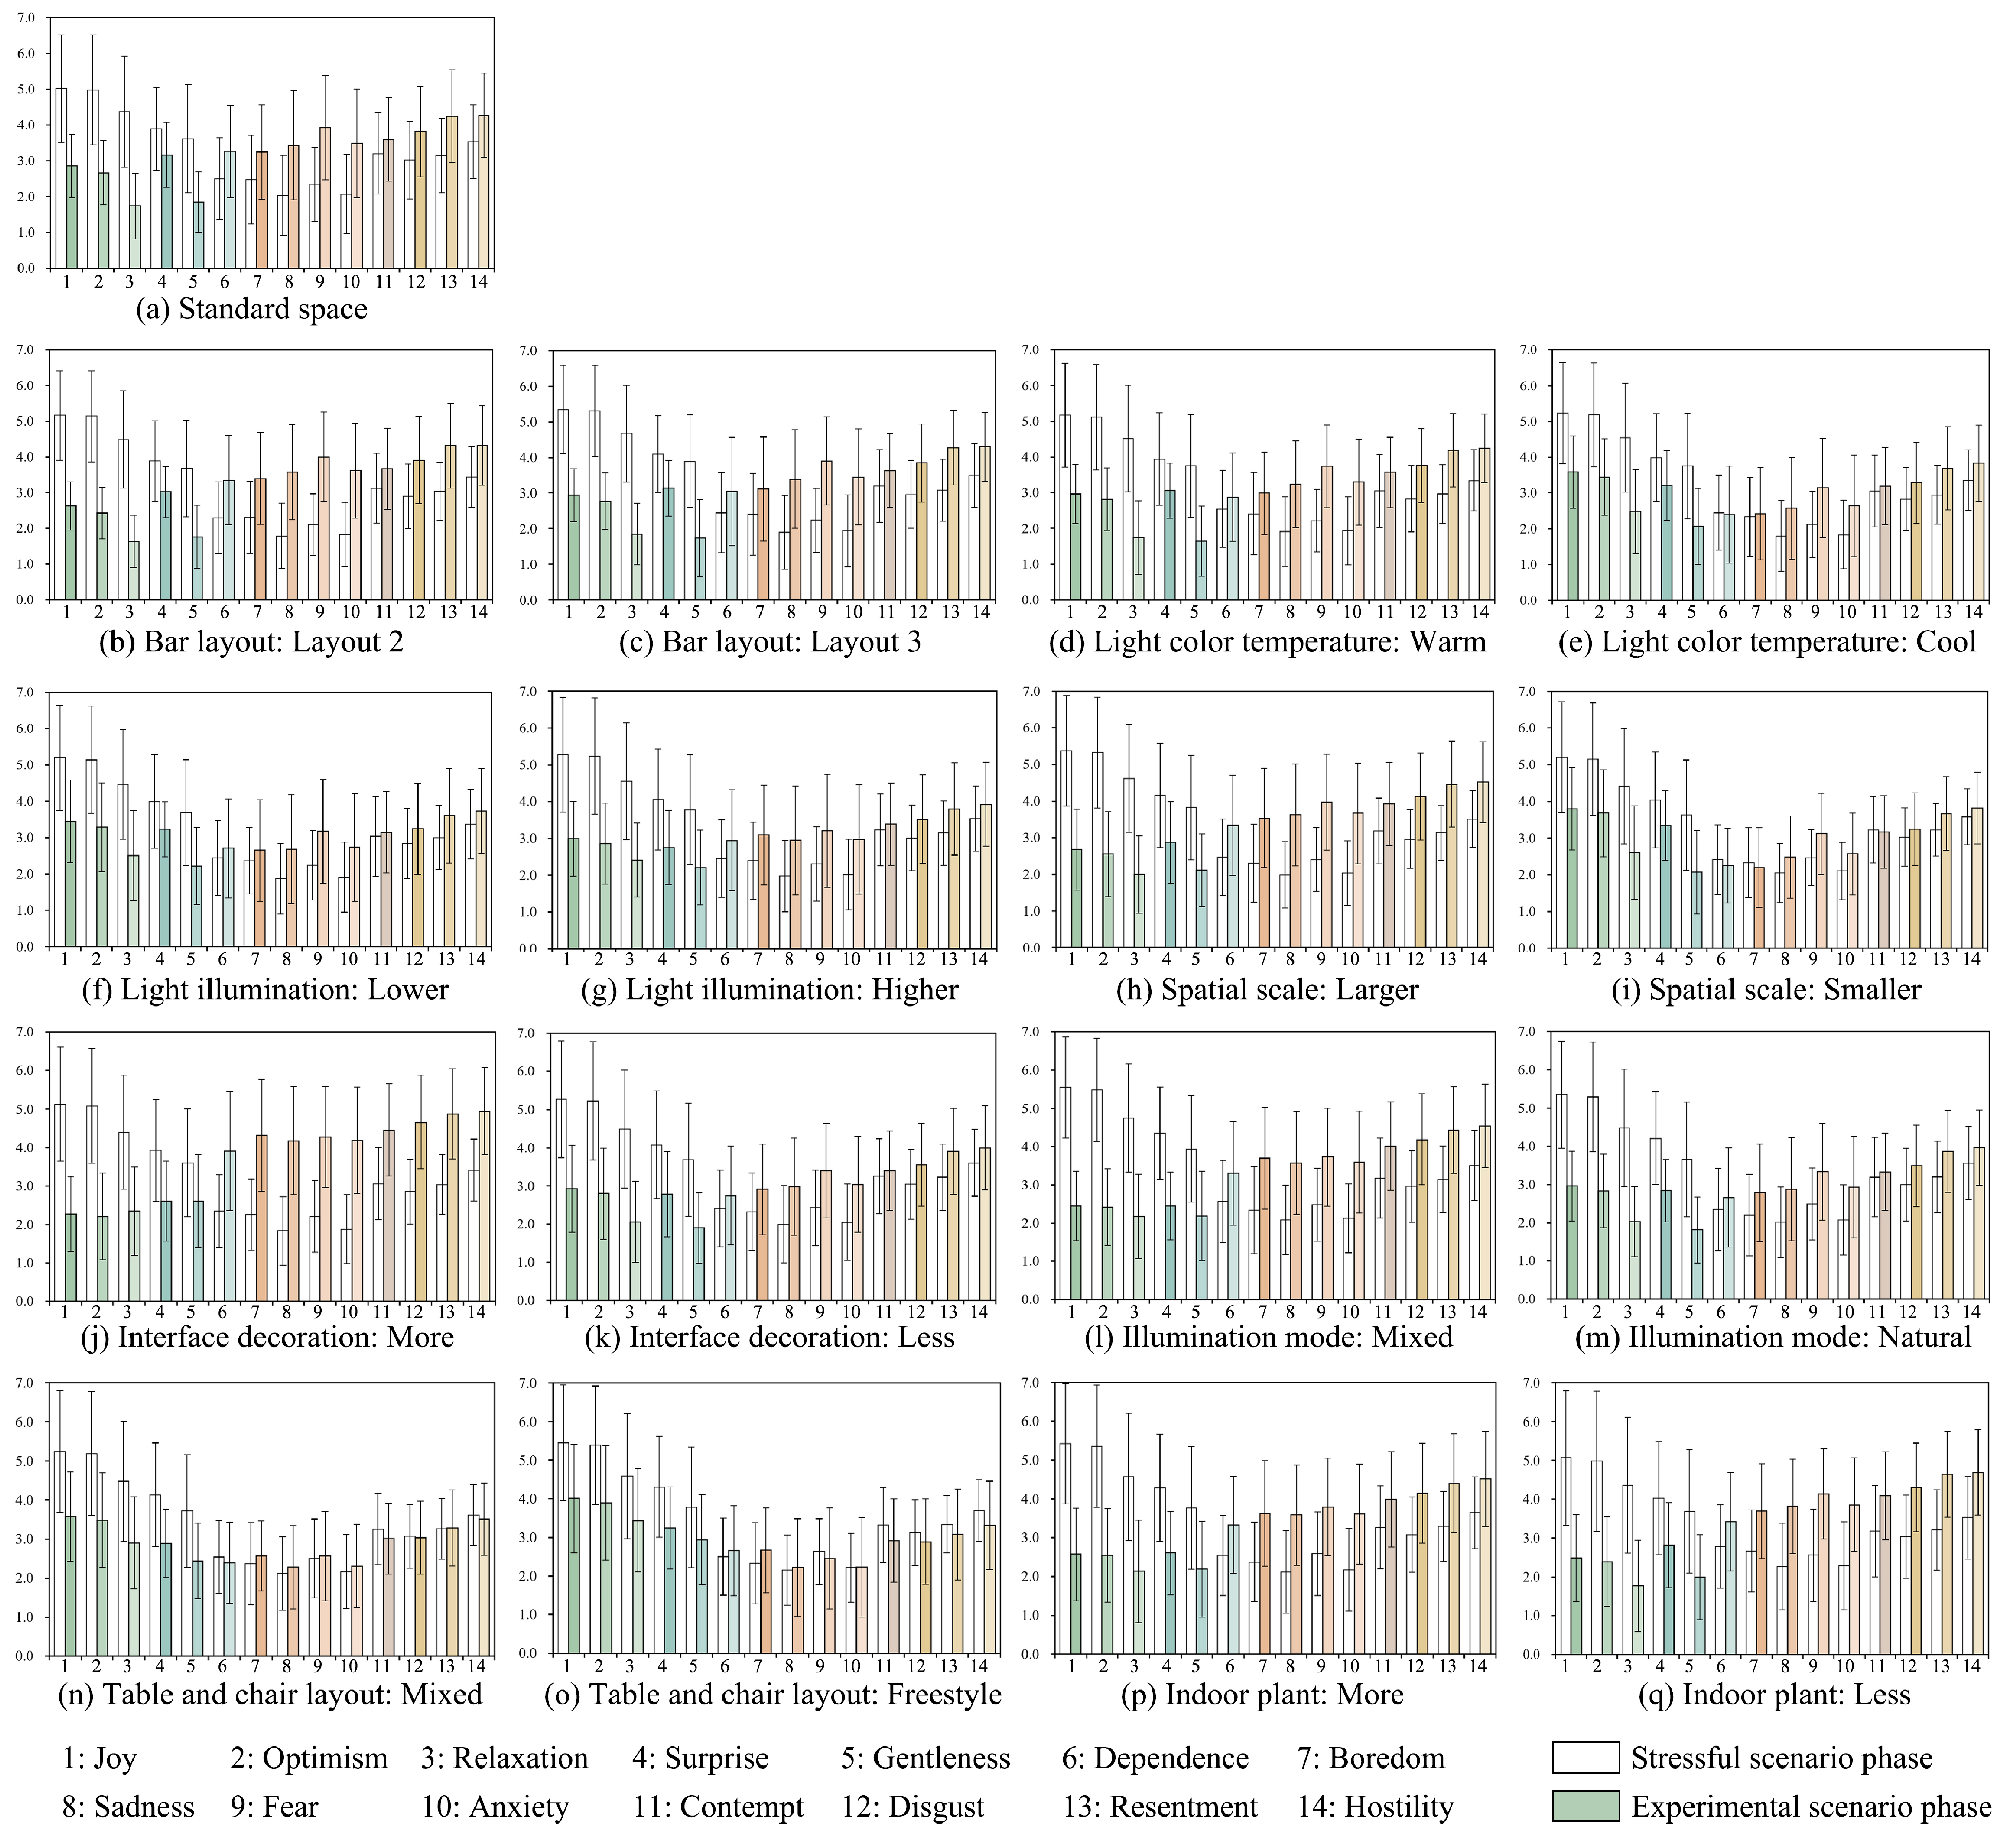
3.1. Perception Evaluation in Different Visual Environment of Community Third Places

We calculated the PAD values during the stressful and experimental scenario phases and accordingly to different emotional tendencies (joy, optimism, relaxation, surprise, gentleness, dependence, boredom, sadness, fear, anxiety, contempt, disgust, resentment, and hostility).
Figure 5 shows the mean values of the emotional tendencies for each environmental factor in the stressful scenario and experimental scenario phases. The emotional tendencies for joy, optimism, and relaxation are higher in the experimental scenario compared to the stress scenario across all environmental factors and levels. These tendencies are more noticeable with larger spatial scales, more interface decorations, mixed illumination modes, and both more or fewer indoor plants. Except cooler light color temperatures, smaller spatial scales, and mixed and freestyle table and chair layouts, emotional tendencies such as dependence, boredom, sadness, and fear are lower in the experimental scenario compared to the stressful scenario across all environmental factors and levels, with less noticeable tendencies for interfacial decorations and both more or fewer indoor plants. In addition, emotional tendencies such as dependence, contempt, or hostility are higher in the experimental scenario compared to the stressful scenario at smaller spatial scales and with mixed and freestyle table and chair layouts.
Table 6 presents the main emotional tendency for each scene (the type of emotion with the smallest distance value is the main emotional tendency of the scene). The main emotional tendency for the standard space scene is relaxation, with a distance of 1.732, and the main emotional tendency for the rest of the scenes is relaxation or gentleness, with the bar layout of Layout 2 having the greatest emotional relaxation tendency, with a distance value of 1.633. The warm color temperature lighting has the greatest emotional tendency, with a distance value of 1.641. However, the main emotional tendency for mixed and freestyle table and chair layouts is sadness, with distance values of 2.137 and 1.765, respectively.
ANOVA was performed on the data for each visual environmental factor and emotional tendency, as shown in Table 7. According to the main effect analysis, the light color temperature has a significant effect on the emotional tendencies of joy, optimism, relaxation, dependence, boredom, sadness, and anxiety (p < 0.05); the light illuminance has a significant effect on the emotional tendency of relaxation (p < 0.05); the spatial scale has a significant effect on the emotional tendencies of all types (except for surprise and mildness, p < 0.05); the interface decoration has a significant effect on the emotional tendencies of all types (except for optimism, relaxation, and surprise, p < 0.05); the illumination mode has a significant effect on the emotional tendencies of surprise and boredom (p < 0.05); and the table and chair layout has a significant effect on the emotional tendencies of all types (except for surprise, p < 0.05).
As shown in Figure 6, among the light color temperatures, the emotional tendencies for joy, optimism, and relaxation are significantly higher for neutral and warm color temperatures compared to the cold color temperatures (p < 0.05), with a maximum difference of 0.78, while the emotional tendencies for dependence, boredom, and sadness are significantly higher for cold color temperatures compared to the neutral color temperatures (p < 0.05), with a maximum difference of 0.87.
Among the light illuminations, the emotional tendency for relaxation is significantly higher for moderate illumination compared to the other illuminations (p < 0.05), with a maximum difference of 0.78.
Among the spatial scales, the emotional tendencies for joy and optimism are significantly higher for moderate and larger scales compared to the smaller scale (p < 0.01), with a maximum difference of 1.12; the emotional tendency for relaxation is significantly higher for moderate scales compared to the smaller scale (p < 0.01), with a difference of 0.87. The emotional tendencies for dependence, boredom, sadness, fear, and anxiety are significantly higher for smaller scales compared to other scales (p < 0.01), with a maximum difference of 1.34. The emotional tendencies for contempt, disgust, resentment, and hostility are significantly higher for the smaller scale compared to the larger scale (p < 0.05), with a maximum difference of 0.88.
Among the interface decorations, the emotion tendency for joy is significantly higher for more interface decorations compared to fewer interface decorations (p < 0.05), with a difference of 0.66. The emotion tendencies for mildness, boredom, contempt, and disgust are significantly higher for no and fewer interface decorations compared to more interface decorations (p < 0.05), with a maximum difference of 1.40. The emotion tendencies for dependence, sadness, fear, anxiety, indignation, and hostility are significantly higher for fewer interface decorations compared to more interface decorations (p < 0.01), with a maximum difference of 1.19.
Among the illumination modes, the emotional tendency for surprise is significantly higher for mixed illumination compared to artificial illumination (p < 0.01), with a difference of 0.72, and the emotional tendency for boredom is significantly higher for natural illumination compared to hybrid illumination (p < 0.05), with a difference of 0.91.
Among the table and chair layouts, the emotional tendencies for joy and gentleness are significantly higher for the arranged layout compared to the freestyle layout (p < 0.01), with a maximum difference of 1.15. The emotional tendencies for optimism and relaxation are significantly higher for the arranged layout compared to the other layouts (p < 0.01), with a maximum difference of 1.71. The emotional tendencies for sadness, fear, anxiety, aversion, resentment, and hostility are significantly higher for the arranged layouts compared to the mixed and freestyle layouts (p < 0.01), with a maximum difference of 1.47.

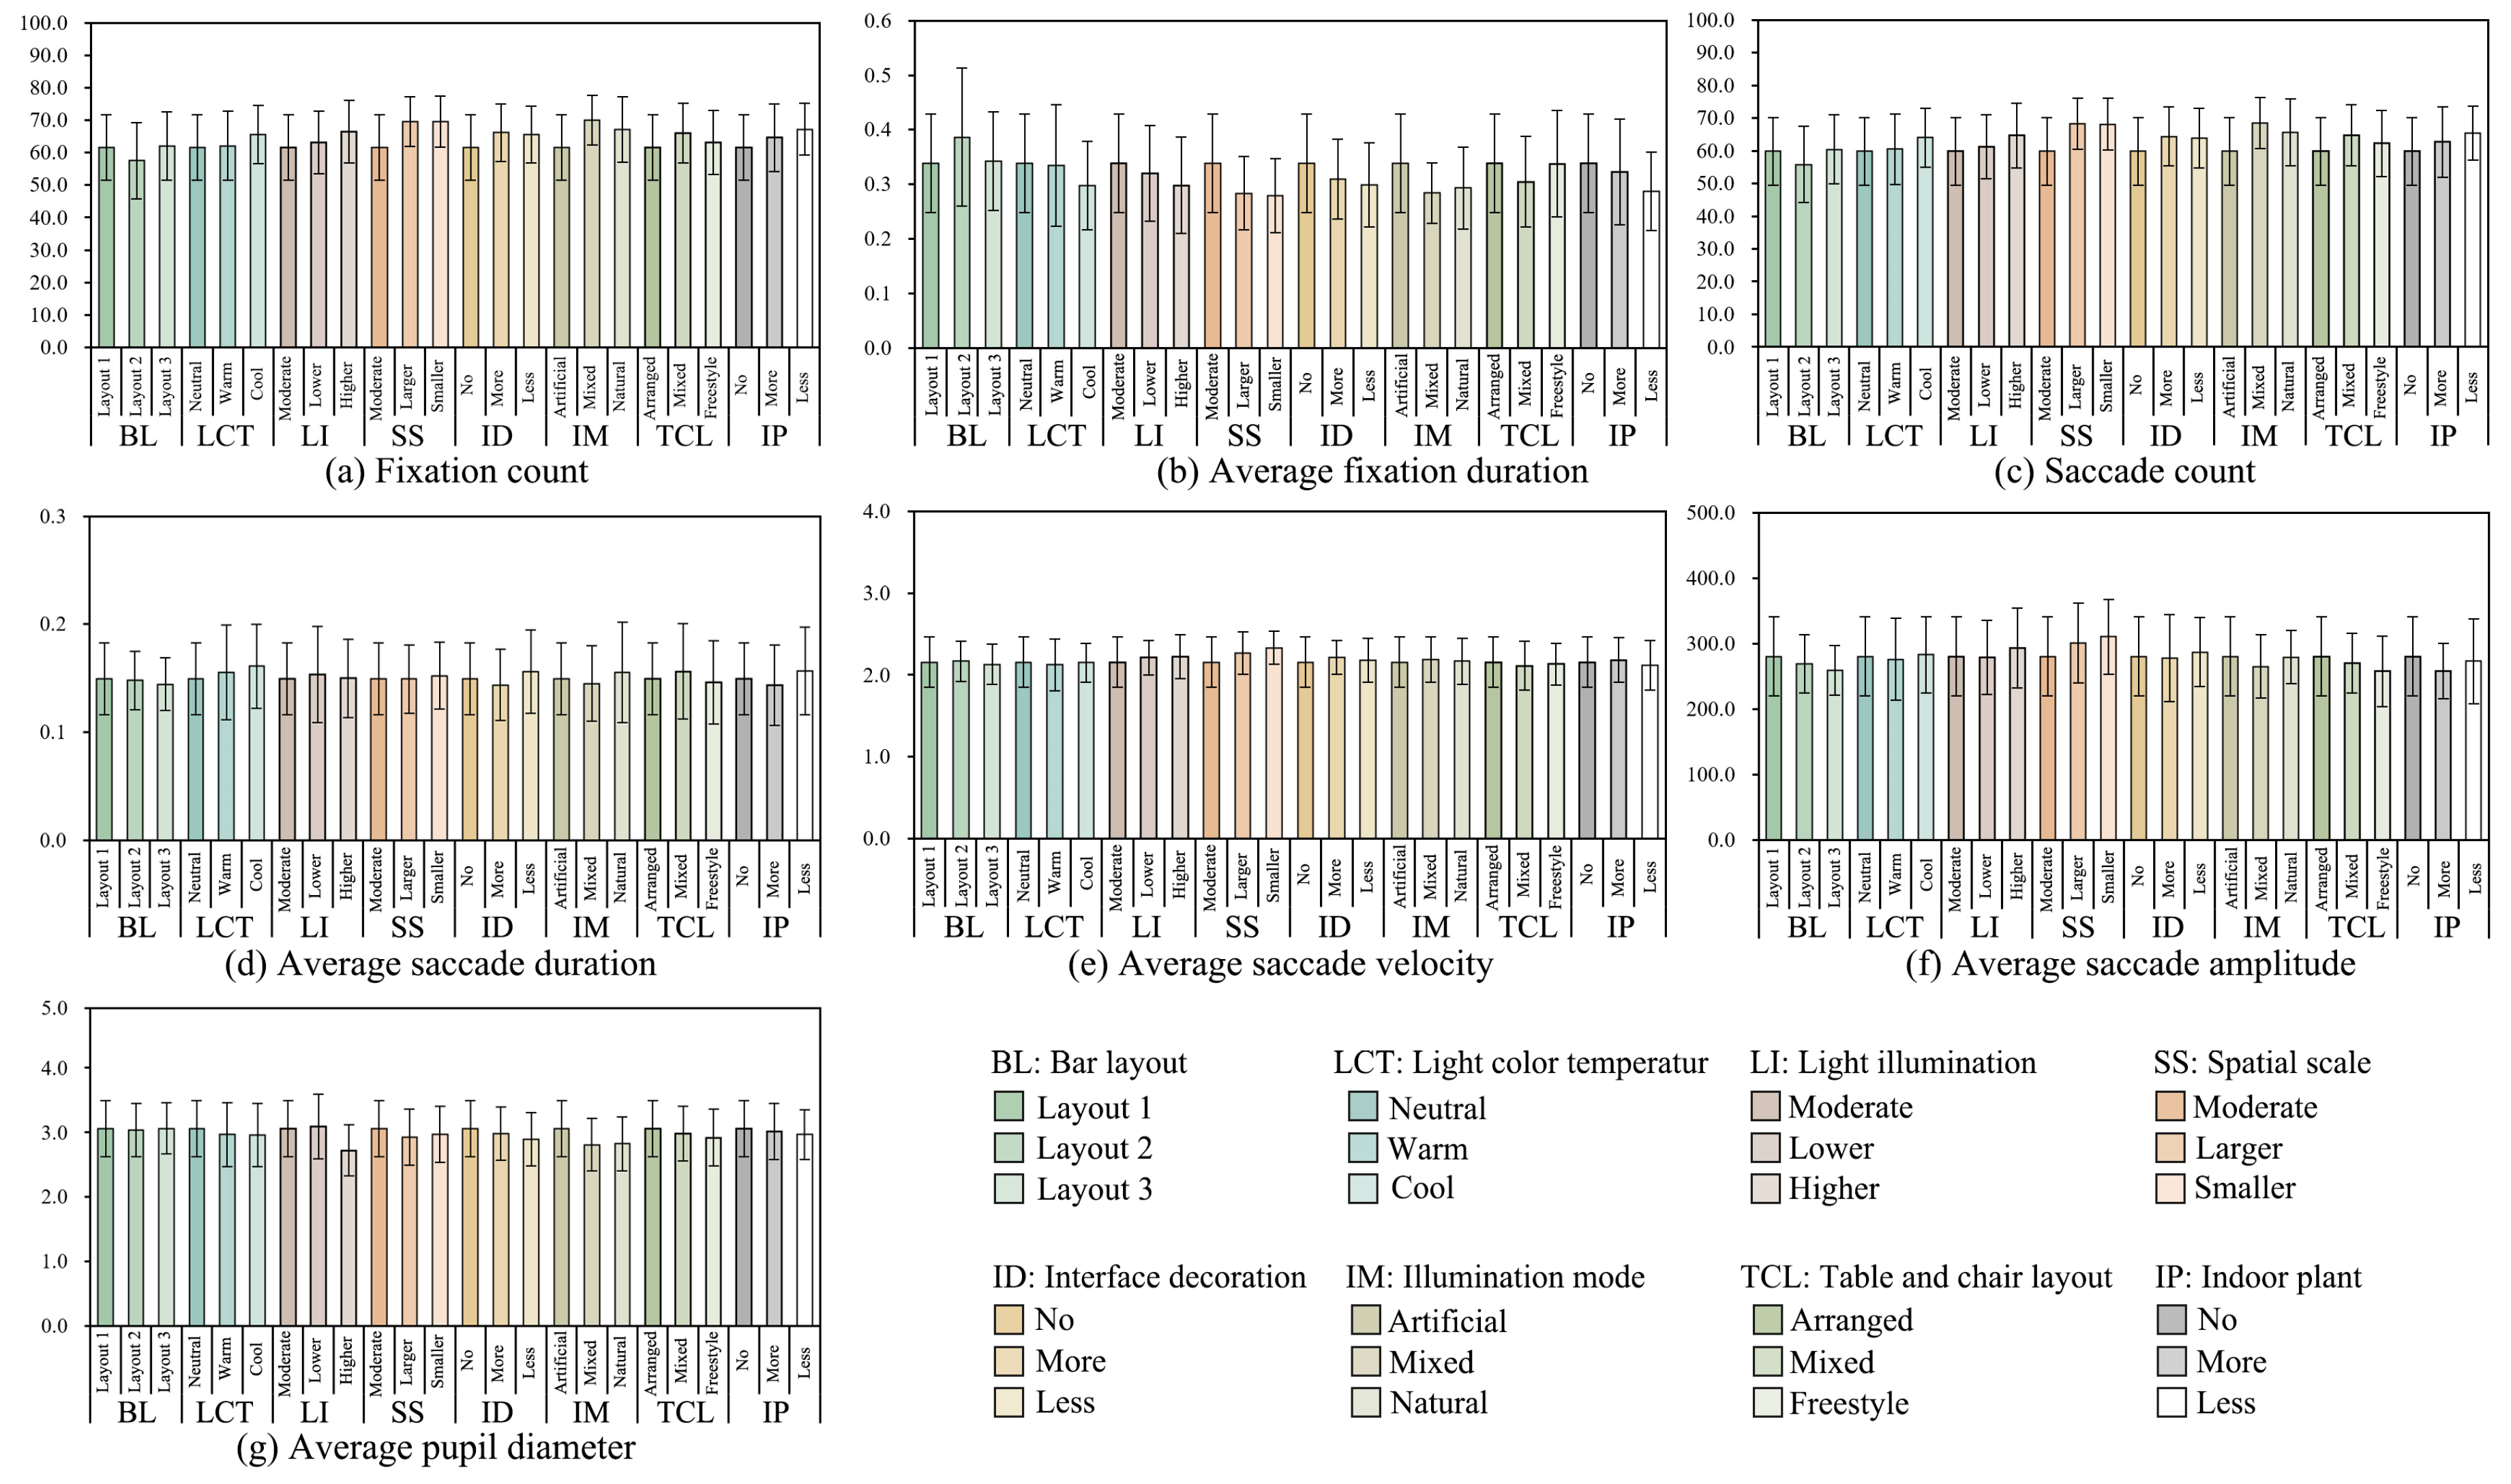
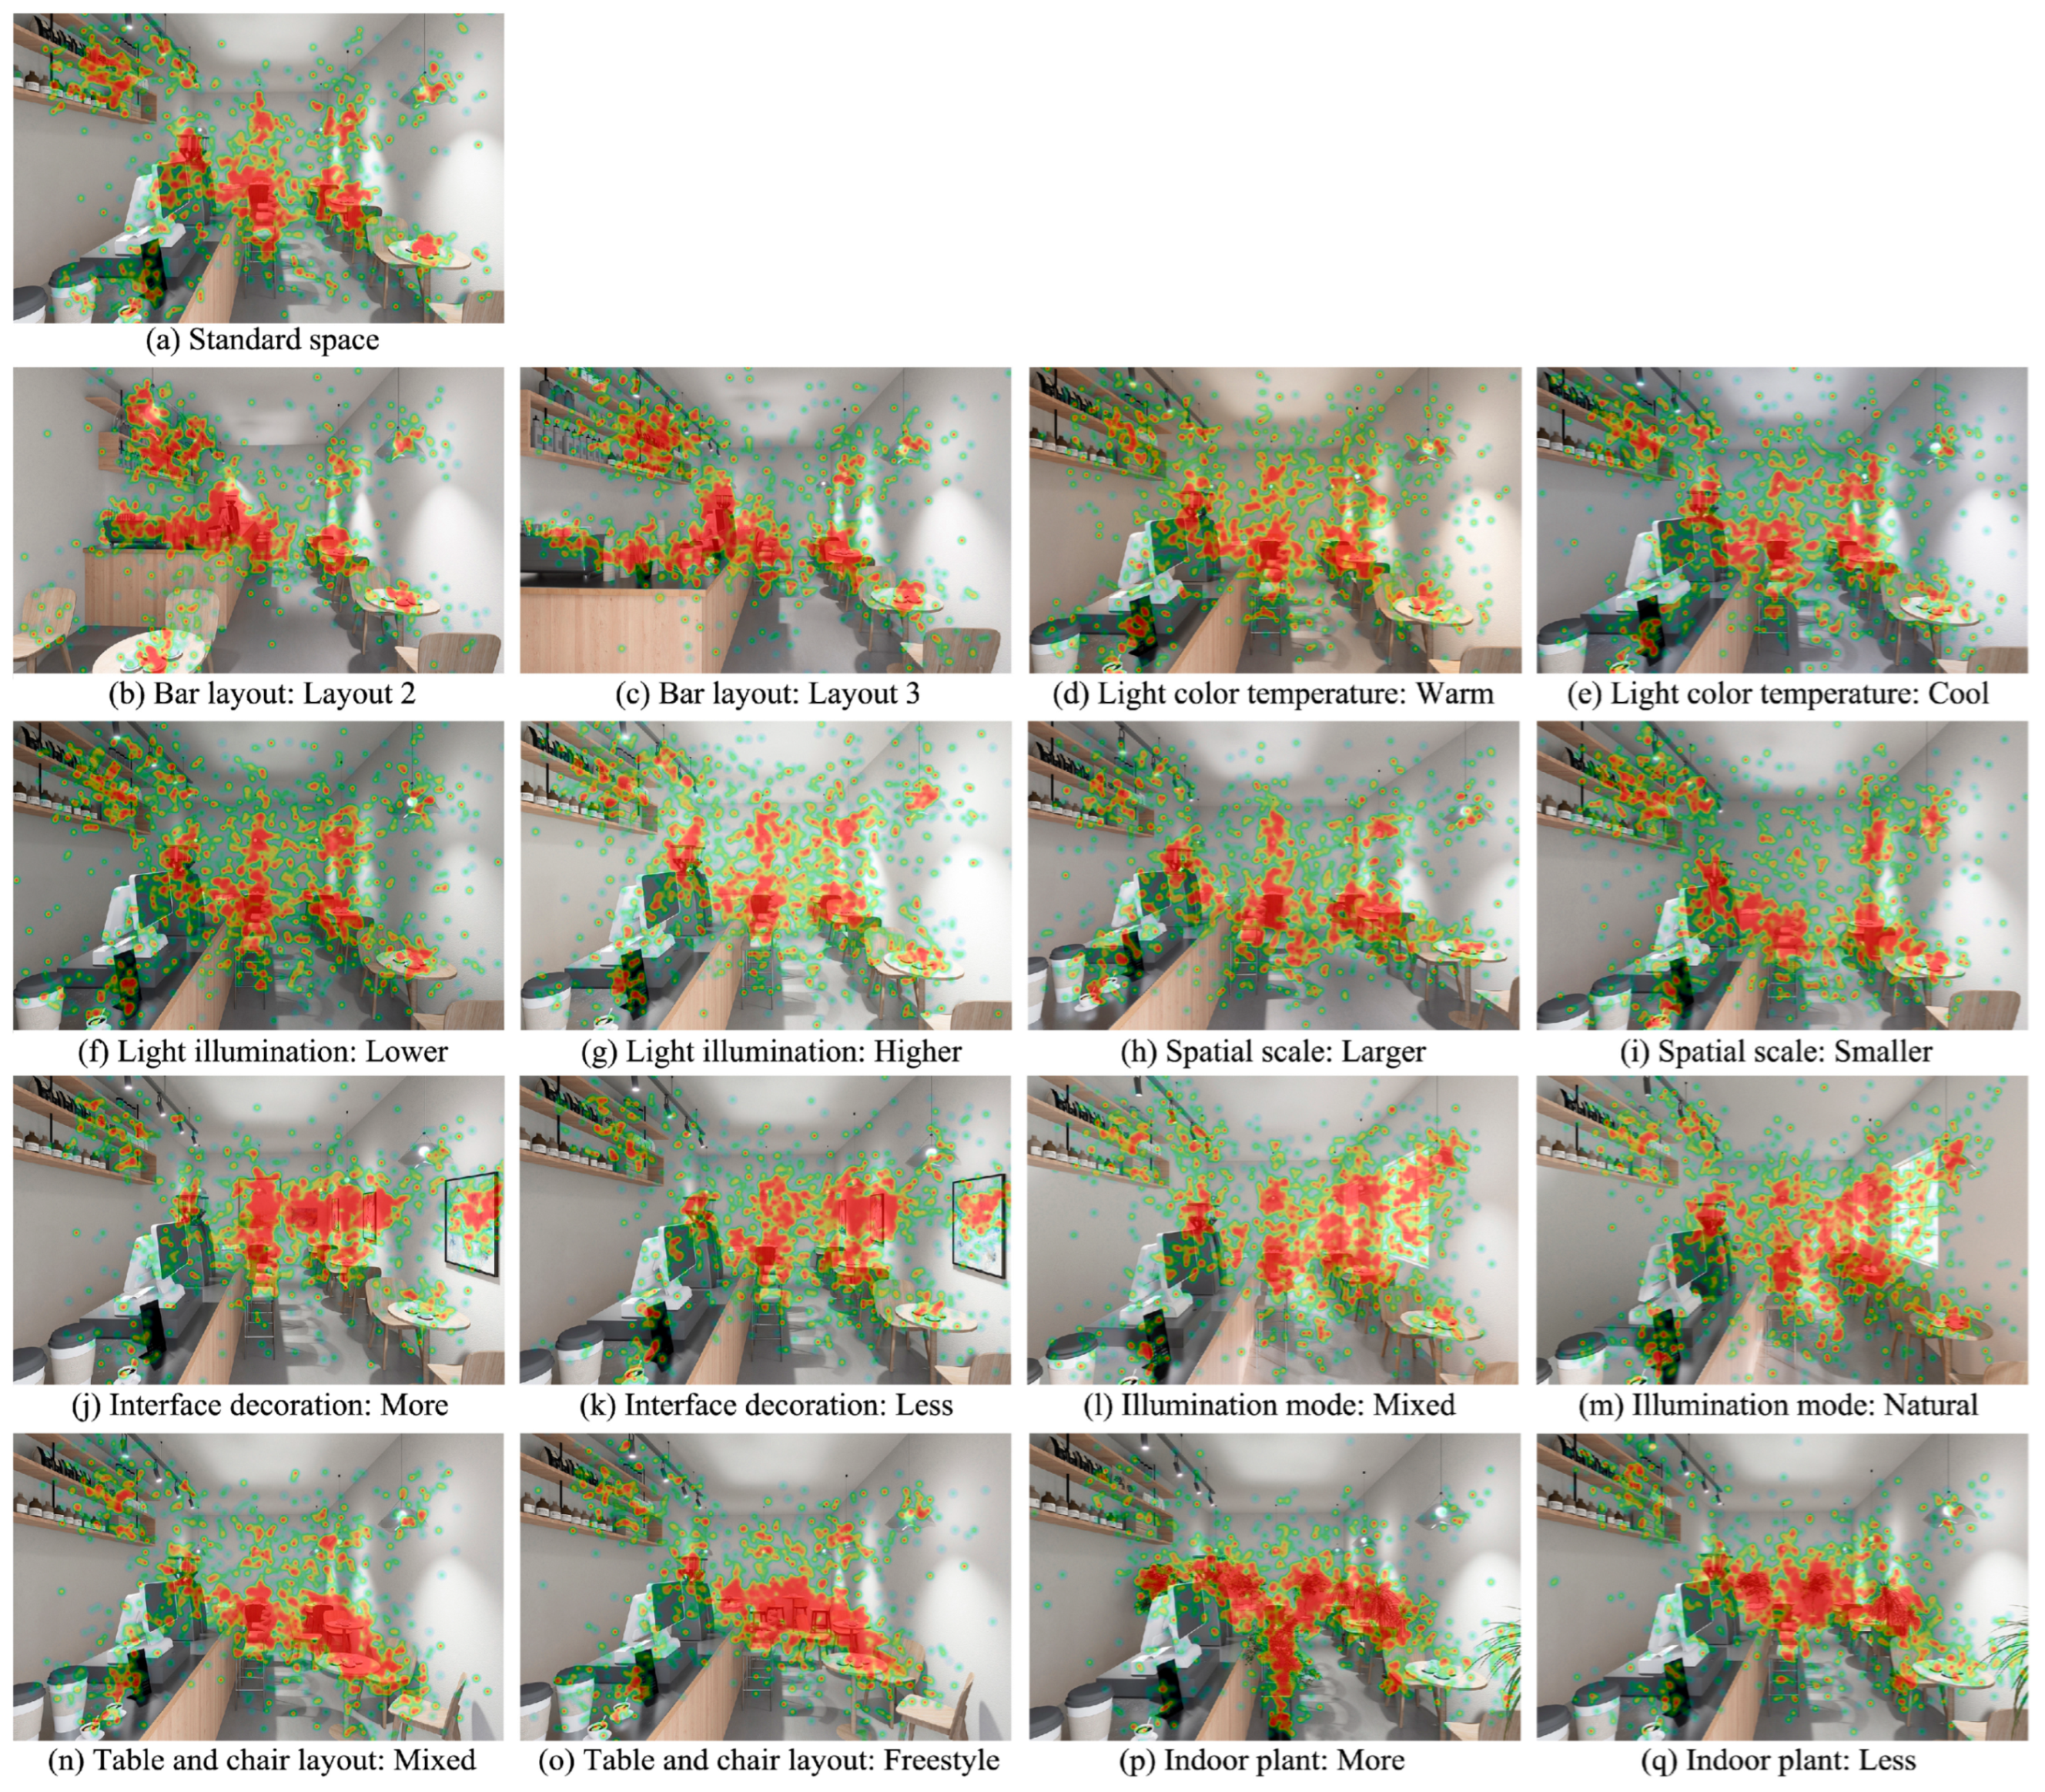
3.2. Physiological Feedback in Different Visual Environment of Community Third Places

ANOVA was performed for each visual environmental factor and eye movement index, as shown in Table 8. Light illumination has a significant effect on the average pupil diameter (p < 0.01); spatial scale has a significant effect on the number of fixation counts, average fixation duration, saccade count, and average saccade velocity (p < 0.05); illumination mode has a significant effect on the number of fixation counts, average fixation duration, saccade count, and average pupil diameter (p < 0.05); and indoor plants have a significant effect on the number of fixation counts, average fixation duration, and saccade count (p < 0.05).
As shown in Figure 7, among the light illuminations, the average pupil diameter is significantly lower for higher illuminance compared to other illuminances (p < 0.01), with a maximum difference of 0.37.
Among the spatial scales, the fixation count and saccade count are significantly higher for larger and smaller scales compared to moderate scales (p < 0.01), with a maximum difference of 8.03 and 8.48, respectively; the average fixation duration is significantly higher for moderate scales compared to other scales (p < 0.01), with a maximum difference of 0.59; and the average saccade velocity is significantly higher for smaller scales compared to moderate scales (p < 0.01), with a difference of 0.18.
Among the illumination modes, the fixation count and saccade count are significantly higher for mixed and natural illumination compared to artificial illumination (p < 0.05), with a maximum difference of 8.45 and 8.71, respectively. The average fixation duration and average pupil diameter are significantly higher for artificial illumination compared to other illumination modes.
Among the indoor plants, the fixation count and saccade count are significantly higher for fewer indoor plants compared to no plants (p < 0.05), with differences of 5.58 and 5.52, and the average fixation duration for no plants is significantly higher compared to fewer indoor plants (p < 0.05), with a difference of 0.05.
Figure 8 shows the analysis of the eye movement heat maps, which present the sub-jects’ attention time to different elements of the experimental scene through color changes; the red region indicates the region with the longest attention time. The data are processed as absolute duration. The subjects’ main focus of attention in each scene is on the table, chairs, furniture, bar and its objects, lamps, and shelves. When interface decorations, windows, and indoor plants are added to the indoor space, the subjects’ attention shifts towards these new elements, resulting in a slight decrease in attention to the original elements. In addition, the subjects’ attention to the spatial interface increased when the color temperature of the light, spatial illuminance, and spatial scale changed.

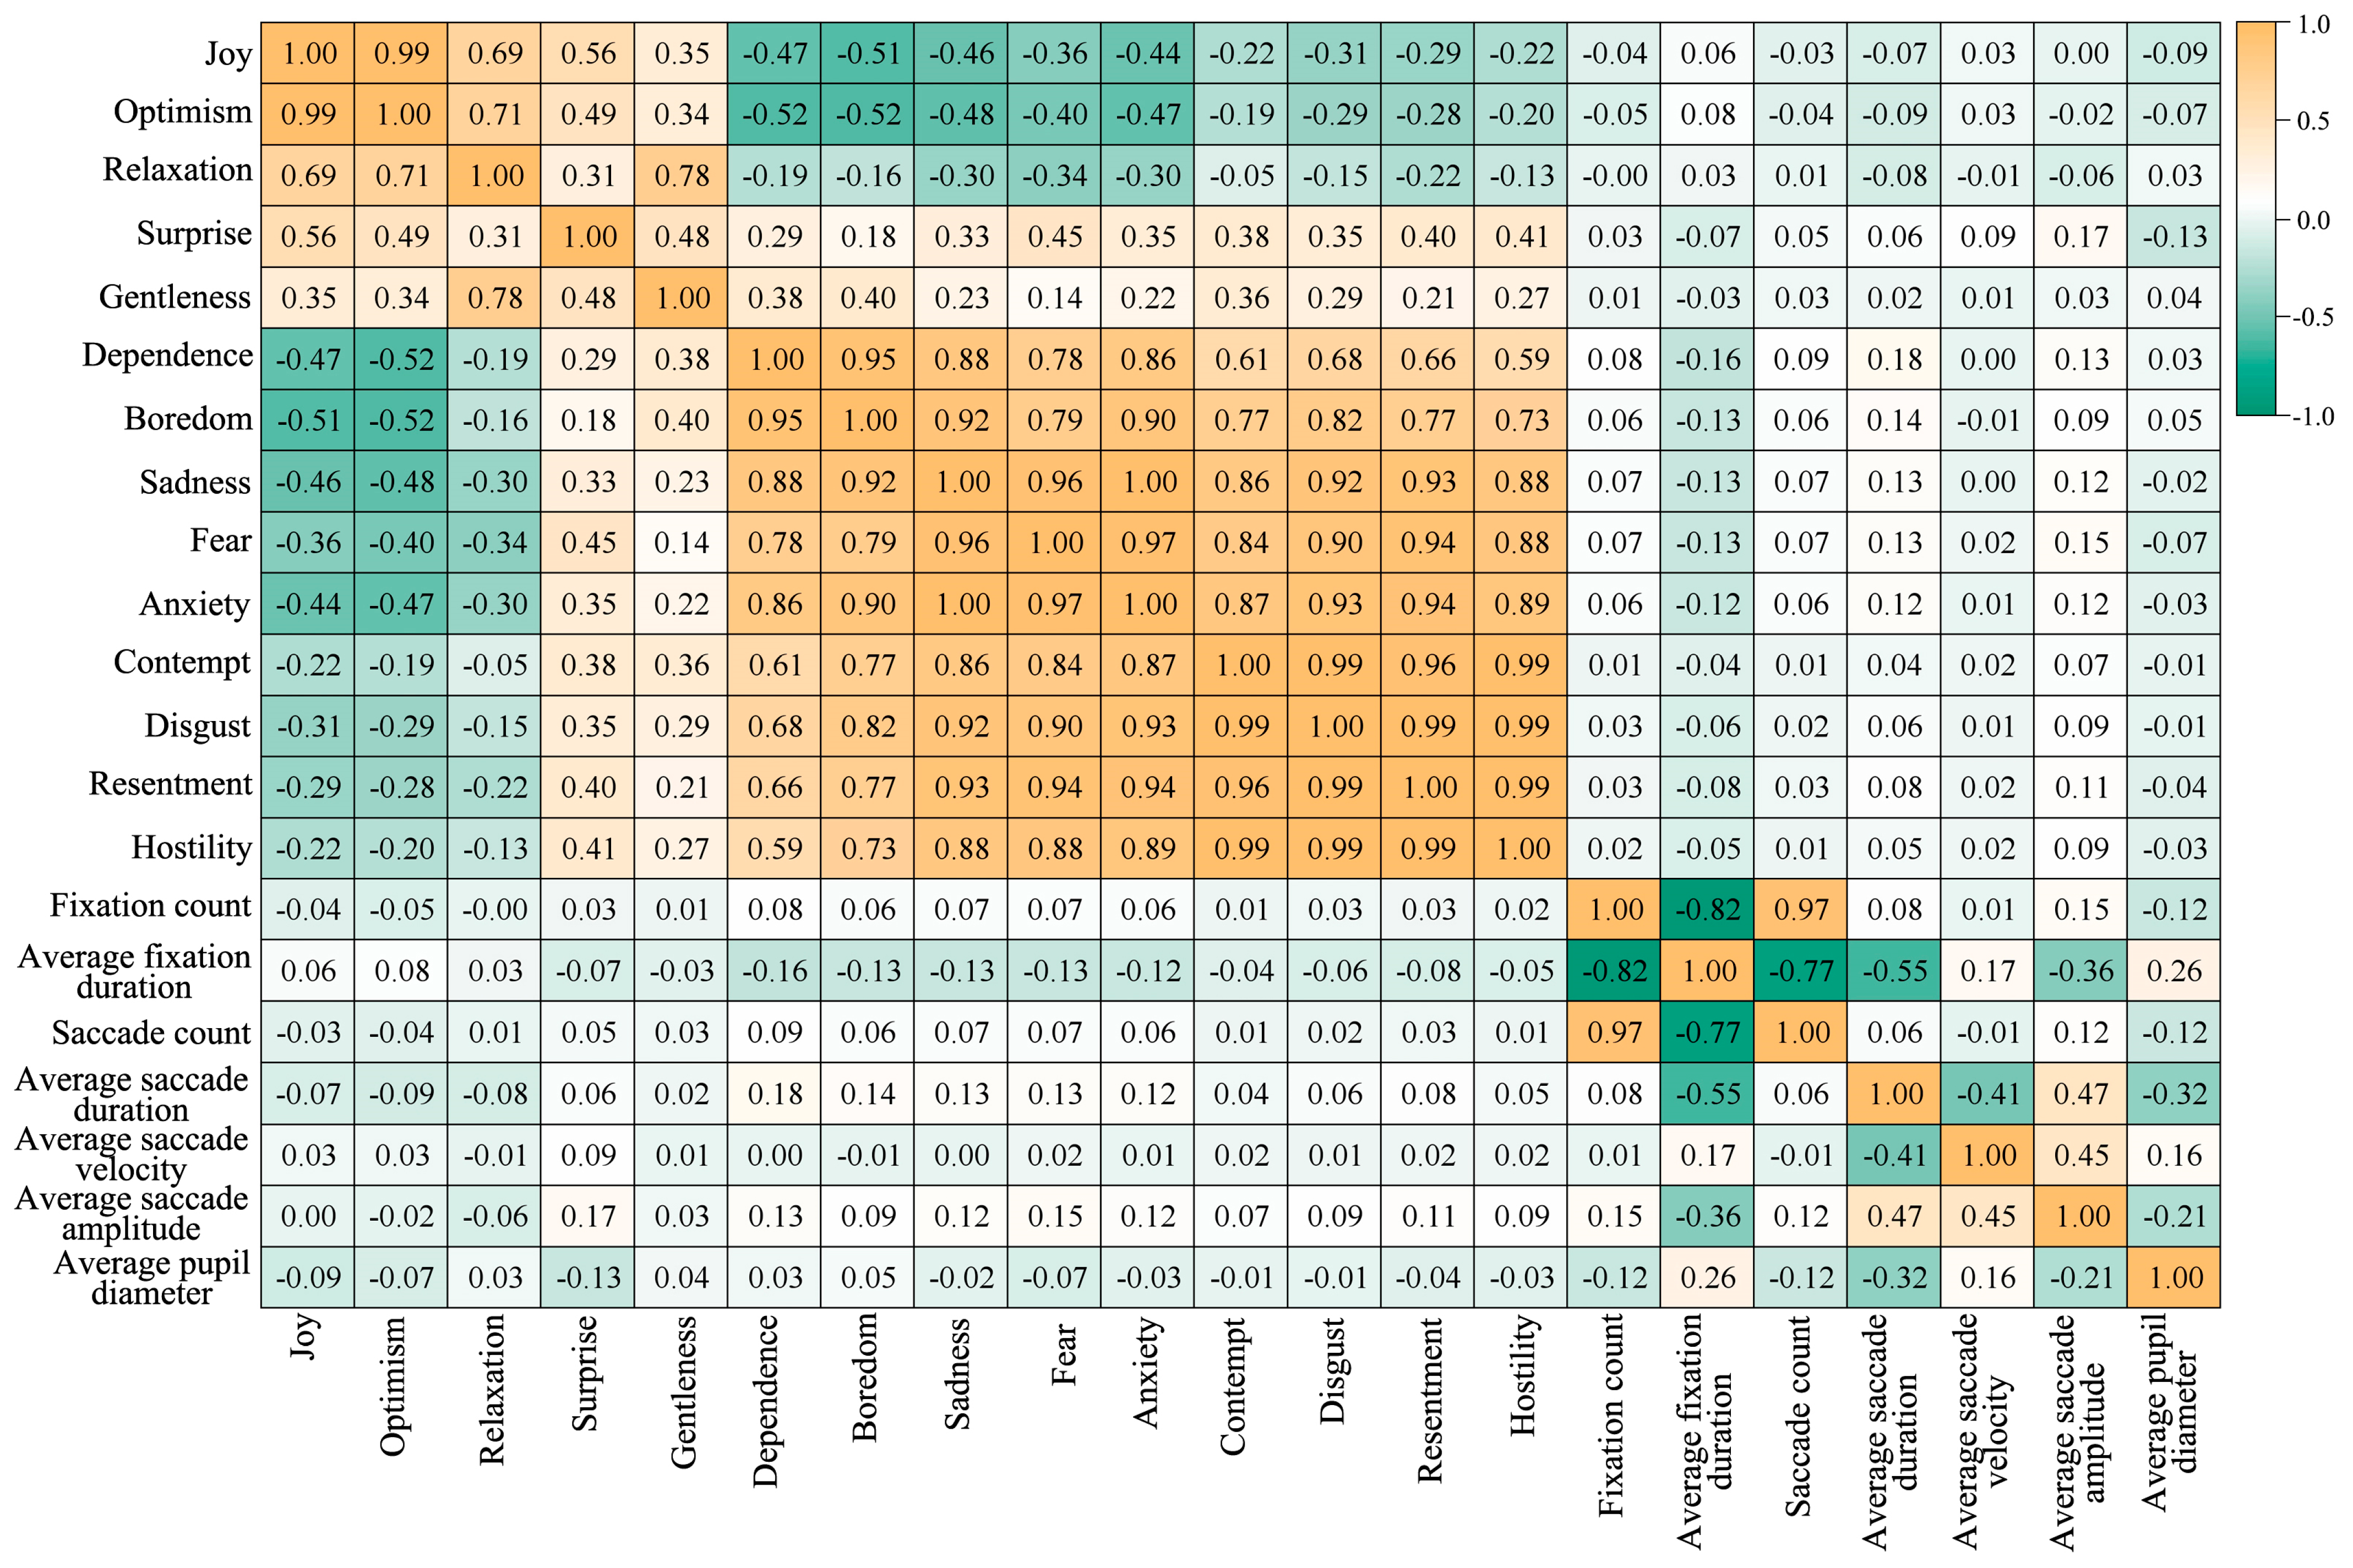
3.3. Correlation Analysis Between Perception Evaluation and Physiological Feedback

Pearson’s correlation analysis was used to examine the correlations between perception evaluation and physiological feedback across the different visual environments of community third places, as shown in Figure 9.
Among the perception evaluations, joy, optimism, relaxation, surprise, and gentleness emotional tendencies are all significantly and positively correlated between the two (p < 0.01). Dependence, boredom, sadness, fear, anxiety, contempt, disgust, resentment, and hostility emotional tendencies are significantly and positively correlated between the two (p < 0.01). Joy, optimism, and relaxation are significantly negatively correlated with dependence, boredom, sadness, fear, anxiety, contempt, disgust, resentment, and hostility (p < 0.01). Surprise is significantly positively correlated with dependence, sadness, fear, anxiety, contempt, disgust, resentment, and hostility (p < 0.01). Gentleness is significantly negatively correlated with dependence, boredom, sadness, fear, anxiety, contempt, disgust, resentment, and hostility (p < 0.01).
Among the physiological feedback, fixation count is significantly positively correlated with saccade count and average saccade amplitude (p < 0.01) and significantly negatively correlated with average fixation duration and average pupil diameter (p < 0.01). Average pupil diameter is significantly positively correlated with average fixation duration and average saccade velocity (p < 0.01) and significantly negatively correlated with average saccade duration and average saccade amplitude (p < 0.01). Average fixation duration is significantly positively correlated with average saccade velocity (p < 0.01) and significantly negatively correlated with average saccade duration and average saccade amplitude (p < 0.01).
Joy is significantly negatively correlated with average pupil diameter (p < 0.05). Optimism is significantly negatively correlated with average saccade duration (p < 0.05). Surprise is significantly positively correlated with average saccade velocity and average saccade amplitude (p < 0.05) and significantly negatively correlated with average pupil diameter (p < 0.05). Dependence is significantly positively correlated with fixation count, saccade count, average saccade duration, and average saccade amplitude (p < 0.05) and significantly negatively correlated with average fixation duration (p < 0.01). Boredom, sadness, fear, and anxiety are significantly positively correlated with average saccade duration and average saccade amplitude (p < 0.05) and significantly negatively correlated with average fixation duration (p < 0.01). Disgust, resentment, and hostility are significantly positively correlated with average saccade amplitude (p < 0.05). In summary, there is a certain correlation between the subjects’ perception evaluation and physiological feedback data, but all correlations are weak.

4. Discussion

4.1. The Effect of Visual Environment of Community Third Places on Perception Evaluation

Studies have shown that the visual environments of community third places have different degrees of effect on subjects’ perception evaluation. The findings of light color temperature, space scale, and interface decoration are consistent with previous research. Previous studies have shown that light color temperature [28], space scale [15], and interface decorations [32] affect emotion perception, with warmer lights being more conducive to promoting positive emotions [28,33]. Crowded spaces had a negative effect on psychology [53], with shorter spaces tending to induce a sense of depression, while taller spaces contribute to psychological relaxation [35]. Decorations are an important stimulus that affects both physiological and psychological responses, promoting psychological relaxation [32]. However, the findings regarding table and chair layout differed from the previous studies, which indicated that the freestyle table and chair layout was related to positive emotions [28]. The difference in the results of the present study may stem from subjective variability in individual evaluations and was also affected to some extent by factors such as the type and material of furniture [54].
The findings of light illumination are consistent with previous research. Previous studies have shown that moderate lighting conditions are associated with comfort and relaxation [28], while higher illuminance is associated with strong emotional responses [34].
The findings of illumination mode are different from previous research. Previous studies have shown that the effect of the natural illumination mode on emotions is two-sided [22,23,24,25]; therefore, the mixed illumination mode should be prioritized, and natural light should be reasonably arranged according to the light conditions to promote the development and sustenance of positive emotions.

4.2. The Effect of Visual Environment of Community Third Places on Physiological Feedback

Studies have shown that the visual environments of community third places have different degrees of effect on subjects’ physiological feedback. Previous studies have shown that fixation count and saccade count are positively correlated with emotional arousal [39,45], attention [41,42], and cognitive load [43]; the average fixation duration is negatively correlated with cognitive load [43]; and the average saccade velocity is positively correlated with attention [42] and cognitive load [43]. This suggests, to some extent, that appropriate spatial scales, illumination modes, and indoor plants can increase emotional arousal, attention, or cognitive load. However, eye movement metrics only identify emotional arousal, making it difficult to distinguish between specific types of emotions. In addition, higher light illumination significantly decreased the average pupil diameter, which may be due to increased luminance [55], independent of emotion.
Physiological feedback data based on perception evaluation corroborate that larger spatial scales and mixed illumination modes promote positive emotions such as joy and optimism, whereas smaller spatial scales tend to increase negative emotions such as boredom, sadness, fear, and anxiety. However, the subjective and objective data of some visual environmental factors are contradictory. For example, both larger and smaller spatial scales significantly increase fixation and saccade count, yet larger spatial scales are associated with increased positive emotions, while smaller spatial scales are linked to heightened negative emotions. This may be caused by the interference of the complexity of visual stimuli on eye movements [56]. Indoor plants have no significant effect on perceptual evaluation, but have a significant effect on physiological feedback. Existing studies have shown that plants have a significant effect on emotion perception [26,27,57], which also side by side confirms the positive effect of the proper number of indoor plants on emotion. Therefore, research on emotion perception needs comprehensive consideration; perception evaluation determines the emotional tone, while physiological feedback can further prove the intensity of emotion.

4.3. Optimization Strategies for Visual Environment of Community Third Places Based on Emotional Perception

Synthesizing the perception evaluation and physiological feedback, certain visual environment optimization strategies for community third places based on emotional perception are proposed, as shown in Figure 10. For lighting, prioritize the use of warm (3000 k) and neutral (4500 k) color temperature lighting, moderate illumination (300 lx), and mixed illumination mode to promote positive emotions, and reduce the use of cool color temperature lighting to avoid triggering negative emotions. For space form and layout, prioritize the use of larger (40 m2) and moderate (32 m2) spatial scales, more interface decorations, and arranged table and chair layouts to promote positive emotions, and reduce the use of smaller spatial scales, no or fewer interface decorations, and mixed or freestyle table settings to avoid triggering negative emotions. For plants, arranging the proper number of plants in the room draws the attention of the user and adds a certain positive mood.

4.4. Limitations and Further Research

This study had a few limitations. Firstly, to reduce experimental complexity, only eight visual environment factors of the community third place were selected (bar layout, light color temperature, light illumination, spatial scale, interface decoration, illumination mode, table and chair layout, and indoor plants), based on their significant effect on emotional perception. Three levels were established for each environmental factor. In future studies, the selection of factors should be expanded, and the horizontal gradient of factors should also be increased.
Secondly, this study only focuses on the visual environment, and future research can add rich research contents such as thermal environment and acoustic environment. At the same time, environmental noise (café chatter) or virtual social presence could be introduced in the experiment to simulate a more complete environment. Furthermore, future research could add studies of individual users, such as age, gender, health, and cultural background.
Finally, only the eye movement index was used as the physiological feedback data in this study. In future studies, more physiological measurements, such as EEG, fMRI, ECG, EMG, and GSR, could be incorporated to enable a more comprehensive assessment of the effects of third place visual environments on physiological feedback.

5. Conclusions

This study comprehensively investigated the role of visual environmental factors in community third places and their levels on the perception of emotions through perception evaluation and physiological feedback data, with the following specific findings:
Light color temperature, light illuminance, spatial scale, interface decoration, illumination mode, and table and chair layout had significant effects on perception evaluation; light illuminance, spatial scale, illumination mode, and indoor plants had significant effects on physiological feedback.
In terms of perception evaluation, neutral or warm light color temperatures, moderate or larger spatial scales, more interface decorations, and arranged table and chair layouts significantly increased positive emotions such as joy and optimism. Moderate light illumination significantly increased relaxation tendencies, while mixed illumination modes significantly increased surprise tendencies and significantly reduced boredom tendencies. In terms of physiological feedback, larger or smaller spatial scales, mixed or natural illumination modes, and fewer indoor plants significantly increased fixation and saccade counts while significantly decreasing the average fixation duration.
There was a correlation between the subjects’ perception evaluation and physiological feedback data, but all of them were weakly correlated. Physiological feedback measurements establish the effect of visual environmental factors on subjective emotion perception to a certain extent, but it is difficult to accurately assess the specific types of emotions through physiological indicators alone; therefore, it is necessary to use a combination of subjective and objective methods to comprehensively evaluate the effects of visual environmental factors on the perception of emotions.

Author Contributions

Conceptualization, C.L., S.C., and Y.J.; methodology, Y.J.; software, S.C.; validation, C.L., S.C., and Y.J.; formal analysis, S.C.; investigation, S.C.; resources, C.L. and Y.J.; data curation, S.C.; writing—original draft preparation, S.C.; writing—review and editing, C.L., S.C., and Y.J.; visualization, S.C.; supervision, Y.J.; project administration, C.L.; funding acquisition, Y.J. All authors have read and agreed to the published version of the manuscript.

Funding

This work was supported by the National Natural Science Foundation of China (grant number 52408033).

Data Availability Statement

The raw data supporting the conclusions of this article will be made available by the authors on request.

Acknowledgments

The authors would like to thank all the respondents who participated in this study.

Conflicts of Interest

The authors declare no conflicts of interest.

Abbreviations

The following abbreviations are used in this manuscript:
BLBar layout
LCTLight color temperature
LILight illumination
SSSpatial scale
IDInterface decoration
IMIllumination mode
TCLTable and chair layout
IPIndoor plant

Appendix A

Factor system of the community third places on emotion.
Visual Environmental FactorPrincipal Constituent
123456
Space length–width ratio0.779
Spatial height–width ratio0.738
Spatial shape0.649
Spatial enclosure0.644
Spatial curvature0.600
Spatial scale0.567
Window position 0.780
Window size 0.772
Window shading mode 0.649
Window shape 0.638
Door size 0.533
Door position 0.531
Light illumination 0.823
Light color temperature 0.669
Illumination mode 0.654
Interface decoration 0.769
Interface color 0.747
Bar layout 0.455
Table and chair type 0.630
Table and chair layout 0.583
Table and chair color 0.557
Table and chair number 0.512
Window plant 0.831
Indoor plant 0.717

References

  1. Cai, M.; Xiang, L.; Ng, E. How does the visual environment influence pedestrian physiological stress? Evidence from high-density cities using ambulatory technology and spatial machine learning. Sustain. Cities Soc. 2023, 96, 104695. [Google Scholar] [CrossRef]
  2. Shahidi, R.; Golmohammadi, R.; Babamiri, M.; Faradmal, J.; Aliabadi, M. Effect of warm/cool white lights on visual perception and mood in warm/cool color environments. EXCLI J. 2021, 20, 1379–1393. [Google Scholar] [PubMed]
  3. Oldenburg, R. The Great Good Place: Cafes, Coffee Shops, Community Centers, Beauty Parlors, General Stores, Bars, Hangouts, and How They Get You Through the Day; Paragon House: St. Paul, MN, USA, 1989. [Google Scholar]
  4. Project for Public Spaces. What Makes a Successful Place. Available online: http://www.pps.org/reference/grplacefeat/ (accessed on 30 December 2009).
  5. Glover, T.D.; Parry, D.C. A third place in the everyday lives of people living with cancer: Functions of Gilda’ s Club of Greater Toronto. Health Place 2009, 15, 97–106. [Google Scholar] [CrossRef]
  6. Chung, M.J. The Study of the Relationships among the Franchise Coffee Shops’ Servicescape, The Third Place Characteristics, Emotional Responses and Store Royalty. J. Tour. Leis. Res. 2016, 28, 217–237. [Google Scholar]
  7. Lee, N. Built Environment and Psychological Well-Being: The Role of The Third Place and Neighborhood Walkability. Ph.D. Thesis, University of California, Irvine, CA, USA, 2021. [Google Scholar]
  8. Biglin, J. Photovoice accounts of third places: Refugee and asylum seeker populations’ experiences of therapeutic space. Health Place 2021, 71, 102663. [Google Scholar] [CrossRef]
  9. Rosenbaum, M.S. Exploring the Social Supportive Role of Third Places in Consumers’ Lives. J. Tour. Leis. Res. 2006, 9, 59–72. [Google Scholar] [CrossRef]
  10. Fong, P.; Haslam, C.; Cruwys, T.; Haslam, S.A. “There’s a Bit of a Ripple-effect”: A Social Identity Perspective on the Role of Third-Places and Aging in Place. Environ. Behav. 2021, 53, 540–568. [Google Scholar] [CrossRef]
  11. Stave, K.S. In Search of a Third Place on Campus: An Exploration of the Effects of Built Space on Students’ Sense of Belonging. Ph.D. Thesis, Portland State University, Portland, OR, USA, 2020. [Google Scholar]
  12. Kim, S.; Park, H.; Choo, S. Effects of Changes to Architectural Elements on Human Relaxation-Arousal Responses: Based on VR and EEG. Int. J. Environ. Res. Public Health 2021, 18, 4305. [Google Scholar] [CrossRef]
  13. Presti, P.; Ruzzon, D.; Avanzini, P.; Caruana, F.; Rizzolatti, G.; Vecchiato, G. Measuring arousal and valence generated by the dynamic experience of architectural forms in virtual environments. Sci. Rep. 2022, 12, 13376. [Google Scholar] [CrossRef]
  14. Vartanian, O.; Navarrete, G.; Chatterjee, A.; Brorson Fich, L.; Gonzalez-Mora, J.L.; Leder, H.; Modroño, C.; Nadal, M.; Rostrup, N.; Skov, M. Architectural design and the brain: Effects of ceiling height and perceived enclosure on beauty judgments and approach-avoidance decisions. J. Environ. Psychol. 2015, 41, 10–18. [Google Scholar] [CrossRef]
  15. Mehaffy, M.W. The Impacts of Symmetry in Architecture and Urbanism: Toward a New Research Agenda. Buildings 2020, 10, 249. [Google Scholar] [CrossRef]
  16. Shemesh, A.; Leisman, G.; Bar, M.; Yasha, J.G. The emotional influence of different geometries in virtual spaces: A neurocognitive examination. J. Environ. Psychol. 2022, 81, 5–6. [Google Scholar] [CrossRef]
  17. Cha, S.H.; Zhang, S.; Kim, T.W. Effects of interior color schemes on emotion, task performance, and heart rate in immersive virtual environments. J. Inter. Des. 2020, 45, 51–65. [Google Scholar] [CrossRef]
  18. Küller, R.; Mikellides, B.; Janssens, J. Color, arousal, and performance—A comparison of three experiments. Color Res. Appl. 2009, 34, 141–152. [Google Scholar] [CrossRef]
  19. Xu, J.; Li, M.; Cao, K.; Zhou, F.; Lv, B.; Lu, Z.; Cui, Z.; Zhang, K. A VR Experimental Study on the Influence of Chinese Hotel Interior Color Design on Customers’ Emotional Experience. Buildings 2022, 12, 984. [Google Scholar] [CrossRef]
  20. Kotradyova, V.; Vavrinsky, E.; Kalinakova, B.; Petro, D.; Jansakova, K.; Boles, M.; Svobodova, H. Wood and Its Impact on Humans and Environment Quality in Health Care Facilities. Int. J. Environ. Res. Public Health 2019, 16, 3496. [Google Scholar] [CrossRef]
  21. Kim, H.; Hong, T. Emotional experience in uncomfortable indoor environments: A combined examination of personal factors. Build. Environ. 2023, 244, 110742. [Google Scholar] [CrossRef]
  22. Gou, Z.; Lau, S.S.-Y.; Qian, F. Comparison of mood and task performance in naturally-lit and artificially-lit environments. Indoor Built Environ. 2013, 24, 27–36. [Google Scholar] [CrossRef]
  23. Kaida, K.; Takahashi, M.; Otsuka, Y. A short nap and natural bright light exposure improve positive mood status. Ind. Health 2007, 45, 301–308. [Google Scholar] [CrossRef]
  24. Ergan, S.; Shi, Z.Y.; Yu, X.R. Towards quantifying human experience in the built environment: A crowdsourcing based experiment to identify influential architectural design features. J. Build. Eng. 2018, 20, 51–59. [Google Scholar] [CrossRef]
  25. Sylvester, K.E.; Bowler, J.L. Effects of Semi-Transparent Glazing on The Emotions of Office Workers. J. Green Build. 2012, 7, 87–99. [Google Scholar] [CrossRef]
  26. Yoo, E.; Jang, H.S.; Kim, K.J.; Zheng, X.H.; Jin, Y.Z. Effect of green interior home on emotional psychology of human. J. People Plants Environ. 2015, 18, 249–256. [Google Scholar] [CrossRef]
  27. Li, Z.; Zhang, W.; Cui, J.; Liu, H. Beneficial effects of short-term exposure to indoor biophilic environments on psychophysiological health: Evidence from electrophysiological activity and salivary metabolomics. Environ. Res. 2024, 15, 117843. [Google Scholar] [CrossRef] [PubMed]
  28. Kim, S.; Ha, M. A Systematic Review of the Attributes of Interior Design Affecting User’s Positive Emotions Measured via Bio-Signals. Dep. Inter. Archit. Built Environ. 2020, 36, 83–91. [Google Scholar]
  29. Yan, S.; Azmi, A.; Mansor, N.; Wang, Z.; Wang, Y. Healing Spaces as a Design Approach to Optimize Emotional Regulation for Patients with Mood Disorders. Buildings 2024, 14, 472. [Google Scholar] [CrossRef]
  30. Banaei, M.; Ahmadi, A.; Gramann, K.; Hatami, J. Emotional evaluation of architectural interior forms based on personality differences using virtual reality. Front. Archit. Res. 2020, 9, 138–147. [Google Scholar] [CrossRef]
  31. Sussman, A.; Hollander, J.B. Cognitive Architecture: Designing for How We Respond to the Built Environment; Routledge: New York, NY, USA, 2021. [Google Scholar]
  32. Kim, J.; Heo, W. Importance of Interior Design: An Environmental Mediator for Perceiving Life Satisfaction and Financial Stress. Environ. Res. Public Health 2021, 18, 10195. [Google Scholar] [CrossRef]
  33. Hsieh, M. Effects of Illuminance Distribution, Color Temperature and Illuminance Level on Positive and Negative Moods. J. Asian Archit. Build. 2015, 14, 709–716. [Google Scholar] [CrossRef]
  34. Kong, Z.; Liu, Q.; Li, X.; Hou, K.; Xing, Q. Indoor lighting effects on subjective impressions and mood states: A critical review. Build. Environ. 2022, 224, 109591. [Google Scholar] [CrossRef]
  35. Meyers-Levy, J.; Zhu, R. The Influence of Ceiling Height: The Effect of Priming on the Type of Processing that People Use. J. Consum. Res. 2007, 34, 174–186. [Google Scholar] [CrossRef]
  36. Mehrabian, A. Basic Dimensions for a General Psychological Theory: Implications for Personality, Social, Environmental, and Developmental Studies; Oelgeschlager, Gunn & Hain: Cambridge, UK, 1980. [Google Scholar]
  37. Li, X.M. PAD Three-dimensional Emotional Model. Computer World, 29 January 2007. [Google Scholar]
  38. Zhao, Y.; Xie, D.; Zhou, R.; Wang, N.; Yang, B. Evaluating Users’ Emotional Experience in Mobile Libraries: An Emotional Model Based on the Pleasure-Arousal-Dominance Emotion Model and the Five Factor Model. Front. Psychol. 2022, 13, 942198. [Google Scholar] [CrossRef] [PubMed]
  39. Liang, C.W.; Tsai, J.L.; Hsu, W.Y. Sustained visual attention for competing emotional stimuli in social anxiety: An eye tracking study. J. Behav. Ther. Exp. Psychiatry 2017, 54, 178–185. [Google Scholar] [CrossRef] [PubMed]
  40. Alshehri, M.; Alghowinem, S. An Exploratory Study of Detecting Emotion States Using Eye-Tracking Technology; Science and Information Conference: London, UK, 2013. [Google Scholar]
  41. Espigares-Jurado, F.; Muñoz-Leiva, F.; Correia, M.B.; Sousa, C.M.R.; Ramos, C.M.Q.; Faísca, L. Visual attention to the main image of a hotel website based on its position, type of navigation and belonging to Millennial generation: An eye tracking study. J. Retail. Consum. Serv. 2020, 52, 101906. [Google Scholar] [CrossRef]
  42. Simmonds, L.; Bellman, S.; Kennedy, R.; Nenycz-Thiel, M.; Bogomolova, S. Moderating effects of prior brand usage on visual attention to video advertising and recall: An eye-tracking investigation. J. Bus. Res. 2019, 111, 241–248. [Google Scholar] [CrossRef]
  43. He, X.; Wang, L.; Gao, X.H.; Chen, Y.H. The eye activity measurement of mental workload based on basic flight task. In Proceedings of the IEEE 10th International Conference on Industrial Informatics, Beijing, China, 25–27 July 2012; pp. 502–507. [Google Scholar]
  44. Borys, M.; Tokovarov, M.; Wawrzyk, M. An analysis of eye-tracking and electroencephalography data for cognitive load measurement during arithmetic tasks. In Proceedings of the 2017 10th International Symposium on Advanced Topics in Electrical Engineering (ATEE), Bucharest, Romania, 23–25 March 2017; pp. 287–292. [Google Scholar]
  45. DiGirolamo, G.J.; Patel, N.; Blaukopf, C.L. Arousal facilitates involuntary eye movements. Exp. Brain Res. 2016, 234, 1967–1976. [Google Scholar] [CrossRef]
  46. Dorr, M.; Martinetz, T.; Gegenfurtner, K.R.; Barth, E. Variability of eye movements when viewing dynamic natural scenes. J. Vis. 2010, 10, 28. [Google Scholar] [CrossRef]
  47. Keskin, M.; Ooms, K.; Dogru, A.O.; De Maeyer, P. Exploring the Cognitive Load of Expert and Novice Map Users Using EEG and Eye Tracking. ISPRS Int. J. 2020, 9, 429. [Google Scholar] [CrossRef]
  48. Partala, T.; Surakka, V. Pupil size variation as an indication of affective processing. Int. J. Hum.-Comput. Stud. 2003, 59, 185–198. [Google Scholar] [CrossRef]
  49. Guo, F.; Ding, Y.; Liu, W.; Liu, C.; Zhang, X.F. Can eye-tracking data be measured to assess product design?: Visual attention mechanism should be considered. Int. J. Ind. Ergon. 2016, 53, 229–235. [Google Scholar] [CrossRef]
  50. Ahmad, M.I.; Keller, I.; Robb, D.A.; Lohan, K.S. A framework to estimate cognitive load using physiological data. Pers. Ubiquit. Comput. 2020, 27, 2027–2041. [Google Scholar] [CrossRef]
  51. Basner, M.; Babisch, W.; Davis, A.; Brink, M.; Clark, C.; Janssen, S.; Stansfeld, S. Auditory and non-auditory effects of noise on health. Lancet 2014, 383, 1325–1332. [Google Scholar] [CrossRef] [PubMed]
  52. Clark, C.; Paunovic, K. WHO Environmental Noise Guidelines for the European Region: A Systematic Review on Environmental Noise and Quality of Life, Wellbeing and Mental Health. Environ. Res. Public Health 2018, 15, 2400. [Google Scholar] [CrossRef] [PubMed]
  53. Evans, G.W. The built environment and mental health. J. Urban Health 2003, 80, 536–555. [Google Scholar] [CrossRef] [PubMed]
  54. Vecchiato, G.; Tieri, G.; Jelic, A.; De Matteis, F.; Maglione, A.G.; Babiloni, F. Electroencephalographic Correlates of Sensorimotor Integration and Embodiment during the Appreciation of Virtual Architectural Environments. Front. Psychol. 2015, 6, 1944. [Google Scholar] [CrossRef] [PubMed]
  55. Pedrotti, M.; Mirzaei, M.A.; Tedesco, A.; Chardonnet, J.R.; Mérienne, F.; Benedetto, S.; Baccino, T. Automatic Stress Classification with Pupil Diameter Analysis. Int. J. Hum.-Comput. Int. 2014, 30, 220–236. [Google Scholar] [CrossRef]
  56. Alipour, H.; Namazi, H.; Azarnoush, N.; Jafari, S. Complexity-Based Analysis of The Relation Between Moving Visual Stimuli and Human Eye Movement. Fractals 2019, 27, 1950024. [Google Scholar] [CrossRef]
  57. Huelat, B.J. The Wisdom of Biophilia-Nature in Healing Environments. J. Green Build. 2008, 3, 23–35. [Google Scholar] [CrossRef]
Figure 1. Overall methodological flowchart.
Buildings 15 02063 g001
Figure 2. Scene model diagrams of different community third place visual environments.
Buildings 15 02063 g002
Figure 3. Laboratory layout and site photos.
Buildings 15 02063 g003
Figure 4. Experimental flow chart.
Buildings 15 02063 g004
Figure 5. Mean diagram of emotional changes of visual environmental factors in stressful scenario and experimental scenario. The value is distance, and the smaller the distance, the greater the emotional tendency.
Buildings 15 02063 g005
Figure 6. The average diagram of the effect of various environmental factors and levels on emotional tendency. The value is distance, and the smaller the distance, the greater the emotional tendency.
Buildings 15 02063 g006
Figure 7. The average diagram of the effect of various environmental factors and levels on eye movement indexes.
Buildings 15 02063 g007
Figure 8. Eye movement heat maps for different visual environmental factors and levels.
Buildings 15 02063 g008
Figure 9. Correlation analysis between perception evaluation and physiological feedback.
Buildings 15 02063 g009
Figure 10. Optimization strategy for visual environment in community third places based on emotional perception.
Buildings 15 02063 g010
Table 1. Effect of the visual environment factors of the community third places on emotion.
NumberVisual Environmental FactorAverageStandard DeviationNumberVisual Environmental FactorAverageStandard Deviation
1Bar layout5.8331.07913Window position5.4291.293
2Light color temperature5.7780.98714Spatial enclosure5.4051.322
3Light illumination5.7541.08615Window shading mode5.3491.304
4Spatial scale5.7381.15416Spatial height–width ratio5.3491.352
5Interface decoration5.6901.11317Spatial shape5.3251.408
6Illumination mode5.6511.11918Window plant5.2381.353
7Table and chair layout5.5951.22119Table and chair number5.1981.290
8Indoor plant5.5861.18420Space length–width ratio5.1591.347
9Interface color5.5481.25321Window shape5.1191.383
10Table and chair color5.5281.17022Door position4.9441.422
11Table and chair type5.5281.18423Spatial curvature4.8171.399
12Window size5.4841.25724Door size4.7621.388
Table 2. Visual environment factors and level parameters.
NumberVisual Environmental FactorLevel 1 Level 2Level 3
1Bar layoutLayout 1 * (entrance corner arrangement)Layout 2 (arrangement away from the entrance corners)Layout 3 (middle arrangement)
2Light color temperatureNeutral * (4500 k)Warm (3000 k)Cool (6000 k)
3Light illuminationModerate * (300 lx)Lower (150 lx)Higher (500 lx)
4Spatial scaleModerate (32 m2) * Larger (40 m2)Smaller (24 m2, 4 m × 6 m)
5Interface decorationNo *More (6 frames, accounting for about 6% of the picture)Less (3 frames, accounting for about 3% of the picture)
6Illumination modeArtificial *MixedNatural
7Table and chair layoutArranged *MixedFreestyle
8Indoor plantsNo *More (accounting for about 10% of the picture)Fewer (accounting for about 5% of the picture)
Level 1 * is standard space.
Table 3. The Pleasure–Arousal–Dominance (Chinese simplified version).
NumberEmotional WordsScoreEmotional Words
1Annoyed−4−3−2−101234Pleased
2Wide-awake−4−3−2−101234Sleepy
3Controlled−4−3−2−101234Controlling
4Contented−4−3−2−101234Melancholic
5Calm−4−3−2−101234Excited
6Dominant−4−3−2−101234Submissive
7Despairing−4−3−2−101234Hopeful
8Stimulated−4−3−2−101234Relaxed
9Awed−4−3−2−101234Important
10Satisfied−4−3−2−101234Unsatisfied
11Sluggish−4−3−2−101234Frenzied
12Influential−4−3−2−101234Influenced
Even items need to be scored reversely.
Table 4. PAD values of 14 basic emotions.
NumberEmotionalpADNumberEmotionalpAD
1Joy2.771.211.428Sadness−0.890.17−0.7
2Optimism2.481.051.759Fear−0.931.3−0.64
3Relaxation2.19−0.661.0510Anxiety−0.950.32−0.63
4Surprise1.721.710.2211Contempt−1.580.321.02
5Gentleness1.57−0.790.3812Disgust−1.80.40.67
6Dependence0.39−0.81−1.4813Resentment−1.981.10.6
7Boredom−0.53−1.25−0.8414Hostility−2.0811.12
Table 5. Information on eye movement indicators and correlation with emotion.
Eye Movement IndexUnitMeaningRelevance
Fixation countcountMeasuring the efficiency of information retrievalPositive correlation with emotional arousal [39,40]
Positively correlated with attention [41,42]
Positive correlation with cognitive load43
Average fixation durationsMeasuring elemental attractivenessNegative correlation with cognitive load [43,44]
Saccade countcountMeasuring elemental attractivenessPositively associated with emotional arousal [45]
Positively correlated with attention [42]
Positive correlation with cognitive load [43]
Average saccade durationsMeasuring search efficiency-
Average saccade velocitypx/msMeasuring of the speed of eye movement during eye hoppingPositively correlated with attention [42]
Positive correlation with cognitive load [43]
Average saccade amplitudepxMeasuring meaningful cues for scenesPositively correlated with attention [46]
Correlation with cognitive load [45,47]
Average pupil diametermmMeasuring subjects’ cognitive, arousal changesPositively associated with emotional arousal [40,48]
Positively correlated with attention [49]
Positive correlation with cognitive load [43,44,50]
Table 6. Main emotional tendencies of different visual environmental factors and levels.
Visual Environmental FactorLevelsEmotional TendenciesDistanceVisual Environmental FactorLevelsEmotional TendenciesDistance
Bar layoutLayout 1Relaxation1.732Interface decorationMoreOptimism2.21
Layout 2Relaxation1.633LessGentleness1.896
Layout 3Gentleness1.741Illumination modeMixedRelaxation2.176
Light color temperatureWarmGentleness1.641NaturalGentleness1.81
CoolGentleness2.063Table and chair layoutMixedSadness2.275
Light illuminationLowerRelaxation2.508FreestyleSadness2.221
HigherGentleness2.206Indoor plantsMoreRelaxation2.137
Spatial scaleLargerRelaxation2.003FewerRelaxation1.765
SmallerGentleness2.068----
Table 7. Significance analysis of different visual environmental factors on emotional tendencies.
Visual Environmental FactorsEmotional
Tendencies
Fpη2Visual Environmental FactorsEmotional
Tendencies
Fpη2
Light color temperatureJoy5.6330.0050.111Interface decorationBoredom9.4050.0000.173
Optimism5.8970.0040.116Sadness5.6770.0050.112
Relaxation5.2040.0070.104Fear3.2750.0420.068
Dependence3.4660.0350.072Anxiety5.410.0060.107
Boredom3.4690.0350.072Contempt7.5370.0010.143
Sadness3.280.0420.068Disgust7.1880.0010.138
Anxiety3.1660.0470.066Resentment5.1220.0080.102
Light illuminationRelaxation4.9580.0090.099Hostility5.6150.0050.111
Spatial scaleJoy10.3030.0000.186Illumination modeSurprise5.2830.0070.105
Optimism10.1030.0000.183Boredom3.7720.0270.077
Relaxation5.1290.0080.102Table and chair layoutJoy7.670.0010.146
Dependence7.5570.0010.144Optimism8.1990.0010.154
Boredom9.7520.0000.178Relaxation17.6720.0000.282
Sadness6.3230.0030.123Gentleness9.2830.0000.171
Fear4.2880.0170.087Dependence4.4760.0140.090
Anxiety5.9670.0040.117Boredom3.3190.0410.069
Contempt3.7180.0280.076Sadness8.620.0000.161
Disgust4.710.0110.095Fear12.130.0000.212
Resentment3.980.0220.081Anxiety9.0480.0000.167
Hostility3.3150.0410.069Contempt3.8340.0250.079
Interface decorationJoy4.0080.0220.082Disgust6.3210.0030.123
Gentleness5.4550.0060.108Resentment9.1170.0000.168
Dependence5.4490.0060.108Hostility6.7450.0020.130
Only the variables with significance p < 0.05 are retained; F (Statistic), p (Significance), η2 (Eta Squared).
Table 8. Significance analysis of visual environmental factors on eye movement indexes.
Visual Environmental FactorsEye Movement IndexesFpη2Visual Environmental FactorsEye Movement IndexesFpη2
Light illuminationAverage pupil diameter6.560.0020.127Illumination modeAverage fixation duration4.5820.0130.092
Spatial scaleFixation count8.8310.0000.164Saccade count6.7120.0020.13
Average fixation duration5.8030.0040.114Average pupil diameter3.530.0330.073
Saccade count9.5150.0000.175Indoor plantFixation count3.2730.0420.068
Average saccade duration3.6530.0300.075Average fixation duration3.4730.0350.072
Illumination modeFixation count6.5130.0020.126Saccade count3.0870.0490.064
Only the variables with significance p < 0.05 are retained; F (Statistic), p (Significance), η2 (Eta Squared).
Disclaimer/Publisher’s Note: The statements, opinions and data contained in all publications are solely those of the individual author(s) and contributor(s) and not of MDPI and/or the editor(s). MDPI and/or the editor(s) disclaim responsibility for any injury to people or property resulting from any ideas, methods, instructions or products referred to in the content.

