Article

Enabling Low-Carbon Transportation: Resilient Energy Governance via Intelligent VPP and Mobile Energy Storage-Driven V2G Solutions

1
School of Electrical and Electronics Engineering, Chung-Ang University, Seoul 06974, Republic of Korea
2
Department of Intelligent Energy and Industry, Chung-Ang University, Seoul 06974, Republic of Korea
*
Author to whom correspondence should be addressed.
Buildings 2025, 15(12), 2045; https://doi.org/10.3390/buildings15122045
Submission received: 13 May 2025 / Revised: 5 June 2025 / Accepted: 10 June 2025 / Published: 13 June 2025

Abstract

:
Integrating Electric Vehicle (EV) charging stations into buildings is becoming increasingly important due to the rapid growth of private EV ownership and prolonged parking durations in residential areas. This paper proposes robust, building-integrated charging solutions that combine mobile energy storage systems (ESSs), station linkage data, and traffic volume data. The proposed system promotes eco-friendly EV usage, flexible energy management, and carbon neutrality through a polyfunctional Vehicle-to-Grid (V2G) architecture that integrates decentralized energy networks. Two core strategies are implemented: (1) configuring Virtual Power Plant (VPP)-based charging packages tailored to station types, and (2) utilizing EV batteries as distributed ESS units. K-means clustering based on spatial proximity and energy demand is followed by heuristic algorithms to improve the efficiency of mobile ESS operation. A three-layer framework is used to assess improvements in energy demand distribution, with demand-oriented VPPs deployed in high-demand zones to maximize ESS utilization. This approach enhances station stability, increases the load factor to 132.7%, and reduces emissions by 271.5 kgCO2. Economically, the system yields an annual benefit of USD 47,860, a Benefit–Cost Ratio (BCR) of 6.67, and a Levelized Cost of Energy (LCOE) of USD 37.78 per MWh. These results demonstrate the system’s economic viability and resilience, contributing to the development of a flexible and sustainable energy infrastructure for cities.

1. Introduction

Amid growing concerns about climate change and environmental pollution in the transportation sector, the international community is actively seeking solutions to promote sustainable development [1,2]. The transportation sector contributes approximately 24% of global carbon emissions, with automobiles alone accounting for about 45% of these emissions [3]. Ranking second only to industry in global carbon emissions, the transport sector has become a primary focus of climate change mitigation efforts [4,5]. In this context, fossil fuel consumption has been identified as a principal culprit, prompting greater investment in clean technologies [6,7]. In particular, the promotion of Electric Vehicles (EVs) has emerged as a key strategy for energy conservation and carbon reduction in transportation [8,9], which solidifies its position as a representative eco-friendly approach to facilitate sustainable growth [10]. In order to maintain competitiveness in the automotive industry while achieving carbon neutrality [11], EV adoption is growing at a rate of 36% per annum [12], and it is predicted that more than 245 million EVs, which is more than 30 times the 2023 figure, will be deployed by 2030 [13]. Over the next decade, as the sale of internal combustion engine vehicles is gradually phased out and the EV battery charging infrastructure is established [14], V2G technology is expected to gain even greater momentum [15].
Typically, commercial EVs have battery capacities ranging from 180 to 540 kWh, compared with the 59 to 125 kWh capacities commonly found in personal EVs. This higher capacity allows commercial EVs to supply more energy, which makes them particularly suitable for V2G [16]. However, considering the rapid increase in private EV adoption and the potential to supply power for extended periods while parked, privately owned EVs also present a significant opportunity for V2G utilization [17]. For example, private EVs are mainly used for daily commutes or short-distance trips and remain parked for most of the day. As a result, these vehicles can feed electricity back to the grid via V2G during their idle hours [18,19]. In contrast, commercial EVs often have irregular or lengthy operating hours, which limits the time they can contribute via V2G [20]. Because private EVs spend many hours without being driven each day, they are well suited to supply energy via V2G. When these factors are viewed alongside the much larger and faster-growing fleet of privately owned EVs, the outlook for V2G technology appears especially robust [21,22]. As industrial trends evolve and EV adoption increases, the widespread implementation of V2G technology is becoming essential. This growth is measured in numbers and driven by digital innovations and improvements in energy efficiency [23]. Research focused on carbon emission reduction and energy conservation at charging stations is reinforcing the role of EVs beyond transportation, positioning them as key assets within the V2G power grid to support ongoing energy collaboration.

1.1. Literature Review

This paper proposes an integrated operational strategy to mitigate energy imbalances among charging stations driven by rising EV charging demand. Specifically, the objective is to engineer a polyfunctional V2G solution that is predicated on a mobile ESS and an intelligent VPP, with the aim of reflecting the characteristics of various types of charging stations and EV traffic data. There has been a paucity of research that comprehensively addresses the operational strategies for different types of charging stations based on a single VPP package. Therefore, the objective of this study is to establish its uniqueness by analyzing the interconnectivity between user behavior and EV traffic data resulting from the increase in EV charging demand, as well as charging station utilization rates. In this section, an examination of the extant literature on the role of VPPs and mobile ESSs in sustainable transportation energy, intelligent VPP-based V2G integration technology, and research trends in V2G operation technology for energy conservation and emission reduction is conducted.
The literature review serves two purposes: it establishes the academic foundation for our methodology and clarifies the technical requirements. Furthermore, the differentiation and scalability of the proposed V2G solutions from existing studies underscore their academic and practical significance.

1.1.1. Role of VPPs and Mobile ESSs

A VPP integrates Distributed Energy Resources (DERs), ESSs, and EVs through digital technologies, which enables them to operate collectively as a single power plant [24,25]. In particular, incorporating V2G further maximizes system efficiency by balancing energy supply and demand, managing resources more effectively, and enhancing grid stability [26]. For example, during periods of rapidly increasing energy demand, power can be drawn from the batteries of private EVs to meet the surge in demand. Hence, this approach alleviates the strain on the grid by predicting the energy demand at EV charging stations and strategically distributing energy [27]. This integration is especially useful for forecasting and responding to demand fluctuations at EV charging stations [28]. Because the electricity demand at EV charging stations can change suddenly, inadequate management can place a significant burden on the power grid [29,30,31].
The mobile ESS concept utilizes EV batteries by treating the EV itself as an ESS and leveraging the energy stored within it [32,33]. Furthermore, by analyzing the energy demand data from EV charging stations, the energy distribution can be adjusted using a mobile ESS, and, when necessary, energy can be retrieved from the mobile ESS and supplied to the power grid to maintain stability [34,35]. Within a VPP, the mobile ESS plays a crucial role in enhancing supply flexibility through this transfer of energy, which enables rapid delivery of energy to regions with high demand [36]. Deploying an intelligent VPP together with a mobile ESS enhances overall grid stability and, by tapping EV batteries as distributed power sources, helps maintain energy supply in heavily loaded areas.

1.1.2. Linkage Technology Between EV Charging Stations and Mobile ESSs

To meet user requirements, a comprehensive set of relevant data must be collected and analyzed [37]. This facilitates the identification of uncertainties in energy demand at various charging stations and the stabilization of charging station operation plans and power grid loads by explaining charging behavior [38,39,40,41]. Analyzing the spatiotemporal demand patterns of EVs and user behaviors is key for supporting effective real-time EV charging station management [42,43], while iterative analysis is vital to guarantee user-centric charging infrastructure planning [4,44]. Data-driven EV charging stations play a significant role in continuously improving VPP performance and conserving energy [45]. In order to conserve energy, it is necessary to collect vehicle flow and charging station data systematically, analyze the factors that cause concentrated charging demand, and improve the stability and efficiency of charging stations. The interaction between the VPP and EV charging stations is subject to variation depending on the type of charging station, and V2G operation methods are applied differently [46,47,48,49]. Therefore, VPP-based V2G operational strategies must be tailored to the type and usage characteristics of each charging station, and K-means-based real-time clustering has proved effective in meeting these requirements across numerous VPP studies [50]. Consequently, tailoring VPP-based V2G operational methods to each charging station type can enhance grid performance and energy efficiency, thereby minimizing carbon emissions.

1.1.3. V2G Technologies for Energy Conservation and Emission Reduction

The integrated approach plays an essential role in improving energy efficiency and reducing carbon emissions [51,52]. Analyzing data-driven EV operational flows helps mitigate uncertainties at charging stations, while intelligent VPP and V2G solutions serve as key mechanisms to address energy dependency and power supply challenges [53]. Considering the randomness of EV usage and the variability of new energy sources, there is an emphasis on technologies that minimize fluctuations in charging station energy [54,55]. V2G operation technology identifies EV operation patterns, charging conditions, and energy demand through data analysis to reduce the burden on the electrical grid and to efficiently utilize energy, such as by storing power in EV batteries when energy demand is low [56,57,58]. For example, private EVs discharge the energy stored during the day back into the grid at night or during peak hours, which helps stabilize the energy supply and reduce carbon emissions.
By applying V2G operational technologies to analyze the operational status and usage data of EV charging stations, the reliability and efficiency of the energy supply system can be enhanced significantly [59]. Furthermore, parked EVs, integrated into V2G-based energy governance, can act as decentralized energy sources that help balance grid demand, improve efficiency, and reduce emissions [60,61,62]. Moreover, the analysis of charging station utilization through V2G technology facilitates charging station demand and energy governance, which lowers carbon emissions and strengthens grid stability [63]. These technologies have now been extended beyond individual EVs and charging stations to building-level energy design and operational strategies. Building Information Modeling (BIM) is an information integration system that digitally represents the physical and functional characteristics of buildings. This system supports efficient decision-making throughout the entire lifecycle of a building, including its design, construction, and operation [64]. In recent years, BIM has been utilized to design modern energy infrastructure that integrates ESSs and renewable energy technologies [65], and has played a key role in the design and operational analysis of charging stations linked to V2G technology. For instance, the optimization of EV charging strategies for office buildings using BIM-based information has been demonstrated to reduce peak power loads and used to evaluate the feasibility of V2G implementation [66]. Integrating BIM with Building Energy Modeling (BEM) has demonstrated that energy efficiency and carbon emission reductions can be achieved simultaneously during building retrofits [67,68]. BIM is being used in the deployment of EV charging infrastructure, energy demand forecasting, and renewable energy connectivity assessment, and is emerging as a key tool for smart building and city design.
Consequently, coupling EVs with V2G technologies under an intelligent VPP plays a pivotal role in achieving three primary objectives: enhancing grid stability, managing energy resources efficiently, and reducing carbon emissions [69,70]. It also contributes to cost savings and environmental protection by smoothing charging station loads within buildings. Ultimately, this approach supports the broader shift towards clean energy systems and advances the creation of carbon-neutral, sustainable urban environments.

1.1.4. Review Summary

Previous studies have established multi-objective theory as a widely adopted approach across many areas of transport. This paper explores ways to enhance transport sustainability and adopts V2G, managed through an intelligent VPP, as its energy management method. Most existing studies remain focused on either vehicles or the grid, and operational strategies that fully account for the characteristics of different charging station types, along with the potential of privately owned EVs as energy resources, are still underdeveloped. In addition, the absence of energy packaging models that utilize diverse data—such as EV demand variability, spatial disparities among charging stations, and traffic volume patterns—has been identified as a research gap.
To address these limitations, this study analyzes charging station-specific demand patterns using K-means clustering and designs a mobile ESS-based polyfunctional V2G solution, thereby proposing an intelligent VPP operation strategy. The primary objective is to achieve three goals simultaneously: mitigation of grid load imbalances, improvement of energy efficiency, and reduction of carbon emissions. From a resilient energy governance perspective, this study focuses on long-term goals that go beyond routine supply stabilization to include sustainable power operation and expanded renewable energy use, even in crisis situations. Accordingly, managing energy demand at charging stations emerges as a critical strategic element in shaping the future of carbon-neutral, sustainable urban living.

1.2. Purpose of the Study

Whilst earlier studies have examined V2G technologies and energy governance in isolation, this study proposes a novel integrated strategy that combines private EVs, city-scale V2G operations, intelligent VPP packaging, and mobile ESS deployment. The strategy employs charging station type, traffic, and spatial data to establish a coordinated energy system that enhances grid stability and reduces urban carbon emissions. Accordingly, this paper proposes a data-driven polyfunctional V2G solution to address climate change and the growing demand for privately owned EVs while reducing carbon emissions and conserving energy. Figure 1 illustrates how the goals of each technology within the intelligent VPP and mobile ESS are interconnected and presents the objectives of the V2G solutions in analyzing and responding to data-based energy demands.
In order to advance the research and achieve these goals, this study analyzes issues from the perspectives of both users and charging stations, using EV traffic data to bridge the gap between charging station demand and supply. Moreover, managing the energy demand of charging stations enhances energy efficiency, reduces energy costs through supply, and strengthens the stability of the charging stations. This approach prevents overloading by managing the energy demand of nearby categorized charging stations in a stable manner Finally, a data-linkage approach to carbon savings and energy conservation is designed to protect the environment and enhance social value. In the long term, these efforts will provide insights into sustainable city development and offer significant advantages in securing competitiveness through entry into emerging markets.
The remainder of this paper is organized as follows: Section 2 presents the system design and analysis of the proposed polyfunctional V2G solution, including the architecture and key variables. Section 3 describes the applied models and algorithms, such as demand management using a mobile ESS and data-driven VPP package design. Section 4 discusses the results and key findings regarding energy conservation and emission reduction based on the proposed solutions. Section 5 concludes the paper, and Section 6 outlines directions for future research.

2. System Design and Analysis

This chapter employs a systematic approach to design and analysis, meticulously delineating the structural framework and operational methodologies of polyfunctional V2G solution. Initially, Section 2.1 presents the hierarchical structure and architecture of the V2G solution based on an intelligent VPP and mobile ESS, and then defines the roles of each type of charging station. In Section 2.2, we utilize empirical data to analyze EV traffic volume, charging station locations, and demand characteristics by type. We then derive the feasibility of mobile ESS utilization and the foundation for energy distribution strategies. This process addresses the issue of imbalanced energy demand within cities by designing a V2G-based energy management system capable of responding to demand.

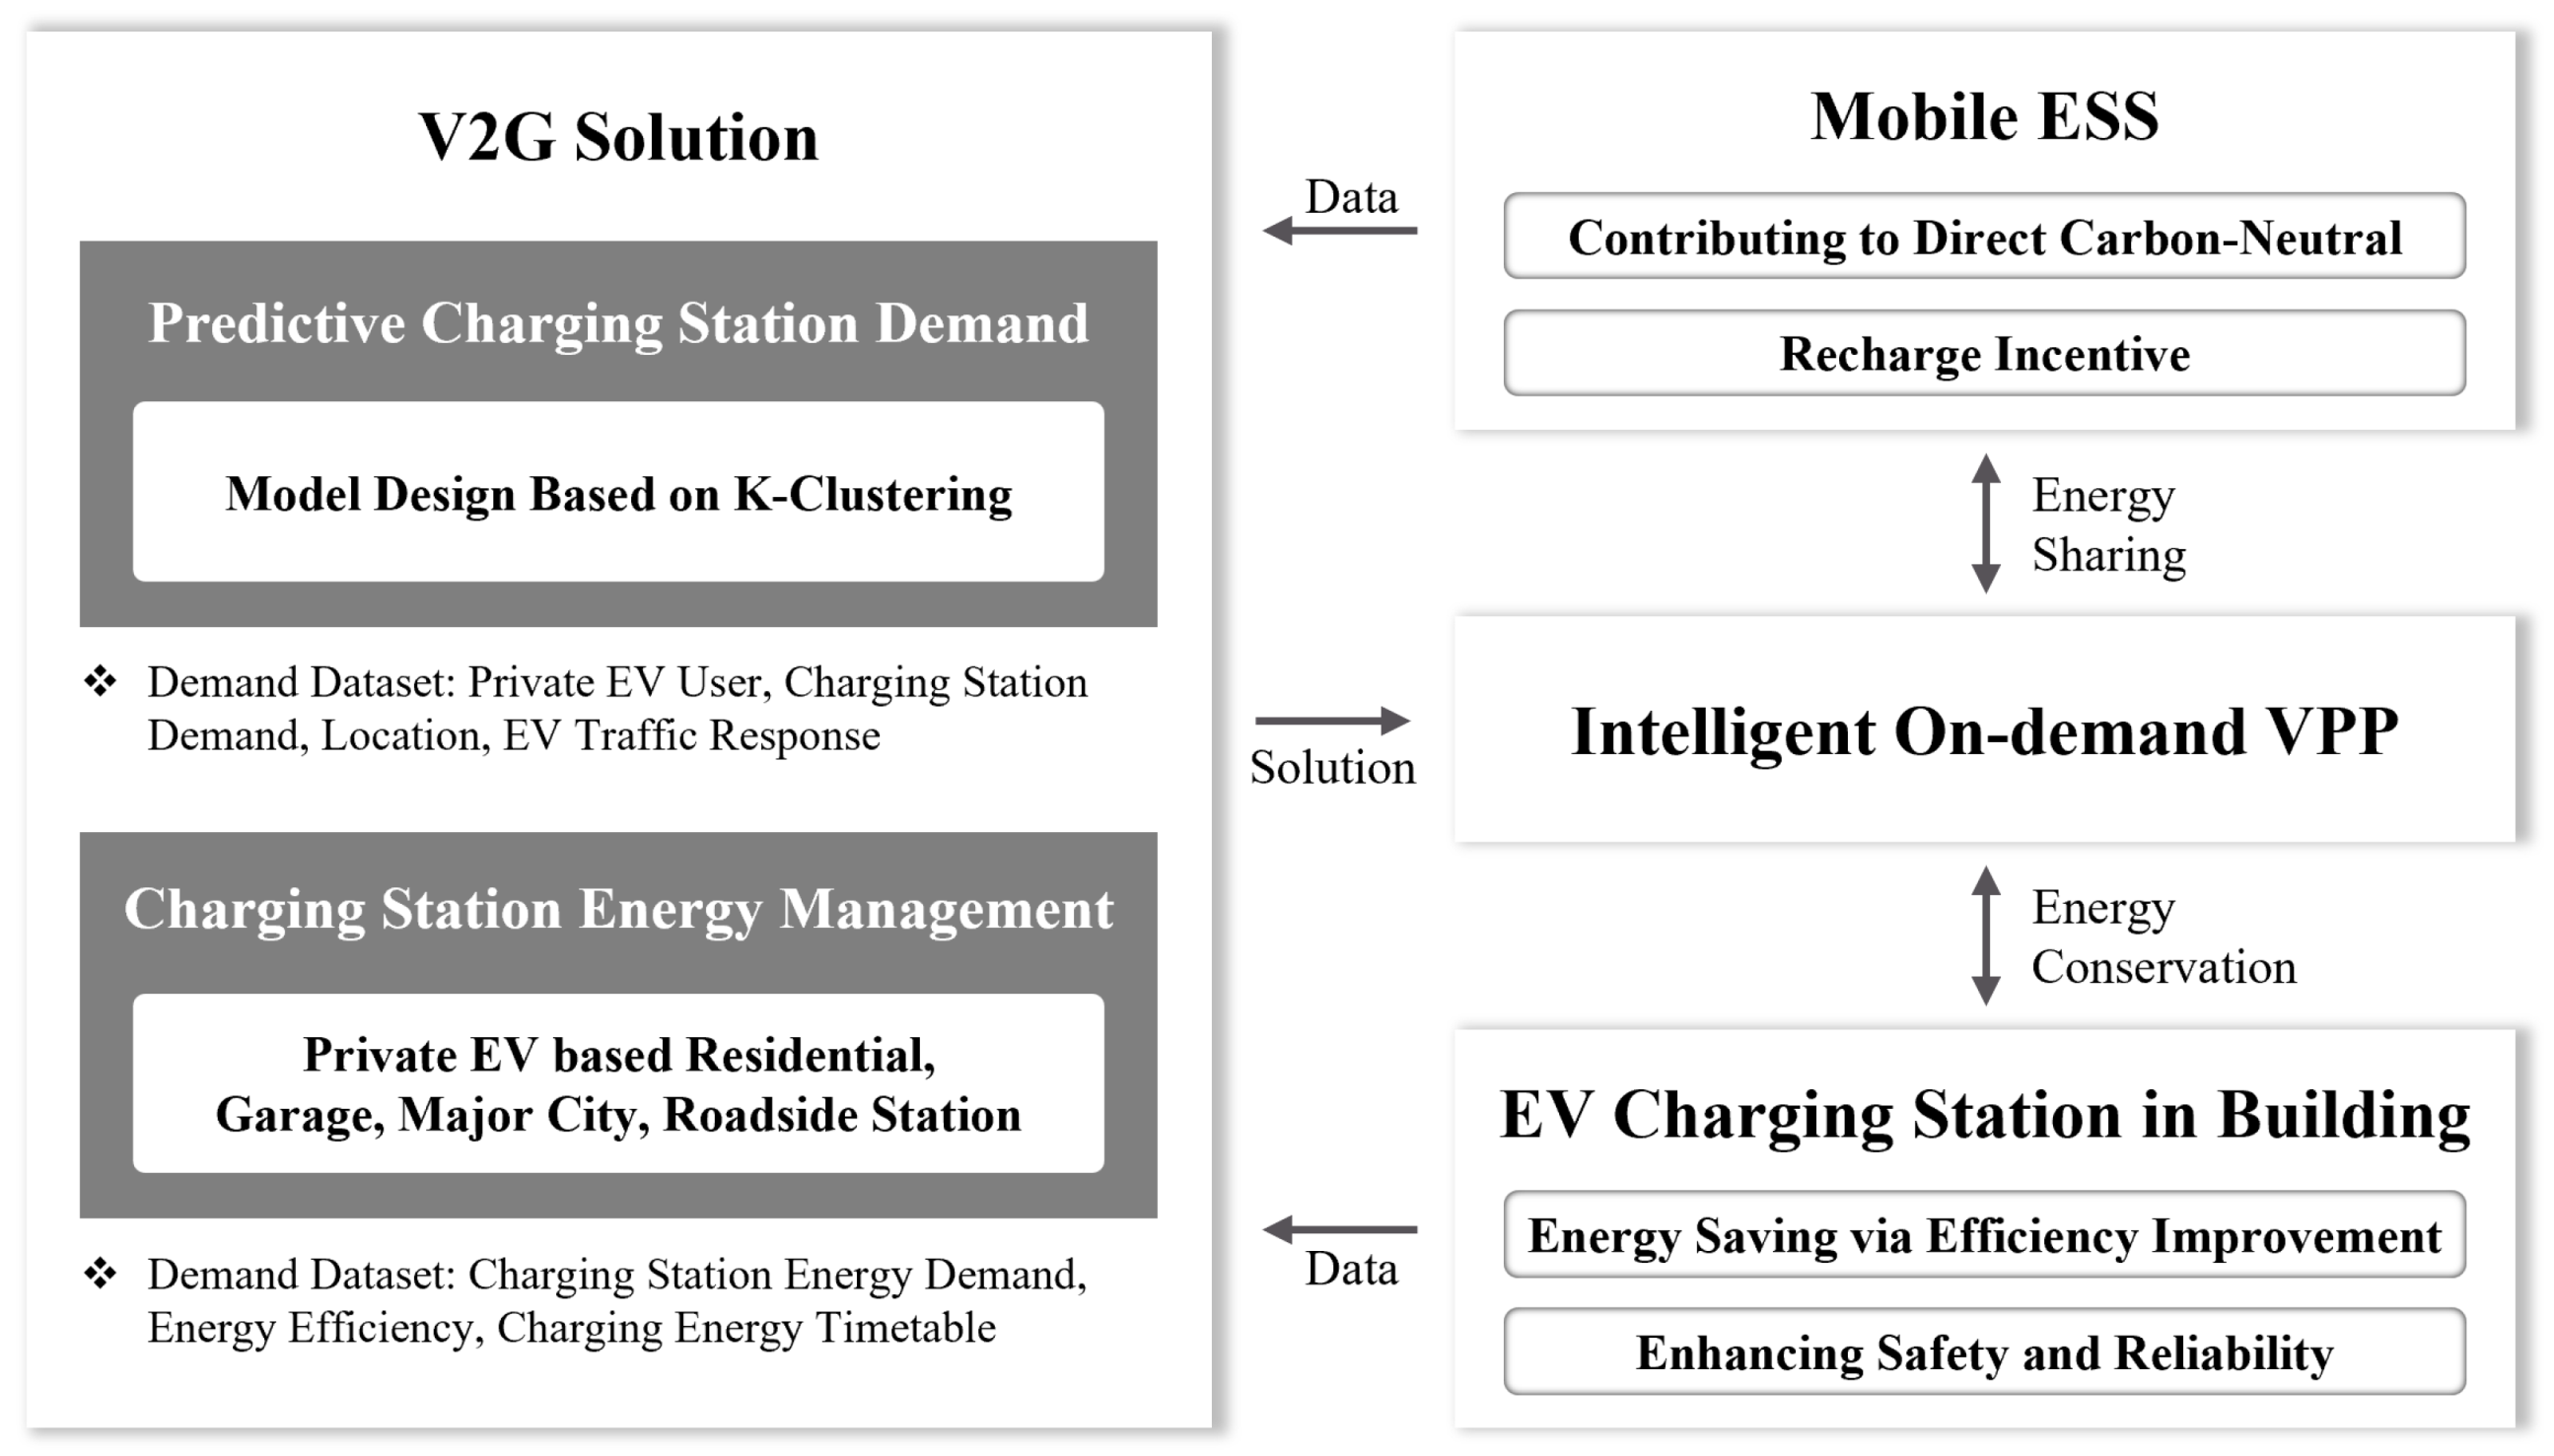
2.1. V2G Solution Operation and Architecture

2.1.1. Concept and Objects of the Proposed Model

The polyfunctional V2G solution proposed in this paper comprises an energy technology that stabilizes charging station operations based on an intelligent VPP by linking EV traffic, charging station location, and energy demand data. By combining intelligent VPP and mobile ESS technologies, the solution enhances grid stability and energy utilization while reducing carbon emissions. To overcome the limitations identified in earlier studies, this paper presents an operational framework for the proposed V2G solution, as illustrated in Figure 2.
To develop advanced V2G technologies, the ESS at the demonstration site is configured with a battery capacity of 8 MWh, which is equivalent to the combined battery capacity of 144 typical private EVs. This approach leverages private EVs as mobile ESS units to distribute the single ESS system and proposes technologies that effectively address the energy demand of charging stations. Among the V2G solution operation methods, the first approach involves categorizing intelligent VPP-based charging stations by type based on charging demand. In contrast, the second focuses on efficiently reducing carbon emissions and conserving energy through energy demand management at charging stations as EV adoption increases. This approach provides insights into long-term sustainable city development and offers significant benefits for entering new markets in the future and securing competitive advantage. Finally, this paper systematically explores intelligent VPP packaging, strategic organization of energy resources technology, which leverages EV traffic to reduce carbon emissions, and demand response technology, which is tailored to charging station types to enhance energy conservation.

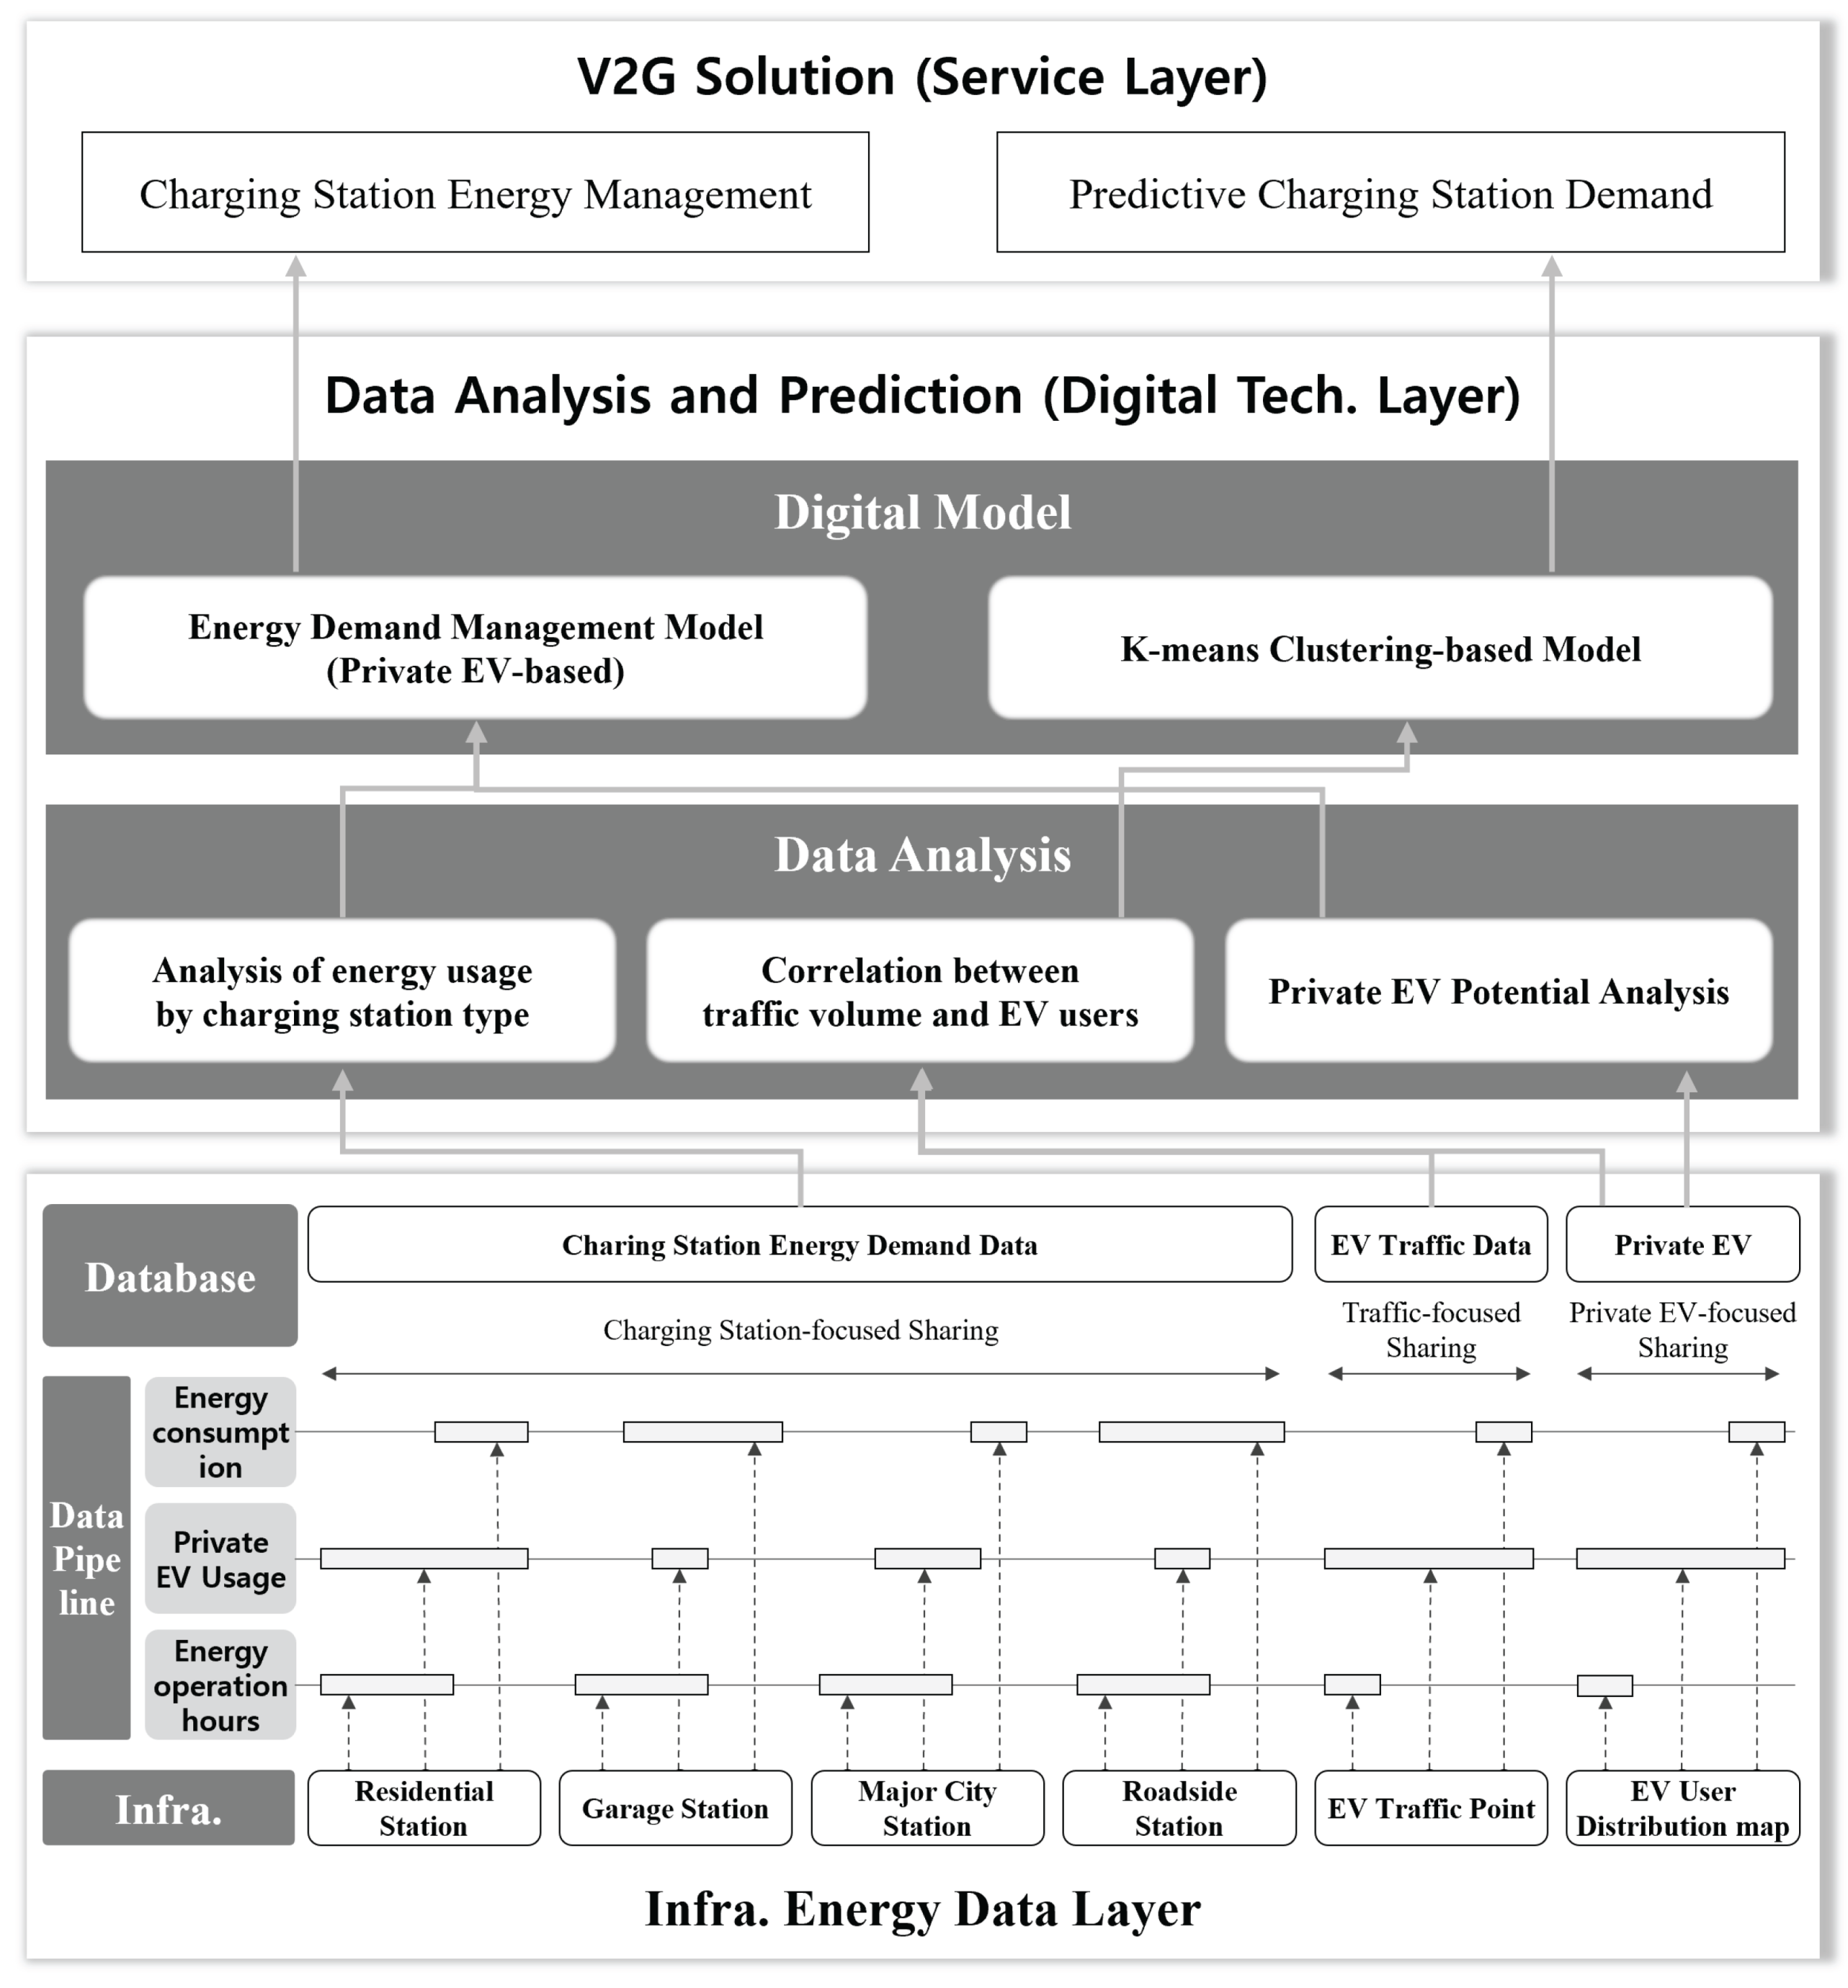
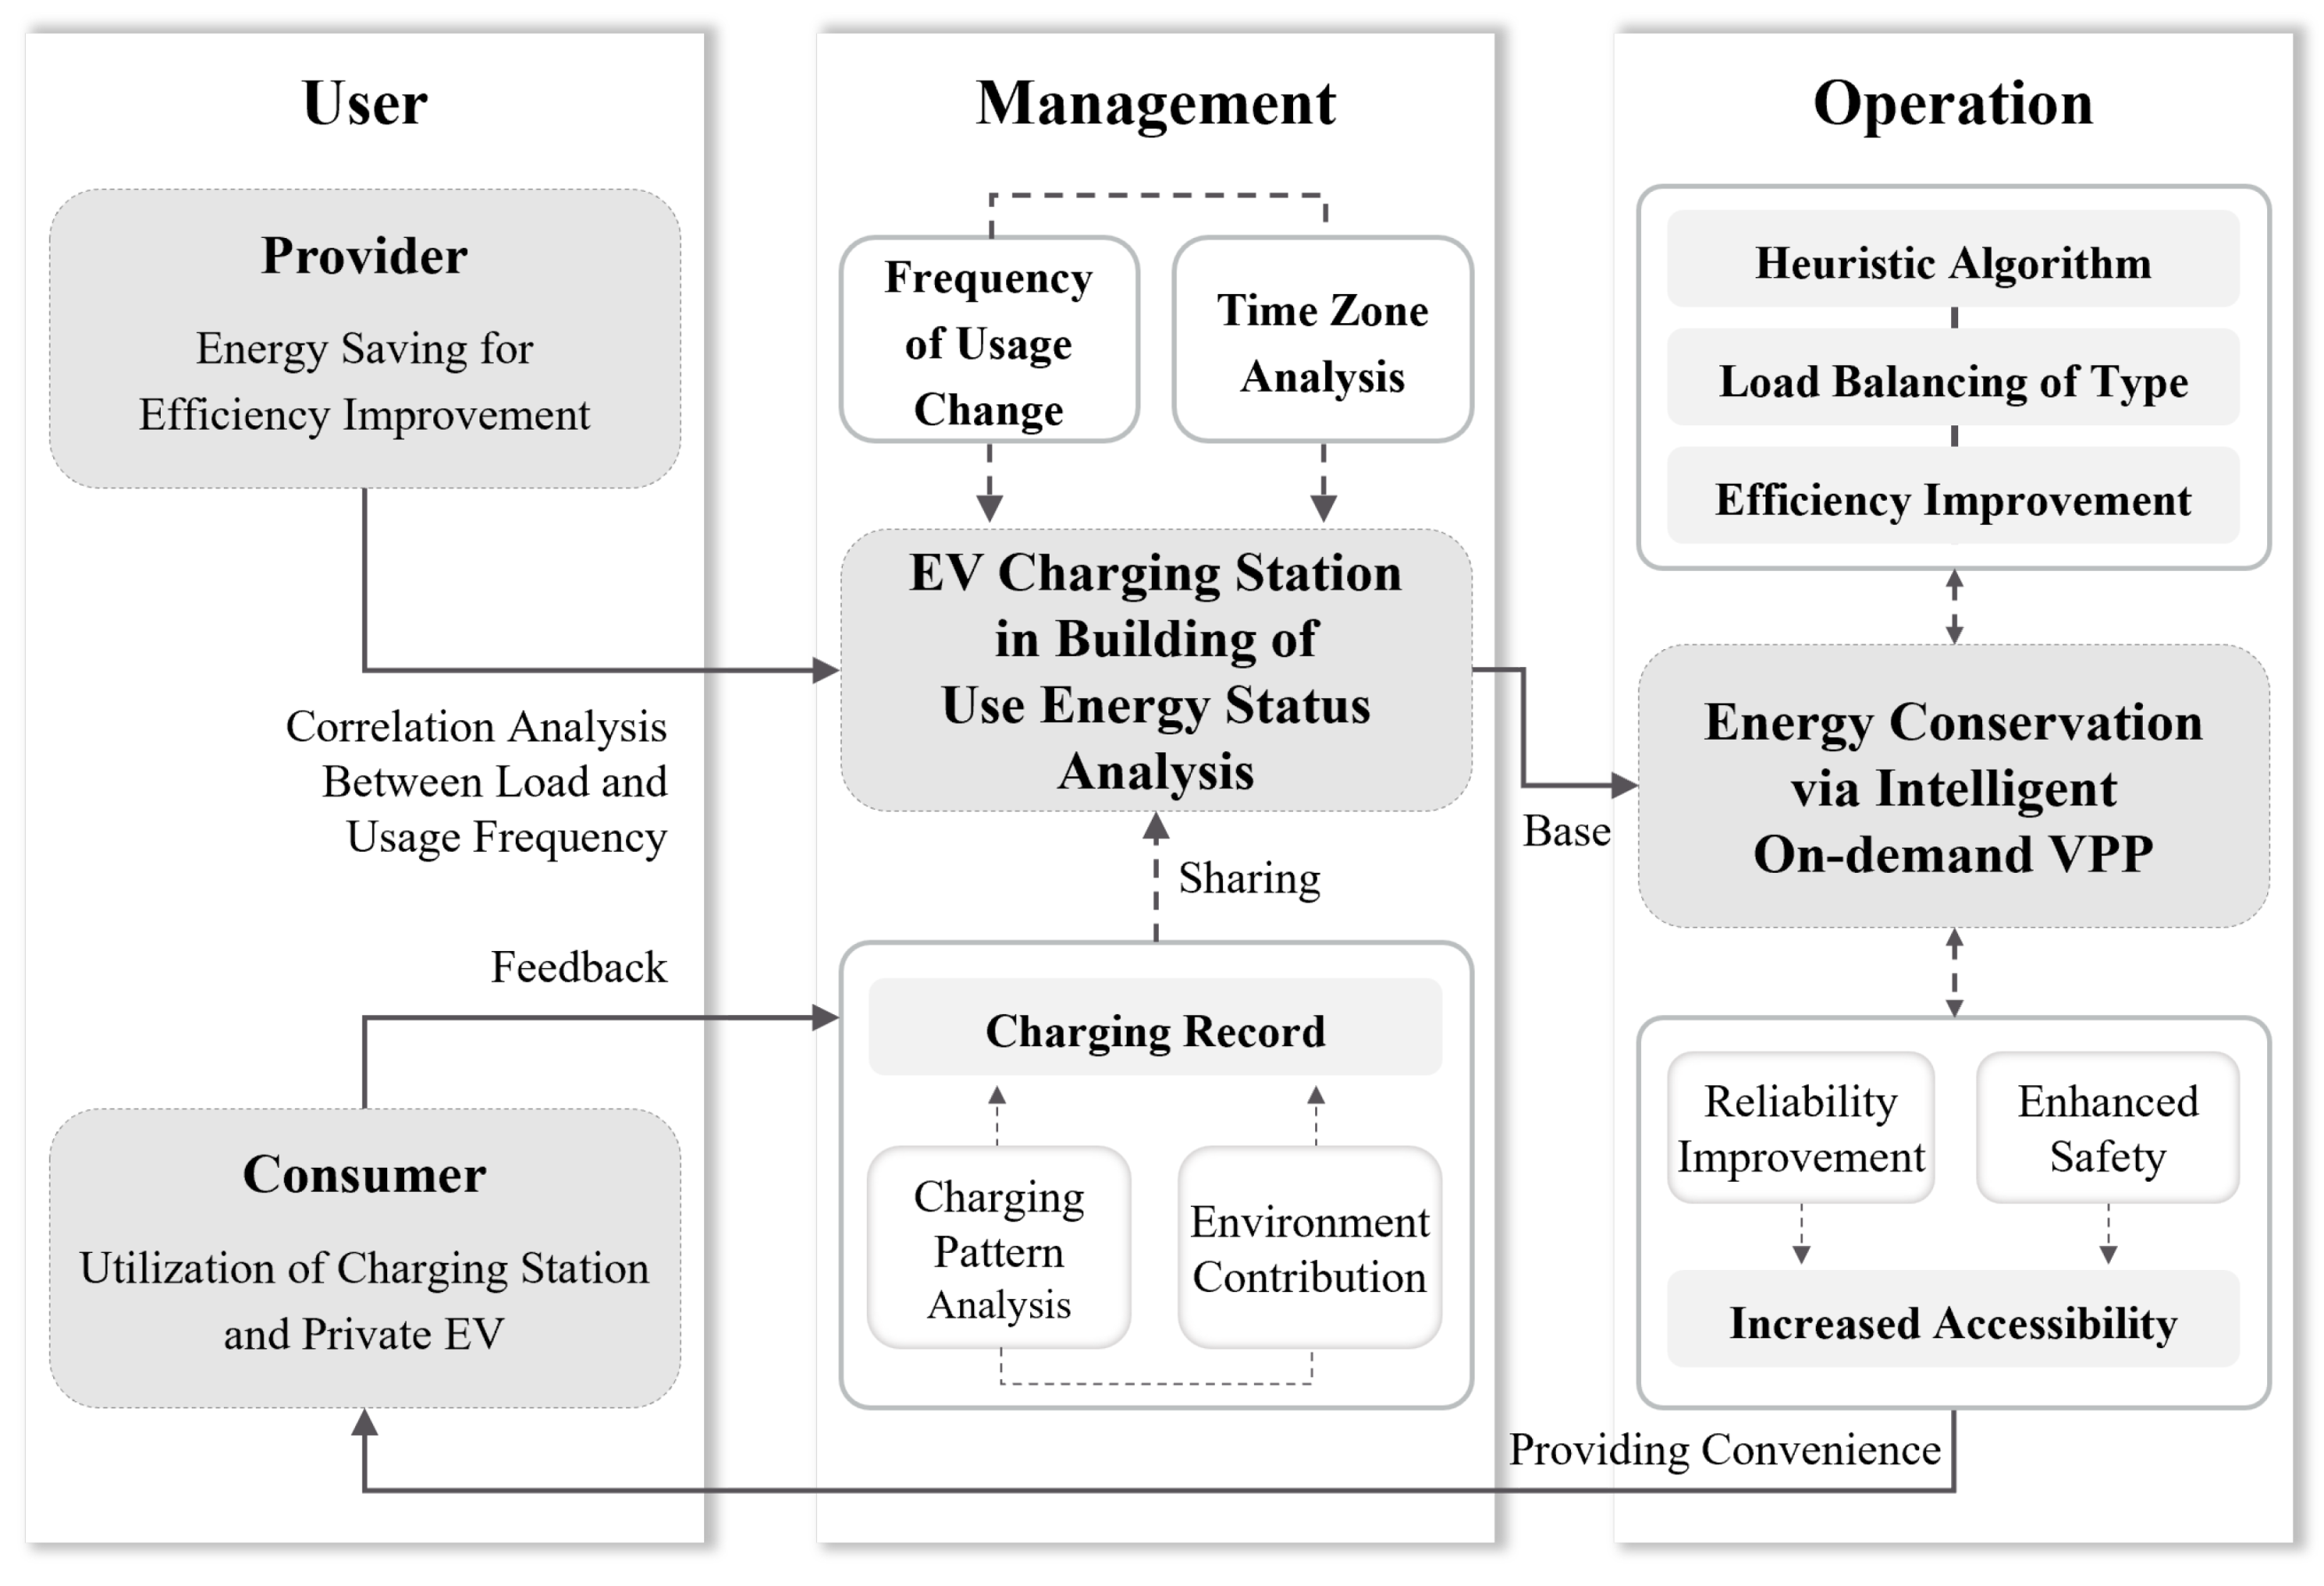
2.1.2. Structure of the Proposed Model

Intelligent VPP packaging at the city level is designed to incorporate key factors such as the city’s unique characteristics, the strategic siting of charging stations, economic feasibility, and sustainability goals. It delivers sustainable power to charging stations and creates an environment in which vehicles can recharge rapidly at transport hubs and along major thoroughfares. In addition, it takes into account the energy demand of stations located in residential areas, garages, key city facilities, and roadside sites, and proposes energy-saving measures accordingly. Figure 3 presents a three-layer framework for analyzing charging station energy demand and the architecture of the proposed V2G solution, highlighting technologies that reduce carbon emissions and conserve energy.

Service Layer

The proposed V2G solution provides energy governance and demand forecasting services for charging stations. At the city level, it analyzes correlations between EV user flows and traffic data, together with the rate of growth in EV demand, in order to identify locations with high expected charging demand and create an environment in which convenient day-to-day charging is available.

Digital Technology Layer

This study focuses on the application of digital technologies from three complementary perspectives: Drawing on the analytical results and algorithms, it develops an energy demand governance model for privately owned EVs and a charging station package model derived from K-means clustering. Machine learning techniques predict EV charging demand and analyze user behavior, traffic data, station locations, and site stations within an intelligent VPP while estimating site-specific demand. Areas with high vehicle flow—such as major roads and city centers—are prioritized for station deployment, and the stations are then packaged into the VPP to satisfy energy demand efficiently.

Infrastructure Energy Data Layer

The system collects and processes data on charging station type, EV traffic flows, and user distribution. These data underpin analyses of energy consumption, patterns of EV use, and optimum operating times. All information is stored in a central database and shared across the infrastructure.
This study considers four charging station categories: Residential In-Building, Major City In-Building, Garage In-Building, and Roadside In-Building. Chargers are categorized into slow (3.3–7 kW) and fast (50 kW) units. residential, garage, and major city stations chiefly employ Type 2 slow chargers, whereas roadside stations are equipped with fast chargers compliant with CCS or CHAdeMO standards. Based on collected EV traffic data, the system analyzes the impact of energy demand at charging stations and maximizes the efficiency of mobile ESSs through intelligent VPP deployment in energy-dense areas.
V2G solutions provide energy governance through predictive models by analyzing the link between mobile ESS utilization and EV traffic data as EV charging demand increases, along with the energy demand response based on charging station utilization analysis. By linking and managing the demand of the charging station and the number of uses, the stability and reliability of the charging station are improved, and energy is conserved.

2.1.3. Polyfunctional V2G Roles by Charging Station Type

Each type of charging station has a distinct role in and contribution to V2G solutions. The following are ways in which charging station types can contribute to V2G:
  • Residential In-Building Charging Station: Vehicles parked at night by private EV users play an important role in receiving energy via V2G. This type, in conjunction with a VPP, supplies battery energy from EVs that are not used at night to mitigate the peak of power consumption at night.
  • Major City In-Building Charging Station: This type of charging station is installed in commercial facilities or public parking lots within cities for short-term use. Rather than relying on a direct power supply, it prioritizes energy distribution using a mobile ESS during periods of high demand.
  • Garage In-Building Charging Station: A garage charging station where private EVs are parked long term. Energy is recovered from the battery of private EVs at night or during times of low vehicle use and supplied to the required area.
  • Roadside In-Building Charging Station: An express charging station on a highway that is often used for quick charging by private EV users, which can lead to a sudden surge in demand for charging. Demand data are analyzed in advance, and energy is replenished quickly, if necessary, to respond reliably to rapid and/or large-scale energy demand.
The mean charging volume, as determined by the charging data utilized in this study, is 16.95 kWh in residential areas, 16.58 kWh in garages, 9.82 kWh in major cities, and 17.56 kWh on roads. This finding provides empirical evidence that validates the power-handling capacity and V2G compatibility of each charging station type. The following charging capacity analysis is predicated on the box plot-based charging demand analysis results that are presented in Section 2.2.3 of this study, and the charger output levels are quantitatively derived using actual charging session data by charging station type. By analyzing the interconnectivity between the utilization of a mobile ESS and EV traffic data in response to increasing EV charging demand, this study proposes a polyfunctional V2G solution capable of addressing energy demand.

2.2. Data Collection and Analysis

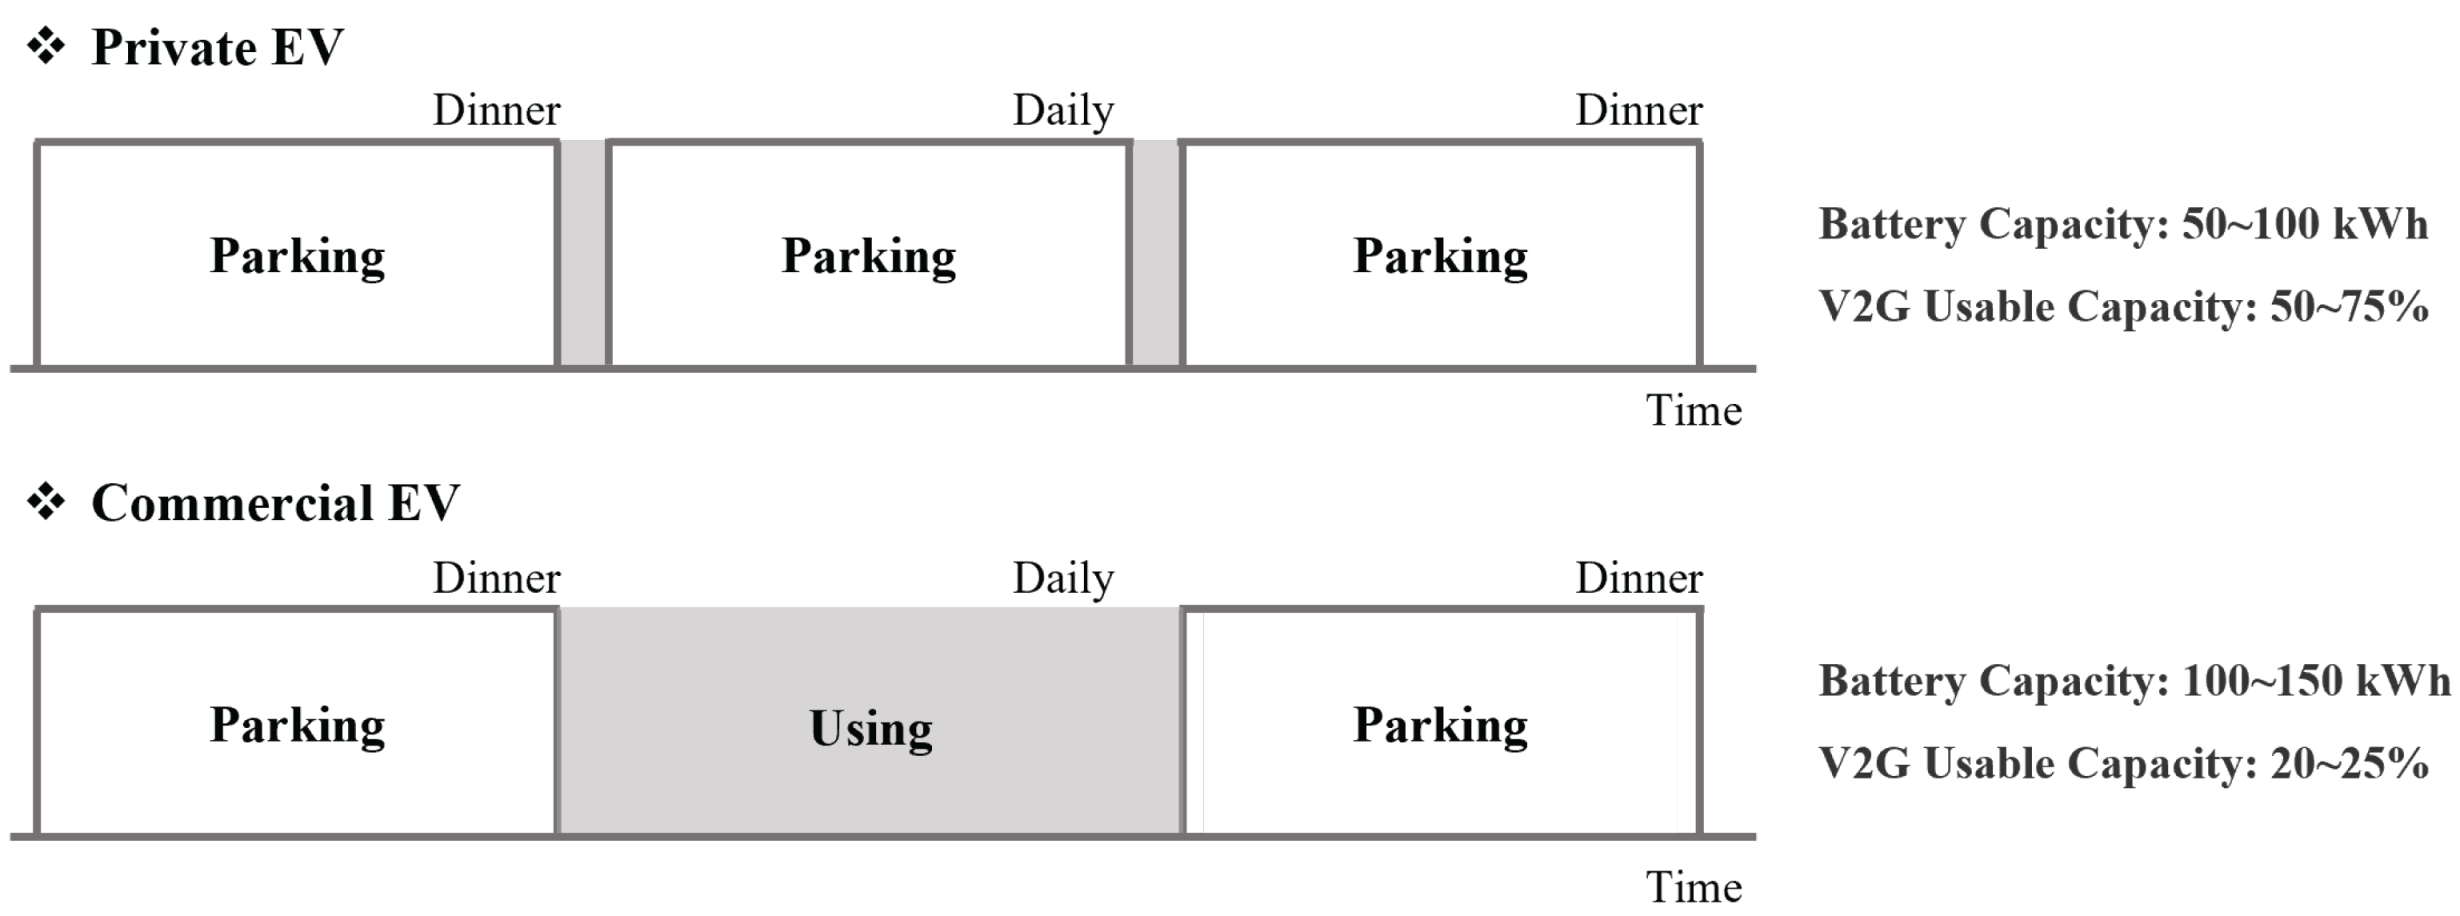
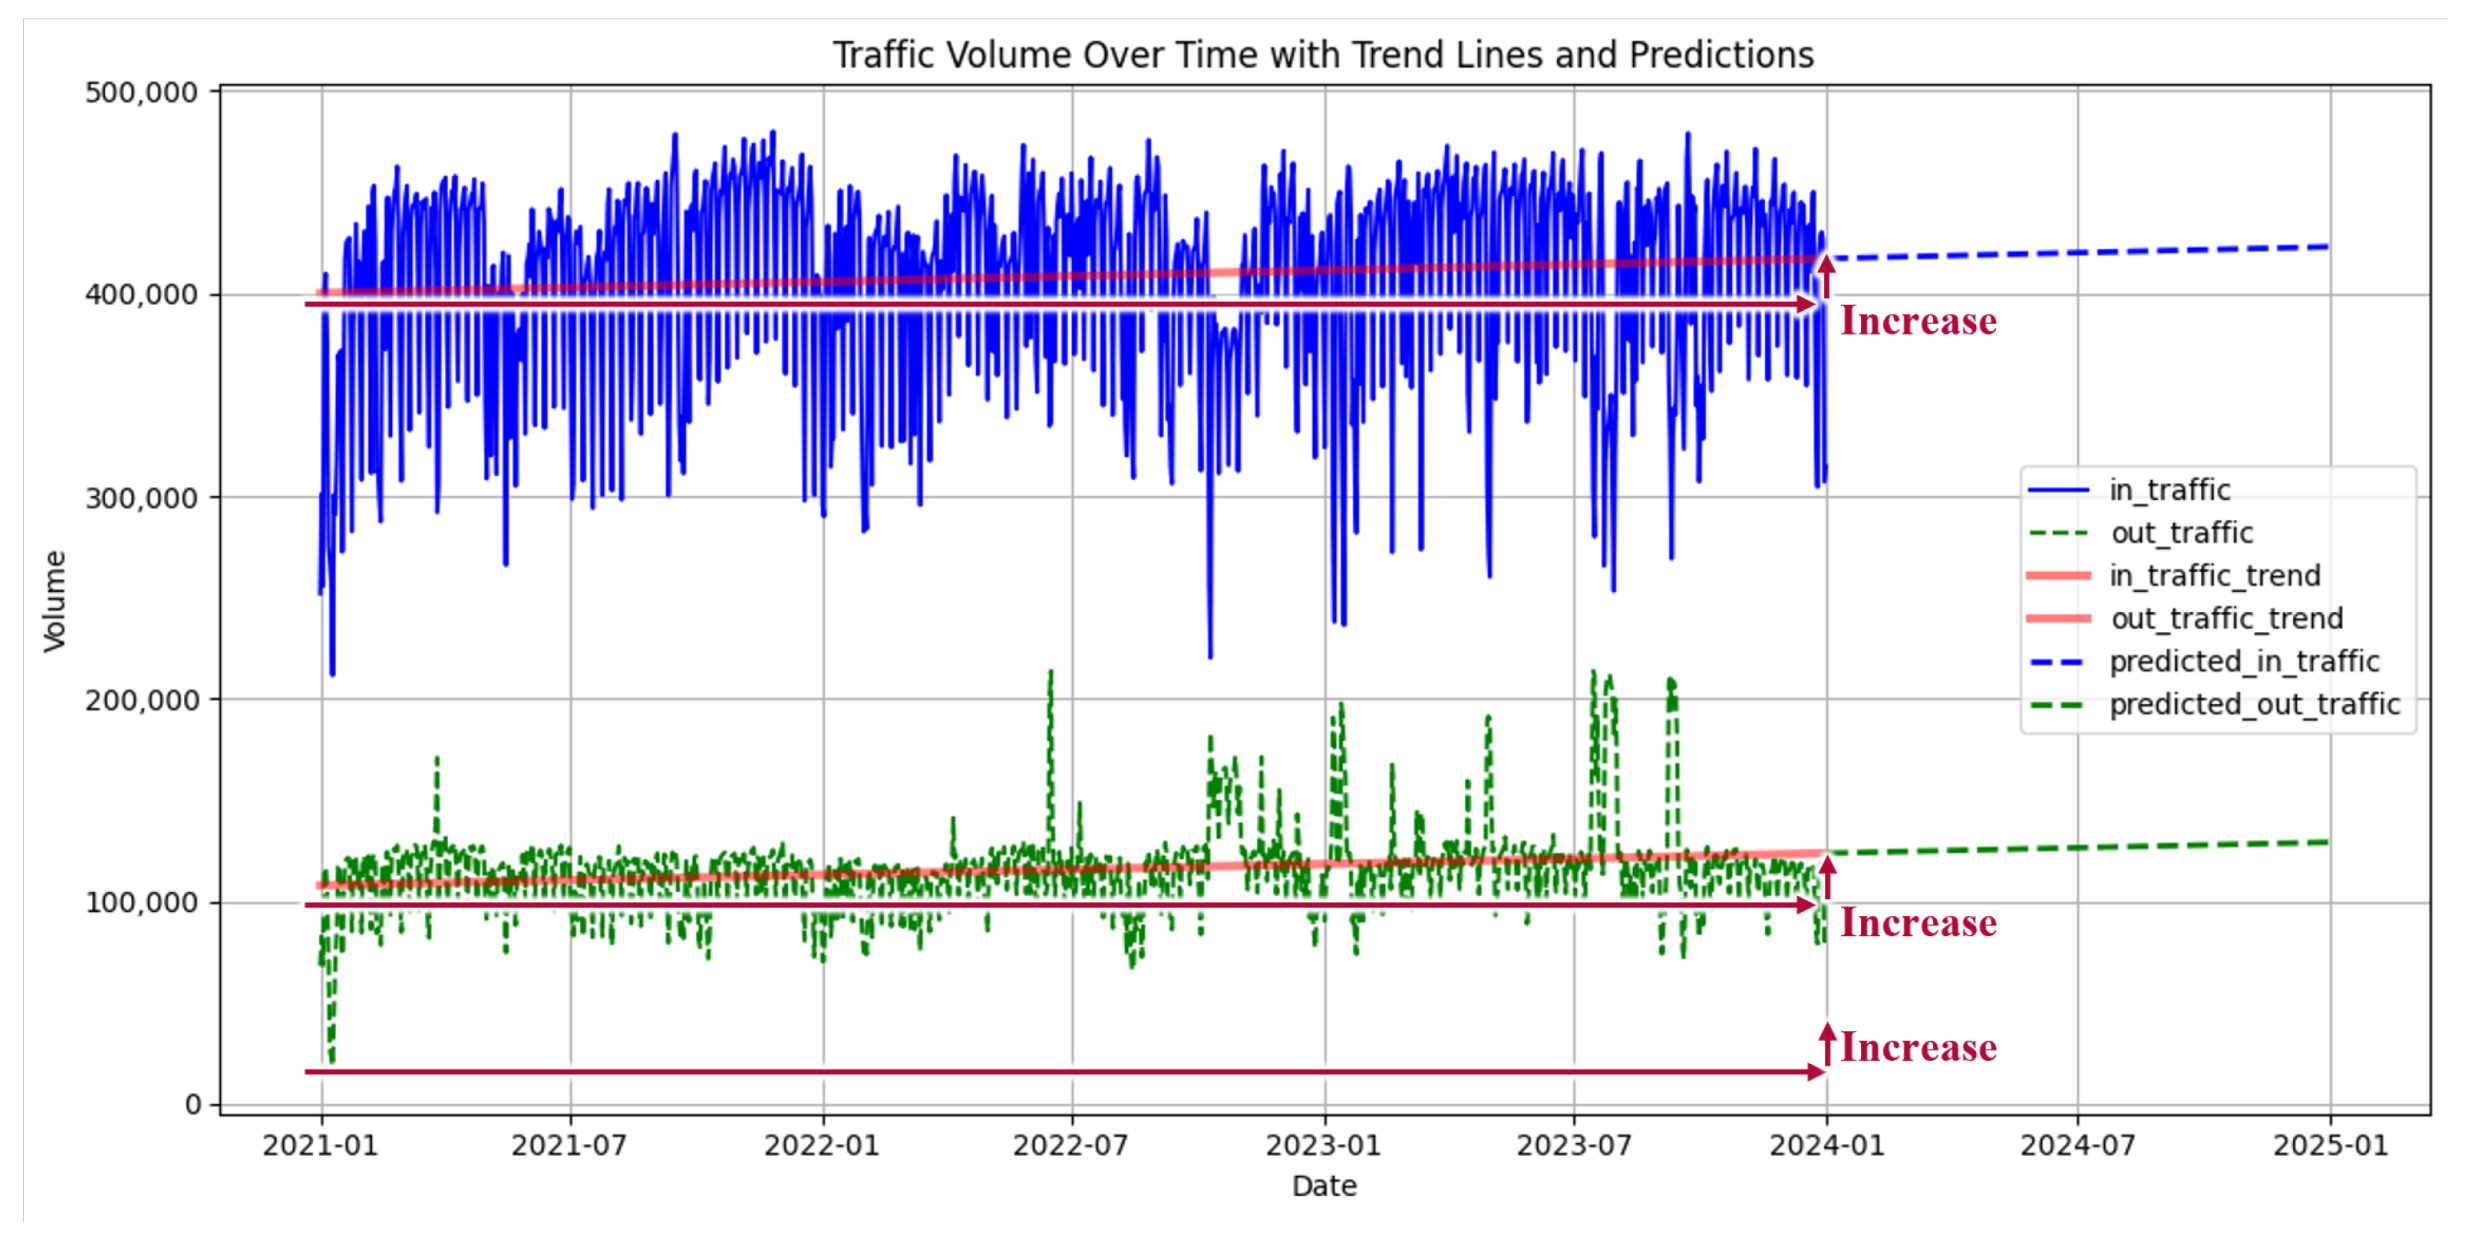
2.2.1. Analysis of Private EV-Based Mobile ESS Potential

Figure 4 compares the battery utilization patterns and V2G suitability of private and commercial EVs throughout the day, evaluating their potential as mobile ESSs. Private EVs, which are parked for the majority of the day, show higher suitability for V2G solutions during evening and nighttime hours when parked. The battery capacity of private EVs ranges from 59 to 125 kWh, with 50–75% of this capacity being available for V2G, which represents a relatively high percentage. These findings indicate that privately owned EVs are well suited for energy storage and distribution. This ratio is derived from an analysis of EV operating cycles, charging–discharging patterns, and charging station location data. The estimation is carried out with a scenario-based model after normalizing traffic data and vehicle registration statistics by time of day. Available V2G capacity is estimated by correlating it with the average daily parking durations. The analysis also takes into account the behavior of multiple privately owned EVs that remain stationary at the same building for extended periods.
In contrast, commercial EVs are primarily in operation during the day, with their parking times mostly limited to evenings and nights. As a result, the opportunities to utilize them as mobile ESSs are more limited, and their actual V2G available capacity is only 20–25%. To this end, we perform an integrated analysis of intersection-level time-series vehicle inflow–outflow data obtained from Seoul’s traffic information system together with EV registration statistics. The available duration for V2G operation is estimated from parking probabilities and dwell-time distributions for each EV class. By combining these results with charging station location data, we infer the spatial distribution of EV energy demand and thus quantify the potential for V2G integration.
Linked with the time-of-day parking and operating profiles shown in Figure 4, this analysis reveals quantitative variations in actual V2G availability and provides key input for data-driven mobile ESS deployment strategies. Private EVs are ideal mobile ESS candidates due to their idle time and high energy availability. These findings underscore the necessity for a strategic approach to design V2G solutions that effectively leverage private EVs as mobile ESSs.
EV charging station location data and private EV traffic data serve as key variables in polyfunctional V2G solutions. Figure 5 presents the correlation between EV user counts and traffic volume from 2021 to 2023, along with a forecast of private EV traffic trends for 2024. The blue line represents the number of vehicles entering a specific area, the green line shows the number of vehicles exiting the area, and the red solid line illustrates the inflow and outflow trends.
At all data collection points, the traffic volume shows a consistent cyclical pattern: increasing during weekdays and decreasing on weekends. This is a typical pattern of commuting flows and major city activities. During weekdays, both inflow and outflow become more active, which results in a significant increase in EV traffic and higher energy demand. The number of inflowing vehicles represents the energy demand for vehicles entering the city, while the number of outflowing vehicles indicates energy movement for vehicles leaving the area. Inflow fluctuates between approximately 300,000 and 450,000, while outflows vary around 100,000 users. This highlights an imbalance in energy consumption and charging station demand within the city. The trend line, represented by a solid red line, demonstrates a continuous increase in EV traffic volume. This is closely tied to the growing number of EV users and illustrates the gradual impact of EVs on city mobility. As EV adoption increases, so does the demand for charging stations, which emphasizes the importance of energy governance strategies.
The EV traffic data used in this analysis are based on intersection-level time-of-day inflow–outflow statistics provided by the Seoul Open Data Plaza (2021–2023), and the numbers of EV users are obtained from the Ministry of Land, Infrastructure, and Transport’s vehicle registration statistics for the same period. The data are normalized by day and week, and outliers are removed to ensure data quality. A trend analysis of traffic volume and user numbers is conducted using time-series regression analysis.
The observed high correlation between the number of EV users and traffic volume facilitates the identification of peak times and congested areas for charging stations based on the data. Furthermore, it serves as a fundamental spatial and temporal V2G solution. This finding indicates that EVs have considerable potential to make a meaningful contribution to city energy flows, extending beyond their current role as a mere transportation mode. It is suggested that EVs can function as strategic assets in the development of intelligent VPP-based energy management strategies.

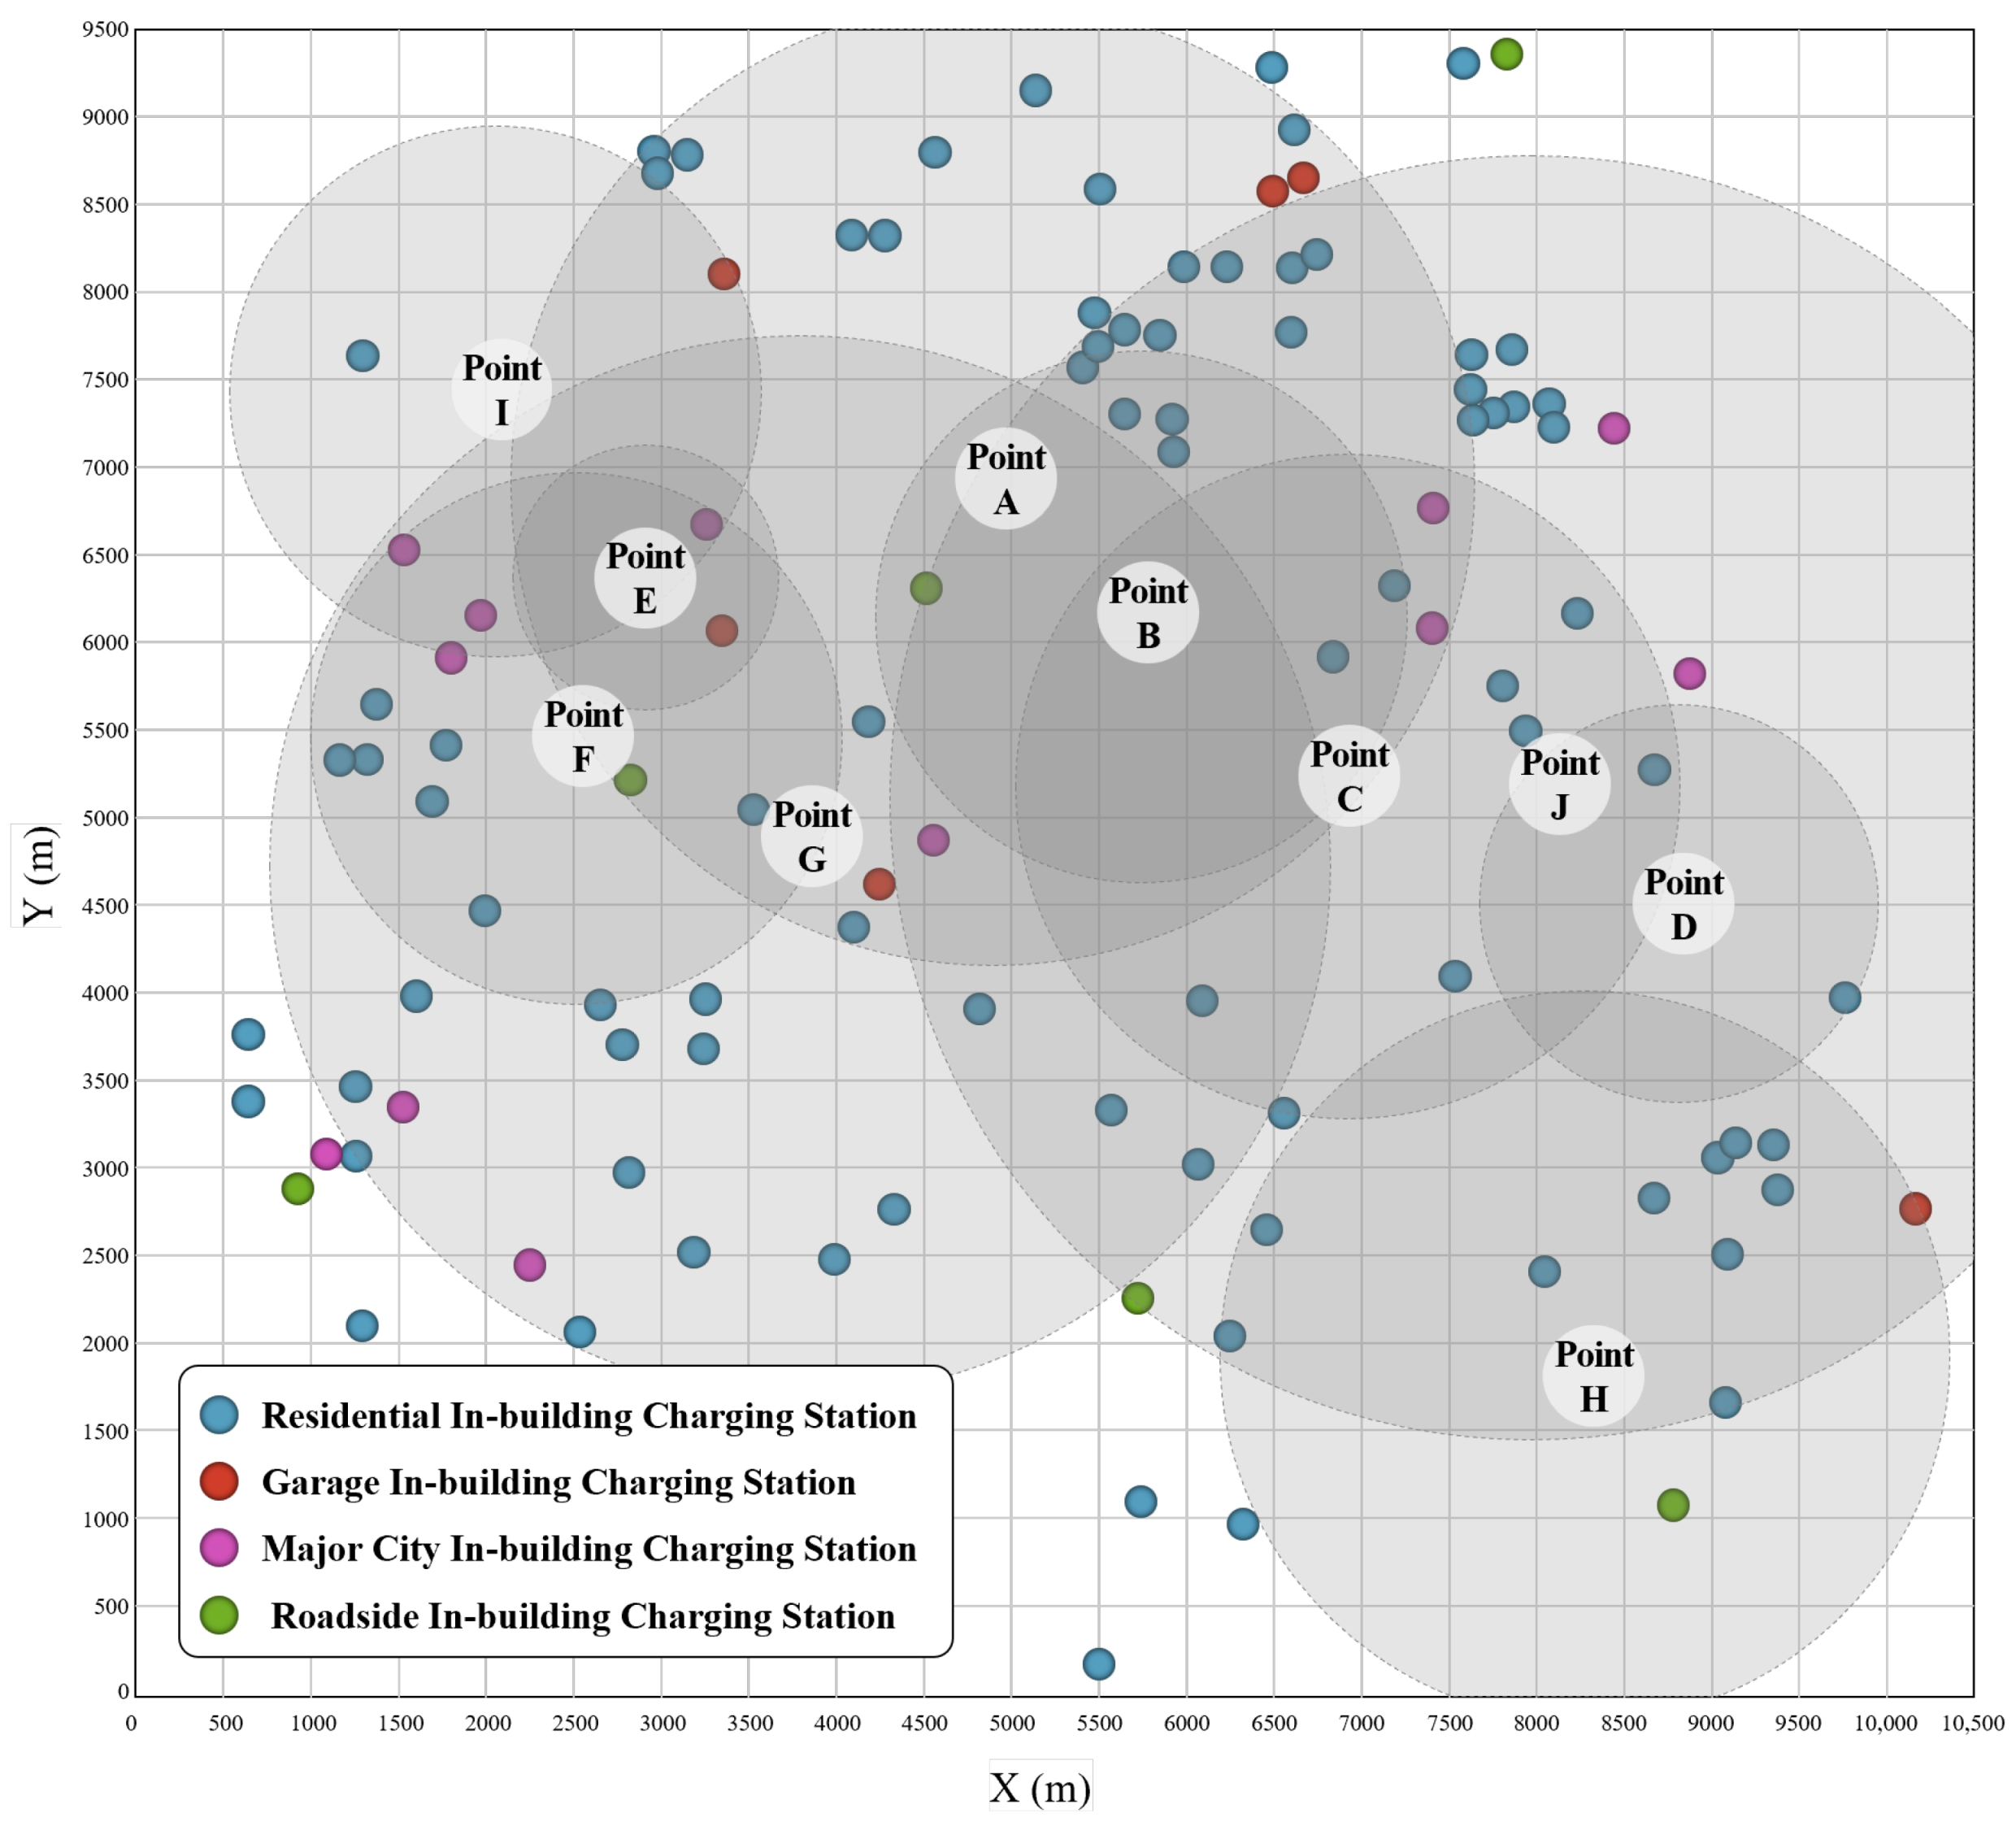
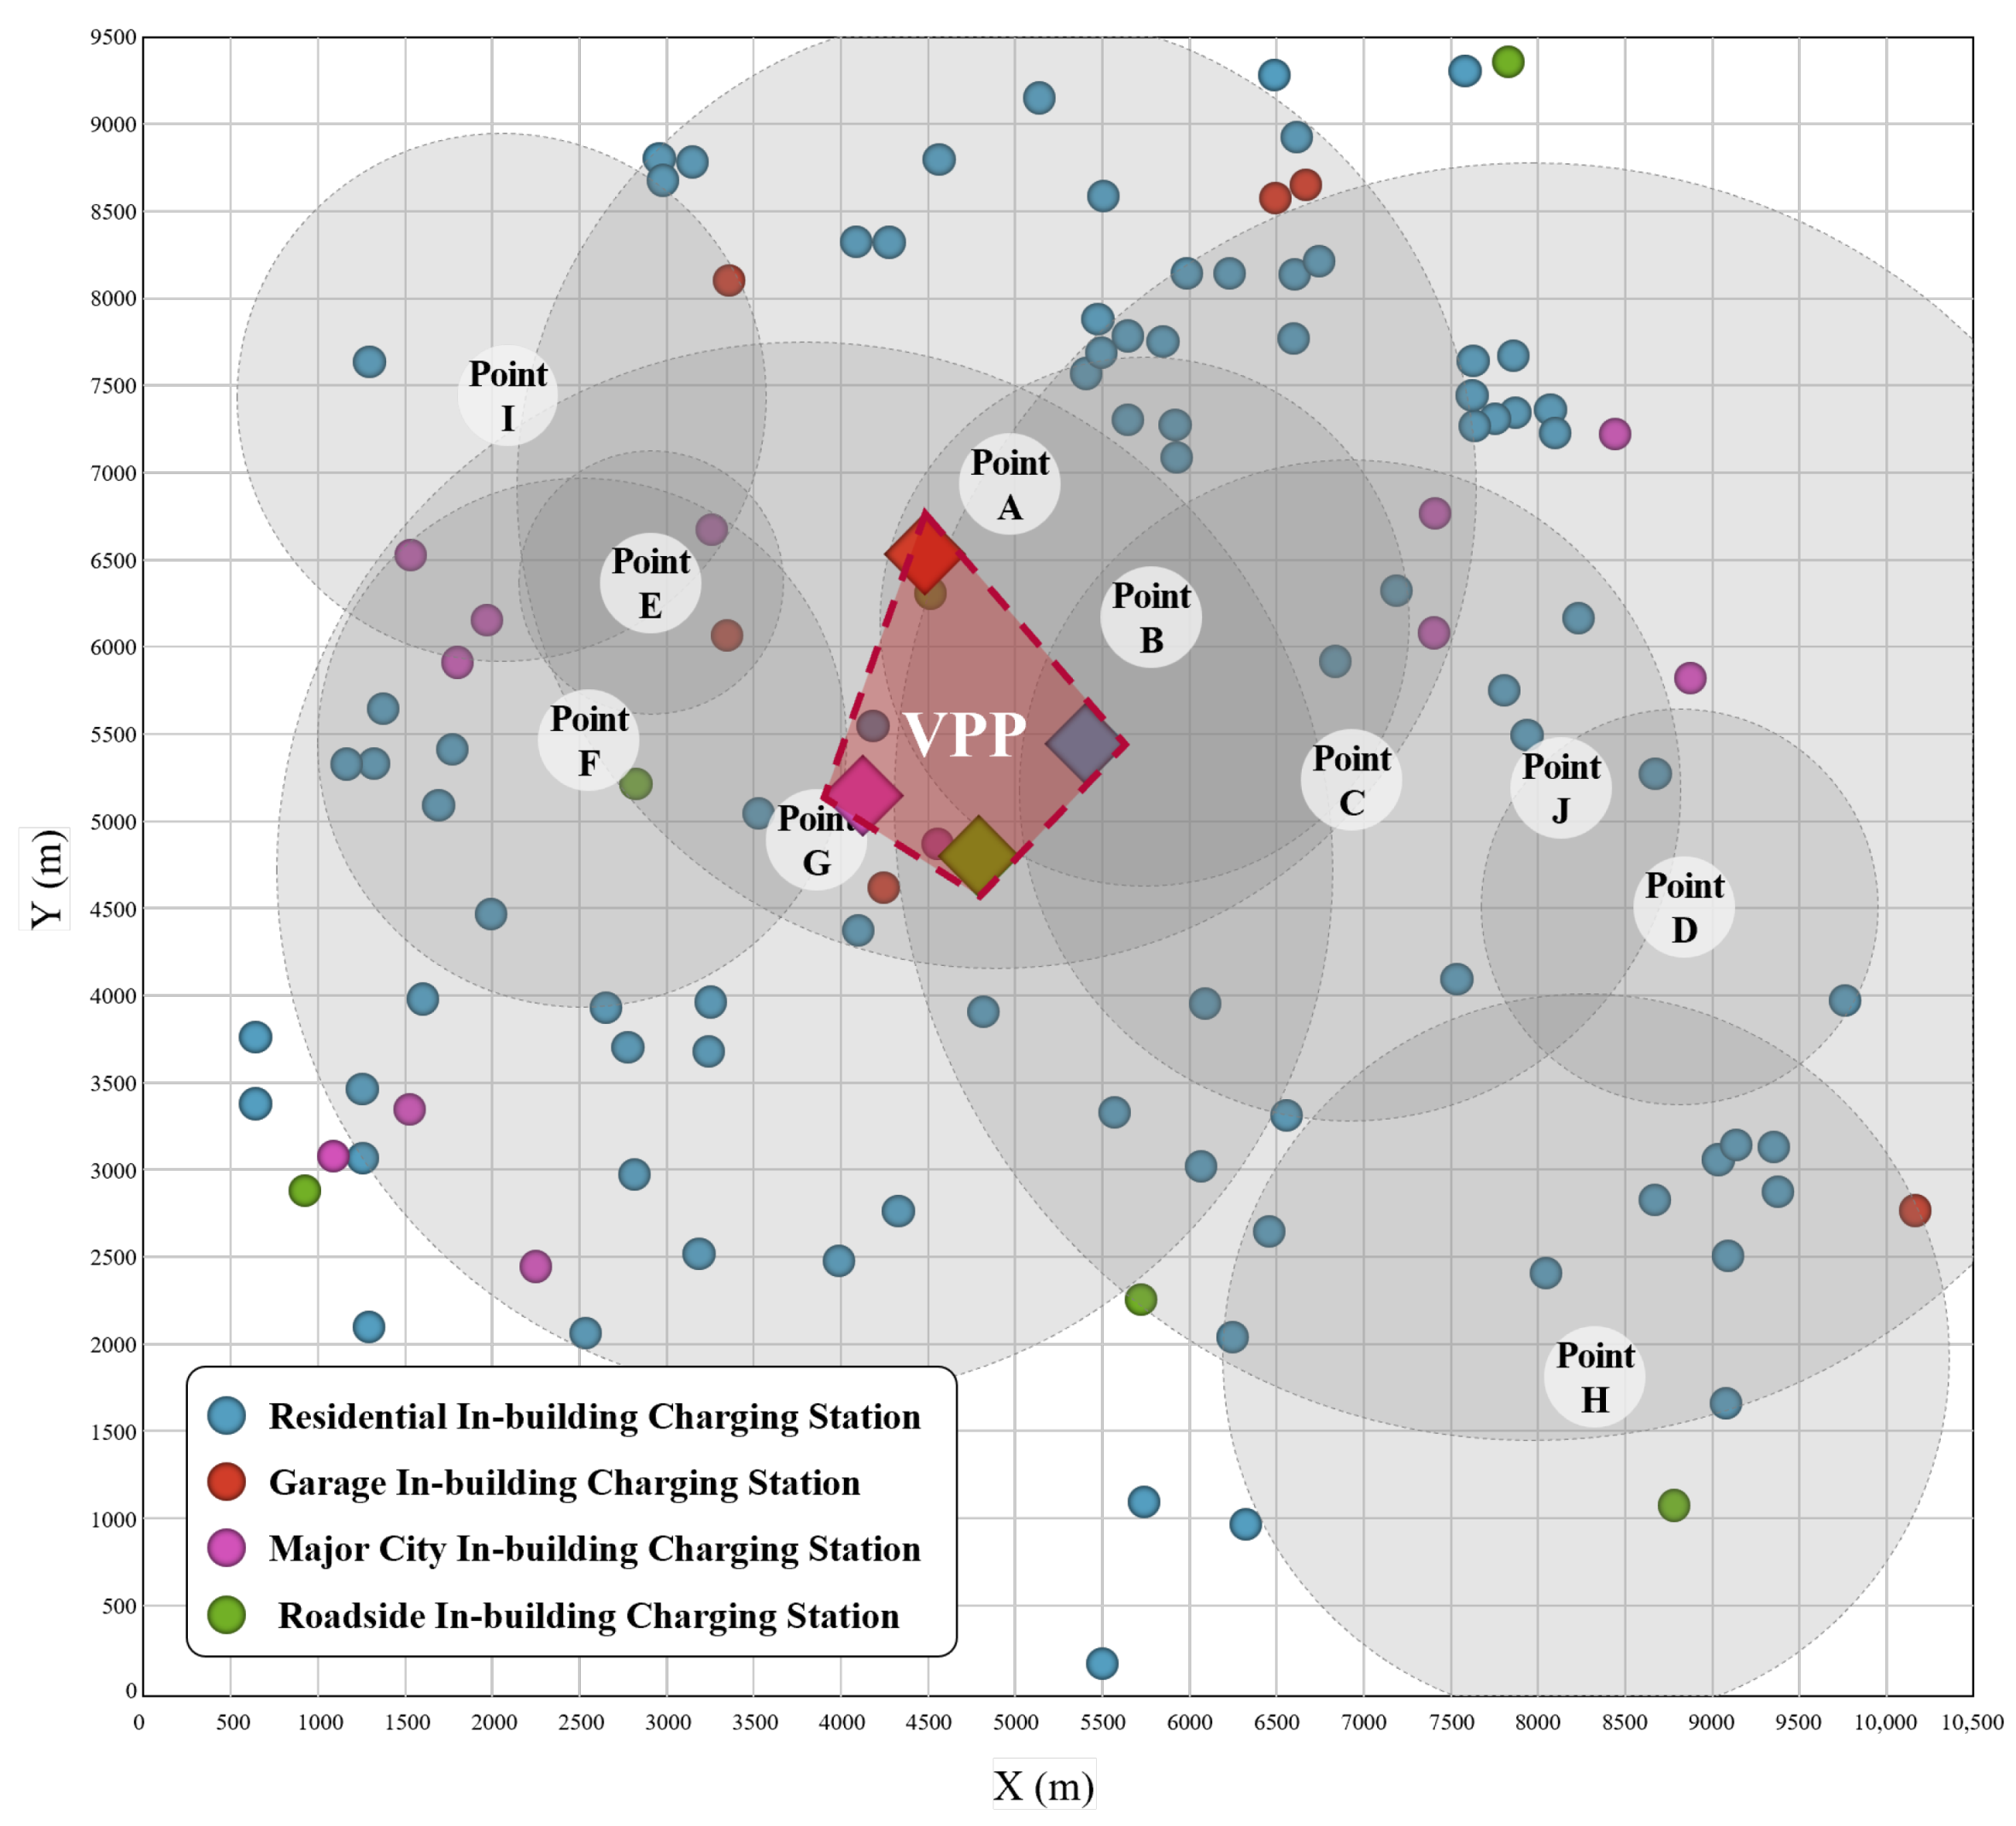
2.2.2. Charging Station Location Data and Classification

In Figure 6, the types of EV charging stations installed within a 500 m radius of 10 EV traffic collection points in a specific city area are visualized. The study area is a densely populated district of Seoul that embodies the transportation and charging infrastructure of a major city. The charging stations are classified into four categories: Residential In-Building, Garage In-Building, Major City In-Building, and Roadside In-Building. The classification is based on the location coordinates of the charging stations and the land use information of surrounding facilities. Each gray shaded area represents the influence zone of an individual collection point, with overlapping areas indicating regions where EV demand is concentrated or charging stations are densely clustered. The distribution of charging stations is characterized by a color-based classification system that differentiates between the various types. This facilitates spatial identification of the concentration of different types across specific areas.
To design a V2G solution for energy distribution and demand response using a mobile ESS, EV traffic flow, charging station locations, and the number of private EVs are linked and analyzed. The data collection process incorporates EV traffic data and charging station location data provided by the Open Data Plaza in Seoul, South Korea, as well as the nationwide electric vehicle charging infrastructure database of the Korea Electric Power Corporation. The volume of EV traffic is estimated by calculating the proportion of EVs in the total traffic volume. This is based on the assumption that the EV penetration rate is equivalent to the total vehicle operation rate. This is in accordance with Seoul City’s vehicle registration statistics. Traffic volume collection points are situated primarily at major intersections in densely trafficked urban districts, capturing the principal movement patterns of privately owned EVs in the city center.
The impact level labeled at each EV traffic data collection point indicates the number of private EVs entering or exiting the city center from that location. Notably, areas where impact levels overlap show a higher concentration of EV charging stations. In addition, data-driven analysis provides critical insights for designing polyfunctional V2G solutions. By linking charging station locations with traffic data, energy demand can be managed more effectively, and energy losses during charging can be minimized, which facilitates efficient energy conservation. This approach provides practical solutions for energy savings and carbon emission reduction. It also underscores the growing role of EVs and charging stations as critical components of a sustainable future in an increasingly environmentally conscious society.

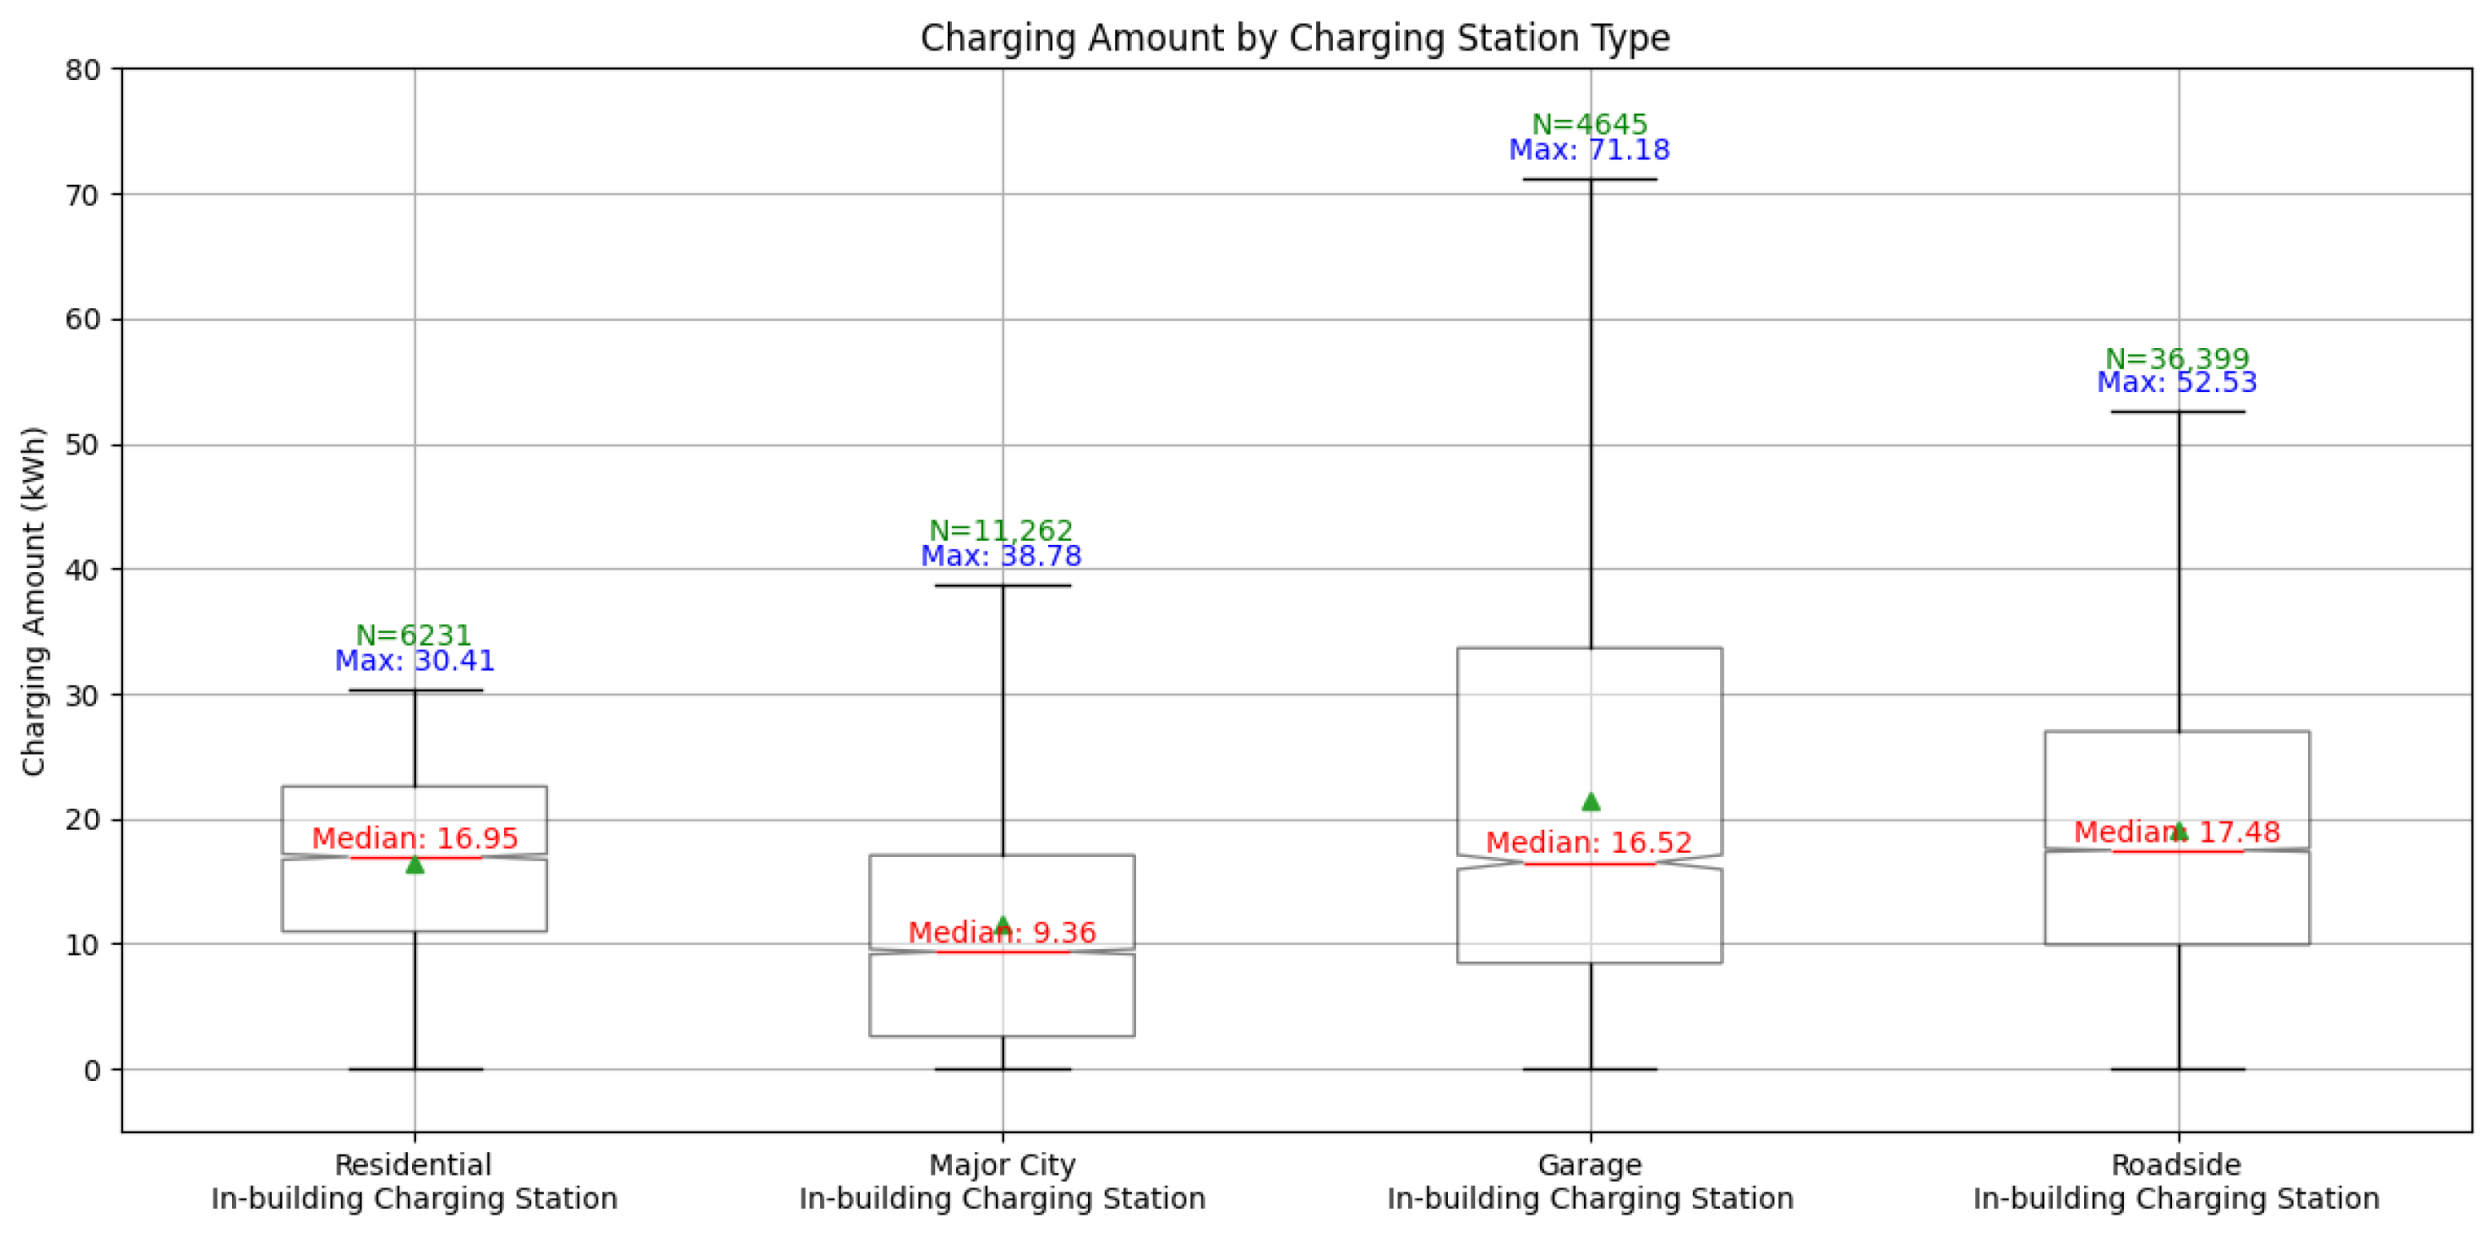
2.2.3. Energy Demand Characteristics by Charging Station Type

Figure 7 visualizes the distribution of energy demand in residential areas, parking lots, major urban facilities, and roadside charging stations in the form of box plots. Box plots are used to visually represent the central tendency and dispersion characteristics of energy demand for each charging station type, serving as an effective statistical tool for quantitatively comparing demand concentration and variability across charging stations. The analysis utilizes over 59,000 real-world charging history data points obtained from the Korea Electric Power Corporation (KEPCO) from 2021 to 2023, with charging stations classified into four types based on their location information. Demand volume is based on the actual charging volume (kWh) of individual charging sessions, and, after excluding outliers, the median and maximum values are used to compare and analyze the demand characteristics by type. This approach aims to quantitatively assess the concentration and variability of demand volume between charging station types and effectively identify imbalances and structural differences in energy demand.
Residential charging stations exhibit low demand, with a median session energy of 16.95 kWh. More than three-quarters of sessions draw no more than 30 kWh. A few sessions, however, reach 30.41 kWh, indicating marked variation among users. Garage stations show a similar median (16.52 kWh) yet record the highest observed session energy—71.18 kWh—implying frequent long-duration charging and a need for high-capacity provision. Major city facility stations register the lowest demand (median 9.36 kWh), reflecting short dwell times, although occasional peaks of up to 38.78 kWh reveal temporary surges. Roadside stations display the highest typical demand (median 17.48 kWh) and the broadest dispersion, with sessions of up to 52.93 kWh, consistent with rapid en route charging during long-distance travel. These disparities underscore the importance of tailored demand management and energy distribution strategies for each station class so as to mitigate irregular loading across the network.

3. Applied Models and Algorithm Design

This chapter delineates the model and algorithm design process for the practical implementation of the proposed polyfunctional V2G solution. Firstly, a demand management process and a load-balancing strategy are presented that use a mobile ESS to efficiently manage the energy demand of EV charging stations. This approach has been demonstrated to assist in the mitigation of issues related to peak-time load concentration, thereby enhancing the stability and reliability of energy operations.
In the subsequent phase of the study, an analysis of charging stations is conducted according to their respective types. This analysis is undertaken through the utilization of K-means clustering, a data-mining technique that facilitates the identification of distinct clusters within the dataset. The subsequent step involves the design of a package-based intelligent VPP, with the design parameters informed by spatial demand characteristics. This approach is predicated on the integration of data pertaining to charging station location, type, traffic volume, and user density, with a view to constructing demand-centric, customized energy packages.
In conclusion, an analysis is conducted to determine the equilibrium between the energy demand of charging station clusters and the energy supply capacity of private EVs. The design of strategic packages capable of real-time demand response is also completed. The present chapter thus demonstrates the feasibility of the polyfunctional V2G solution through a series of procedures ranging from data-based analysis to actual algorithm design and application. The proposed model and its algorithms are implemented in Python. Data are processed and analyzed with Pandas and NumPy, and K-means clustering is carried out using scikit-learn. Matplotlib and Seaborn are employed to visualize clustering results and demand patterns, thereby improving the clarity of the analysis. All procedures are executed within a bespoke, internally developed computing environment.

3.1. Demand Management with Mobile ESSs

3.1.1. Charging Demand Management Process

This process follows a sequence focused on users, governance, and operation and aims to improve energy efficiency through charging station utilization analysis. The frequency of energy usage at each charging station is identified to distinguish frequently used stations from those that are relatively underused. In addition, the concentration of energy demand during peak usage times is analyzed, and a mobile ESS is used to distribute energy demand in response to changing trends. Figure 8 illustrates the energy demand governance process for conserving energy at charging stations.
The provider needs to analyze the correlation between the load levels of charging stations and hourly usage to manage energy demand at charging stations and improve energy efficiency. They should also use private EVs to distribute energy across different types of charging stations. Both providers and consumers analyze the relationship between energy usage and frequency, which provides valuable feedback to operations. In the governance phase, charging patterns are analyzed, and charging strategies are developed to reduce carbon emissions. The state of charging station utilization is analyzed based on changes in usage frequency.
In the operational phase, an intelligent VPP is actively used to improve charging efficiency and balance energy. At this stage, the analysis of charging station utilization identifies peak and off-peak energy demand periods. By charging during off-peak hours, energy can be evenly distributed via a mobile ESS, which increases energy utilization efficiency across the grid. Moreover, managing charging station loads helps conserve energy, improve reliability, and enhance stability. By applying this process, the goal is to maximize the potential of ESSs within private EVs, utilizing them as mobile ESSs and effectively managing the energy demand of charging stations.

3.1.2. Heuristic Load Allocation for Mobile ESS

Algorithm 1 begins by calculating the average load, maximum load, and median load for each of the four charging station types. The average load is calculated by summing the load of all charging stations of the same type and dividing it by the number of stations. The maximum load refers to the load of the station with the highest value within a given type. The median load is a reference value somewhere between the average and maximum load and is considered a slightly better indicator than the average load.
The next step is to check whether the load of each charging station exceeds the average load. If a station exceeds the average load, the specific excess load is calculated, and part of it is redistributed to other stations of the same type that are still below the average load. The load to be redistributed is determined by selecting the smaller value between the excess amount and the amount needed for the receiving station to reach the average load. Each time redistribution occurs, the load values of the station losing load as well as the station gaining load are updated. This process continues until there is no remaining excess load or no station below the average load. If all stations of a particular type already exceed the average load, it becomes impossible to find stations below the average, and the median load becomes the new benchmark. In this step, stations that exceed the median load redistribute their excess load to stations that are still below the median load. Similarly, the amount of load to be redistributed is determined by selecting the smaller value between the excess load and the amount required for the receiving station to reach the median load. This secondary redistribution process continues until no excess load remains above the median load or further redistribution becomes impossible.    
Algorithm 1: Heuristic Algorithm for the Distribution of Energy with a Mobile ESS
Buildings 15 02045 i001
Through this process, all stations—whether experiencing reduced or increased load—are assigned updated load values. This approach prevents excessive load concentration at specific stations or types and ensures a more balanced distribution. The ESS allocation scheme adopts a heuristic, rule-based structure, yet its decision logic is domain-specific: it reflects the intra-city mobility of mobile ESS units and the load profiles of charging stations. Allocation priorities and thresholds are derived from empirical charging demand patterns, ensuring that the algorithm offers practical judgement and transferability to real operating environments. As a result, even during peak hours, the load is evenly distributed, which improves power utilization efficiency and enhances the operational stability of the charging infrastructure.

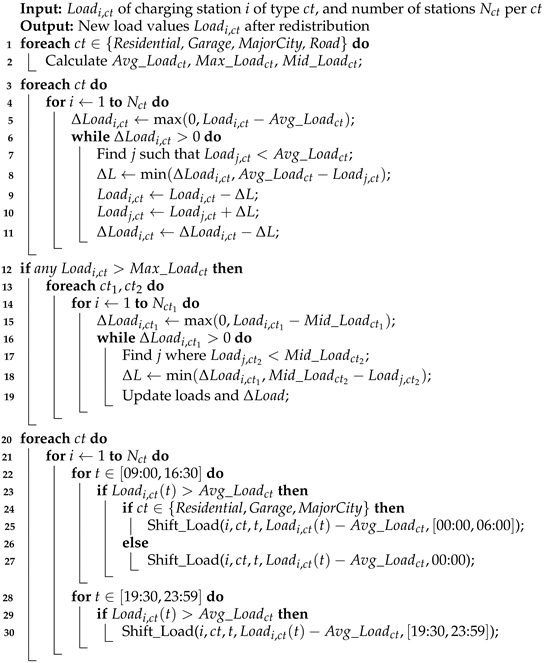
3.2. Machine Learning for Data-Driven VPP Design

3.2.1. K-Means Data Clustering Package Modeling

K-means clustering is selected as an unsupervised, centroid-based algorithm well suited to the design of intelligent VPP packages. By grouping charging stations around geometric centroids, the method captures spatial correlations and location-specific demand characteristics. Distance-weighted and load-weighted features are input so that the algorithm reflects both station proximity and the distribution of energy demand. The number of clusters and the initial centroids are chosen from the statistical properties of urban traffic flows and charging loads, then fine-tuned to ensure that the resulting clusters carry strategic value rather than representing a purely mathematical partition. The final clustering output provides a practical foundation for assembling demand-oriented mobile ESS packages and planning their deployment within the VPP framework.
The design and operation principles of K-means clustering can be divided into the selection of cluster values, the centroids of K clusters, and the calculation of distances between individual data points. It groups data into K clusters and uses the centroid of each cluster as the representative point for intelligent VPP packaging. This approach provides convenience to EV users and responds to energy demand while also improving the sustainability of city traffic systems.
In the context of the continuous influx of energy and transportation data, the calculation speed, interpretability, and lightweight memory usage of the system are of paramount importance. It is evident that the computational complexity of the K-means algorithm is directly proportional to the number of data points, the number of clusters, the number of variables, and the number of iterations. Consequently, it boasts a notable computational efficiency, even when dealing with substantial datasets. Each cluster center is interpreted as the package reference point for the VPP, thereby enabling intuitive decision-making in operational settings. Clustering is performed using the K-means algorithm based on 59,000 EV charging session records. The value of K is set at 4, representing the number of clusters that correspond to the four distinct categories of electric vehicle charging station clusters identified within the dataset, namely, Residential In-Building, Garage In-Building, Roadside In-Building, and Major City In-Building. The data points for each charging station type are defined as x i = ( l i , t i , d i , e i ) , where l i is the location information, t i is the usage time of the charging station, d i denotes the traffic data, and e i represents the energy demand.
Private EVs function as mobile ESS units within each cluster, supplying energy to high-demand areas for charging stations. The private EV data are expressed as x EV , j = ( β j , α j , e EV , j ) , where β j represents the proportion of private EVs in the cluster, α j denotes the utilization rate of private EVs, and e EV , j indicates the energy supply capacity of an individual private EV.
In the initial step, each cluster center μ k is initialized with a random value, as shown in Equation (1). This follows the general initialization method of the K-means algorithm.
μ k for k = 1 , 2 , , K
Here, K is the number of clusters, and each cluster C k consists of n k data points x i . In the VPP packaging stage, the cluster centers are updated using the average of the data points within each cluster, as shown in Equation (2):
μ i = 1 | C i | x j C i x j
where C i denotes the set of data points belonging to cluster i, and | C i | is the number of data points in that cluster. The mean μ i is calculated as the arithmetic average of all x j values in the cluster. In the next step, the total energy demand within each cluster by charging station type is calculated using Equation (3), where e j represents the energy demand of charging session x j :
E i , demand = x j C i e j
Mobile ESS units supply energy to the charging station cluster, and the total energy that can be provided by private EVs in cluster type i is calculated as shown in Equation (4):
E i , EV = x E V , j C i ( β j · α j · e E V , j )
To balance the energy demand and supply within each charging station cluster by type, the energy amount is appropriately allocated. Equation (5) represents the energy balance condition, which must be satisfied to ensure equilibrium between energy supply and demand within cluster i. Here, E i , supply refers to the energy available from mobile ESS units, and E i , EV denotes the energy available from private EVs within cluster i:
E i , demand = E i , supply + E i , EV
Finally, Equation (6) defines the objective function for minimizing the energy demand–supply mismatch across the four types of charging station clusters. This function aims to optimize the overall energy distribution efficiency of the system:
min i = 1 4 E i , demand E i , supply + E i , EV 2
The objective is to minimize the mismatch between demand and supply in each cluster and thus maximize system-wide distribution efficiency. To that end, EV charging data are grouped with K-means clustering, and the resulting clusters inform a package-based intelligent VPP strategy tailored to individual categories of privately owned EVs. By capturing the distinct characteristics of each category, the system can respond effectively to localized demand peaks at particular times and places. In addition, by shortening delivery distances within clusters, the approach improves responsiveness and enables the efficient allocation of energy via privately owned EVs.

3.2.2. Data Clustering and Package Modeling Using K-Means

Figure 9 plots the spatial distribution of each charging station type on an X-Y grid, showing cluster centers and their 500 m service radii derived from actual location data. Each center represents stations with high power demand situated in areas of heavy traffic. VPPs are configured by linking these centers, thereby creating hubs in which energy flows can be modulated and demand response strategies that harness privately owned EVs can operate efficiently.
This study integrates charging station networks with EV traffic flow data to identify high-energy-demand zones within urban areas and proposes a VPP packaging strategy to mitigate the imbalance between local electricity demand and supply.
Specifically, by regulating the charging–discharging behavior of privately owned EVs at locations where charging infrastructure influence intersects with heavy traffic, the approach bolsters grid stability and local energy autonomy. The framework shows that a sustainable, V2G-based energy management system can be realized with existing assets, obviating the need for extensive infrastructure expansion.
This is an explanation of how intelligent VPP packaging solutions can be used in city environments. For instance, in areas where there is a high density of charging stations and where traffic is particularly concentrated, it is possible to analyze the data relating to the usage of the charging stations and the flow of traffic which have been collected over the course of the day. This analysis can then be used to identify locations where demand for charging is particularly high. Based on the analysis results, a specific charging station is set as the central node of the cluster and connected to nearby private EV users to adjust the charging and discharging schedules.
The implementation of demand-responsive operations has the potential to induce substantial grid decentralization effects by utilizing the existing charging station network and user patterns, thereby obviating the necessity for additional complex infrastructure. This design provides the basis for the practical application of VPP-based charging station package operations at the city level. Furthermore, the energy demand response enabled by VPP packaging expands the role of EVs and charging stations beyond basic transportation and energy consumption. These systems function as dynamic energy hubs, capable of storing and redistributing energy, thereby playing a critical role in advancing regional decarbonization and energy self-sufficiency.

4. Results and Discussion

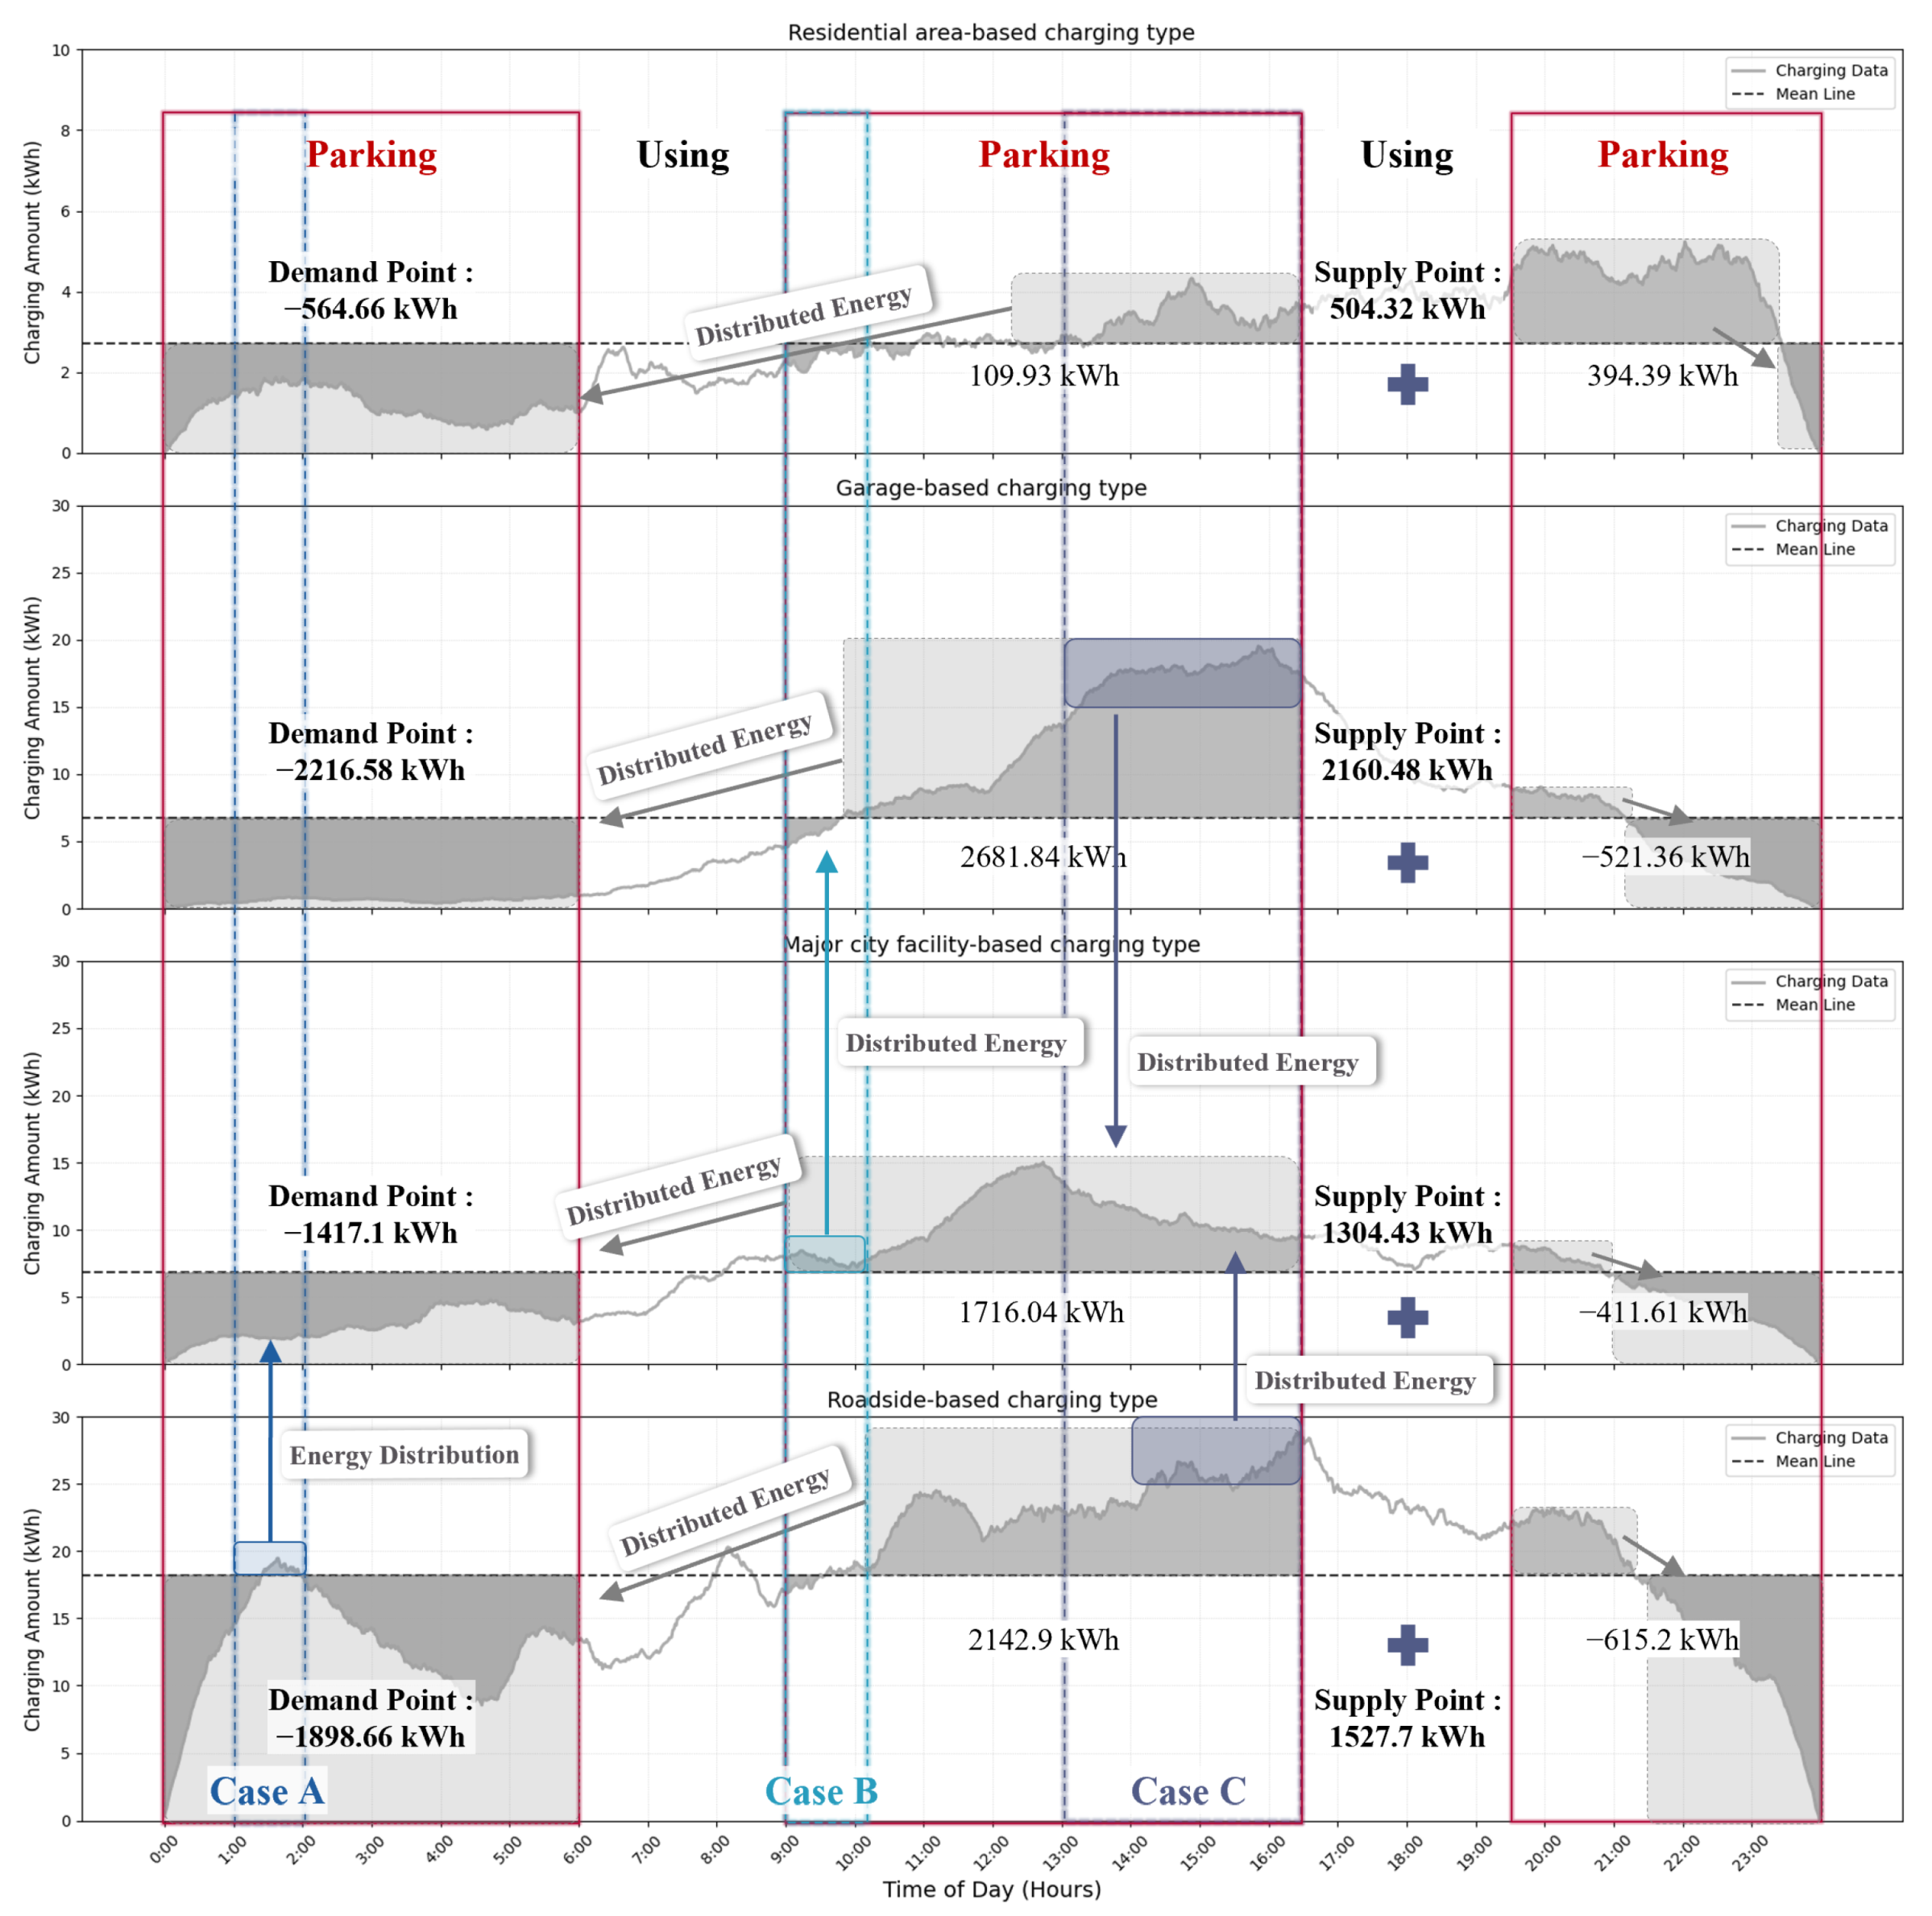
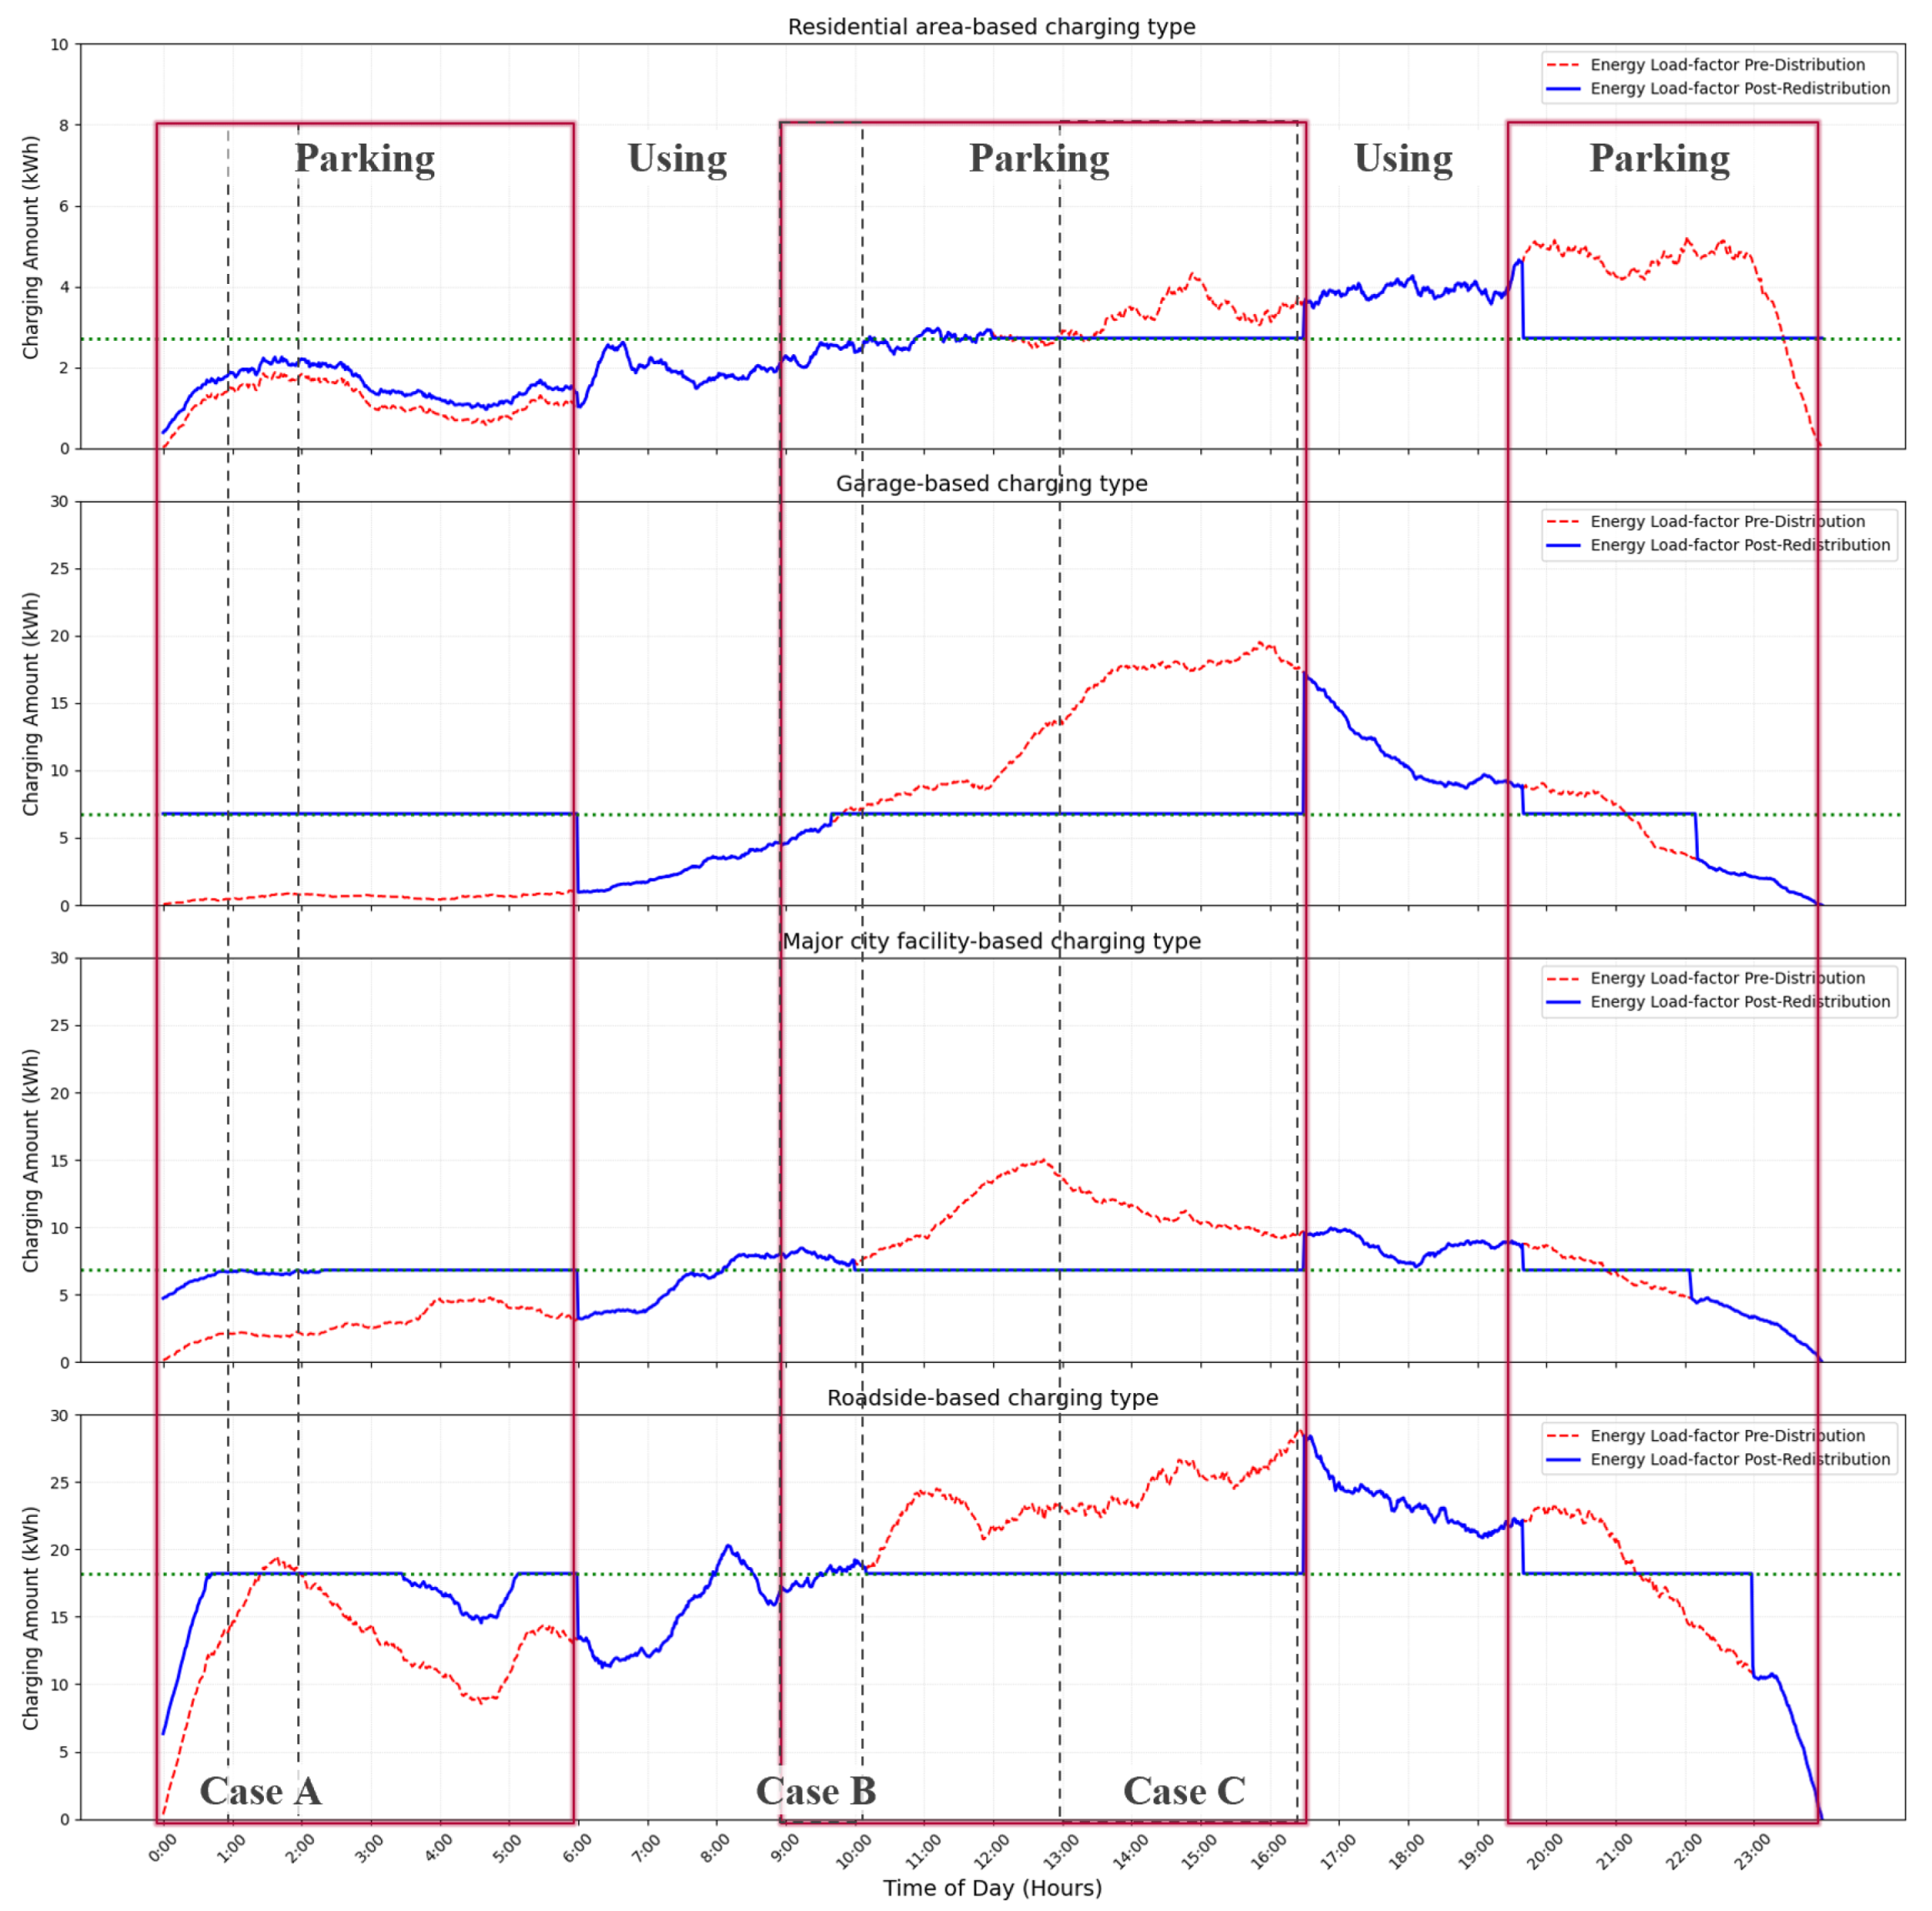
4.1. Baseline Load Analysis and Initial Energy Management

Figure 10 presents the results of energy distribution in response to 24 h charging power demand for Residential In-Building, Garage In-Building, Major City In-Building, and Roadside In-Building charging station types at the predicted locations. Each graph is divided into three scenarios, A, B, and C, which illustrate the application of balance adjustment during specific parking periods to utilize the potential of private EVs in response to energy demand. The simulation is built on empirical traffic volume data and EV registration records, with each case depicting charging demand and traffic patterns for a specific time window. The model draws on the EV traffic dataset outlined in Section 2.2.1 and is not limited by a fixed vehicle count; instead, each case is shaped by relative demand profiles and the charging–discharging potential inferred from time-of-day traffic flows and the number of registered users. The study’s aim is to evaluate the effectiveness of supplying energy via privately owned EVs in zones that experience peak demand.
By analyzing the characteristics of each graph type, it is found that residential charging stations exhibit low initial power consumption, which gradually increases after 6 a.m. and peaks between 5 p.m. and 8 p.m. Although the power consumption gradually decreases afterward, it remains steady after 10 p.m., which reflects the pattern of users charging their EVs at home after returning from work and results in high power consumption during the evening. Garage charging stations start with very low power consumption, which gradually increases from 6 a.m., reaches a maximum load between 1 p.m. and 4 p.m., and subsequently drops sharply. Major city charging stations show a gradual increase in load around 8 a.m., peaks between noon and 3 p.m., and then gradually declines. This finding corresponds to the pattern of people charging their vehicles during lunch breaks or while out. Charging stations on roads experience a rapid increase in power consumption between 8 a.m. and 10 a.m., generate a peak during the afternoon, and then experience a gradual decrease in power consumption. After 8 p.m., power consumption drops sharply and remains at a consistently low level as charging demand is primarily concentrated during commuting hours and long-distance travel periods.
The simulations are run over three distinct time windows: Case A (01:00–02:00), Case B (09:00–10:00), and Case C (13:00–16:30). In this scenario, Case A shows an excess load of 2 kWh above the average load at a roadside charging station which is redistributed to a major city charging station to balance the load. In Case B, when an excess load of more than 3 kWh accumulates at a major city charging station, the load is transferred to a garage charging station. Case C involves a situation where all types of charging stations are already utilizing loads above average, which means the load is redistributed based on the median value. In this case, garage and roadside charging stations with loads of 6 kWh above the median redistribute their load to major city charging stations. The load is redistributed across all types of charging stations to maintain load balance.
Notably, when a mobile ESS is utilized at charging stations with parking time, energy can be supplied to areas in need or otherwise stored for later use. This approach proactively redistributes surging demand and maintains balanced energy requirements. For example, when excess load occurs at a roadside charging station, it is transferred to a major city charging station, and any surplus at the major city charging station is further redistributed to a garage charging station. In scenarios where all types of charging stations experience high loads, the load is divided based on the median value, using parked vehicle batteries to mitigate peaks. This distributed charging pattern becomes a key strategy to enhance the overall stability and efficiency of the charging infrastructure.
The distributed strategy in question offers the following technical advantages: In principle, it facilitates the transfer of energy between EVs without the necessity of establishing distinct infrastructure within the power grid. This approach serves to mitigate issues related to city overload and contributes to the preservation of power quality. Specifically, the strategic utilization of parking time can transform vehicles into a form of DER, thereby offering a pragmatic solutions for enhancing energy self-sufficiency and resilience within city areas in the long term.

4.2. Results of Energy Distribution Using V2G Solution

Charging demand and energy governance at charging stations are closely related. In addition, responding to, managing, and regulating energy demand is critical to improving energy efficiency and enhancing safety. Furthermore, the load rate increases based on the number of vehicles that are charging simultaneously at each station and their charging speeds. This leads to higher energy demand during peak-load periods. A sharp increase in energy demand during peak-load times puts a significant burden on the charging station. If it is not managed correctly, it threatens the station’s stability. The efficiency of the charging station is maximized by redistributing the energy demand concentrated in specific sections of the power grid to other sections. Energy consumption is then evenly distributed via a mobile ESS to allocate energy at specific times to the relevant charging stations. Therefore, it is essential to distribute energy effectively to meet demand during peak-load periods.
The energy load factor analysis in this study is conducted based on the time-of-day charging demand and the discharge capacity of the mobile ESS. The identification of the peak load is based on the demand concentration time for each charging station type. The load factors, recalculated to reflect the impact of distributed power, are presented as ELPD and ELPR indicators. Specifically, Figure 11 provides a visual representation of the discrepancy between pre-supply and post-supply load quantities, thereby demonstrating the efficacy of this distribution in mitigating actual demand.
Equation (7) is a calculation that determines the Energy Load Factor Pre-Distribution (ELPD) based on the total energy consumption of the charging station prior to distribution adjustment. The pre-load factor, as derived from this equation, is 67.8%, which indicates that the total daily energy consumption is relatively concentrated at the peak-demand point. Therefore, it can be concluded that charging demand is concentrated during specific time periods. This finding quantitatively demonstrates the need for improvements in terms of system stability and energy balance.
E L P D = P b e f o r e , t · Δ t P p e a k , b e f o r e × 24
Equation (8) mathematically expresses the purpose of load redistribution, which is to reduce peak loads occurring during a specific time interval and distribute them to other time intervals with more capacity to alleviate the instantaneous burden on the power grid. In this context, the variable Δ P t denotes the quantity of power to be reduced at time t. Its value is recalibrated in accordance with the distribution strategy for each designated time interval. In essence, the term Δ P t signifies the extent to which the maximum demand for electricity is decreased. This parameter can be adaptively configured by taking into account the available capacity of specific time slots and the prevailing energy demand patterns.
Δ P t = P a f t e r , t P b e f o r e , t
Equation (9) is the formula for calculating the Energy Load Factor Post-Redistribution (ELPR). As with the ELPD, this formula is based on the total daily energy consumption. However, it is redefined using the post-redistribution power consumption P after , t . Initially, P after , t is expressed as the sum of P before , t and Δ P t , as defined in Equation (8). However, this is merely an intermediate variable used to describe the step-by-step process of power redistribution. Therefore, it can be replaced with P after , t mathematically.
E L P R = P a f t e r , t · Δ t P p e a k , a f t e r × 24
Based on the formula, the ELPR value derived in this study is 132.7%, which shows approximately twice the load-balancing effect compared to the ELPD value of 67.8% before dispersion. As a result, the peak power demand concentrated at each charging station is alleviated, and the average load factor is improved to 64.9%. This quantitatively demonstrates that the proposed distribution strategy effectively redistributes the power grid load, contributing to improved overall energy consumption balance and efficiency. By managing energy demand through an intelligent VPP-based package that integrates four types of charging stations and energy distribution, it is possible to improve load stability and maintain energy supply and demand balance.

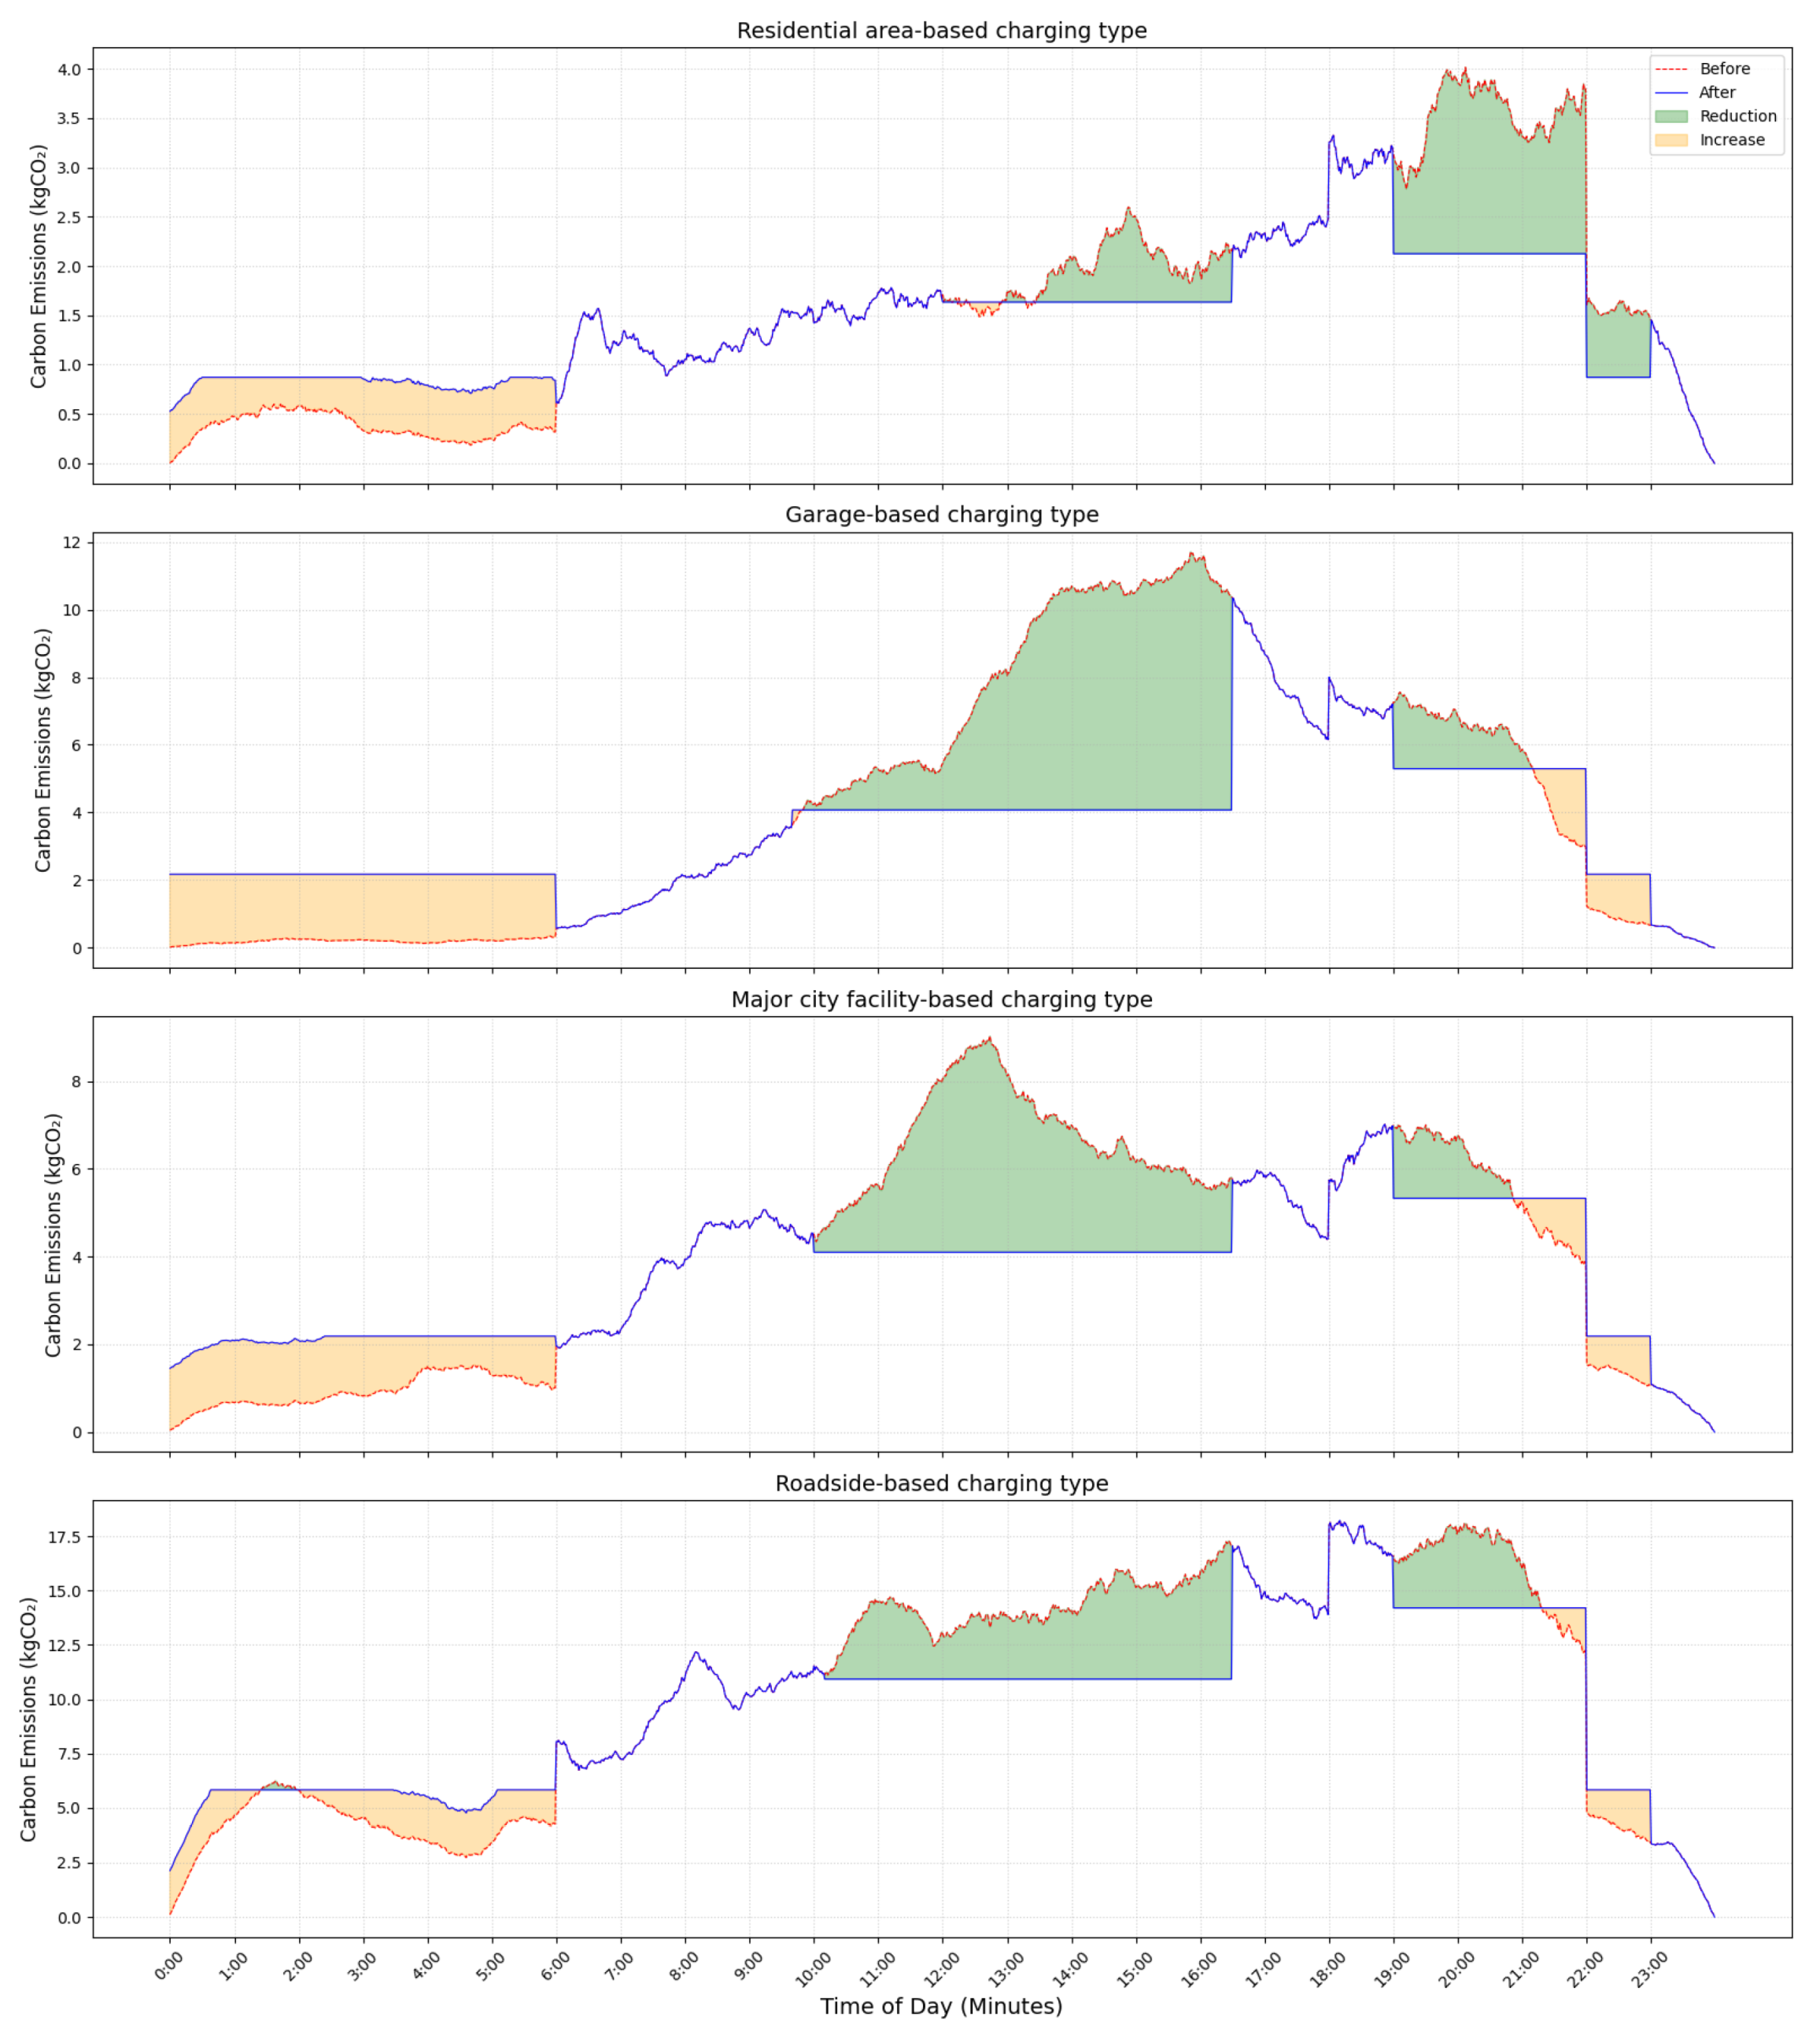
4.3. Impact of the Proposed Solutions on Carbon Emissions

Research on resilient city design centered on V2G solutions is gaining increasing attention. In modern cities, carbon emissions from the transportation sector continue to rise, which its prompting efforts to promote EV adoption and expand the deployment of charging stations as key solutions. Because the use of a mobile ESS is closely related to carbon emissions, it is essential to reduce emissions through its application. Accordingly, strategic EV charging planning is necessary to facilitate the expansion of charging infrastructure. Consequently, the expansion of EV infrastructure and the broader adoption of V2G technologies are poised to enable eco-friendly vehicle charging and contribute significantly to carbon emission reduction.
By distributing energy based on Mobile ESS Charging by Station Type (MECST) and Mobile ESS Discharging by Station Type (MEDST), energy usage can be efficiently managed to support both energy conservation and carbon emission reduction. Carbon reduction is quantified using the Carbon Reduction via Energy Distribution (CRED) method, which calculates the difference in Marginal Emission Factors (MEFs) between charging and discharging periods. As a quantitative indicator, CRED expresses the carbon reduction achieved through energy redistribution between charging stations using a mobile ESS.
The carbon emission factors by fuel type are based on Intergovernmental Panel on Climate Change (IPCC) guidelines. These values are used to calculate the Carbon Emission Factor (CEF) [71]. Values of 94.6 kgCO2/GJ and 56.1 kgCO2/GJ are applied to coal and LNG, respectively. Meanwhile, renewable energy sources such as solar and wind power do not involve combustion processes and are therefore not listed in the table. They are considered to have zero CO2 emissions and are treated as 0 kgCO2/GJ.
Equation (10) calculates the MEF, which represents the final carbon emission coefficient for each time period. The MEF is derived by multiplying the Marginal Share Ratio (MSR) of each fuel type by its corresponding CEF.
MEF t = i MSR i , t · CEF i
The MEF value is applied to Equation (11) by comparing the carbon emissions during the charging and discharging time periods. It serves as a key variable for estimating carbon reduction based on V2G. Table 1 presents the carbon emission factors derived for each time slot.
Figure 12 compares the carbon emissions for each charging station category before and after energy redistribution using the time zone-specific Marginal Emission Factors (MEFs) listed in Table 1. The red dashed line represents emissions prior to redistribution, whereas the blue solid line represents emissions afterwards. Green shading marks intervals in which emissions fall, while orange shading indicates intervals in which they rise owing to diurnal variation in the MEF.
To quantitatively reflect the energy losses during the charging and discharging processes based on a mobile ESS, the discharge loss rate ( η 2 ) is considered. The actual energy charged at charging stations reflects a charging loss rate of η 1 = 0.9 , and a discharging loss rate of η 2 = 0.9 is applied to calculate the effective discharged energy. Subsequently, based on the MEFs presented in Table 1, the carbon reduction amount is derived using Equation (11):
CRED = ct t before , t after E ct , t before t after · MEF t before MEF t after · η 1 · η 2
Carbon reduction is enhanced through the use of V2G solutions, and, by leveraging mobile ESSs for energy distribution between charging stations, a reduction of 271.5 kgCO2 per day can be achieved. As a result, from the perspective of EV charging, the expansion of charging station deployment plays a critical role in promoting EV adoption. Furthermore, a substantial reduction in carbon emissions can be achieved through energy distribution at charging stations using a mobile ESS.

4.4. Economic Feasibility Analysis of the Proposed Solution

To evaluate the economic feasibility and resilience of the proposed system, this study adopts quantitative indicators such as the annual benefit (USD/year), Benefit–Cost Ratio (BCR), and Levelized Cost of Energy (LCOE). These indicators reflect the system’s ability to respond to external factors, ensure long-term applicability, and support energy sovereignty and resilient energy governance. Table 2 summarizes the main variables used for this analysis based on system configuration, market data, and analytical results.
Based on these variables, the annual benefit B t is calculated as in Equation (12):
B t = C CO 2 · p CO 2 + E shifted · p peak
The calculated annual benefit B t is USD 47,860 per year, which indicates that the investment can recover both C a p E x and O p E x over the project lifetime. The BCR, which evaluates economic efficiency by comparing the present value of benefits to costs, is defined in Equation (13):
BCR = t = 1 T B t ( 1 + r ) t C a p E x ( 1 + r ) 0 + t = 1 T O p E x ( 1 + r ) t
The system’s BCR is calculated to be 6.67, indicating strong financial and policy-oriented investment feasibility.
Additionally, the LCOE, which represents the average cost per unit of electricity (MWh) over the system’s lifetime, is defined as shown in Equation (14):
LCOE = C a p E x + t = 1 T O p E x ( 1 + r ) t t = 1 T E t ( 1 + r ) t
As a result, the calculated LCOE is USD 37.78/MWh—below the current electricity market price—confirming the system’s economic competitiveness.
Beyond technological and economic efficiency, the proposed solution also supports the realization of resilient energy governance. Resilience refers to the energy system’s adaptability and recoverability in response to diverse external stressors such as climate change, demand imbalance, policy shifts, and infrastructure failures. These qualities are essential for sustainable and stable energy systems.
Accordingly, the economic indicators—the annual benefit, BCR, and LCOE—can be interpreted from a resilience perspective as follows:
  • An annual benefit exceeding the annualized cost indicates financial autonomy and operational sustainability under market or policy fluctuations.
  • A high BCR demonstrates strong investment return potential and economic recoverability.
  • A low LCOE enhances price elasticity, enabling cost-effective energy supply even under market volatility or supply instability.
These results demonstrate that the proposed system is not only viable under fixed operational conditions but also adaptable to external changes such as policy transitions, price instability, and energy crises, supporting its structural readiness for long-term resilience.

5. Conclusions

This study explores the integration of an intelligent VPP using EV traffic data and demand response technologies tailored to different types of charging stations. As global EV adoption expands, the demand for convenient charging at accessible living hubs is rising, thus increasing the need for a proportional increase in charging stations. By implementing intelligent VPP and V2G solutions, this study aims to enhance the versatility of EV charging, improve charging station management, and provide greater convenience to users. While existing research has explored energy demand governance in charging stations using machine learning, studies on the operation of charging stations by type through unified VPP packaging remain limited. This study distinguishes itself from prior work by analyzing the relationship between rising charging demand, user behavior, EV traffic data, and charging station utilization rates. It proposes a polyfunctional V2G solution that integrates intelligent VPP packaging technology for data-driven carbon reduction, addressing both climate change and growing EV demand. In addition, the study introduces energy demand response technologies tailored to different types of charging stations to further support energy conservation. The advanced techniques introduced in this study significantly improve the state of the art in charging station management and pave the way for future research in this field.
When the proposed technology is linked to energy management in buildings within a city, it can be used as a B2G-linked node capable of energy storage and resupply as a demand source for EV charging. In particular, the interconnection between charging stations, users, and traffic volume is analyzed to achieve an EV-centered virtuous cycle structure by applying V2G solutions in the city. The key technologies of this solution (an intelligent VPP and a mobile ESS) are integrated to play critical roles in achieving three primary goals: (1) strengthening the stability of the energy grid, (2) managing energy sources efficiently, and (3) reducing carbon emissions. This approach demonstrates that carbon emissions can be reduced effectively by using private EVs. The study proposes a series of measures with the dual objectives of promoting energy conservation and enhancing the safety of charging stations.
In addition, it suggests measures for conserving energy and enhancing the safety of charging stations. The proposed approach raises the charging station load factor to 132.7% and cuts daily emissions by 271.5 kgCO2. Each year, it delivers a net benefit of USD 47,860, a BCR of 6.67, and an LCOE of USD 37.78/MWh, confirming strong economic feasibility. These results show that technology provides a practical foundation for simultaneously improving energy efficiency and reducing carbon emissions in real-world EV charging station operations. Consequently, using only EV traffic data, charging station locations, and charging station utilization data, it is possible to design a scenario for the implementation of a sustainable city.

6. Future Research

This paper presents an intelligent demand response strategy that exploits EV traffic and charging station data. Future work will extend the dataset to regional hubs and quantify carbon reduction and energy conservation effects on the city scale. In particular, we aim to balance urban energy flows by interlinking hub-type ESSs—an approach that aligns with the global ESS market, which is expected to be growing at an average annual rate of 38% by 2028, according to the Battery for Energy Storage Systems Market Size 2024–2028 report. Coupling hub-based ESSs with V2G solutions will facilitate a transportation-centered smart city architecture capable of achieving carbon neutrality through sector-specific mitigation, emissions reduction, and energy saving.
In addition, integrating building energy use patterns with EV charging demand should diffuse peak loads, maximize ESS utilization, and channel surplus power into V2G operations. Such an integrated energy flow model will enhance urban resilience and magnify carbon-abatement benefits. Ultimately, the proposed framework offers both practicality and scalability: it can underpin demonstrator projects, inform energy policy, and convert idle building power into V2G resources. Continued analysis of demand and supply data among EVs, chargers, and buildings will further reinforce urban energy resilience and carbon reduction outcomes.

Author Contributions

Conceptualization, S.P., G.Y. and M.-i.C.; methodology, G.Y.; software, G.Y. and S.K.; validation, K.C.; formal analysis, G.Y.; investigation, M.-i.C., K.C. and A.L.; resources, S.K.; data curation, G.Y. and A.L.; writing—original draft preparation, G.Y.; writing—review and editing, M.-i.C.; visualization, G.Y.; supervision, S.P.; project administration, S.P.; funding acquisition, S.P. All authors have read and agreed to the published version of the manuscript.

Funding

This work was supported by the IITP (Institute of Information & Coummunications Technology Planning & Evaluation)–ITRC (Information Technology Research Center) grant funded by the Korea government (Ministry of Science and ICT) (IITP-RS-2024-00436248, 33.4), this work was supported by the Korea Institute of Energy Technology Evaluation and Planning (KETEP) grant, funded by the Korean government (MOTIE) (RS-2024-00398346, ESS Big Data-Based O&M and Asset Management Technical Manpower Training), and this research was supported by the Chung-Ang University Research Scholarship Grants in 2023.

Data Availability Statement

Data are contained within the article.

Conflicts of Interest

The authors declare no conflicts of interest.

Abbreviations and Symbols

The following abbreviations and symbols are used in this manuscript:
BCRBenefit–Cost Ratio
BEMBuilding Energy Modeling
BIMBuilding Information Modeling
CEFCarbon emission factor
CREDCarbon Reduction via Energy Distribution
DERDistributed Energy Resource
ELPDEnergy Load Factor Pre-Distribution
ELPREnergy Load Factor Post-Redistribution
ESSEnergy storage system
EVElectric Vehicle
GJGigajoule
IPCCIntergovernmental Panel on Climate Change
KEPCOKorea Electric Power Corporation
kWhKilowatt-hour
LCOELevelized Cost of Energy (USD/MWh)
LNGLiquefied Natural Gas
MECSTMobile ESS Charging by Station Type
MEDSTMobile ESS Discharging by Station Type
MEFMarginal Emission Factor
Mobile ESSMobile energy storage system
MSRMarginal Share Ratio
V2GVehicle-to-Grid
VPPVirtual Power Plant
P b e f o r e , t Power at time t before redistribution
P a f t e r , t Power at time t after redistribution
Δ P t Change in power at time t due to redistribution
Δ t Time-step interval (h) in load factor calculations
μ k Initial centroid of the k-th cluster in K-means
C i Set of data points in cluster i
E i , demand Total energy demand of cluster i
E i , supply Energy supplied by mobile ESS to cluster i
E i , EV Energy available from private EVs in cluster i
η 1 Charging cycle efficiency factor
η 2 Discharging cycle efficiency factor
B t Annual total benefit (USD/year)
C a p E x Capital expenditure or initial investment (USD)
O p E x Annual operation and maintenance cost (USD/year)
TProject duration or system lifetime (years)
rDiscount rate (%)
E t Annual energy supplied or saved (MWh/year)
E shifted Electricity redistributed via ESS/V2G (MWh/year)
p peak Electricity market price (USD/MWh)
p CO 2 Carbon price (USD/tonCO2)
C CO 2 CO2 reduction (ton/year)

References

  1. Castillo-Calzadilla, T.; Alonso-Vicario, A.; Borges, C.E.; Martin, C. E-Mobility in Positive Energy Districts. Buildings 2022, 12, 264. [Google Scholar] [CrossRef]
  2. Khalili, S.; Rantanen, E.; Bogdanov, D.; Breyer, C. Global Transportation Demand Development with Impacts on the Energy Demand and Greenhouse Gas Emissions in a Climate-Constrained World. Energies 2019, 12, 3870. [Google Scholar] [CrossRef]
  3. Babic, J.; Carvalho, A.; Ketter, W.; Podobnik, V. A data-driven approach to managing electric vehicle charging infrastructure in parking lots. Transp. Res. Part D Transp. Environ. 2022, 105, 103198. [Google Scholar] [CrossRef]
  4. Shareef, H.; Islam, M.M.; Mohamed, A. A review of the state-of-the-art charging technologies, placement methodologies, and impacts of electric vehicles. Renew. Sustain. Energy Rev. 2016, 64, 403–420. [Google Scholar] [CrossRef]
  5. Xie, D.; Shi, X.; Li, K.; Li, J.; Li, G. Nonlinear Impact Analysis of Urban Road Traffic Carbon Emissions Based on the Integration of Gasoline and Electric Vehicles. Buildings 2025, 15, 488. [Google Scholar] [CrossRef]
  6. Kapustin, N.O.; Grushevenko, D.A. Long-term electric vehicles outlook and their potential impact on electric grid. Energy Policy 2020, 137, 111103. [Google Scholar] [CrossRef]
  7. Haghani, M.; Sprei, F.; Kazemzadeh, K.; Shahhoseini, Z.; Aghaei, J. Trends in electric vehicles research. Transp. Res. Part D Transp. Environ. 2023, 123, 103881. [Google Scholar] [CrossRef]
  8. Shafiei, M.; Ghasemi-Marzbali, A. Electric vehicle fast charging station design by considering probabilistic model of renewable energy source and demand response. Energy 2023, 267, 126545. [Google Scholar] [CrossRef]
  9. Will, C.; Zimmermann, F.; Ensslen, A.; Fraunholz, C.; Jochem, P.; Keles, D. Can electric vehicle charging be carbon neutral? Uniting smart charging and renewables. Appl. Energy 2024, 371, 123549. [Google Scholar] [CrossRef]
  10. Tarafdar-Hagh, M.; Taghizad-Tavana, K.; Ghanbari-Ghalehjoughi, M.; Nojavan, S.; Jafari, P.; Mohammadpour Shotorbani, A. Optimizing Electric Vehicle Operations for a Smart Environment: A Comprehensive Review. Energies 2023, 16, 4302. [Google Scholar] [CrossRef]
  11. Saleh, M.; Milovanoff, A.; Daniel Posen, I.; MacLean, H.L.; Hatzopoulou, M. Energy and greenhouse gas implications of shared automated electric vehicles. Transp. Res. Part D Transp. Environ. 2022, 105, 103233. [Google Scholar] [CrossRef]
  12. Dik, A.; Omer, S.; Boukhanouf, R. Electric Vehicles: V2G for Rapid, Safe, and Green EV Penetration. Energies 2022, 15, 803. [Google Scholar] [CrossRef]
  13. Wu, Y.-C.; Kontou, E. Designing electric vehicle incentives to meet emission reduction targets. Transp. Res. Part D Transp. Environ. 2022, 107, 103320. [Google Scholar] [CrossRef]
  14. Yang, K.; Zhang, Q.; Wang, G.; Li, H.; McLellan, B. A new model for comprehensively evaluating the economic and environmental effects of vehicle-to-grid (V2G) towards carbon neutrality. J. Energy Storage 2024, 98, 113067. [Google Scholar] [CrossRef]
  15. Abdullah, H.M.; Gastli, A.; Ben-Brahim, L. Reinforcement Learning Based EV Charging Management Systems–A Review. IEEE Access 2021, 9, 41506–41531. [Google Scholar] [CrossRef]
  16. Leippi, A.; Fleschutz, M.; Davis, K.; Klingler, A.-L.; Murphy, M.D. Optimizing electric vehicle fleet integration in industrial demand response: Maximizing vehicle-to-grid benefits while compensating vehicle owners for battery degradation. Appl. Energy 2024, 374, 123995. [Google Scholar] [CrossRef]
  17. Tepe, B.; Figgener, J.; Englberger, S.; Sauer, D.U.; Jossen, A.; Hesse, H. Optimal pool composition of commercial electric vehicles in V2G fleet operation of various electricity markets. Appl. Energy 2022, 308, 118351. [Google Scholar] [CrossRef]
  18. Muttaqi, K.M.; Isac, E.; Mandal, A.; Sutanto, D.; Akter, S. Fast and random charging of electric vehicles and its impacts: State-of-the-art technologies and case studies. Electr. Power Syst. Res. 2024, 226, 109899. [Google Scholar] [CrossRef]
  19. He, Z.; Khazaei, J.; Freihaut, J.D. Optimal integration of Vehicle to Building (V2B) and Building to Vehicle (B2V) technologies for commercial buildings. Sustain. Energy Grids Netw. 2022, 32, 100921. [Google Scholar] [CrossRef]
  20. Liao, Z.; Taiebat, M.; Xu, M. Shared autonomous electric vehicle fleets with vehicle-to-grid capability: Economic viability and environmental co-benefits. Appl. Energy 2021, 302, 117500. [Google Scholar] [CrossRef]
  21. Zhang, C.; Greenblatt, J.B.; MacDougall, P.; Saxena, S.; Jayam Prabhakar, A. Quantifying the benefits of electric vehicles on the future electricity grid in the midwestern United States. Appl. Energy 2020, 270, 115174. [Google Scholar] [CrossRef]
  22. Varone, A.; Heilmann, Z.; Porruvecchio, G.; Romanino, A. Solar parking lot management: An IoT platform for smart charging EV fleets, using real-time data and production forecasts. Renew. Sustain. Energy Rev. 2024, 189, 113845. [Google Scholar] [CrossRef]
  23. Erdinc, O.; Paterakis, N.G.; Mendes, T.D.P.; Bakirtzis, A.G.; Catalao, J.P.S. Smart Household Operation Considering Bi-Directional EV and ESS Utilization by Real-Time Pricing-Based DR. IEEE Trans. Smart Grid 2015, 6, 1281–1291. [Google Scholar] [CrossRef]
  24. Alabi, T.M.; Lu, L.; Yang, Z. Improved hybrid inexact optimal scheduling of virtual powerplant (VPP) for zero-carbon multi-energy system (ZCMES) incorporating Electric Vehicle (EV) multi-flexible approach. J. Clean. Prod. 2021, 326, 129294. [Google Scholar] [CrossRef]
  25. İnci, M.; Savrun, M.M.; Özgür, Ç. Integrating electric vehicles as virtual power plants: A comprehensive review on vehicle-to-grid (V2G) concepts, interface topologies, marketing and future prospects. J. Energy Storage 2022, 55, 105579. [Google Scholar] [CrossRef]
  26. Türkoğlu, A.S.; Güldorum, H.C.; Şengor, I.; İçek, A.; Erdinç, O.; Hayes, B.P. Maximizing EV profit and grid stability through Virtual Power Plant considering V2G. Energy Rep. 2024, 11, 3509–3520. [Google Scholar] [CrossRef]
  27. Palmiotto, F.; Zhou, Y.; Forte, G.; Dicorato, M.; Trovato, M.; Cipcigan, L.M. A coordinated optimal programming scheme for an electric vehicle fleet in the residential sector. Sustain. Energy Grids Netw. 2021, 28, 100550. [Google Scholar] [CrossRef]
  28. Mwasilu, F.; Justo, J.J.; Kim, E.-K.; Do, T.D.; Jung, J.-W. Electric vehicles and smart grid interaction: A review on vehicle to grid and renewable energy sources integration. Renew. Sustain. Energy Rev. 2014, 34, 501–516. [Google Scholar] [CrossRef]
  29. Lebrouhi, B.E.; Khattari, Y.; Lamrani, B.; Maaroufi, M.; Zeraouli, Y.; Kousksou, T. Key challenges for a large-scale development of battery electric vehicles: A comprehensive review. J. Energy Storage 2021, 44, 103273. [Google Scholar] [CrossRef]
  30. Ramadhani, U.H.; Fachrizal, R.; Shepero, M.; Munkhammar, J.; Widén, J. Probabilistic load flow analysis of electric vehicle smart charging in unbalanced LV distribution systems with residential photovoltaic generation. Sustain. Cities Soc. 2021, 72, 103043. [Google Scholar] [CrossRef]
  31. Soares, J.; Morais, H.; Sousa, T.; Vale, Z.; Faria, P. Day-Ahead Resource Scheduling Including Demand Response for Electric Vehicles. IEEE Trans. Smart Grid 2013, 4, 596–605. [Google Scholar] [CrossRef]
  32. Sarda, J.; Patel, N.; Patel, H.; Vaghela, R.; Brahma, B.; Bhoi, A.K.; Barsocchi, P. A review of the electric vehicle charging technology, impact on grid integration, policy consequences, challenges and future trends. Energy Rep. 2024, 12, 5671–5692. [Google Scholar] [CrossRef]
  33. Kumar, G.M.S.; Cao, S. Conversion of metro railway into smart charging zero-emission transportation hub for supporting electric train, shuttle bus, cars and public EV charging station. Energy Convers. Manag. X 2024, 22, 100552. [Google Scholar] [CrossRef]
  34. Dong, X.-J.; Shen, J.-N.; Liu, C.-W.; Ma, Z.-F.; He, Y.-J. Simultaneous capacity configuration and scheduling optimization of an integrated electrical vehicle charging station with photovoltaic and battery energy storage system. Energy 2024, 289, 129991. [Google Scholar] [CrossRef]
  35. Cao, S. The impact of electric vehicles and mobile boundary expansions on the realization of zero-emission office buildings. Appl. Energy 2019, 251, 113347. [Google Scholar] [CrossRef]
  36. Liu, B.; Zhuo, F.; Zhu, Y.; Yi, H. System Operation and Energy Management of a Renewable Energy-Based DC Micro-Grid for High Penetration Depth Application. IEEE Trans. Smart Grid 2015, 6, 1147–1155. [Google Scholar] [CrossRef]
  37. Choi, M.; Kang, B.; Lee, S.; Park, S.; Beck, J.S.; Lee, S.H.; Park, S. Empirical study on optimization methods of building energy operation for the sustainability of buildings with integrated renewable energy. Energy Build. 2024, 305, 113908. [Google Scholar] [CrossRef]
  38. Damianakis, N.; Mouli, G.R.C.; Bauer, P. Grid impact of photovoltaics, electric vehicles and heat pumps on distribution grids—An overview. Appl. Energy 2025, 380, 125000. [Google Scholar] [CrossRef]
  39. Morrissey, P.; Weldon, P.; O’Mahony, M. Future standard and fast charging infrastructure planning: An analysis of electric vehicle charging behaviour. Energy Policy 2016, 89, 257–270. [Google Scholar] [CrossRef]
  40. Lee, T.; Yoon, G.; Kang, B.; Choi, M.; Park, S.; Park, J.; Park, S. Enhancing Electric Vehicle Charging Infrastructure: A Techno-Economic Analysis of Distributed Energy Resources and Local Grid Integration. Buildings 2024, 14, 2546. [Google Scholar] [CrossRef]
  41. Yang, J.; Wu, F.; Yan, J.; Lin, Y.; Zhan, X.; Chen, L.; Liao, S.; Xu, J.; Sun, Y. Charging demand analysis framework for electric vehicles considering the bounded rationality behavior of users. Int. J. Electr. Power Energy Syst. 2020, 119, 105952. [Google Scholar] [CrossRef]
  42. Yang, D.; Sarma, N.J.S.; Hyland, M.F.; Jayakrishnan, R. Dynamic modeling and real-time management of a system of EV fast-charging stations. Transp. Res. Part C Emerg. Technol. 2021, 128, 103186. [Google Scholar] [CrossRef]
  43. Demirci, A.; Tercan, S.M.; Cali, U.; Nakir, I. A Comprehensive Data Analysis of Electric Vehicle User Behaviors Toward Unlocking Vehicle-to-Grid Potential. IEEE Access 2023, 11, 9149–9165. [Google Scholar] [CrossRef]
  44. Menghwar, M.; Yan, J.; Chi, Y.; Amin, M.A.; Liu, Y. A market-based real-time algorithm for congestion alleviation incorporating EV demand response in active distribution networks. Appl. Energy 2024, 356, 122426. [Google Scholar] [CrossRef]
  45. Zhao, Y.; Jiang, Z.; Chen, X.; Liu, P.; Peng, T.; Shu, Z. Toward environmental sustainability: Data-driven analysis of energy use patterns and load profiles for urban electric vehicle fleets. Energy 2023, 285, 129465. [Google Scholar] [CrossRef]
  46. Lu, J.; Yin, W.; Wang, P.; Ji, J. EV charging load forecasting and optimal scheduling based on travel characteristics. Energy 2024, 311, 133389. [Google Scholar] [CrossRef]
  47. Bouguerra, S.; Bhar Layeb, S. Determining optimal deployment of electric vehicles charging stations: Case of Tunis City, Tunisia. Case Stud. Transp. Policy 2019, 7, 628–642. [Google Scholar] [CrossRef]
  48. Shariatzadeh, M.; Antunes, C.H.; Lopes, M.A.R. Charging scheduling in a workplace parking lot: Bi-objective optimization approaches through predictive analytics of electric vehicle users’ charging behavior. Sustain. Energy Grids Netw. 2024, 39, 101463. [Google Scholar] [CrossRef]
  49. Hammam, A.H.; Nayel, M.A.; Mohamed, M.A. Optimal design of sizing and allocations for highway electric vehicle charging stations based on a PV system. Appl. Energy 2024, 376, 124284. [Google Scholar] [CrossRef]
  50. Chen, Y.; Niu, Y.; Qu, C.; Du, M.; Wang, J. Data-driven-based distributionally robust optimization approach for a virtual power plant considering the responsiveness of electric vehicles and Ladder-type carbon trading. Int. J. Electr. Power Energy Syst. 2024, 157, 109893. [Google Scholar] [CrossRef]
  51. Tian, X.; Zha, H.; Tian, Z.; Lang, G.; Li, L. Carbon emission reduction capability assessment based on synergistic optimization control of electric vehicle V2G and multiple types power supply. Energy Rep. 2024, 11, 1191–1198. [Google Scholar] [CrossRef]
  52. Rehman, M.A.; Numan, M.; Tahir, H.; Rahman, U.; Khan, M.W.; Iftikhar, M.Z. A comprehensive overview of vehicle to everything (V2X) technology for sustainable EV adoption. J. Energy Storage 2023, 74, 109304. [Google Scholar] [CrossRef]
  53. Ruan, G.; Qiu, D.; Sivaranjani, S.; Awad, A.S.A.; Strbac, G. Data-driven energy management of virtual power plants: A review. Adv. Appl. Energy 2024, 14, 100170. [Google Scholar] [CrossRef]
  54. Huang, S.; Liu, W.; Zhang, J.; Liu, C.; Sun, H.; Liao, Q. Vehicle-to-grid workplace discharging economics as a function of driving distance and type of electric vehicle. Sustain. Energy Grids Netw. 2022, 31, 100779. [Google Scholar] [CrossRef]
  55. Ding, T.; Zeng, Z.; Bai, J.; Qin, B.; Yang, Y.; Shahidehpour, M. Optimal Electric Vehicle Charging Strategy With Markov Decision Process and Reinforcement Learning Technique. IEEE Trans. Ind. Appl. 2020, 56, 5811–5823. [Google Scholar] [CrossRef]
  56. Schram, W.L.; Aghaie, H.; Lampropoulos, I.; van Sark, W.G.J.H.M. Insights on the capacity value of photovoltaics, community batteries and electric vehicles. Sustain. Energy Grids Netw. 2021, 26, 100421. [Google Scholar] [CrossRef]
  57. Zakariazadeh, A.; Jadid, S.; Siano, P. Integrated operation of electric vehicles and renewable generation in a smart distribution system. Energy Convers. Manag. 2015, 89, 99–110. [Google Scholar] [CrossRef]
  58. Niu, J.; Li, X.; Tian, Z.; Yang, H. Uncertainty analysis of the electric vehicle potential for a household to enhance robustness in decision on the EV/V2H technologies. Appl. Energy 2024, 365, 123294. [Google Scholar] [CrossRef]
  59. Bie, Y.; Qin, W.; Wu, J. Optimal electric bus scheduling method under hybrid energy supply mode of photovoltaic-energy storage system-power grid. Appl. Energy 2024, 372, 123774. [Google Scholar] [CrossRef]
  60. Wang, A.; Gao, X.; Tang, M. A space variable-scale scheduling method for digital vehicle-to-grid platform under distributed electric energy storage. Appl. Soft Comput. 2023, 133, 109911. [Google Scholar] [CrossRef]
  61. Yu, H.; Niu, S.; Shang, Y.; Shao, Z.; Jia, Y.; Jian, L. Electric vehicles integration and vehicle-to-grid operation in active distribution grids: A comprehensive review on power architectures, grid connection standards and typical applications. Renew. Sustain. Energy Rev. 2022, 168, 112812. [Google Scholar] [CrossRef]
  62. Lo, K.-Y.; Yeoh, J.H.; Hsieh, I.-Y.L. Towards Nearly Zero-Energy Buildings: Smart Energy Management of Vehicle-to-Building (V2B) Strategy and Renewable Energy Sources. Sustain. Cities Soc. 2023, 99, 104941. [Google Scholar] [CrossRef]
  63. Ucer, E.; Koyuncu, I.; Kisacikoglu, M.C.; Yavuz, M.; Meintz, A.; Rames, C. Modeling and Analysis of a Fast Charging Station and Evaluation of Service Quality for Electric Vehicles. IEEE Trans. Transp. Electrif. 2019, 5, 215–225. [Google Scholar] [CrossRef]
  64. Durdyev, S.; Dehdasht, G.; Mohandes, S.R.; Edwards, D.J. Review of the Building Information Modelling (BIM) Implementation in the Context of Building Energy Assessment. Energies 2021, 14, 8487. [Google Scholar] [CrossRef]
  65. Choi, H.-S. Experimental Infrastructure Design for Energy-Independent Car Park Building Based on Parametric Photovoltaic Facade System. Appl. Sci. 2024, 14, 8448. [Google Scholar] [CrossRef]
  66. Winschermann, L.; Bañol Arias, N.; Hoogsteen, G.; Hurink, J. Assessing the value of information for electric vehicle charging strategies at office buildings. Renew. Sustain. Energy Rev. 2023, 185, 113600. [Google Scholar] [CrossRef]
  67. Motalebi, M.; Rashidi, A.; Nasiri, M.M. Optimization and BIM-based lifecycle assessment integration for energy efficiency retrofit of buildings. J. Build. Eng. 2022, 49, 104022. [Google Scholar] [CrossRef]
  68. Ciccozzi, A.; Santavicca, A.; de Rubeis, T.; Ambrosini, D. BIM-BEM interoperability for energy analysis: A comparative study of different strategies. Energy Rep. 2025, 13, 4705–4718. [Google Scholar] [CrossRef]
  69. Bañol Arias, N.; Hashemi, S.; Andersen, P.B.; Træholt, C.; Romero, R. Assessment of economic benefits for EV owners participating in the primary frequency regulation markets. Int. J. Electr. Power Energy Syst. 2020, 120, 105985. [Google Scholar] [CrossRef]
  70. Khowaja, A.; Dean, M.D.; Kockelman, K.M. Quantifying the emissions impact of repurposed electric vehicle battery packs in residential settings. J. Energy Storage 2022, 47, 103628. [Google Scholar] [CrossRef]
  71. IPCC. 2006 IPCC Guidelines for National Greenhouse Gas Inventories, Volume 2: Energy; Eggleston, H.S., Buendia, L., Miwa, K., Ngara, T., Tanabe, K., Eds.; Institute for Global Environmental Strategies (IGES): Hayama, Japan, 2006; Chapter 2: Stationary Combustion. [Google Scholar]
  72. U.S. Environmental Protection Agency. Report on the Social Cost of Greenhouse Gases: Estimates Incorporating Recent Scientific Advances; U.S. Environmental Protection Agency: Washington, DC, USA, 2023.
  73. Korea Power Exchange. System Marginal Price (SMP) Statistics Portal; Korea Power Exchange: Seoul, Republic of Korea, 2024. [Google Scholar]
  74. U.S. Department of Energy. Battery Electric Vehicles Have Lower Scheduled Maintenance Costs; U.S. Department of Energy: Washington, DC, USA, 2021.
  75. Alternative Fuels Data Center. Operation and Maintenance for Electric Vehicle Charging Infrastructure; U.S. Department of Energy: Washington, DC, USA, 2023.
  76. U.S. Department of Energy. DOE FY 2025 Budget Justification, Volume 4; Office of the Chief Financial Officer: Washington, DC, USA, 2024.
Figure 1. Purpose of V2G solutions integrating a VPP and mobile ESS.
Buildings 15 02045 g001
Figure 2. Operation methods of V2G solution.
Buildings 15 02045 g002
Figure 3. Three-layer V2G solution architecture.
Buildings 15 02045 g003
Figure 4. V2G and mobile ESS suitability of private and commercial EVs.
Buildings 15 02045 g004
Figure 5. Traffic volume and user count over time.
Buildings 15 02045 g005
Figure 6. Impact of EV traffic data on energy demand.
Buildings 15 02045 g006
Figure 7. Charging amount by type of charging station.
Buildings 15 02045 g007
Figure 8. Energy demand governance process for energy conservation.
Buildings 15 02045 g008
Figure 9. Energy demand response via VPP packaging.
Buildings 15 02045 g009
Figure 10. Application of polyfunctional V2G solution.
Buildings 15 02045 g010
Figure 11. Energy distribution graph for energy governance.
Buildings 15 02045 g011
Figure 12. Carbon emissions before and after energy redistribution.
Buildings 15 02045 g012
Table 1. MEF by time slot.
Time Slot00:00–06:0006:00–18:0018:00–22:0022:00–24:00
MEF ( kg · CO 2 / kWh )0.320.600.780.32
Table 2. Variables for economic feasibility assessment.
ItemSymbolValueDescription
Annual CO2 Reduction C CO 2 271.5Reduction based on EV charging load shift
Carbon Price [72] p CO 2 100Market or SCC-based unit price
Shifted Electricity E shifted 190Electricity redistributed via ESS and V2G
Electricity Market Price [73] p peak 109System marginal price (SMP) average
Initial Infrastructure Cost C a p E x 45,000V2G chargers and mobile ESS infra cost
Annual O&M Cost [74,75]OpEx1350Operation and maintenance
System LifetimeT10Project evaluation period
Discount Rate [76]r5Commonly used for ESS/LCOE assessments
Annual Energy Supplied E t 190Estimated annual energy benefit
Disclaimer/Publisher’s Note: The statements, opinions and data contained in all publications are solely those of the individual author(s) and contributor(s) and not of MDPI and/or the editor(s). MDPI and/or the editor(s) disclaim responsibility for any injury to people or property resulting from any ideas, methods, instructions or products referred to in the content.

