Article

Enhancing Readability in Construction Safety Reports Using a Two-Step Quantitative Analysis Approach

1
Department of Business Administration and Safety Engineering, Seoul National University of Science and Technology, Seoul 01811, Republic of Korea
2
Department of Safety Engineering, Seoul National University of Science and Technology, Seoul 01811, Republic of Korea
3
Department of Civil & Mineral Engineering, University of Toronto, 27 King’s College Cir, Toronto, ON M5S 1A1, Canada
4
Department of Safety Management, Korea South-East Power Co., 32 Sadeul-ro 123beon-gil, Jinju-si 52852, Republic of Korea
*
Author to whom correspondence should be addressed.
Buildings 2025, 15(12), 1994; https://doi.org/10.3390/buildings15121994
Submission received: 9 May 2025 / Revised: 4 June 2025 / Accepted: 6 June 2025 / Published: 10 June 2025

Abstract

This study addresses the limitations of South Korea’s Design for Safety (DfS) reports, which are a critical component of construction safety reports (CSRs) but rely heavily on text, limiting readability and visual comprehension. While previous studies have highlighted the readability challenges in construction safety documents, few have quantitatively combined layout and readability assessments using objective metrics. To enhance information delivery, this research proposes an improved CSR format and quantitatively evaluates its effectiveness compared to the conventional format. A two-step analysis was conducted using document layout analysis, pixel-based methods, and the Flesch Reading Ease Score (FRES) to assess layout and readability. The results showed that conventional CSRs consist of nearly 100% text, while the improved format integrates approximately 70% images and 30% text, enhancing visual clarity without altering content. The improved format achieved a higher average FRES score of 50.24 compared to 44.52 for the conventional format, indicating a 1.12-fold increase in readability. These findings suggest that the improved CSR format significantly enhances comprehension and information delivery. The proposed quantitative analysis method offers a practical approach for evaluating and improving document design in construction safety, and it can be applied to other fields to improve the effectiveness of written communication.

1. Introduction

1.1. Background of Research

In the dynamic and complex sector of construction, the success of projects across their entire lifecycle is a collaborative effort involving a diverse array of stakeholders [1,2,3,4]. This endeavor is underscored by the generation of a huge amount of project-related information [5]. Information generated throughout the project is recorded and stored in documents [6]. Construction-related documents serve not only as presentations of information but also play a crucial role as a medium for effective communication among project stakeholders [7,8]. Among the diverse documentation, reports stand out as the most frequently generated, offering a contrast to contracts and drawings [9,10]. These reports are systematically produced to track ongoing developments in design, construction, and oversight, ensuring a comprehensive view of the advancement of the project [11].
Although there are many types of reports, there has been growing interest in utilizing construction safety reports (CSRs) to prevent and mitigate accidents [12]. CSRs are a key tool for maintaining and managing safety on construction sites, conveying the risks of site tasks based on accident cases [13]. These reports facilitate communication among project participants, contributing to accident prevention and management [14].
For construction safety management, each country has representative CSRs, such as Design for Safety (DfS) in South Korea, Construction Design and Management (CDM) in the United Kingdom, and the Safe Work Method Statement (SWMS) in Australia. These CSRs can be used as preventative measures during the construction phase and for learning from accident cases to prevent future incidents [15]. In South Korea, construction designers create a DfS, which includes measures to reduce hazardous risk factors at the construction site [16]. In the United Kingdom, CDM mandates the inclusion of health and safety management in planning and design during the construction process [17]. The CDM 2015 regulations specify the creation of a Construction Phase Plan as a principal duty, outlining plans to safely complete work involving risk factors [18]. In Australia, the SWMS is prepared to perform high-risk construction work, detailing the process of risk identification and risk assessment to ensure safe work practices [19]. Thus, CSRs are utilized in various ways according to the regulations and purposes of each country.
While CSRs, with their numerous advantages for accident prevention, are expected to be actively utilized in each country, not all countries are utilizing them completely. In particular, their use in South Korea is not as prevalent, which can be attributed to several issues. CSRs in South Korea adopt a text-centric structure, facing limitations in the visual transmission of information and readability [20]. Akal [21] identified the text composition of bidding documents as a factor hindering readability in an analysis study of 34 subcontract bids. Additionally, Koc and Pelin Gurgun [22] found that “lack of visual representation” in construction contract documents could lead to conflicts. These issues can prevent the effective transmission of crucial information for accident prevention at construction sites, potentially leading to construction accidents [23].
Kang et al. [24] compared three types of American Association of Orthodontists (AAO) consent forms: the original AAO consent form, a readability-enhanced AAO consent form, and an AAO consent form enhanced with both readability and visual aids. They evaluated the improvement in patient and parent memory and comprehension by asking 90 pairs of patients and parents 18 questions. The study concluded that the consent form enhanced with visual aids significantly improved patient and parent memory and comprehension compared to the form with only improved readability. This result emphasizes the crucial role of high readability and visual information in enhancing memory and comprehension. While this example is drawn from the healthcare field, the underlying principle of improved comprehension through visual and readable materials is equally applicable to construction safety. Construction workers and site managers, like patients, need to understand complex safety information under time constraints and stress. Therefore, enhancing the readability and visual materials of construction safety reports could similarly yield better outcomes compared to text-centric reports, ensuring that critical safety messages are effectively conveyed. However, to verify if these improvements are genuinely effective, quantitative evaluation is required, and appropriate evaluation metrics need to be established.
There are various evaluation metrics for assessing documents. Waller [25] proposed the following criteria for evaluating what constitutes a good document: language criteria, design criteria, relationship criteria, and content criteria. Among these, readability is used as a sub-criterion for language criteria, and layout is used as a sub-criterion for design criteria.
Readability originates from the close relationship between the text and the reader, referring to the ease with which a reader can process and understand written text [26]. In other words, it indicates how easily a text can be understood considering the interaction between various text variables and the characteristics of the reader [27]. Hence, when measuring readability, it is important to consider not only the text itself but also the ability of the reader to understand the text [28]. However, assessing readability solely based on the linguistic characteristics of the text without considering the level of understanding or the background of the reader can be challenging. Therefore, assessing readability solely based on the linguistic characteristics of the text should be evaluated using formulas or indices [29]. Hence, various readability assessment indices can be utilized, with the Flesch readability test being a commonly used index [30]. Additionally, the layout of the report plays a crucial role in evaluating its readability [31]. Layout refers to the visual arrangement of a document, organizing and highlighting information to capture the attention of the reader [32]. A well-structured layout arranges information logically and consistently, reducing the cognitive load on readers and making it easier to locate important information [33]. This reduces the effort required for readers to read and understand the document, ultimately enhancing readability [34]. Therefore, readability and layout are closely related, and considering both factors together is essential for improving the overall quality and effectiveness of a document [31].
This study proposes an improved construction safety report by adding visual aids (images) to the existing text-centric reports. To verify the effectiveness of this improved report, the study will use two evaluation criteria: readability and layout.

1.2. Literature Review

There are various evaluation criteria for assessing documents, but this study focuses on readability and layout. Accordingly, we first analyzed previous studies that evaluated both the readability and layout of documents.
In the construction field, Sinyai et al. [35] identified ongoing issues with the readability and suitability of construction occupational safety and health materials for workers. This study aims to review examples of construction occupational safety and health materials to investigate how well these materials meet established readability and suitability standards. Using the standard online readability calculator (readability-score.com; accessed on 24 September 2024), the text’s difficulty was assessed, and the SMOG and Flesch–Kincaid formulas were used to generate grade level ratings required for understanding specific texts. Furthermore, the suitability was evaluated using the Suitability Assessment of Materials (SAM) and the Clear Communication Index (CCI), which comprehensively assess various factors including reading grade level and typography, in addition to layout factors. Through this, writers and publishers of construction occupational safety and health materials can identify opportunities to improve their materials by utilizing the readability and suitability testing tools presented in this study.
In fields other than construction, Liu et al. [36] evaluated the readability and layout of patient information leaflets (PILs) for cardiovascular disease and type 2 diabetes medications provided in the UK to determine if these leaflets are appropriate for use by older adults. The layout criteria for PILs were based on the guidelines from the European Union (EU) and the Medicines and Healthcare products Regulatory Agency (MHRA). The readability of the PILs was assessed using the Gunning Fog Index formula. This combined evaluation highlighted the need to improve both the layout and readability of the current leaflets.
Synthesizing the findings from previous studies, it is emphasized that evaluating both readability and layout through various evaluation tools highlights the need for document improvement. However, studies that evaluate both readability and layout together are limited. Moreover, the study by Liu et al. [36] did not use quantitative evaluation tools for layout but relied on qualitative assessments using EU and MHRA guidelines, which affected the study’s validity. For this reason, there is a need to develop new methodologies that use quantitative evaluation tools to assess both readability and layout together.
The quantitative evaluation tools used in previous studies to assess readability and layout were analyzed. First, studies that evaluated the readability of documents using quantitative evaluation tools were investigated.
Hall [37] evaluated the readability of original research articles published in surgical journals using the Flesch Reading Ease Index. The aim was to suggest a target Flesch Reading Ease Score for authors when writing manuscripts. The study calculated the Flesch Reading Ease Scores for 30 original articles published in Archives of Surgery, the British Journal of Surgery, and the ANZ Journal of Surgery in 2005. The results showed that the average scores for each journal were 12.4 (Archives of Surgery), 14.4 (British Journal of Surgery), and 18.6 (ANZ Journal of Surgery), concluding that original research articles published in surgical journals are difficult to read.
Emanuel and Boyle [38] collected and analyzed informed consent documents from four phase III clinical trials for COVID-19 vaccines to evaluate how difficult these documents were to read. The Flesch–Kincaid Grade Level (FKGL) was used to determine the grade level required to understand specific texts, and the Flesch Reading Ease Score (FRES) was applied to assess texts’ difficulty. The study found that all informed consent documents required a reading level of 9th grade or higher, with an average Flesch Reading Ease Score of 52.4, indicating a difficult reading level. The authors concluded that the informed consent documents for COVID-19 vaccine trials are difficult for the general public to understand.
Next, studies that evaluated the layout of documents using quantitative evaluation tools were investigated.
Reinert et al. [39] analyzed nine patient consent forms from a phase III clinical neuro-oncology study conducted at a German brain tumor center to evaluate their quality. The quality evaluation criteria included layout, readability, and ethical aspects, among others. The layout was evaluated based on three criteria: Well-Structured Information, Helpful Graphics, Symbols, or Figures, and Study Flow Chart. Each criterion was scored up to three points using specific evaluation criteria and scoring systems to quantitatively assess the layout of the documents.
Sinyai et al. [35] investigated how well 103 construction occupational safety and health materials met established readability and suitability standards. Suitability was evaluated using a checklist that included 22 items, some of which assessed layout factors. Each item was scored as 2 (excellent), 1 (adequate), or 0 (inadequate), using this scoring system to quantitatively determine how effectively the layout of the documents was structured.
The analysis of studies using quantitative evaluation tools to assess readability and layout revealed the following findings.
First, previous studies have applied various readability evaluation tools and layout scoring systems to different types of documents. However, unlike readability evaluation tools (e.g., Flesch Reading Ease, Flesch–Kincaid Grade Level), layout evaluation tools lack specific quantitative evaluation methods. Readability evaluation tools can assign scores based on predefined formulas, whereas layout evaluations can vary based on the evaluator’s subjective interpretation. For example, criteria, such as “Well-Structured Information” or “Helpful Graphics” in [39], can differ based on the evaluator’s understanding and interpretation. This variability can lead to inconsistent evaluation results for the same document, reducing the consistency of the evaluation. Therefore, it is necessary to select objective and consistent quantitative evaluation tools to jointly assess readability and layout and develop new methodologies for effectively evaluating documents.
Second, most existing studies analyzed readability and layout with a sample size of fewer than 30 documents. However, a small sample size makes it difficult to generalize the findings to the entire population, and the results based on such data cannot be considered reliable.
Therefore, the following research questions can be proposed. (i) How can methodologies for evaluating readability and layout be suggested? (ii) How can the results of readability be ensured with a small sample size?
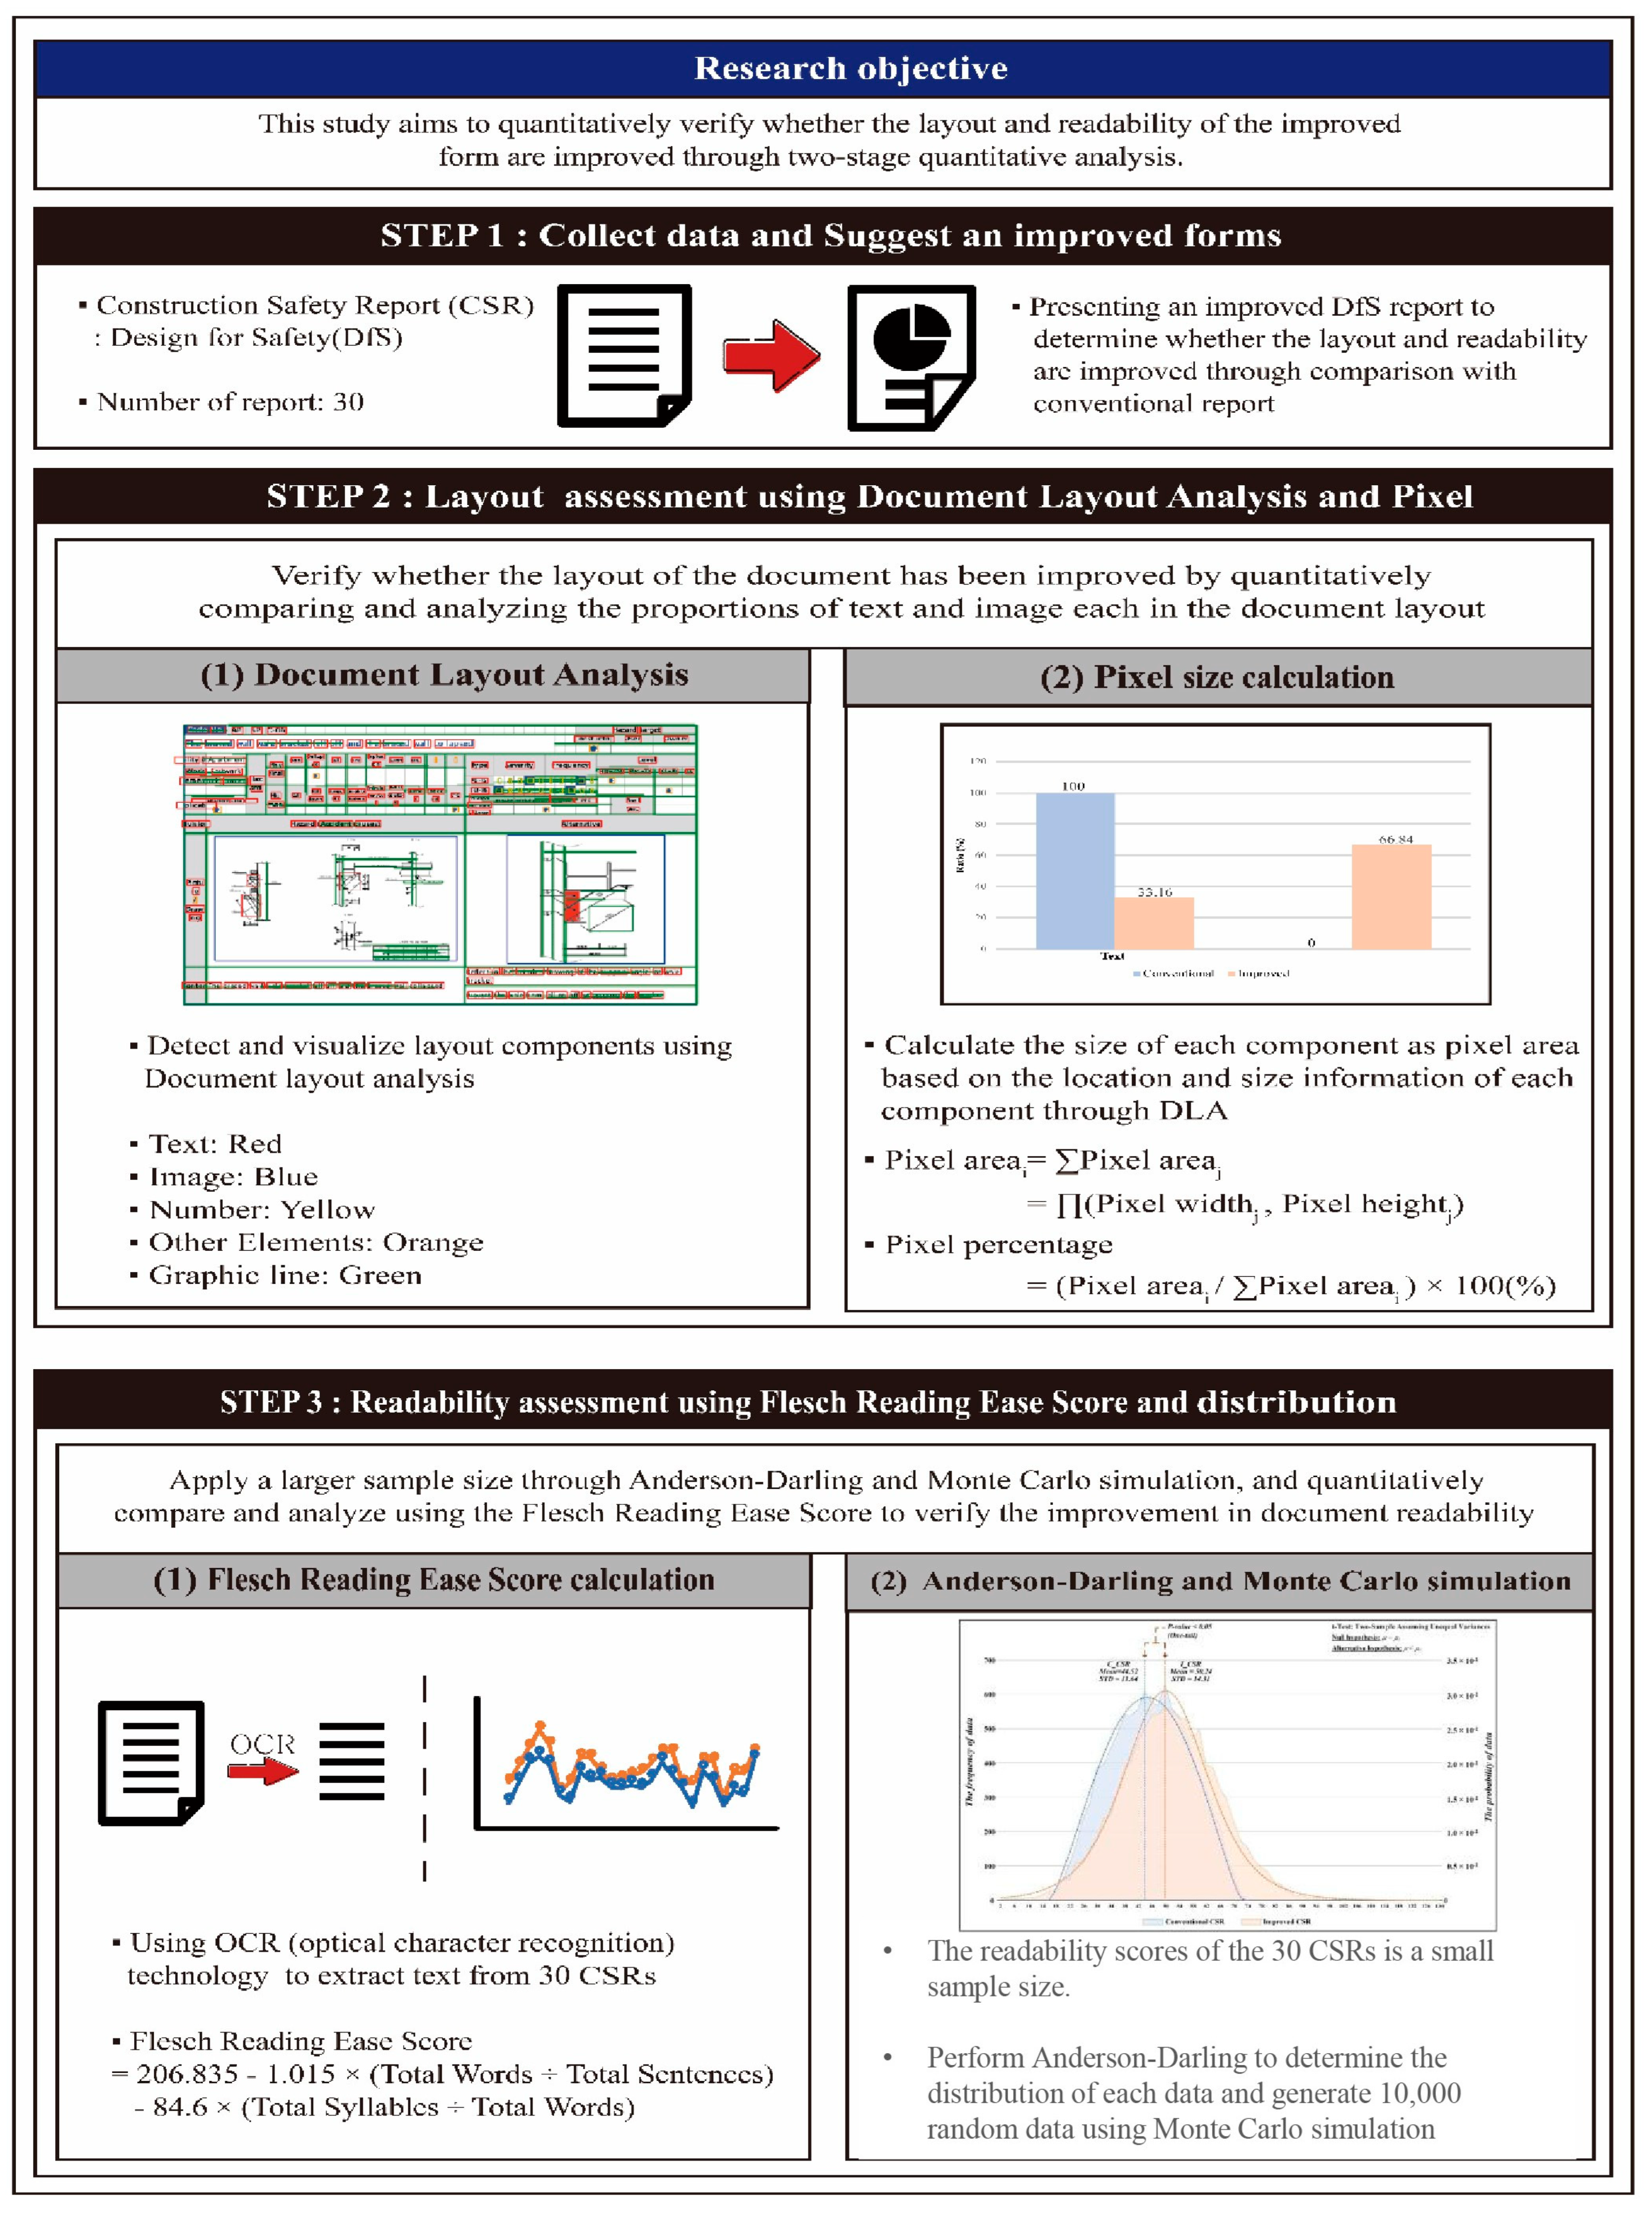
Based on the existing literature, this study aims to confirm the improvement of layout and readability in the enhanced construction safety report using a two-step quantitative analysis method: document layout analysis and a pixel-based method and the Flesch Reading Ease Score. Additionally, as mentioned in previous studies, the reliability of validation results may not be sufficient due to a small sample size. To address this, we propose a framework that utilizes Monte Carlo simulation to generate 10,000 random samples, thereby producing more reliable results.
This paper is structured as follows. Section 1 introduces the background and rationale for the study. Section 2 details the materials and methods used, including data collection, document layout analysis, and readability assessment. Section 3 presents the results of the analysis. Section 4 discusses the findings in the context of existing research and practical implications. Finally, Section 5 concludes the paper with a summary of contributions and suggestions for future research.

2. Materials and Methods

This study proposes an improved construction safety report by adding visual materials (images) to the conventional text-centered reports and conducts a quantitative evaluation using document layout analysis and the Flesch Reading Ease formula to verify its effectiveness. The aim is to confirm the improvement in the layout and readability of the improved construction safety reports. The study is conducted in three phases, as follows.
First, this study collects 30 Design for Safety (DfS) reports. Then, it proposes 30 improved reports with added visual materials (images) to improve the conventional text-centered DfS. The effectiveness of these enhanced reports is then verified through the following steps. Second, the ratio of layout components (text and images) in the reports is calculated through document layout analysis and pixel analysis. This quantitatively verifies the improvement in the layout. Third, the Flesch Reading Ease formula, an indicator for evaluating the ease of reading text, is used to verify the improvement in readability. However, considering that the sample size of 30 reports may be insufficient to detect statistically significant differences, additional analyses are performed. In cases where the sample size is inadequate, Monte Carlo simulations are utilized to generate 10,000 random readability scores to derive more reliable results. This approach aims to estimate the characteristics of the population by generating a larger scale of random data based on the readability scores obtained from the limited dataset. This approach reduces statistical uncertainty due to limited data and contributes to a more reliable evaluation of the readability improvement of the improved CSR. The overall research framework is shown in Figure 1.

2.1. Collection of Data

The CSR utilized in South Korea’s construction industry primarily encompasses DfS and the Safety and Health Design Record [40]. Although operated under different legislation, it is assessed that there is no significant difference in the contents of these two reports [41]. Therefore, for improving CSR in South Korea, if one format can be selected for proposing improvements, it is expected that the same approach can be applied to the other format, as well. Hence, in this study, the authors chose to focus on DfS reports, which are extensively researched globally. DfS was introduced in 2016 to enhance construction safety in South Korea [42]. It involves identifying potential hazards in the early design stages of construction projects and mitigating or eliminating them throughout the project phases to ensure safety during construction [43]. For effective analysis and results, 30 DfS reports issued by public agencies were collected as the conventional CSR. Afterwards, we proposed 30 improved CSRs with added visual data (pictures) to improve the conventional text-based CSR. The formats of the conventional CSR and improved CSR are shown in Figure 2 and Figure 3, respectively. The comparison of the components between the conventional and improved CSR formats is presented in Table 1. In this study, the comparison of the components between the two CSR formats yielded several differences between the conventional CSR and the improved CSR. In the conventional CSR, certain components were omitted, whereas the improved CSR has supplemented these by providing richer information through text and images. First, items, such as titles, facility types, final versions, and elements, not listed in the conventional CSR were added in text form in the improved CSR. Additionally, in the improved CSR, sections like hazard (accident causes) and hazard reduction measures (alternatives) are visually presented using images. However, some items present in the conventional CSR were omitted in the improved CSR, including reduced measures by third parties, remaining hazards, evaluation aspect and purpose, the evaluation table for alternatives, and notes. This comparison reveals that the transition from conventional CSR to improved CSR did not alter the existing common information; rather, parts of the text were simply replaced with images.

2.2. DLA and Pixel-Based Report Evaluation

As a result of analyzing the above components, it was found that the text sections were simply replaced with images. To quantitatively confirm this, a DLA analysis was conducted. In this study, the authors aim to detect and visualize layout components using DLA, followed by the quantification of the pixel area size of each component based on the DLA results. Specifically, the authors analyzed how the ratio of layout components changed in the improved CSR compared to the conventional CSR, aiming to verify the improvements in the layout structure of the document. Hence, 30 samples of conventional and improved CSRs were analyzed and compared.

2.2.1. Extraction of Document Layout

DLA identifies and categorizes areas of interest within document images [44]. It involves finding the relationships and positions of document layout components, such as text and visual information (tables, figures, and charts), and other elements [45]. There are two fundamental approaches to DLA: bottom–up and top–down. The bottom–up approach analyzes the document from the level of small elements, like pixels, building up to the overall layout [46]. This method is useful for understanding the detailed characteristics of the document and accurately comprehending its structure [47]. Conversely, the top–down approach starts with large document areas, dividing the document into smaller areas, such as text, images, lines, etc. [48]. This method processes large document areas first, allowing for the sequential identification of detailed elements, which aids in understanding the overall structure [47]. This study employs a top–down approach to comprehend the overall structure of the document. The DLA analysis process using the top–down approach is as follows. First, to analyze the CSR layout stored in PDF format, the PDF page was converted to an image, and then image processing was performed using OpenCV. OpenCV is a powerful library for image and video processing, providing various functions, such as image loading, conversion, analysis, and object recognition [49]. Using the OpenCV library, PDF document pages undergo conversion from color to grayscale, thereby facilitating the computational identification of shapes and patterns within the document [50].
After image processing, the Canny algorithm was used to detect edges for line detection [51]. Edges represent parts of the image that delineate the contours of objects [52]. After obtaining information about the contours of objects in the image through edge detection, Hough Transform was used to detect lines [53]. Hough Transform is a technique used to find straight lines in an image, analyzing edge information found in the edge detection stage [54]. This process allows for the determination of the coordinates of the detected lines [55].
Subsequently, the process proceeds to the identification of text, images, numbers, other components, and graphical elements. The detected lines through image processing and edge detection are visualized by using bounding boxes [56]. These bounding boxes are created by drawing a square on the detected line coordinate to visually represent the component [57]. Bounding boxes created around text, images, numbers, and other elements are marked in specific colors. The characteristic colors for each component are defined as follows:
  • Text: Text is marked in red and identified by the presence of alphabetic characters.
  • Numbers: Numbers are marked in yellow and identified when they exclusively contain numerical characters within text elements.
  • Images: Images are marked in blue and identified as pictures or photographs within the PDF document.
  • Other elements: All other components are marked in orange and distinguished from text, numbers, images, and graphic lines.
  • Graphic lines: Lines are marked in green and automatically detected through image processing and line detection processes. As graphic lines are not included in the analysis, they are not applied to subsequent pixel size calculation tasks.

2.2.2. Calculation of Pixel Size

A pixel represents the smallest unit of a digital image [58]. Based on the previously determined location and size information of each element, the size of each component is calculated in terms of pixel area. In this process, document components are classified into two main categories for calculation: text (text, numbers, and other elements) and images.
First, the pixel area of each component and the total area are calculated, as shown in Equation (1):
P i x e l   a r e a i = P i x e l   a r e a j = ( P i x e l   w i d t h j ,   P i x e l   h e i g h t j )
where Pixel areai means an area with a specific pixel range along with the ith color, Pixel areaj means an area with the jth pixel range, Pixel widthj means the width of the jth pixel, Pixel heightj means an area with the jth pixel range, and jth means the rectangle for the image and text in the DfS.
Subsequently, the relative size occupied by each component within the total area was calculated, as shown in Equation (2):
P i x e l   p e r c e n t a g e = P i x e l   a r e a i P i x e l   a r e a i × 100 ( % )
With these calculations, the authors quantitatively compared and analyzed how much text and images occupy the document layout, thereby verifying the improvement in the structure and layout of the document.

2.3. Verification of Improvement in Readability Based on the FRES

Based on the DLA analysis results from Section 3.2, the improvement in layout was verified through structural analysis. According to previous research, readability and layout are closely related, and a clearly organized layout can enhance readability [34]. Therefore, readability should be considered alongside layout. Consequently, the authors conducted a readability assessment for each report, along with a layout evaluation using DLA.
For readability assessment, various formulas can be employed [59]. Prominent among these are the FRES and FKGL, which are extensively used [60]. The FRES is one of the oldest readability formulas, and it is widely used by government agencies and organizations, recognized across various countries and academic research fields, and adopted by many researchers as a popular readability assessment tool [61,62]. Therefore, in this study, the authors employed the FRES to quantitatively verify the improvement in readability. The FRES is calculated based on the number of words, sentences, and syllables in the document [63], as shown in Equation (3):
F l e s c h   R e a d i n g E a s e   S c o r e   = 206.835 1.015 × ( T o t a l   W o r d s   ÷   T o t a l   S e n t e n c e s )     84.6 × ( T o t a l   S y l l a b l e s   ÷   T o t a l   W o r d s )
The FRES is typically expressed within a range of 0–100, with higher scores indicating easier readability of the text [64]. Based on the evaluation results of each test, it is explained that scores above 50 require the comprehension level of a high school student [65]. The authors compared the readability of conventional and improved CSRs to verify how much the readability of the improved CSR had improved compared to the conventional CSR. The process for calculating the Flesch Reading Ease Score is as follows. First, it is necessary to extract text from PDF documents. For text extraction, OCR (Optical Character Recognition) technology was used. Specifically, in the Python programming environment (version 3.12.5), the pytesseract library was utilized to employ the Tesseract OCR engine. The Tesseract OCR engine, developed by Google, is a powerful open-source OCR tool that supports character recognition in various languages [66]. After the initial text extraction, it was found that the extracted text data contained errors and omissions. Therefore, a manual text correction process was applied to improve accuracy. This process involved checking the extracted text line by line against the original CSR documents and ensuring missing words were added and sentence structures were restored for clarity. To ensure consistency and objectivity during manual correction, the following guidelines were followed: (i) all corrections were performed by two independent reviewers with experience in construction safety documentation; (ii) a checklist of common errors (e.g., missing section titles, incomplete hazard descriptions) was used; and (iii) ambiguous corrections were cross-validated by comparing multiple report samples. The corrected text data were then input into an online text analysis tool to measure the number of words, sentences, and syllables per page. Based on these measured values, the Flesch Reading Ease Score was directly calculated by substituting the values into the calculation formula.
The readability scores of the 30 samples of conventional and improved CSRs represent a fraction of the population and are intended to analyze the statistical characteristics of the population. However, initial evaluations with a limited dataset present challenges in fully reflecting the characteristics of the entire population [67]. When the sample size is small, the results of statistical tests entail uncertainty, and Monte Carlo simulation has traditionally been employed to address this issue of uncertainty [68]. Accordingly, our analysis began by conducting an Anderson–Darling goodness-of-fit test (A-D test) on the readability scores of the 30 samples of conventional and improved CSRs to assess data distribution. Subsequently, we employed Monte Carlo simulation to generate random data, aiming to achieve a more detailed understanding of the population’s characteristics. The A-D test is a statistical method that fits the given data to various probability distributions to determine which distribution best explains the data [69]. The A-D value is a measure of goodness of fit obtained from the A-D test, indicating the difference between the given data and a specific distribution [70]. The smaller the A-D value calculated from the A-D test, the more closely the distribution matches the given data [71]. Following the A-D test applied to various probability distributions for the given data, the distribution of the readability scores of the 30 samples of conventional CSR was found to fit the beta distribution (A-D value: 0.1591). The beta distribution of the conventional dataset is shown in Equation (4):
f ( x ; α , β ) = x α 1 ( 1 x ) β 1 B ( α , β )
The readability scores of the 30 samples of the improved CSR yield the smallest A-D value of 0.1966 for the logistic distribution, suggesting that this distribution closely matches the data from the 30 improved CSR samples. The logistic distribution for the improved dataset is defined as shown in Equation (5):
f ( x ; μ , s ) = e ( x μ ) / s s ( 1 + e ( x μ ) / s ) 2
After determining the data distribution using the A-D test, Monte Carlo simulation was used to generate random data from the defined probability distributions. Monte Carlo simulation refers to a probabilistic process specifically aimed at facilitating decision making under uncertain circumstances [72]. The objective of Monte Carlo simulation is to draw samples from the probability distributions assumed in the model to generate random variables [73]. The essence of this process is random sampling [74]. Because random samples effectively represent the population, their statistical values provide good estimates for the parameters [75]. Therefore, following the A-D test, random numbers were generated from each identified probability distribution, and these random numbers were used to extract data equivalent to the desired sample size [76].
In this study, Monte Carlo simulation was employed to generate 10,000 random readability scores. This approach aims to estimate the characteristics of the population by generating a larger scale of random data based on the readability scores obtained from the limited dataset.

3. Results

3.1. Overview of the Evaluation Process

This study employed a systematic evaluation process to assess the effectiveness of the improved construction safety reports (CSRs) in terms of layout and readability. The evaluation process was conducted in the following three key steps: (1) document layout analysis (DLA) and pixel-based methods were used to quantitatively assess the layout differences between the conventional and improved CSR formats; (2) the Flesch Reading Ease Score (FRES) was calculated for each report to evaluate the text’s readability using Optical Character Recognition (OCR) and subsequent text analysis; and (3) Monte Carlo simulation was conducted to address the limitations of small sample size, generating 10,000 random samples from the identified probability distributions to provide robust statistical evaluation. This systematic approach ensured that layout and readability improvements were assessed comprehensively and reliably.

3.2. Comparison Results of DLA and Pixel-Based Method

In the section titled “Extraction of document layout”, four components, such as text, image, numeric, and other elements, were detected with respect to their position for visualization using DLA (Figure 4). Figure 4 represents the results of DLA analysis using the 6th report out of 30 CSRs as an example. The sixth report was selected because it exhibited the most notable contrast in the text-to-image ratio when compared to both the conventional and improved CSRs.
Based on the results of the DLA analysis, pixel area sizes were calculated to compare and evaluate how the ratio of layout components changed between the improved CSR and the conventional CSR. First, the pixel ratio results of the four components of the improved report are shown in Table 2. For the conventional report, the text component is 98.8%, image is 0%, numeric is 0.7%, and other elements are 0.5%. All 30 DfS report samples showed the same results, so these results were omitted in Table 2. As seen in Table 2, the pixel ratios of numeric and other elements in the improved report are significantly lower compared to the ratios of text and image. Therefore, when calculating pixels, the components within the document were classified into two main categories, text (text + numeric + other elements) and image, following the method described in Section 2.2.2 titled “Calculation of Pixel Size.” The results of calculating the improved report, classified into these two main categories, are shown in Table 3. For the conventional report, text (T + N + O) is 100% and image is 0%. All 30 DfS report samples showed the same results, so the results were omitted from the table. The statistical analysis results of the text and image ratios between the improved and conventional reports are presented in Table 4. The analysis of the layout component ratios of 30 conventional CSRs revealed that the reports consisted entirely of text with no images. However, the analysis of the layout component ratios of 30 improved CSRs showed that text accounted for 33.13%, whereas images comprised about 66.87%. This confirms a significant decrease in text and a considerable increase in images. Thus, by quantifying the layout component ratio of improved CSR using DLA using pixels, the alteration in the document layout structure was verified.

3.3. Comparison Results of the FRES

To analyze the readability levels of 30 reports using the Flesch Reading Ease formula, text was first extracted from PDF documents using the Tesseract OCR engine. However, most of the extracted text was disorganized and jumbled, failing to maintain the original structure of the documents. Additionally, some text was not properly extracted, necessitating manual supplementation of the missing parts. To ensure the accuracy of the extracted text, sentences were reassembled to restore the original meaning and structure of the documents, and any missing text was verified. For example, in Improved CSR 6 (Figure 3), the pre- and post-correction text extraction states can be compared in Table 5 and Table 6. In the pre-correction text data, items 4, 5, 8, 9, 10, and 14 did not extract properly. Missing words were manually added to complete the text data. Afterward, the completed text data was input into an online text analysis tool to measure the number of words, sentences, and syllables on each page. Based on these measured values, scores were derived by directly applying the values to the pre-designed Flesch Reading Ease Score formula.
The number of words, sentences, syllables, and Flesch Reading Ease Scores for each page of the 30 conventional and improved reports are shown in Table 7 and Table 8. Among these metrics, the Flesch Reading Ease Scores are presented as a line graph in Figure 5 to visually compare the scores between the conventional and improved reports.
Overall, the authors observed that the readability scores of improved CSR are higher than those of conventional CSR, with the highest readability score of improved CSR being 82.94. The difference in scores between conventional and improved CSR is up to approximately 16.6, indicating a significant improvement in readability levels.
However, initial evaluations with a limited dataset present a challenge in fully reflecting the characteristics of the entire population. To address this, the characteristics of the population were more precisely analyzed using the A-D test and Monte Carlo simulation. After inferring the distribution through the A-D test, random readability score data for each report were generated through Monte Carlo simulation, producing 10,000 random readability scores for each, as shown in Figure 6. According to the analysis results in Table 9, the average readability scores of conventional CSR and improved CSR were 44.52 and 50.24, respectively, indicating that the readability of improved CSR was better than that of conventional CSR.
To determine if there is a statistically significant difference in the average readability scores between the two reports, a one-sided Student’s t-test was conducted. The following hypotheses were set before performing the test:
Null Hypothesis (H0).
The average readability scores of conventional and improved CSR will be the same.
Alternative Hypothesis (H1).
The average readability score of conventional CSR will be lower than that of improved CSR.
Before performing the one-sided Student’s t-test, an F-test was conducted to verify the difference in variances between the readability scores of the two groups, conventional and improved CSR. The results of the F-test are shown in Table 10. The results of the F-test show a one-sided p-value of 0.00, which is less than the significance level of 0.05 (P(F ≤ f) < 0.05). Referring to the results of the F-test, their variances are suggested as unequal. Therefore, t-tests are based on the assumption that the variances between two sample data ranges are unequal. The one-sided unequal variances t-test results were revealed as follows (Table 11). Because the p-value is lower than 0.05, the null hypothesis is to be rejected. In other words, hypothesis testing confirmed that the average score of improved CSR is higher than that of conventional CSR.

4. Discussion

According to the results confirmed through DLA and pixel-based layout evaluation, the conventional CSR format consisted of approximately 100% text, whereas the improved CSR format was restructured to include about 70% images and 30% text. In discussing these results, an analysis of prior research found that an increased ratio of images to text enhances document comprehension [77]. Furthermore, visually enhanced materials improve readability and aid in understanding the text [78]. Thus, an increase in the image ratio within the report directly contributes to the improvement of the overall readability of the document. Consequently, the conclusion can be drawn that the improved CSR, characterized by a higher image ratio, facilitates reader comprehension of the document, thereby implying that the improved CSR has contributed to an improvement in readability [79].
According to the Anderson–Darling distribution fitting and the generation of 10,000 readability scores based on the FRES through Monte Carlo simulation, the average readability score of the conventional CSR was 44.52, while the improved CSR’s score was 50.24, indicating an approximate 1.12-fold improvement in readability. An analysis of prior research considering the impact of readability on document comprehension confirmed that a higher level of readability positively influences document comprehension [80]. This indicates the significant role that readability plays in understanding documents. However, it is important to note that both the conventional and improved CSRs are still rated as fairly difficult to read according to the FRES thresholds. While the improved CSR shows statistically significant enhancements in readability, this does not guarantee that end users, such as construction workers or safety officers, will find the reports intuitively easier to understand. Therefore, these results should be interpreted as a preliminary indication of improved text design rather than definitive proof of better user comprehension. Additionally, the results of the one-sided F and t-tests confirmed that there is a statistically significant difference in readability scores between the two reports. This statistical difference indicates that the observed disparity implies a meaningful difference in readability between the two groups. In essence, this supports the conclusion that the readability of the improved CSR is statistically superior to that of the conventional CSR.
In line with recent studies on construction safety communication and documentation practices, our findings align with prior work emphasizing the crucial role of visual clarity and language accessibility in improving understanding and compliance. For instance, while previous research [35] has highlighted issues of readability and layout in safety documents, our study extends these findings by employing a two-step quantitative evaluation method, combining document layout analysis with pixel-based methods and the FRES, and validating results with Monte Carlo simulation. Unlike purely qualitative assessments or limited-scope studies, our approach offers a more objective and replicable framework for evaluating construction safety reports. Moreover, the study fills a gap in the literature by providing comprehensive, quantitative evidence that improved layout (integrating images and reduced text density) contributes to enhanced readability metrics. This contrasts with earlier works that focused primarily on readability scores without considering layout or that used subjective assessments of layout without quantitative validation. Therefore, our study not only reinforces but also expands upon the current understanding of document design for construction safety communication, offering practical and methodological advancements.
To enhance conventional text-based CSRs, an improved report incorporating visual materials (images) was proposed. To verify whether this enhanced report is superior to the conventional one, a quantitative evaluation was conducted using document layout analysis, pixel analysis, and the Flesch Reading Ease Score. This evaluation confirmed whether the layout and readability of the improved CSRs were better. Ultimately, it was quantitatively demonstrated that the improved CSRs are superior to the conventional CSRs. Additionally, to address the potential lack of reliability in the verification results due to the small sample size, a framework utilizing Monte Carlo simulation was presented, which contributed to enhancing the reliability of the findings in this study.
Beyond these findings, the improved CSR format holds several practical implications for the construction industry. By integrating clearer visual representations and improved text layout, these enhanced reports can serve as effective tools in safety communication and training, potentially reducing misunderstandings of safety guidelines. In practice, the improved format could be incorporated into standard safety documentation protocols, design guidelines, or digital safety management systems, ensuring consistent and comprehensible reporting across projects. Furthermore, the enhanced CSR format could be adopted in worker training programs to reinforce safe practices through more accessible content. These practical applications could lead to increased adoption of CSRs in South Korea, where reliance on text-heavy reports has limited their effectiveness.

5. Conclusions

This study successfully enhances text-based construction safety reports by incorporating visual materials (images) and evaluating their effectiveness through readability and layout assessments. The readability was assessed using the Flesch Reading Ease, while the layout was evaluated through document layout analysis (DLA) and pixel-based methods. The research validates the effectiveness of the improved reports using a two-step quantitative approach, demonstrating that the inclusion of visual materials significantly contributes to better readability and a more effective layout.
The contributions of this study are as follows. (1) A method for quantitatively verifying improvements in the report layout and readability using a two-step quantitative analysis method that employs DLA and pixel methods along with the FRES was presented. (2) The improved report format proposed for this study acts as a more effective means of safety reporting and information delivery, potentially enhancing safety on construction sites. (3) The quantitative analysis method proposed in this study can be utilized in fields beyond construction to improve document layout and readability, thereby increasing the effectiveness of information delivery. (4) The quantitative analysis method proposed for critically evaluating and improving the conventional CSR format contributes to the enhancement of technical document quality, which is expected to aid in raising standards in professional fields.
The limitations of this study are as follows. (1) The dataset used in this study represents only a fraction of CSRs, and the study did not cover a broader variety of report types and formats, presenting challenges in generalizing the two-step quantitative analysis method. (2) This study focused primarily on the visual aspects of reports, such as layout and readability, to assess document quality. However, evaluating document quality based solely on layout and readability has its limitations. (3) It is also emphasized that readability formulas overlook the prior knowledge, interests, and motivation of the reader. (4) The study lacks direct validation from actual users, as no feedback was collected from report readers, nor were comprehension tests conducted to verify whether the improved readability scores translate to better understanding in practice. The improvements demonstrated are limited to quantitative metrics rather than validated user experience outcomes.
Considering the above limitations, future research will proceed as follows. (1) The research will expand to cover various types and formats of reports beyond the examples limited to DfS reports, aiming to enhance the generalizability of the two-step quantitative analysis method. (2) By incorporating additional content quality evaluation metrics beyond layout and readability, the study will aim to achieve more comprehensive and integrative results through evaluations of various aspects, not limited to their visual components. (3) Future research will include user validation through feedback collection and comprehension testing to verify whether improved readability metrics correspond to actual improvements in user understanding and usability of the reports.

Author Contributions

Conceptualization, J.O. and J.J. (Jaewook Jeong); methodology, J.O., J.J. (Jaemin Jeong), and H.M.; validation, H.K. (Hyugsoo Kwon), H.K. (Hoyoung Kim), and L.K.; formal analysis, J.O. and H.M.; investigation, J.O.; resources, J.J. (Jaewook Jeong); data curation, J.O., H.K. (Hyugsoo Kwon), and H.K. (Hoyoung Kim); writing—original draft preparation, J.O.; writing—review and editing, L.K. and J.J. (Jaemin Jeong); visualization, J.O.; supervision, J.J. (Jaewook Jeong); project administration, J.J. (Jaewook Jeong); funding acquisition, J.J. (Jaewook Jeong). All authors have read and agreed to the published version of the manuscript.

Funding

This study was financially supported by the research program funded by the Korea South-East Power Corporation (KOEN) through the project (Project No. 2022-Construction-01).

Data Availability Statement

The data generated and analyzed during this research are available from the corresponding authors upon reasonable request.

Conflicts of Interest

Authors Hyugsoo Kwon and Hoyoung Kim were employed by the company Korea South-East Power Co. The remaining authors declare that the research was conducted in the absence of any commercial or financial relationships that could be construed as a potential conflict of interest.

Abbreviations

The following abbreviations are used in this manuscript:
DfSDesign for Safety
CSRsConstruction safety reports
DLADocument layout analysis
FRESFlesch Reading Ease Score
A-D testAnderson–Darling goodness-of-fit test
OCROptical Character Recognition

References

  1. Xue, J.; Shen, G.Q.; Yang, R.J.; Wu, H.; Li, X.; Lin, X.; Xue, F. Mapping the Knowledge Domain of Stakeholder Perspective Studies in Construction Projects: A Bibliometric Approach. Int. J. Proj. Manag. 2020, 38, 313–326. [Google Scholar] [CrossRef]
  2. Kumi, L.; Jeong, J.; Jeong, J.; Son, J.; Mun, H. Network-Based Safety Risk Analysis and Interactive Dashboard for Root Cause Identification in Construction Accident Management. Reliab. Eng. Syst. Saf. 2025, 256, 110814. [Google Scholar] [CrossRef]
  3. Kumi, L.; Jeong, J.; Jeong, J. Systematic Review of Quantitative Risk Quantification Methods in Construction Accidents. Buildings 2024, 14, 3306. [Google Scholar] [CrossRef]
  4. Mun, H.; Jeong, J.; Jeong, J.; Kumi, L. Unsupervised Learning Approach for Benchmark Models to Identify Construction Projects with High Accident Risk Levels. Eng. Constr. Archit. Manag. 2025. [Google Scholar] [CrossRef]
  5. Dave, B.; Koskela, L. Collaborative Knowledge Management—A Construction Case Study. Autom. Constr. 2009, 18, 894–902. [Google Scholar] [CrossRef]
  6. Hjelt, M.; Björk, B.-C. Experiences of EDM Usage in Construction Projects. J. Inf. Technol. Constr. 2006, 11, 113–125. [Google Scholar]
  7. Zhu, Y.; Issa, R.R.A.; Cox, R.F. Web-Based Construction Document Processing via Malleable Frame. J. Comput. Civ. Eng. 2001, 15, 157–169. [Google Scholar] [CrossRef]
  8. Kumi, L.; Jeong, J.; Jeong, J. Proactive Approach to Enhancing Safety Management Using Deep Learning Classifiers for Construction Safety Documentation. Eng. Appl. Artif. Intell. 2025, 153, 110889. [Google Scholar] [CrossRef]
  9. Caldas, C.H.; Soibelman, L.; Han, J. Automated Classification of Construction Project Documents. J. Comput. Civ. Eng. 2002, 16, 234–243. [Google Scholar] [CrossRef]
  10. Kumi, L.; Jeong, J.; Jeong, J. Data-Driven Automatic Classification Model for Construction Accident Cases Using Natural Language Processing with Hyperparameter Tuning. Autom. Constr. 2024, 164, 105458. [Google Scholar] [CrossRef]
  11. Atkinson, A.R.; Westall, R. The Relationship between Integrated Design and Construction and Safety on Construction Projects. Constr. Manag. Econ. 2010, 28, 1007–1017. [Google Scholar] [CrossRef]
  12. Zhou, Z.; Goh, Y.M.; Li, Q. Overview and Analysis of Safety Management Studies in the Construction Industry. Saf. Sci. 2015, 72, 337–350. [Google Scholar] [CrossRef]
  13. González García, M.N.; Segarra Cañamares, M.; Villena Escribano, B.M.; Romero Barriuso, A. Constructiońs Health and Safety Plan: The Leading Role of the Main Preventive Management Document on Construction Sites. Saf. Sci. 2021, 143, 105437. [Google Scholar] [CrossRef]
  14. Winge, S.; Albrechtsen, E.; Arnesen, J. A Comparative Analysis of Safety Management and Safety Performance in Twelve Construction Projects. J. Saf. Res. 2019, 71, 139–152. [Google Scholar] [CrossRef]
  15. Lu, Y.; Yin, L.; Deng, Y.; Wu, G.; Li, C. Using Cased Based Reasoning for Automated Safety Risk Management in Construction Industry. Saf. Sci. 2023, 163, 106113. [Google Scholar] [CrossRef]
  16. Soh, J.; Jeong, J.; Jeong, J. Improvements of Design for Safety in Construction through Multi-Participants Perception Analysis. Appl. Sci. 2020, 10, 4550. [Google Scholar] [CrossRef]
  17. Hare, B.; Cameron, I.; Roy Duff, A. Exploring the Integration of Health and Safety with Pre-Construction Planning. Eng. Constr. Archit. Manag. 2006, 13, 438–450. [Google Scholar] [CrossRef]
  18. Ndekugri, I.; Ankrah, N.A.; Adaku, E. The Design Coordination Role at the Pre-Construction Stage of Construction Projects. Build. Res. Inf. 2022, 50, 452–466. [Google Scholar] [CrossRef]
  19. O’Neill, C.; Gopaldasani, V.; Coman, R. Factors That Influence the Effective Use of Safe Work Method Statements for High-Risk Construction Work in Australia—A Literature Review. Saf. Sci. 2022, 147, 105628. [Google Scholar] [CrossRef]
  20. Alsubaey, M.; Asadi, A.; Makatsoris, H. A Naïve Bayes Approach for Ews Detection by Text Mining of Unstructured Data: A Construction Project Case. In Proceedings of the 2015 SAI Intelligent Systems Conference (IntelliSys), London, UK, 10–11 November 2015; pp. 164–168. [Google Scholar]
  21. Akal, A.Y. What Are the Readability Issues in Sub-Contracting’s Tender Documents? Buildings 2022, 12, 839. [Google Scholar] [CrossRef]
  22. Koc, K.; Pelin Gurgun, A. Assessment of Readability Risks in Contracts Causing Conflicts in Construction Projects. J. Constr. Eng. Manag. 2021, 147, 04021041. [Google Scholar] [CrossRef]
  23. Liu, Y.; Wang, J.; Tang, S.; Zhang, J.; Wan, J. Integrating Information Entropy and Latent Dirichlet Allocation Models for Analysis of Safety Accidents in the Construction Industry. Buildings 2023, 13, 1831. [Google Scholar] [CrossRef]
  24. Kang, E.Y.; Fields, H.W.; Kiyak, A.; Beck, F.M.; Firestone, A.R. Informed Consent Recall and Comprehension in Orthodontics: Traditional vs Improved Readability and Processability Methods. Am. J. Orthod. Dentofac. Orthop. 2009, 136, 488.e1–488.e13. [Google Scholar] [CrossRef] [PubMed]
  25. Waller, R. What Makes a Good Document. The Criteria We Use. Technical Paper 2011. Available online: https://uploads-ssl.webflow.com/5c06fb475dbf1265069aba1e/6090fb24421b454c776fd1a8_SC2CriteriaGoodDoc_v5.pdf (accessed on 24 September 2024).
  26. Amendum, S.J.; Conradi, K.; Hiebert, E. Does Text Complexity Matter in the Elementary Grades? A Research Synthesis of Text Difficulty and Elementary Students’ Reading Fluency and Comprehension. Educ. Psychol. Rev. 2018, 30, 121–151. [Google Scholar] [CrossRef]
  27. Benjamin, R.G. Reconstructing Readability: Recent Developments and Recommendations in the Analysis of Text Difficulty. Educ. Psychol. Rev. 2012, 24, 63–88. [Google Scholar] [CrossRef]
  28. Stenner, A.J.; Stone, M.H. Does the Reader Comprehend the Text Because the Reader Is Able or Because the Text Is Easy? In Explanatory Models, Unit Standards, and Personalized Learning in Educational Measurement; Springer Nature: Singapore, 2023; pp. 133–152. [Google Scholar]
  29. Crossley, S.; Heintz, A.; Choi, J.S.; Batchelor, J.; Karimi, M.; Malatinszky, A. A Large-Scaled Corpus for Assessing Text Readability. Behav. Res. Methods 2023, 55, 491–507. [Google Scholar] [CrossRef]
  30. Wang, S.; Liu, X.; Zhou, J. Readability Is Decreasing in Language and Linguistics. Scientometrics 2022, 127, 4697–4729. [Google Scholar] [CrossRef]
  31. Kouroupetroglou, G.; Tsonos, D. Multimodal Accessibility of Documents. In Advances in Human Computer Interaction; InTech: Houston, TX, USA, 2008. [Google Scholar]
  32. Namboodiri, A.M.; Jain, A.K. Document Structure and Layout Analysis. In Digital Document Processing. Advances in Pattern Recognition; Springer: London, UK, 2007; pp. 29–48. [Google Scholar]
  33. Williams, T.R. Guidelines for Designing and Evaluating the Display of Information on the Web. Tech. Commun. 2000, 47, 383–396. [Google Scholar]
  34. Huang, W. Using Eye Tracking to Investigate Graph Layout Effects. In Proceedings of the 2007 6th International Asia-Pacific Symposium on Visualization, Sydney, Australia, 5–7 February 2007; pp. 97–100. [Google Scholar]
  35. Sinyai, C.; MacArthur, B.; Roccotagliata, T. Evaluating the Readability and Suitability of Construction Occupational Safety and Health Materials Designed for Workers. Am. J. Ind. Med. 2018, 61, 842–848. [Google Scholar] [CrossRef]
  36. Liu, F.; Abdul-Hussain, S.; Mahboob, S.; Rai, V.; Kostrzewski, A. How Useful Are Medication Patient Information Leaflets to Older Adults? A Content, Readability and Layout Analysis. Int. J. Clin. Pharm. 2014, 36, 827–834. [Google Scholar] [CrossRef]
  37. Hall, J.C. The readability of original articles in surgical journals. ANZ J. Surg. 2006, 76, 68–70. [Google Scholar] [CrossRef] [PubMed]
  38. Emanuel, E.J.; Boyle, C.W. Assessment of Length and Readability of Informed Consent Documents for COVID-19 Vaccine Trials. JAMA Netw. Open 2021, 4, e2110843. [Google Scholar] [CrossRef]
  39. Reinert, C.; Kremmler, L.; Burock, S.; Bogdahn, U.; Wick, W.; Gleiter, C.H.; Koller, M.; Hau, P. Quantitative and Qualitative Analysis of Study-Related Patient Information Sheets in Randomised Neuro-Oncology Phase III-Trials. Eur. J. Cancer 2014, 50, 150–158. [Google Scholar] [CrossRef] [PubMed]
  40. Kim, S.O.; Yoon, Y.G.; Oh, T.K. Improvement of Safety Management and Plan by Comparison Analysis of Construction Technology Promotion Act (CTPA) and Occupational Safety and Health Act (OSHA) in Construction Field. J. Korean Soc. Saf. 2021, 36, 37–46. [Google Scholar] [CrossRef]
  41. Yoon, H.K.; Kwon, Y.J.; Oh, B.H.; Gwon, Y.I.; Yoon, Y.G.; Oh, T.K. A Study on the Improvement of Safety Management of Plan/Order, Design, and Construction Business Management. J. Korean Soc. Saf. 2020, 35, 56–63. [Google Scholar]
  42. Lee, C. Construction Industry Progress of South Korea: 1995–2019. In Construction Industry Advance and Change: Progress in Eight Asian Economies Since 1995; Emerald Publishing Limited: Leeds, UK, 2021; pp. 137–161. [Google Scholar]
  43. Ibrahim, C.K.I.C.; Manu, P.; Belayutham, S.; Mahamadu, A.-M.; Antwi-Afari, M.F. Design for Safety (DfS) Practice in Construction Engineering and Management Research: A Review of Current Trends and Future Directions. J. Build. Eng. 2022, 52, 104352. [Google Scholar] [CrossRef]
  44. Tran, T.A.; Oh, K.; Na, I.-S.; Lee, G.-S.; Yang, H.-J.; Kim, S.-H. A Robust System for Document Layout Analysis Using Multilevel Homogeneity Structure. Expert Syst. Appl. 2017, 85, 99–113. [Google Scholar] [CrossRef]
  45. Bhowmik, S.; Kundu, S.; Sarkar, R. BINYAS: A Complex Document Layout Analysis System. Multimed. Tools Appl. 2021, 80, 8471–8504. [Google Scholar] [CrossRef]
  46. BinMakhashen, G.M.; Mahmoud, S.A. Historical Document Layout Analysis Using Anisotropic Diffusion and Geometric Features. Int. J. Digit. Libr. 2020, 21, 329–342. [Google Scholar] [CrossRef]
  47. Simon, A.; Pret, J.-C.; Johnson, A.P. A Fast Algorithm for Bottom-up Document Layout Analysis. IEEE Trans. Pattern Anal. Mach. Intell. 1997, 19, 273–277. [Google Scholar] [CrossRef]
  48. Marinai, S. Learning Algorithms for Document Layout Analysis. In Handbook of Statistics; Elsevier: Amsterdam, The Netherlands, 2013; pp. 400–419. [Google Scholar]
  49. Domínguez, C.; Heras, J.; Pascual, V. IJ-OpenCV: Combining ImageJ and OpenCV for Processing Images in Biomedicine. Comput. Biol. Med. 2017, 84, 189–194. [Google Scholar] [CrossRef] [PubMed]
  50. Güneş, A.; Kalkan, H.; Durmuş, E. Optimizing the Color-to-Grayscale Conversion for Image Classification. Signal Image Video Process. 2016, 10, 853–860. [Google Scholar] [CrossRef]
  51. Zhou, P.; Ye, W.; Xia, Y.; Wang, Q. An Improved Canny Algorithm for Edge Detection. J. Comput. Inf. Syst. 2011, 7, 1516–1523. [Google Scholar]
  52. Verma, O.P.; Sharma, R.; Kumar, M.; Agrawal, N. An Optimal Edge Detection Using Gravitational Search Algorithm. Lect. Notes Softw. Eng. 2013, 1, 148. [Google Scholar] [CrossRef]
  53. Fan, D.; Bi, H.; Wang, L. Implementation of Efficient Line Detection with Oriented Hough Transform. In Proceedings of the 2012 International Conference on Audio, Language and Image Processing, Shanghai, China, 16–18 July 2012; pp. 45–48. [Google Scholar]
  54. Aggarwal, N.; Karl, W.C. Line Detection in Images through Regularized Hough Transform. IEEE Trans. Image Process. 2006, 15, 582–591. [Google Scholar] [CrossRef] [PubMed]
  55. Bailey, D.; Chang, Y.; Le Moan, S. Analysing Arbitrary Curves from the Line Hough Transform. J. Imaging 2020, 6, 26. [Google Scholar] [CrossRef]
  56. Inayoshi, S.; Otani, K.; Tejero-de-Pablos, A.; Harada, T. Bounding-Box Channels for Visual Relationship Detection. In Computer Vision—ECCV 2020. ECCV 2020, Proceedings of the 16th European Conference, Glasgow, UK, 23–28 August 2020; Springer: Cham, Switzerland, 2020; pp. 682–697. [Google Scholar]
  57. Ferrari, V.; Fevrier, L.; Jurie, F.; Schmid, C. Groups of Adjacent Contour Segments for Object Detection. IEEE Trans. Pattern Anal. Mach. Intell. 2008, 30, 36–51. [Google Scholar] [CrossRef]
  58. Booth, D.T.; Cox, S.E.; Berryman, R.D. Point Sampling Digital Imagery with ‘Samplepoint’. Environ. Monit. Assess. 2006, 123, 97–108. [Google Scholar] [CrossRef]
  59. Brewer, J.C. Measuring Text Readability Using Reading Level. In Advanced Methodologies and Technologies in Modern Education Delivery; IGI Global: Hershey, PA, USA, 2018; pp. 93–103. [Google Scholar]
  60. Eleyan, D.; Othman, A.; Eleyan, A. Enhancing Software Comments Readability Using Flesch Reading Ease Score. Information 2020, 11, 430. [Google Scholar] [CrossRef]
  61. Hidayat, R. The Readability of Reading Texts on the English Textbook. In Proceedings of the Role of International Languages toward Global Education System, Palangka Raya, Indonesia, 25 June 2016; pp. 120–128. [Google Scholar]
  62. Sattari, S.; Pitt, L.F.; Caruana, A. How Readable Are Mission Statements? An Exploratory Study. Corp. Commun. Int. J. 2011, 16, 282–292. [Google Scholar] [CrossRef]
  63. Chen, H.-H. How to Use Readability Formulas to Access and Select English Reading Materials. J. Educ. Media Libr. Sci. 2012, 50, 229–254. [Google Scholar] [CrossRef]
  64. Zamanian, M.; Heydari, P. Readability of Texts: State of the Art. Theory Pract. Lang. Stud. 2012, 2, 43–53. [Google Scholar] [CrossRef]
  65. Robinson, E.; McMenemy, D. ‘To Be Understood as to Understand’: A Readability Analysis of Public Library Acceptable Use Policies. J. Librariansh. Inf. Sci. 2020, 52, 713–725. [Google Scholar] [CrossRef]
  66. Malathi, T.; Selvamuthukumaran, D.; Diwaan Chandar, C.S.; Niranjan, V.; Swashthika, A.K. An Experimental Performance Analysis on Robotics Process Automation (RPA) With Open Source OCR Engines: Microsoft Ocr And Google Tesseract OCR. IOP Conf. Ser. Mater. Sci. Eng. 2021, 1059, 012004. [Google Scholar] [CrossRef]
  67. Asiamah, N.; Mensah, H.K.; Oteng-Abayie, E.F. General, Target, and Accessible Population: Demystifying the Concepts for Effective Sampling. Qual. Rep. 2017, 22, 1607–1621. [Google Scholar] [CrossRef]
  68. Wurpts, I.C.; Geiser, C. Is Adding More Indicators to a Latent Class Analysis Beneficial or Detrimental? Results of a Monte-Carlo Study. Front. Psychol. 2014, 5, 920. [Google Scholar] [CrossRef]
  69. Jäntschi, L.; Bolboacă, S.D. Computation of Probability Associated with Anderson–Darling Statistic. Mathematics 2018, 6, 88. [Google Scholar] [CrossRef]
  70. Liebscher, E. Approximation of Distributions by Using the Anderson Darling Statistic. Commun. Stat. Theory Methods 2016, 45, 6732–6745. [Google Scholar] [CrossRef]
  71. Zhang, H.; Gao, Z.; Du, C.; Bi, S.; Fang, Y.; Yun, F.; Fang, S.; Yu, Z.; Cui, Y.; Shen, X. Parameter Estimation of Three-Parameter Weibull Probability Model Based on Outlier Detection. RSC Adv. 2022, 12, 34154–34164. [Google Scholar] [CrossRef]
  72. McFarland, J.; DeCarlo, E. A Monte Carlo Framework for Probabilistic Analysis and Variance Decomposition with Distribution Parameter Uncertainty. Reliab. Eng. Syst. Saf. 2020, 197, 106807. [Google Scholar] [CrossRef]
  73. Lee, D.-Y.; Kim, D.-E. A Study on the Probabilistic Risk Analysis for Safety Management in Construction Projects. J. Korea Soc. Comput. Inf. 2021, 26, 139–147. [Google Scholar]
  74. Shapiro, A. Monte Carlo Sampling Methods. In Handbooks in Operations Research and Management Science; Elsevier: Amsterdam, Netherlands, 2003; Volume 10, pp. 353–425. [Google Scholar]
  75. Kwak, S.G.; Kim, J.H. Central Limit Theorem: The Cornerstone of Modern Statistics. Korean J. Anesth. 2017, 70, 144. [Google Scholar] [CrossRef] [PubMed]
  76. Harrison, R.L.; Granja, C.; Leroy, C. Introduction to Monte Carlo Simulation. AIP Conf. Proc. 2011, 1204, 17–21. [Google Scholar]
  77. Weiner, M.D.; Puniello, O.T.; Siracusa, P.C.; Crowley, J.E. Recruiting Hard-to-Reach Populations: The Utility of Facebook for Recruiting Qualitative In-Depth Interviewees. Surv. Pract. 2017, 10, 1–13. [Google Scholar] [CrossRef]
  78. Townsend, M.S.; Sylva, K.; Martin, A.; Metz, D.; Wooten-Swanson, P. Improving Readability of an Evaluation Tool for Low-Income Clients Using Visual Information Processing Theories. J. Nutr. Educ. Behav. 2008, 40, 181–186. [Google Scholar] [CrossRef]
  79. Alkhurayyif, Y.; Weir, G.R.S. Readability as a Basis for Information Security Policy Assessment. In Proceedings of the 2017 Seventh International Conference on Emerging Security Technologies (EST), Canterbury, UK, 6–8 September 2017; pp. 114–121. [Google Scholar]
  80. Rameezdeen, R.; Rodrigo, A. Textual Complexity of Standard Conditions Used in the Construction Industry. Constr. Econ. Build. 2013, 13, 1–12. [Google Scholar] [CrossRef]
Figure 1. Research framework.
Buildings 15 01994 g001
Figure 2. Example of conventional CSR.
Buildings 15 01994 g002
Figure 3. Example of improved CSR.
Buildings 15 01994 g003
Figure 4. DLA for conventional and improved CSRs.
Buildings 15 01994 g004
Figure 5. FRES readability evaluation of the 30 samples.
Buildings 15 01994 g005
Figure 6. FRES readability evaluation of the 10,000 samples.
Buildings 15 01994 g006
Table 1. Comparison of DfS components.
No.ComponentConventional
DfS
Improved
DfS
1Title-Text
2Hazard management in chargeTextText
3Facility type-Text
4Work typeTextText
5Elements-Text
6Solution stageTextText
7Reduce measures stageTextText
8Accident type (physical/human)TextText
9Hazard (accident causes)TextText + Image
10RisksTextText
11Hazard reduction measures (alternative)TextText + Image
12Reduction measures by third partyText-
13Remaining hazardText-
14Evaluation aspect and purposeText-
15Evaluation table for alternativeText-
16NoteText-
17Final ver.-Text
18CodeTextText
Table 2. Four component pixel ratio of improved DfS.
No.Text (Red)Image (Blue)Numeric (Yellow)Other Elements (Orange)
133.4066.200.200.20
232.2067.400.200.20
334.4065.200.200.20
431.0068.600.200.20
534.2065.400.200.20
633.4066.200.200.20
731.9067.700.200.20
829.9769.670.210.15
933.3466.250.230.17
1030.9068.700.200.20
1133.3066.300.200.20
1231.1068.500.200.20
1335.7363.830.250.18
1429.0070.600.200.20
1534.2565.340.240.18
1630.4669.170.210.16
1731.7067.900.200.20
1832.5067.100.200.20
1931.2068.400.200.20
2030.8068.800.200.20
2130.4069.200.200.20
2234.5065.100.200.20
2336.0063.600.200.20
2434.3065.300.200.20
2535.2064.400.200.20
2631.2068.400.200.20
2734.5065.100.200.20
2834.7464.840.240.18
2933.3066.300.200.20
3032.9066.700.200.20
Table 3. Two component pixel ratio of improved DfS.
No.Text (T + N + O)Image
133.8066.20
232.6067.40
334.8065.20
431.4068.60
534.6065.40
633.8066.20
732.3067.70
830.3369.67
933.7466.25
1031.3068.70
1133.7066.30
1231.5068.50
1336.1663.83
1429.0470.60
1534.6765.34
1630.8369.17
1732.1067.90
1832.9067.10
1931.6068.40
2031.2068.80
2130.6069.20
2234.9065.10
2336.4063.60
2434.7065.30
2535.6064.40
2631.6068.40
2734.9065.10
2835.1664.84
2933.7066.30
3033.3066.70
Table 4. Statistical analysis comparison of text and image ratios.
Conventional CSRImproved CSR
TextImageTextImage
Mean100033.1366.87
Standard Deviation001.861.86
Minimum100029.4063.60
Maximum100036.4070.60
Table 5. Before text extraction modification.
No.Text Extraction
1Code No.
2The braced wall wale bracket fell off and the braced wall collapsed
3Hazard target (Constructor, User, Owner)
4Application (-, -)
5Elements (-)
6Work (Earthwork)
7Facility type (Apartment)
8-
9- (Non, -, Fall, Fire, -, Burst, ETC)
10-
11Type (Severity, Frequency)
12Level H(8~25) M(4~7) L(1~3) ETC
13Reduce measures stage (PPE, Administrative Controls, Engineering Controls, Substitution, Elimination)
14- Ver.
15division
16Hazard (Accident causes)
17Alternative
18Picture/Drawing
19Content
20The braced wall wale bracket fell off and the braced wall collapsed
21Reflect in the detailed drawing of the support angle for wale bracket
22Prevent the wale from falling off by securing the bracket
Table 6. After text extraction modification.
No.Text Extraction
1Code No.
2The braced wall wale bracket fell off and the braced wall collapsed
3Hazard target (Constructor, User, Owner)
4Application (Pre-construction phase, Construction phase)
5Elements (Earthwork braced wall)
6Work (Earthwork)
7Facility type (Apartment)
8Human (Fall, Fall down, Bump/Hit, Caught/Crushed, Amputation/Cut, Electrocuted, Burned, Chocked, ETC)
9Physical (Non, Collapse, Fall, Fire, Explosion, Burst, ETC)
10AS-IS, TO-BE
11Type (Severity, Frequency)
12Level H(8~25) M(4~7) L(1~3) ETC
13Reduce measures stage (PPE, Administrative Controls, Engineering Controls, Substitution, Elimination)
14Final Ver.
15division
16Hazard (Accident causes)
17Alternative
18Picture/Drawing
19Content
20The braced wall wale bracket fell off and the braced wall collapsed
21Reflect in the detailed drawing of the support angle for wale bracket
22Prevent the wale from falling off by securing the bracket
Table 7. Flesch Reading Ease Score of conventional DfS.
No.WordsSentencesSyllablesScoreSummary
181716621.71Very difficult to read
21421227928.60Very difficult to read
31121320245.51Difficult to read
42011833952.82Fairly difficult to read
51451122761.01Plain English
61491322766.31Plain English
72041732659.46Fairly difficult to read
81711532434.97Difficult to read
91741333629.88Very difficult to read
101661427753.63Fairly difficult to read
111591629340.85Difficult to read
121401424747.43Difficult to read
131301322649.61Difficult to read
141491427241.59Difficult to read
151701631240.78Difficult to read
162081636943.56Difficult to read
171591629340.85Difficult to read
181561627547.80Difficult to read
191331321261.60Plain English
201711529549.32Difficult to read
211151520151.19Fairly difficult to read
221341324740.43Difficult to read
231051321426.21Very difficult to read
241631130732.46Difficult to read
251441223854.83Fairly difficult to read
261441225346.02Difficult to read
271201224126.78Very difficult to read
281681431038.55Difficult to read
291261524335.15Difficult to read
301241219563.31Plain English
Table 8. Flesch Reading Ease Score of improved DfS.
No.WordsSentencesSyllablesScoreSummary
14339113.25Very difficult to read
22334340.89Difficult to read
33646154.35Fairly difficult to read
44457749.85Difficult to read
55157768.75Plain English
64956682.94Easy to read
75558171.08Fairly easy to read
83957634.06Difficult to read
95549940.60Difficult to read
103044961.04Plain English
113457318.29Very difficult to read
124757660.49Plain English
133856749.96Difficult to read
145349541.74Difficult to read
152745043.32Difficult to read
1661510746.06Difficult to read
174858449.04Difficult to read
184958157.04Fairly difficult to read
194857564.90Plain English
205259246.60Difficult to read
212744365.25Plain English
222745140.18Difficult to read
233656839.73Difficult to read
243446926.52Very difficult to read
255148257.87Fairly difficult to read
264547358.18Fairly difficult to read
272545127.91Very difficult to read
2858510049.20Difficult to read
293546248.09Difficult to read
303545565.01Plain English
Table 9. Statistical analysis of readability scores using Monte Carlo simulation.
Conventional CSRImproved CSR
Mean44.5250.24
Standard deviation11.6414.31
Minimum16.991.28
Maximum71.66129.58
Q135.7240.58
Q244.6250.09
Q353.2459.85
Table 10. F-test: two groups for variance.
ConventionalImproved
Mean44.5250.24
Variance135.46204.69
Number10,00010,000
F ratio0.66
P(T ≤ t) one-tail0.00
F Critical one-tail0.97
Table 11. t-test: unequal variances.
ConventionalImproved
Mean44.5250.24
Variance135.46204.69
Number10,00010,000
t Stat−31.01
P(T ≤ t) one-tail0.00
t Critical one-tail1.64
Disclaimer/Publisher’s Note: The statements, opinions and data contained in all publications are solely those of the individual author(s) and contributor(s) and not of MDPI and/or the editor(s). MDPI and/or the editor(s) disclaim responsibility for any injury to people or property resulting from any ideas, methods, instructions or products referred to in the content.

