1. Introduction
Optimising indoor air quality (IAQ) and thermal comfort while managing energy consumption is a critical design objective for school buildings. Creating a healthy indoor environment in educational facilities presents unique challenges due to the complex interplay of various factors [
1]. Research has consistently demonstrated that IAQ and thermal comfort parameters significantly impact the learning process, educational outcomes, and health parameters [
2,
3]. Hence, indoor air quality (IAQ) and thermal comfort are taken as significant factors of indoor environmental quality (IEQ) in overall designing and constructing educational spaces [
4].
Educational spaces, particularly classrooms where students and teachers spend extended periods, are crucial in shaping the learning environment. The key elements of IEQ, including lighting, thermal conditions, acoustics, and air quality, have been shown to influence educators’ and students’ well-being, satisfaction, and performance [
5]. For instance, suboptimal air quality conditions or thermal discomfort can negatively affect concentration, engagement, and overall academic achievement. Building envelope design, especially the configuration and placement of windows, is fundamental in achieving desirable indoor environments while contributing to energy efficiency. Windows not only provide natural light and views but also impact thermal performance and ventilation [
6].
Numerous studies have explored the relationship between IAQ and thermal comfort and their association with educational outcomes, particularly emphasising classroom environments. These spaces, designed for prolonged occupancy and focused learning activities, require careful consideration of environmental factors to create conditions conducive to effective teaching and learning [
7]. The critical aspects of IEQ in educational settings are indoor air quality and thermal comfort, encompassing both natural and artificial sources [
8]. Proper indoor air quality and thermal comfort have been associated with various benefits, including improved mood, enhanced motivation, and reduced fatigue [
9]. Some researchers suggest that well-designed IEQ strategies can positively influence students’ ability to absorb and retain information, potentially leading to improved academic performance [
6]. Beyond these immediate effects, long-term implications of sustained optimal IAQ and TC include improved cognitive development, reduced absenteeism due to illness, enhanced teacher retention, and ultimately better academic achievement metrics over students’ educational journeys. Research indicates that children exposed to consistently good IAQ during their formative educational years demonstrate better concentration abilities, information retention, and problem-solving skills that persist into higher education levels [
1].
The design of educational spaces, particularly classrooms, represents a complex process that demands careful consideration of multiple environmental factors and their interactions. The architectural design process encompasses multiple stages and involves diverse stakeholders, creating a complex web of interactions among architects, consultants, facility operators, and end-users. Ensuring environmental quality requires continuous refinement of design methodologies. Contemporary architectural education integrates multidisciplinary approaches, combining engineering, environmental psychology, and building science insights to enhance understanding of environmental comfort and its practical applications in design [
1].
In the aftermath of the COVID-19 pandemic, the design of educational spaces has come under increased scrutiny, particularly regarding the importance of maintaining healthy Indoor Air Quality (IAQ) and Thermal Comfort (TC) standards. Like many developed countries, including the USA, UK, Canada, China, Europe, and Australia, New Zealand enhanced its minimum IAQ and TC requirements in response to the challenges posed by the pandemic. The Ministry of Education (MOE) updated the Design Quality Learning Standards (DQLS) to version 2.0 in 2022. Notably, around 90% of primary schools in New Zealand utilise natural ventilation systems, underscoring the need for rigorous IAQ and TC standards. These standards are designed to create learning environments that accommodate diverse teaching methods and learning activities.
The revised DQLS emphasises the critical role of ventilation in minimising the transmission of airborne diseases, including COVID-19. The updated guidelines include stricter requirements for fresh air intake and distribution, specifying higher air change rates (ACH) or ventilation rates (l/s/p) and lower acceptable carbon dioxide concentrations (ppm). Furthermore, the guidance on heating and cooling has been improved, with temperature recommendations tailored to specific regional climates.
To ensure compliance, design verification procedures have been strengthened. Larger buildings with a higher window-to-wall ratio (WWR) are now required to undergo mandatory building performance modelling. Lastly, the updated standards advocate for the use of indoor environmental monitoring tools in every classroom to continuously evaluate the effectiveness of ventilation systems [
10].
Despite these revisions, there remains a critical research gap in understanding how the updated New Zealand DQLS (V2.0) compares to international standards, particularly those established by OECD countries, and whether they adequately address the unique IAQ and TC requirements for primary schools in the post-COVID-19 era. Additionally, there is limited research evaluating the effectiveness and feasibility of implementing these updated standards in the context of New Zealand’s predominantly naturally ventilated primary school building stock.
This study aims to address these gaps through the following specific objectives:
To critically evaluate the current Indoor Air Quality (IAQ) and Thermal Comfort (TC) guidelines in Design Quality Learning Spaces (DQLS) Version 2.0 against comparable Organisation for Economic Co-operation and Development (OECD) standards, identifying limitations and appropriateness for post-COVID-19 primary school classrooms across New Zealand’s six climate zones.
To design and propose optimal post-COVID-19 IAQ and TC guidelines specifically tailored for New Zealand primary school contexts, comparing these with OECD standards to ensure international best practice alignment.
This research offers several novel contributions to the field. First, it provides the first comprehensive comparative analysis of post-COVID IAQ and TC standards for educational spaces between New Zealand and other OECD countries. Second, it specifically addresses the unique characteristics of New Zealand primary schools, where natural ventilation predominates—a context not adequately addressed in the current international literature. Third, the study bridges theoretical standards with practical implementation challenges, offering actionable design guidelines tailored to New Zealand’s climate conditions, building traditions, and educational practices. Finally, the research establishes a methodological framework for evaluating and developing region-specific IAQ and TC standards that could be adapted for use in other geographical contexts facing similar challenges in educational facility design.
2. Background
There is a general agreement among researchers and designers on the importance of IAQ and thermal comfort in improving the indoor environmental quality of educational spaces. They also acknowledge the challenge of balancing multiple individual factors and benefits with reducing discomfort to user activities [
4]. As a result, careful design of building envelopes, with a focus on passive design strategies where possible, is crucial [
6]. Research has shown a strong link between the indoor environmental conditions in educational buildings and their architectural and constructional features. These features include layout, orientation, spatial arrangement, thermal envelope properties, window-to-wall ratios, and external shading [
4,
11].
Research conducted in 2002 for educational spaces identified a significant link between student academic performance and multiple facets of the indoor educational setting. It revealed that enhanced building conditions, such as modern construction, improved lighting, optimal temperature control, and high air quality, can positively correlate with better student outcomes. Additionally, the study examined the influence of school size on student achievement, highlighting that smaller occupancy in schools tends to create a more secure and engaging environment, reduce disciplinary problems, and enhance satisfaction among stakeholders, including families, students, and teachers. The report further supported these findings by noting that class sizes with a student–teacher ratio of 15:1 or lower are associated with improved performance in mathematics and reading and positive behavioural impacts [
12].
The design of educational spaces typically draws upon conventional design principles, professional knowledge, and feedback from past experiences rather than employing systematic methodologies and in-depth analyses. As a result, the design quality can vary significantly, often contingent upon the individual designer’s expertise and experience, and may inadvertently marginalise considerations for indoor environmental comfort [
13]. The design phase frequently overlooks the investigation and assessment of various comfort solutions. Despite ongoing efforts to improve school building design, many public schools fail to provide adequate learning environments, primarily due to inconsistent architectural standards. Moreover, using simulations and optimisation techniques in design evaluations is rare, user engagement is typically absent from the design process, post-occupancy evaluations (POEs) are seldom carried out, and building performance data is not effectively incorporated into subsequent designs [
14].
Primary school educational spaces occupy a foundational role in the developmental journey of children, being compulsory in most countries, and thus involve a significant amount of time spent in school settings [
10]. As a result, a comprehensive analysis of the school environment is essential for grasping the elements that impact student learning, health, and overall well-being [
15]. Student health, including physical, psychological, and emotional aspects, is crucial for effective learning and personal development. Concurrently, academic achievement, which is evidenced through grades, assessment results, classroom engagement, and a thorough understanding of the curriculum, reflects a student’s educational progress and accomplishments [
16].
2.1. New Zealand DQLS Guidelines and Classroom IAQ and TC
In New Zealand, the Ministry of Education (MOE) formulated the Designing Quality Learning Spaces (DQLS) document to direct the development of suitable indoor environmental quality (IEQ), which includes indoor air quality (IAQ) and thermal comfort, within New Zealand’s classrooms and learning areas. The DQLS is intended to foster optimal learning environments in new school constructions. Initially, it was released in 2007 as separate documents for IAQ and thermal comfort, these guidelines were amalgamated and revised in 2017 (version 1.0). A further update in 2022 (version 2.0) introduced new benchmarks for air quality, thermal performance, heating, and ventilation within classrooms. DQLS 2.0 also delineates mandatory air quality, temperature, thermal performance, and indoor environment monitoring stipulations. These reinforced mandatory requirements in the updated DQLS 2.0 correspond with the MOE’s 2030 School Property Strategy. This strategy accentuates student well-being and creates high-quality learning spaces accommodating diverse teaching and learning approaches. The DQLS 2.0 update mirrors the evolving context of educational space design and commissioning, which is now overseen by regulatory bodies [
17].
Through the DQLS V 2.0, the NZ Ministry of Education prioritised healthy classrooms by emphasising improved indoor air quality and thermal comfort. These DQLS requirements, which also cover acoustics and lighting, call for a comprehensive design approach. Given the complex interplay of variables within indoor environmental quality (IAQ, thermal comfort, acoustics, and lighting), designers must consider their combined effects during both the design and commissioning phases to ensure an optimal learning environment [
17,
18].
Hence, New Zealand’s commitment to incorporating best practices in sustainable educational spaces is well reflected in the Designing Quality Learning Spaces (V2.0) document. However, the efficacy of these guidelines in ensuring optimal building performance, particularly in the face of the nation’s diverse climate zones, warrants thorough investigation. Furthermore, a direct comparison with internationally recognised standards is essential to benchmark DQLS (V2.0) and identify potential areas for improvement. Building upon the findings of our prior research [
10,
15,
17,
18], which analysed the textual content of DQLS (V2.0) and international standards. This study employs building performance simulation to evaluate the practical impact of these differences on classroom performance.
2.2. Multi-Criteria Optimisation of Building Design
Henceforth, assessing indoor environmental quality in educational spaces requires a holistic approach incorporating multi-criteria optimisation of indoor air quality (IAQ) and thermal comfort (TC) factors, as established guidelines maintain. A key component of this approach is Building Performance Assessment (BPA), which uses computational models to forecast and analyse building performance across various aspects. BPA employs simulation to evaluate airflow patterns for IAQ, assessing ventilation effectiveness. For TC models, heat transfer and occupant comfort consider temperature, humidity, and radiant heat. During the design phase, simulation software thoroughly evaluates diverse design parameters, including ventilation strategies, material selection, and building envelope. The energy assessment enables the calculation of heating and cooling loads, along with infiltration and natural ventilation loads. This allows designers to explore scenarios and their impact on IAQ metrics, such as carbon dioxide concentration and ventilation effectiveness, and TC indicators, like Predicted Mean Vote (PMV) and Predicted Percentage of Dissatisfaction (PPD). Simultaneously, the design process incorporates relevant IAQ and TC standards and guidelines, ensuring simulated performance aligns with recommended benchmarks. This iterative process, which integrates simulation-driven insights with guideline adherence, results in classroom designs that meet and exceed performance expectations for both IAQ and TC, creating healthier and more productive learning spaces.
Recent advancements in building optimisation have highlighted the significance of evolutionary computation in addressing complex architectural challenges [
19]. This approach facilitates the identification of optimal or near-optimal solutions through systematic parameter variation within defined design constraints [
20,
21]. Parametric analysis enables early stage performance evaluation across multiple design configurations, supporting enhanced energy efficiency outcomes while maintaining cost-effectiveness [
19]. The widespread adoption of computational design tools in architectural practice reflects their growing importance in addressing environmental challenges. Early stage performance analysis enables practitioners and researchers to evaluate critical design parameters, including volumetric composition, spatial configuration, and envelope systems. This proactive approach optimises energy efficiency while maintaining cost-effectiveness throughout the design process. Integrating these analytical tools empowers designers to make informed decisions based on quantifiable performance metrics before significant resources are committed to development [
22].
Various software, from comprehensive building analysis to specifically calibrated platforms, is designed for building performance simulations. A critical distinction exists between simulation engines, which process complex thermodynamics and build science calculations and modelling interfaces [
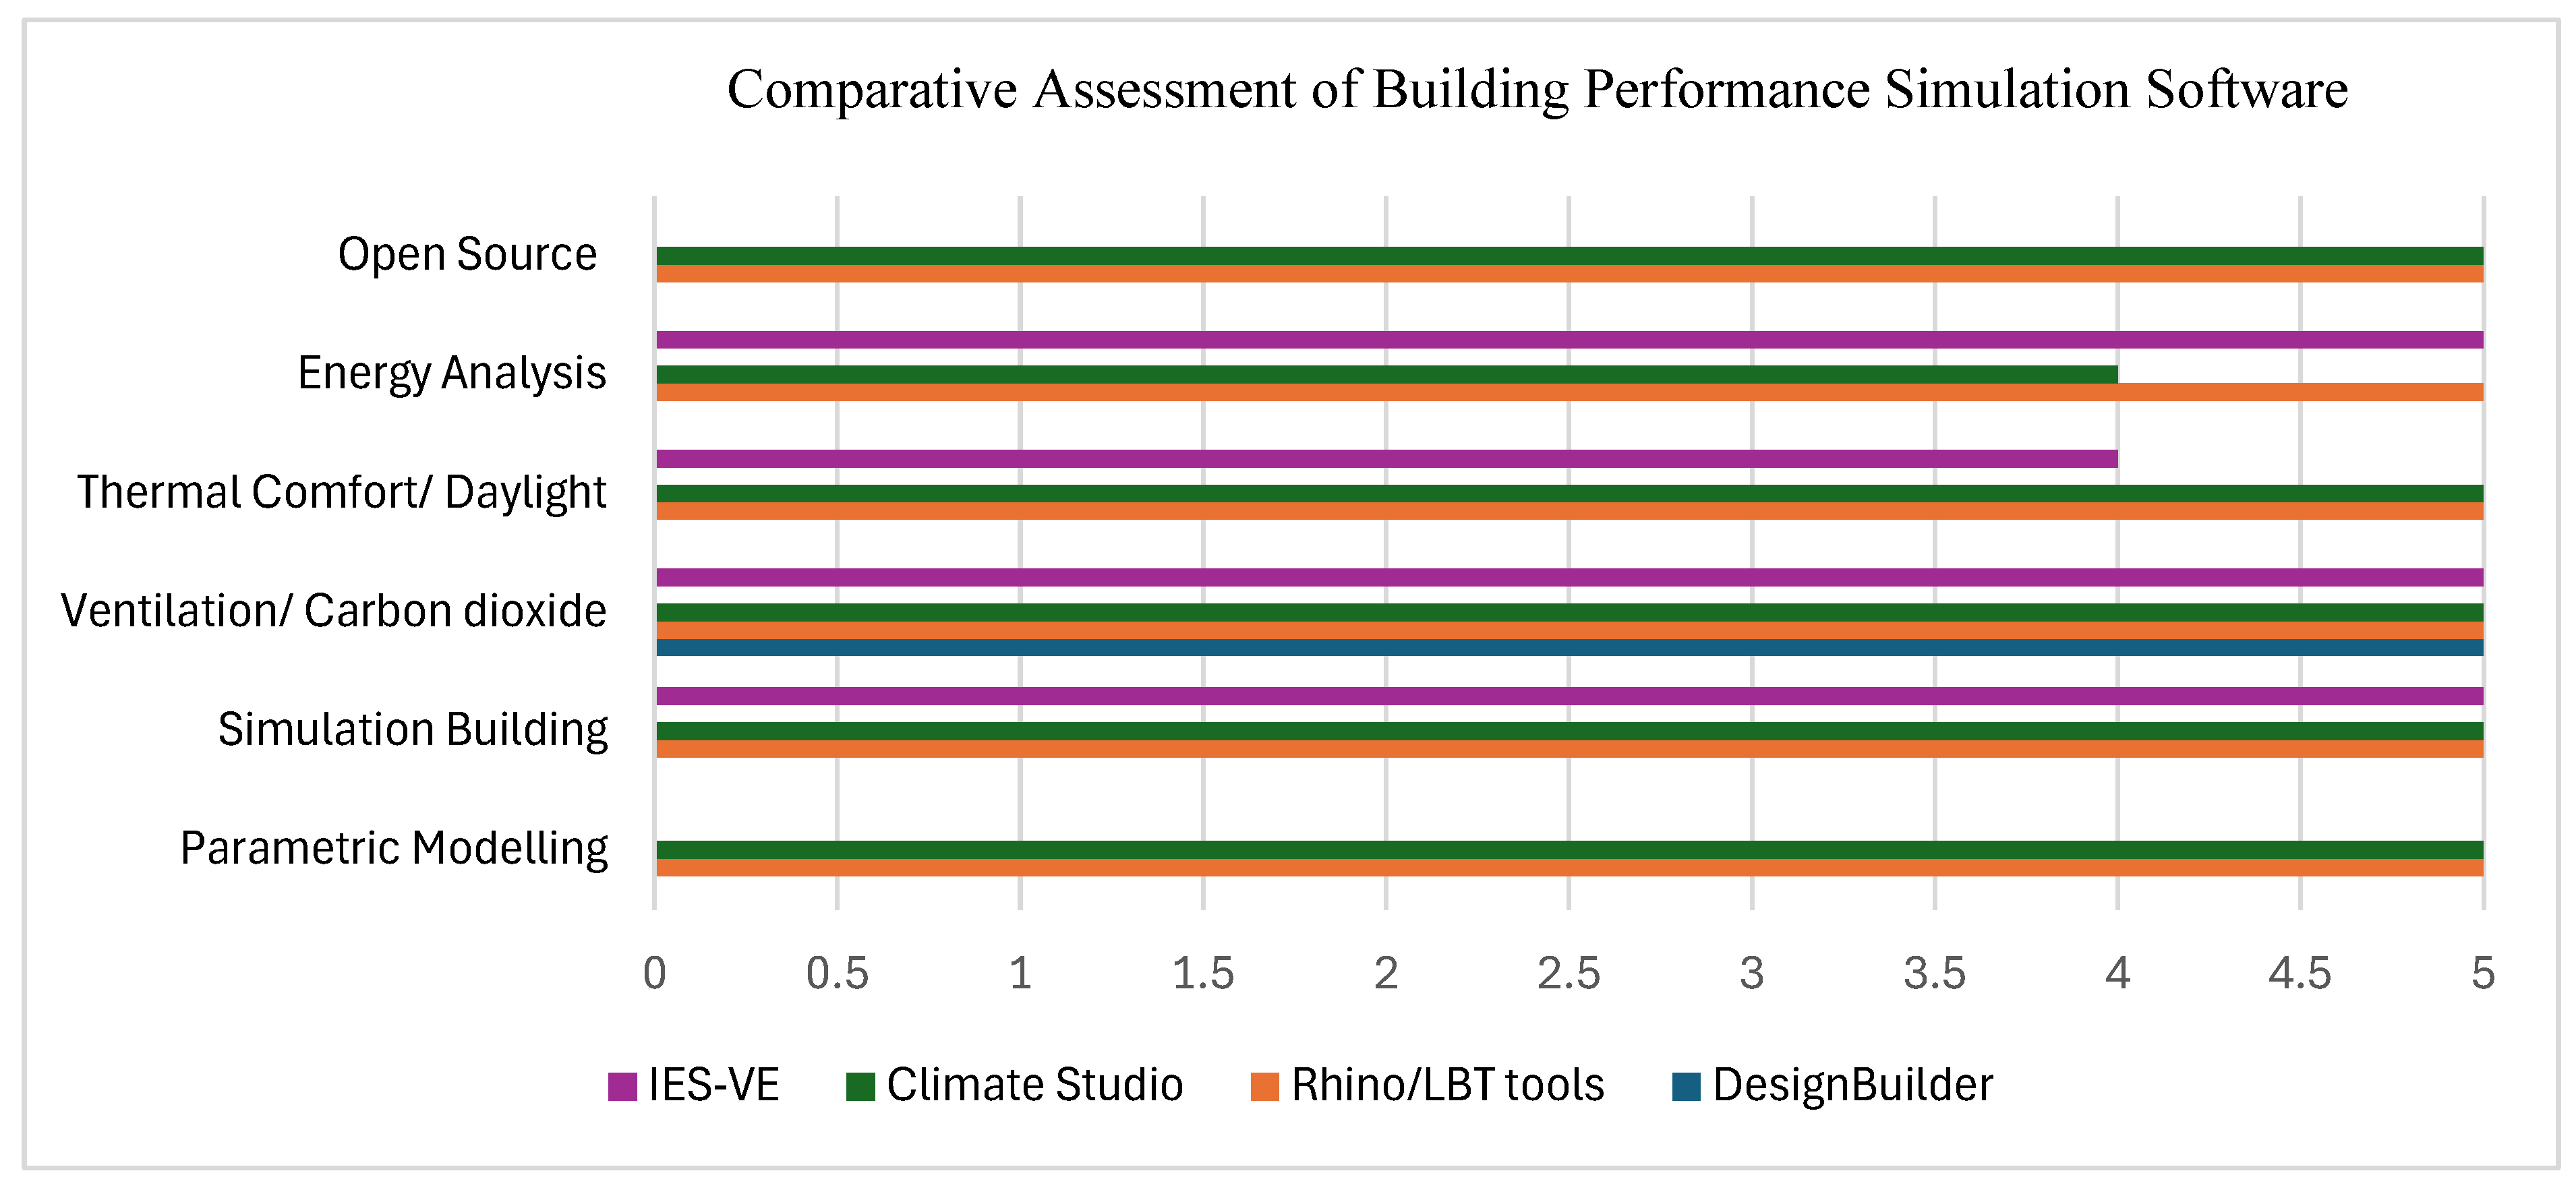
23]. The IES-VE and Design Builder software have established an early grasp on architectural design for early stage construction. IES-VE showed strong capabilities in simulation building and ventilation analysis but scored lower in energy analysis. Design Builder, while powerful for ventilation and carbon dioxide analysis, was not evaluated for other parameters due to licensing limitations that restricted its application across all assessment areas in this study [
24]. Notable among these is Rhinoceros, which leverages the Grasshopper plug-in ecosystem for energy simulation. This ecosystem’s Ladybug Tools (LBT) and Honeybee Tools (HBT) framework facilitates complete numerical building analysis by integrating Energy Plus and open foam [
4,
25,
26,
27,
28,
29]. Climate Studio, another Grasshopper-based application, offers comparable functionality to LBT through a streamlined interface without open-source accessibility. In contrast, Sefaira, integrated with SketchUp, provides basic functionality but lacks advanced modelling capabilities. Though mentioned in our initial software review and briefly explored, it was ultimately excluded from the final comparison due to its limited capabilities for detailed IAQ analysis and carbon dioxide concentration modelling, which are critical components of this research [
25].
A comparative analysis of building performance simulation software was conducted to identify the most suitable tool for this research. The evaluation focused on six key parameters essential for analysing IAQ and thermal comfort in educational spaces: open-source accessibility, energy analysis capabilities, thermal comfort and daylight modelling, ventilation and carbon dioxide simulation, whole building simulation, and parametric modelling capabilities.
Figure 1 presents a comparative assessment of four leading building performance simulation tools: IES-VE, Climate Studio, Rhino with Ladybug Tools (LBT), and Design Builder. Each software was rated on a scale of 0–5 for each parameter, where 0 indicates no capability and 5 indicates comprehensive capability.
Based on this comprehensive evaluation, Rhino 7 with Ladybug Tools (LBT) was selected as the primary software platform for this study due to its superior combination of open-source accessibility, advanced energy analysis capabilities, comprehensive thermal comfort and IAQ modeling, and robust parametric simulation capabilities all essential for accurately modeling and analysing post-COVID IAQ and thermal comfort requirements in New Zealand primary schools.
Figure 2 provides an example of a Grasshopper Script for Building Performance Assessment.
BPA offers a quantitative framework for evaluating the effects of design choices on IAQ and TC design guidelines [
30]. Using simulation allows designers to test various design options before construction, thus avoiding costly rework. For example, different ventilation system layouts can be simulated to determine the most effective strategy for fresh air delivery and carbon dioxide concentrations. Similarly, the influence of window placement and shading devices on daylighting and solar gain can be evaluated to optimise thermal comfort and minimise energy use. BPA also aids in identifying potential issues, such as stagnant air pockets or areas of excessive heat gain, enabling proactive solutions during design. This proactive approach, facilitated by BPA, significantly contributes to creating high-performing classroom environments prioritising occupant well-being and learning outcomes [
1].
This study evaluates several critical Indoor Air Quality (IAQ) and Thermal Comfort (TC) parameters essential for optimising educational environments. The analysis focuses on key Thermal Comfort Percentage (TCP), including Heating sensation percentage (HSP) and Cooling sensation percentage (CSP), which establish temperature thresholds. We also examine energy performance indicators such as heating load, cooling load, and infiltration load measured in kilowatt-hours per square meter per year (kWh/m
2/year) that quantify energy requirements for maintaining comfortable conditions. For air quality assessment, carbon dioxide (CO
2) concentration (measured in parts per million, ppm) serves as the primary indicator of ventilation adequacy, with levels below 800 ppm considered optimal for educational settings under post-COVID guidelines. Additionally, we analyse Air Change per Hour (ACH) and ventilation rates (L/s/p) to evaluate air exchange efficiency. Daylight metrics, including Daylight Autonomy (DA) and Useful Daylight Illuminance (UDI), are considered for their impact on both energy efficiency and learning environments. These parameters interact in complex ways, creating both synergies and trade-offs in building performance.
Section 4 provides a comprehensive explanation and measurement methodologies for each parameter in the context of New Zealand’s DQLS V2.0 standards and their comparison with international OECD benchmarks.
2.3. New Zealand Climate Zones
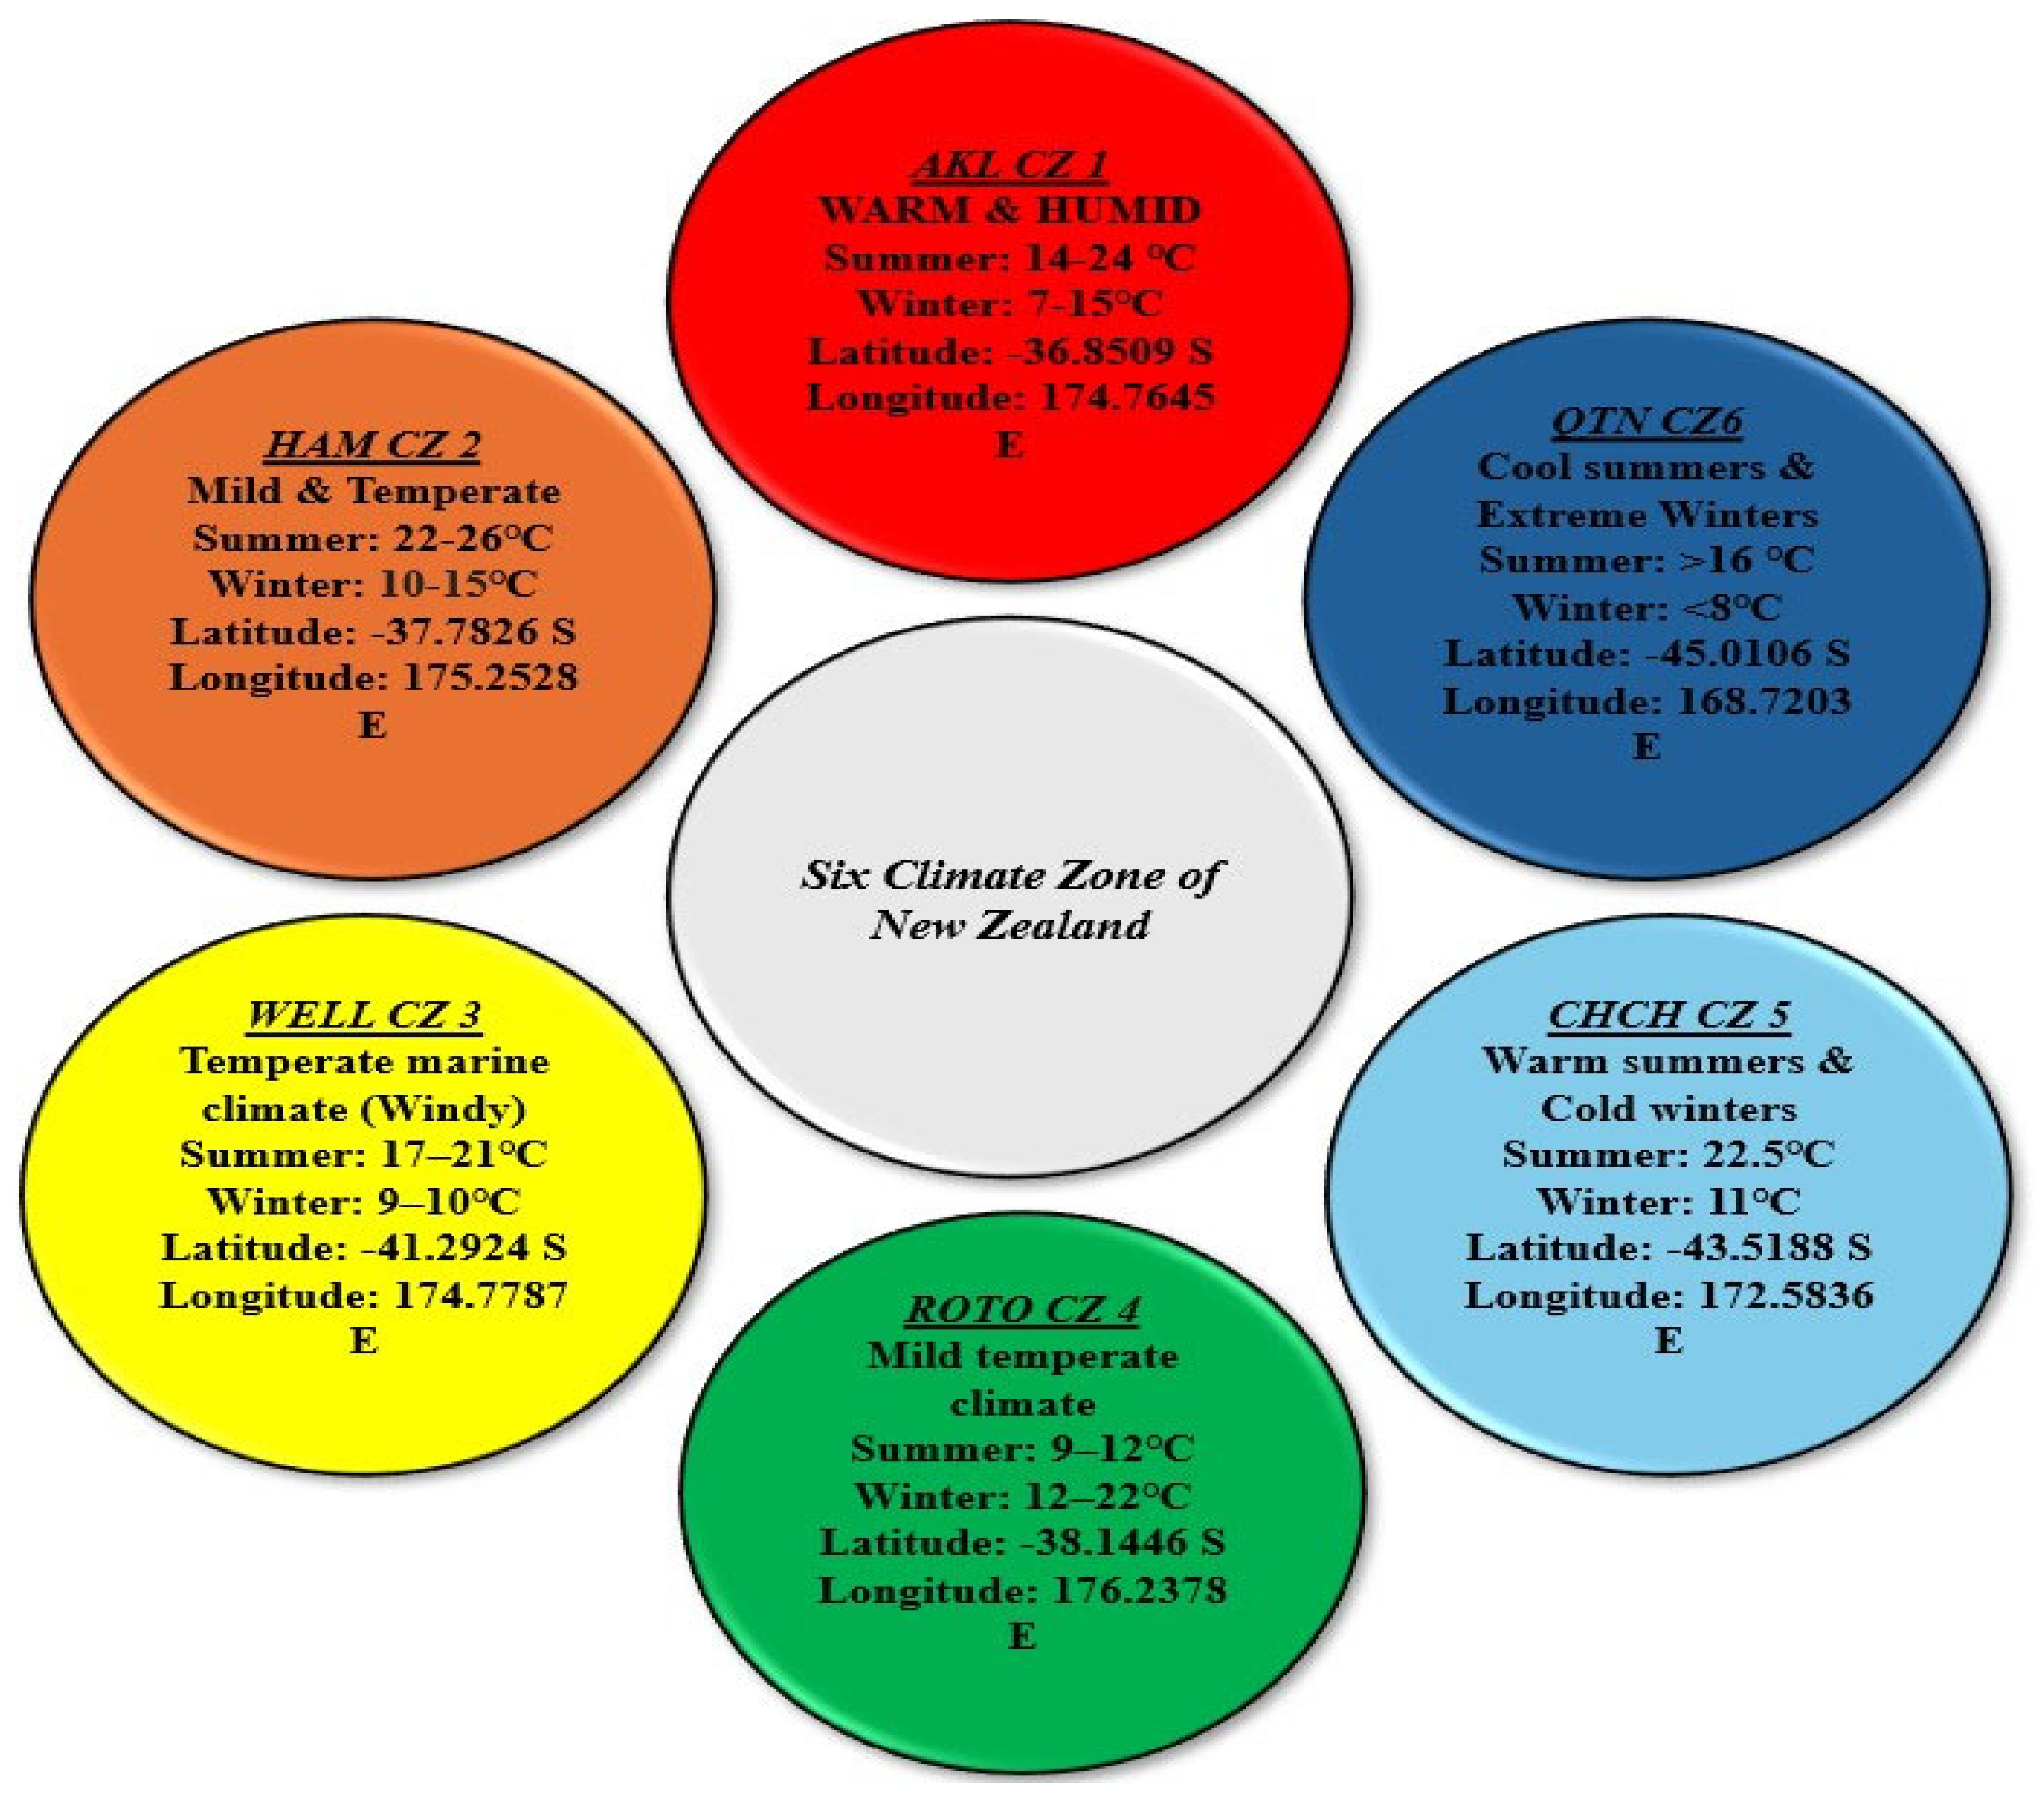
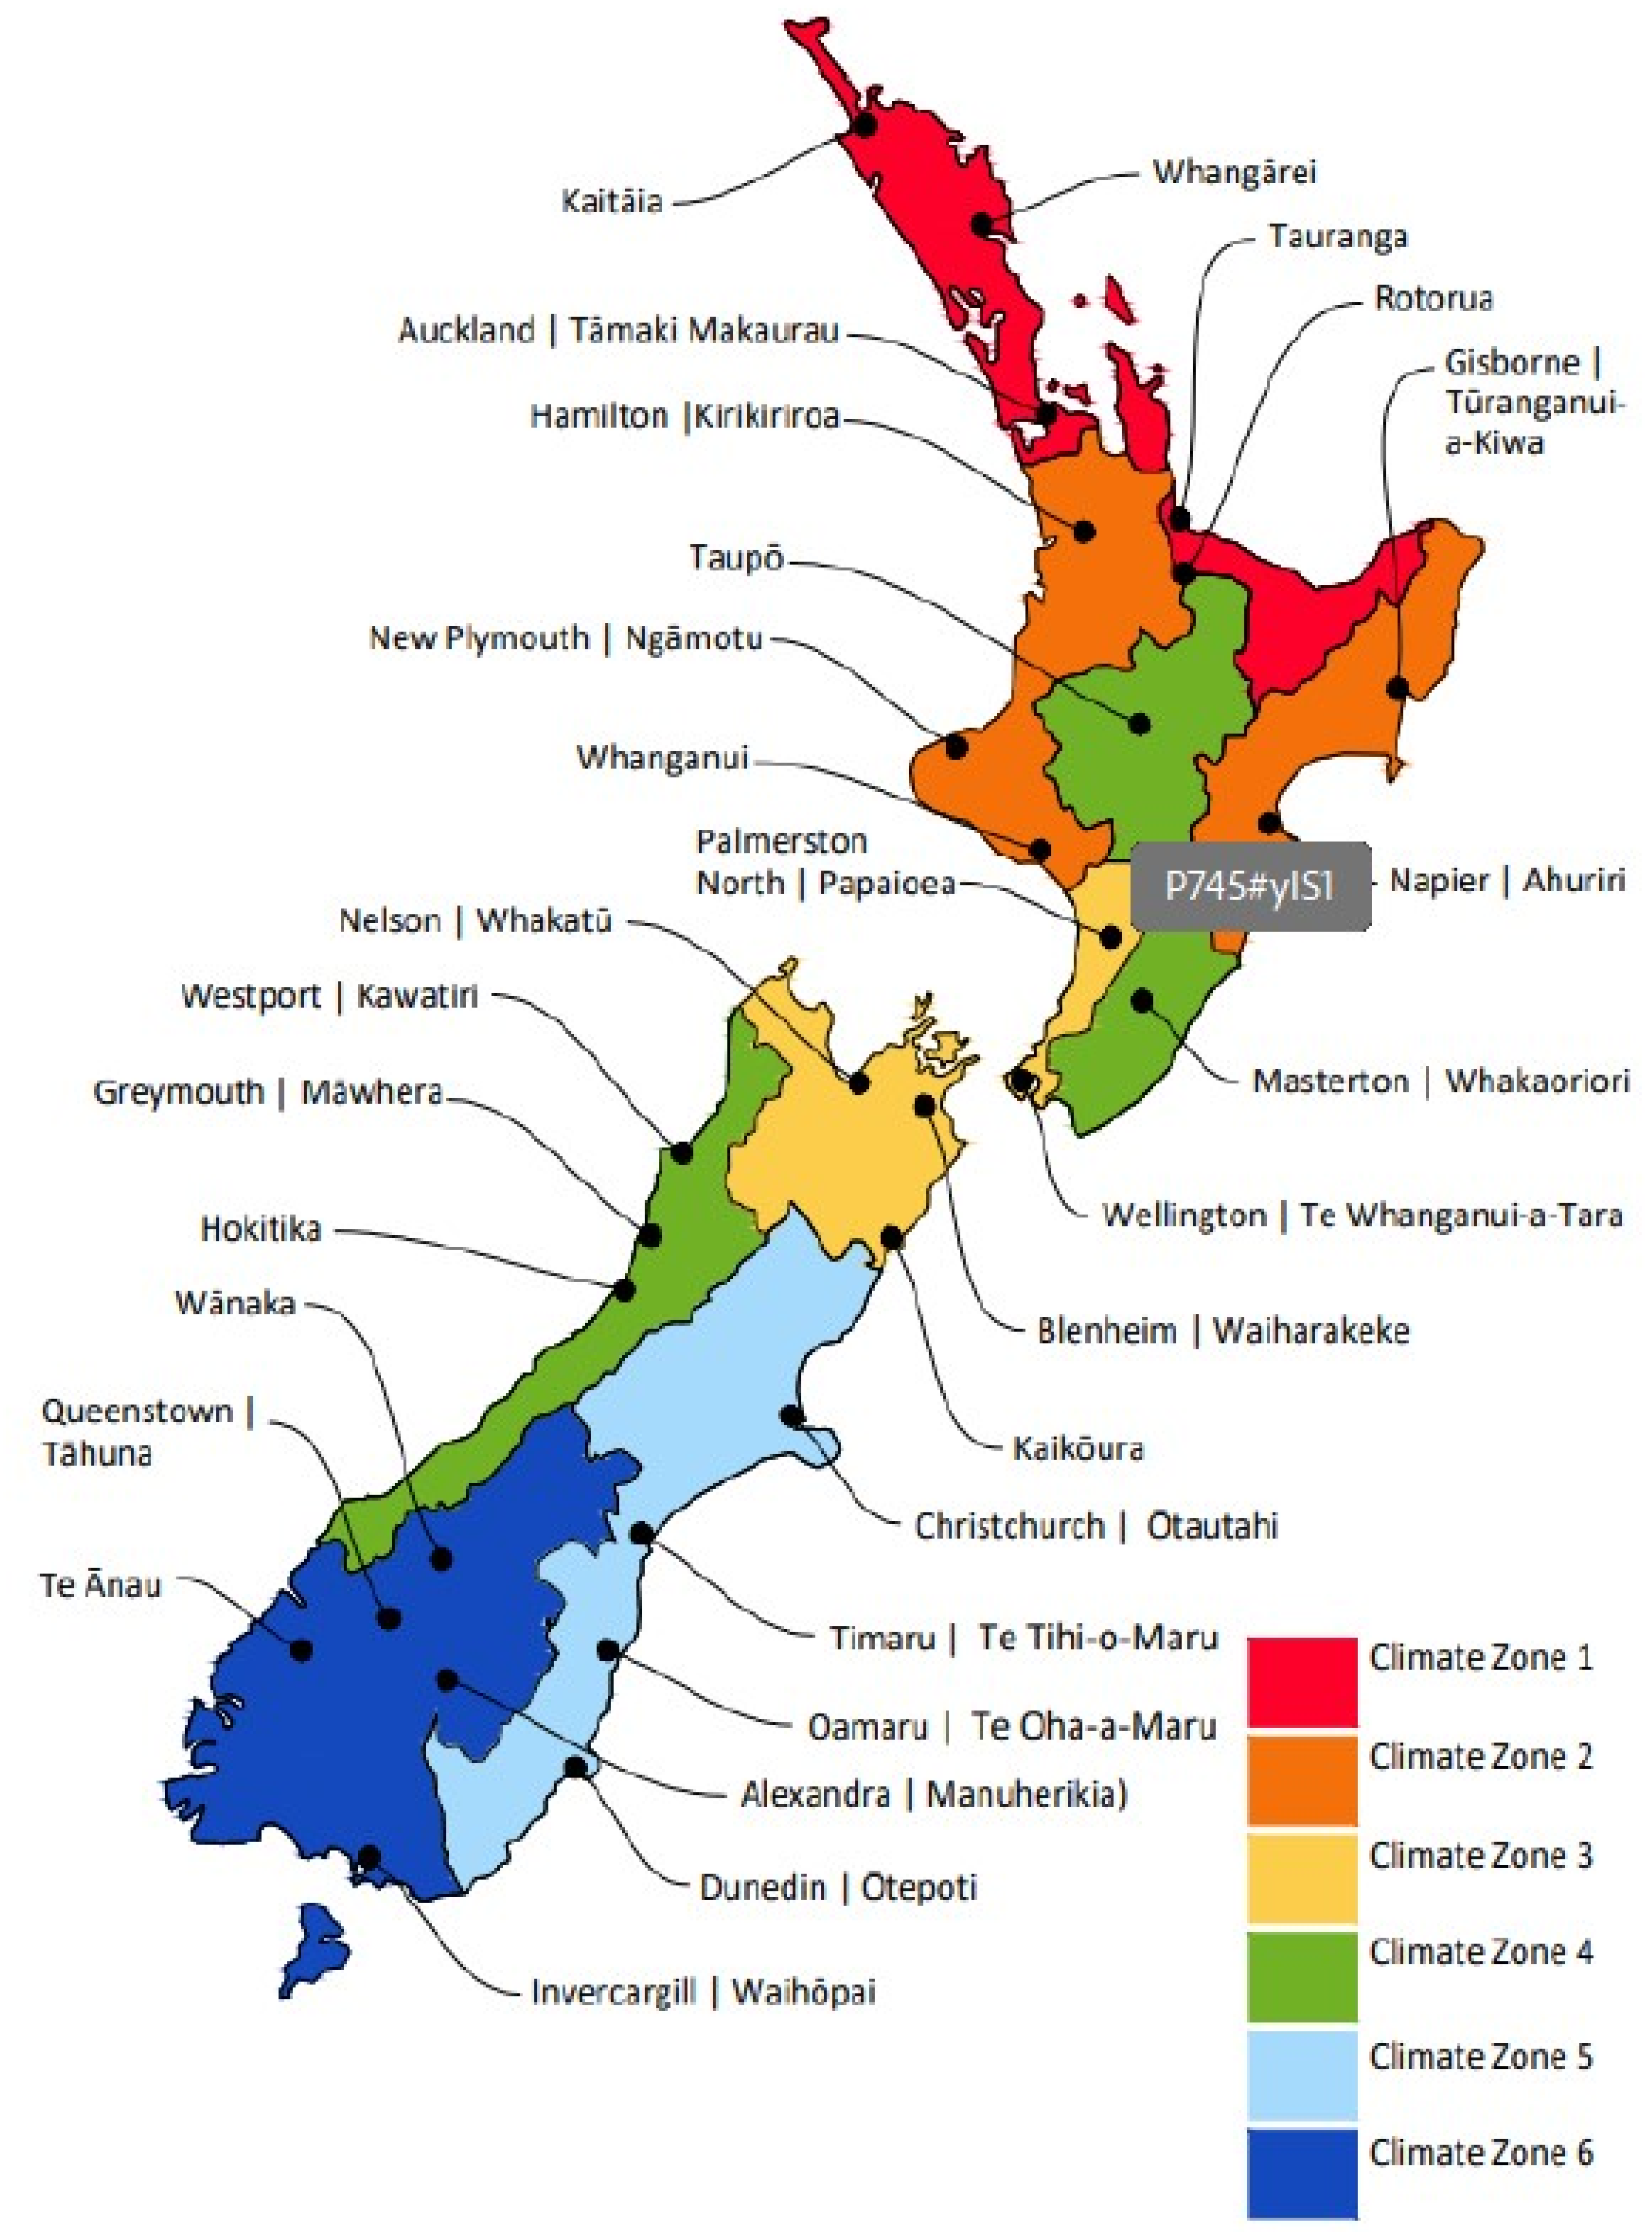
New Zealand, situated in the South Pacific region, exhibits diverse climatic conditions. The nation is classified into six distinct climatic zones, as defined by the New Zealand Building Code [
31,
32]. Six of New Zealand’s major urban centres, each representative of a specific climatic zone, were selected in case studies for Avalon and Canterbury Block parametric modelling. The accompanying
Figure 3 and
Figure 4 below illustrate the geographical placement of the cities and their respective climatic zones. This selection allows for a comprehensive assessment of building performance across the varied environmental contexts found within New Zealand.
Figure 3 explains each of the six climate zones of New Zealand, offering the type of weather conditions in both the summer and winter seasons. In addition, each major urban city has its exact latitude and longitude location. To better understand each climate zone location within two different islands, the North Island and South Island, refer to
Figure 4 below. The selection of colour in
Figure 3 is synced with
Figure 4.
3. Methods
The study aims to ascertain the suitability of current IAQ and Thermal Comfort guidelines in DQLS (V2.0), compared to OECD standards and design optimal post-COVID-19 IAQ and TC design guidelines for New Zealand Primary schools. Achieving the above aim is further categorised into two individual objectives:
Research Objective 1: To simulate the Indoor Air Quality (IAQ) and Thermal Comfort (TC) design guidelines from Design Quality Learning Spaces (DQLS) Version 2.0 and Organisation for Economic Co-operation and Development (OECD) standards to identify limitations and appropriateness for post-COVID-19 primary school classrooms in six climate zones of New Zealand.
Research Objective 2: To design and compare the optimal IAQ and TC guidelines for post-COVID-19 with OECD standards, developing context-specific recommendations for New Zealand primary schools.
To achieve these objectives, we conducted a building performance assessment (BPA) using a parametric modelling approach to analyse and optimise the architectural design features of school classrooms. BPA used in this study focuses on IAQ, thermal performance, energy efficiency and daylighting assessment. The classroom reference building—Avalon—was used as the basis for the detailed parametric analysis in six climate zones of New Zealand.
The multi-criteria optimisation for optimal IAQ, TC, ventilation strategy and carbon dioxide variables are described in
Table 1 below:
An evolutionary computation via the Ladybug tool (LBT) was followed in correlation to the Honeybee (HB) plug-in for Grasshopper (GH)/Rhino, which was used to optimise (Ladybug Tools, 2024 [
33]). The study is divided into four main parts:
Avalon classroom typology modelling in Rhino 7 software,
development of the GH classroom reference model,
performance analysis of case study building typologies (IAQ, TC, DA, and Energy analysis), and
parametric optimisation DQLS (V2.0) and the international standard set by OECD countries in six climate zones of New Zealand.
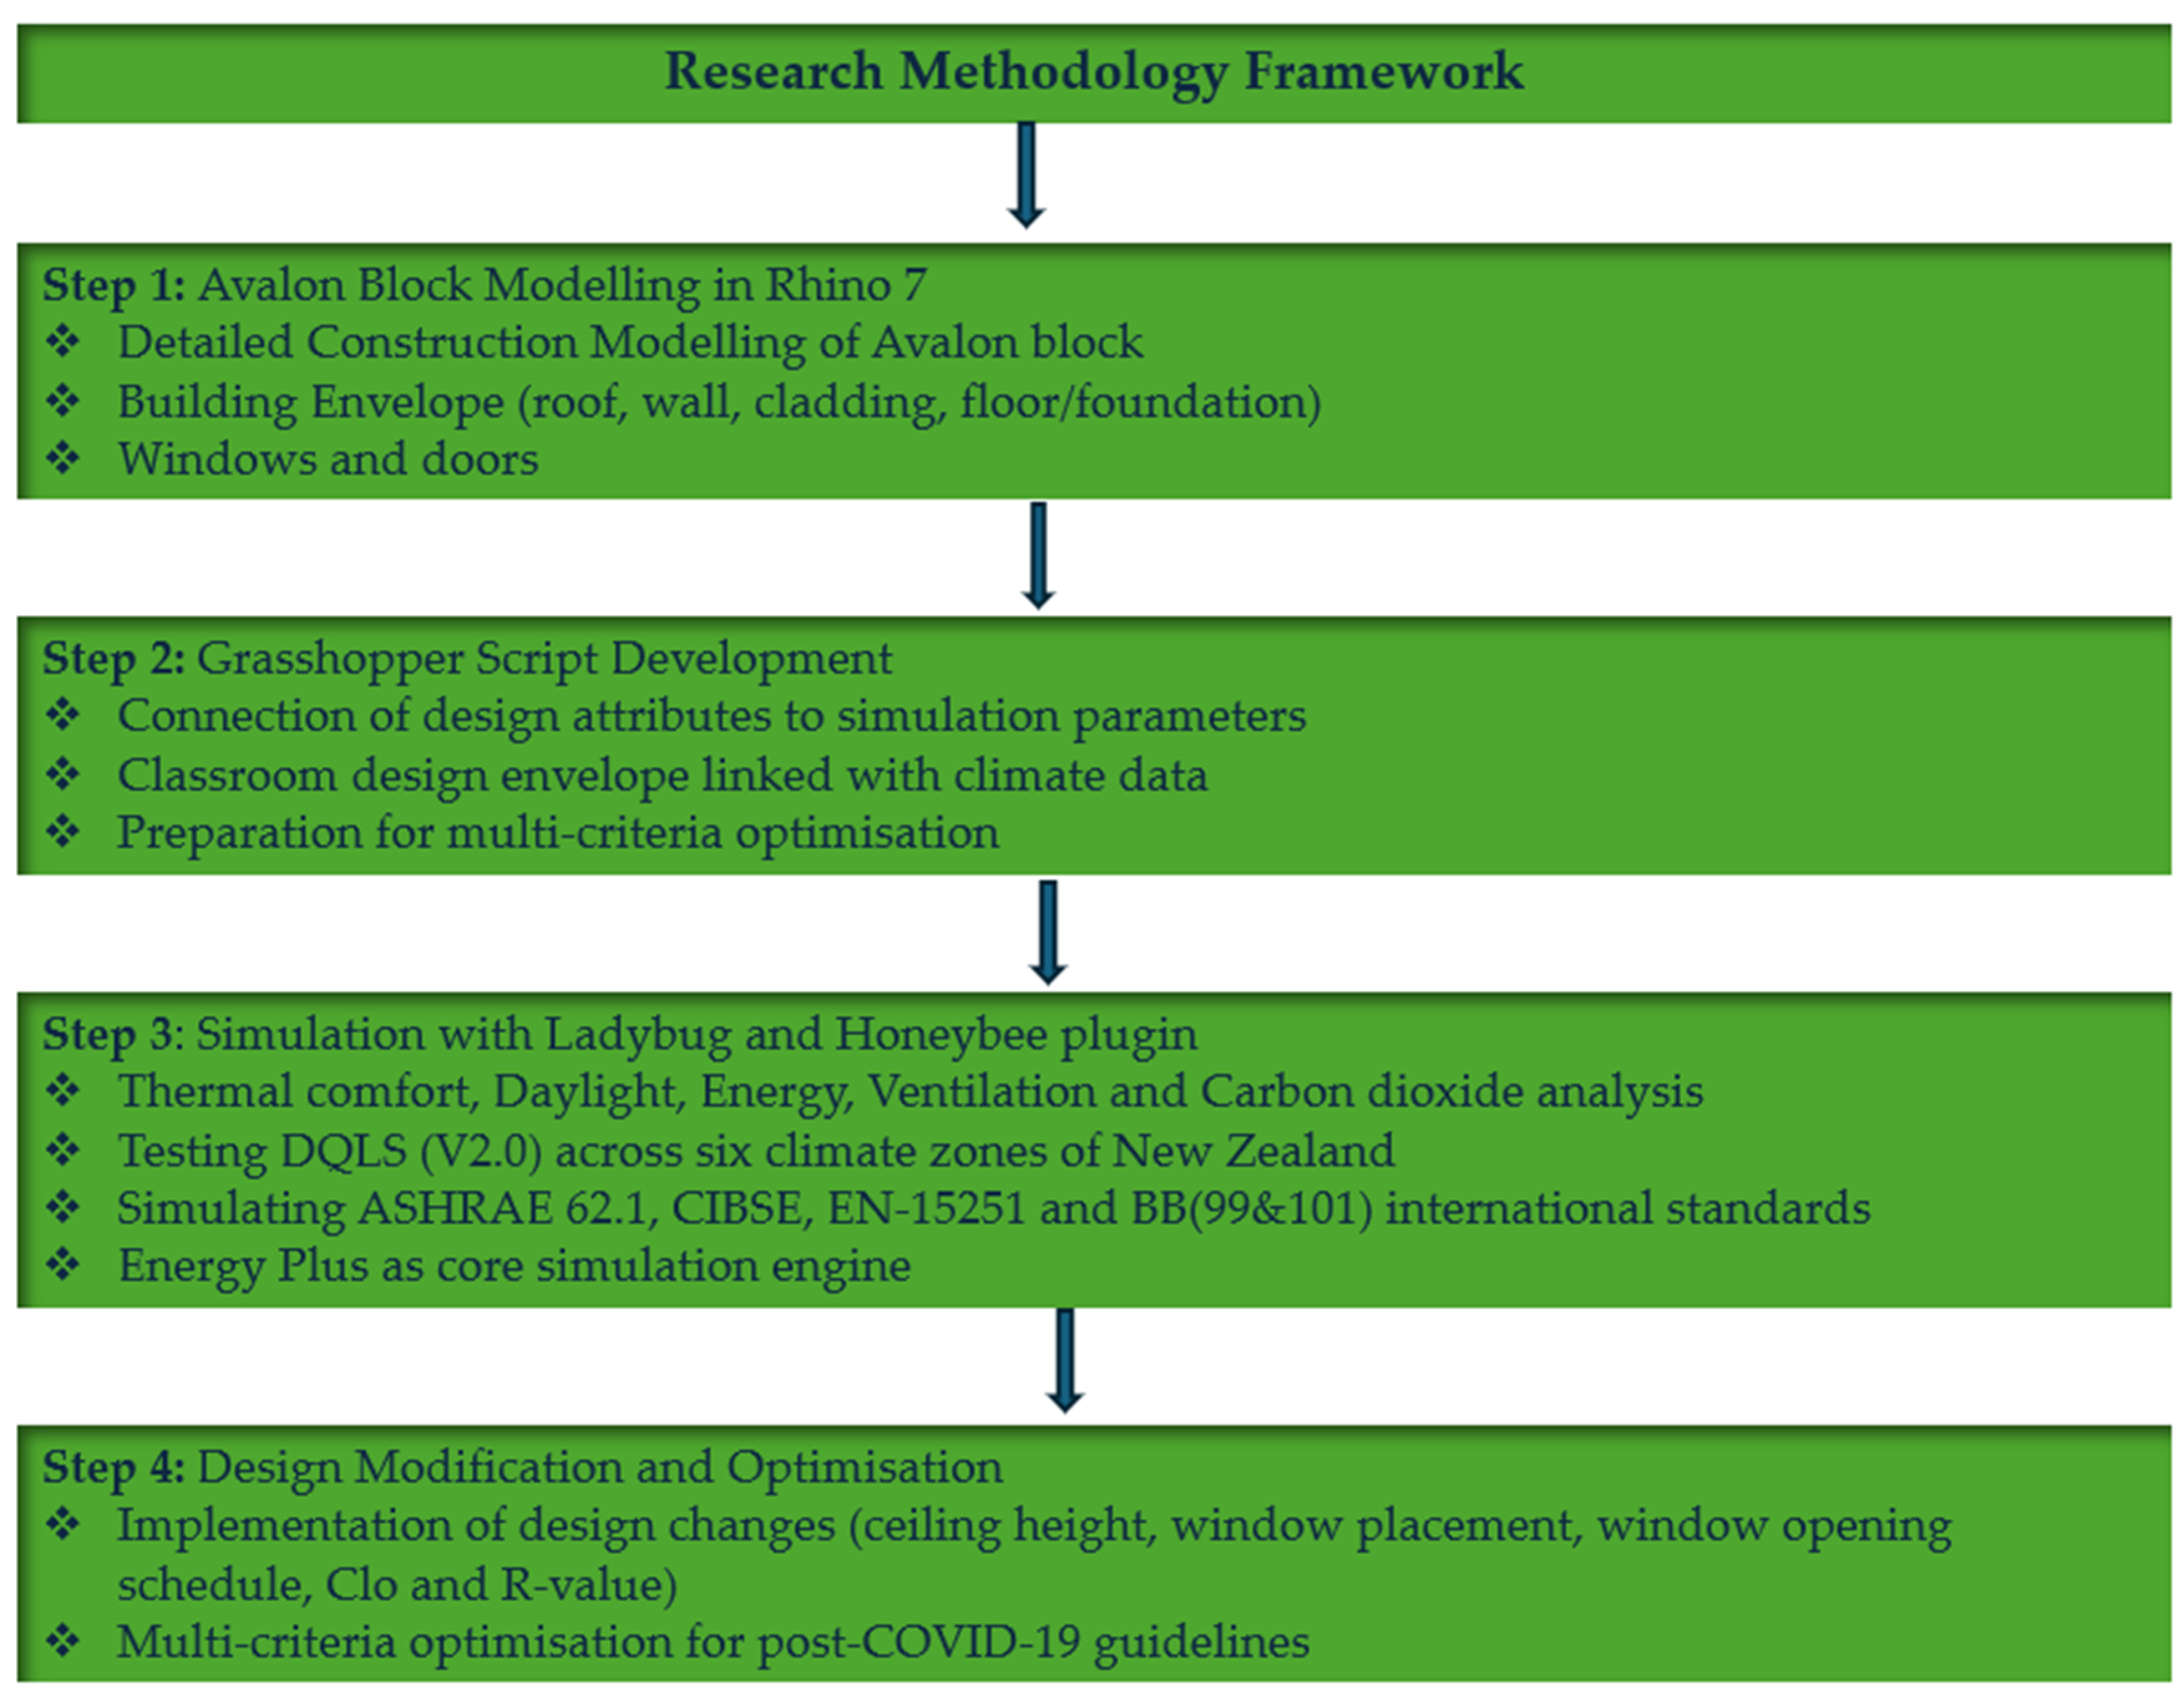
In the first step, as per design features, the Avalon block was modelled in the Rhino 7 software, keeping all the construction details for the building envelope (roof, walls/cladding, floor/foundations, year of construction) along with windows and door similar to the actual reference modelled in the documents [
34].
In the second step, the Grasshopper plugin developed the script for connecting the Avalon block’s design attributes to analyse the simulation steps. The Grasshopper script consists of several individual design attributes, such as a classroom design envelope connected with the climate data file.
In the third step, Ladybug and Honeybee tools were used from the database of the Grasshopper plugin to simulate thermal comfort, daylight analysis, energy analysis, ventilation, and carbon dioxide for DQLS (V2.0) in six climate zones of New Zealand. Later, ASHRAE 62.1, CIBSE, EN–15251, and BB (99 and 101) international standards were simulated individually in six climate zones of New Zealand. All the tools and plugins were run individually to minimise the bug error of margin for holistic analysis of multi-criteria optimisation until the complete script runs without showing any margin of error. This study employed Energy Plus as its core simulation engine. It enables detailed analysis of multiple building systems, including ventilation, carbon dioxide concentration, daylighting, energy loads, and thermal comfort, supporting comprehensive building performance evaluation using the Grasshopper plugin. The DQLS (V2.0) and international standards simulation were performed to identify the limitations and appropriateness of current IAQ and TC guidelines in both New Zealand primary school classroom typologies.
In the fourth step, based on the findings from prior simulations and holistic engineered solutions (literature review), certain changes were adopted to Avalon block design features, such as increased ceiling height, windows’ vertical placement, changes in R-value, and Clo insulation. Following the preparatory steps in
Figure 5 to the simulation assessment, the multi-criteria optimisation task was carried out to develop the optimal design guidelines for IAQ and TC in primary school classrooms for post-COVID-19 in six climate zones of New Zealand
3.1. Avalon Block (Reference Primary School Design)
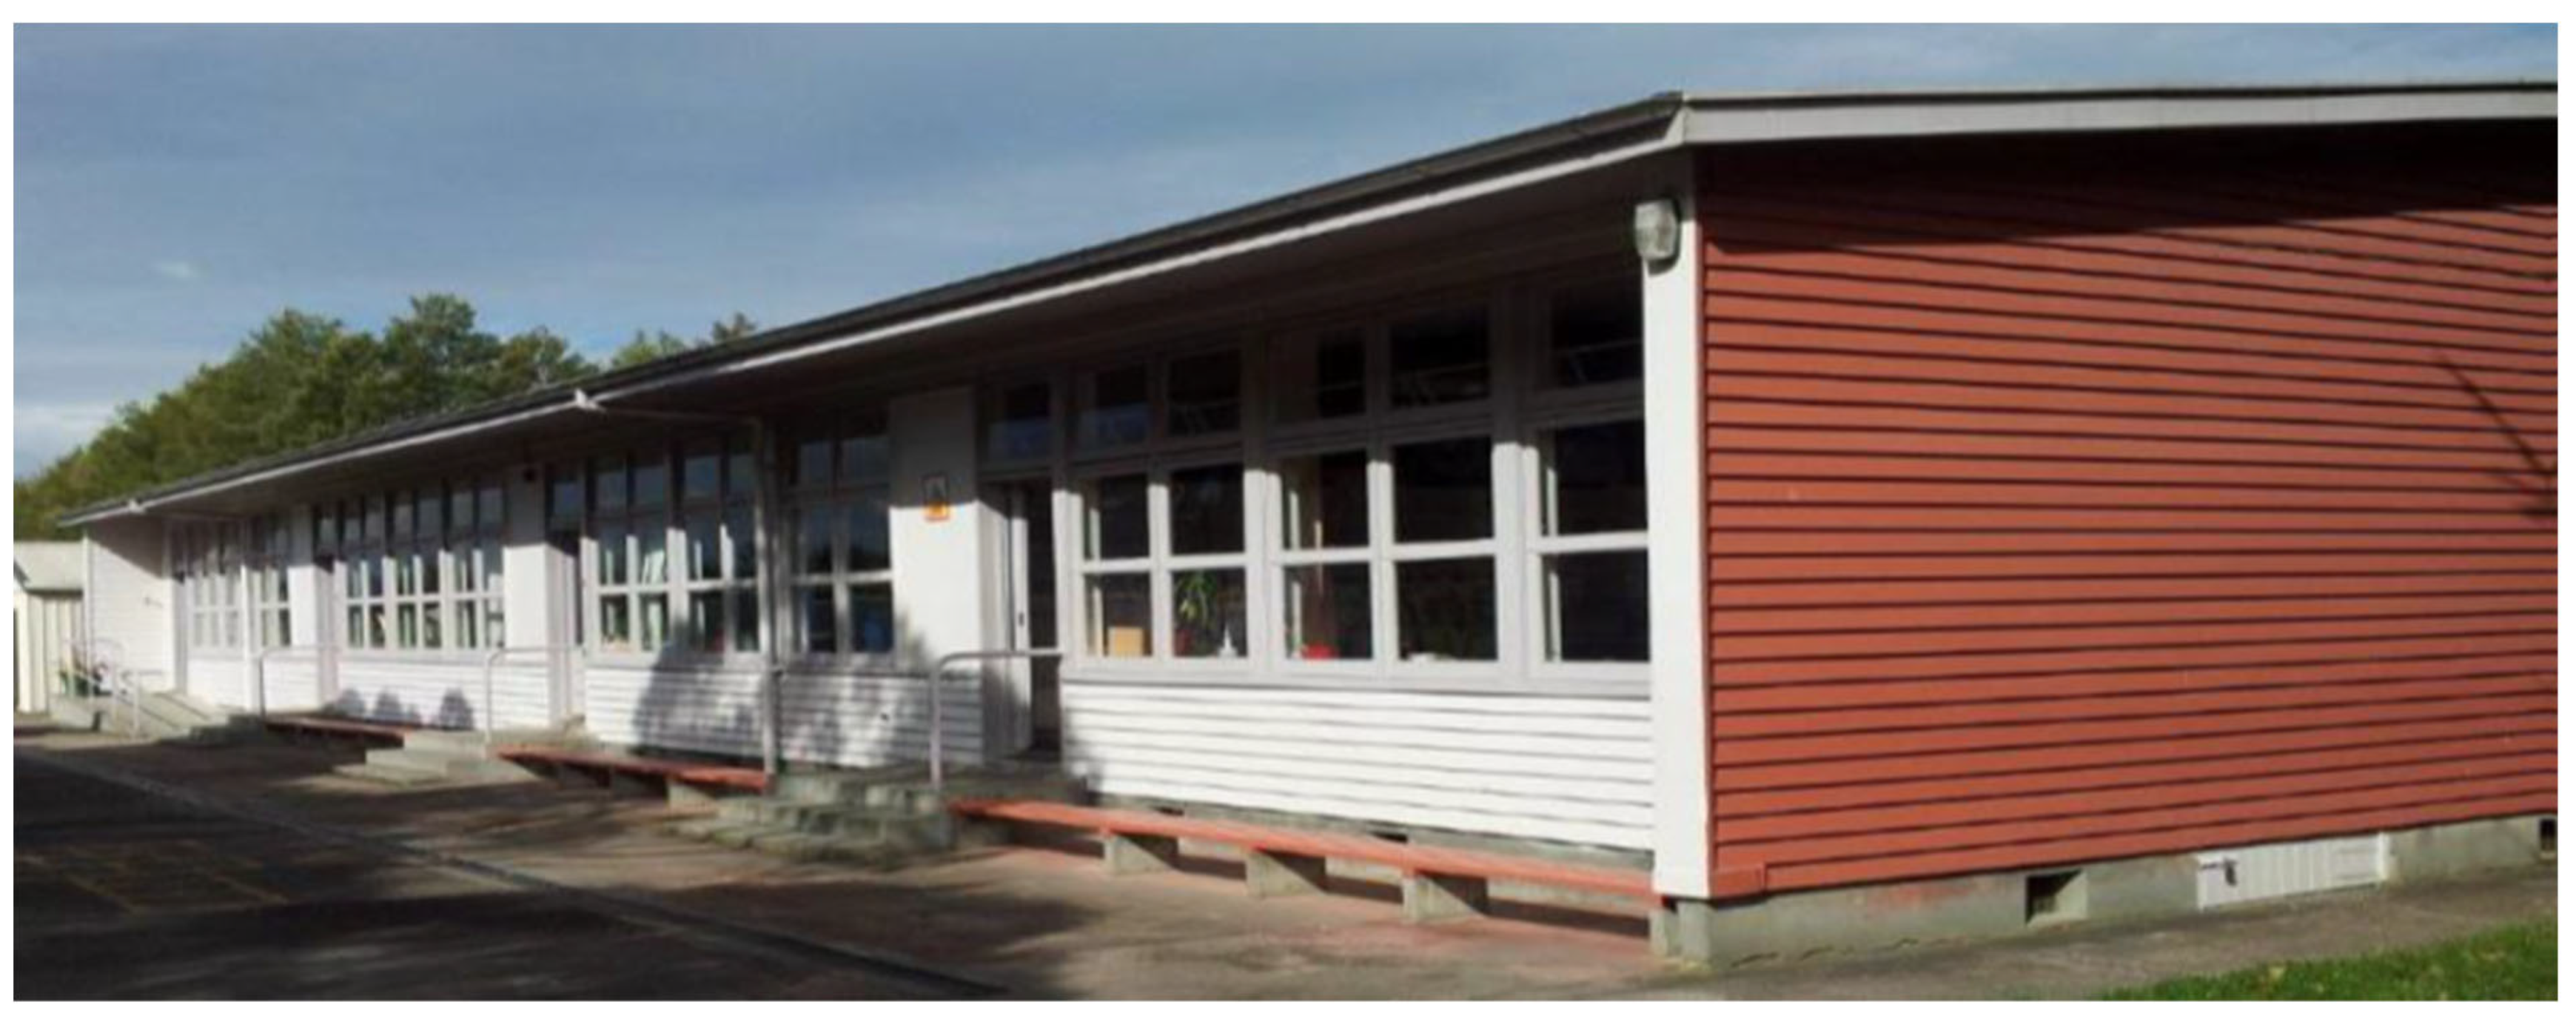
Built predominantly between 1955 and 1962, Avalon school blocks are renowned for their durable construction, structural soundness, resistance to weather, and flexibility to accommodate changing educational requirements. A typical Avalon unit is a single-story building with cloakrooms at the back of the classrooms, providing access to nearby toilet facilities. These classrooms are characterised by large, nearly floor-to-ceiling windows on the front facade and clerestory windows along the rear. The clerestory windows create distinct high and low ceiling areas within the classroom. Avalon blocks can be found in various configurations, ranging from single classrooms to multi-classroom setups of up to four consecutive units.
Table 2 below overviews Avalon block construction details [
34].
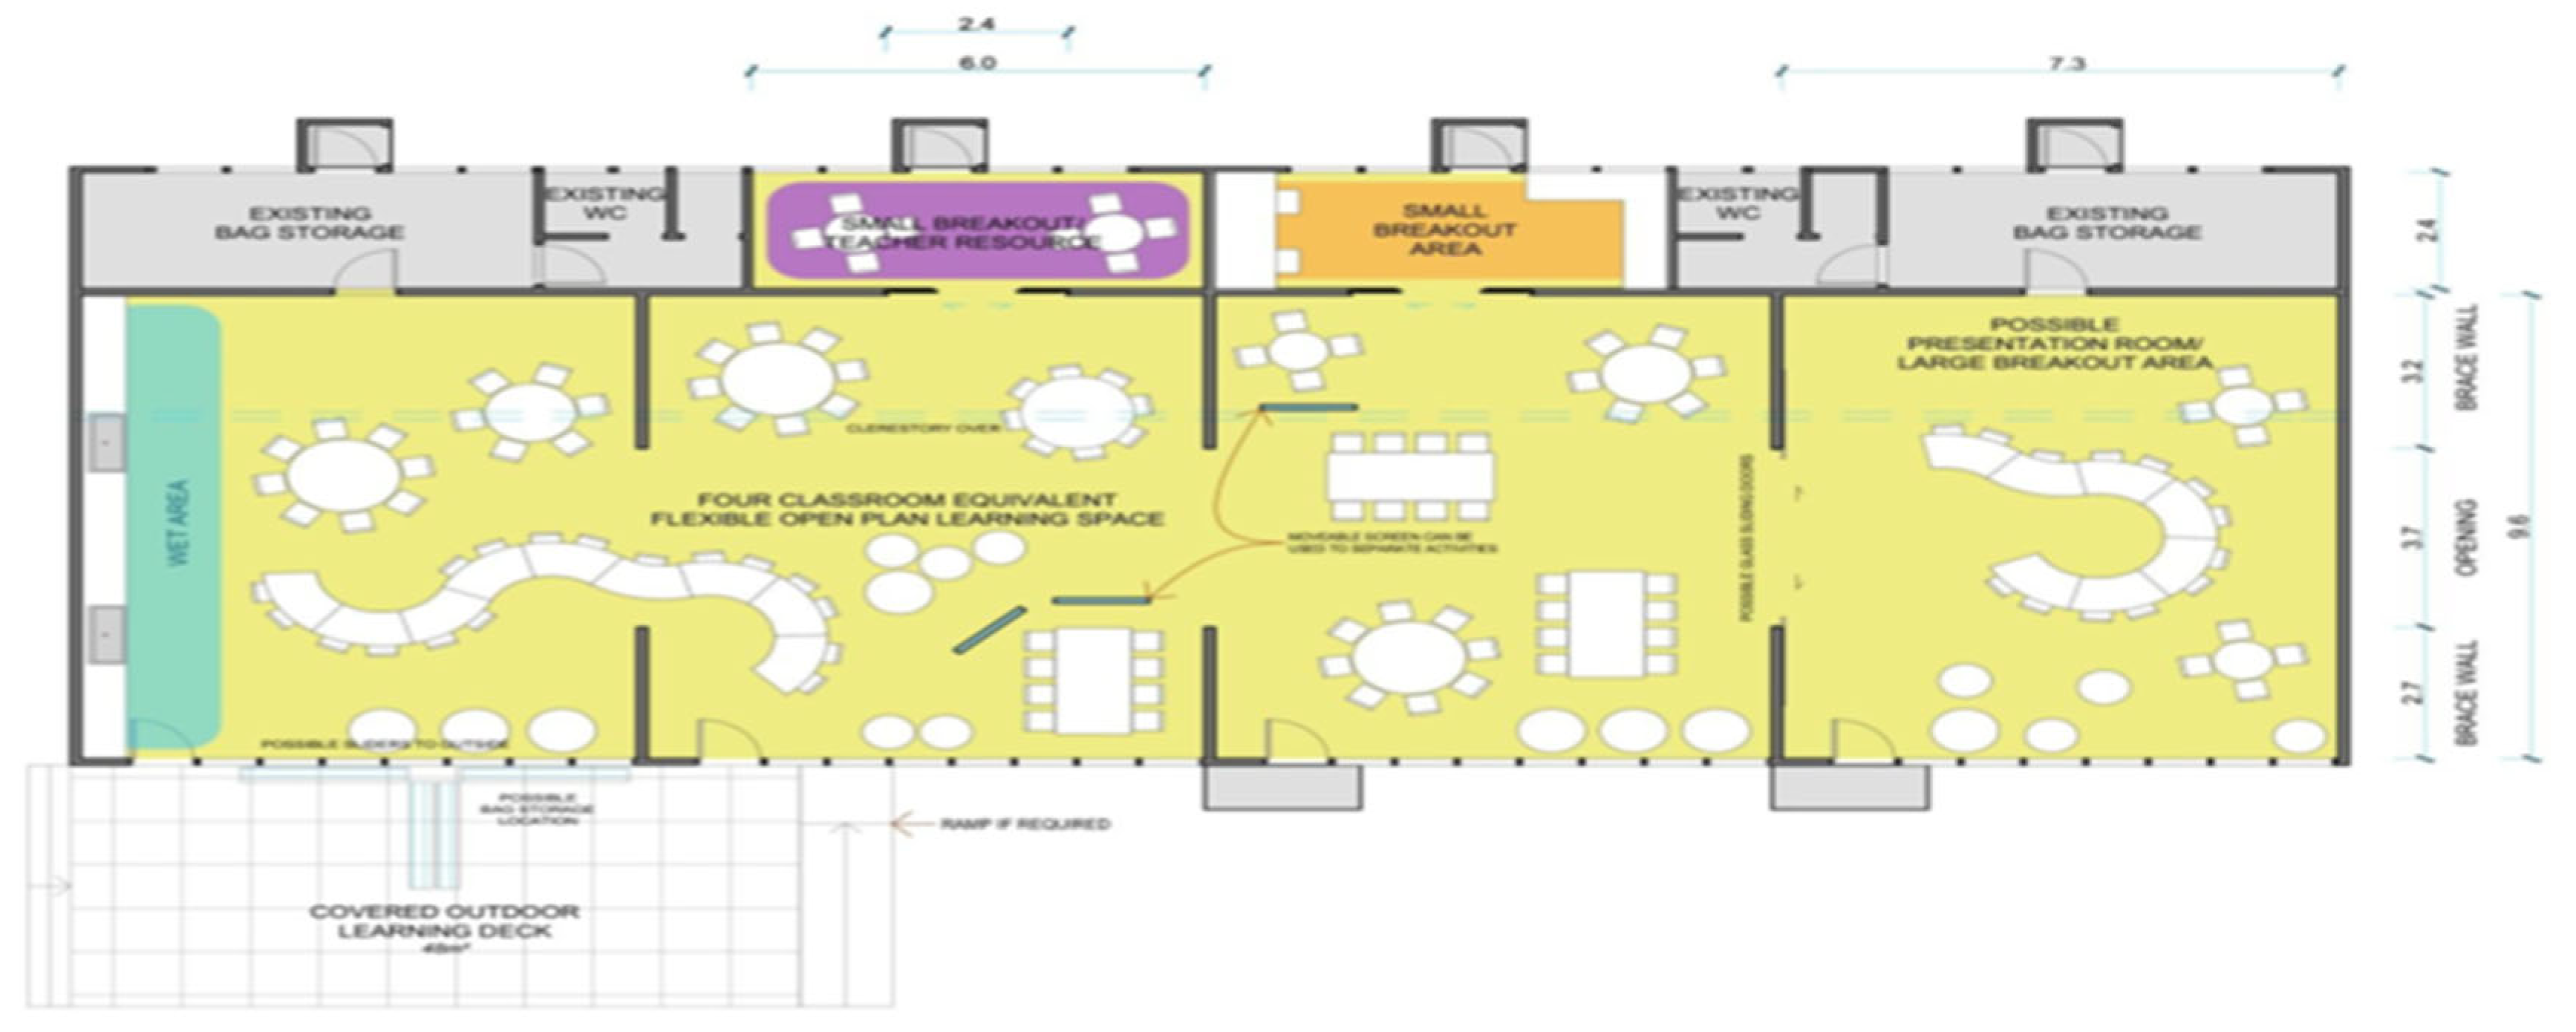
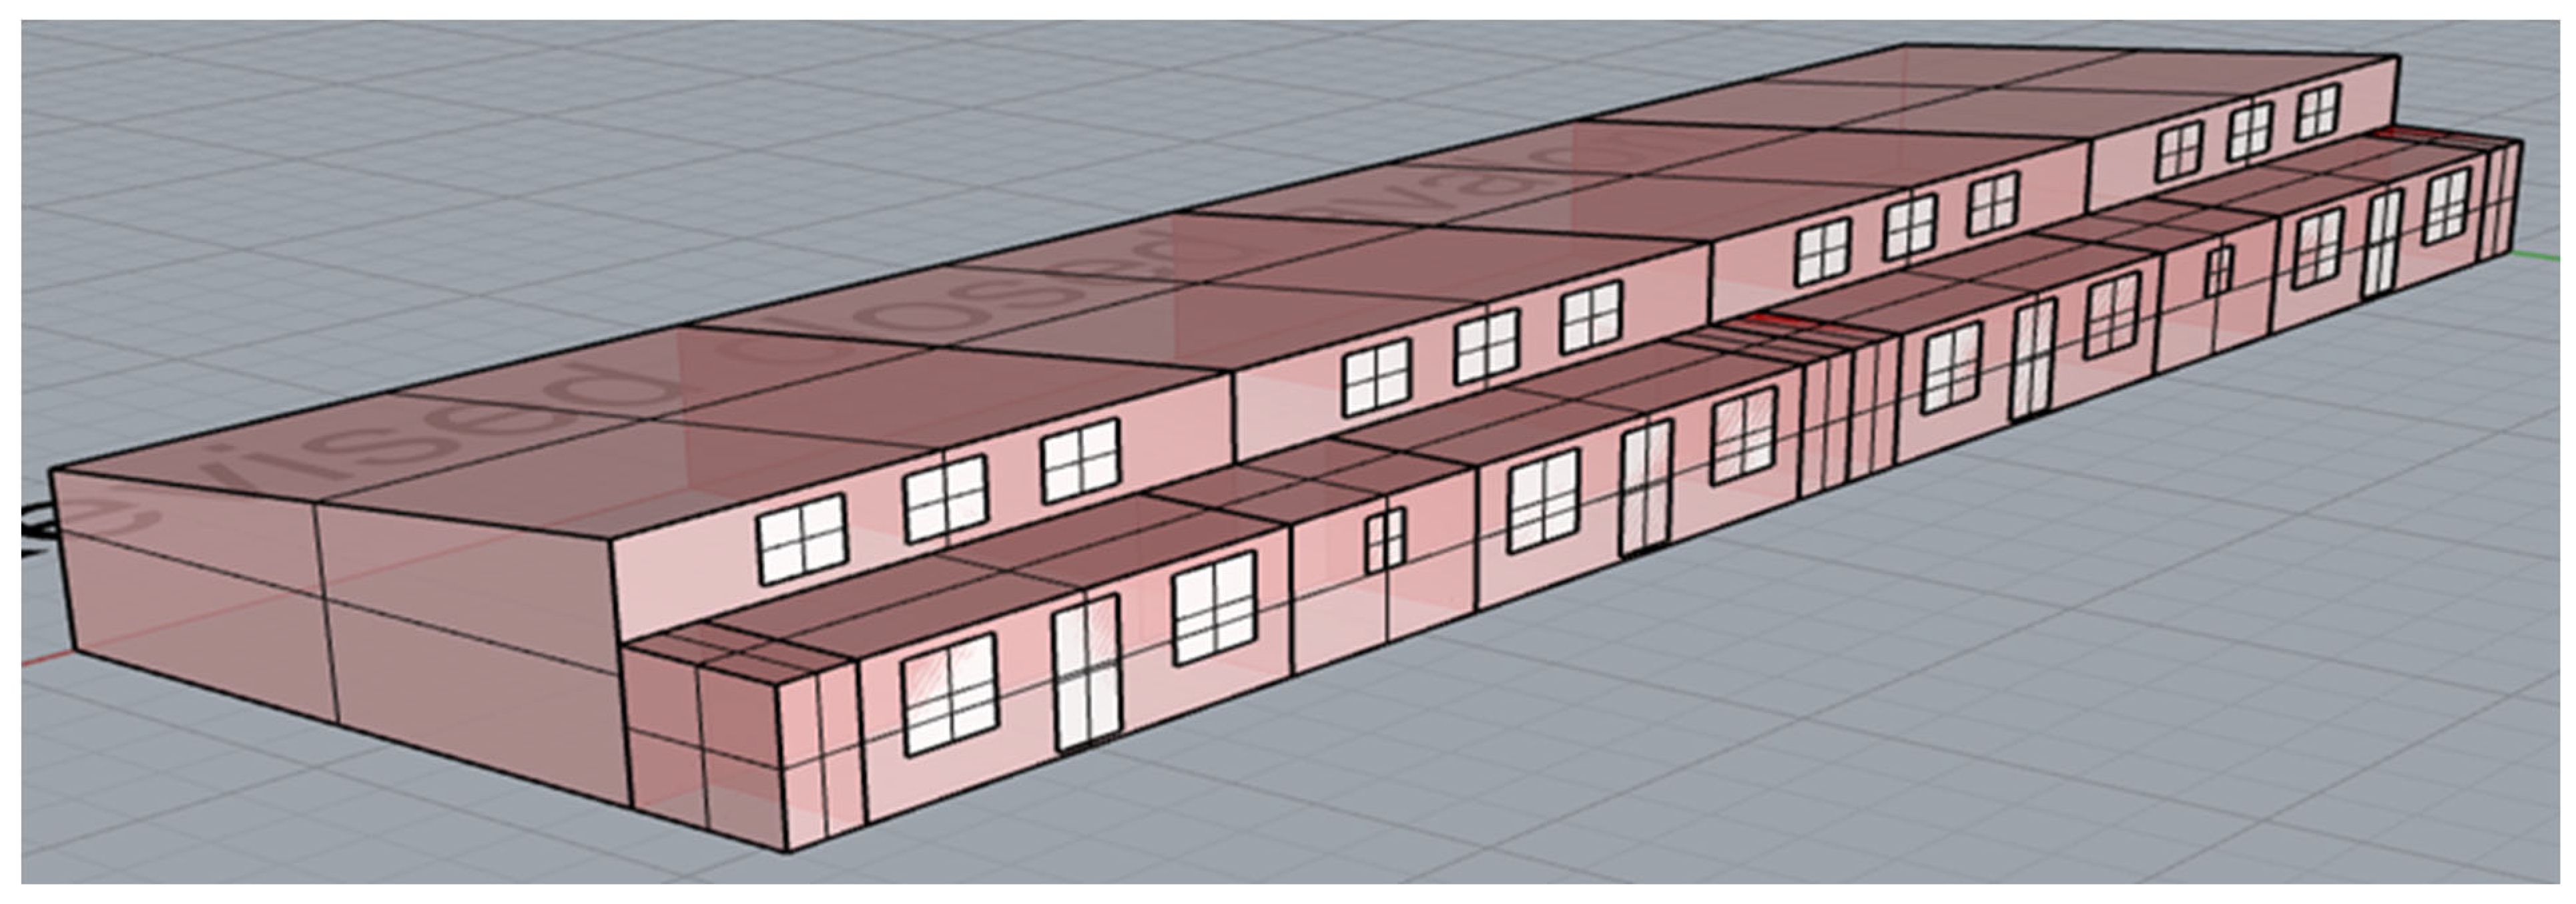
Figure 6,
Figure 7 and
Figure 8 below give an idea of the standard view for built Avalon blocks and floor plans retrieved from the official Ministry of Education website.
3.2. Experimental Data for Building Performance Assessment
Building performance simulations for the Avalon block were carried out to assess the adequacy of current IAQ and TC guidelines for six climate zones in New Zealand. In addition, both school typologies were simulated against local and international standards such as (DQLS V (2.0), ASHRAE 62.1, EN-15251, CIBSE, Building Bulletin 99 and 101) in six climate zones of New Zealand. Through advanced parametric modelling assessment, the BPA for Avalon block critically evaluates existing IAQ and TC guidelines, identifies their limitations, and proposes optimised design standards tailored to New Zealand’s varied climatic conditions. The proposed optimal IAQ and TC design guidelines for New Zealand in six climate zones with a specific focus on adaptability and applicability in a post-pandemic educational environment are based on multi-criteria optimisation and a series of simulations performed, as shown in
Table 3 below. Furthermore,
Table 4 represents the DQLS (V2.0) and international standard (ASHRAE 62.1, CIBSE, EN-15251, BB 99 and 101) IAQ and TC standard data used to perform the parametric modelling to identify the building performance for the post-pandemic educational environment in Avalon block in six climate zones of New Zealand.
3.3. Occupancy Profile Schedule
The occupancy profile of the analysed spaces is defined by several critical factors: the total number of occupants, the proportion of the occupied area allocated to students and teachers, and the occupancy schedule, which specifies the times when individuals are present in the space during weekdays, presented in
Table 4 below. School buildings house students and various services, such as daycare, kindergarten, nursery, and primary teaching, each operating on different schedules. Certain staff members usually arrive before the students. In contrast, the metabolic rate for sedentary occupants is around 60 Watt/m
2 [
40], or 120 Watt/person in Energy Plus software [
41]. Although clothing insulation significantly affects occupant thermal comfort, this parameter is kept constant at 0.75 for this study, and the Carbon Dioxide generation rate is typically between 3.34–5.5 cm
3/s [
42]. Occupancy, occupancy per space, and occupants’ timetable are for the New Zealand primary school classroom context in
Table 5. Metabolic rate, CO
2 generation rate, and CLO are the most common data available as constant values [
40].
4. Development of IAQ and Thermal Comfort Assessment Metrics and Thresholds
4.1. Thermal Comfort and Daylighting Multi-Criteria Optimisation (MCO) Metric
Optimising the thermal comfort in any building requires significant consideration of multiple indoor environmental factors such as temperature, relative humidity, clothing insulation, and metabolic rate [
43]. International standards have significantly developed thermal comfort standards worldwide to cater to individual satisfaction [
10]. Although there is a consensus on the significance of thermal comfort, differences emerge between children and adults in their subjective evaluations [
44]. Children are more vulnerable to higher temperatures due to their elevated metabolic rates and the active nature of their school activities. This increased sensitivity highlights the need for meticulous attention to thermal comfort standards specifically designed to meet the needs of children in educational settings [
45]. The thermal comfort standards are set to categorise the indoor environment and should offer comfortable conditions to the majority of occupants in the building. Henceforth, the international standard used in this study uses a similar strategy for thermally comfortable conditions via two main modelling options: (A) PMV (predicted mean vote) scale and PPD (predicted percentage dissatisfied) scale; (B) Adaptive PMV scale [
10,
46].
Table 6 below shows the minimum R-value for the building component for the Avalon block simulated in six climate zones of New Zealand for DQLS (V2.0). The simulation timesteps are yearly based on a weekly schedule from Monday to Friday (9 a.m. to 3:30 p.m.). The output creates a link between greater exposure of WWR% and similar classroom sizes, which showed differences in daylighting percentage and the significant impact of adaptive thermal comfort percentage in classroom typologies (see
Table 7).
PMV assumes a steady-state environment with limited occupant control. It may not accurately predict comfort in naturally ventilated buildings where occupants can adapt to varying conditions (e.g., by opening windows or adjusting clothing) [
47]. Hence, the adaptive model to define thermal comfort in naturally ventilated buildings was created because it accounts for occupant behaviour and dynamic thermal conditions [
48]. Previous studies have underscored the importance of employing an adaptive method for precise thermal comfort assessment [
49]. Accordingly, this investigation adopts the Adaptive Comfort Percentage (ACP) as the principal measure for evaluating thermal comfort within classroom settings. The ACP is calculated using the Ladybug and Honeybee plugins for Grasshopper [
33]. It indicates the percentage of occupied hours during which occupants feel thermally comfortable. Comfortable conditions are those where the indoor temperature remains within the acceptable range, which is determined by the current outdoor temperature. To examine the thermal comfort range for both the Avalon school block, the findings are classified into three categories: Total Comfort Percentage (TCP), Heating Season Comfort Percentage (HSP), and Cooling Season Comfort Percentage (CSP). This method offers a detailed insight into the thermal comfort performance under various operational conditions.
The most common metrics described and assessed daylighting in indoor environments are useful daylight illuminance (UDI) and daylight autonomy (DA) [
26]. For this study, we primarily focus on the natural light coming through the windows of the Avalon block in six climate zones of New Zealand. Adequate natural light minimises the energy load and is associated with indoor environmental comfort. Satisfactory natural light improves adults’ and children’s mood, performance, learning ability, and physical health [
50]. Henceforth, UDI and DA are climate-based and accurate metrics that measure effective daylighting in indoor environments in different climate zones to indicate the percentage of yearly daylighting specifications [
51]. The Useful Daylight Illuminance (UDI) metric measures the percentage of annual occupied hours when daylight illuminance is within a defined range [
52]. UDI acts as a dynamic measure of lighting performance, calculated based on illuminance levels at the work plane (0.75 m above the floor), assessing the sufficient daylight [
53]. Daylight Autonomy (DA) evaluates the annual adequacy of daylight illuminance within an indoor space. Research indicates that spatial visual comfort and satisfaction are maximised when 50% of the analysed space achieves an illuminance level of 300 lux [
26,
54,
55]. The main factor contributing to the knowledge of this study for daylighting assessment is a window-to-wall ratio difference between both classroom typologies; Avalon is constructed with 70 m
2 approx. 35% of WWR (north-facing windows). The findings are classified into two categories to examine the natural daylighting comfort range for the Avalon school block: UDI percentage value and DA percentage value.
Thresholds to Evaluate Thermal Comfort and Daylight (MCO)
Table 7 shows the adaptive thermal comfort percentage for the Avalon block simulated in six climate zones of New Zealand for all OECD standards. The classroom geometry and its content are iterated in
Table 2 for the Avalon block, Occupancy details in
Table 5, and envelope design features (thermal values) in
Table 6. The simulation results are followed yearly, with time slots from 9 a.m. to 3:30 p.m. and a weekly schedule from Monday to Friday. To calculate the adaptive thermal comfort percentage for the Avalon blocks, values for each OECD standard were put in the Grasshopper script connected with the Ladybug & Honeybee tools plugin. The method creates a connection between indoor and outdoor temperatures by calculating the dry bulb temperature, dew point temperature, and relative humidity for all six climates (
Table 7).
4.2. Energy Performance Multi-Criteria Optimisation (MCO) Metrics
The energy performance evaluation for both the Avalon block in six climate zones of New Zealand, for all OECD standards, followed by a building performance assessment approach via parametric modelling. To better understand the energy performance evaluation, it is important to normalise the total building energy usage value in one metric, i.e., energy use intensity (EUI) [
56]. Primary contributors collectively represent 50–70% of total energy consumption in any building, which includes artificial lighting, heating, and cooling loads [
57]. To evaluate energy performance effectively, this study employs annual energy use intensity (kWh/m
2) measurements for each of these critical systems, following established methodological frameworks [
55]. This approach provides a comprehensive metric for quantifying and comparing the energy efficiency characteristics of the analysed building typologies.
4.3. Ventilation and Carbon Dioxide Multi-Criteria Optimisation (MCO) Metrics
Natural ventilation is categorised into two types of ventilation: single-sided ventilation and cross-ventilation. Single-sided ventilation heavily depends on airflow from one side of the building, i.e., air entering and leaving from the same entrance or different walls of the same building. In cross-ventilation, enabling airflow through a building by establishing pathways between opposing exterior walls facilitates what is commonly known as cross-ventilation. Specifically, air is introduced through an aperture on the windward facade, traversing the interior space and exiting via an opening on the leeward side. As it progresses through the ventilated area, this movement of air results in the absorption of thermal energy and the accumulation of airborne contaminants [
33,
58]. Ventilation plays a critical role in designing smooth operations in educational spaces, as adequate ventilation offers a clean environment and removes contaminated air [
15]. Moreover, studies during and after post-COVID-19 specifically stressed the natural ventilation efficacy for healthy IAQ, less pathogen risk, and lowered carbon dioxide concentration. The ventilation rates are usually measured in litres per second per person (l/s/p) or air change per hour (ACH) [
10].
Monitoring carbon dioxide percentage in parts per million (ppm) has been a subject of study for decades in the IAQ and TC research area. To measure the efficacy of ventilation in a building, it is advised to measure the CO
2 percentage in ppm as a proxy. A high percentage of ppm in indoor environments is directly associated with a poor ventilation rate [
59]. Outdoor CO
2 is generally between 400 and 500 ppm and is kept constant in the simulation strategy [
60]. No or inadequate ventilation rate can significantly spike carbon dioxide concentration. Educational spaces, particularly in cold and temperate climates, often see elevated carbon dioxide in the winter season. This phenomenon is often accentuated during the winter months, where reduced air exchange rates due to diminished frequency in the manipulation of fenestration systems contribute to the accumulation of carbon dioxide concentration [
61]. The worldwide COVID-19 pandemic has greatly increased the focus on the significance of indoor air quality and TC. Studies have shown that carbon dioxide (CO
2) levels are a key indicator of occupant well-being and a dependable proxy for evaluating the potential spread of the COVID-19 virus in enclosed spaces [
61,
62,
63,
64]. Accurate prediction of CO
2 concentrations in indoor environments requires considering various factors, such as indoor temperatures, relative humidity, air circulation patterns, and the number of occupants [
62]. Hence, considering CO
2 as the main indicator for spreading not only COVID-19 but other illnesses related to health implications, various organisations have declared significant standards to combat the contamination of viruses and illnesses in enclosed spaces with higher occupancy [
10,
63].
Thresholds to Evaluate the Ventilation and Carbon Dioxide (MCO)
An ideal CO
2 concentration after the emergence of COVID-19 is within the range of 800 ppm to 1000 ppm for healthy IAQ. To achieve the ideal CO
2 range, airflow is expected to be between 8 l/s/p and 10 l/s/p or 5–6 ACH [
65,
66,
67].
For this study, the DQLS (V 2.0) for the CO
2 concentration range is simulated at three different ranges in compliance with different ventilation rates: (1) 800 ppm at 12 l/s/p and 6 ACH; (2) 1200 ppm at 7.5 l/s/p and 3.5 ACH; (3) 2000 ppm at 4 l/s/p and 2 ACH. In addition, international standards are simulated as per
Table 3. The Avalon block classroom profile is kept similar to
Table 2 and
Table 5, and the occupancy profile is followed by
Table 4. Since windows’ function plays a critical role here, it was set to be conditioned during the wintertime for 10 min intervals every 120 min. The optimisation of CO
2 in
Table 9 shows the connection between the built typology features, occupancy schedules, climatic conditions, classroom size and number of occupants for ventilation rates for all international and DQLS V(2.0) standards in six climate zones of New Zealand and international standards as per individual ventilation standards, temperature, occupancy, and RH.
4.4. Development of Optimal Design Changes for Avalon Block
The optimal design solution for the Avalon block was addressed through multi-criteria optimisation to achieve optimal indoor air quality (IAQ) and thermal comfort (TC) standards in response to post-COVID-19 requirements. Three key modification strategies were implemented, each addressing specific performance aspects of the building designs.
- (a)
Structural Volumetric Optimal Design Modifications
The ceiling height was increased by 0.8 m (~1 m) in the Avalon block, resulting in a total classroom height of 3.5 m. This modification significantly enhanced air volume within the teaching spaces, facilitating better air circulation and dilution of airborne contaminants. The increased room volume directly contributed to reduced CO2 concentration levels during peak occupancy periods throughout the day, extending until ventilation thresholds were reached. This modification proved particularly beneficial in maintaining healthier IAQ metrics while allowing for reduced mechanical ventilation requirements.
- (b)
Fenestration Design Modification
To optimise the balance between natural lighting, thermal performance, and ventilation, interventions were implemented in the window arrangement and the thermal insulation of the building envelope. The Avalon design experienced a vertical adjustment in window positioning by 0.3 m. Additionally, the window-to-wall area ratio was standardised at 25% across all models, enhancing solar heat gain while ensuring adequate natural illuminance and daylight.
- (c)
Thermal Envelope Design Modification
To address climatic requirements, the thermal insulation of the building envelope was enhanced. In Christchurch, the roof’s thermal resistance (R-values) was increased by 3.3% (roof), the walls by 6.5%, and the floor by 4%. In Queenstown, which is characterised by more severe weather conditions, more significant improvements were necessary, with R-value increases of 7% for the roof, 9.35% for the walls, and 3.8% for the floor. These targeted enhancements to the building’s thermal envelope substantially reduced heating and cooling demands and minimised undesirable heat transfer across both investigated climate zones.
4.5. Development of Ventilation Control Strategy and Occupants’ Clothing Value Modification
A sophisticated manual ventilation protocol was established to maintain optimal CO2 levels while minimising energy losses. In the Avalon model, manual window opening was scheduled at 2 h and 12 min intervals during full occupancy. This timestep for ventilation protocols achieved the dual objectives of maintaining CO2 concentrations close to the baseline ppm threshold while minimising thermal energy losses.
Occupant comfort parameters were adjusted to reflect regional climate realities, with clothing insulation (clo) values for Wellington, Christchurch, and Queenstown modified from 0.75 to 0.80. This adjustment acknowledged the colder climate conditions in these regions and aligned thermal comfort expectations with typical occupant adaptations, resulting in comfort assessments and reduced heating demands without compromising perceived comfort.
4.6. Reliability and Validity
To ensure the reliability of the simulation outcomes, the Avalon classroom reference design model developed in Rhino 7 and the Grasshopper script for parameters were tested and run multiple times to identify the potential bugs and determine the marginal error across both classroom typologies in six climate zones of New Zealand. Each multi-criteria optimisation variable was calculated for national and international standards. In simulation studies, the marginal error of ± 1 to 15% is considered highly reliable for indoor building environmental calibration studies [
23,
68,
69,
70]. Both classroom typologies were carefully calibrated, and model comprehension in the script was run and tested five times, with results consistently showing marginal variation of ±5 to 10% across all the interactions for each multi-criteria optimisation variable for national and international standards. This consistency of outcomes across repeated simulations demonstrates the reliability of the research findings. Furthermore, the simulation methodology presents all input parameters comprehensively, with constant values based on published scholarly simulation research, ensuring if the script were to be run for other classroom typologies by different researchers, followed with careful calibration and similar protocols for IAQ and TC parameters, the findings would be comparable with the current research. This repeatability further reinforces the reliability of the current research outcomes.
The validity of this research simulation methodology is established through a careful selection of validated simulation software (Rhino 7), followed by a critical consideration of direct influencing parameters for IAQ and TC in school classrooms. The core simulation environment employs Rhino 7 software for designing the reference model of school classrooms. It is integrated with the Grasshopper algorithmic plugin and offers a parametric modelling framework with established validation in building performance research. With the help of a literature review, the parameters selected for IAQ and TC affecting the indoor classroom environment were prioritised for parametric modelling to ensure the focused evaluation of selected variables. The simulation methodology is strengthened and validated by integrated environmental analysis plugins (Ladybug and Honeybee tools) [
68,
71,
72]. The ladybug tools enhance reliability through their capacity to conduct detailed climatic analysis and weather data integration and interpretation; Honeybee facilitates, in conjunction with Energy Plus and Open FOAM, to conduct detailed thermal, ventilation, energy, and daylight analysis. Hence, such an integrated software ecosystem creates a reliable measurement practice with consistent, reproducible simulation results and findings, which supports the internal validity of software selection and parameters used in the research assessment in the context of the indoor environment.
5. Presentation of Results and Findings
The multi-criteria optimisation of adaptive thermal comfort for the Avalon classroom typology for DQLS (V2.0) presents meaningful insights, as depicted below.
5.1. Avalon Block Adaptive Thermal Comfort Analysis
In Auckland, the application of DQLS V2.0 resulted in a Total Comfort Percentage (TCP) ranging from 78% to 82%, which exceeded the performance of ASHRAE 62.1 (67–71%), CIBSE (64–68%), EN-15251 (65–69%) and BB 99 and 101 (69–73%). The optimal solution enhanced this metric to 82–85%, making a 3–4 percentage point improvement. The Heating Season Comfort Percentage (HSP) remained consistently low at 1–3% across all OECD standards, with the optimal solution metric reducing cold discomfort to 0–0.3%. The Cooling Season Comfort Percentage (CSP) was moderate at 15–18%, significantly lower than ASHRAE 62.1 (27–28%) and other OECD standards, indicating a reduced overheating in the region’s temperate climatic conditions. Hamilton demonstrated the highest TCP among all analysed regions under DQLS V2.0, achieving 85–90%, exceeding other OECD standards. The optimal solution approached near-ideal thermal conditions, with a TCP of 91–94%. HSP was minimal at 0–1% for DQLS V2.0 and 0–0.8% for the optimal solution, signifying robust prevention of cold stress. Additionally, a substantial reduction in CSP was observed, from 9–14% (DQLS V2.0) to 6–9% (optimal solution), highlighting Hamilton’s favourable conditions for minimising cooling loads. In Wellington, DQLS V2.0 achieved a competent TCP of 77–80%, similar to BB 99 and 101, and the optimal solution was 81–87%. HSP remained minimal at 0–0.6% (DQLS V2.0) and 0–0.9% (optimal solution). Notably, the optimal solution substantially improved CSP from 19–22% to 12–19%, representing a 7-percentage point improvement and highlighting the benefits of targeted interventions in this location. Rotorua presented TCP performance comparable to Auckland under DQLS V2.0, achieving 78–82% close with BB 99 and 101, exceeding other OECD standards. The optimal solution yielded good improvement after Hamilton, reaching 86–92% (TCP). Minimal HSP was observed at 0–1% (DQLS V2.0) and 0–0.5% (optimal solution). A 10 per cent drop in CSP was achieved, from 17–22% to 8–14%, indicating the effectiveness of optimal strategies in mitigating overheating. Christchurch showed moderate baseline TCP performance under DQLS V2.0, achieving 70–74% close with ASHRAE 62.1 and slightly better than other OECD standards. The optimal solution led to TCP reaching 77–84%. HSP remained low at 0–1% (DQLS V2.0) and 0–1.2% (optimal solution), signifying effective prevention of cold conditions. A significant drop in CSP, from 24–30% to 16–22%, highlights the efficacy of increased thermal insulation and Clo in balancing thermal performance. Despite challenging climatic conditions in Queenstown, DQLS V2.0 performed slightly better than ASHRAE 62.1 (65–70%) and outperformed other OECD standards, achieving a TCP of 69–78%. The optimal solution enhanced TCP to 77–81%. HSP was marginally higher than other OECD standards at 1–3% (DQLS V2.0). The reduction in CSP was reasonable, from 19–27% to 18–22%, yet the increased insulation and Clo value demonstrated its effectiveness in balancing heating and cooling needs.
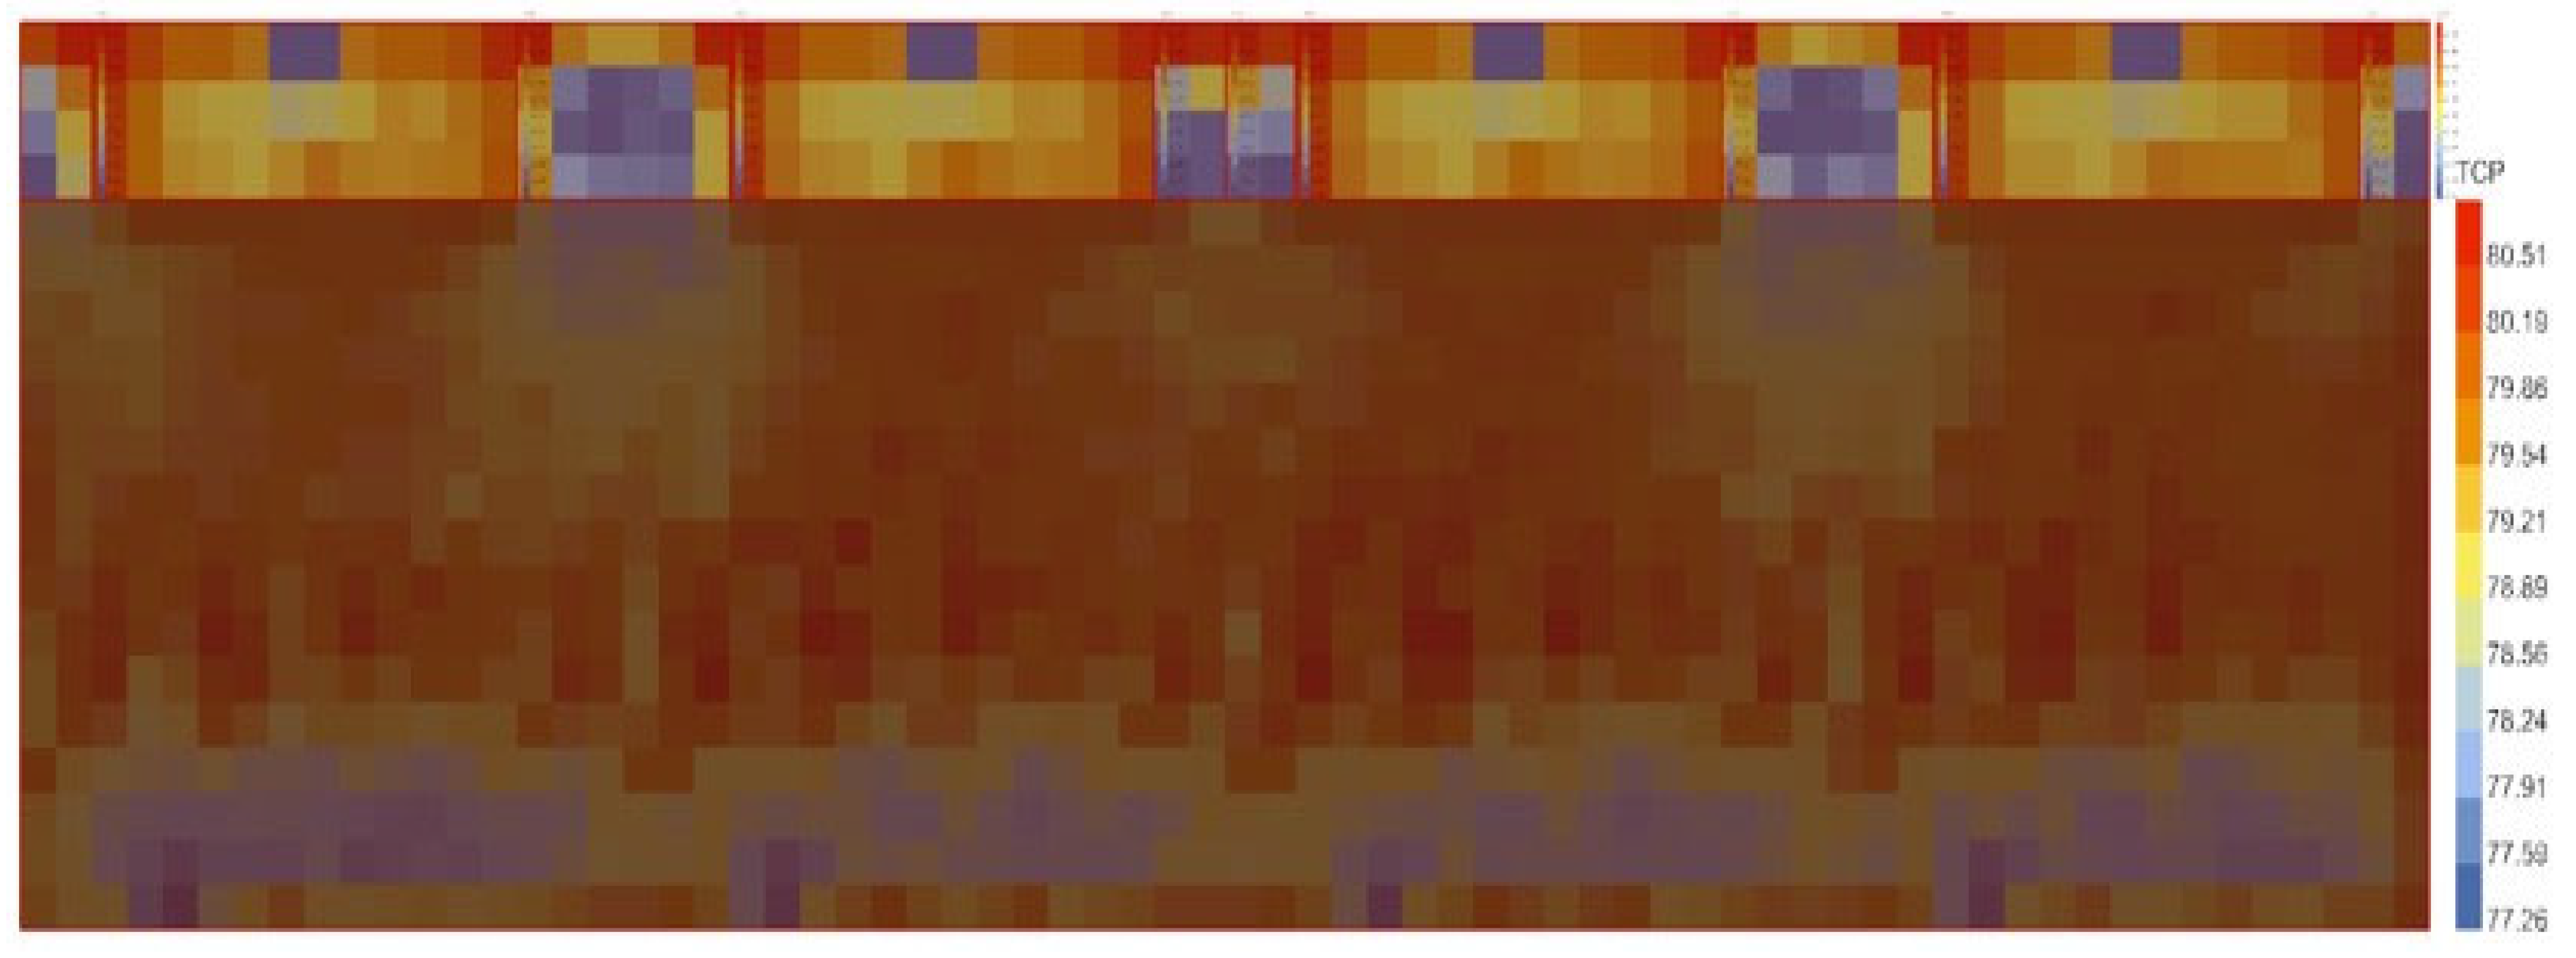
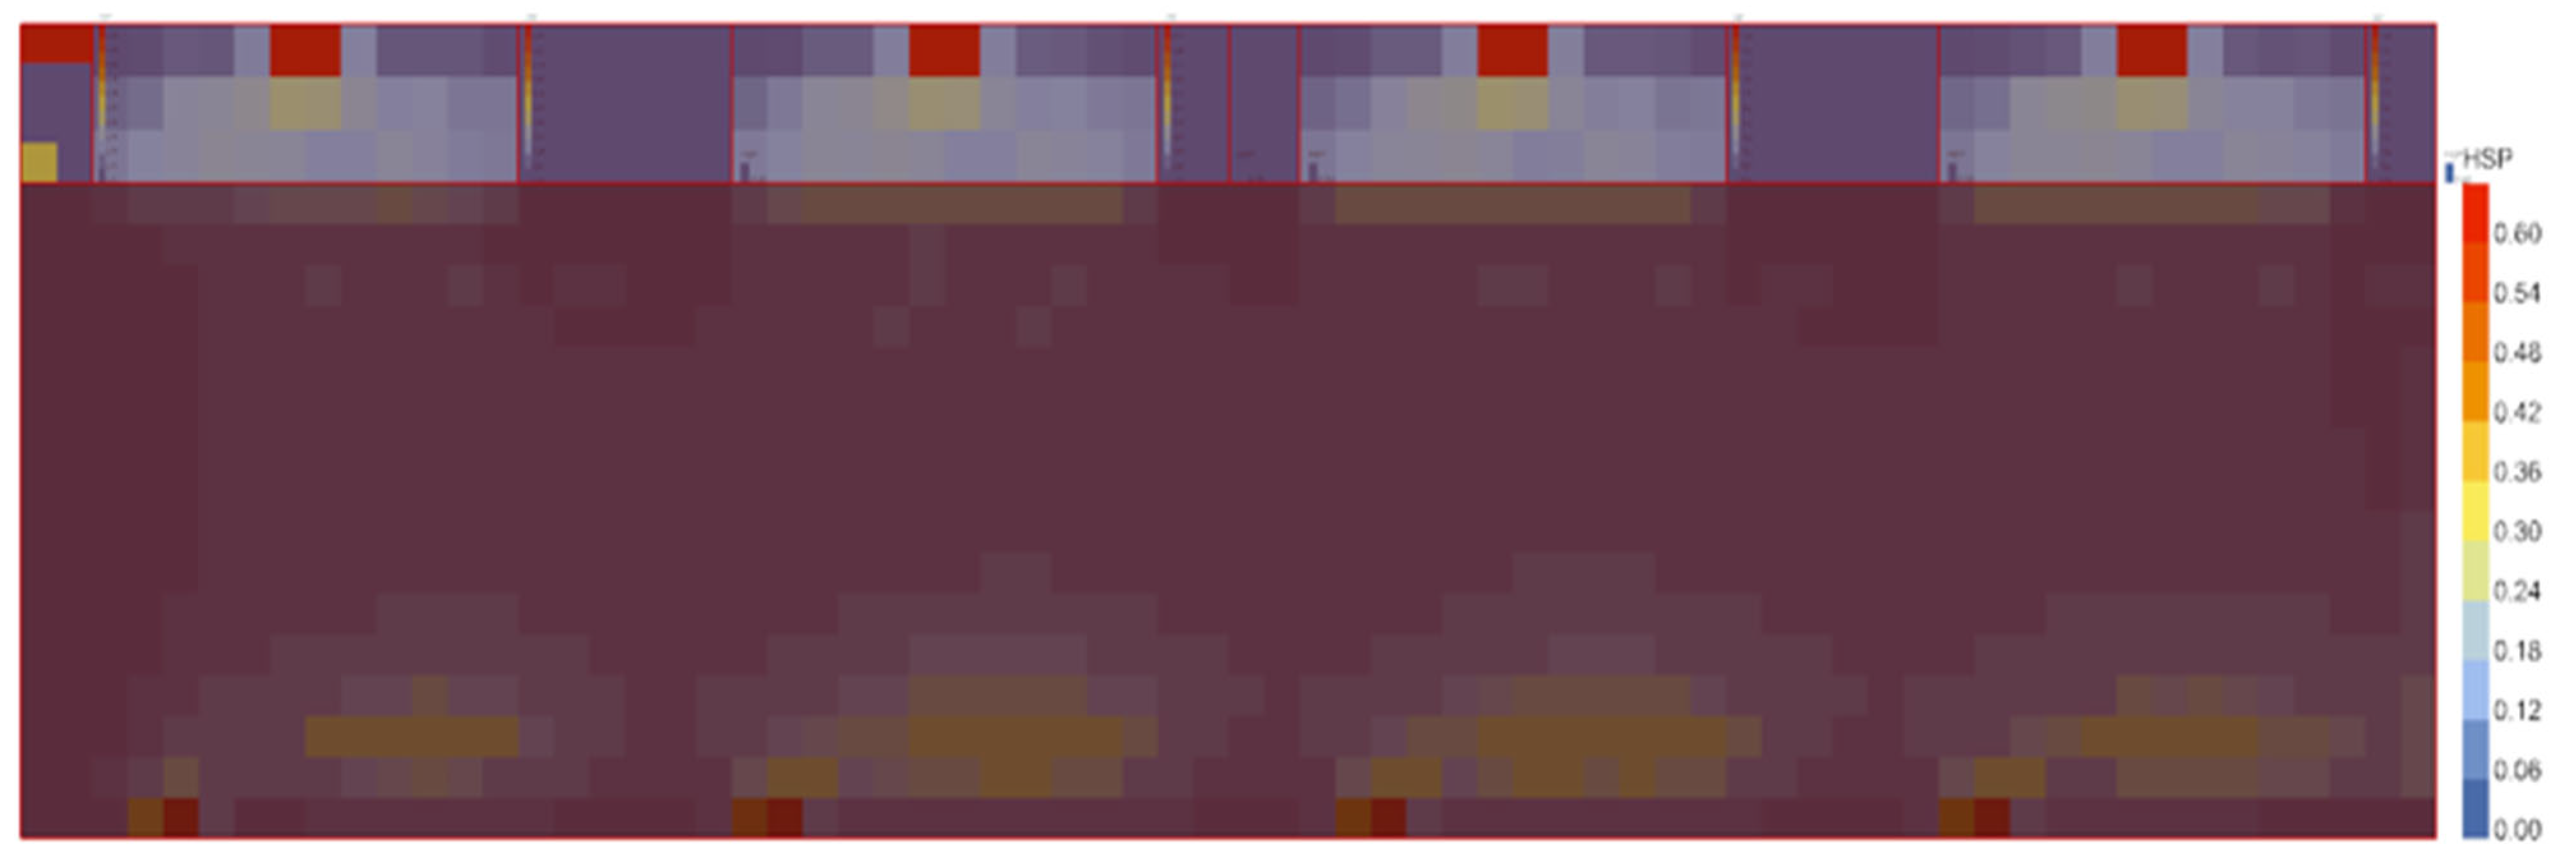
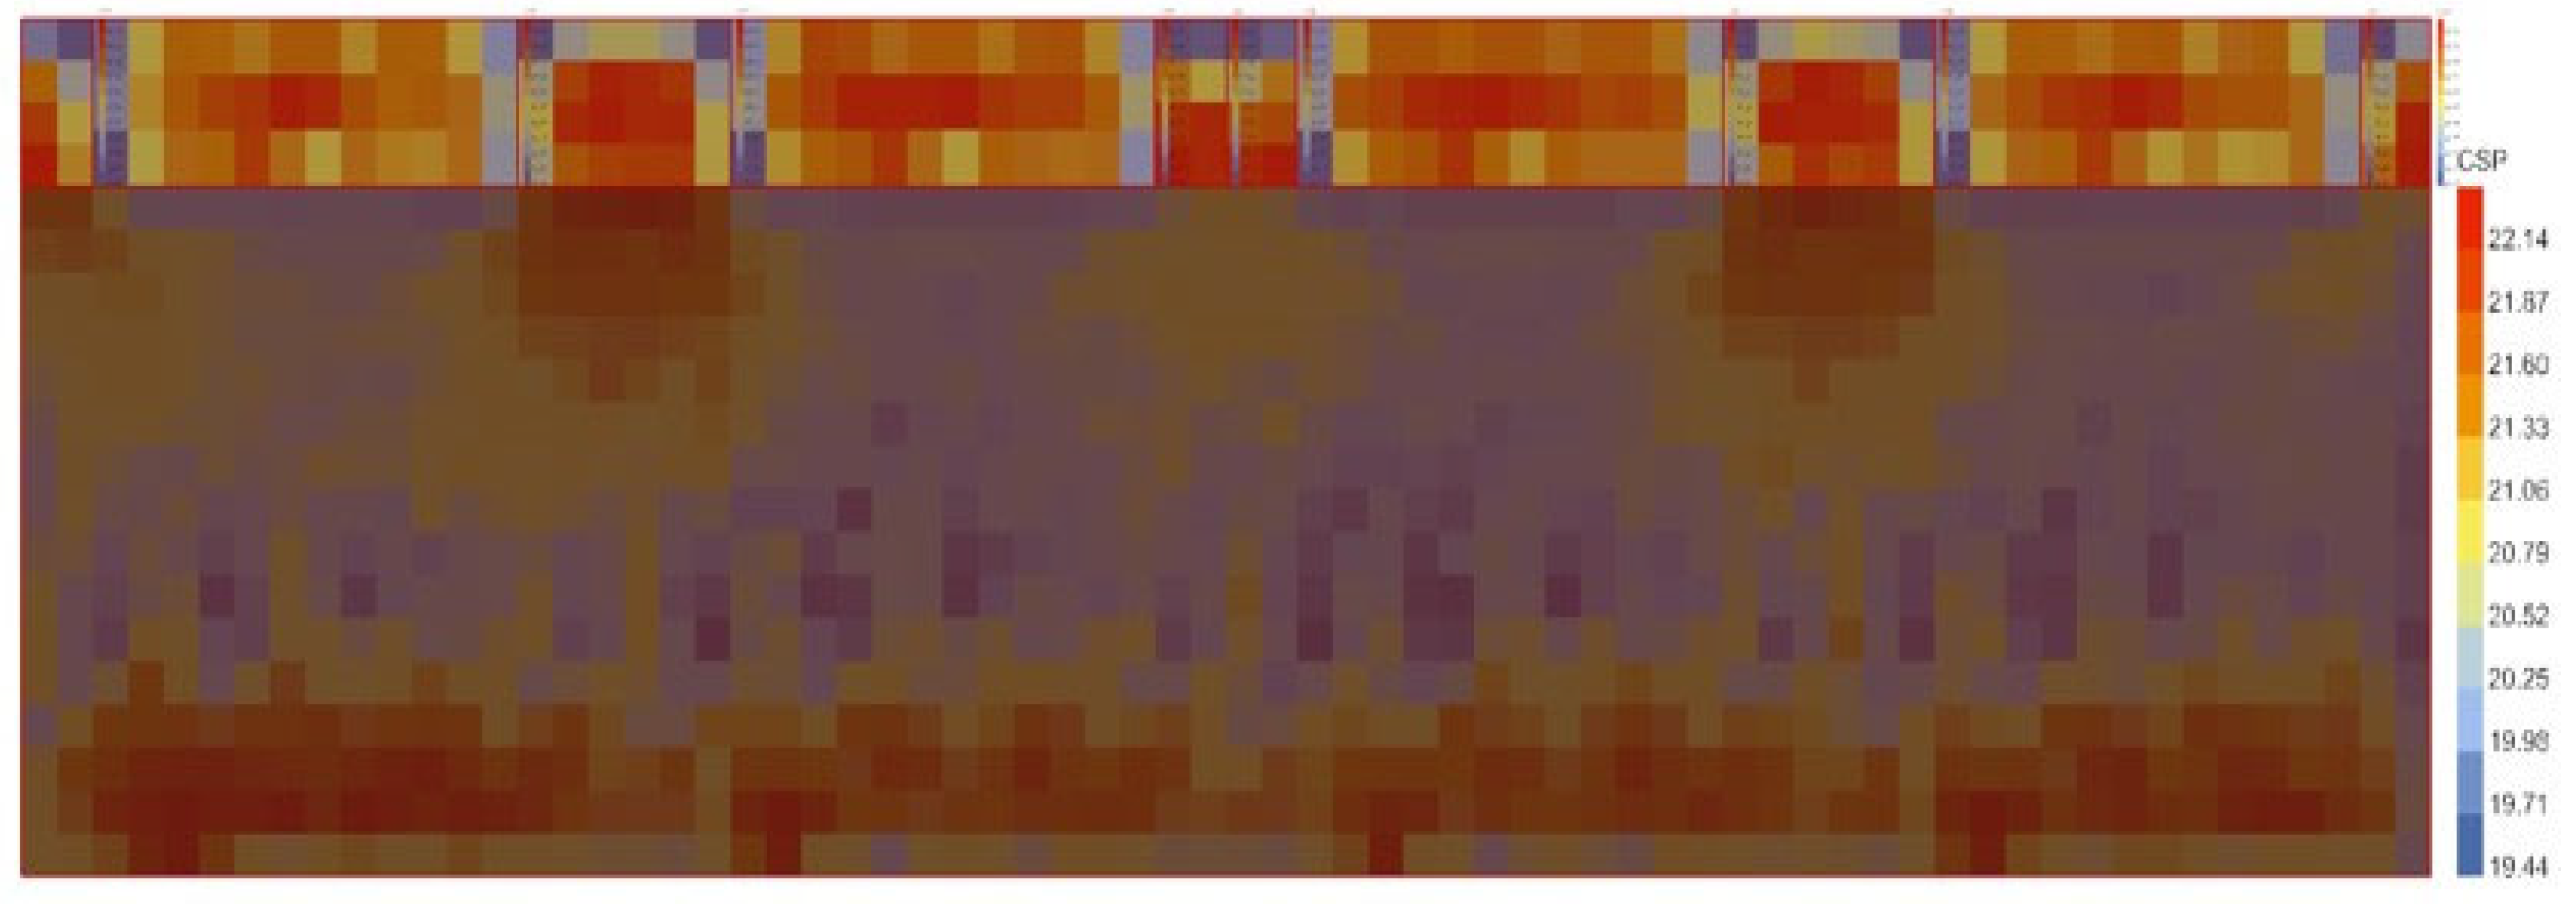
Figure 9,
Figure 10 and
Figure 11 below show the reference Avalon block thermal chart for WELLINGTON DQLS v2.0 (TCP, HSP, and CSP).
Avalon Block Daylight Analysis
The Avalon block showed that the lowest daylight (DA) value received in all six climate zones of New Zealand is between 47–50%, and the highest percentage received in all six climate zones of New Zealand is between 85–88%. Wellington exhibited the lowest point, receiving (47–87%), while Hamilton and Rotorua exhibited the highest, receiving 50–88%. The optimal solution showed marginal improvement, with the lowest point for Wellington improved from 47–87% to 45–87%. Additionally, Hamilton Rotorua improved from 51–88% to 50–88%, and Auckland, Christchurch, and Queenstown achieved 49–87%. The Useful daylight illuminance (UDI) for the Avalon block received a minimum percentage of 66–89% for Wellington, and the maximum UDI value achieved for Hamilton and Auckland was 72–88%, Rotorua was marked at 71–87%, and Christchurch and Queenstown achieved 69–86%. The optimal solution for the UDI value showed improvement with a 2% decrease for all six climate zones, while there was no change in Hamilton.
5.2. Energy Analysis
A comparative analysis of heating load efficiency, referenced against OECD standards, reveals significant disparities across New Zealand’s diverse climatic regions in the Avalon Block. The DQLS V2.0 shows a relatively consistent pattern of high energy demand in the northern regions, with both Auckland and Hamilton recording 69 kWh/m
2, and in southern altitudes peaking between 75–80 kWh/m
2. In contrast, the ASHRAE standard 62.1 indicates a more moderate energy consumption profile, ranging from 52 kWh/m
2 in Hamilton and Wellington to 65 kWh/m
2 in Queenstown, thus demonstrating greater overall efficiency. The CIBSE standards exhibit significant geographical variability, with substantial energy use in Auckland at 53–50 kWh/m
2, lower than DQLS V2.0, compared to more efficient performance in Wellington at 41 kWh/m
2 and Christchurch, with similar to DQLS V2.0 75 kWh/m
2, respectively. The EN-15251 follows a similar trend to CIBSE, showing energy use in Auckland at 62 kWh/m
2 while achieving efficient operation in Wellington at 54 kWh/m
2, Christchurch and Queenstown between 70–77 kWh/m
2, similar to CIBSE. Building Bulletins (BB) 99 and 101 consistently demonstrate the higher overall energy demands similar to DQLS V2.0, the northern region values between 63–65 kWh/m
2, and the southern region at 81 kWh/m
2 in Christchurch and Queenstown, in all OECD standards. The Optimal Avalon solution, in contrast, presents a more balanced energy utilisation profile across all climatic zones, with values ranging from 60 kWh/m
2 in the northern region to 67 kWh/m
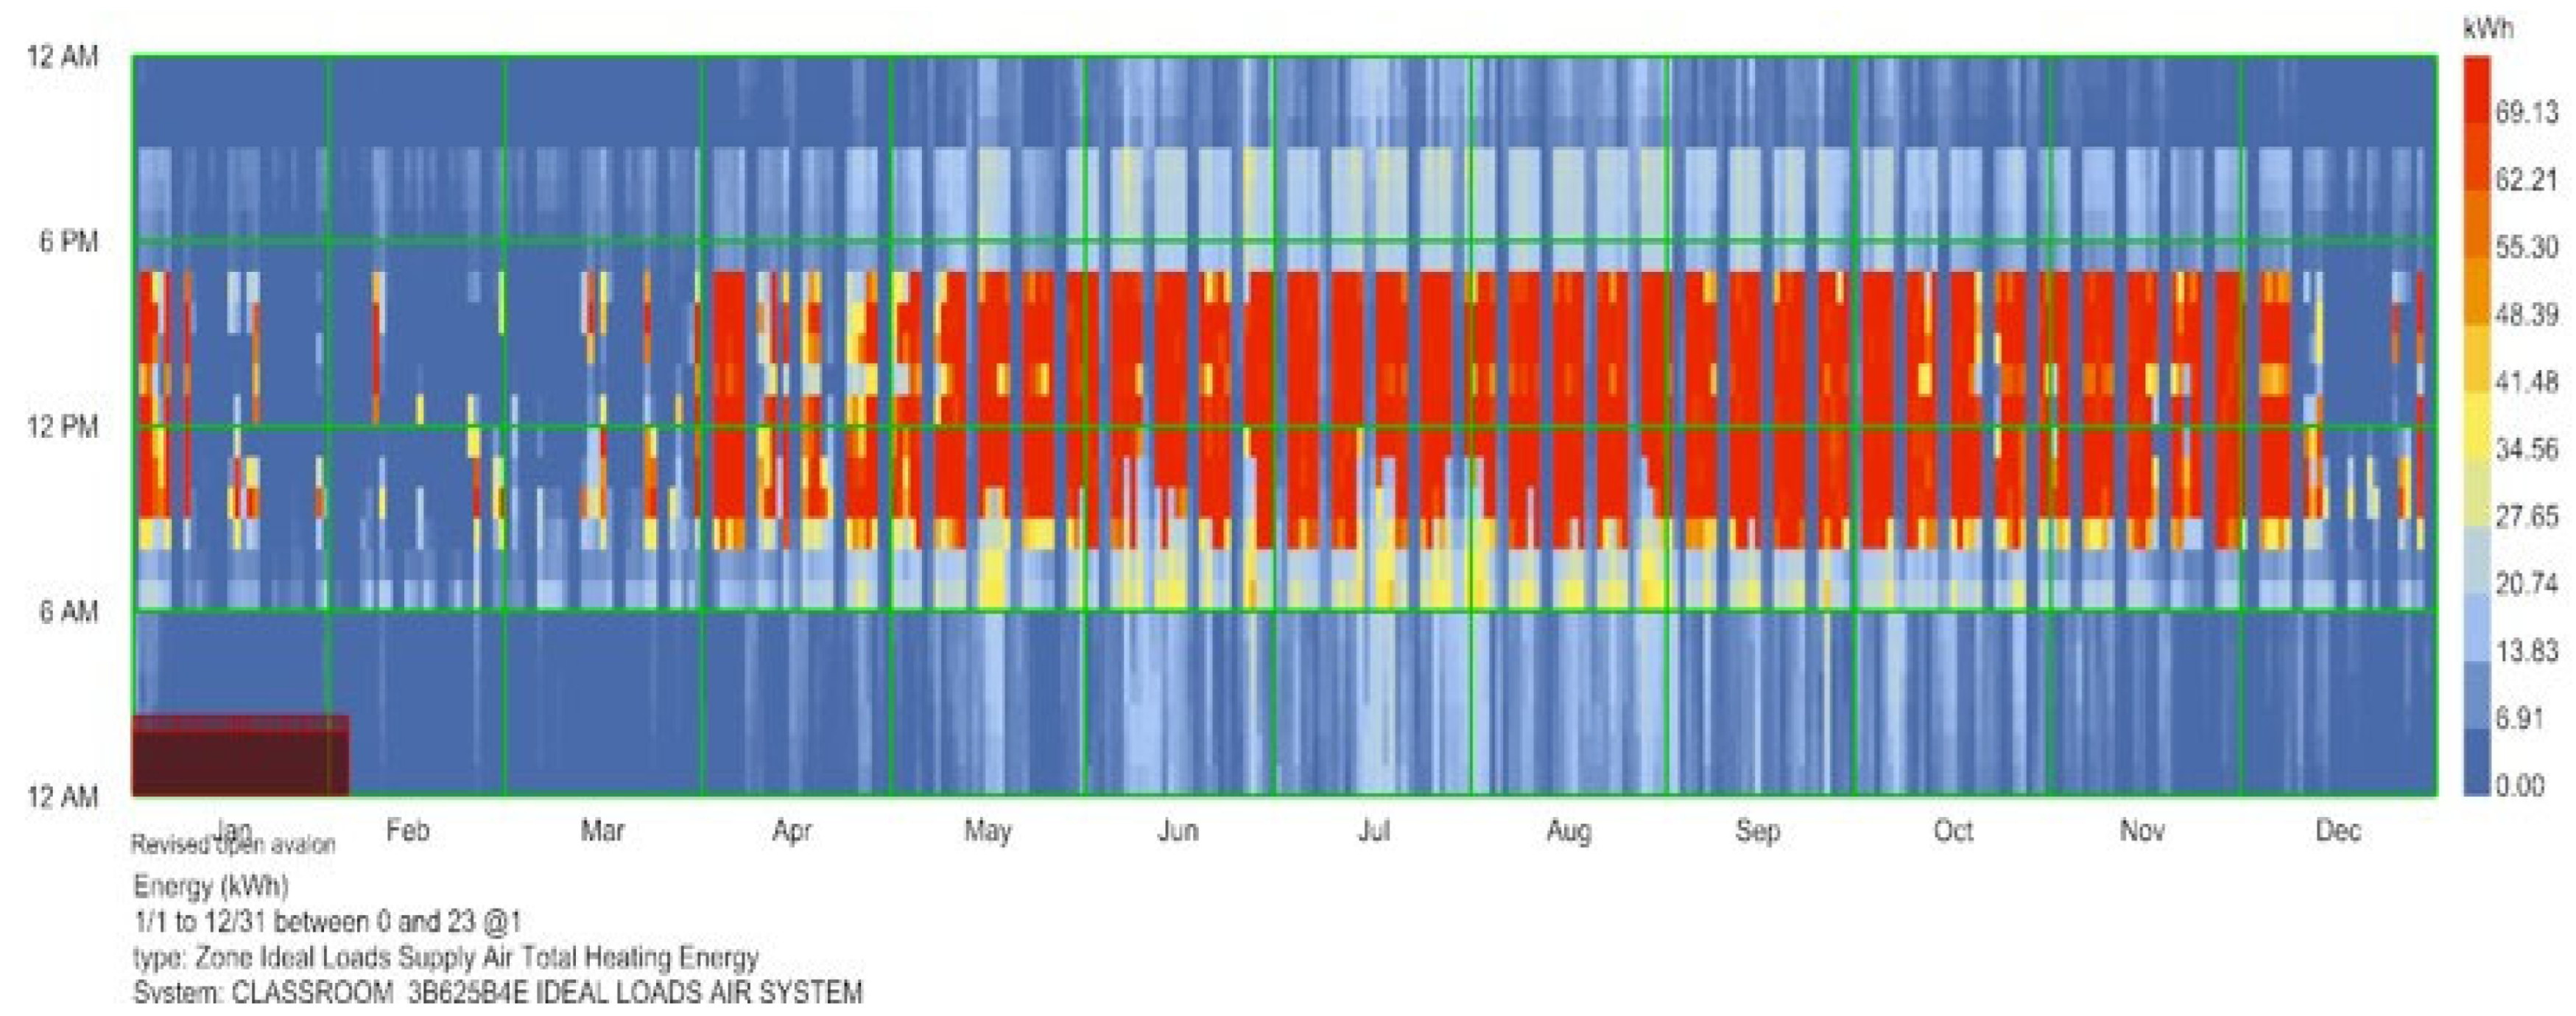
2 in the southern region, reducing the demands by 6–16%.
Figure 12 shows the heating load graph for the Avalon block (AKL—DQLS v2.0).
However, the cooling load performance across OECD standards highlights significant differences. The ASHRAE standard 62.1 consistently demonstrates reasonable cooling efficiency, ranging from 8–13 kWh/m
2 in Queenstown to Wellington and 12 kWh/m
2 in Auckland to 10 kWh/m
2 in Rotorua. In contrast, the DQLS V2.0 shows cooling performance between 21–36 kWh/m
2, particularly lowest at 21 kWh/m
2 in Queenstown and highest in Auckland at 35 kWh/m
2. The CIBSE standards indicate favourable performance across most regions, with particularly efficient outcomes between 10–18 kWh/m
2, with the lowest in Wellington at 10 kWh/m
2 and Queenstown at 13 kWh/m
2, though with variations across different locations, highest at 18 kWh/m
2 in Hamilton. The EN-15251 maintains a reasonable efficacy, with the lowest load in Queenstown at 10 kWh/m
2 and the highest in Auckland (25 kWh/m
2). Building Bulletins (BB) 99 and 101 demonstrate a wide range of performance, from highly effective cooling in Queenstown at 17 kWh/m
2 to significantly inefficient operation in Auckland, Hamilton, and Christchurch between 26–33 kWh/m
2, quite similar to DQLS V2.0. The Optimal Avalon solution presents a mixed profile, with outstanding performance in Wellington at 13 kWh/m
2 and Queenstown at 14 kWh/m
2. But, the high values in Auckland and Hamilton at 25 kWh/m
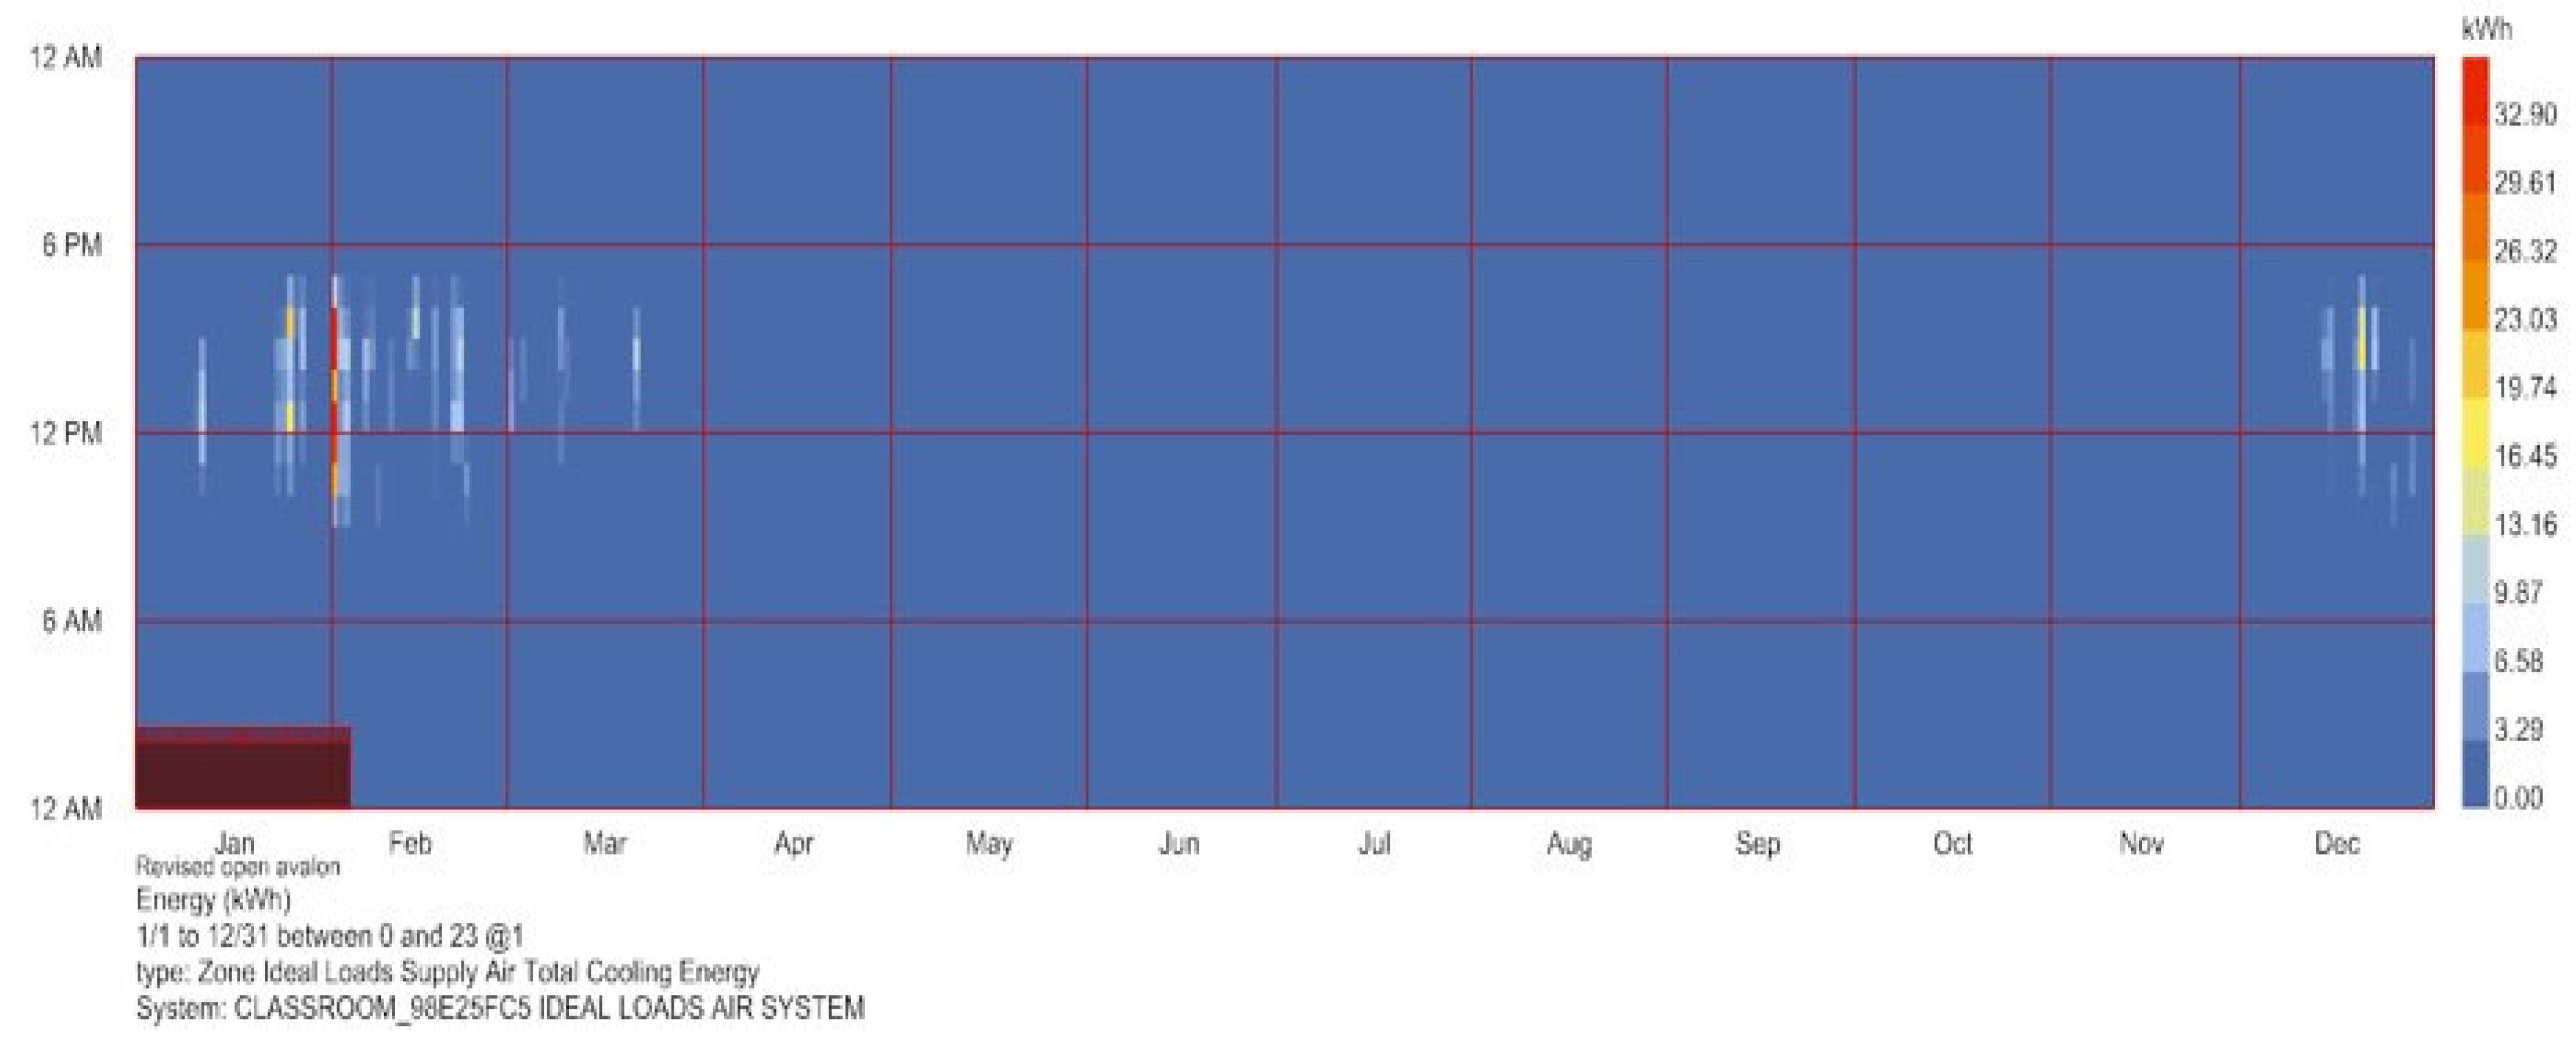
2. This suggests that the Optimal Avalon solution involves design compromises that prioritise performance in specific climatic regions over others. The optimal solution delivered moderate results in the northern regions for cooling by 10–21%, but in the southern regions, the cooling load was reduced by 35% in southern regions.
Figure 13 shows the cooling load graph for the Avalon block (AKL—DQLS v2.0).
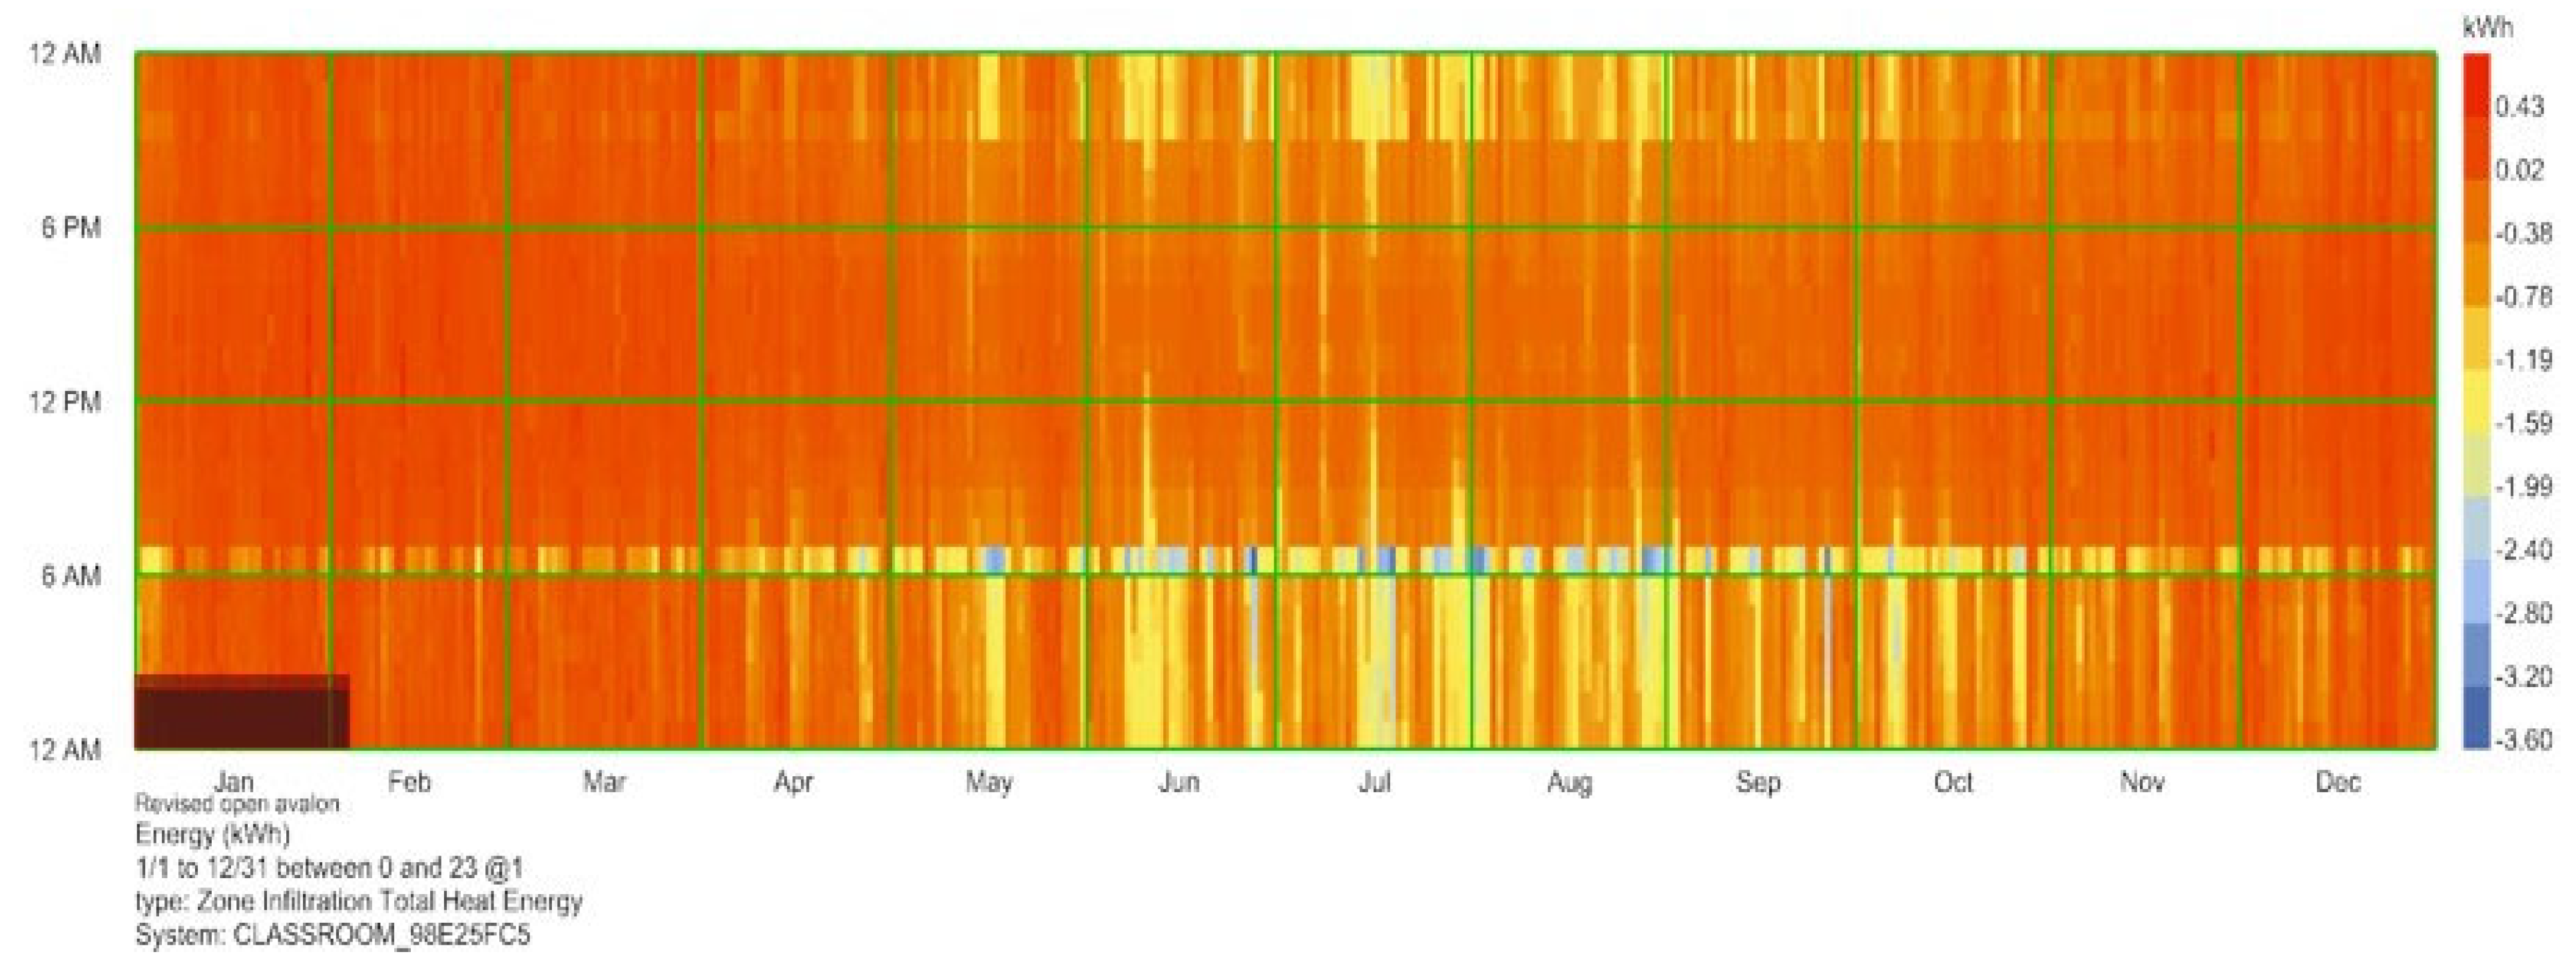
The infiltration energy loads exhibit substantial meaning in six climate zones of New Zealand. The higher negative value in the southern region directly correlates with high heating loads in the same region. A lower value in the northern region directly correlates with a high cooling load in the northern region. Avalon block exhibits negative values from −3.6 to −5.1 kWh/m
2 (Auckland to Queenstown). The optimal solution improved by 10–15% across all six climate zones.
Figure 14 shows the infiltration load graph for the Avalon block (AKL- DQLS v2.0)
5.3. Carbon Dioxide and Ventilation Analysis
In Auckland, the DQLS V2.0 showed a spike in CO
2 concentration between 9% to 11%, the baseline of three distinctive values: 800 ppm (12 l/s/p), 1200 ppm (7.5 l/s/p), and 2000 ppm (4 l/s/p). ASHRAE 62.1 showed a spike between 10 and 21% at 1000 ppm for 6.4 l/s/p and 7.4 l/s/p, while CIBSE exhibited a 4.1% spike with an 800 ppm baseline value against 12 l/s/p followed by a 3.4% spike for 1000 ppm against 12 l/s/p. EN-15251 was simulated at two distinctive baseline values, 800 ppm at 8 l/s/p and 1400 ppm at 8 l/s/p, resulting in a 6.5% and 3.8% increase. Moreover, BB 99 and 101 were simulated at 1500 ppm at two distinct ventilation rates: 10 l/s/p attained a 5% and 8 l/s/p attained a 6.2% spike in concentration. In Hamilton, DQLS V2.0 measurements indicated an elevation of CO
2 levels, between 8–10% above target values at 800 ppm (12 l/s/p), 1200 ppm (7.5 l/s/p), and 2000 ppm (4 l/s/p). ASHRAE 62.1 showed a 12–19% increase at 1000 ppm at 6.4 l/s/p and 7.5 l/s/p ventilation rates. CIBSE guidelines transmitted a 3.7% increase at 800 ppm (12 l/s/p) and a 3.9% increase at 1000 ppm (12 l/s/p). EN-15251 simulations achieved a 7.8% increase at 800 ppm (8 l/s/p) and a 4.1% increase at 1400 ppm (8 l/s/p). BB 99 and 101 simulations at 1500 ppm showed a 4.8% increase at 10 l/s/p and a 4.6% increase at 8 l/s/p. DQLS V2.0 demonstrated a 7–11% increase in CO
2 concentrations across the three baseline measurements in Wellington. ASHRAE 62.1 exhibited a 13–17% increase at 1000 ppm with both ventilation rates. CIBSE parameters showed a 3.7% increase at 800 ppm and a 3.4% increase at 1000 ppm. EN-15251 simulations revealed a 6.4% increase at 800 ppm and a 4.4% increase at 1400 ppm. BB 99 and 101 simulations indicated a 5.6% increase at 10 l/s/p and a 5.1% increase at 8 l/s/p. In Rotorua, DQLS V2.0 measurements showed CO
2 concentration increases of 9–11% across the baseline values. ASHRAE 62.1 displayed 11–19% increases at 1000 ppm. CIBSE parameters resulted in a 5.1% increase at 800 ppm and a 4.7% increase at 1000 ppm. EN-15251 simulations showed a 7.2% increase at 800 ppm and a 5.1% increase at 1400 ppm. BB 99 and 101 measurements indicated a 5.5% increase at 10 l/s/p and a 5.4% increase at 8 l/s/p. In Christchurch, DQLS V2.0 findings revealed CO
2 concentration increases of 8–10% across the three baseline values. ASHRAE 62.1 showed 10–14% increases at 1000 ppm with both ventilation rates. CIBSE parameters resulted in a 3.8% increase at 800 ppm and a 3.5% increase at 1000 ppm. EN-15251 simulations showed a 6.4% increase at 800 ppm and a 4.1% increase at 1400 ppm. BB 99 and 101 measurements indicated a 5.2% increase at 10 l/s/p and a 5.6% increase at 8 l/s/p. Similarly, DQLS V2.0 showed CO
2 concentration increases of 9–11% across the baseline values in Queenstown. ASHRAE 62.1 exhibited 11–15% increases at 1000 ppm. CIBSE parameters resulted in a 3.5% increase at 800 ppm and a 3.8% increase at 1000 ppm. EN-15251 simulations showed a 7.3% increase at 800 ppm and a 4.3% increase at 1400 ppm. BB 99 and 101 measurements indicated a 5.9% increase at 10 l/s/p and a 6.4% increase at 8 l/s/p. The Optimal solution in Avalon Block improved by 4% to 5.5%, meeting all OECD standards, ranging from 4% to 7% across all climate zones above the baseline value.
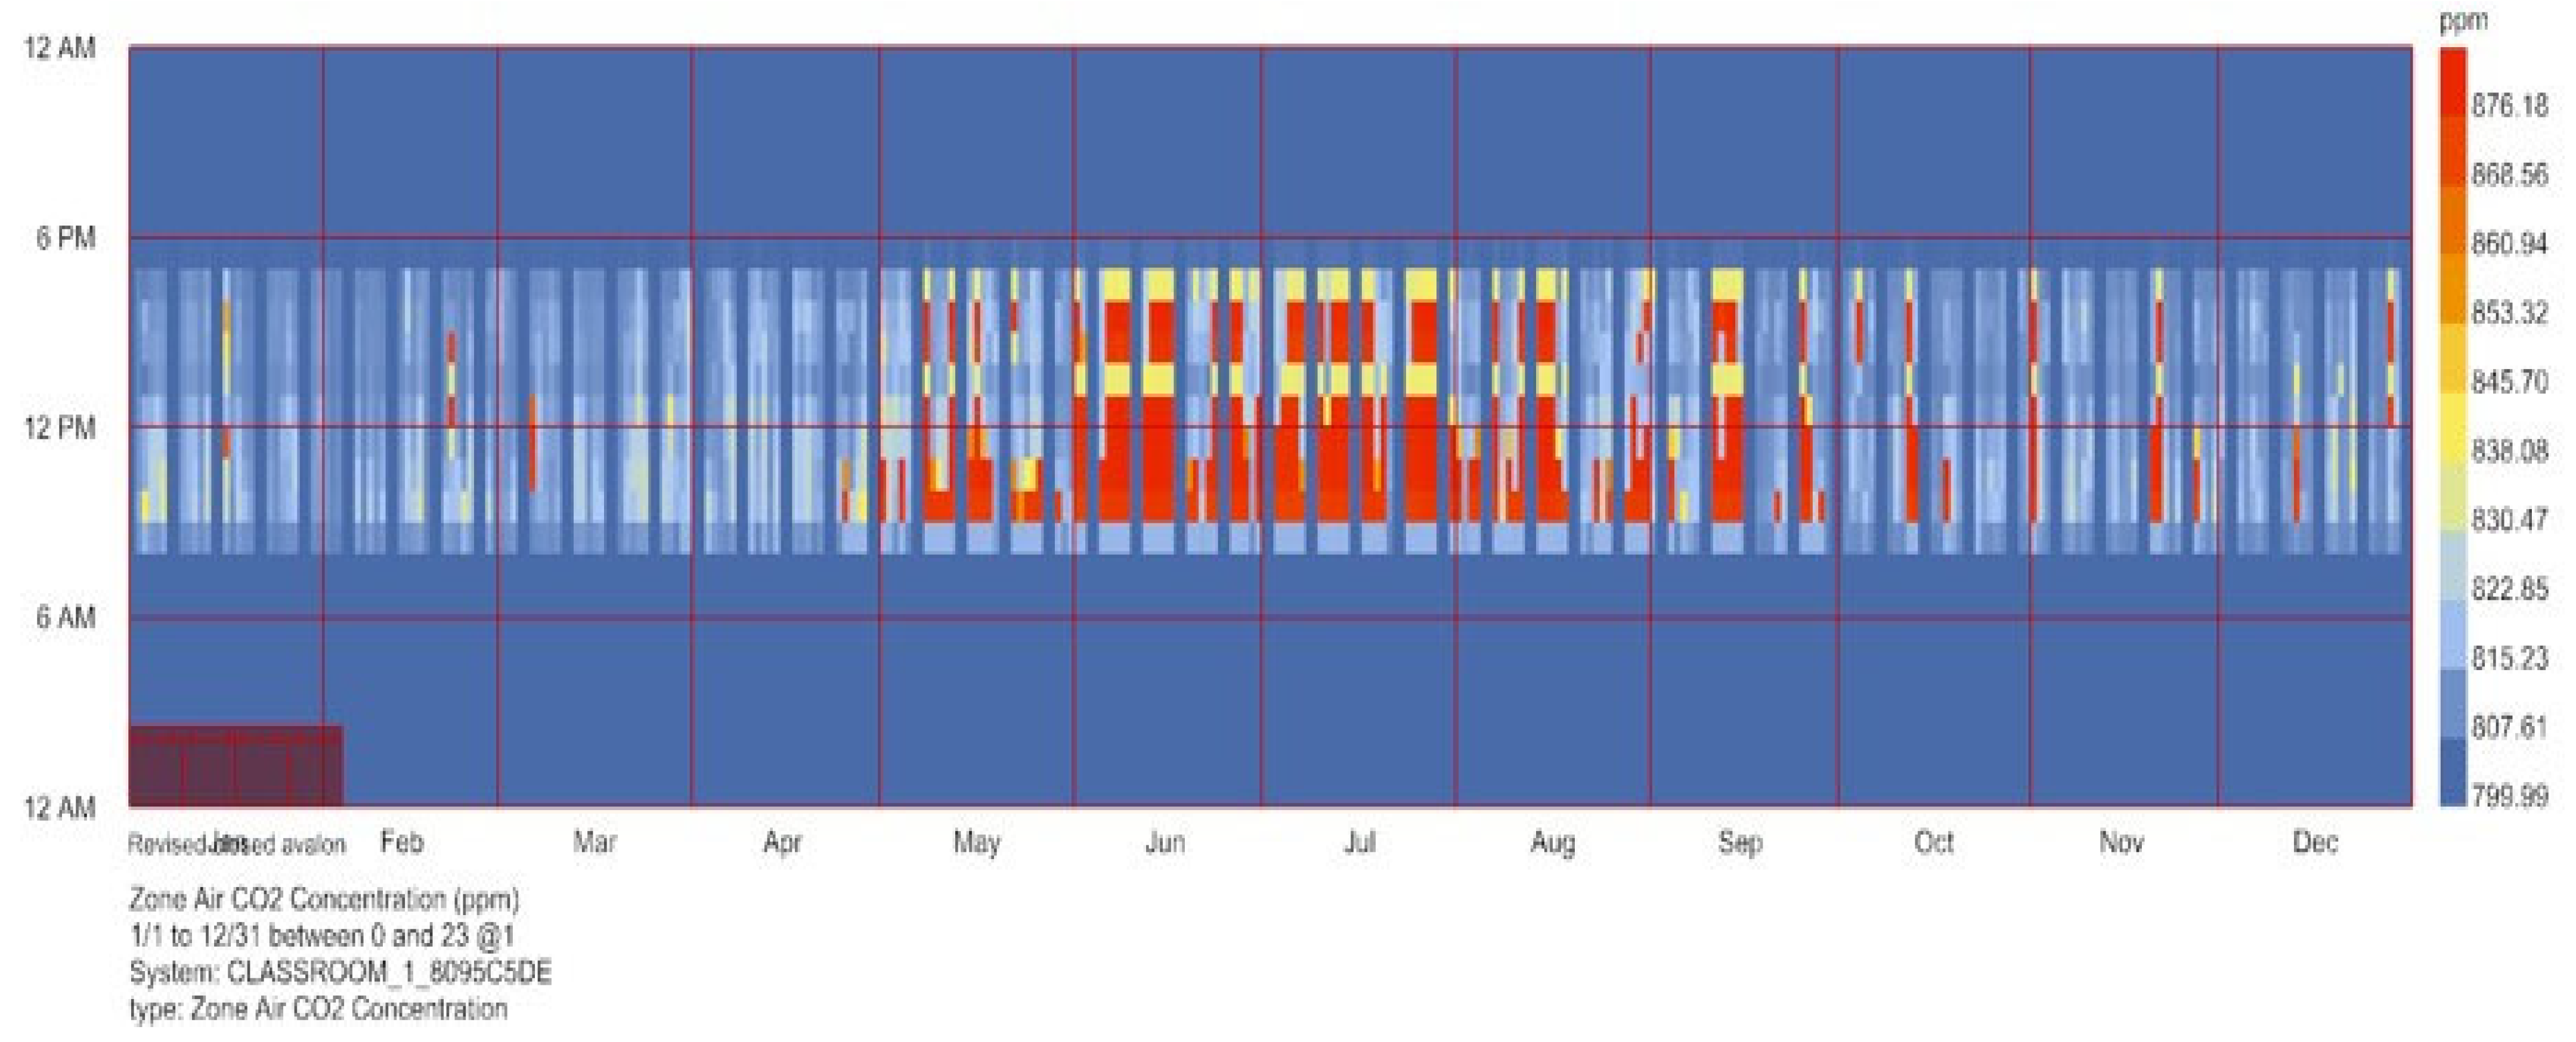
Figure 15 and
Figure 16 show the carbon dioxide concentration for Avalon Block (CHCH at 800 ppm and 2000 ppm).
5.4. Holistic Comparative Analysis
DQLS V 2.0 consistently outperforms the OECD standards in the Avalon block’s adaptive thermal comfort (TCP) percentage with a remarkable mean value above 70%, even in diverse climatic conditions. Low (HSP) values indicate good thermal resistance for preventing cold stress during winter, and moderate (CSP) values indicate limited overheating compared to OECD standards. Christchurch and Queenstown showed the lowest TCP value but comparatively high HSP value, while Auckland and Christchurch had the highest CSP value. The optimal design changes enhanced the TCP value by 3–10% and the CSP value by 5–10%. Low HSP value is important for an educational environment where thermal comfort can impact cognitive performance. A low CSP value suggests good management with a rise in global temperature.
The Avalon block performed better with daylight and Useful illuminance. The mean DA for Avalon values are above 47%, and UDI above 67%. Consistent performance with 35% WWR in Avalon. Avalon performed resiliently in the context of diversified climatic conditions. The value for relatively small standard deviations in maximum values indicates reliable upper-performance thresholds. Areas with higher UDI often experience increased solar heat gain, leading to higher cooling demands (higher CSP) [
73]. Conversely, reducing window area or using shading to decrease cooling loads can potentially reduce useful daylight [
26,
74]. Similarly, the Avalon block showed high UDI and CSP values in Wellington, Christchurch, and Queenstown. The optimal design changes for reducing the WWR to 25% improved the CSP values but also helped to strengthen the thermal comfort overall.
Comparing the energy performance across New Zealand’s varied climate zones reveals that the optimal Avalon solution demonstrated a balanced heating performance (52–68.5 kWh/m
2) across climate zones compared to standard implementations, particularly showing improvement over DQLS (V2.0), which requires 65–81.6 kWh/m
2 across north to south regions. The cooling demands were significantly reduced in northern and southern regions, ranging from 21–36 kWh/m
2 to 14–25 kWh/m
2, similar to other OECD standards. This improvement directly correlates with the increased ceiling height to 3.5 m and vertical window placement of 0.3 m, which enhances air stratification and reduces energy demands [
75]. Cooling load analysis reveals significant regional variations, with the Optimal Avalon solution showing excellent performance in Wellington (3.83 kWh/m
2) but higher values in Hamilton (33 kWh/m
2). These improvements are directly attributable to the enhanced R-values implemented in the thermal envelope, particularly the increases of 3.3% for roofs, 6.5% for walls, and 4% for floors in Christchurch, and the more aggressive enhancements of 7% for roofs, 9.35% for walls, and 3.8% for floors in Queenstown [
76,
77]. The infiltration load appears highly effective in DQLS V2.0. The Avalon infiltration load for the northern region (AKL, HAM, and ROTO) was between 0.3–0.5 kWh/m
2, while the southern region (CHCH, WELL, and QTN) was slightly higher, between 0.5–0.6 kWh/m
2. However, the infiltration value is close to 0, which indicates the marginal heat transfer to heat gain, while the negative infiltration value indicates heat losses [
78].
Across all climate zones, the Avalon block at 800 ppm base value presented a 9–10% spike at 10 l/s/p. Similarly, for 7 l/s/p at a base value of 1200 ppm, the Avalon resulted in a spike of 11%. For 3 l/s/p at 2000 ppm, Avalon showed a 12% spike. With every 3–4 l/s/p decrease in airflow, the Avalon shows a spike of 2–3%. The manual window timestep intervention adjustment is every 120 min in Avalon for 10 min [
42,
79], along with a 0.8-metre ceiling height increase (stack effect) [
80], and 0.3-metre window vertical movement [
81,
82], coupled with 25% WWR in Avalon, which significantly reduced carbon dioxide. In optimal Avalon, at 12 l/s/p, the spike from 10% was reduced by 50%; at 7.5 l/s/p, the spike from 11% dropped to 4.8%, and 4 l/s/p resulted in 4.5% from 12%.
While this research used the Avalon block design school as a specific reference study, but computational approach and findings have broader applications for educational facility design. The relationships identified between building envelope, daylighting, thermal comfort, energy performance, and indoor air quality represent fundamental architectural principles rather than characteristics unique to this reference school building. The parametric modelling approach deliberately isolated key design variables that exist in the majority of school buildings, allowing designers to apply these insights to different contexts. The computational methods developed can be readily adapted to analyse similar design challenges in other educational facilities, regardless of size or location, via access to climate data information. The results and findings have relevance beyond this single reference primary school study.
5.5. Limitations and Areas of Improvement
This study presents insights regarding IAQ and TC positioning with the current DQLS V2.0 standards. DQLS V2.0 establishes a solid foundation for classroom environmental quality regarding adaptive comfort, daylight/illuminance, ventilation strategies, carbon dioxide, and energy load (heating and cooling) while presenting opportunities for enhancement through targeted interventions. The standard achieves commendable balance across multiple performance criteria, with specific areas showing potential for improvement.
Thermal Comfort: DQLS V2.0 delivers satisfactory thermal comfort percentages across most climate zones, particularly in moderate regions. The variations observed between northern and southern regions suggest that while the standard provides good thermally balanced performance, strategic ceiling height, window positioning adjustments, WWR%, and a slight increase in R-value in cooler regions can enhance adaptive thermal comfort without compromising other environmental factors. Both classroom typologies achieve acceptable daylight autonomy under DQLS V2.0, with consistent illuminance distribution. The research demonstrates that carefully calibrated window-to-wall ratio reductions (to 25%) can maintain sufficient daylighting while simultaneously improving thermal performance, revealing an opportunity to fine-tune the relationship between these interdependent factors. However, there is a trade-off between illuminance and CSP value. Higher illuminance thus creates thermal discomfort. The limitation of this study is that it does not analyse the significant solar gain and different building and window orientations, creating room for future research. Energy Analysis: DQLS V2.0 presents reasonable energy performance that balances competing demands. The optimisation analysis reveals that modest enhancements to thermal envelope specifications (R-values) and other interventions can yield significant improvements in heating and cooling loads while maintaining efficient parameters, pointing to potential efficiency gains through climate-specific adjustments. However, the high heating load in the northern region and high cooling load in the southern region indicate that future studies can connect it with different window orientations associated with climate-oriented research with enhanced ventilation strategies. The cost implications associated with interventions have not been analysed in future studies. Carbon Dioxide: The ventilation strategies within DQLS V2.0 provide adequate indoor air quality. The improved performance achieved through adjusted window operation schedules and increased ceiling height demonstrates that relatively simple interventions can substantially enhance ventilation effectiveness while preserving the standard’s core environmental balance. CO2 management strategies could be enhanced by implementing optimised window operation, more frequent schedules, and leveraging the stack effect for better airflow. The research confirms DQLS V2.0’s effectiveness as a comprehensive standard while highlighting how thoughtful, integrated interventions can simultaneously elevate its performance across multiple environmental criteria.
6. Conclusions
This comprehensive assessment of DQLS V2.0 across diverse New Zealand climate zones against OECD standards reveals significant strengths and areas requiring strategic intervention. The standard demonstrates remarkable versatility in establishing baseline environmental quality metrics that generally outperform several OECD standards, particularly in thermal comfort and daylighting parameters.
The DQLS V2.0 framework maintains Total Comfort Percentage (TCP) values consistently above 70% across most regions in the Avalon classroom typologies, showcasing its ability to adapt to New Zealand’s varied climate conditions. This foundational strength in thermal comfort supports cognitive function and student well-being across diverse geographical locations. Similarly, the daylight autonomy (DA) metrics consistently achieve acceptable thresholds above 47%, with useful daylight illuminance (UDI) values exceeding 67% in both typologies, indicating effective baseline illumination strategies. Still, its impact on thermal comfort has not been analysed.
However, notable limitations emerge in specific performance areas that warrant targeted improvement. The standard exhibits challenges in managing cooling season comfort percentages (CSP), particularly in northern regions where overheating issues are more pronounced. Energy analysis reveals suboptimal performance in heating loads for northern regions (65–70 kWh/m2) and cooling loads in southern regions (21–36 kWh/m2), indicating opportunities for climate-specific calibration. Additionally, the Avalon typology demonstrated CO2 concentration spikes (9–12%), suggesting that ventilation strategies require typology-specific refinement. Optimisation analysis demonstrated that strategic interventions can significantly enhance DQLS V2.0 performance without compromising its holistic approach. Specifically, adjustments to ceiling height (3.5 m), window positioning (0.3 m vertical repositioning), window-to-wall ratio reduction (25%), enhanced thermal envelope specifications, and refined ventilation scheduling can yield substantial improvements: TCP increases of 3–17%, CSP reductions of 5–18%, heating load reductions of 6–16%, cooling load reductions of 10–35%, and CO2 concentration reductions of 10–30% in Avalon block.
These findings affirm that DQLS V2.0 establishes a stronger foundation for classroom environmental quality than comparable OECD standards, particularly in its balanced approach to multiple performance criteria. The standard’s comprehensive framework provides a robust platform that, with strategic climate-specific interventions and more holistic analysis incorporating orientation factors, solar gain considerations, window position optimisation, post-occupancy evaluation, and cost implications, can further elevate classroom environmental quality to exceptional levels, balancing the relationship between the improved thermal performance (particularly from height increases) and ventilation effectiveness would strengthen DQLS V2.0’s relevance for post-pandemic design.
To enhance practical applicability, optimised design recommendations can be implemented through a phased approach aligned with school renewal cycles. For existing Avalon blocks, the most cost-effective interventions include manual window operation schedules (120 min intervals). Medium-cost interventions include window repositioning (0.3 m vertical adjustment) and WWR reduction to 25. The ceiling height increases to 3.5 m presents the most significant intervention per classroom, making it more suitable for new constructions or major renovations. Schools can prioritise these interventions based on climate zone challenges. Northern regions (Auckland, Hamilton) should focus on cooling load reductions through window modifications, while southern regions (Christchurch, Queenstown) benefit most from enhanced thermal envelope specifications and targeted R-value improvements (particularly roof insulation at 3.3–7% enhancement). This tiered implementation strategy allows schools to maximise improvements within existing budget constraints.
This research, though based on the Avalon block, contributes generalisable knowledge about optimal design strategies for educational facilities. The computational results reveal design principles that transcend this specific context and provide valuable insights for architects and designers working on various school building projects. The methodology itself offers a replicable framework for analysing design performance in educational environments.
Future research should explore the interrelationships between building orientation, window configuration, and climate-specific adaptations to refine the DQLS framework further. Additionally, cost–benefit analyses of proposed interventions would provide valuable insights for practical implementation. Moreover, additional case studies can directly adopt the computational methods and design principles across diverse climate conditions for other educational facilities. This would further strengthen the generalisability of our findings and refine the computational approach for broader implementation. By building upon DQLS V2.0’s strong foundation with these targeted enhancements, New Zealand’s educational facilities can achieve optimal environmental conditions that support student learning outcomes while maintaining energy efficiency and sustainability goals.
