
A Cloud Model-Based Evaluation of Renovation Decisions for Old Urban Communities from the Perspective of Resilience—A Case Study of a Community in Nanjing, China

Abstract
1. Introduction
2. Materials and Methods
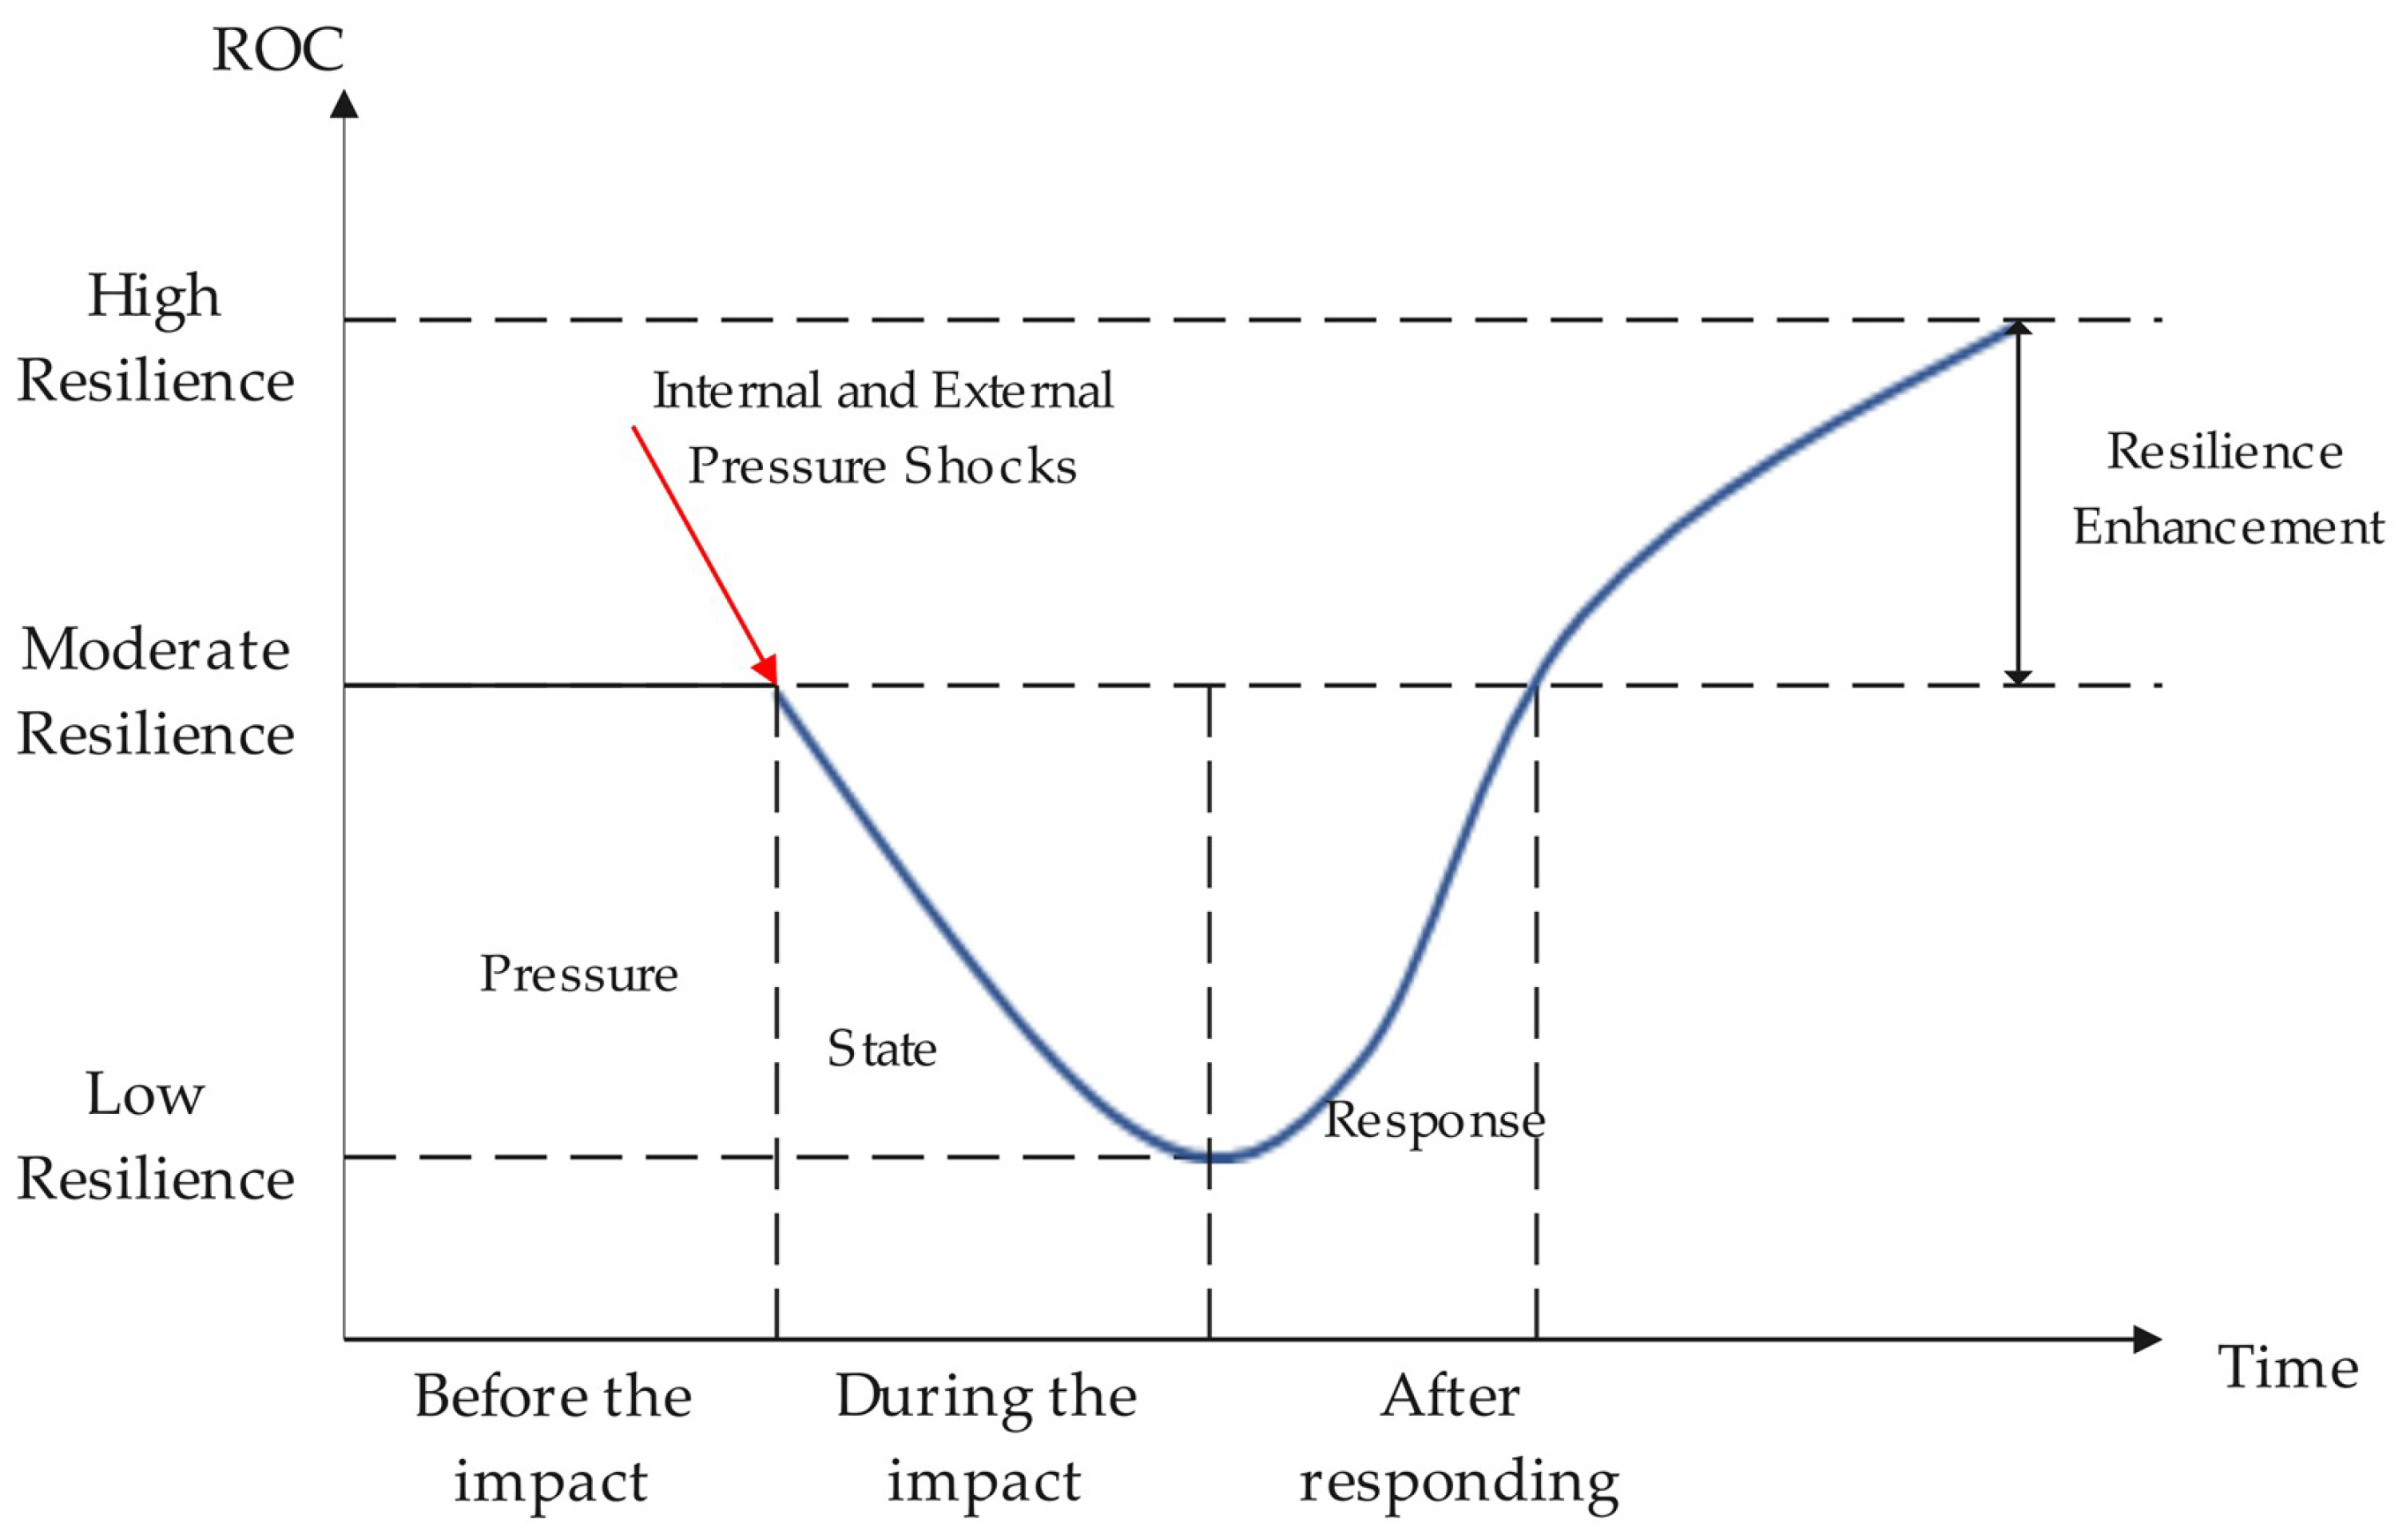
2.1. Concept of Resilience of Old Communities (ROC)
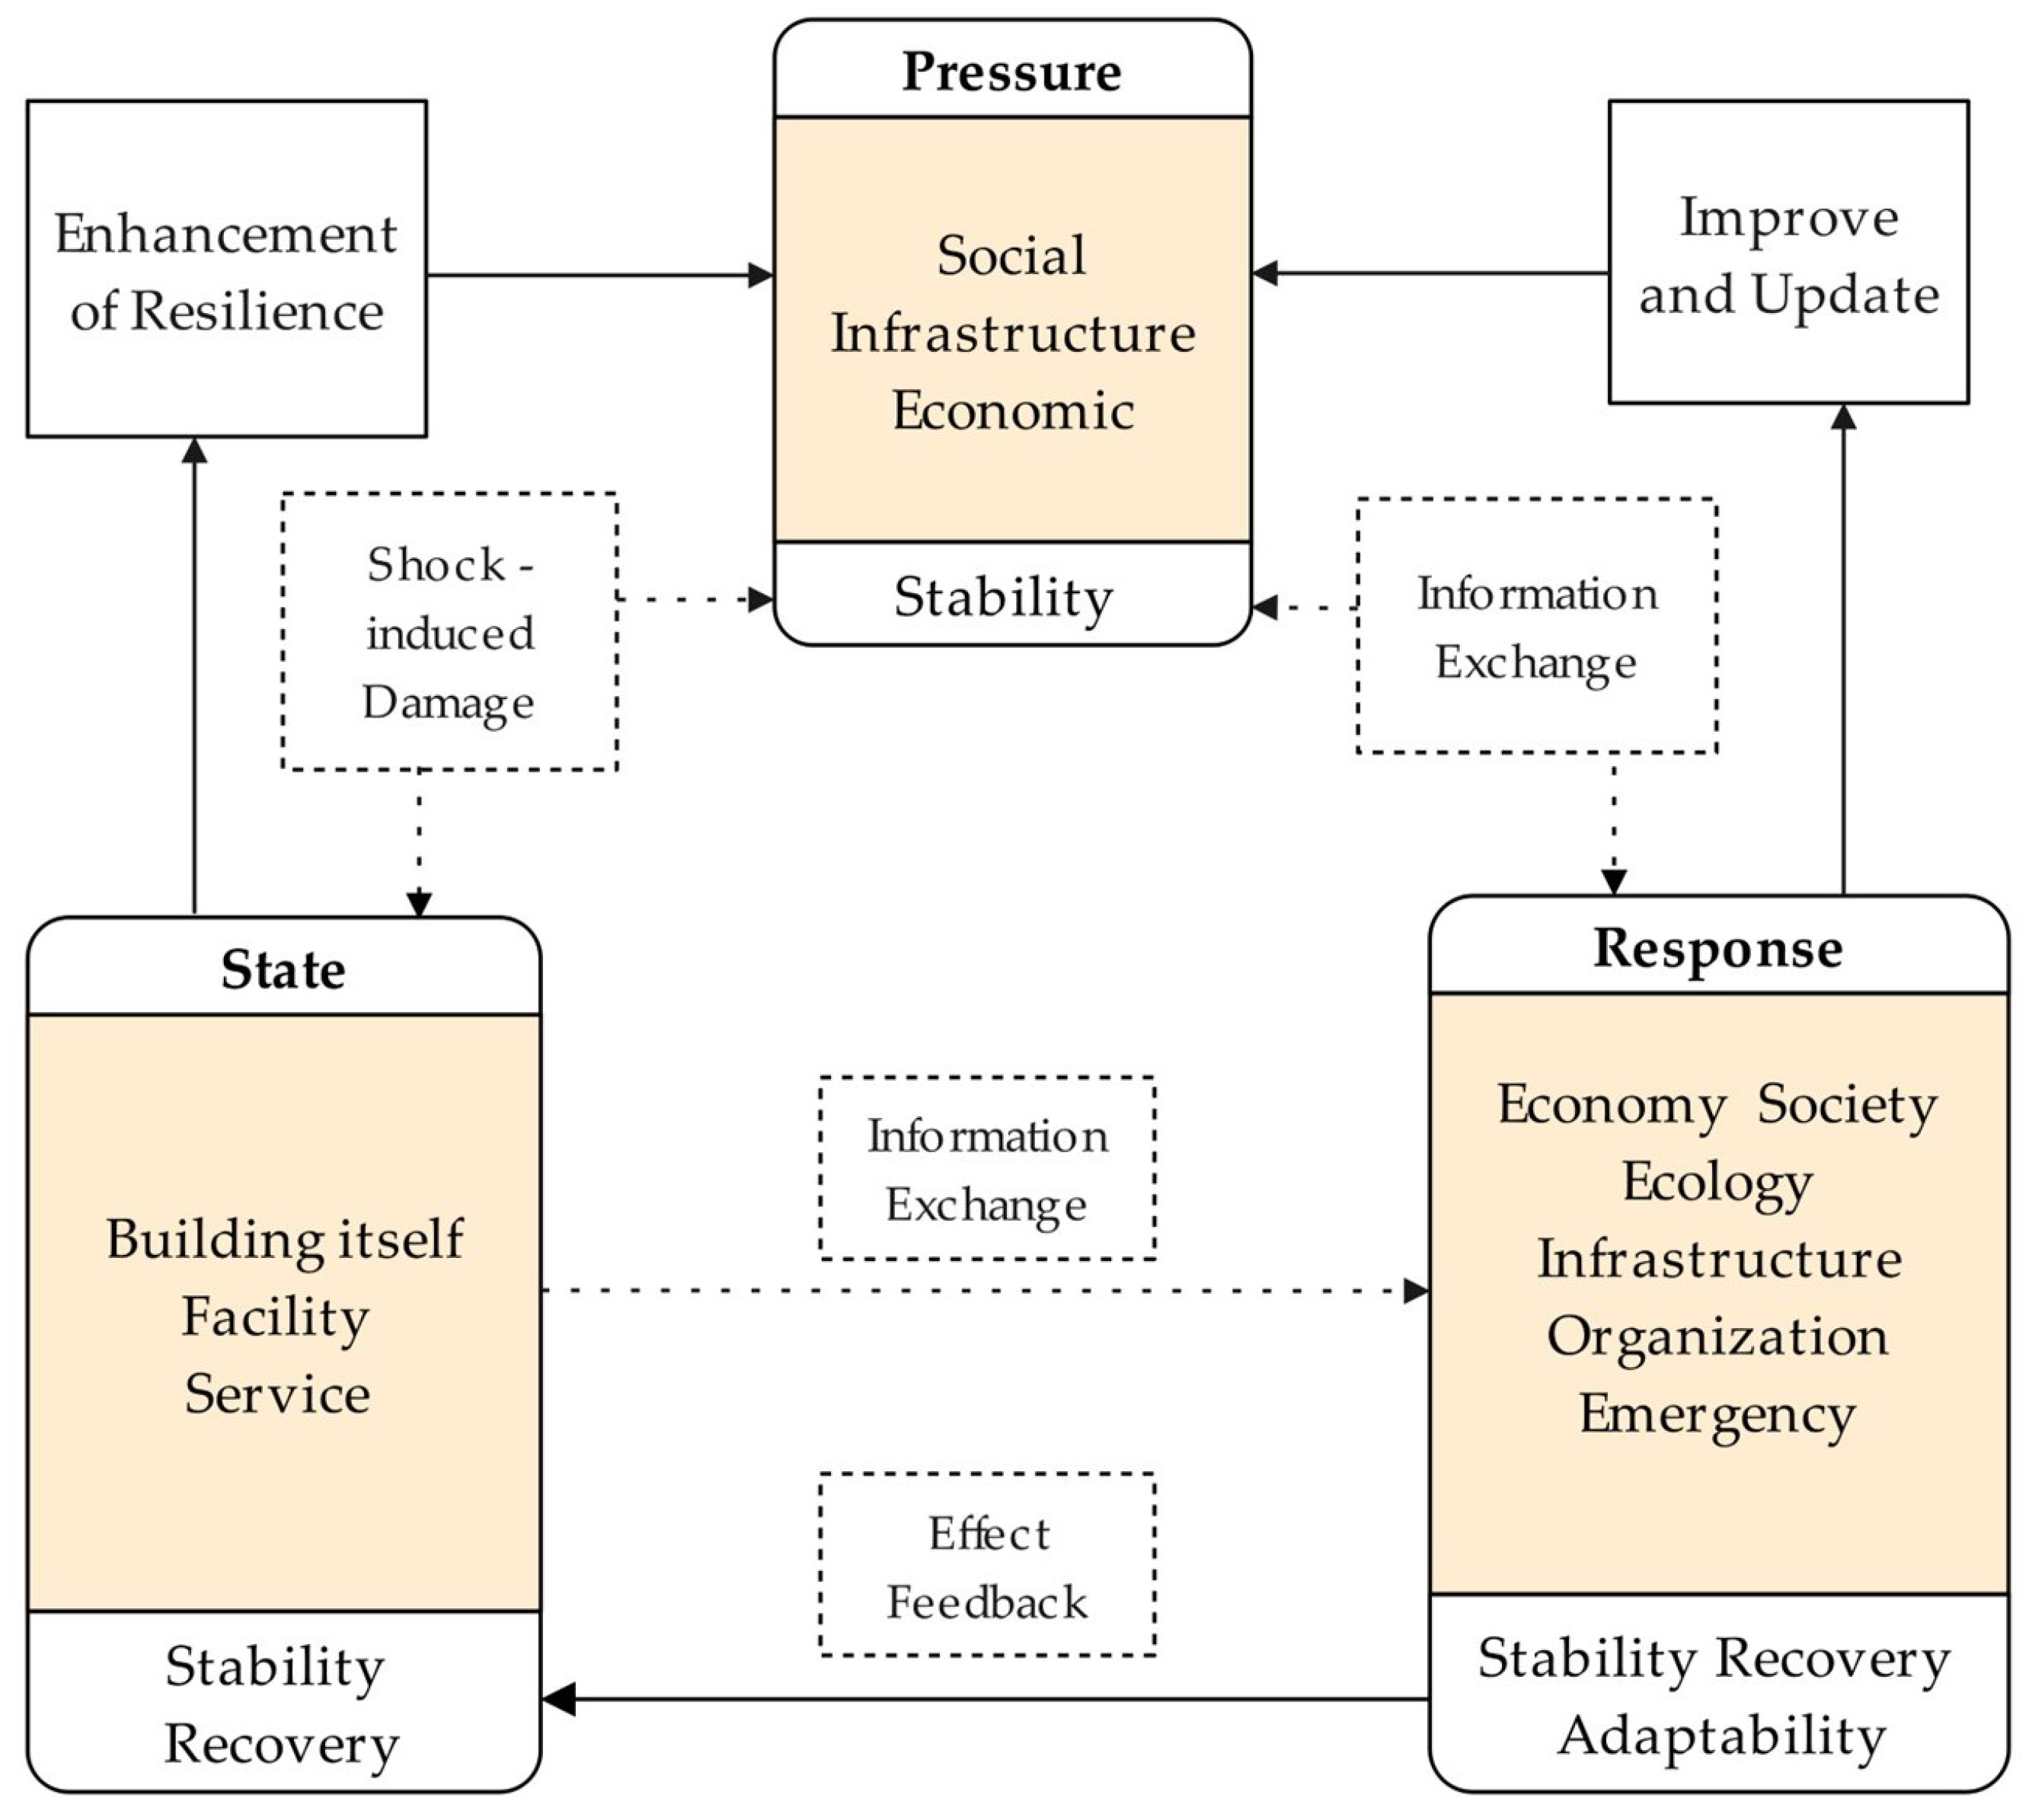
2.2. The Intrinsic Relationship Between the PSR Model and the ROC
2.3. ROC Assessment Indicator System Based on the PSR Model
2.4. Vague Set-Based Indicator Simplification and Quantitative Classification of Indicators
3. Cloud Model-Based Priority Decision-Making Framework for the Renovation of Old Communities
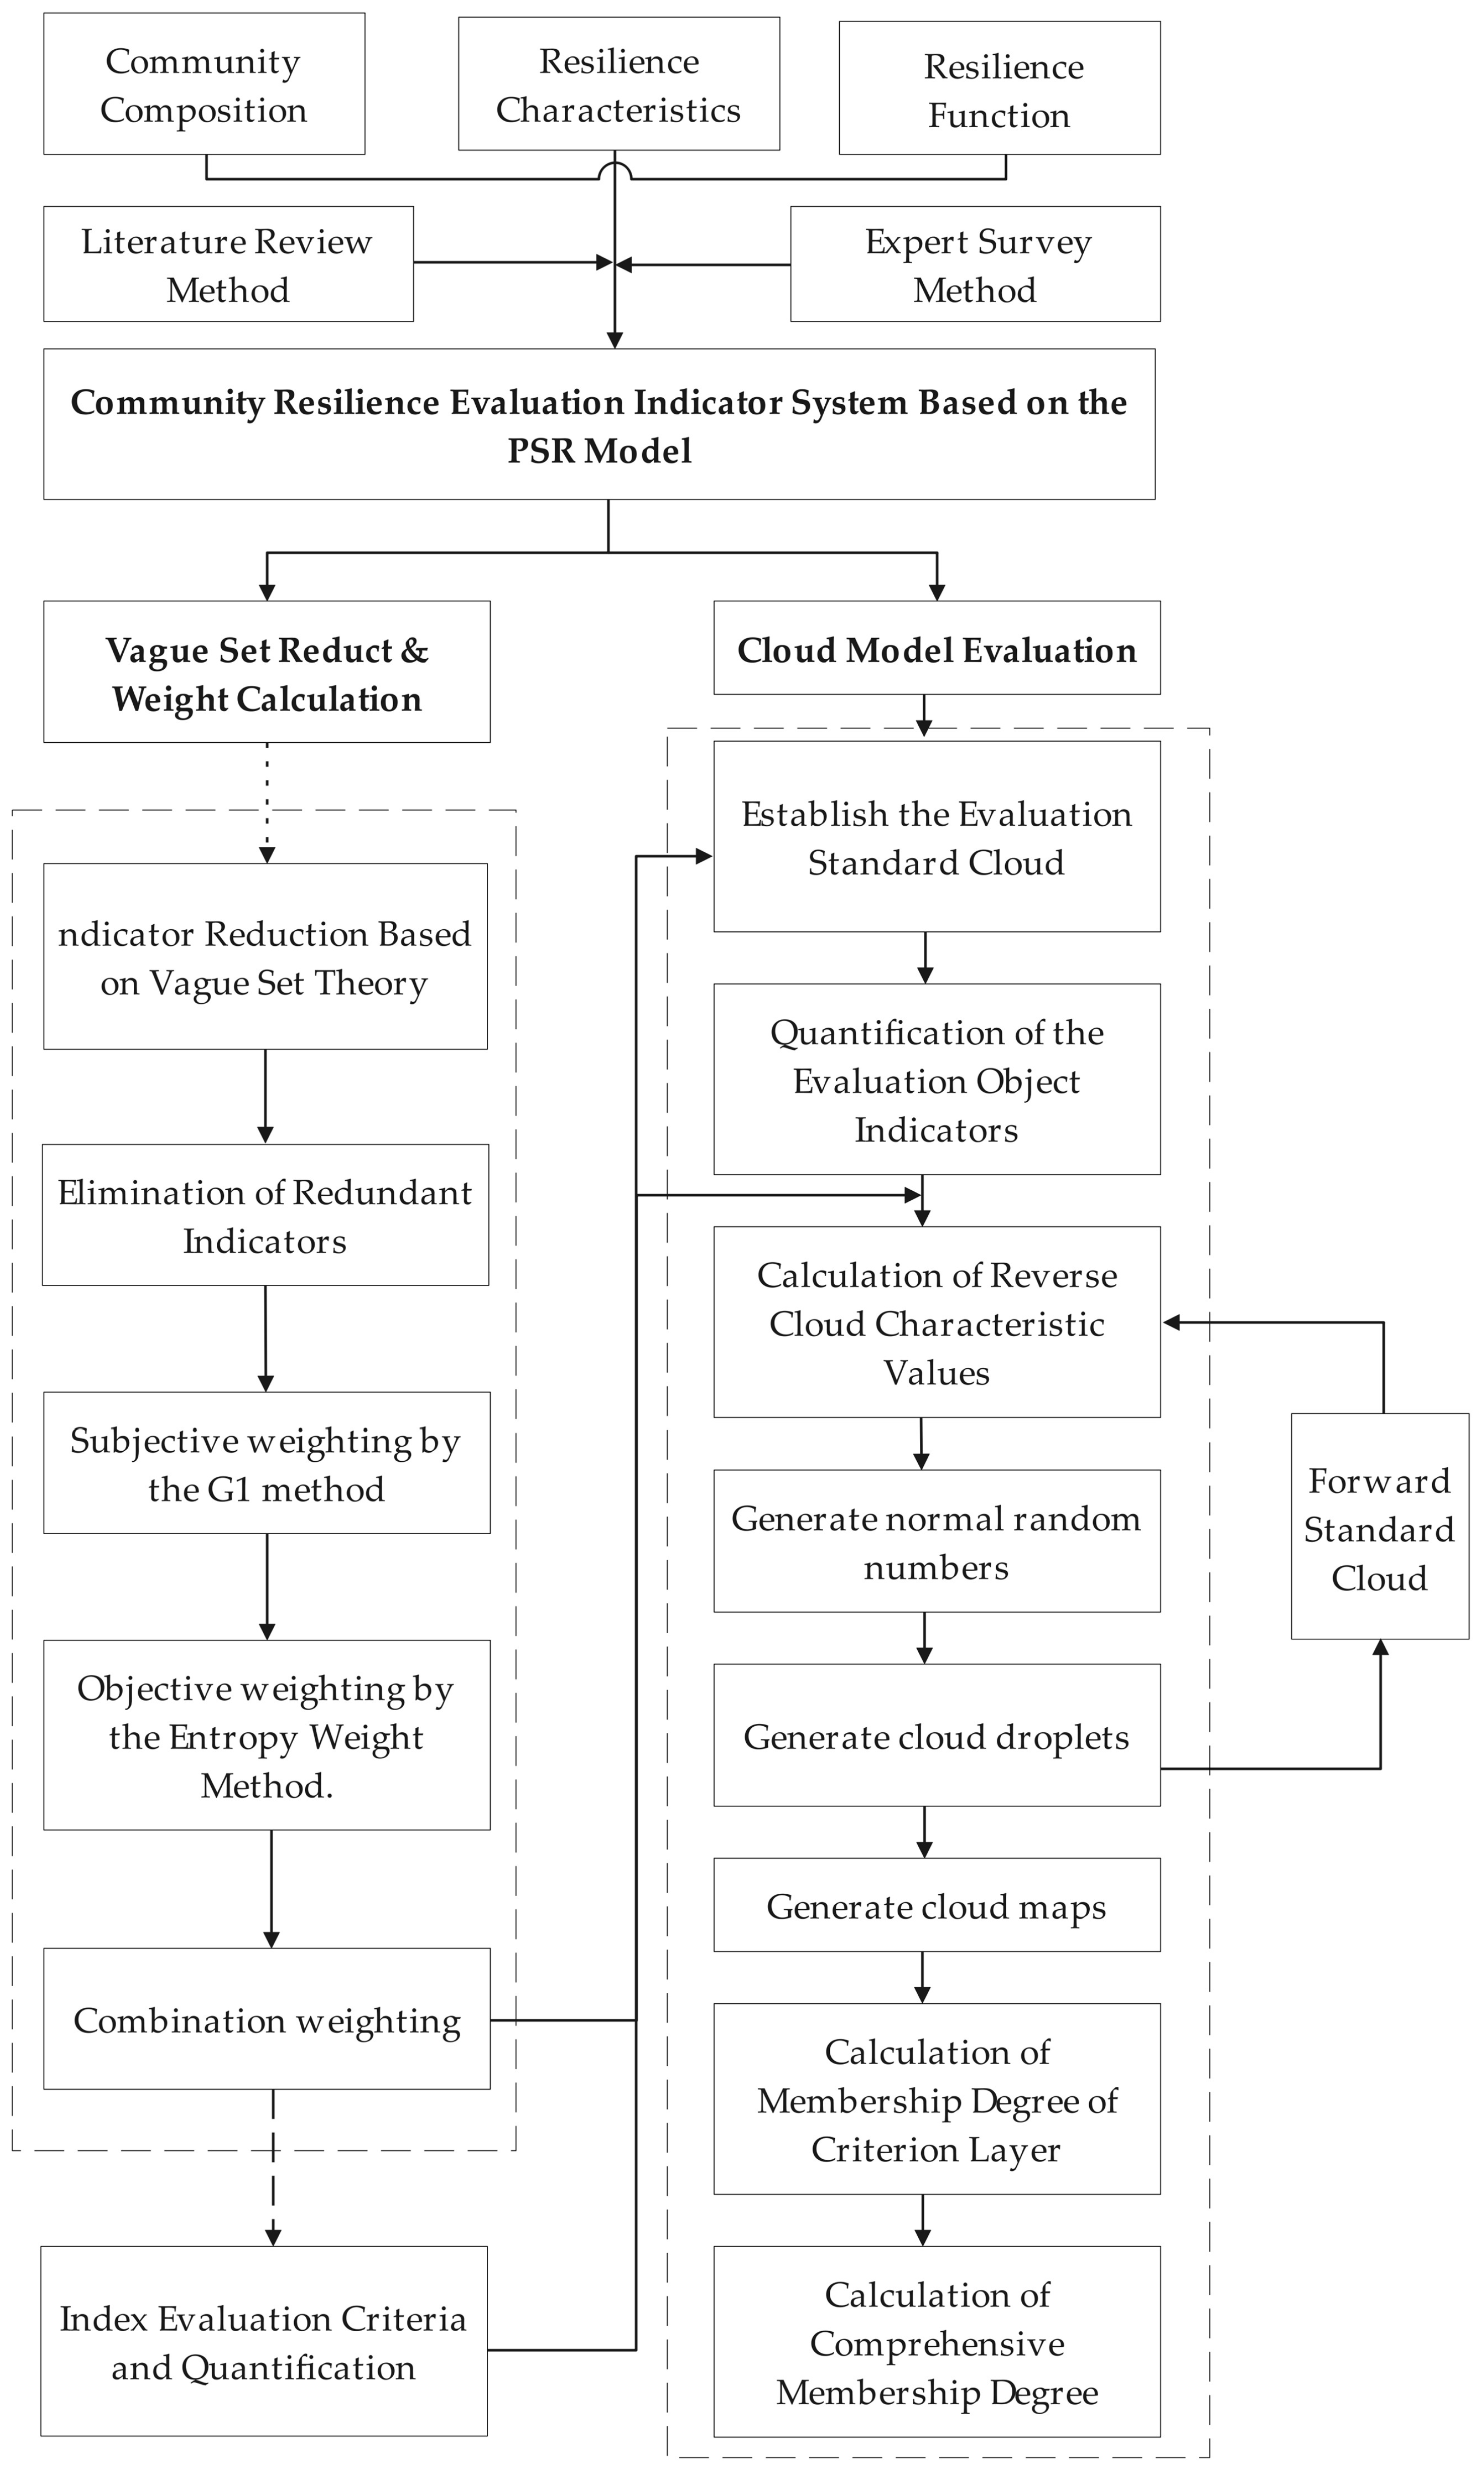
3.1. Cloud Model Evaluation Process
- Preliminary determination of the ROC evaluation index system through a literature review and expert methods, and a reduction in indicators using vague set methods to determine the renovation evaluation index system for old communities.
- Using subjective and objective weighting methods to determine the combined weight of evaluation indicators.
- Using cloud model backward generators with the obtained weights to generate assessment cloud maps, comparing the backward cloud map with the forward standard cloud map, and determining the membership degree of the ROC value at each criterion on the principle of the maximum membership degree.
3.2. Combined Weighting Based on the G1 and Entropy Weight Methods
- G1 Weighting MethodThe G1 weighting method, also known as the Sequence Relation Analysis Method, is a subjective weighting technique derived from the analytic hierarchy process (AHP). This method is logically straightforward, easy to compute, and does not require consistency checks, thereby enhancing the validity of the resulting weights [21]. The weights of each indicator are calculated according to Formula (2). In this formula, C represents the ranking of the relative importance of the indicators, denotes the weight of the indicator, and indicates the relative importance of the indicator, categorized into nine equal levels with values ranging from 1 to 1.8.
- Entropy Weight MethodThe entropy weight method calculates the weights of indicators by assessing the information entropy associated with each indicator, thereby facilitating the objective weighting of multi-indicator data. This process is specifically detailed in Formula (3). In this context, i represents the sample, j denotes the indicator, indicates the value of the sample and indicator, refers to the information entropy, and signifies the weight of the indicator.
- Combined WeightingThe weighting vectors of subjective and objective indicators are linearly combined according to Formula (4) to obtain the combined-weight vector. In Formula (4), and represent the coefficients of the subjective and objective weights, respectively. The weight coefficients are usually determined using methods such as the simple average, weighted average, analytic hierarchy process (AHP), etc.
3.3. Cloud Model Parameters and Membership Degree Calculation
- Construct the forward standard cloud.
- Calculate the reverse cloud parameters for each evaluation indicator.
- Calculate the cloud level similarity.
- Calculate the cloud level membership degree
4. Case Study
4.1. Case Overview
4.2. Establishment of a Cloud Model for the Evaluation Standards of Each Indicator
4.3. Combined-Weight Calculation
- G1 Method for Weight Calculation
- Entropy Weight Method for Weight CalculationData from sixteen retrofitted communities in Nanjing, similar to the YinLun Garden community, were collected. Using Formula (3), the objective weights for the resilience evaluation of old communities were calculated.
- Combined-Weight CalculationAs illustrated in Figure 5, the entropy weight method and the G1 method assign significantly different weights to various indicators. The combined weighting method effectively mitigates the discrepancies arising from both subjective and objective weighting approaches. Given that the data sample utilized in the entropy weight method was relatively small, the weight coefficient was set at 0.4. The combined indicator weights were calculated using Formula (4). The results of the weight calculations are presented in Table 6, where W1 denotes the weight determined by the G1 method, W2 indicates the weight derived from the entropy weight method, and W0 with a bold font represents the combined weight.
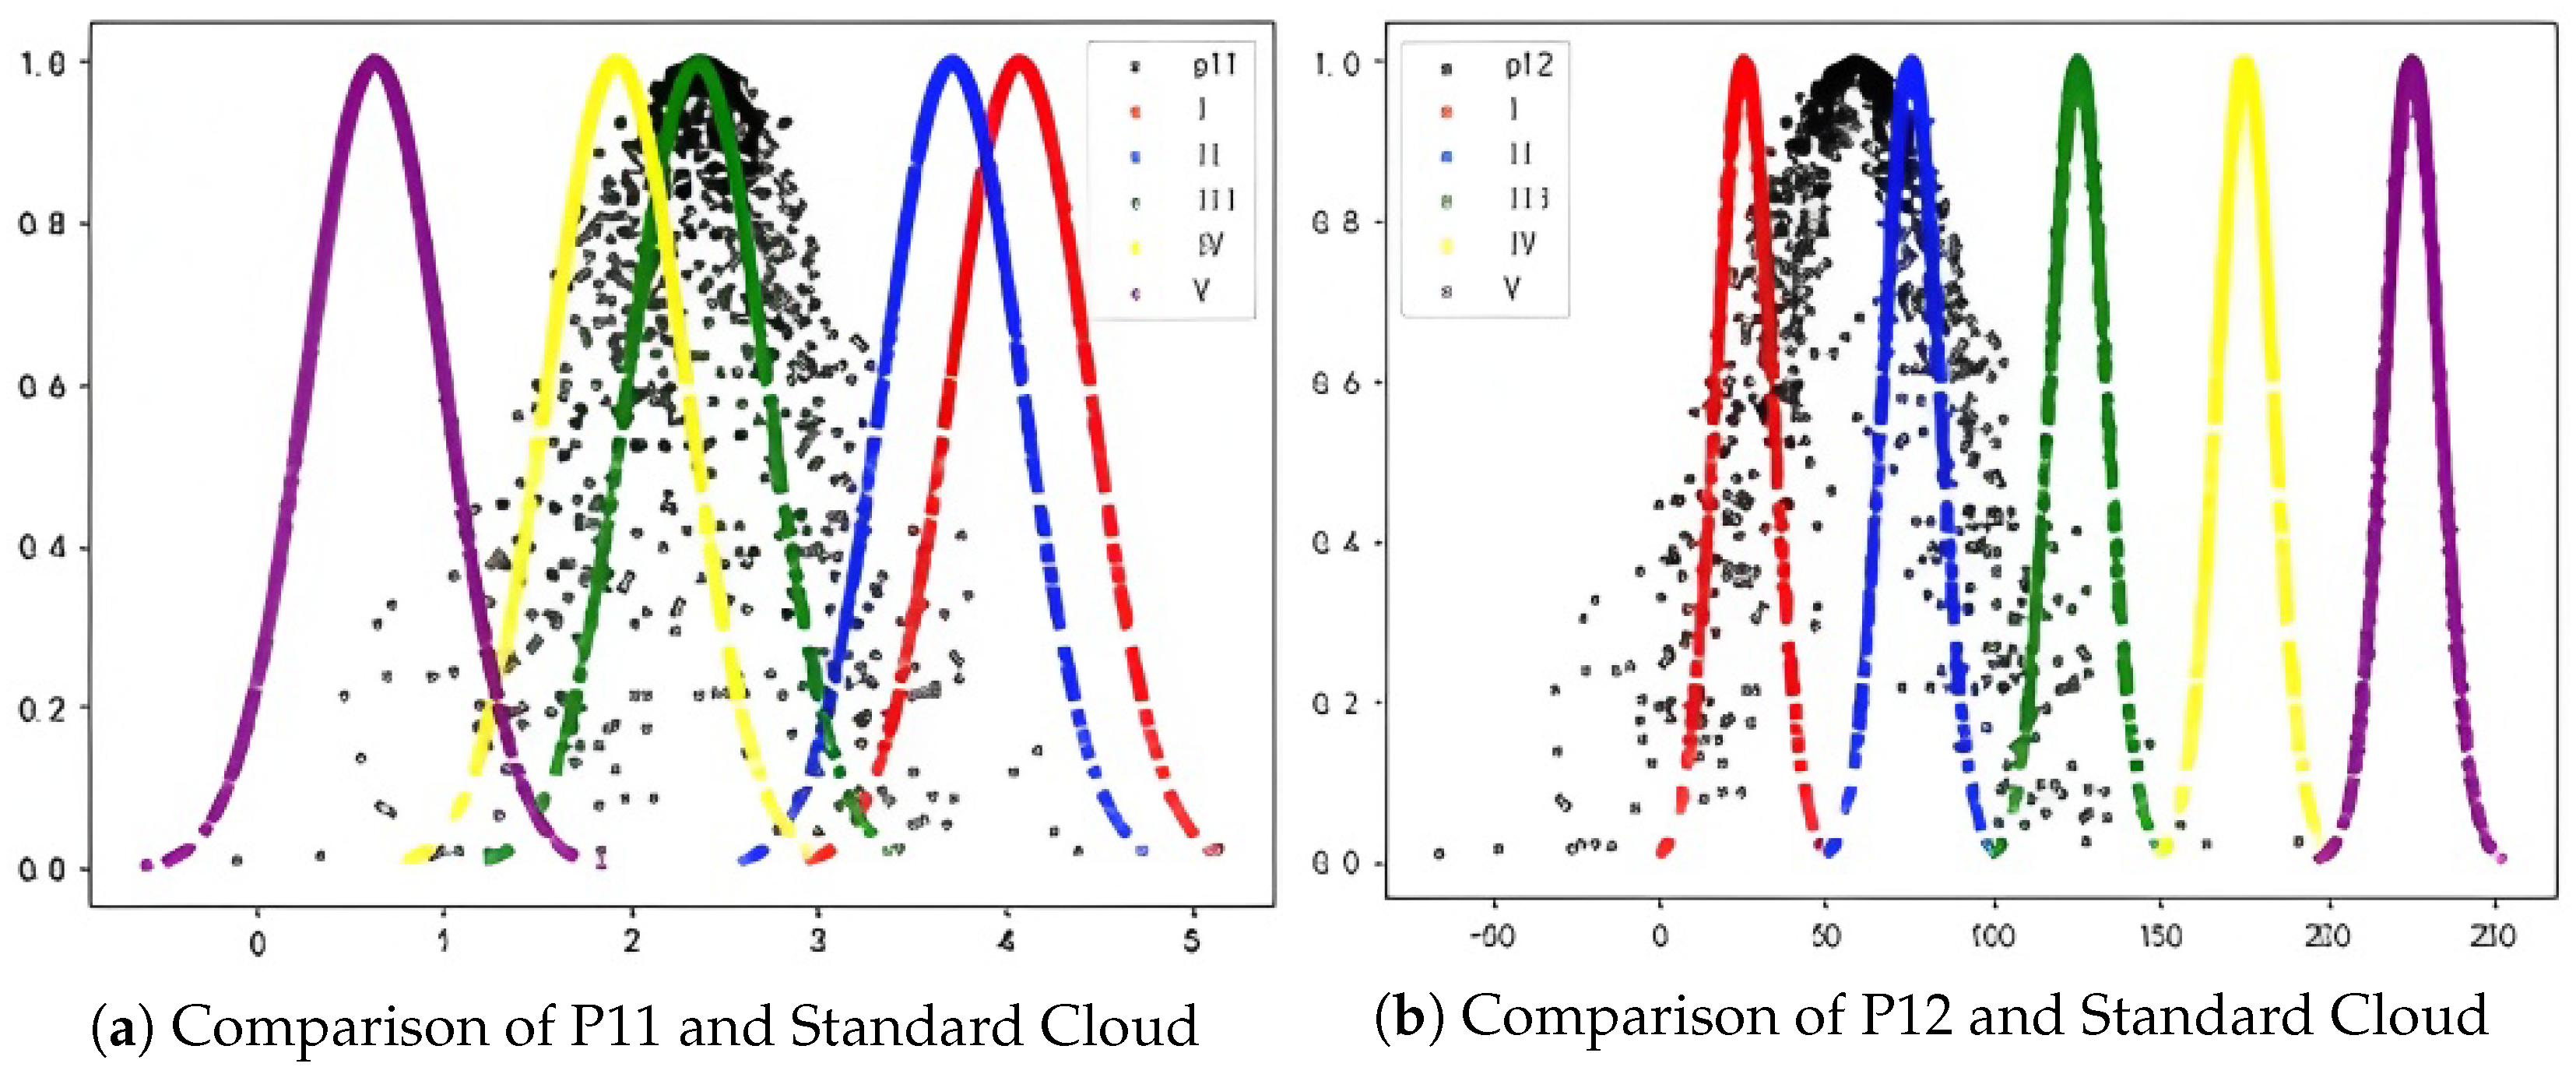
4.4. Calculation of Indicator Membership Degree and Generation of Evaluation Cloud Map
- We adopted a literature review and expert methods to preliminarily determine the ROC indicator system, and applied vague set methods to reduce the indicators for establishing the evaluation indicator system for old-community renovation.
- We adopted both subjective and objective weighting methods to establish the combined weights of the evaluation indicators.
- We treated the obtained combination weights as the probabilities of the resilience indicator’s occurrence, and we utilized the forward and reverse cloud generators of the cloud model to produce the cloud parameters. Based on the principle of the maximum membership degree, we calculated the membership degree values for different resilience levels of the ROC.
4.5. Calculation of Membership Degrees for Target, Criteria, and Sub-Criteria Layers
5. Discussion and Suggestions
5.1. Discussion
5.2. Suggestions
6. Conclusions and Limitations
6.1. Conclusions
- The decision-making process for renovating and evaluating older communities, viewed through a resilience perspective, effectively integrates current challenges with the potential for future development. This approach emphasizes goal orientation while also prioritizing sustainability. Notably, the resilience indicator classification system based on the pressure–state–response (PSR) model standardizes the evaluation indicators for renovation decisions, thereby enhancing the consistency and efficiency of the evaluation framework.
- The decision-making and evaluation method that employs the cloud model to calculate the resilience level membership degrees of various layers not only facilitates seamless conversion between qualitative language and quantitative values, but also accommodates the inherent randomness of the data. Moreover, through data visualization, it effectively illustrates the resilience levels of the different criteria layers within the evaluated community.
6.2. Limitations
- The weights of the resilience evaluation indicators based on the PSR model, as determined using the combined weighting method presented in this paper, require further validation to ensure their rationality and accuracy in practical applications. Additional research is needed to enhance the systematization and stability of the indicator system. The sample size utilized for determining the objective weights of the indicators through the entropy weight method is relatively small, and the number of experts surveyed to establish the subjective weights using the G1 method is also limited. Future research should focus on increasing both the sample size and the number of survey participants.
- Although a cloud model computation program based on MATLAB has been developed, the calculation process remains relatively complex. Future research will focus on further studies in areas such as the intelligent evaluation of renovation potential, automation of data acquisition, and visualization of evaluation results.
Author Contributions
Funding
Data Availability Statement
Conflicts of Interest
References
- Gu, Z.; Zhang, X. Framing social sustainability and justice claims in urban regeneration: A comparative analysis of two cases in Guangzhou. Land Use Policy 2021, 102, 105224. [Google Scholar] [CrossRef]
- Yi, H.; Wang, X. Research on the Current Status and Development Suggestions of Existing Residential Building Renovation in China. Build. Sci. 2021, 37, 121–127. [Google Scholar]
- Fan, Y.; Zhang, M.; Li, H.; Xu, J.; Chen, Y. Resilience evaluation system of the old community based on cloud model. J. Shandong Univ. (Eng. Sci.) 2023, 53, 1–9. [Google Scholar]
- Zhang, J.; Li, X. Evaluation of Urban Public Building Renovation Potential Based on Combination Weight Cloud Model—Case Study in China. Buildings 2024, 14, 3211. [Google Scholar] [CrossRef]
- Papadopoulos, A.M.; Theodosiou, T.G.; Karatzas, K.D. Feasibility of energy saving renovation measures in urban buildings: The impact of energy prices and the acceptable pay back time criterion. Energy Build. 2002, 34, 455–466. [Google Scholar] [CrossRef]
- Pietrapertosa, F.; Tancredi, M.; Giordano, M.; Cosmi, C.; Salvia, M. How to prioritize energy efficiency intervention in municipal public buildings to decrease CO2 emissions? A case study from Italy. Int. J. Environ. Res. Public Health 2020, 17, 4434. [Google Scholar] [CrossRef] [PubMed]
- Lu, H.; Zhang, X. Assessing the adaptability of old community for renovation based on health sustainability. In Proceedings of the Institution of Civil Engineers-Engineering Sustainability; Emerald Publishing Limited: Leeds, UK, 2023; Volume 176, pp. 214–227. [Google Scholar]
- Zheng, C. Evaluation Study on the Comprehensive Benefits of the “Three Olds” Renovation in Tianhe District of Guangzhou City. Front. Humanit. Soc. Sci. 2023, 3, 92–98. [Google Scholar] [CrossRef]
- Shang, L.; Zhang, Y.; Zhang, D.; Zhong, Y. Disaster Resilience Evaluation of Old Communities under the Perspective of Rainstorm Flood Disasters: An Empirical Study Based on the PSR Model and BPNN. Sci. Technol. Eng. 2023, 23, 11338–11348. [Google Scholar]
- Guo, X.; Fei, Z.; Wang, Z. Rigidity, Flexibility, and Resilience in Urban Disaster Response. Urban Rural Plan 2021, 3, 35–42. [Google Scholar]
- Liu, S.; Wang, Y.; Li, Z.; Zhang, D.; Yu, K. Community resilience monitoring and evaluation under the prevention and control of public health emergencies. E3S Web Conf. 2021, 251, 03013. [Google Scholar] [CrossRef]
- Maskrey, S.; Vilcan, T.; O’Donnell, E.; Lamond, J. Using Learning and Action Alliances to build capacity for local flood risk management. Environ. Sci. Policy 2020, 107, 198–205. [Google Scholar] [CrossRef]
- Daniel, L.; Mazumder, R.K.; Enderami, S.A.; Sutley, E.J.; Lequesne, R.D. Community capitals framework for linking buildings and organizations for enhancing community resilience through the built environment. J. Infrastruct. Syst. 2022, 28, 04021053. [Google Scholar] [CrossRef]
- Zhang, X.; Luo, Y. Community Resilience from the Perspective of Disasters: International Research Progress and Implications. Secretary 2022, 40, 37–49. [Google Scholar]
- Yan, C.; Chen, J.; Duan, R.; Ren, W.; Lan, S. Evaluation System for Fireproof Resiliance of Urban Historical Blocks Based on Pressure-State-Response Model:A Case of Three Lanes and Seven Alleys in Fuzhou City. Sci. Technol. Eng. 2021, 21, 3290–3296. [Google Scholar]
- Hazbavi, Z.; Sadeghi, S.H.; Gholamalifard, M.; Davudirad, A.A. Watershed health assessment using the pressure–state–response (PSR) framework. Land Degrad. Dev. 2020, 31, 3–19. [Google Scholar] [CrossRef]
- Wang, J.; Wang, Y.; Lin, G. Study on Rural Classification and Resilience Evaluation Based on PSR Model: A Case Study of Lvshunkou District, Dalian City, China. Sustainability 2024, 16, 6708. [Google Scholar] [CrossRef]
- Fan, H.; Yang, T. Study on the Path and Strategy of Upgrading Renovation of Old Community Based on the Residents’ Needs: A Case of Youdian Xincun Community, Wuhan. In Proceedings of the 2023 5th International Conference on Civil Architecture and Urban Engineering (ICCAUE 2023), Xiamen, China, 17–19 November 2023; Atlantis Press: Paris, France, 2024; pp. 309–324. [Google Scholar]
- Shen, T.; Yao, X.; Wen, F. The Urban Regeneration Engine Model: An analytical framework and case study of the renewal of old communities. Land Use Policy 2021, 108, 105571. [Google Scholar] [CrossRef]
- Zhang, Z.; Wang, M.; Xu, Z.; Ye, Y.; Chen, S.; Pan, Y.; Chen, J. The influence of Community Sports Parks on residents’ subjective well-being: A case study of Zhuhai City, China. Habitat Int. 2021, 117, 102439. [Google Scholar] [CrossRef]
- Guotai, C.; Zhichuan, Z.; Yuling, Z. The science and technology evaluation model based on entropy and G1 and empirical research of China. Stud. Sci. Sci. 2008, 26, 1210–1220. [Google Scholar]
- Deyi, L.; Changyu, L.; Juan, D.; Xu, H. Artificial Intelligence with Uncertainty. Software 2004, 15, 1583–1594. [Google Scholar]


| Criteria Layer | Sub-Criteria Layer | Indicator Layer | Unit | Pos/Neg | Fre | |
|---|---|---|---|---|---|---|
| Pressure | Social pressure | Residential Floor Area Ratio (FAR) | P11 | N | − | 9 |
| Per Capita Housing Area | P12 | M2/person | + | 6 | ||
| Surrounding Hazard Sources | P13 | Int | + | 3 | ||
| Ecological pressure | Annual Average Precipitation | P21 | mm/year | − | 12 | |
| Community Road Network Density | P22 | M/M2 | − | 10 | ||
| Residential Area Sanitation | P23 | N | + | 11 | ||
| Economic pressure | Urban Engel Coefficient | P31 | N | − | 5 | |
| Property Management Fees | P32 | yuan/m2 | + | 6 | ||
| Number of Immigrants | P33 | Int | − | 3 | ||
| State | Physical state | Building Age | S11 | Year | − | 13 |
| Building Seismic Rating | S12 | N | + | 9 | ||
| Waterproofing Service Life | S13 | Year | + | 10 | ||
| Indoor Acoustic Environment | S14 | db | − | 9 | ||
| Indoor Lighting Environment | S15 | Lux | + | 8 | ||
| Infrastructure state | Average Power Supply Stability | S21 | N | + | 7 | |
| Drainage Network Density | S22 | Km/km2 | − | 8 | ||
| Green Space Coverage Rate | S23 | N | + | 10 | ||
| Completeness of Service | S24 | N | + | 5 | ||
| Response | Service state | Accessibility of Service Facilities | S31 | Min | − | 9 |
| Surveillance Coverage Rate | S32 | N | + | 4 | ||
| Governance response | Renovation Funding Sources | R11 | yuan | + | 12 | |
| Sense of Green Energy Awareness | R12 | N | + | 8 | ||
| Sense of Community Identity | R13 | N | + | 7 | ||
| Disaster response | Post-Disaster Recovery Capacity | R21 | N | + | 7 | |
| Emergency Response Plan | R22 | N | − | 6 | ||
| Safety Education | R23 | N | + | 7 |
| Indicator | gA(ai) | qA(ai) | A(ai) | YA(ai) | Ranking |
|---|---|---|---|---|---|
| P11 | 0.8 | 0.1 | 0.1 | 0.77 | 1 |
| P12 | 0.6 | 0.3 | 0.1 | 0.33 | 7 |
| P13 | 0.5 | 0.3 | 0.2 | 0.24 | 9 |
| P21 | 0.6 | 0.1 | 0.3 | 0.65 | 2 |
| P22 | 0.6 | 0.2 | 0.2 | 0.48 | 4 |
| P23 | 0.5 | 0.2 | 0.4 | 0.42 | 5 |
| P31 | 0.7 | 0.3 | 0 | 0.4 | 6 |
| P32 | 0.5 | 0.1 | 0.4 | 0.56 | 3 |
| P33 | 0.4 | 0.2 | 0.3 | 0.26 | 8 |
| Indices | Evaluation Reference | I | II | III | IV | V |
|---|---|---|---|---|---|---|
| P11 | GB50180-2018 | (3.6, 4.5] | (2.7, 3.64] | (1.92, 2.78] | (1.06, 2.78] | (0.2, 1.06] |
| P12 | GB50360-2021 | (0, 10] | (10, 20] | (20, 30] | (30, 40] | (40, 60] |
| P21 | GB/T 33680-2017 | (0, 250] | (250, 450] | (450, 650] | (650, 850] | (850, 1050] |
| P22 | GB50180-2018 | (0, 7] | (7, 8] | (8, 9] | (10, 11] | (11, 16] |
| P23 | T/CECS 650-2020 | (0, 40] | (40, 50] | (50, 60] | (60, 80] | (80, 100] |
| P31 | Engel’s law | (0, 60%] | (50%, 60%] | (40%, 50%] | (30%, 40%] | (0, 30%] |
| P32 | Standard for Property | |||||
| Management | (0, 0.35] | (0.35, 45] | (0.45, 0.75] | (0.75, 1] | (1, 2] | |
| S11 | Residential Building Code | |||||
| GB50368-2005 | (40, 50] | (40, 30] | (30, 20] | (20, 10] | (0, 10] | |
| S12 | GB 50223 | (0, 3] | (3, 4.5) | (4.5, 6] | (6, 7] | (7, 9] |
| S13 | GB55030-2022 | (0, 5]) | (5, 10]) | (10, 15]) | (15, 25]) | (25, 50] |
| S14 | GB 3096—2008 | (45, 80] | (40, 45] | (35, 40] | (30, 35] | (0, 30] |
| S15 | GB50033-2013 | (0, 1%] | (1%, 2%] | (2%, 3%]) | (3%, 4%]) | (4%, 5%] |
| S21 | GB/T 36040-2018 | (0, 50] | (50, 100] | (100, 150] | (150, 200] | (200, 300] |
| S22 | Drainage Networks | |||||
| 40053-2022 | (0, 0.3] | (0.3, 0.6] | (0.6, 0.9] | (0.9, 1.2] | (1.2,1.5] | |
| S23 | GB/T 50563-2010 | [0, 0.25] | (0.25, 0.28] | (0.28, 0.3] | (0.3, 0.35] | (0.35, 1] |
| S31 | Evaluation Method | |||||
| of Urban Basic Public Service | (45, 100] | (31, 45] | (16, 30] | (10, 16] | (0, 10] | |
| S32 | Standard of Full Coverage | |||||
| and Network | (0, 0.4] | (0.4, 0.6] | (0.6, 0.8] | (0.8, 0.9] | (0.9, 1] | |
| R11 | Survey Data | (0, 1] | (1, 2] | (2, 3] | (3, 4] | (4, 5] |
| R12 | Survey Data | (0, 1] | (1, 2] | (2, 3] | (3, 4] | (4, 5] |
| R13 | Survey Data | (0, 1] | (1, 2] | (2, 3] | (3, 4] | (4, 5] |
| R21 | Survey Data | (0, 1] | (1, 2] | (2, 3] | (3, 4] | (4, 5] |
| R22 | GB/T 51327-2018 | (0, 30] | (30, 50] | (50, 70] | (70, 90] | (90, 100] |
| Indicator | P11 | P12 | P21 | P22 | P23 | P31 | P32 | S11 | S12 | S13 | S14 |
|---|---|---|---|---|---|---|---|---|---|---|---|
| Property | 2.15 | 16.5 | 25 | 7.5 | 20 | 0.55 | 0.35 | 35 | 1.5 | 7.5 | 42.5 |
| 2.15 | 6.5 | 75 | 7 | 20 | 0.45 | 0.4 | 35 | 3.75 | 7.5 | 37.5 | |
| Owner | 3.45 | 6.5 | 25 | 7.0 | 20 | 0.6 | 0.4 | 45 | 3.75 | 7.5 | 45 |
| 2.15 | 6.5 | 75 | 7 | 20 | 0.45 | 0.4 | 35 | 3.75 | 7.5 | 37.5 | |
| Community | 2.15 | 22.5 | 75 | 10.5 | 45 | 0.55 | 0.6 | 45 | 5.25 | 12.5 | 37.5 |
| 2.15 | 16.5 | 75 | 7.5 | 45 | 0.45 | 0.4 | 45 | 5.25 | 12.5 | 37.5 | |
| Indicator | S15 | S21 | S22 | S23 | S31 | S32 | R11 | R12 | R13 | R21 | R22 |
| Property | 0.015 | 3.5 | 0.125 | 38 | 0.5 | 0.5 | 2.5 | 3.5 | 40 | 40 | 40 |
| 0.005 | 4 | 0.125 | 23 | 0.5 | 0.5 | 1.5 | 2.5 | 40 | 40 | 40 | |
| Owner | 0.025 | 4 | 0.265 | 23 | 0.65 | 0.5 | 1.5 | 2.5 | 80 | 80 | 20 |
| 0.015 | 4 | 0.125 | 23 | 0.5 | 0.5 | 1.5 | 2.5 | 40 | 40 | 40 | |
| Community | 0.025 | 3.5 | 0.265 | 13 | 0.5 | 1.5 | 4.5 | 3.5 | 40 | 20 | 40 |
| 0.015 | 3.5 | 0.265 | 13 | 0.5 | 1.5 | 3.5 | 3.5 | 60 | 40 | 40 |
| Indices | I | II | III | IV | V |
|---|---|---|---|---|---|
| P11 | 4.07, 0.37, 0.001 | 3.71, 0.37, 0.001 | 2.35, 0.37, 0.001 | 1.92, 0.37, 0.001 | 0.63, 0.37, 0.001 |
| P12 | 5, 1.67, 0.001 | 15, 1.67, 0.001 | 25, 1.67, 0.001 | 35, 1.67, 0.001 | 45, 1.67, 0.001 |
| P21 | 25, 8.33, 0.001 | 75, 8.33, 0.001 | 125, 8.33, 0.001 | 175, 8.33, 0.001 | 225, 8.33, 0.001 |
| P22 | 6.5, 0.17, 0.001 | 7.5, 0.17, 0.001 | 8.5, 0.17, 0.001 | 9.5, 0.17, 0.001 | 10.5, 0.17, 0.001 |
| P23 | 20, 6.67, 0.01 | 45, 1.67, 0.001 | 55, 1.67, 0.001 | 70, 1.67, 0.001 | 90, 1.67, 0.001 |
| P31 | 0.65, 0.02, 0.001 | 0.55, 0.02, 0.001 | 0.45, 0.02, 0.001 | 0.35, 0.02, 0.001 | 0.25, 0.02, 0.001 |
| P32 | 0.18, 0.06, 0.001 | 0.4, 0.02, 0.001 | 0.6, 0.05, 0.001 | 0.88, 0.04, 0.001 | 1, 0.04, 0.001 |
| S11 | 45, 1.67, 0.001 | 35, 1.67, 0.001 | 25, 1.67, 0.001 | 15, 1.67, 0.001 | 5, 1.67, 0.001 |
| S12 | 1.50, 0.5, 0.001 | 3.75, 0.25, 0.001 | 5.25, 0.25, 0.001 | 6.5, 0.17, 0.001 | 7.5, 0.17, 0.001 |
| S13 | 2.5, 0.83, 0.001 | 7.5, 0.83, 0.001 | 12.5, 0.83, 0.001 | 20, 0.83, 0.001 | 27.5, 0.83, 0.001 |
| S14 | 50, 1.67, 0.001 | 42.5, 0.83, 0.001 | 37, 0.83, 0.001 | 32.5, 0.83, 0.001 | 15, 5, 0.001 |
| S15 | 0.05, 0.02, 0.01 | 0.15, 0.02, 0.001 | 0.25, 0.02, 0.001 | 0.04, 0.02, 0.001 | 0.5, 0.02, 0.001 |
| S21 | 0.15, 0.01, 0.001 | 0.4, 0.03, 0.001 | 0.6, 0.03, 0.001 | 0.8, 0.03, 0.001 | 0.95, 0.03, 0.001 |
| S22 | 4, 0.17, 0.001 | 3.5, 0.17, 0.001 | 2.5, 0.17, 0.001 | 1.5, 0.17, 0.001 | 1.000, 0.17, 0.001 |
| S23 | 0.13, 0.42, 0.001 | 0.27, 0.01, 0.001 | 0.29, 0.03, 0.001 | 0.33, 0.01, 0.001 | 0.68, 0.01, 0.001 |
| S31 | 45, 2.33, 0.001 | 38, 2.33, 0.001 | 23, 2.33, 0.001 | 13, 1, 0.001 | 5, 1.67, 0.0001 |
| S32 | 0.2, 0.07, 0.001 | 0.5, 0.03, 0.001 | 0.7, 0.03, 0.001 | 0.85, 0.02, 0.001 | 0.95, 0.02, 0.001 |
| R11 | 0.5, 0.17, 0.001 | 1.5, 0.17, 0.001 | 2.5, 0.17, 0.001 | 3.5, 0.17, 0.001 | 4.5, 0.17, 0.001 |
| R12 | 0.5, 0.17, 0.001 | 1.5, 0.17, 0.001 | 2.5, 0.17, 0.001 | 3.5, 0.17, 0.001 | 4.5, 0.17, 0.001 |
| R13 | 0.5, 0.17, 0.001 | 1.5, 0.17, 0.001 | 2.5, 0.17, 0.001 | 3.5, 0.17, 0.001 | 4.5, 0.17, 0.001 |
| R21 | 2, 0.33, 0.001 | 4, 0.33, 0.001 | 6, 0.33, 0.001 | 8, 0.33, 0.001 | 9, 0.33, 0.001 |
| R22 | 15, 5, 0.001 | 40, 3.33, 0.001 | 60, 3.33, 0.001 | 80, 3.33, 0.001 | 95, 1.67, 0.001 |
| W | P11 | P12 | P21 | P22 | P23 | P31 | P32 | S11 | S12 | S13 | S14 |
|---|---|---|---|---|---|---|---|---|---|---|---|
| W1 | 0.075 | 0.017 | 0.041 | 0.021 | 0.029 | 0.016 | 0.014 | 0.067 | 0.073 | 0.037 | 0.013 |
| W2 | 0.068 | 0.037 | 0.050 | 0.048 | 0.048 | 0.037 | 0.045 | 0.036 | 0.037 | 0.048 | 0.049 |
| W0 | 0.072 | 0.025 | 0.045 | 0.032 | 0.037 | 0.024 | 0.027 | 0.055 | 0.059 | 0.041 | 0.027 |
| W | S15 | S21 | S22 | S23 | S31 | S32 | R11 | R12 | R13 | R21 | R22 |
| W1 | 0.009 | 0.022 | 0.026 | 0.026 | 0.015 | 0.009 | 0.164 | 0.066 | 0.093 | 0.055 | 0.102 |
| W2 | 0.036 | 0.068 | 0.036 | 0.051 | 0.048 | 0.048 | 0.039 | 0.036 | 0.051 | 0.039 | 0.036 |
| W0 | 0.021 | 0.041 | 0.031 | 0.036 | 0.029 | 0.025 | 0.114 | 0.055 | 0.076 | 0.049 | 0.076 |
| Ind | Cloud Parameters | Cloud Level Similarity | Cloud Level Membership Degree | ||||||||||
|---|---|---|---|---|---|---|---|---|---|---|---|---|---|
| Ex | En | He | I | II | III | IV | V | I | II | III | IV | V | |
| P11 | 2.37 | 0.45 | 0.27 | 0.02 | 0.05 | 0.67 | 0.47 | 0.02 | 0.01 | 0.04 | 0.55 | 0.38 | 0.02 |
| P12 | 14.50 | 5.01 | 1.92 | 0.05 | 0.38 | 0.04 | 0.00 | 0.00 | 0.10 | 0.82 | 0.08 | 0.00 | 0.00 |
| P21 | 58.33 | 27.84 | 10.24 | 0.13 | 0.23 | 0.03 | 0.00 | 0.00 | 0.34 | 0.60 | 0.06 | 0.00 | 0.00 |
| P22 | 7.83 | 1.11 | 0.73 | 0.05 | 0.16 | 0.11 | 0.02 | 0.01 | 0.14 | 0.46 | 0.30 | 0.06 | 0.04 |
| P23 | 30.83 | 13.57 | 5.48 | 0.33 | 0.05 | 0.01 | 0.03 | 0.00 | 0.83 | 0.13 | 0.04 | 0.01 | 0.00 |
| P31 | 0.51 | 0.07 | 0.03 | 0.02 | 0.17 | 0.14 | 0.04 | 0.00 | 0.07 | 0.45 | 0.37 | 0.11 | 0.01 |
| P32 | 0.43 | 0.07 | 0.05 | 0.04 | 0.24 | 0.06 | 0.00 | 0.00 | 0.11 | 0.70 | 0.19 | 0.00 | 0.00 |
| S11 | 40.00 | 6.26 | 3.04 | 0.15 | 0.16 | 0.03 | 0.00 | 0.00 | 0.44 | 0.47 | 0.09 | 0.00 | 0.00 |
| S12 | 3.87 | 1.15 | 0.76 | 0.08 | 0.31 | 0.07 | 0.02 | 0.01 | 0.17 | 0.65 | 0.14 | 0.03 | 0.01 |
| S13 | 9.17 | 2.78 | 1.04 | 0.03 | 0.24 | 0.10 | 0.03 | 0.00 | 0.08 | 0.65 | 0.26 | 0.01 | 0.00 |
| S14 | 39.58 | 3.48 | 1.04 | 0.01 | 0.14 | 0.19 | 0.05 | 0.00 | 0.04 | 0.36 | 0.49 | 0.12 | 0.00 |
| S15 | 0.01 | 0.07 | 0.03 | 0.08 | 0.30 | 0.13 | 0.02 | 0.00 | 0.16 | 0.59 | 0.22 | 0.03 | 0.00 |
| S21 | 0.15 | 0.01 | 0.01 | 0.41 | 0.00 | 0.00 | 0.00 | 0.00 | 1.00 | 0.00 | 0.00 | 0.00 | 0.00 |
| S22 | 3.33 | 0.69 | 0.13 | 0.12 | 0.26 | 0.11 | 0.00 | 0.00 | 0.24 | 0.52 | 0.22 | 0.02 | 0.00 |
| S23 | 22.17 | 7.65 | 5.05 | 0.01 | 0.02 | 0.39 | 0.04 | 0.00 | 0.03 | 0.06 | 0.83 | 0.08 | 0.00 |
| S31 | 0.25 | 0.08 | 0.03 | 0.16 | 0.20 | 0.22 | 0.05 | 0.00 | 0.26 | 0.31 | 0.35 | 0.08 | 0.00 |
| S32 | 0.83 | 0.57 | 0.21 | 0.05 | 0.04 | 0.07 | 0.05 | 0.48 | 0.08 | 0.06 | 0.10 | 0.08 | 0.68 |
| R11 | 2.50 | 1.25 | 0.17 | 0.05 | 0.09 | 0.16 | 0.08 | 0.03 | 0.13 | 0.23 | 0.38 | 0.19 | 0.07 |
| R12 | 3.00 | 0.62 | 0.30 | 0.01 | 0.03 | 0.16 | 0.15 | 0.02 | 0.00 | 0.08 | 0.44 | 0.41 | 0.06 |
| R13 | 2.50 | 1.32 | 0.16 | 0.05 | 0.09 | 0.15 | 0.08 | 0.03 | 0.13 | 0.22 | 0.37 | 0.19 | 0.08 |
| R21 | 4.33 | 0.69 | 0.42 | 0.01 | 0.42 | 0.04 | 0.00 | 0.00 | 0.03 | 0.88 | 0.09 | 0.00 | 0.00 |
| R22 | 36.67 | 6.96 | 4.26 | 0.04 | 0.41 | 0.01 | 0.00 | 0.00 | 0.09 | 0.87 | 0.03 | 0.00 | 0.00 |
| Criteria | Sub-Criteria | I | II | III | IV | V |
|---|---|---|---|---|---|---|
| Pressure | P1 | 0.004 | 0.024 | 0.042 | 0.028 | 0.001 |
| P2 | 0.051 | 0.047 | 0.014 | 0.002 | 0.001 | |
| P3 | 0.005 | 0.030 | 0.014 | 0.003 | 0.000 | |
| State | S1 | 0.042 | 0.113 | 0.042 | 0.006 | 0.001 |
| S2 | 0.049 | 0.018 | 0.037 | 0.004 | 0.000 | |
| S3 | 0.009 | 0.011 | 0.013 | 0.004 | 0.017 | |
| Response | R1 | 0.025 | 0.048 | 0.096 | 0.059 | 0.018 |
| R2 | 0.009 | 0.1100 | 0.007 | 0.0000 | 0.0000 |
| Membership Degree | I | II | III | IV | V | |
|---|---|---|---|---|---|---|
| Target layer | 0.065 | 0.137 | 0.090 | 0.036 | 0.014 | |
| Criteria Layer | Pressure | 0.059 | 0.100 | 0.070 | 0.033 | 0.003 |
| State | 0.100 | 0.142 | 0.092 | 0.014 | 0.018 | |
| Response | 0.034 | 0.158 | 0.102 | 0.059 | 0.018 | |
Disclaimer/Publisher’s Note: The statements, opinions and data contained in all publications are solely those of the individual author(s) and contributor(s) and not of MDPI and/or the editor(s). MDPI and/or the editor(s) disclaim responsibility for any injury to people or property resulting from any ideas, methods, instructions or products referred to in the content. |
© 2025 by the authors. Licensee MDPI, Basel, Switzerland. This article is an open access article distributed under the terms and conditions of the Creative Commons Attribution (CC BY) license (https://creativecommons.org/licenses/by/4.0/).
Share and Cite
Li, X.; Zhang, X.; Zhang, J. A Cloud Model-Based Evaluation of Renovation Decisions for Old Urban Communities from the Perspective of Resilience—A Case Study of a Community in Nanjing, China. Buildings 2025, 15, 1985. https://doi.org/10.3390/buildings15121985
Li X, Zhang X, Zhang J. A Cloud Model-Based Evaluation of Renovation Decisions for Old Urban Communities from the Perspective of Resilience—A Case Study of a Community in Nanjing, China. Buildings. 2025; 15(12):1985. https://doi.org/10.3390/buildings15121985
Chicago/Turabian StyleLi, Xisheng, Xiang Zhang, and Jiaying Zhang. 2025. "A Cloud Model-Based Evaluation of Renovation Decisions for Old Urban Communities from the Perspective of Resilience—A Case Study of a Community in Nanjing, China" Buildings 15, no. 12: 1985. https://doi.org/10.3390/buildings15121985
APA StyleLi, X., Zhang, X., & Zhang, J. (2025). A Cloud Model-Based Evaluation of Renovation Decisions for Old Urban Communities from the Perspective of Resilience—A Case Study of a Community in Nanjing, China. Buildings, 15(12), 1985. https://doi.org/10.3390/buildings15121985