4.2. Effect of Aspect Ratio
To investigate the influence of aspect ratio on the damage behavior of RC shear walls under identical blast conditions, the wall height was kept constant while the wall width (
, defined as the wall width) was varied to adjust the aspect ratio.
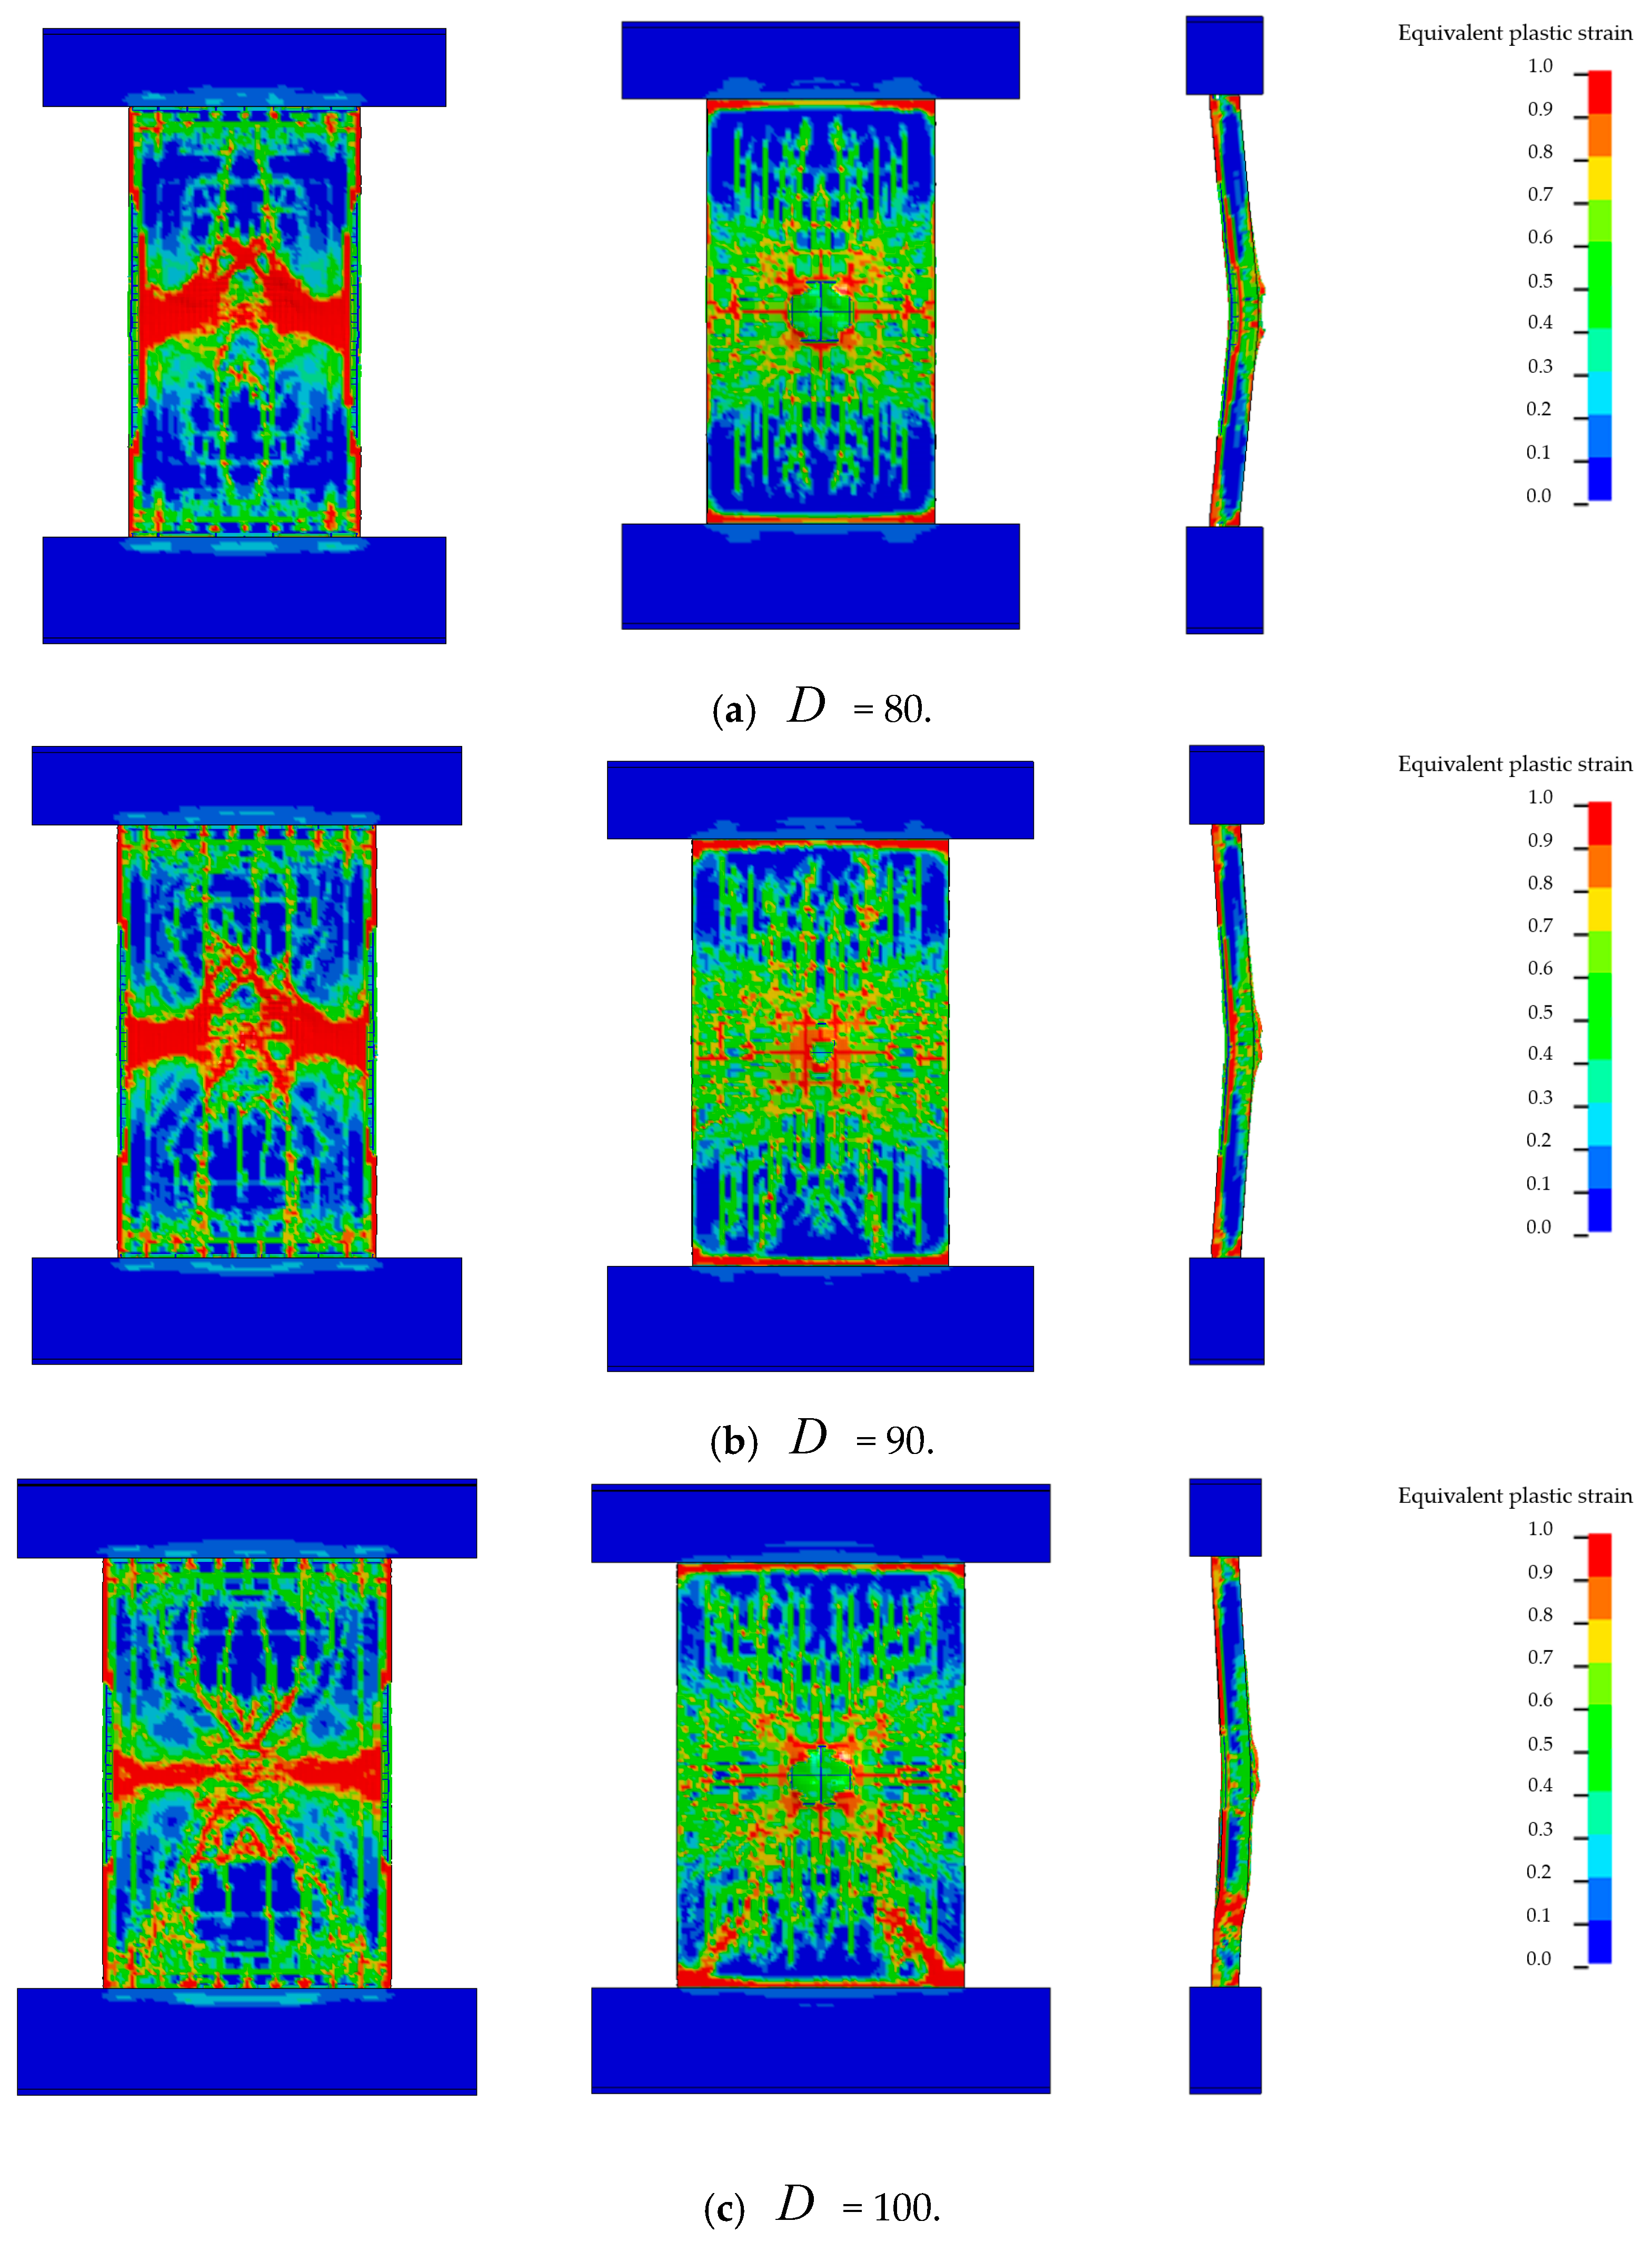
Figure 17 shows the damage patterns of RC shear walls subjected to a 5 kg emulsion explosive (equivalent to 3.5 kg TNT) at a standoff distance of 40 cm.
As illustrated in
Figure 17, the failure mode of the RC shear walls changes noticeably with decreasing aspect ratio under the same explosive charge and standoff conditions. When the wall width was 80 cm, a prominent horizontal concrete spalling zone appeared on the blast-facing side, while the rear face exhibited a circular crushed area. Due to the relatively low out-of-plane stiffness, the wall was more susceptible to large deflections under short-duration high-intensity blast loading, resulting in the formation of pronounced horizontal cracks.
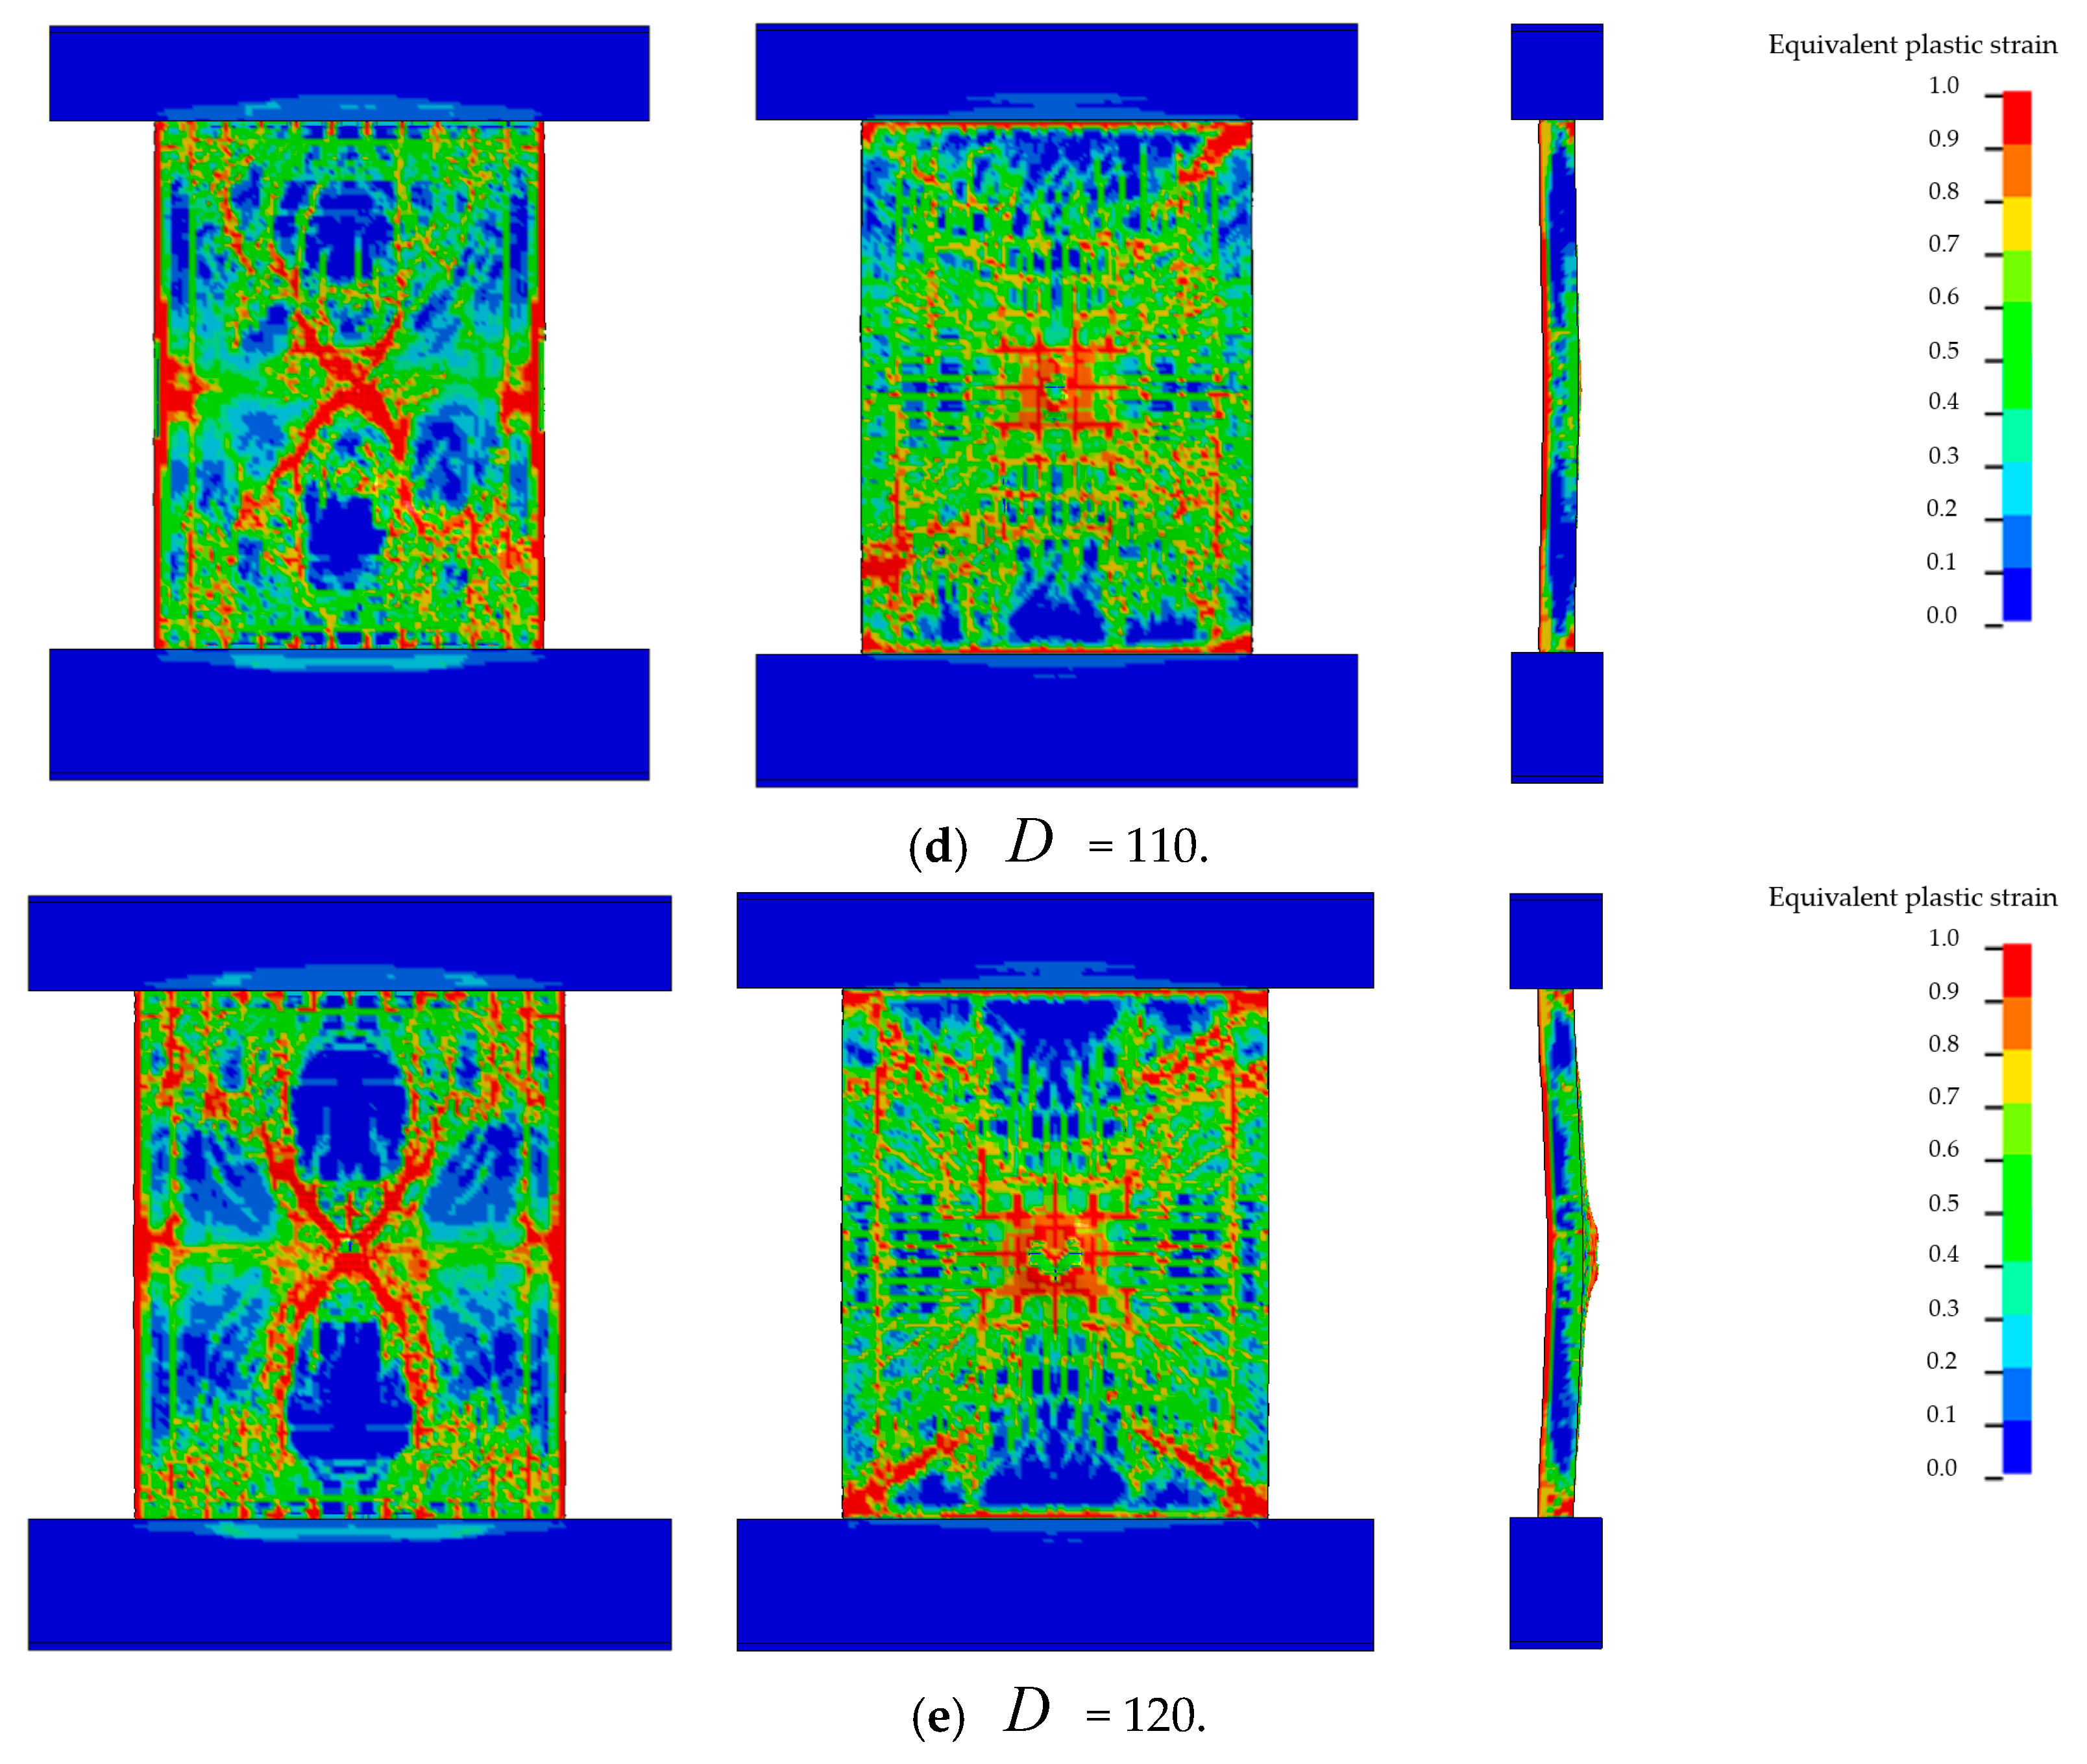
As the wall width increased to 90 cm and 100 cm, the spalling zone on the front face became significantly narrower, and the rear face developed localized cracking at the center. When the width further increased to 110 cm and 120 cm, the horizontal spalling zone disappeared entirely, replaced by an X-shaped failure pattern. The cracking region on the rear face expanded, but the overall wall exhibited stronger out-of-plane flexural resistance. The blast energy was distributed over a wider area, resulting in more superficial spalling and non-penetrating cracks.
In addition, to further analyze the influence of aspect ratio on the damage mode of RC shear walls under identical blast loading,
Figure 18 summarizes the central displacement responses of the walls subjected to different explosive charges. Here, the maximum displacement of the RC shear wall is used as an indicator of the overall displacement response.
Under the 2.8 kg explosive charge, the maximum displacement gradually decreased as the wall width increased, from 3.66 cm at D = 80 cm to 3.07 cm at D = 120 cm. This indicates that wider walls possess higher out-of-plane stiffness, which enhances their resistance to blast loads and results in smaller displacements.
At the 3.5 kg charge level, the maximum displacement decreased steadily from 7.73 cm at D = 80 cm to 5.68 cm at D = 100 cm, confirming that increased wall width improves out-of-plane stiffness and reduces displacement under blast loading. However, a rebound in displacement was observed at D = 110 cm, where the maximum displacement increased to 6.38 cm before decreasing again to 5.75 cm at D = 120 cm. As shown in
Figure 17, the damage mode at D = 110 cm shifted from global to local failure, with the central region bulging outward, resulting in a larger out-of-plane deflection. At D = 120 cm, despite similar damage, the increased width enhanced the out-of-plane stiffness, leading to a reduction in maximum displacement.
Under a 4.2 kg explosive charge, the maximum central displacements at D = 80 cm and D = 90 cm were similar, indicating a transition from global to local failure modes. From D = 90 cm to D = 120 cm, the maximum displacement continued to decrease with increasing wall width. This further confirms that greater wall width improves out-of-plane stiffness and effectively suppresses excessive displacement under high-intensity blast loading.
4.3. Effect of Axial Load
To investigate the influence of axial compression on the damage characteristics and dynamic response of RC shear walls under blast loading, the aspect ratio, explosive charge, and standoff distance were kept constant. The axial compression ratio
was varied by adjusting the applied axial load while maintaining consistent specimen geometry and blast conditions.
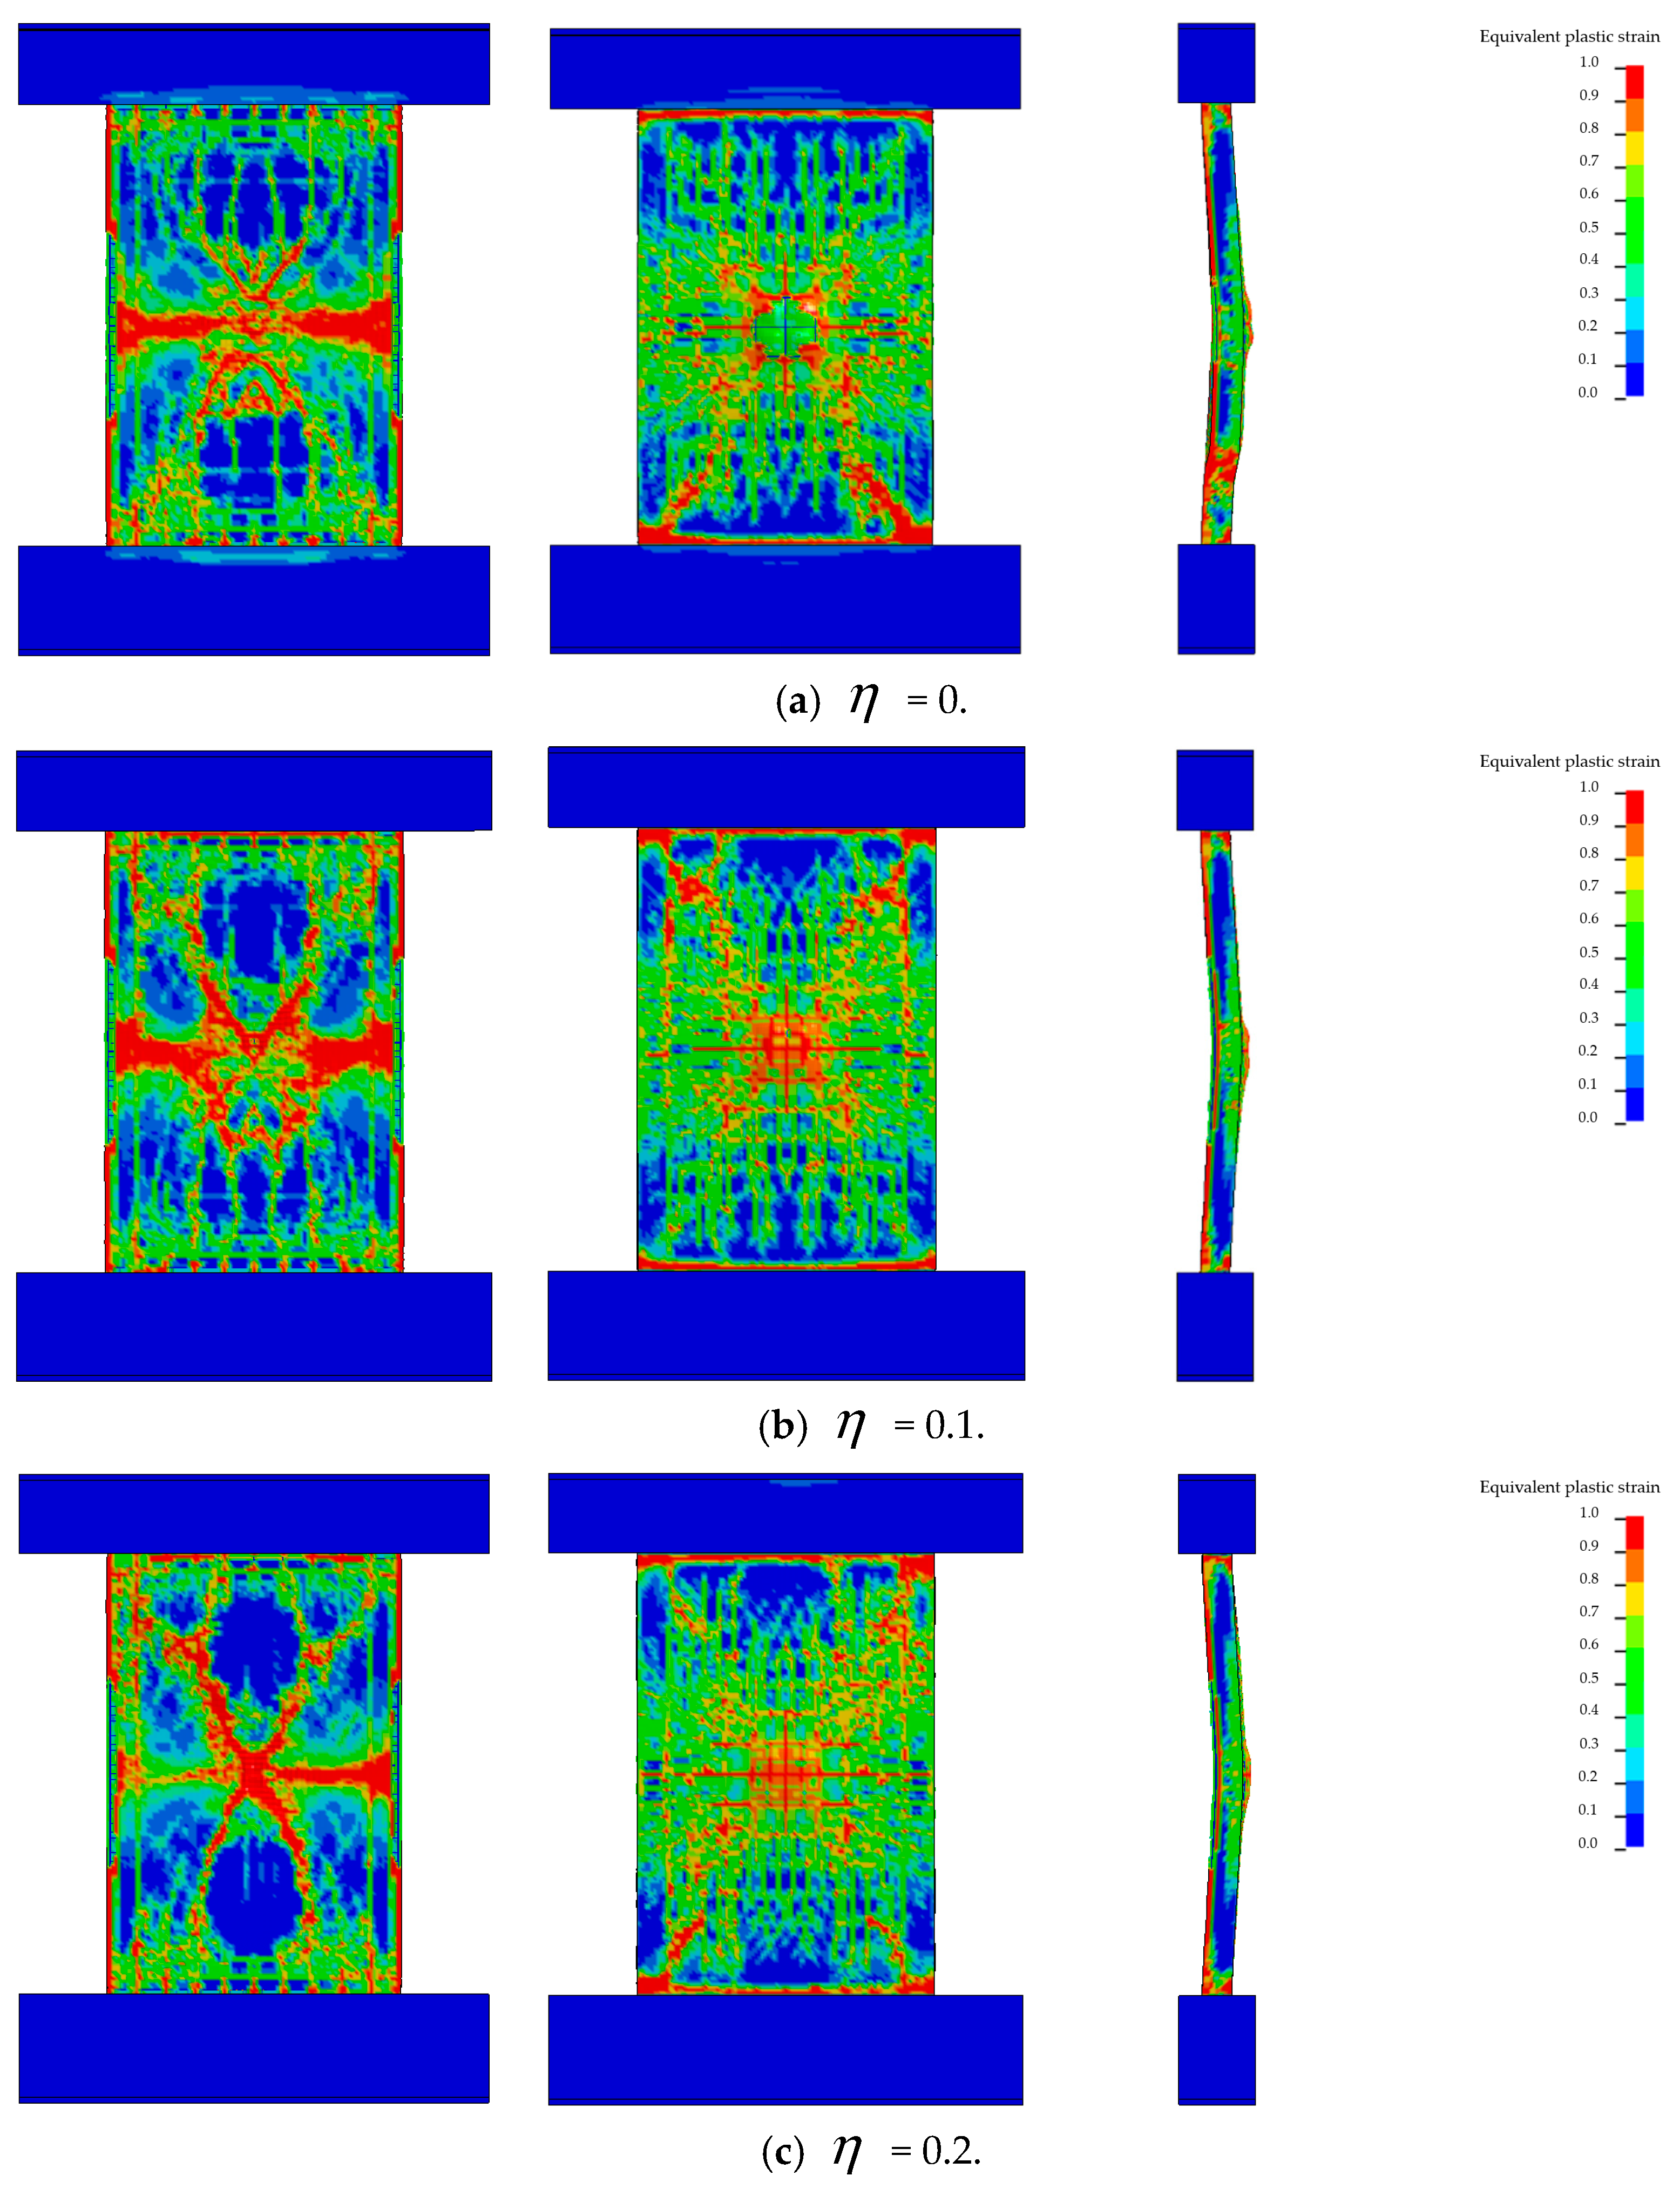
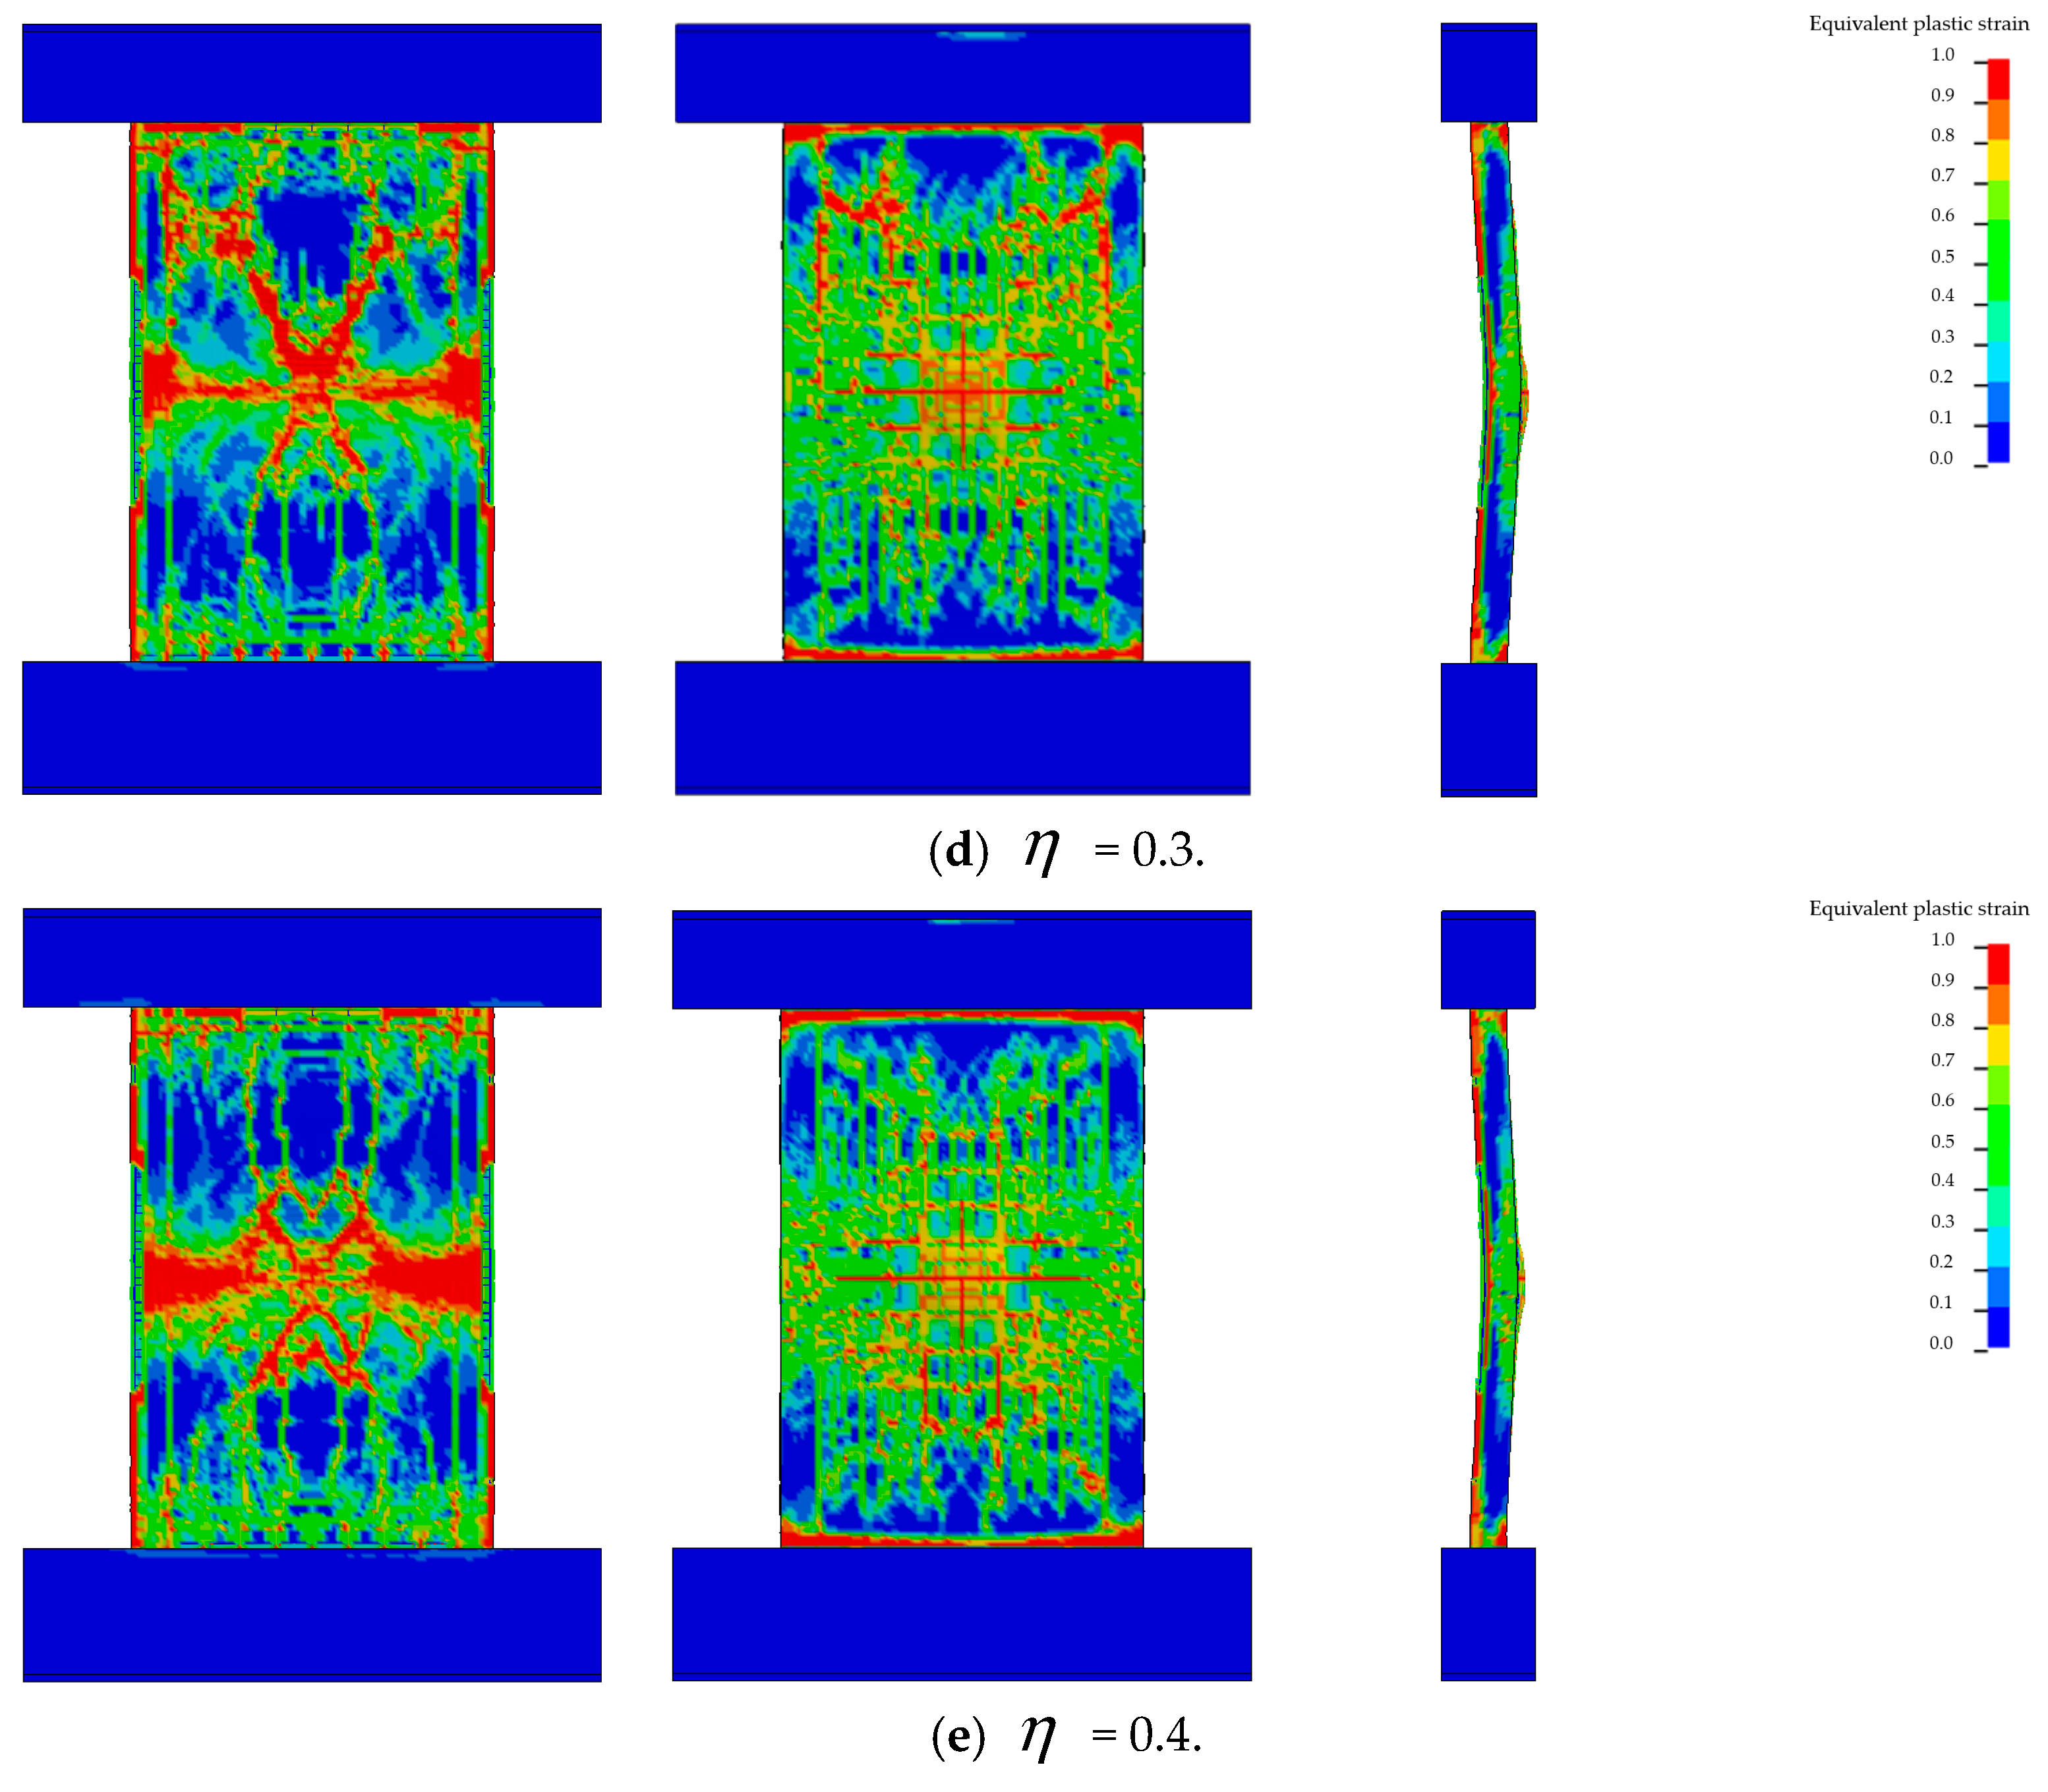
Figure 19 compares the damage patterns of RC shear walls subjected to a 3.5 kg emulsion explosive at a standoff distance of 40 cm under different axial compression ratios
. The axial compression ratio
is defined as the ratio between the applied axial load
and the axial load-carrying capacity of the wall section, expressed as:
where
is the applied axial load;
is the axial compressive strength of concrete; and
is the cross-sectional area of the wall.
When the axial load = 0, the RC shear wall exhibited global failure. On the blast-facing side, a long vertical strip of concrete damage developed, while the rear face showed a circular spalling zone. When the axial load increased to = 0.1, the failure mode shifted from global to local. The front face displayed both a vertical strip and an emerging X-shaped damage zone, while the spalling zone on the rear face disappeared.
At = 0.2, a more distinct X-shaped damage pattern formed on the blast-facing side, and the damaged area on the rear face was further reduced. When the axial load was increased to = 0.3, the X-shaped damage zone became more concentrated at the wall center, and rear-face damage continued to diminish.
However, when the axial load reached = 0.4, both a vertical strip-shaped damage zone and an X-shaped damage pattern reappeared on the blast-facing side, indicating a transition from localized to global failure in the RC shear wall. On the rear face, more cracks were observed, further reflecting the increase in overall structural damage.
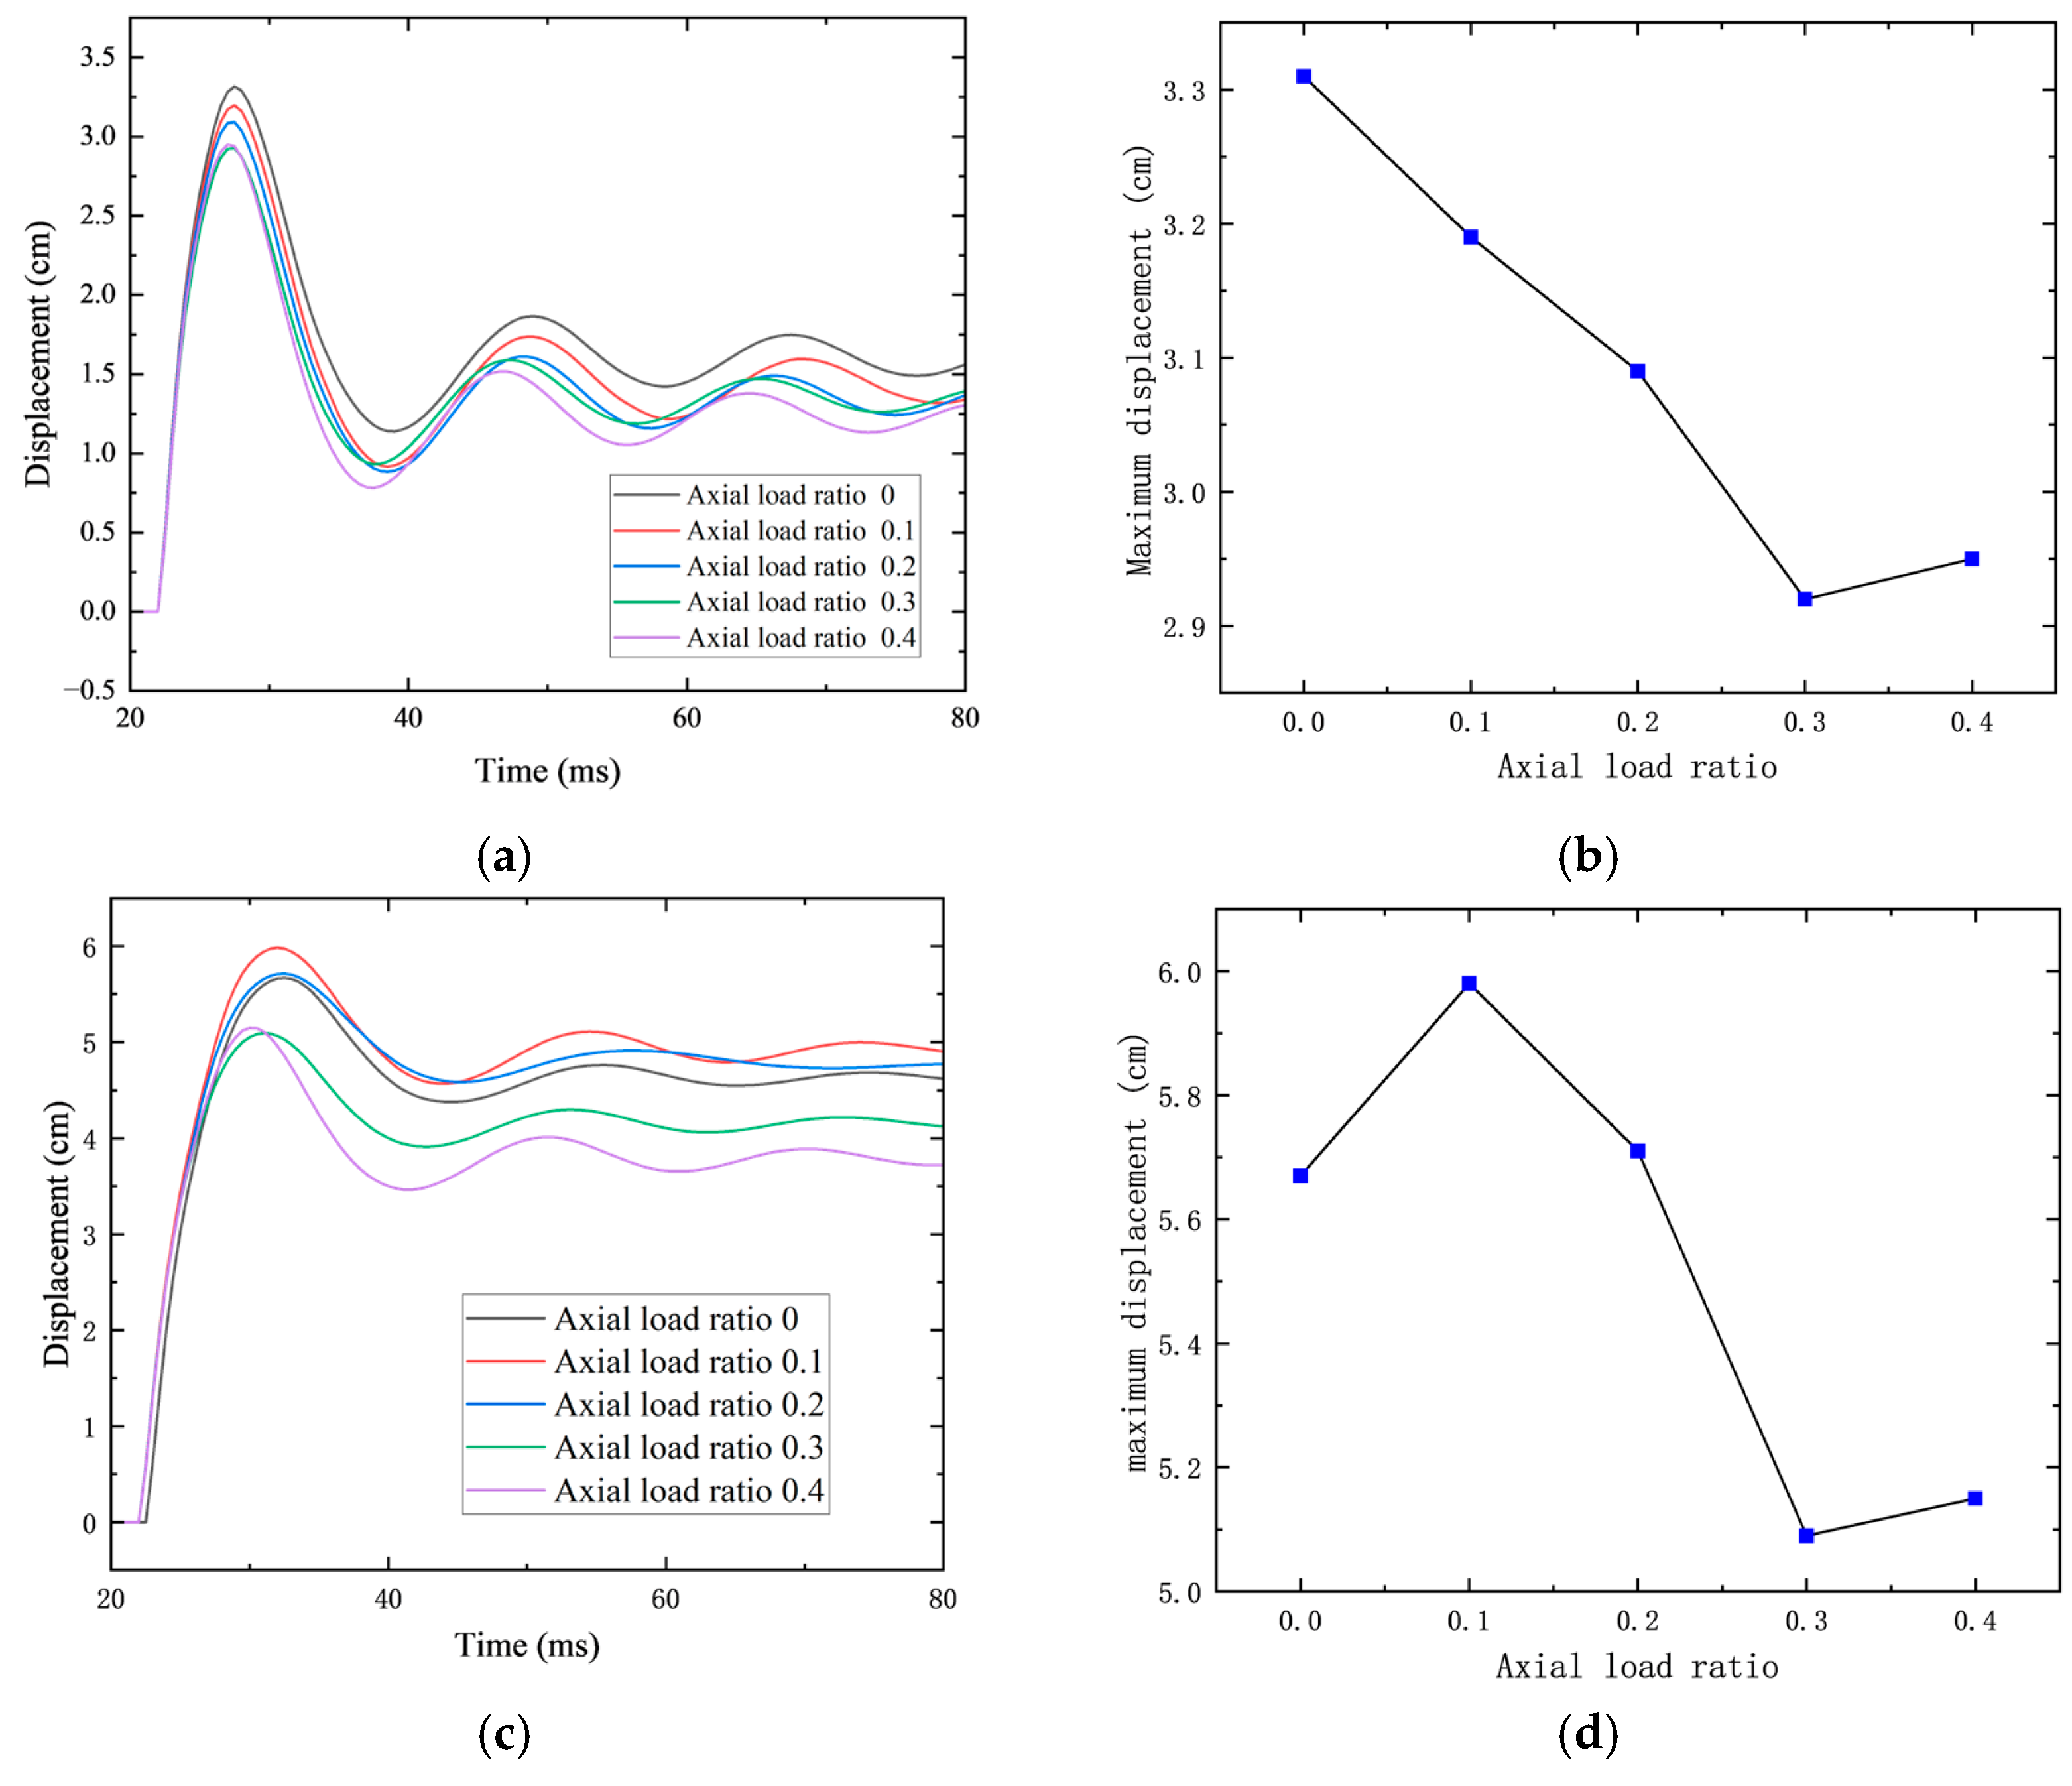
Figure 20 presents the time–history curves of mid-span displacement for RC shear walls under different axial load levels. As shown in the figure, with increasing axial load, the displacement oscillation period becomes shorter, indicating an increase in wall stiffness due to the enhanced axial compression.
Under a 2.8 kg explosive charge, the maximum displacement at the wall center gradually decreased from 3.39 cm to 2.92 cm as the axial load increased from 0 to 0.3. This is attributed to the fact that moderate axial compression places the wall cross-section under pre-compressive stress, which improves the out-of-plane stiffness and overall stability. As a result, the wall’s resistance to blast-induced deformation is enhanced, and both out-of-plane bending and crack propagation are suppressed. However, when the axial load was further increased to 0.4, the maximum displacement slightly rebounded to 2.95 cm. This is likely because although a higher axial load provides greater stiffness and initially smaller deformation, once local cracking or spalling occurs, brittle fracture may trigger a redistribution of internal forces, leading to localized deflection increases and further crack propagation.
Under a 3.5 kg explosive charge, the axial load ratio increase from 0 to 0.1 led to a rise in displacement from 5.67 cm to 5.98 cm. As the ratio increased from 0.1 to 0.2, the displacement slightly decreased to 5.71 cm, which was still above the value for the uncompressed case. As shown in
Figure 19, applying axial compression increases wall stiffness and induces stress concentration, which shifts the damage pattern from global to local failure. When the axial load ratio increased from 0.2 to 0.3, the wall’s flexural–shear resistance was significantly enhanced, leading to a marked decrease in displacement. This suggests that the “locking effect” of axial compression became dominant, suppressing large deflection and concentrating cracks before rapid propagation. However, when the axial load was further increased to 0.4, the wall became more susceptible to localized brittle failure. Once initial cracks formed, stress redistribution occurred, leading to locally intensified damage and a slight rebound in displacement.
Under a 4.2 kg explosive charge, as the axial load ratio increased from 0 to 0.3, the out-of-plane displacement was significantly reduced from 15.32 cm to 12.87 cm, passing through intermediate values of 13.99 cm and 13.31 cm. When the axial load ratio further increased to 0.4, the maximum displacement slightly rose to 12.91 cm. This trend is consistent with that observed under the 4 kg explosive condition.
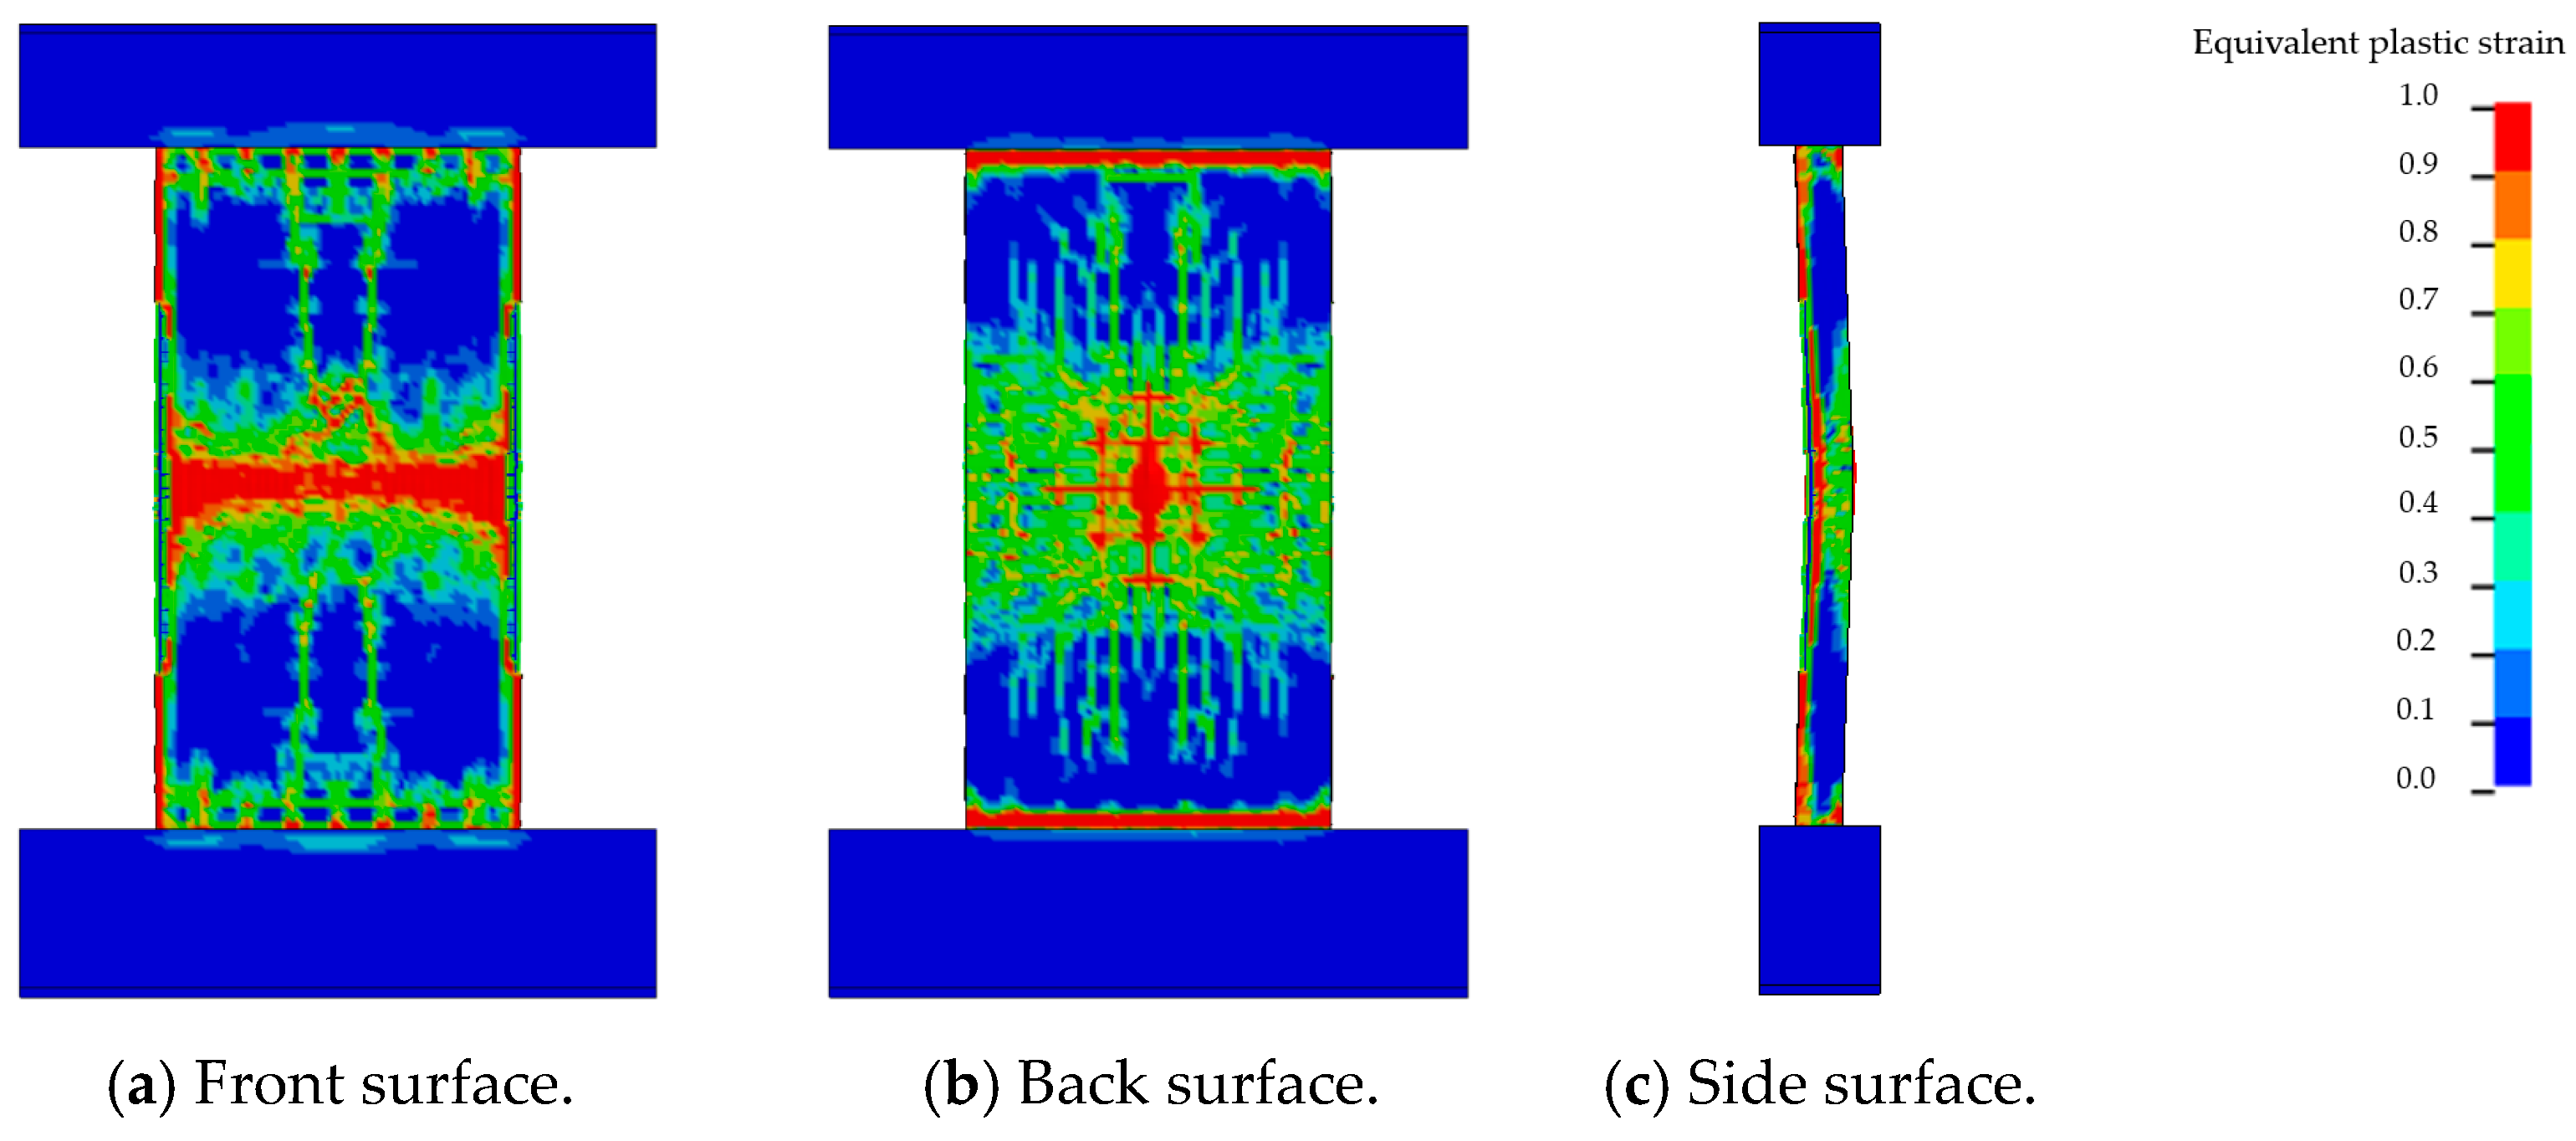
4.4. Effect of Explosive Charge
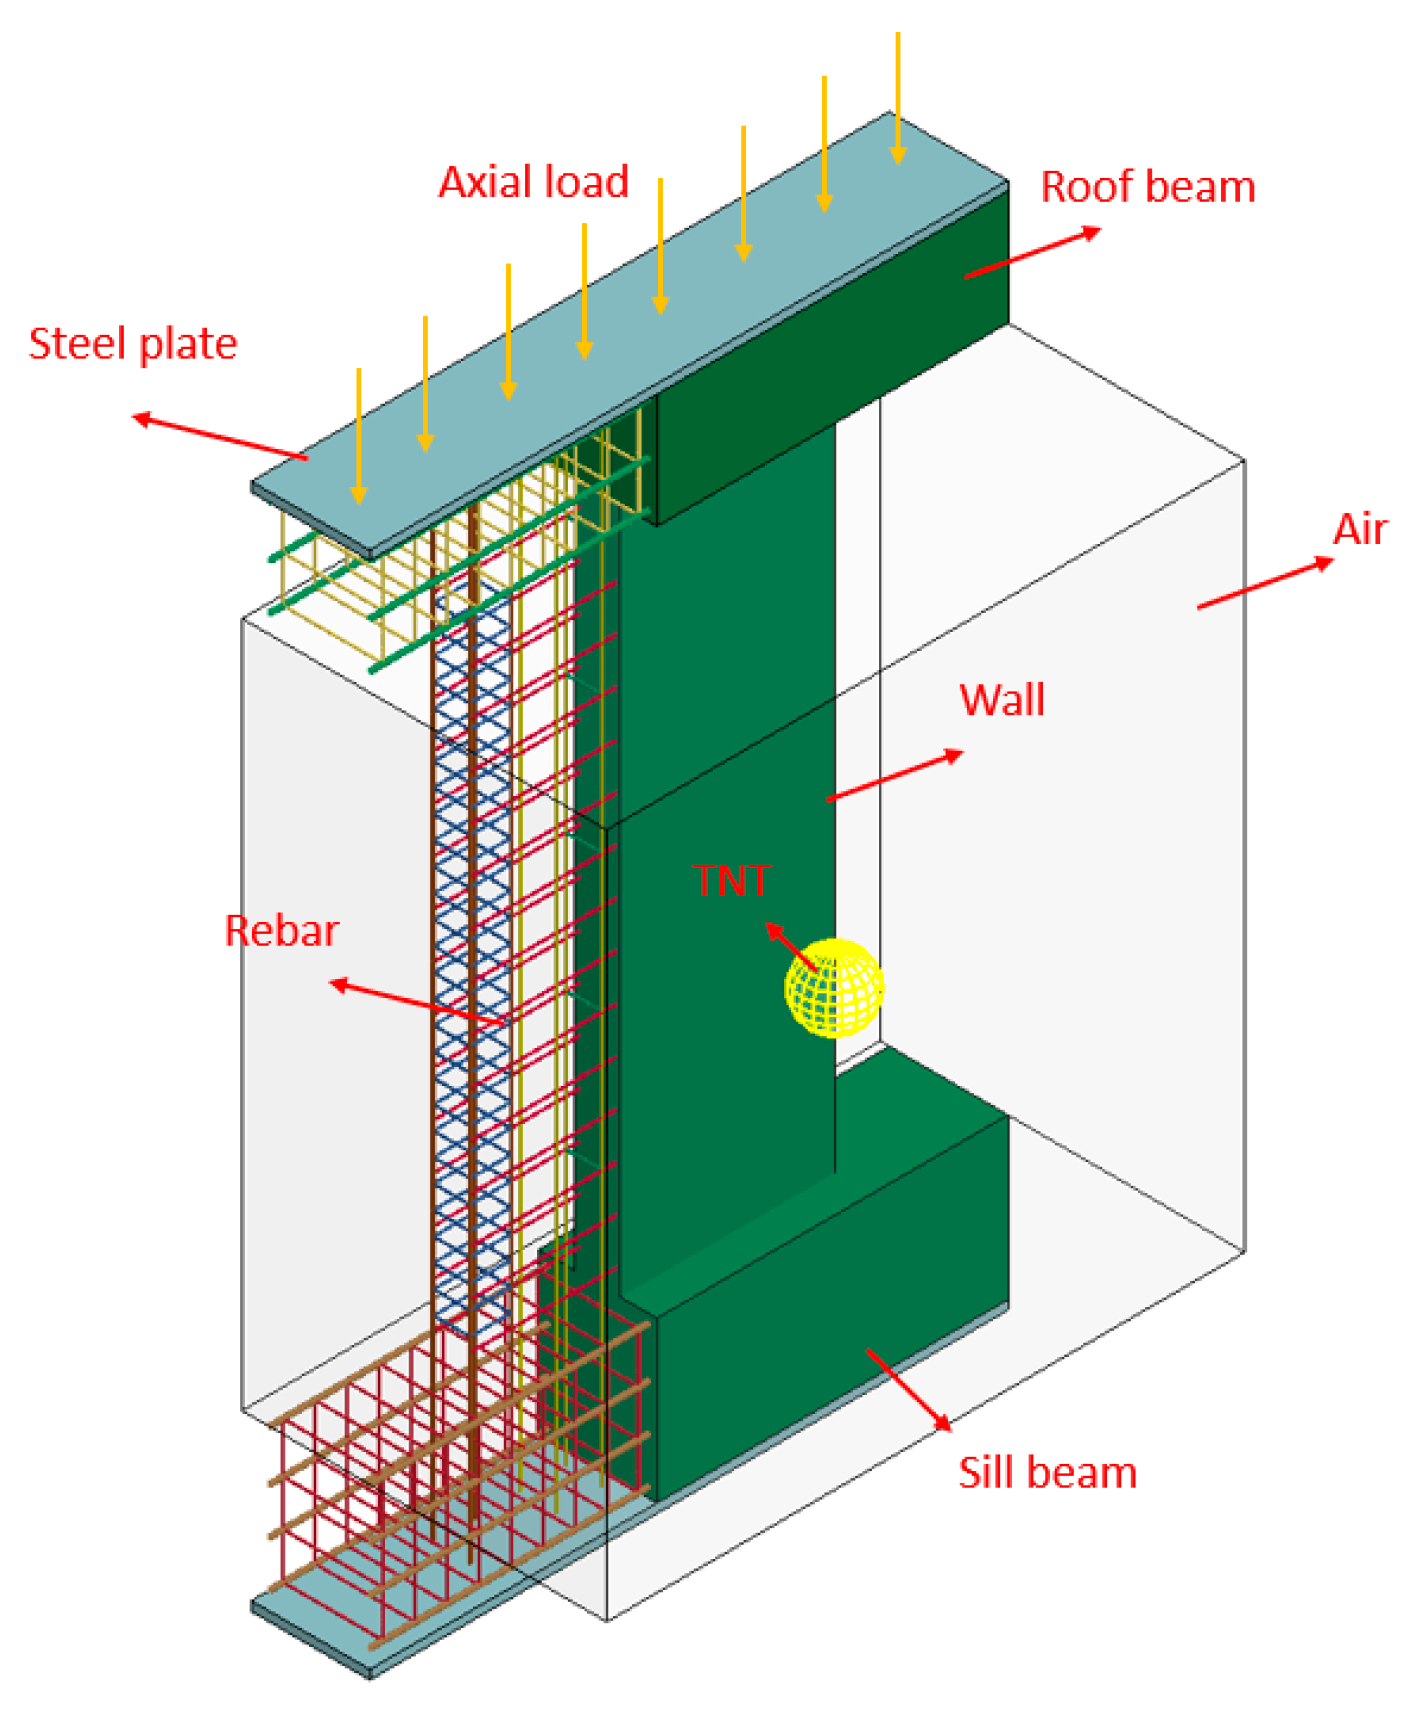
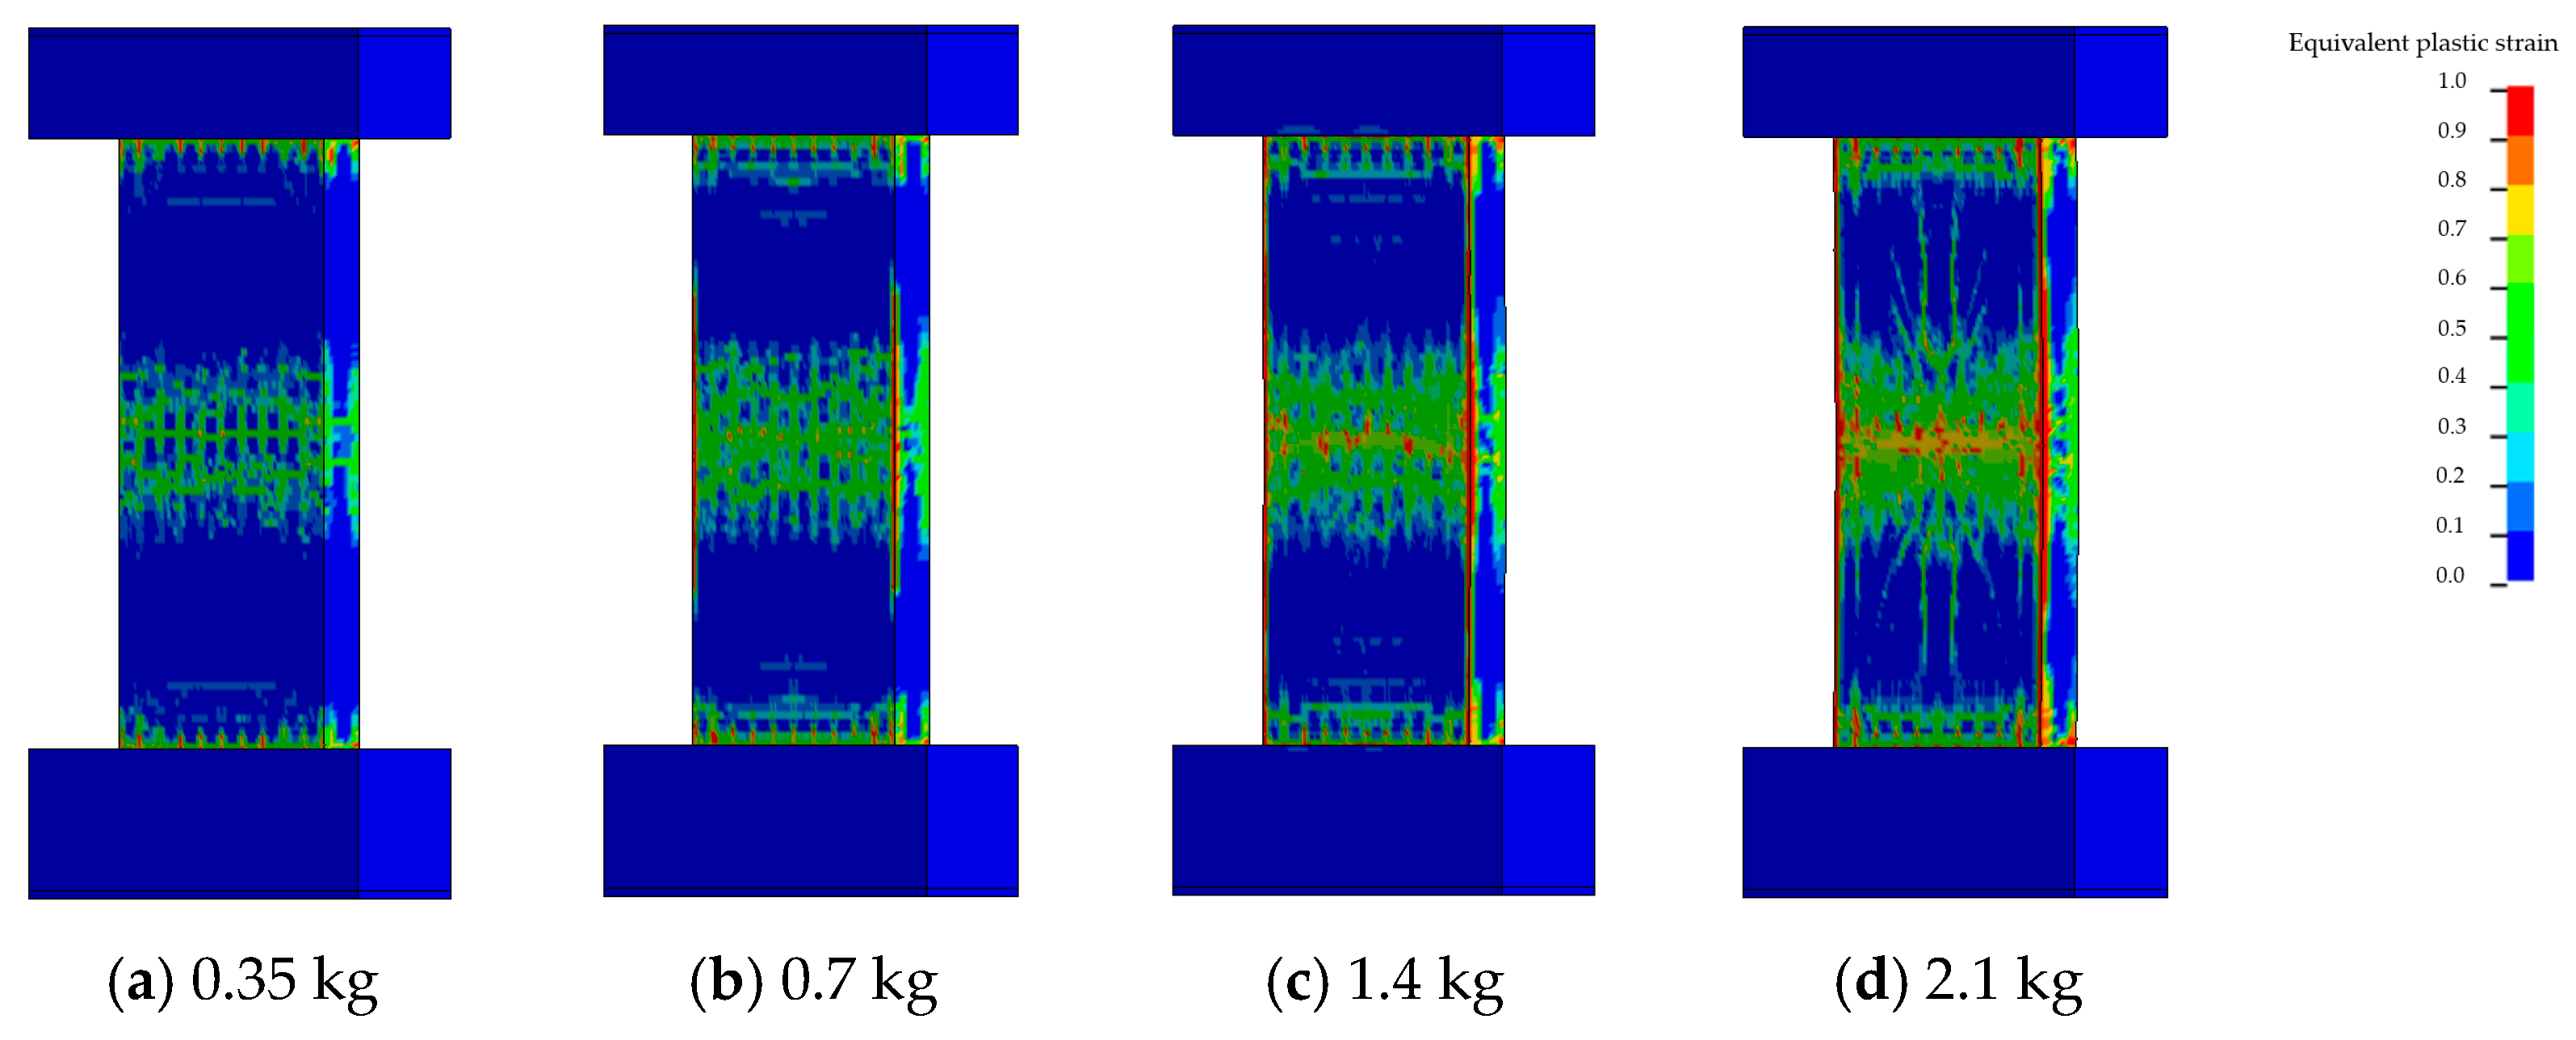
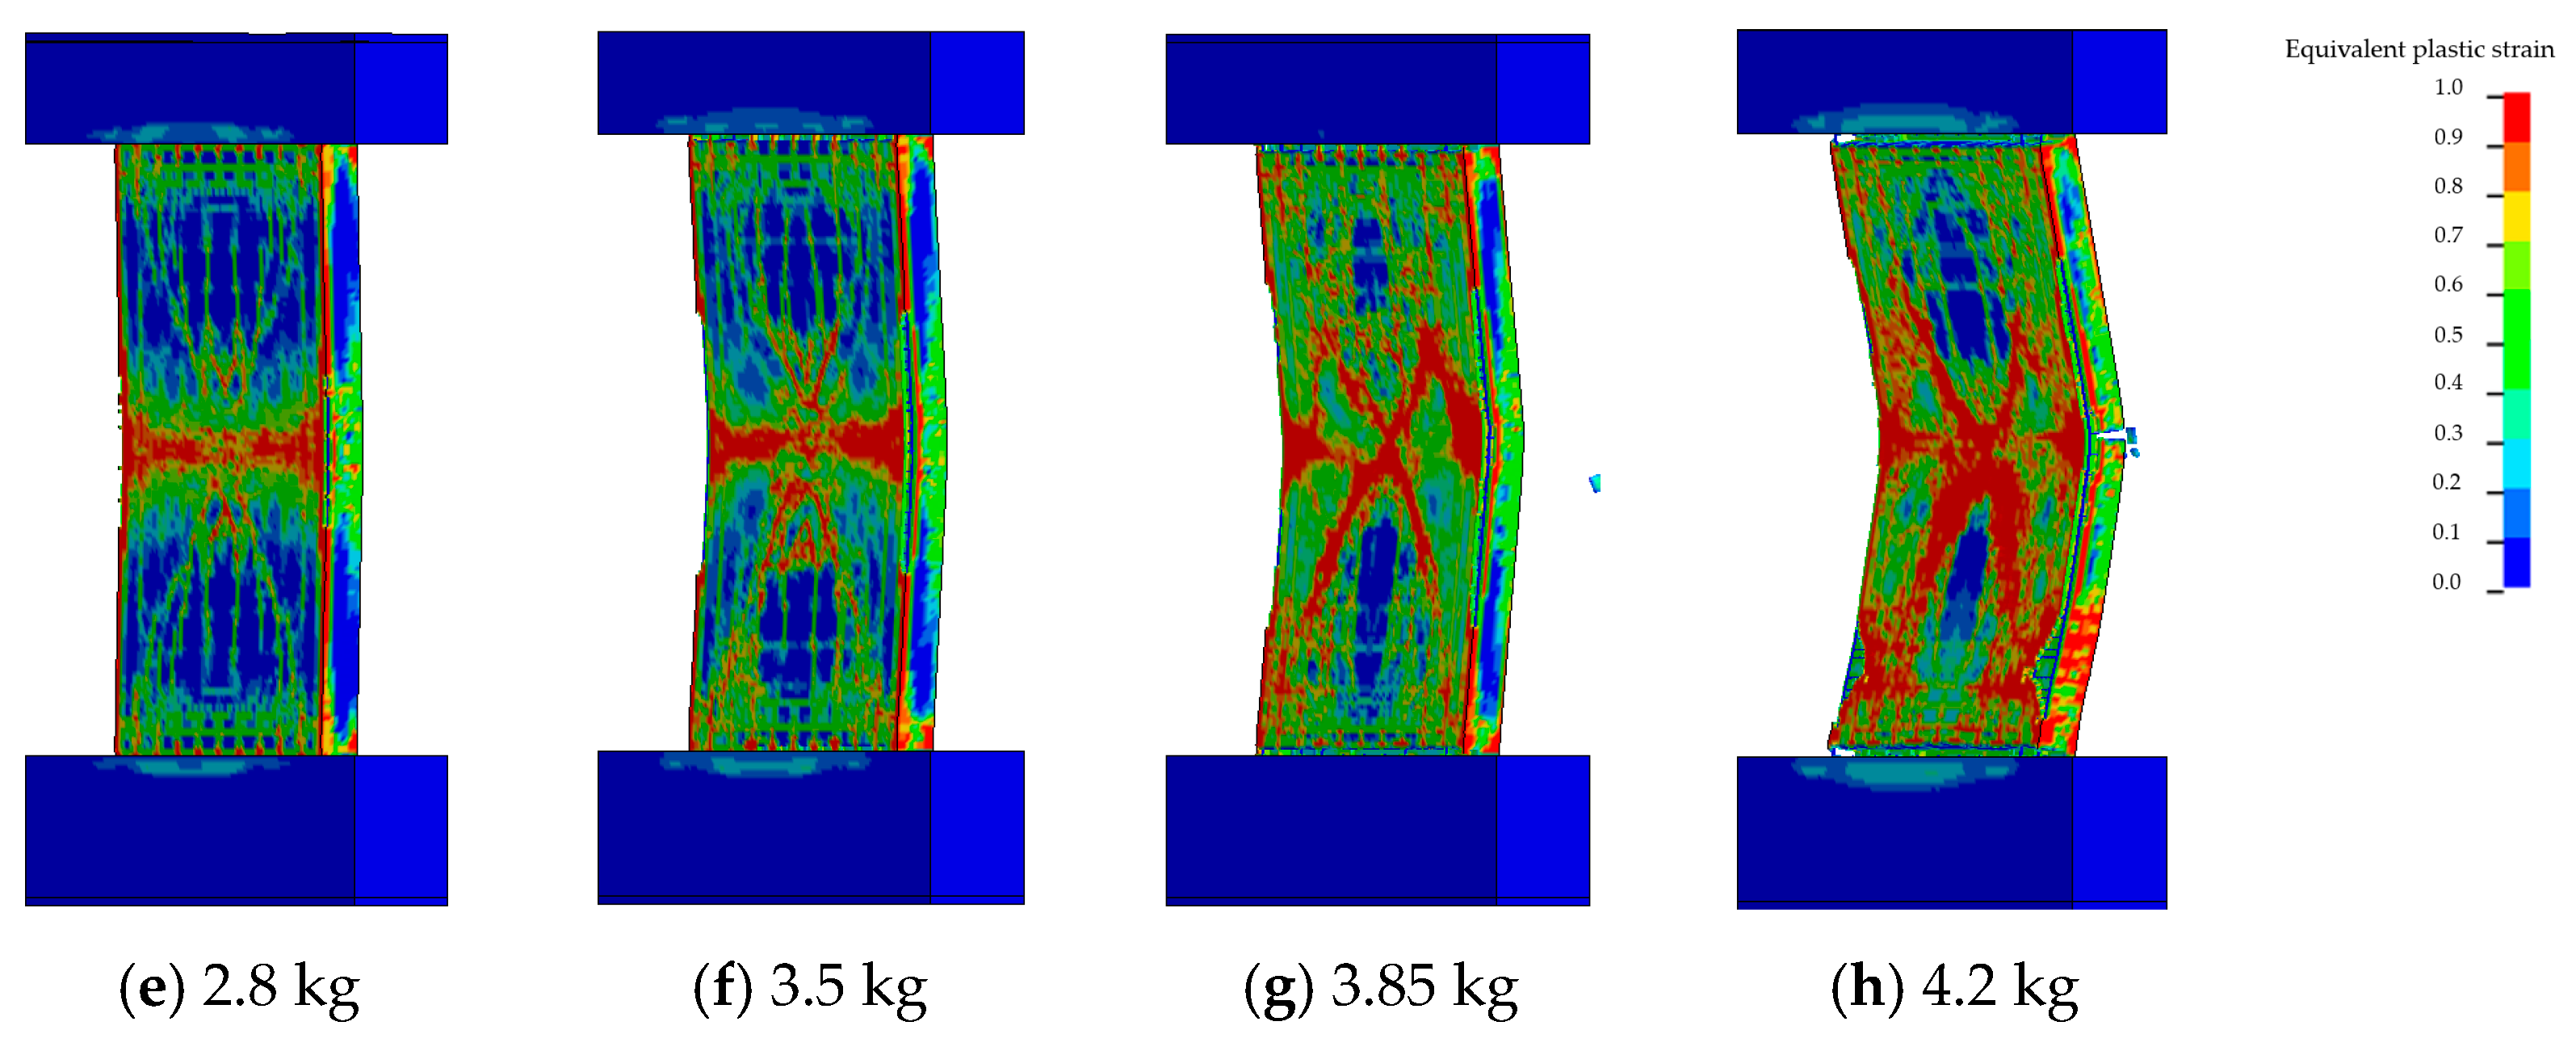
To investigate the damage mechanisms of reinforced RC shear walls under close-in blast loading with different explosive charge weights, numerical simulations were carried out on walls with a fixed width of 100 cm. The standoff distance was kept constant at 40 cm, and the structural response under varying TNT charge weights was analyzed. The corresponding damage patterns are shown in
Figure 21, and detailed simulation parameters are summarized in
Table 10. The scaled distance
is defined as:
where
is the scaled distance;
is the standoff distance from the charge to the target; and
is the TNT equivalent charge weight.
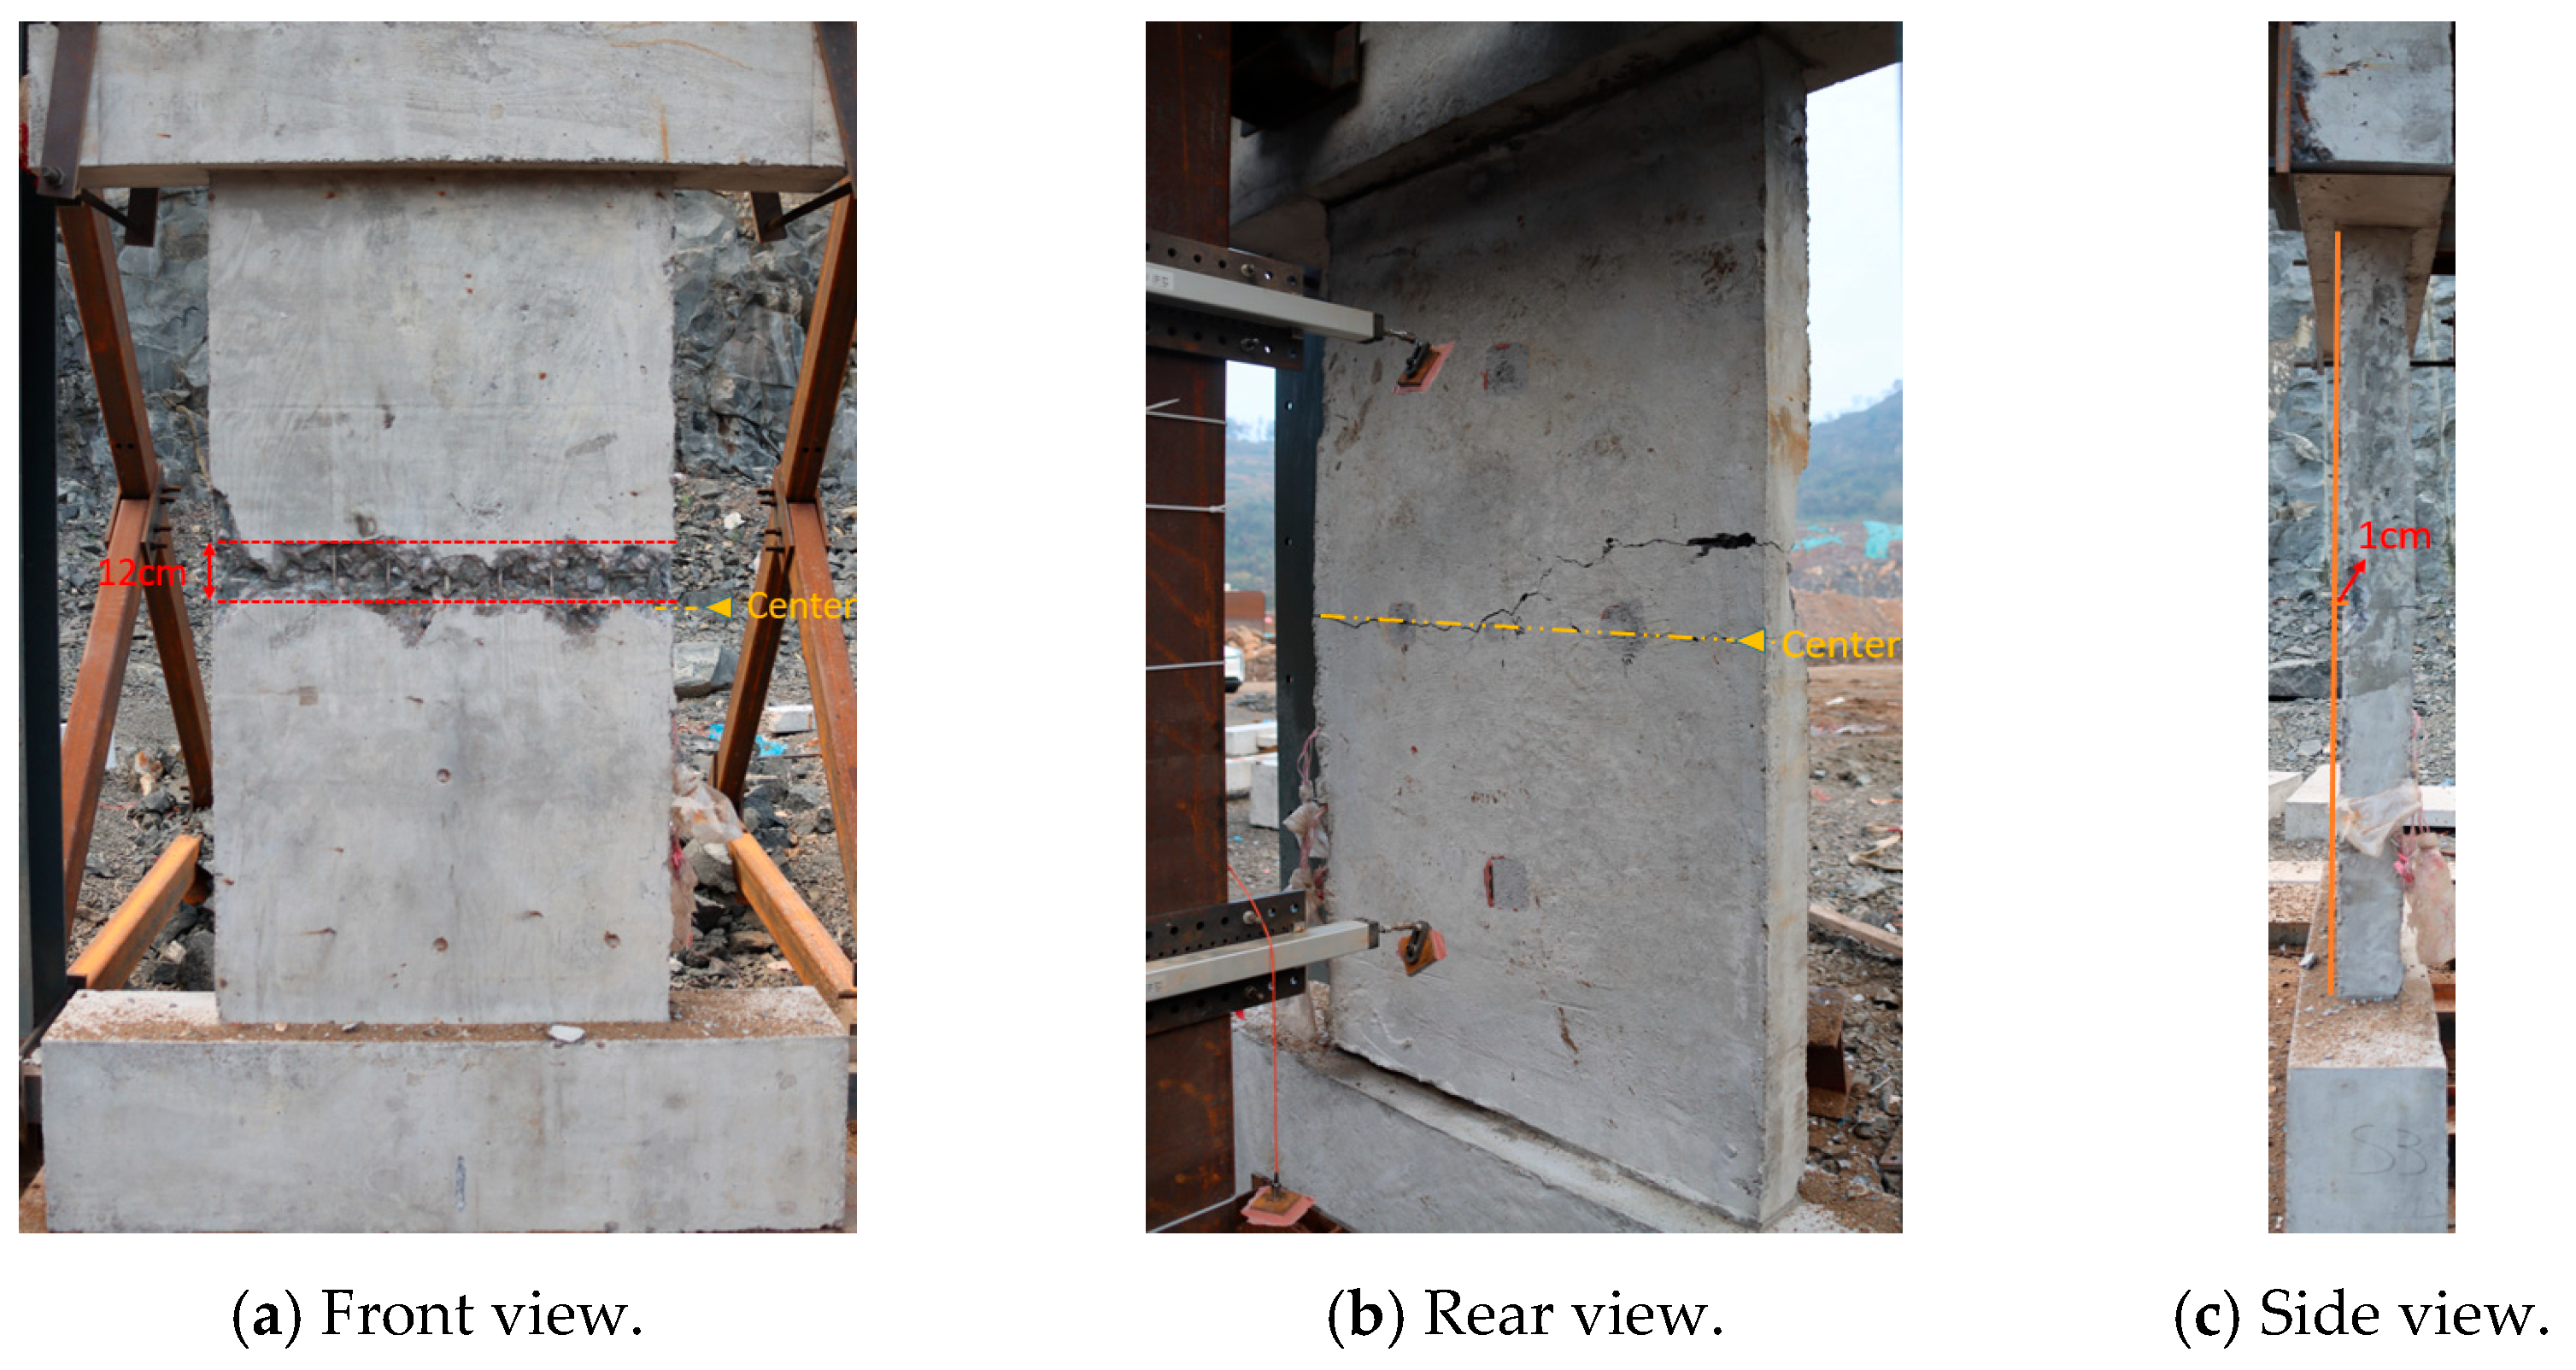
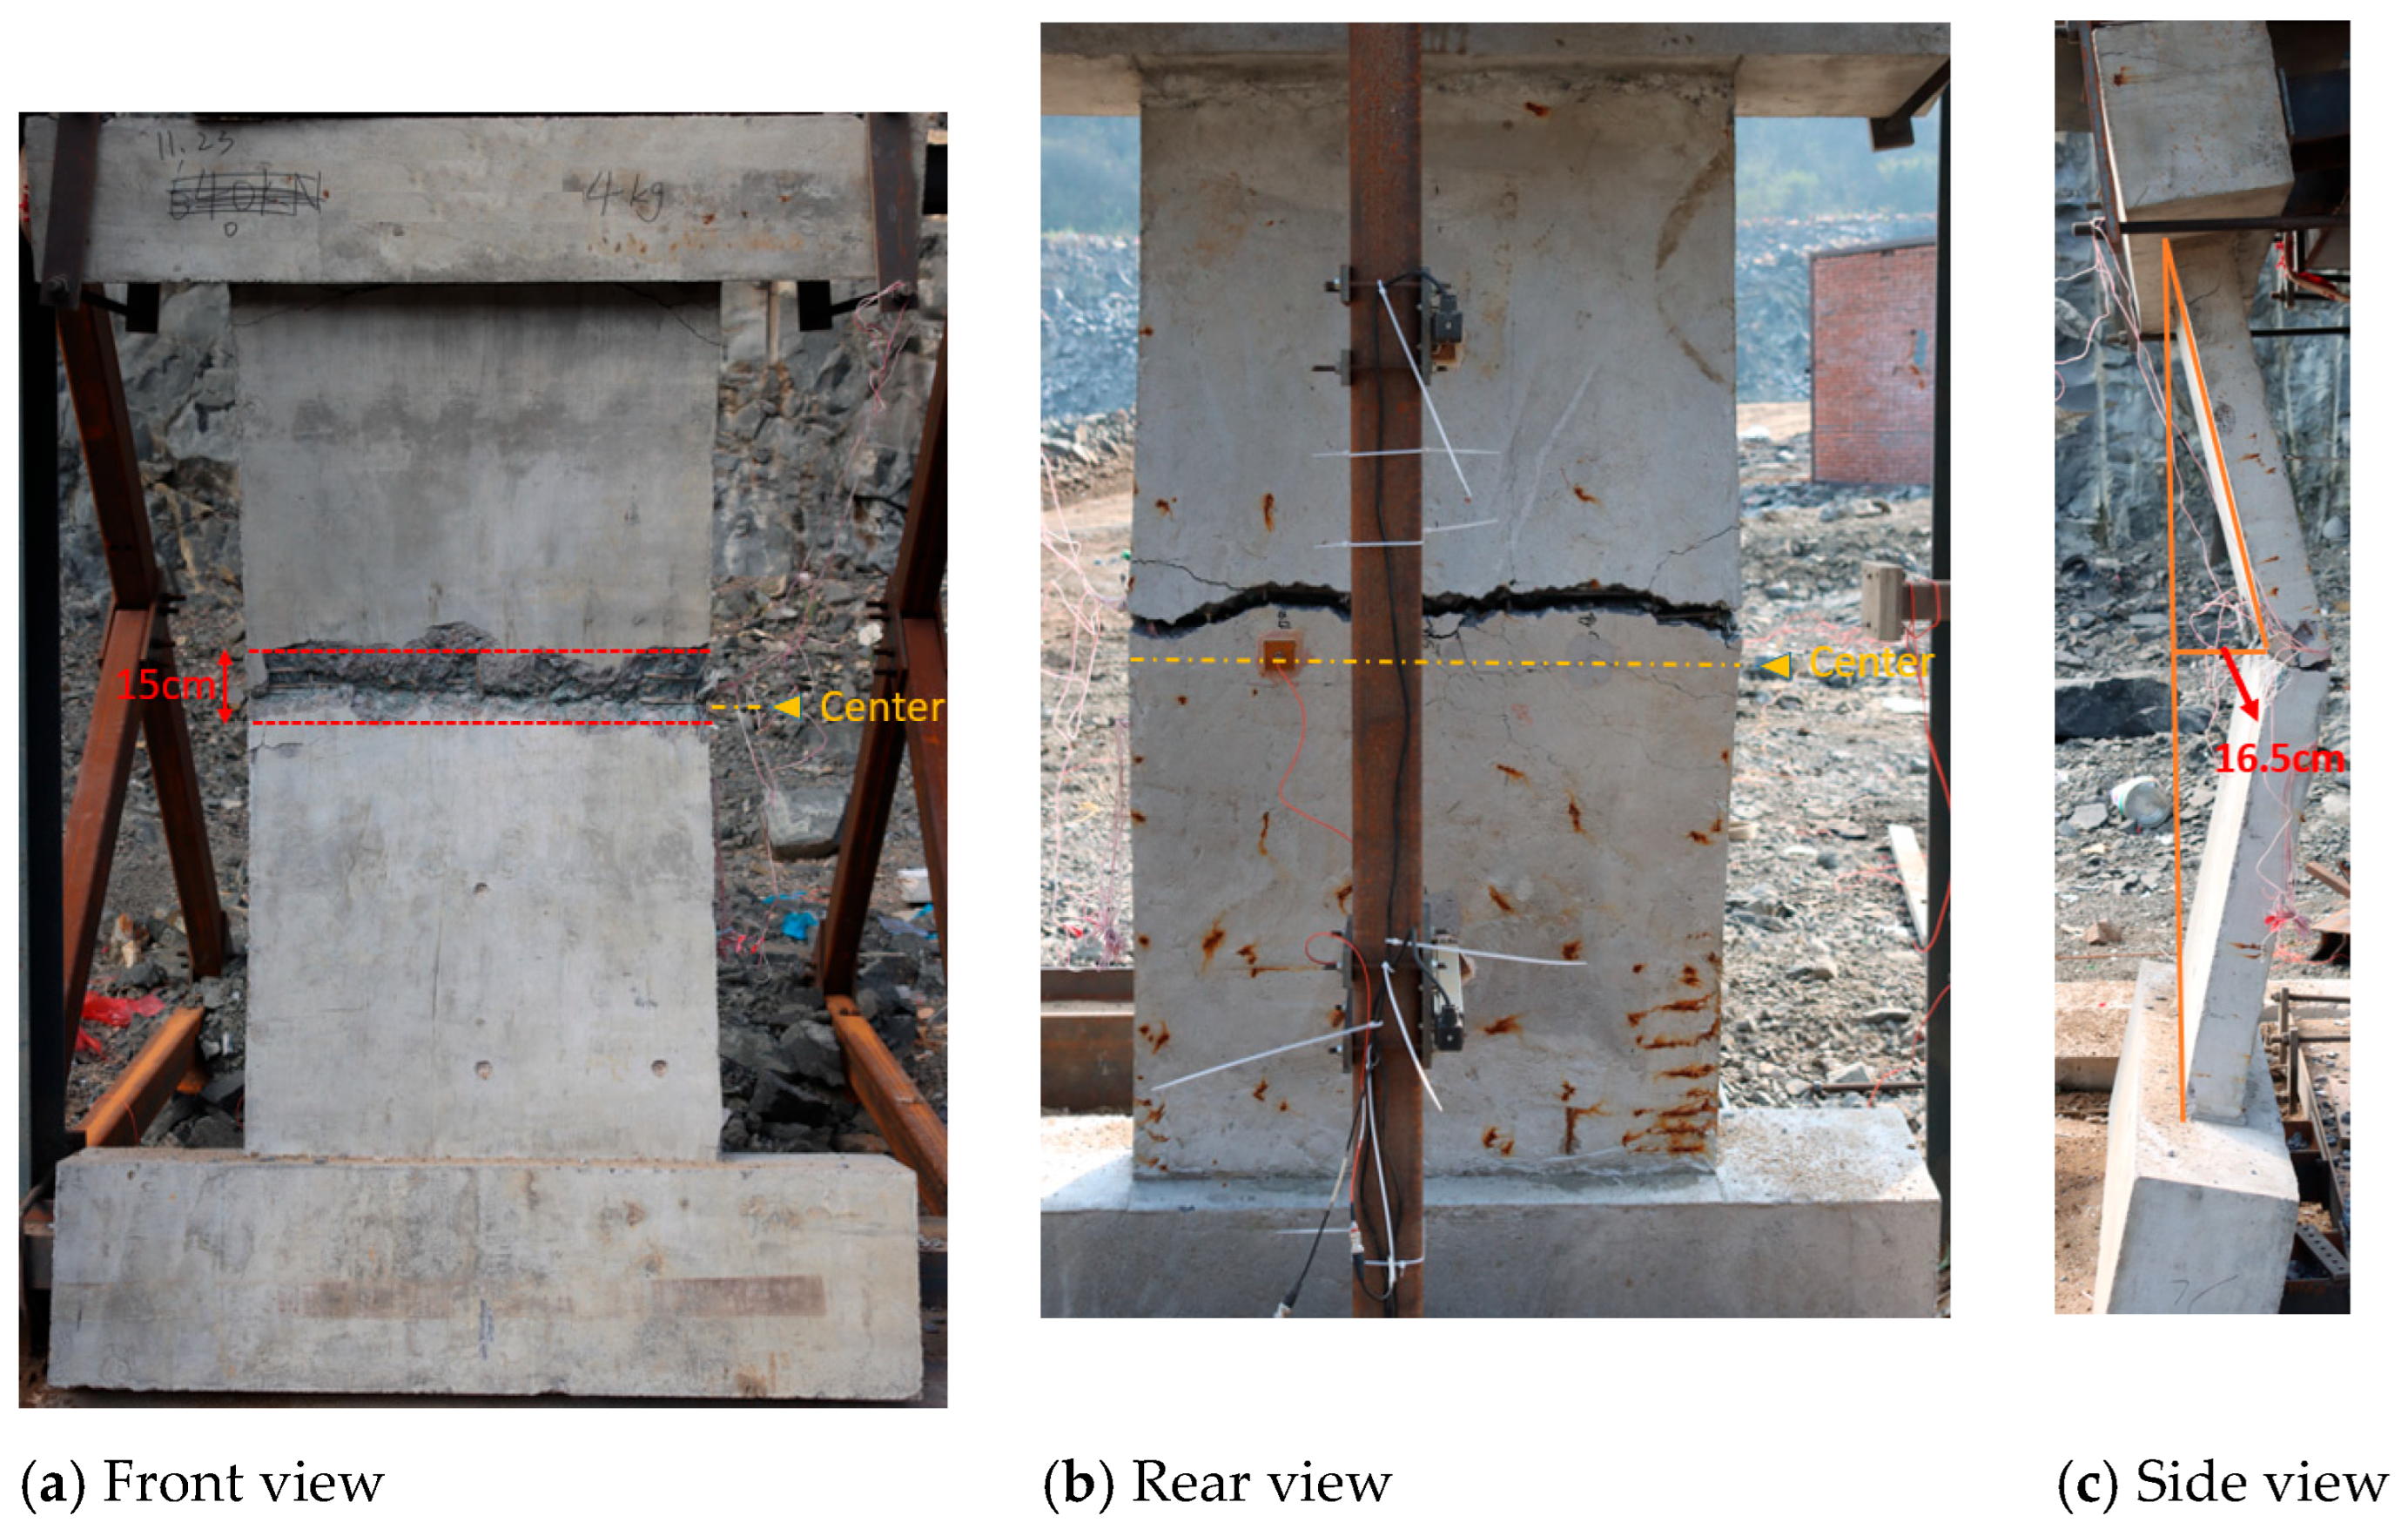
When the charge weight was 0.35 kg, the wall remained intact with no visible damage. The reinforcement did not undergo deformation, and the maximum central displacement was 0.48 cm, within the elastic range. At 0.7 kg, minor surface cracks appeared on the blast-facing side, and a through-thickness crack was observed at the center of the rear face. The maximum central displacement increased to 0.73 cm.
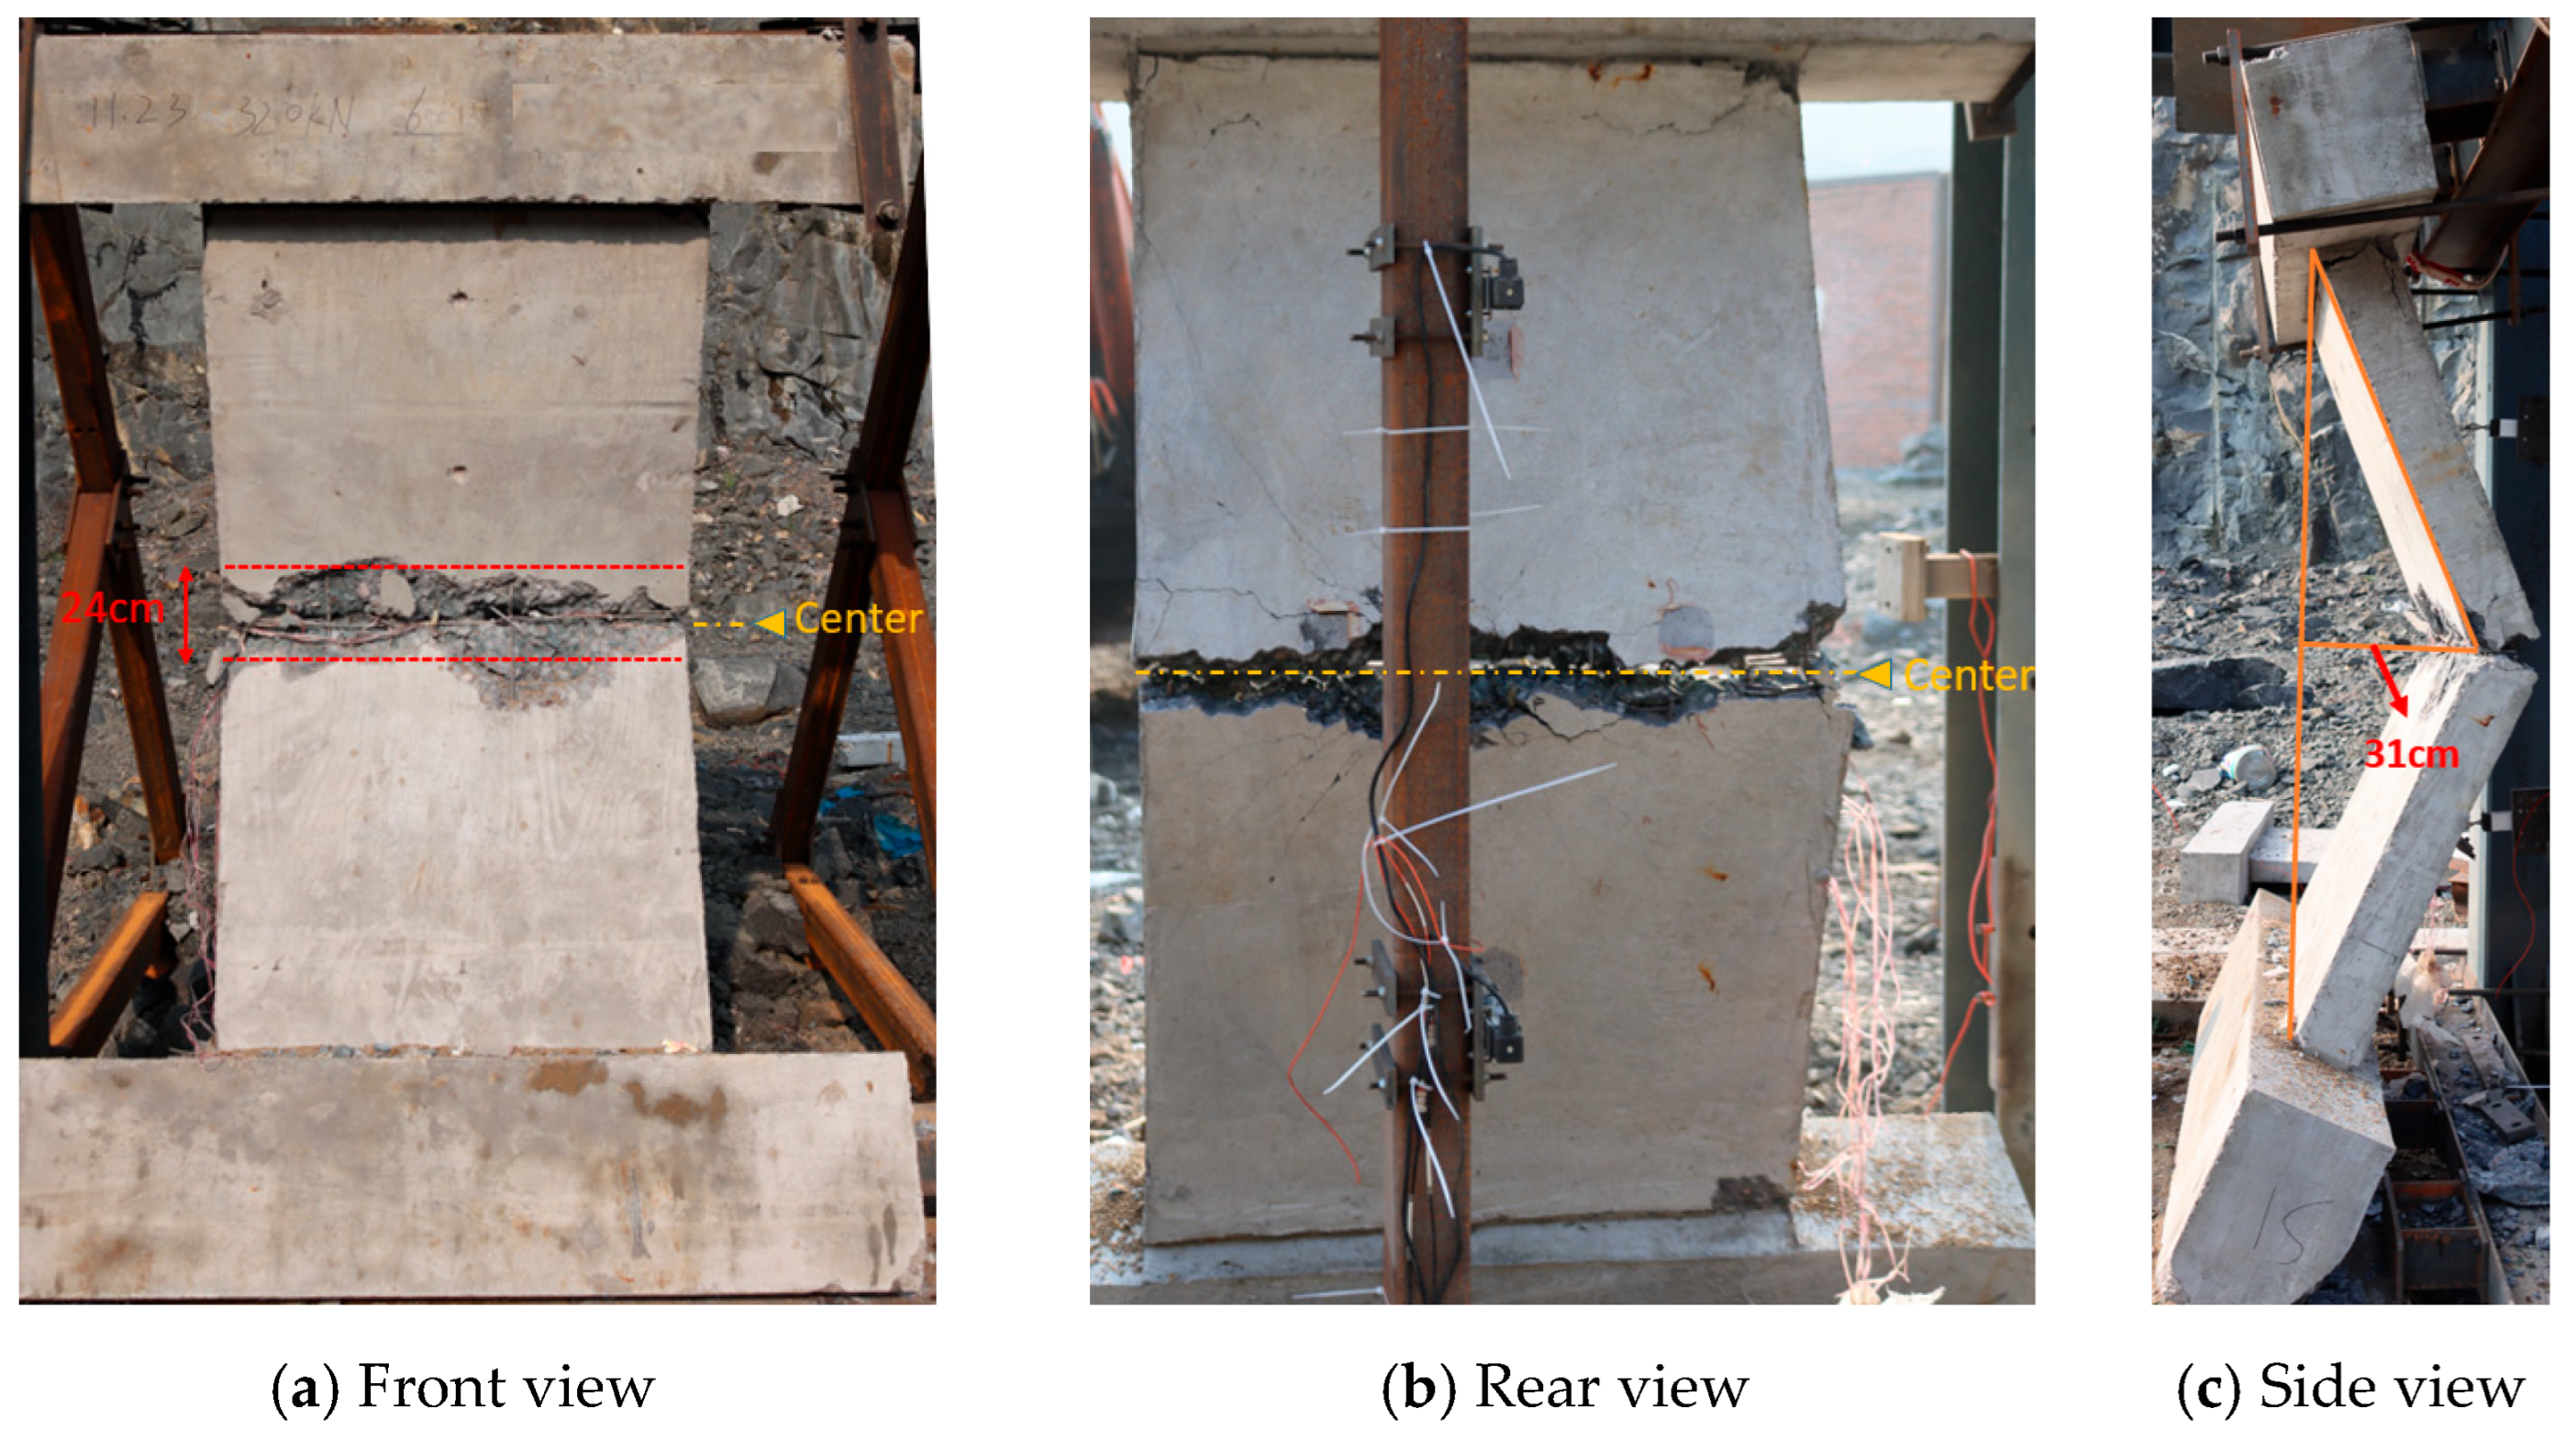
At 2.8 kg, a noticeable concrete crushing zone formed on the blast-facing side, and the center of the rear face bulged outward. The through-crack deepened and became more concentrated. The maximum central displacement reached 3.31 cm, indicating slight flexural damage. At 3.5 kg, both vertical and X-shaped damage bands appeared on the blast-facing side, and a spall crater formed on the rear face. The maximum displacement increased to 5.67 cm, and the wall exhibited clear flexural failure.
When the charge weight was 3.85 kg, a prominent X-shaped damage zone developed on the blast-facing side, and the rear crater expanded. The maximum displacement rose to 8.90 cm, accompanied by minor cracking at the connection between the wall and the top beam. The wall showed signs of combined flexural–shear failure. At 4.2 kg, a large X-shaped damage zone formed on the front face, and extensive concrete spalling occurred on the rear face. Cracking appeared at both the top and bottom beam connections, and the wall experienced a clearly defined flexural–shear failure with a maximum central displacement of 15.32 cm.
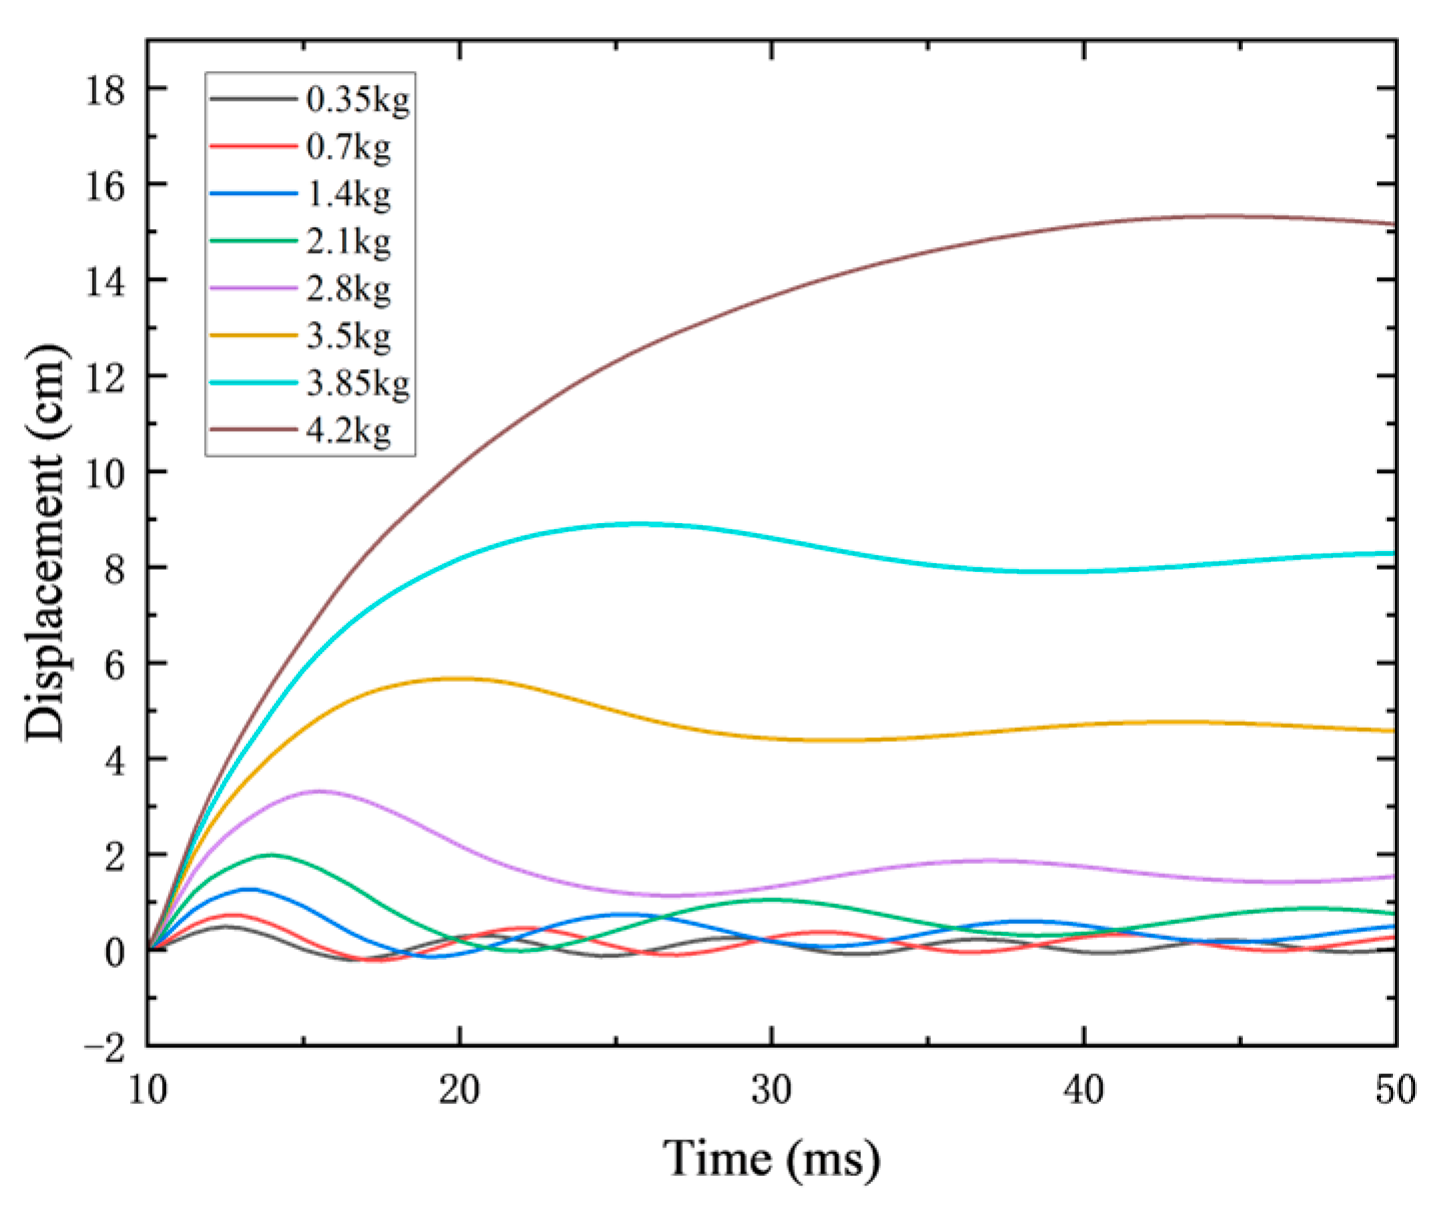
Figure 22 presents the displacement–time curves at the center of the reinforced concrete shear wall under different scaled distances. As the blast occurred, with the standoff distance kept constant, the increase in TNT equivalent resulted in a decrease in scaled distance, leading to a larger maximum displacement at the wall center. Additionally, the time required to reach the peak displacement increased with the charge weight.
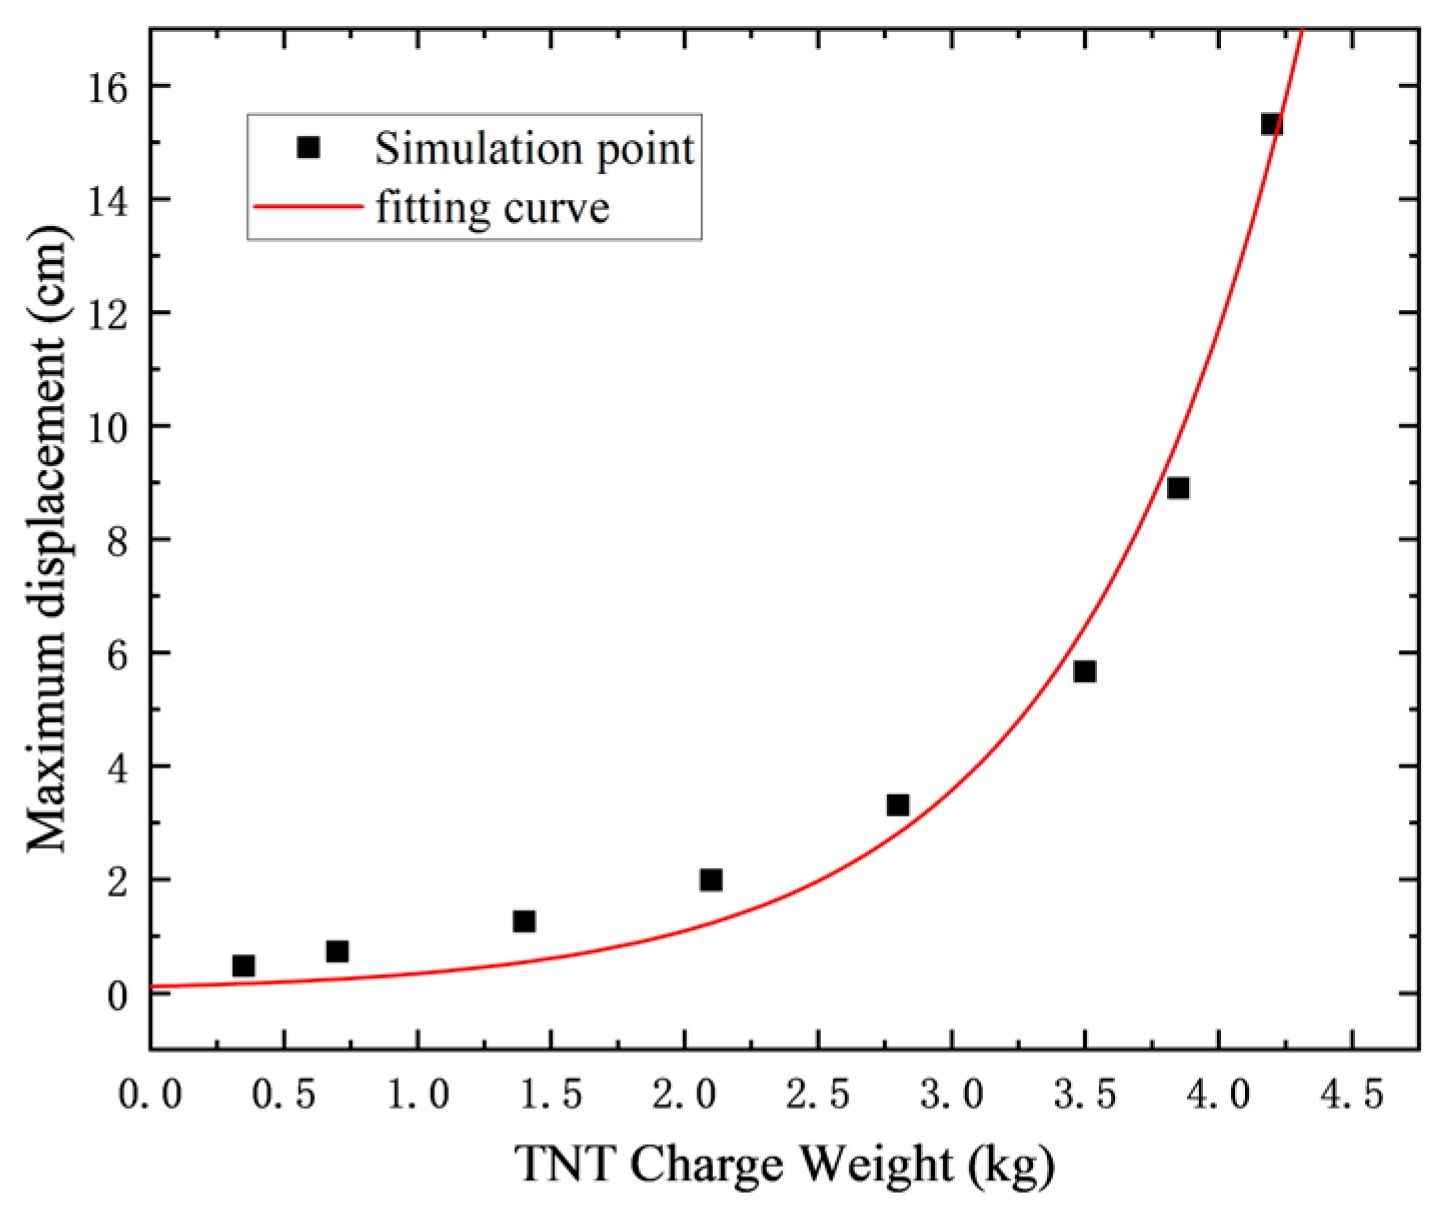
Figure 23 further illustrates the relationship between peak central displacement and TNT charge weight. A curve is fitted using the least squares method
, where
represents the peak displacement and
is the charge weight, as shown in the figure. The coefficient of determination (
) is 0.982, indicating a strong correlation and a good fit.
For the RC shear wall model with a width of 100 cm (discussed in
Section 4.2), the fitted curve in
Figure 13 can be used to predict the maximum displacement at the wall center for TNT charge weights ranging from 0 to 4.2 kg.
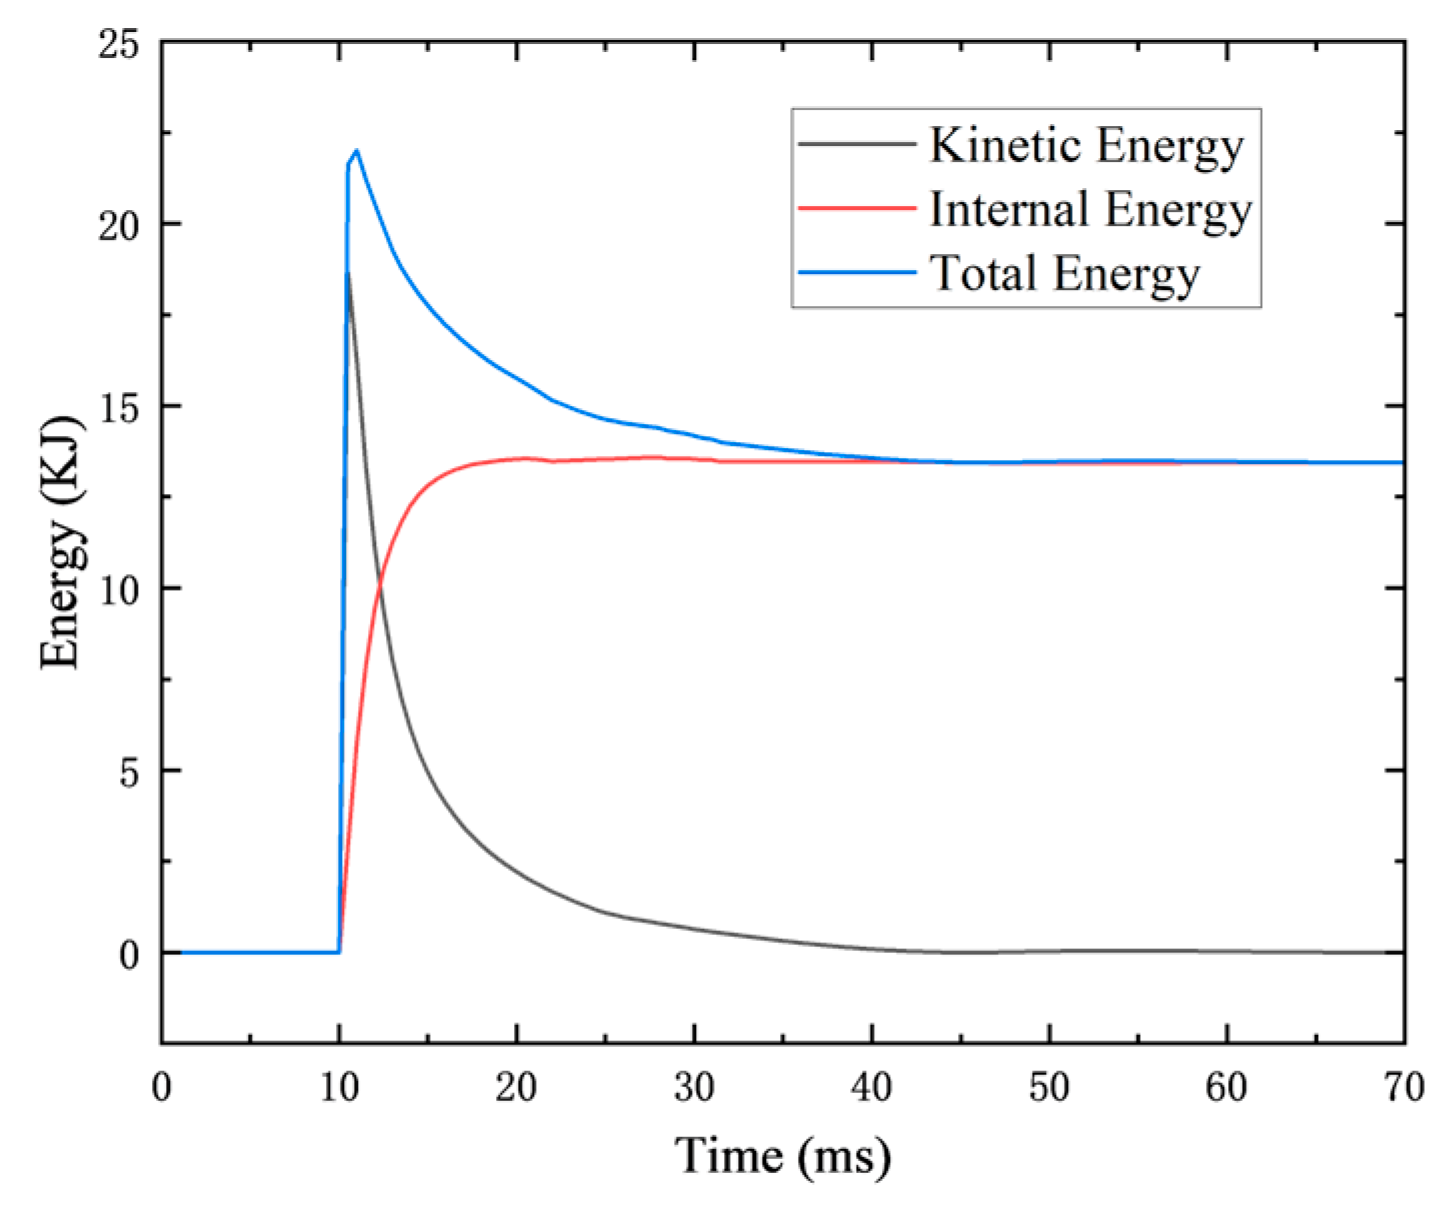
To better interpret the damage mechanisms,
Figure 24 illustrates the time–history evolution of kinetic energy, internal energy, and total energy under the 4.2 kg TNT blast scenario. Immediately following the detonation, the kinetic energy rapidly peaks and is subsequently converted into internal energy as the shear wall undergoes deformation. The total energy remains nearly constant throughout the simulation, indicating that energy conservation is well maintained. The progressive rise in internal energy represents the energy absorbed by the structure through plastic deformation and cracking, which aligns with the observed damage patterns.
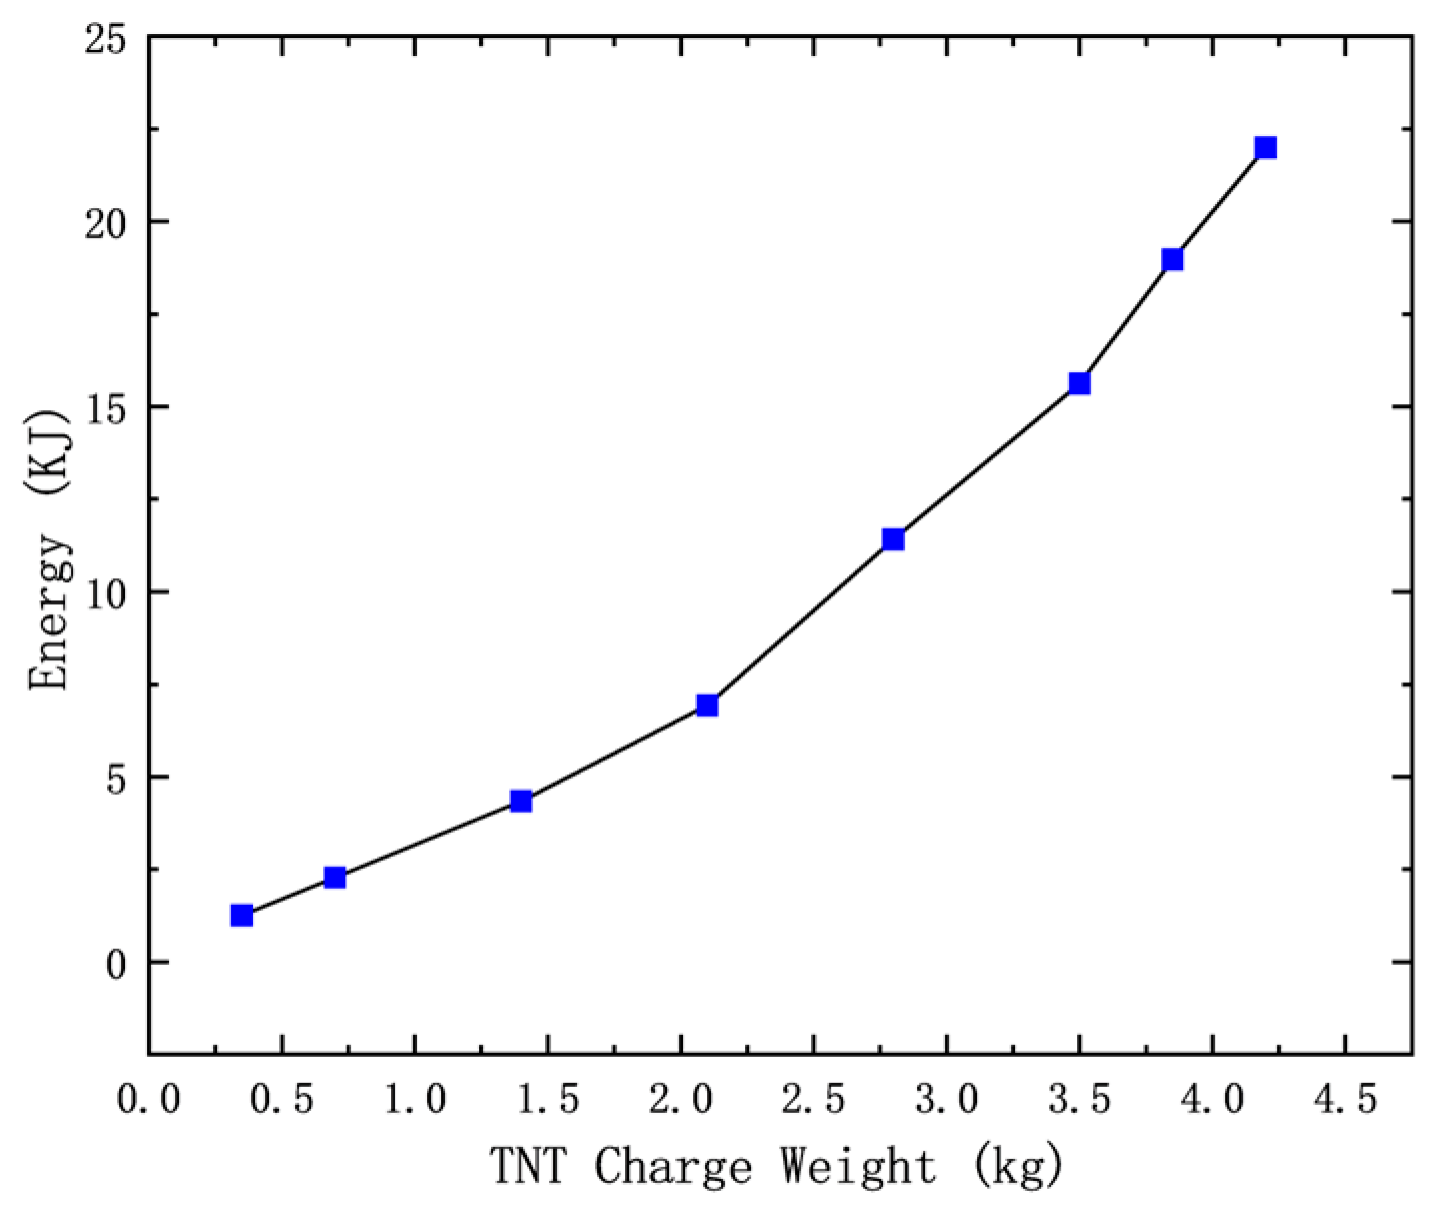
Figure 25 presents the relationship between the absorbed internal energy and TNT charge weight. As the explosive charge increases, the internal energy absorbed by the wall also increases nonlinearly. This trend indicates that more energy is transferred into the structure during higher-intensity blasts, leading to more significant plastic deformation and damage. The absorbed energy can be used as a quantitative indicator of the wall’s damage level, providing a complementary metric to displacement-based assessments.
Under blast loading, the failure modes of RC shear walls are primarily characterized by flexural failure or combined flexural–shear failure. Therefore, the support rotation angle is considered a more appropriate parameter for evaluating the damage level of shear walls. Based on the recommendations in Reference [
50], the damage level assessment parameter
for RC shear walls is defined as follows:
where
denotes the maximum mid-span displacement of the shear wall, and
represents the shortest distance between the wall center and the support. The corresponding relationship between the damage level of the RC shear wall and the support rotation angle
as well as the mid-span displacement
is presented in the table.
Based on the numerical simulation results, the damage phenomena associated with five typical failure modes are described as follows:
(1) No Damage: The wall remains within the elastic range under blast loading, with no impact on structural function. The support rotation angle is less than 0.5°.
(2) Minor Damage: A small number of fine cracks appear on the wall surface, with limited width and no through-thickness penetration. Localized concrete spalling may occur, but no visible perforation is formed. Overall deformation is small, and mid-span deflection remains within acceptable limits. The residual load-bearing capacity is essentially intact, and the structural function remains unaffected. The support rotation angle is between 0.5° and 2°.
(3) Moderate Damage: Significant radial and circumferential cracks develop on the wall surface, some penetrating the full thickness. Concrete spalling is more severe, with shallow craters or localized perforations possible. Overall deformation is considerable, and mid-span deflection exceeds allowable limits. Some residual load-bearing capacity remains, though structural function is partially impaired. The support rotation angle is between 2° and 6°.
(4) Severe Damage: Numerous through-thickness cracks appear, accompanied by extensive concrete spalling. Deep craters or large perforations form. The wall exhibits large overall deformation, and mid-span deflection significantly exceeds allowable limits. Residual capacity is greatly reduced. Collapse or blowout may occur on the rear face, with concrete fragments projected outward. Structural function is severely compromised. The support rotation angle is between 6° and 12°.
(5) Complete Failure: The wall completely fractures or collapses, losing all load-bearing capacity. Concrete is heavily fragmented, and reinforcement is exposed or ruptured. Rear-face blowout and through-failure are extremely severe, with wide debris scattering. Structural function is entirely lost. The support rotation angle exceeds 12°.


