1. Introduction
China’s highway construction sector has undergone substantial growth over the past decade. By the end of 2022, the total highway mileage reached 5.2807 million km—an increase of 1.9355 million km since 2005 [
1]. A key factor contributing to this rapid expansion is China’s significant reliance on infrastructure projects as a means of driving economic development and facilitating modernization [
2]. As the industry matures, however, firms operating in highway construction and related services are confronted with considerable challenges when pursuing diversification [
3]. In particular, the completion of major highways has reduced the necessity for new projects, while the limited toll periods for existing routes have heightened operational risks [
4]. These changes underscore the need to explore new pathways for achieving long-term, sustainable growth [
5,
6,
7]. Among available alternatives of diversification strategies, the construction industry has emerged as a potential target due to its synergies with existing capabilities, becoming an important choice for infrastructure corporations [
8,
9].
Against this backdrop, the present study focuses on two critical areas: internal management and organizational optimization. It offers a detailed examination of how strategic refinements in organizational structures and management processes can help companies navigate the complexities of diversification. Additionally, the study underscores the pivotal role of continuous technological innovation in enhancing overall operational efficiency and mitigating X-inefficiency [
10,
11,
12,
13]. In doing so, it aligns with Penrose’s theoretical framework, which advocates the proactive use of surplus resources to strengthen a firm’s competitive position [
14].
Despite the importance of these issues, comparatively few investigations have addressed diversification and its effects on the performance of infrastructure corporations in China statistically, especially taking construction industry as an important alternative [
13,
15]. This paper sets research objectives and clearly states hypotheses: related diversification reduces X-inefficiency in highway firms, unrelated diversification increases operational risks. This paper seeks to bridge that gap by analyzing data from publicly listed firms over an 11-year span, employing a DEA-BCC model, X-inefficiency measures, and panel analysis. The empirical findings suggest that proper diversification strategies generally exert a positive influence on firms’ economic performance, particularly by bolstering resource allocation efficiency, enhancing production efficiency, and mitigating X-inefficiency.
Beyond its empirical findings, this study advances both theoretical and practical understanding of diversification strategies within the infrastructure sector, with particular relevance to the construction industry. The methodological approach not only quantifies the efficiency gains from strategic diversification but also identifies the risks of over-extension into unrelated areas, offering a nuanced perspective on resource allocation.
The remainder of this paper is organized as follows.
A comprehensive literature review details the definition of diversified operations, various measures of diversification, and the concept of X-inefficiency.
The next section outlines the methodology used, including model specifications and data analysis techniques.
The empirical findings derived from this analysis are then presented.
A concluding section discusses the broader implications, followed by key conclusions and directions for future research.
2. Literature Review
2.1. Diversification/Diversified Operation and Economic Performance
Diversification, also referred to as poly-centric or multifaceted operations, encompass a company’s engagement in a variety of business activities conducted in a diversified manner [
16,
17]. In short, it can be defined as a business strategy in which a firm concurrently offers more than one product or business item. This can involve investments in different industries, diverse product lines, the operation of multiple products within a single industry, or a combination of physical business and e-commerce ventures [
18,
19,
20]. The study of corporate diversification, or diversification strategies, has been ongoing since the 1950s [
21]. In Ansoff’s article titled “Diversification Strategy,” it is argued that diversification represents a crucial stage in a company’s development, enabling the introduction of new products into new markets as the company grows [
22]. Penrose further elaborates on diversification, describing it as an expansion of an enterprise’s production and operations while retaining its original product line. It was also emphasized that surplus resources are utilized to extend business activities upstream and downstream within the original product chain [
14]. According to Rumelt, diversification is a corporate strategy aimed at developing new businesses and markets to enhance competitiveness, building upon the foundation of the original business model [
23].
Jang et al. conducted an empirical study on data from 72 listed international construction companies over the period 2009–2014, revealing a U-shaped relationship between international diversification and firm performance [
24]. Lee et al. conducted an empirical analysis on the impact of diversification on construction company insolvency through a vector error correction model, and the results showed that a higher degree of diversification does not lead to greater increase in firm value [
25]. Raudszus et al. have shown through collected evidence that diversification in related industries is superior to unrelated industries—at least in the construction industry [
26]. The impact of diversified operations on corporate performance of listed companies in the construction industry is complex, and it is worth exploring whether diversified operation strategies should be advocated or devalued in the process of corporate operation.
2.2. Types and Measurement of Diversification
There are various ways to classify diversified operations. Ansoff first classified diversified operations into four types: vertical diversification, horizontal diversification, concentric diversification, and mixed diversification [
27]. Wrigley first introduced the concepts of “specialization rate” and “correlation ratio” by differentiating the products or businesses and the relevance of each product or business [
28,
29]. Rumelt replaced products with businesses and classified firms’ diversified operations into four categories: single-business, dominant-business, related-business, and unrelated-business, and the consensus of researchers was that unrelated products diversification (conglomeration) may destroy value, while relevant diversification may increase value [
23]. Yisheng Yin developed a two-dimensional model and classified diversification into four types including low degree (LD), related degree (RD), unrelated degree (UD), and high degree (HD) [
30].
2.3. Definition and Application of X-Inefficiency
The term “X-inefficiency” in economics refers to situations in which businesses experience internal inefficiencies that drive up production costs beyond what is necessary for a certain output [
31]. Many reasons, including out-of-date technology, ineffective manufacturing methods, bad management, and a lack of competition, contribute to this inefficiency, which raises consumer costs and reduces profitability [
32]. Cost frontier analysis is a technique used to assess the efficiency of firms in a specific industry or sector by approximating the minimum cost required to produce a specific output level [
33]. Data Envelopment Analysis (DEA) is a method for evaluating the relative efficacy of businesses or organizations that does not rely on presumptions or predetermined criteria. It assesses how well businesses use different inputs and outputs and establishes the maximum degree of efficiency that can be attained given the resources at hand. Businesses that fall short of this ultimate standard of efficiency are considered ineffective [
34].
It is evident from the literature review above that the definition of diversification is widely accepted in both the academic and industry domains. Different methods of categorizing diversification are frequently the result of meeting the needs of various industries. Also, considering that the highway industry is a natural monopoly, in order to scientifically and reasonably analyze the results of the diversification of listed highway companies, this paper uses the theory of “X non-efficiency”, which is closely related to the analysis of monopoly industries. Thus, the implementation of the DEA-CCR model, Panel (data) analysis, and X-inefficiency in this study has a solid theoretical and practical foundation.
3. Methodology
3.1. Data Overview
This research primarily concentrates on listed highway construction and operation companies in China, benefiting from the ready availability of their data. The essential financial metrics are derived from the annual reports of these enterprises, as well as sourced from prominent databases like the China Stock Market & Accounting Research Database (CSMAR), and the China Highway database. Twenty actively operating companies were selected, and their annual reports from 2011 to 2021 were meticulously reviewed. The core business of the research company’s sample is toll road operation, with diversified businesses including real estate development, material production, project consulting services, etc.
3.2. Diversification Measurement
To evaluate the viability of the construction industry as a diversification target for infrastructure corporations, this study employs three principal metrics: (1) The Number of Diversified Business Units (N) identifies construction-related segments—such as civil engineering or real estate development—as distinct units when their revenue contribution exceeds 5% of total income; (2) the Herfindahl–Hirschman Index (HHI) quantifies revenue concentration, with adjusted values (1–HHI) reflecting the degree of diversification, as a diversification metric (input variable) in the DEA model; and (3) Entropy Index (EI) distinguishes between related and unrelated diversification.
- (1)
Number of Diversified Business Units (N): This metric counts business segments as separate entities when their operating income contributes more than 5% to the company’s total operating income [
35].
- (2)
Herfindahl–Hirschman Index (HHI): The HHI is a measure that quantifies the degree of diversification by calculating the squared sum of the proportion of a company’s revenue derived from different business segments concerning the total revenue [
36]. The formula for HHI is as follows [
37]:
where
represents the proportion of business revenue from industry
i in relation to the main business revenue. A higher HHI corresponds to a higher degree of diversification in a company. To ensure consistency and ease of analysis, this paper utilizes a variation of HHI, where it subtracts the result from 1. This adjustment ensures that the degree of diversification and the HHI move in the same direction.
- (3)
The entropy index is a measure of the degree of uniformity of energy distribution in space, first applied to the study of corporate diversification. In this equation,
represents the share of business revenue from i in relation to the main business revenue. A higher EI indicates a more substantial degree of diversified operations [
39].
3.3. Data Envelopment Analysis (DEA)
The evaluation of performance aims to continuously monitor the efficiency and economy of the company’s operations and to provide information for corporate decisions. A method is needed which allows the use of both quantitative and qualitative characteristics; Data Envelopment Analysis (DEA) is such a method. DEA may complete traditional indicator analysis, especially if the goal is to get more information regarding operational and technical efficiency. Based on the analysis of the chosen corporate data, DEA-BCC is presented to be suitable for the comparison and analysis of profit-making companies’ performance.
Data envelopment analysis (DEA) is a popular non-parametric performance evaluation method for computing the efficiency scores of a group of homogeneous decision-making units (DMUs) with various inputs and outputs. The DEA model can be divided into two categories: input-oriented and output-oriented. The former refers to the minimum input without changing the output, while the latter refers to obtaining the maximum output without changing the input [
40]. DEA is widely used in a variety of areas, including energy, electricity, water, agriculture, mining, finance, banking, insurance, real estate, transportation, health care, sports, communication, manufacturing, tourism, and education [
41,
42].
Charnes, Cooper, and Rhodes (1978) first introduced DEA, which is based on Farrell’s research study [
43]. This model can only be used to evaluate decision units with invariant returns to scale, and the calculated efficiency value is the technical efficiency value. However, it cannot separately measure pure technical efficiency and scale efficiency, and therefore cannot intuitively evaluate the scale effectiveness of decision units through calculation results. The specific form of this model is as follows [
42]:
where
m represents the number of decision units,
is the input vector of the evaluated decision unit DMU,
is its output vector,
is the linear combination coefficient of the decision unit DMU, the comprehensive efficiency value of the decision unit is
, and
and
represent slack variables, that is, redundant values of input and output.
represents a non-Archimedean infinitesimal.
S·
t refers to “satisfying the following conditions”, used to introduce constraint conditions.
i and
r are input indicators and output indicators, respectively.
This paper uses the CCR-BCC model in DEA to measure the efficiency of the selected companies. It provides an accurate analysis of how diversification affects operational efficiency, focusing on identifying and improving X-inefficiency. This model optimizes resource allocation and improves operational efficiency, providing a powerful analytical tool for future strategy formulation and decision-making processes. Efficiency values range from 0 to 1, with closer values indicating more technically efficient decision-making units. Unlike the CCR model, the BCC model can decompose the technical efficiency values obtained from the CCR model into two parts: pure technical efficiency and scale efficiency, so this article chooses the input-oriented DEA-BCC model. The specific form of this model is as follows [
42]:
where
m represents the number of decision units,
is the input vector of the evaluated decision unit DMU,
is its output vector,
is the linear combination coefficient of the decision unit DMU,
j represents a certain decision unit. The comprehensive efficiency value of the decision unit is
, and
and
represent slack variables, that is, redundant values of input and output.
represents a non-Archimedean infinitesimal.
S·
t refers to “satisfying the following conditions”, used to introduce constraint conditions.
i and
r are index for inputs and index for outputs, respectively.
3.4. X-Inefficiency
The DEA method has been used to calculate the overall efficiency of each company, which reflects the “X-efficiency”, the company’s ability to maximize its outputs for a given set of inputs and to measure the degree of waste in the production process. When using the DEA method to measure X-efficiency, the calculation of X-inefficiency can be seen as follows [
44]:
4. Results
4.1. Selection of Input and Output Indicators
When selecting indicators, it is necessary to pre-process the data, eliminate unavailable data, and select relevant and representative data.
Table 1 shows the input–output indicator system of listed highway companies selected in this paper.
4.2. DEA Analysis
Table 2 displays the comprehensive efficiency of listed highway construction and operation companies from 2011 to 2021 in China.
Qian et al. analyzed the technical efficiency of road transportation in various provinces across the country from 2015 to 2019, and found that eleven provinces were DEA-effective, ten provinces had efficiency values fluctuating around 0.9 and 0.8, and the remaining ten provinces were below 0.8 [
45]. A score of 1 indicates Pareto efficiency—no input reduction or output increase is possible without harming other metrics. According to
Table 2, three listed organizations have a high average value of comprehensive efficiency from 2011 to 2021, and the majority of the average values are less than 0.9, indicating that most companies have potential for efficiency development.
From
Table 3, it can be seen that the returns to scale are divided into three categories: decreasing returns to scale (Drs), constant returns to scale, and increasing returns to scale (Irs), which confirms that the variable returns to scale (VRS) hypothesis is statistically applicable to the highway enterprise dataset.
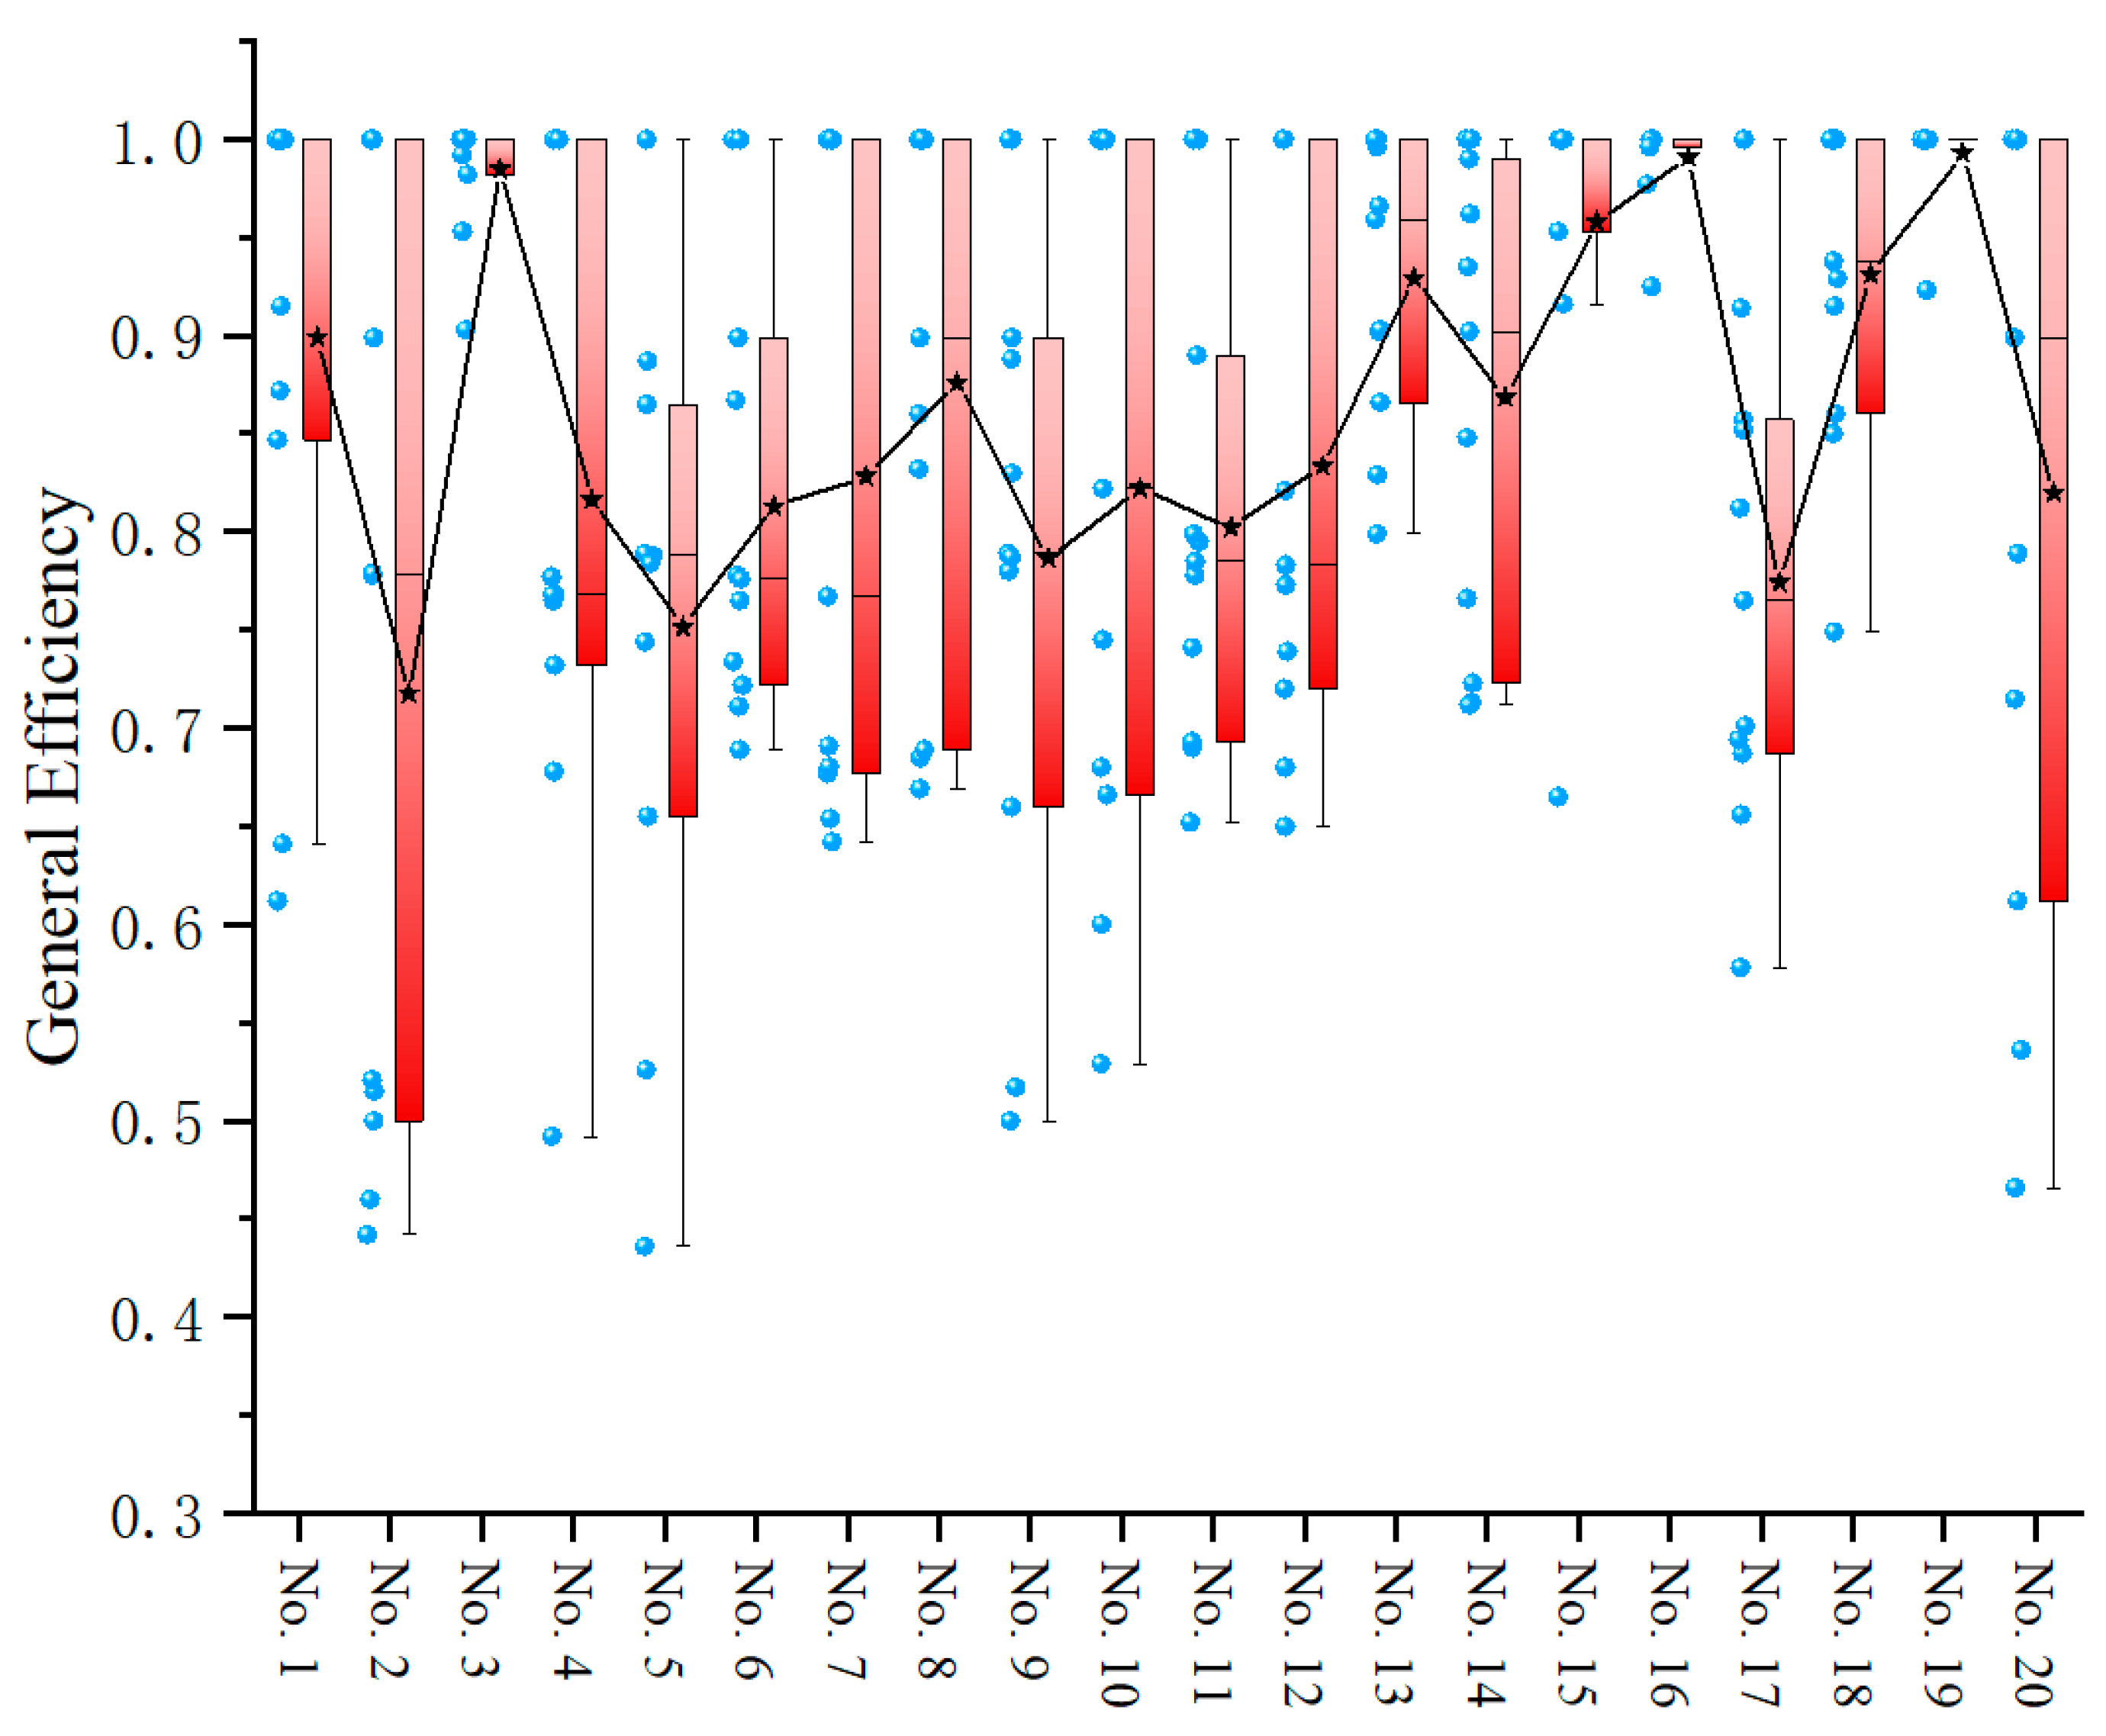
It can also be seen that the value of comprehensive efficiency varies between years, indicating that there is instability in the level of business management of listed highway companies, and that the external environment has an impact on their economic performance. Company No. 2 has the lowest total efficiency value (0.718), with 28.2% input waste. The average value of each company’s total comprehensive efficiency level for the 11-year period from 2011 to 2021 is 0.86, with 14% redundancy in input resources.
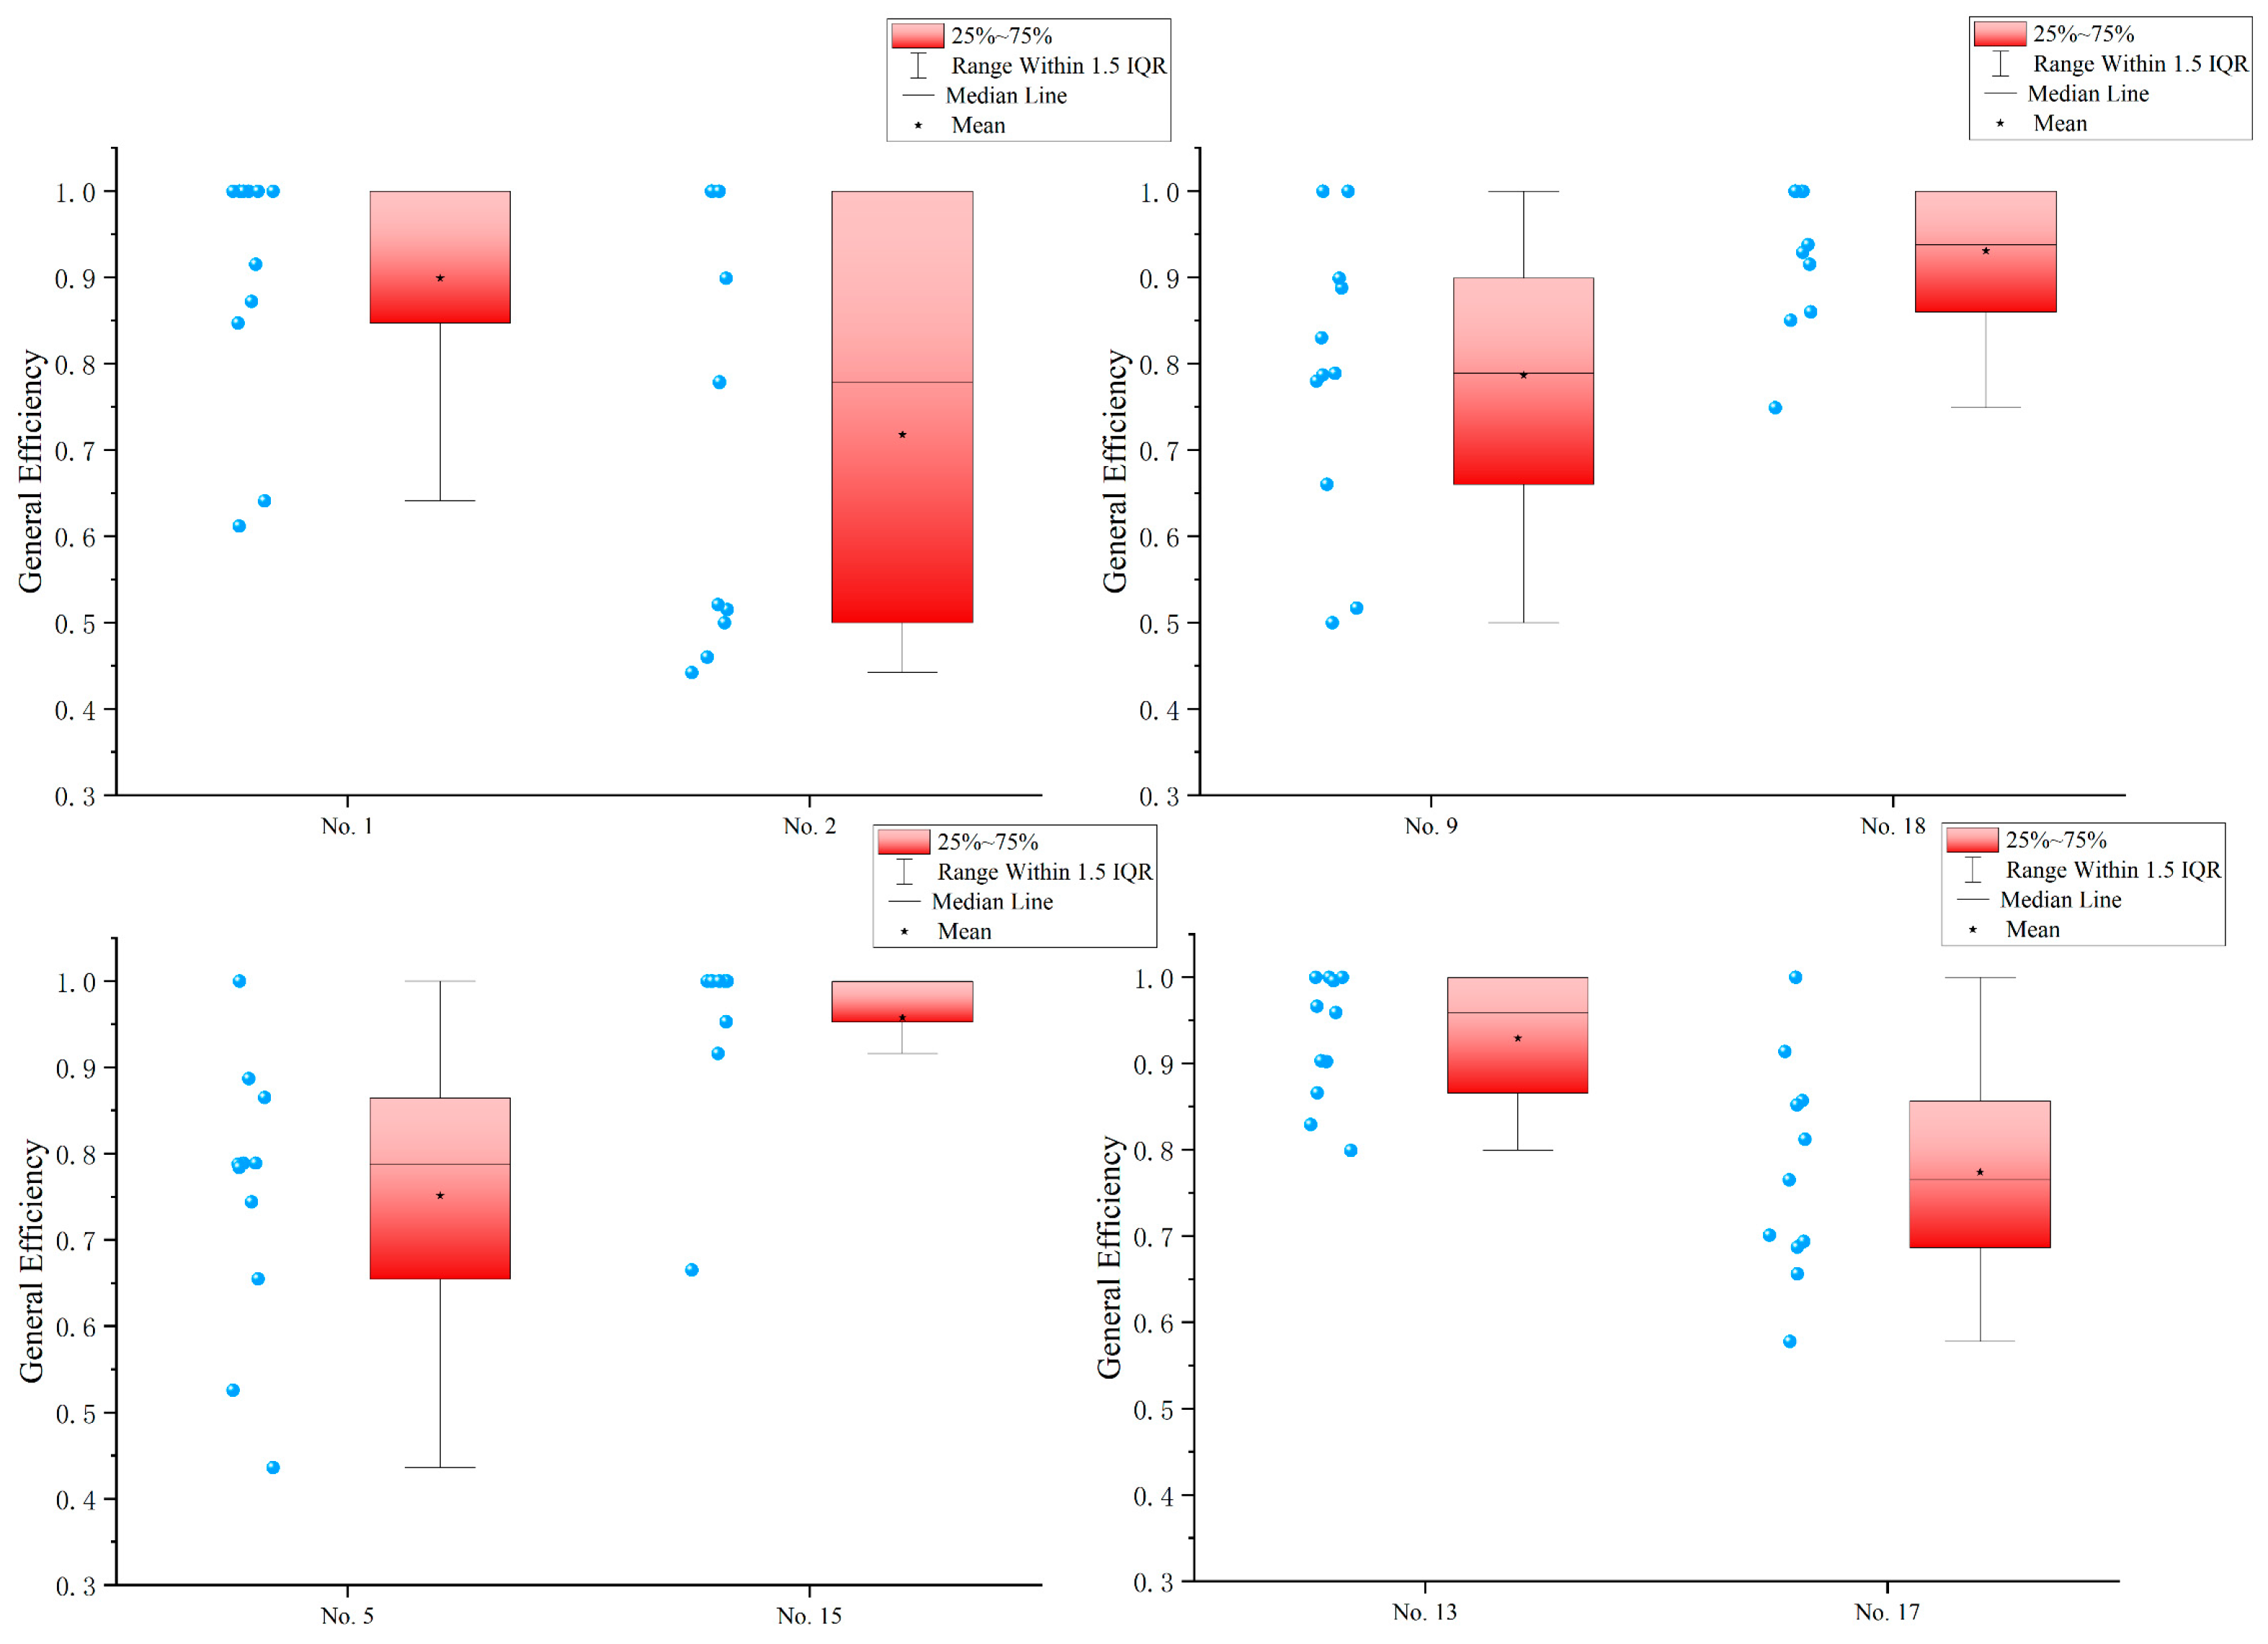
Figure 1 illustrates the changes in comprehensive efficiency of different companies, while
Figure 2 compares and analyzes eight of them. According to
Figure 1 and
Figure 2, by comparing the comprehensive efficiency of different highway listed companies, it was found that Company No. 2, Company No. 5, Company No. 9 and Company No. 17 have lower comprehensive efficiency, while companies such as Company No. 13, Company No. 15, and Company No. 18 have relatively high comprehensive efficiency levels.
4.3. Diversification vs. X-Inefficiency
Based on the calculated comprehensive efficiency, the measure of diversification and economic performance of each listed highway company is derived as shown in
Table 4 below.
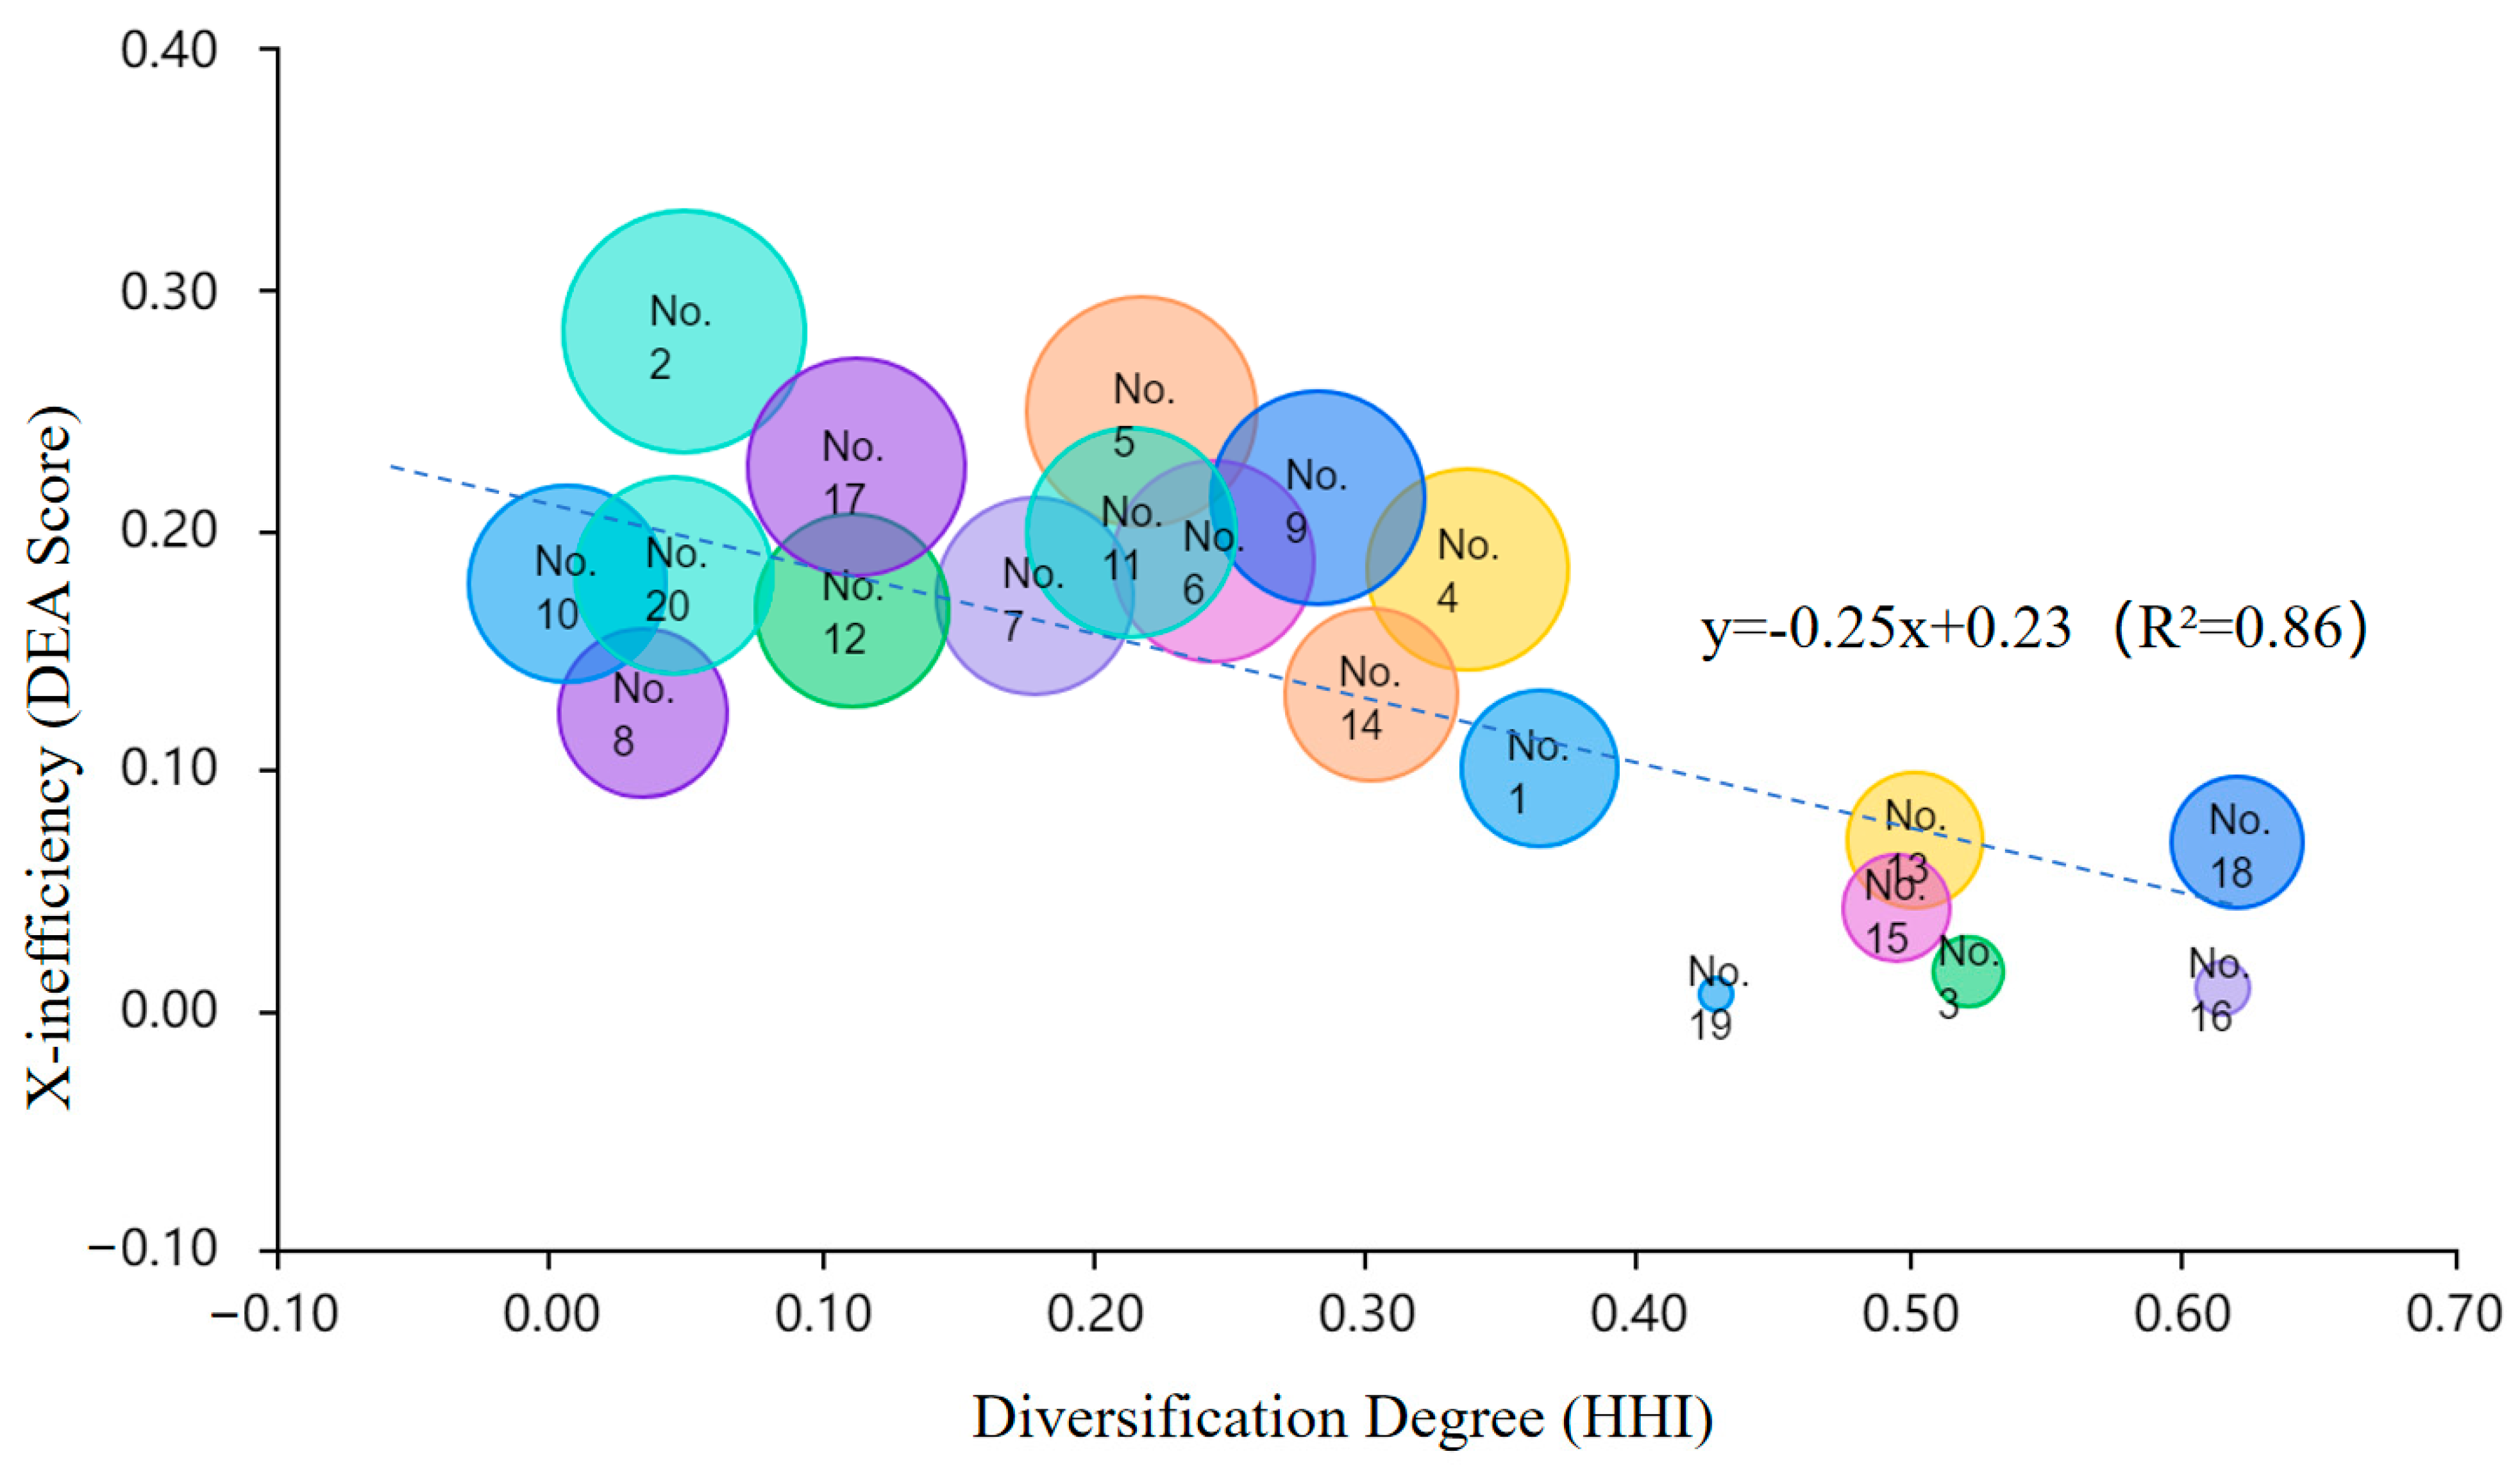
Figure 3 was plotted using SPSSAU22.0 software based on the HHI and X-inefficiency data from
Table 4. From
Figure 3, it is clear that the selected companies have a negative overall association between diversification and X-inefficiency. This discovery calls into question the previously held premise that there is a positive association between firm concentration and X-inefficiency, or an inverted U-shaped relationship between concentration and technical efficiency (i.e., X-efficiency), as proposed by international academics. Under the market economy system in China, diversified operation of highway corporations is beneficial for improving the management status of enterprises, enhancing resource allocation and production efficiency, thereby reducing X-inefficiency and technological inefficiency to a certain extent.
The empirical analysis also reveals distinct outcomes for infrastructure corporations diversifying into the construction industry, depending on the nature of their expansion. Firms pursuing related diversification—such as those entering infrastructure maintenance or public works—exhibited 12% lower X-inefficiency compared to non-diversifiers. This improvement stems from shared resources, including labor and equipment, which reduce redundancy and optimize cost structures. For example, Company No. 15 phased entry into bridge maintenance using existing equipment and staff training, reducing operational costs by 15%. It achieved an efficiency score of 0.958 by focusing on ancillary highway facilities, demonstrating how aligned diversification can enhance performance.
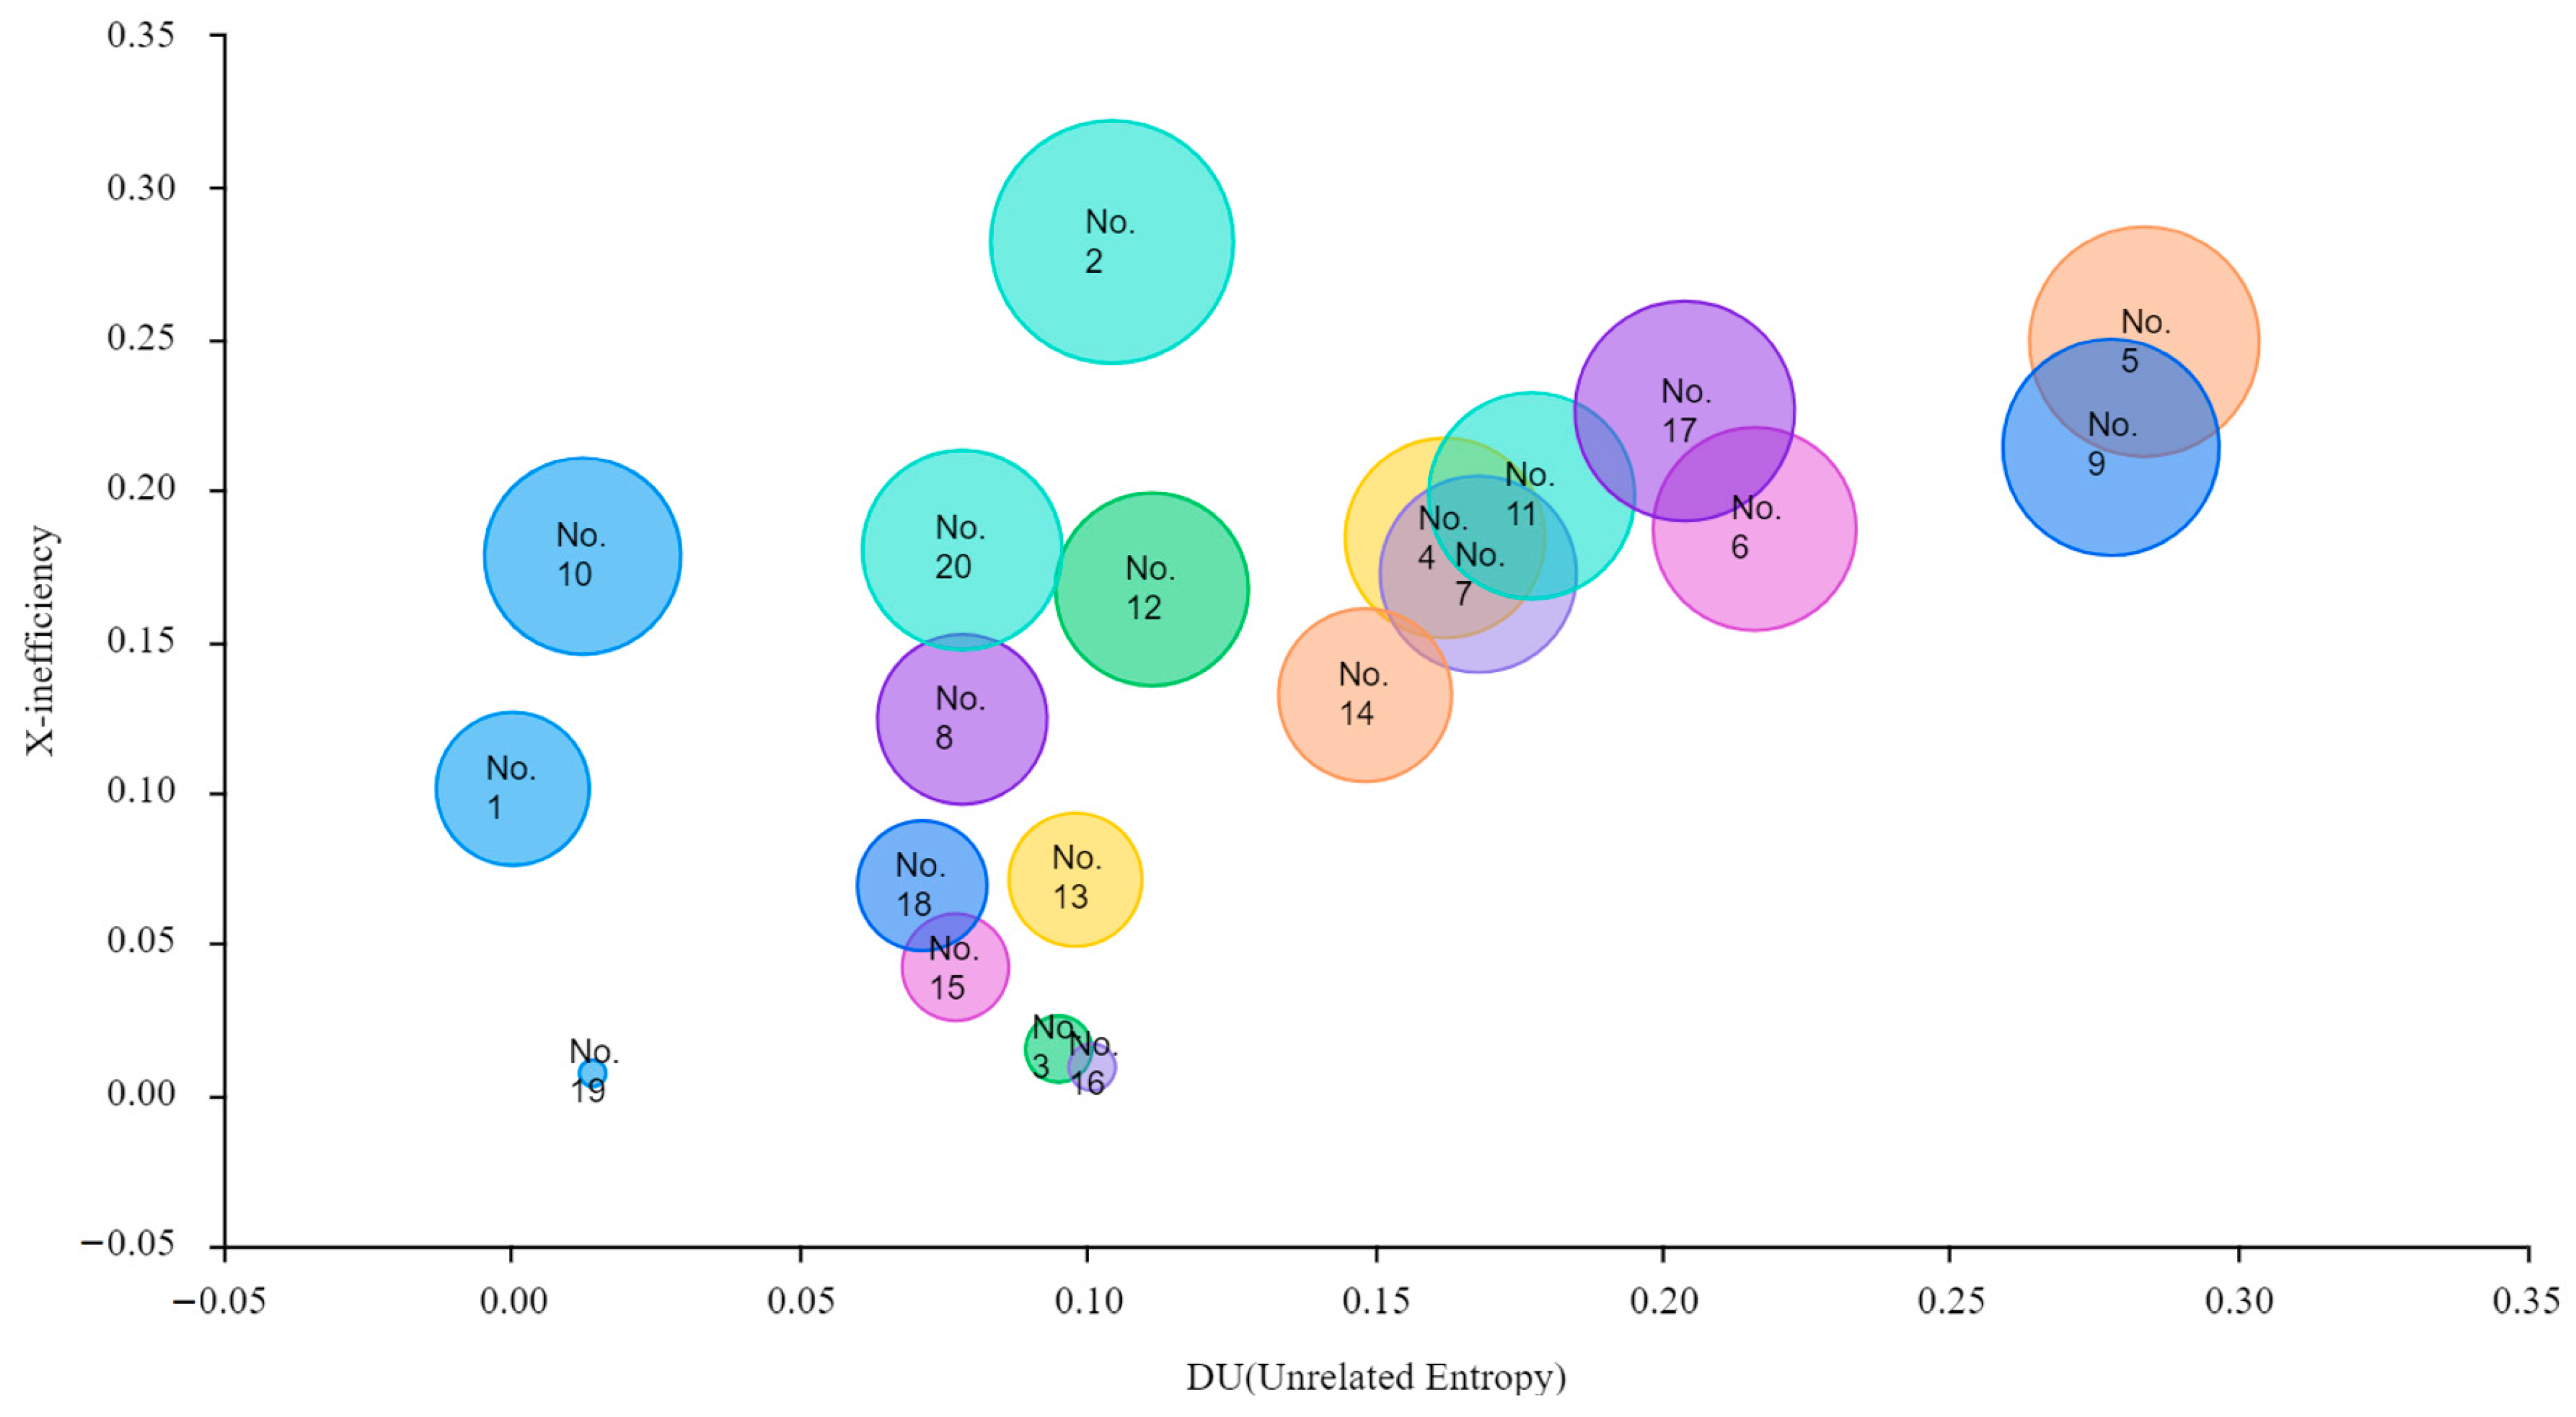
Figure 4 reveals that corporations venturing into unrelated construction sectors, such as commercial real estate, faced 18% higher X-inefficiency. Challenges included management bottlenecks, as divergent project requirements necessitated specialized expertise, and capital misallocation, where overinvestment in non-core assets eroded profitability. Company No. 5, which diversified into shopping mall development, exemplified these risks, with an efficiency score of 0.751. It diverted 38% of capital to commercial real estate without prior expertise, leading to managerial overstretch and X-inefficiency of 0.249.
The construction industry’s cyclical nature further influences diversification outcomes. While construction contracts can stabilize revenue amid fluctuating toll income, they also expose firms to economic downturns and regulatory hurdles, such as zoning laws and environmental compliance costs.
4.4. Panel (Data) Analysis
To further investigate the relationship between the impact of diversification on the economic performance of China’s listed highway companies, this paper employs panel analysis for model construction. Panel analysis is an econometric model built on top of panel data to analyze the interrelationships between variables [
37]. The regression models for the four economic performance evaluation indicators of return on total assets, return on net assets, operational income, and net profit are as follows [
46,
47]:
The results are shown in
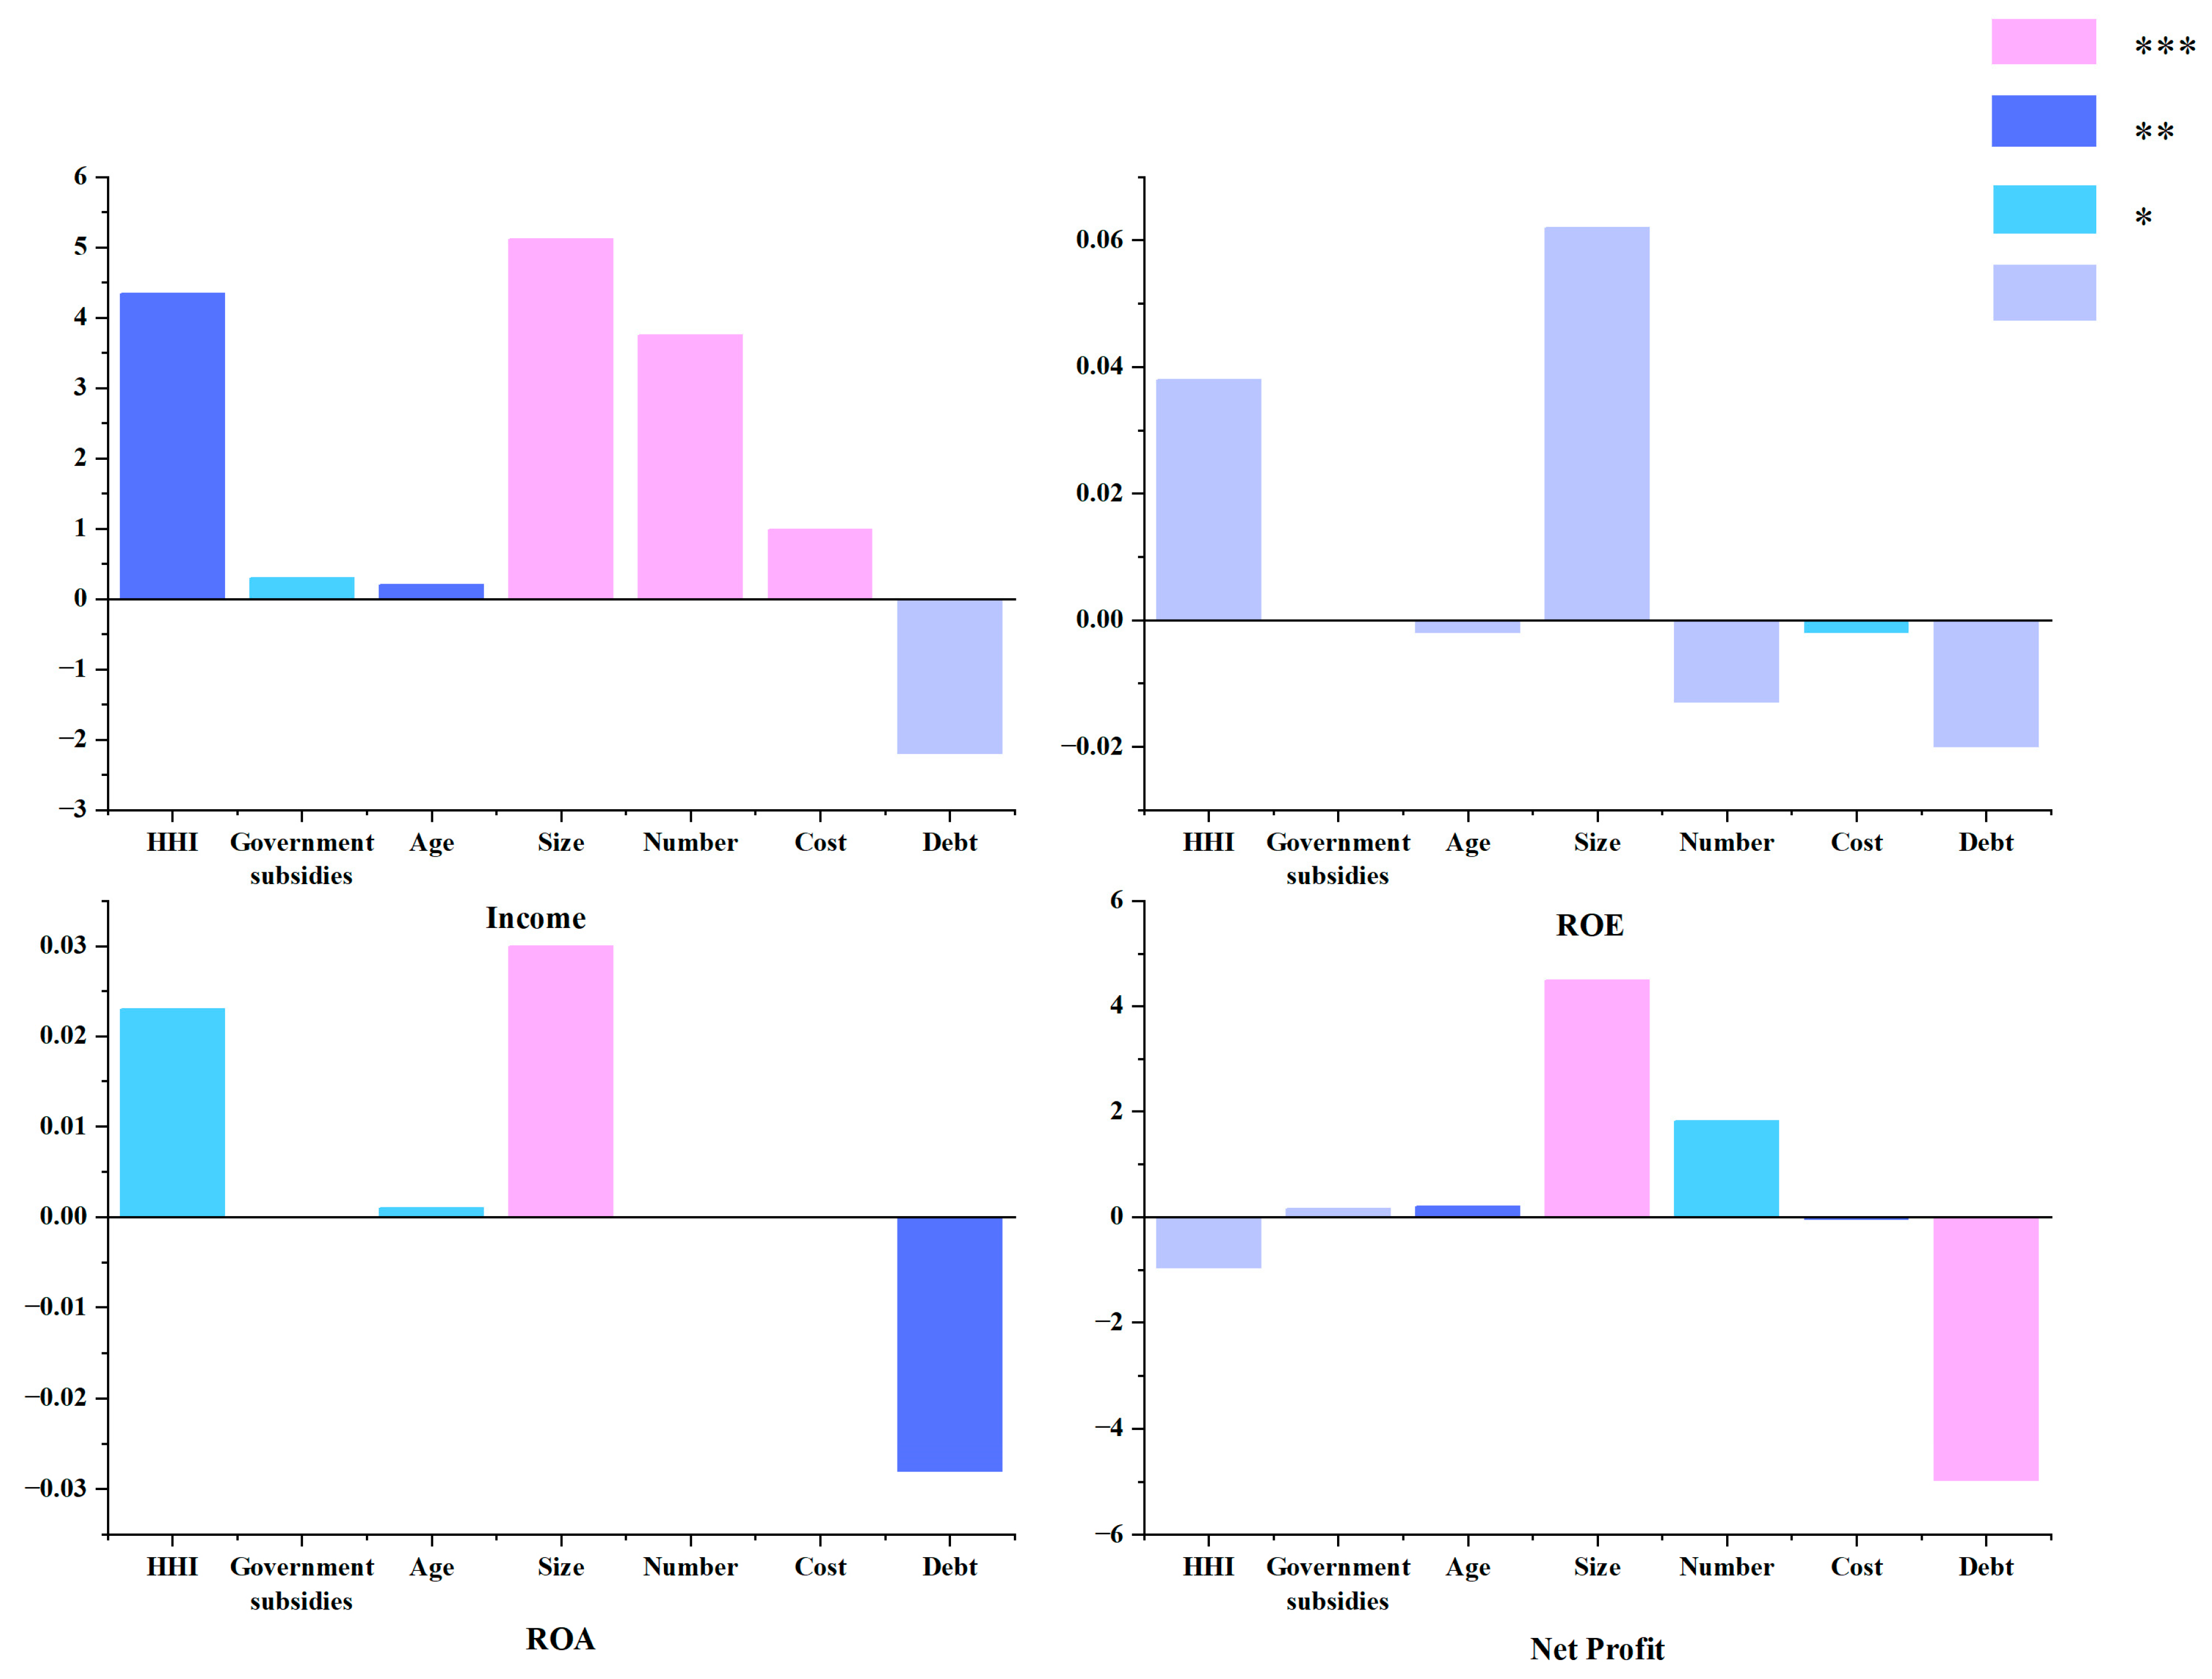
Table 5, where HHI is significant on Income and ROA at 5% and 10% levels, respectively, which indicates a significant positive correlation between them. The average marginal effect is 4.346 and 0.023, which indicates that as the degree of diversification increases, Income improves. For every 1% increase in the degree of diversification, Income grows by 4.346%, and ROA grows by 0.023%.
By observing
Figure 5, there is a positive correlation between the degree of diversification (HHI) and operating income (Income), return on equity (ROE), and return on total assets (ROA). Based on a comprehensive comparison of the significant relationship between the degree of diversification and economic performance, as well as the average marginal effect, this study suggests that the degree of diversification of listed highway companies is positively correlated with overall economic performance. That is, as the degree of diversification of listed highway companies increases, the overall economic performance also improves.
5. Discussion
The findings of this study provide compelling evidence that the construction industry represents a strategically viable diversification avenue for infrastructure corporations, particularly those operating in mature markets such as China’s highway sector. The empirical results demonstrate that related diversification—where firms expand into construction activities aligned with their core competencies (e.g., civil engineering, infrastructure maintenance)—leads to measurable improvements in operational efficiency and reductions in X-inefficiency. These outcomes align with Penrose’s theory of resource utilization, as firms effectively deploy surplus assets and expertise across synergistic business lines.
However, the study also highlights the risks associated with unrelated diversification into construction sectors such as commercial real estate or luxury housing. These ventures, while potentially lucrative, often introduce inefficiencies due to mismatched resource allocation, regulatory complexities, and managerial overextension. Existing research has shown that the institutional environment of the country or region in which a company operates has a significant impact on its development, including the implementation of diversification strategies. Generally speaking, the better the institutional environment in which a company operates, the more effective the market mechanism will be, and the more rational the company’s behavior in the business process will be. When making diversified strategic choices, it will be more in line with market requirements. As a fundamental industry of the national economy, the highway industry operates in a relatively favorable institutional environment, which provides a theoretical basis for the diversified operation of highways. From a policy perspective, the construction industry’s dual role as a stabilizer and a disruptor warrants targeted interventions. Governments can play a pivotal role by incentivizing technology adoption—such as Building Information Modeling or prefabrication—to mitigate inefficiencies. Additionally, subsidies for R&D in sustainable construction practices could further enhance the attractiveness of related diversification. For corporate leaders, the implications are clear: diversification into construction should prioritize vertical integration and capability alignment, while unrelated ventures demand rigorous risk assessment and adaptive governance structures.
6. Conclusions
This study challenges conventional assumptions about diversification in natural monopoly industries by demonstrating that the construction industry, when approached strategically, can serve as a catalyst for improved performance in infrastructure corporations. Through a robust analytical framework combining DEA-BCC modeling, entropy indices, and panel data analysis, this study quantifies the benefits of related diversification, including enhanced resource allocation and reduced X-inefficiency. Conversely, it also delineates the pitfalls of unrelated expansion, such as increased operational costs and managerial inefficiencies. The underperformance of Company No. 5 underscores this point, as its unrelated diversification strategy resulted in significant X-inefficiency. The results offer actionable insights for both corporate strategists and policymakers. For infrastructure firms, the key takeaway is the importance of aligning construction diversification with existing capabilities to maximize synergies. For policymakers, the study underscores the need for supportive measures, such as tax incentives for R&D or streamlined regulatory processes, to facilitate efficient diversification. Research has confirmed that Company No. 15 has improved efficiency through digital tools, and policy recommendations may consider providing BIM training subsidies for listed highway companies involved in the construction industry.
This study extends Penrose’s theory by quantifying how surplus resources reduce X-inefficiency under related diversification. By bridging theoretical economics with practical decision-making tools, this study contributes a replicable framework for evaluating diversification strategies in infrastructure-dependent industries, aligning with a focus on sustainable and innovative construction practices.
Future Research
Future research could add explicit examples of construction-related diversification (e.g., BIM, prefabrication) to align with the current trend of innovation in building technologies and its effects on diversification strategies from other industries. Considering the potential biases of limited sample size, future research will be extended to unlisted firms. The 5% revenue threshold for defining diversified business units may disregard high-potential emerging businesses with low current revenue shares; future research will conduct sensitivity analysis with lower thresholds (e.g., 1%). In panel analysis, external economic conditions may interact with firm-level diversification strategies, government subsidies are used as control variables, and more macroeconomic variables will be added in future research.
Author Contributions
Data curation, G.L., C.G.; Writing—original draft, H.X.; Writing—review and editing, G.L.; Methodology, H.X.; Project administration, H.X.; Software, G.L.; Formal analysis, H.X., C.G.; Investigation, G.L.; Funding acquisition, H.X.; Resources, H.X.; Conceptualization, H.X.; Supervision, H.X.; Validation, G.L.; Visualization, G.L., C.G. All authors have read and agreed to the published version of the manuscript.
Funding
This research was funded by the National Natural Science Foundation of China, No. 72541007.
Data Availability Statement
Dataset available on request from the authors: The raw data supporting the conclusions of this article will be made available by the authors on request.
Conflicts of Interest
The authors declare no conflicts of interest.
References
- Ji, Z.; Huang, Y. The Impact of Highway Infrastructure on Population Mobility: Evidence from a Sample of 800 Counties and Districts (2000–2019) in China. Sustainability 2023, 15, 14834. [Google Scholar] [CrossRef]
- Banerjee, A.; Duflo, E.; Qian, N. On the road: Access to transportation infrastructure and economic growth in China. J. Dev. Econ. 2020, 145, 102442. [Google Scholar] [CrossRef]
- Wu, S.; Deng, X. Corporate Diversification, Ownership, and Solvency in China’s Property-Liability Insurance Companies. Math. Probl. Eng. 2021, 2021, 1562771. [Google Scholar] [CrossRef]
- Xu, Y.; Fan, J.; Xu, H. Study on the operation efficiency of toll roads in China from the perspective of scale economy. J. Adv. Transp. 2021, 2021, 8830521. [Google Scholar] [CrossRef]
- Benito-Osorio, D.; Colino, A.; Guerras-Martin, L.A.; Zuniga-Vicente, J.A. The combined effects of product and geographical diversification on performance: Evidence in manufacturing SMEs. BRQ Bus. Res. Q. 2020, 23, 91–106. [Google Scholar] [CrossRef]
- Huu, T.V.; Nguyen, M.H. A Study on the Relationship Between Diversification and Firm Performance Using the GSEM Method. Emerg. Mark. Financ. Trade 2021, 57, 85–107. [Google Scholar]
- Fu, X.; Qiang, Y.; Liu, X.; Jiang, Y.; Cui, Z.; Zhang, D.; Wang, J. Will multi-industry supply chains’ resilience under the impact of COVID-19 pandemic be different? A perspective from China’s highway freight transport. Transp. Policy 2022, 118, 165–178. [Google Scholar] [CrossRef]
- Kwak, S.; Lee, S.; Kim, K.; Kim, J. Impact of Business Diversification on the Business Performance of Construction Firms in the Republic of Korea. Buildings 2025, 15, 1238. [Google Scholar] [CrossRef]
- Wang, Y.; Zhao, X.; Yu, X.; Liu, S.; Feng, M.; Tao, Y.; Yang, Q. Analysis of Development Trends and Associations in Intelligent Construction of Chinese Corporations. Buildings 2025, 15, 716. [Google Scholar] [CrossRef]
- Postali, F.A.S. Oil windfalls and X-inefficiency: Evidence from Brazil. J. Econ. Stud. 2016, 43, 699–718. [Google Scholar] [CrossRef]
- Lee, W.; Lee, K.-D. X-inefficiency and Privatization in a Mixed Duopoly. Korea World Econ. 2014, 15, 309–328. [Google Scholar]
- Smyth, A. Competition, Cost Innovation, and X-inefficiency in Experimental Markets. Rev. Ind. Organ. 2016, 48, 307–331. [Google Scholar] [CrossRef]
- Ma, H.; Zeng, S.; Shen, G.Q.; Lin, H.; Chen, H. International diversification and corporate social responsibility: An empirical study of Chinese contractors. Manag. Decis. 2016, 54, 750–774. [Google Scholar] [CrossRef]
- Penrose, E.T. The Theory of the Growth of the Firm; Oxford University Press: Oxford, UK, 2009. [Google Scholar]
- Wang, Y.; Jin, X. Structural risk of diversified project financing of city investment company in China based on the best worst method. Eng. Constr. Archit. Manag. 2021, 28, 196–215. [Google Scholar] [CrossRef]
- Ljubownikow, G.; Ang, S.H. Competition, diversification and performance. J. Bus. Res. 2020, 112, 81–94. [Google Scholar] [CrossRef]
- Nigam, N.K.; Gupta, C.P. Negative Related Diversification, Positive Related Diversification and Firm’s Performance: Measurement and Application. Glob. Bus. Rev. 2023, 24, 48–67. [Google Scholar] [CrossRef]
- Feng, M.; Wang, T. Enhancing digital transformation: Exploring the role of supply chain diversification and dynamic capabilities in Chinese companies. Ind. Manag. Data Syst. 2024, 124, 2467–2496. [Google Scholar] [CrossRef]
- Tien, N.H.; Ngoc, N.M. Related and Non-related Diversification Strategy of Domestic Business Groups in Vietnam. Int. J. Adv. Res. Eng. Manag. 2019, 5, 12–17. [Google Scholar]
- Arte, P.; Larimo, J. Moderating influence of product diversification on the international diversification-performance relationship: A meta-analysis. J. Bus. Res. 2022, 139, 1408–1423. [Google Scholar] [CrossRef]
- Andersen, T.A.; Ansoff, H.I.; Norton, F.; Weston, J.F. Planning for diversification through merger. Calif. Manag. Rev. 1959, 1, 24–35. [Google Scholar] [CrossRef]
- Fatmawati, V.A.; Hariyana, N. The Effect of Product Diversification and Company Size on Company Profitability Case Study on UD Setya Abadi DM. Integr. J. Soc. Sci. Cult. 2024, 2, 203–209. [Google Scholar]
- Rumelt, R.P. Diversification strategy and profitability. Strateg. Manag. J. 1982, 3, 359–369. [Google Scholar] [CrossRef]
- Jang, Y.; Kwon, N.; Ahn, Y. International diversification and performance of construction companies: Moderating effect of regional, product, and industry diversifications. J. Manag. Eng. 2019, 35, 04019015. [Google Scholar] [CrossRef]
- Lee, S.; Tae, S.; Yoo, S.; Shin, S. Impact of business portfolio diversification on construction company insolvency in Korea. J. Manag. Eng. 2016, 32, 05016003. [Google Scholar] [CrossRef]
- Raudszus, M.; Schiereck, D.; Trillig, J. Does vertical diversification create superior value? Evidence from the construction industry. Rev. Manag. Sci. 2014, 8, 293–325. [Google Scholar] [CrossRef]
- Ndung, U.; Wanjira, G. Adoption of Diversification Strategies and the Perfomance of State Owned Sugar Firms in Western Region in Kenya. Ph.D. Thesis, MMUST, Kakamega, Kenya, 2019. [Google Scholar]
- Zou, C.; Yu, Q.; Liu, D. Impact of Diversification on Enterprises Innovation. In Proceedings of the WHICEB, Wuhan, China, 26–28 May 2017. [Google Scholar]
- Kumar, M.S. The costs of related diversification: The impact of the core business on the productivity of related segments. Organ. Sci. 2013, 24, 1827–1846. [Google Scholar] [CrossRef]
- Yin, Y. An Empirical Study on the Polyglotization of Large Chinese Firms—Comparative Analysis with Large U.S. Firms. J. Ind. Eng. Eng. Manag. 1998, 1998, 3–14. [Google Scholar]
- Mirzaee, A.M.; Martek, I. Improving project management “closeout” phase outcomes: Evidence from a large general contractor in Iran using “X-inefficiency theory”. Eng. Constr. Archit. Manag. 2024. [Google Scholar] [CrossRef]
- Sickles, R.C.; Zelenyuk, V. Measurement of Productivity and Efficiency; Cambridge University Press: Cambridge, UK, 2019. [Google Scholar]
- Battese, G.E.; Coelli, T.J. A model for technical inefficiency effects in a stochastic frontier production function for panel data. Empir. Econ. 1995, 20, 325–332. [Google Scholar] [CrossRef]
- Australia; Steering Committee for the Review of Commonwealth/State Service Provision; Scales, B. Data Envelopment Analysis: A Technique for Measuring the Efficiency of Government Service Delivery; Industry Commission: Parramatta, NSW, Australia, 1997. [Google Scholar]
- Feng, Y.; Yao, S.; Wang, C.; Liao, J.; Cheng, F. Diversification and financialization of non-financial corporations: Evidence from China. Emerg. Mark. Rev. 2022, 50, 100834. [Google Scholar] [CrossRef]
- Solarin, S.A. Convergence of tourism market diversification: Evidence from a new indicator based on Herfindahl–Hirschman index. Qual. Quant. 2025, 59, 663–681. [Google Scholar] [CrossRef]
- Rhoades, S.A. The herfindahl-hirschman index. Fed. Res. Bull. 1993, 79, 188. [Google Scholar]
- Jacquemin, A.P.; Berry, C.H. Entropy measure of diversification and corporate growth. J. Ind. Econ. 1979, 27, 359–369. [Google Scholar] [CrossRef]
- Dharmasena, T.; Nanayakkara, N.S. The Impact of Entropy Index as a Measure of Diversification Strategy on Firm Performance during Covid-19 Pandemic: Evidence from DIMO PLC. In Proceedings of the 19th International Conference on Business Management (ICBM), Colombo, Sri Lanka, 8–9 December 2022. [Google Scholar]
- Du, X.; Wan, B.; Long, W.; Xue, H. Evaluation of Manufacturing Innovation Performance in Wuhan City Circle Based on DEA-BCC Model and DEA-Malmquist Index Method. Discret. Dyn. Nat. Soc. 2022, 2022, 2989706. [Google Scholar] [CrossRef]
- Peykani, P.; Mohammadi, E.; Saen, R.F.; Sadjadi, S.J.; Rostamy-Malkhalifeh, M. Data envelopment analysis and robust optimization: A review. Expert Syst. 2020, 37, e12534. [Google Scholar] [CrossRef]
- Georgiou, A.C.; Kaparis, K.; Vretta, E.-M.; Bitsis, K.; Paltayian, G. A Bilevel DEA Model for Efficiency Evaluation and Target Setting with Stochastic Conditions. Mathematics 2024, 12, 529. [Google Scholar] [CrossRef]
- Charnes, A.; Cooper, W.W.; Rhodes, E. Measuring the efficiency of decision making units. Eur. J. Oper. Res. 1978, 2, 429–444. [Google Scholar] [CrossRef]
- Tong, S. Some implications of x-efficiency theory for the role of managerial quality as a key determinant of firm performance and productivity. In Handbook of Research Methods in Behavioural Economics; Edward Elgar Publishing: Cheltenham, UK, 2023; pp. 172–189. [Google Scholar]
- Qian, J.; Chen, H. Analysis of National Highway Transportation Efficiency Based on DEA Analysis. Build. Mater. Dev. Dir. 2022, 20, 97–100. [Google Scholar]
- Liu, H.; Wong, W.K.; Cong, P.T.; Nassani, A.A.; Haffar, M.; Abu-Rumman, A. Linkage among Urbanization, energy Consumption, economic growth and carbon Emissions. Panel data analysis for China using ARDL model. Fuel 2023, 332, 126122. [Google Scholar] [CrossRef]
- Yang, S.; Yang, X.; Wang, X. Estimation and Simultaneous Confidence Bands for Fixed-Effects Panel Data Partially Linear Models. Mathematics 2024, 12, 3774. [Google Scholar] [CrossRef]
| Disclaimer/Publisher’s Note: The statements, opinions and data contained in all publications are solely those of the individual author(s) and contributor(s) and not of MDPI and/or the editor(s). MDPI and/or the editor(s) disclaim responsibility for any injury to people or property resulting from any ideas, methods, instructions or products referred to in the content. |
© 2025 by the authors. Licensee MDPI, Basel, Switzerland. This article is an open access article distributed under the terms and conditions of the Creative Commons Attribution (CC BY) license (https://creativecommons.org/licenses/by/4.0/).


