Article

Evolution Method of Built Environment Spatial Quality in Historic Districts Based on Spatiotemporal Street View: A Case Study of Tianjin Wudadao

School of Surveying, Mapping and Urban Spatial Information, Beijing University of Civil Engineering and Architecture, Beijing 102616, China
*
Author to whom correspondence should be addressed.
Buildings 2025, 15(11), 1953; https://doi.org/10.3390/buildings15111953
Submission received: 6 May 2025 / Revised: 23 May 2025 / Accepted: 2 June 2025 / Published: 4 June 2025

Abstract

With the accelerating pace of urbanization, historic districts are increasingly confronted with the dual challenge of coordinating heritage preservation and sustainable development. This study proposes an intelligent evaluation framework that integrates spatiotemporal street view imagery, affective perception modeling, and scene recognition to reveal the evolutionary dynamics of built environment spatial quality in historic districts. Empirical analysis based on multi-temporal data (2013–2020) from the Wudadao Historic District in Tianjin demonstrates that spatial quality is shaped by a complex interplay of factors, including planning and preservation policies, landscape greening, pedestrian-oriented design, infrastructure adequacy, and equitable resource allocation. These findings validate the framework’s effectiveness as a tool for monitoring urban sustainability. Moreover, it provides actionable insights for the development of resilient, equitable, and culturally vibrant built environments, effectively bridging the gap between technological innovation and sustainable governance in the context of historic districts.

1. Introduction

With the acceleration of global urbanization, historic districts, as the core carriers of urban cultural identity and public spaces for residents, have become a key topic in urban planning [1]. The dynamic evolution mechanism of their spatial quality and its impact on urban sustainable development has attracted increasing attention. However, existing research primarily focuses on the evaluation of static spatial attributes (such as greenery coverage and building density) [2,3]. This limitation is particularly prominent in the study of historic districts, where the spatial quality not only involves the update of the built environment but also requires balancing the complex relationship between cultural heritage preservation, tourism development, and the needs of local residents [4].
Traditional spatial quality evaluation methods (such as surveys and field observations) have significant limitations in terms of coverage and temporal continuity [5]. In recent years, street view images have gradually become an important data source for urban spatial analysis due to their high resolution, spatiotemporal traceability, and potential for emotion perception. In the tradition of emotion perception, the term generally refers to the ability to recognize, distinguish, and interpret emotional information in the environment through various cues such as facial expressions, body language, and contextual factors. With the advancement of research, the emotion perception of streetscapes has come to refer specifically to a method for assessing the emotional quality or the built environment quality of urban street spaces through street view imagery [6]. Existing studies have validated its effectiveness in areas such as vegetation monitoring and street safety assessment [7,8]. However, there are still three main shortcomings in the research on historic districts: (1) Lack of dynamism: Most studies are based on street view images from a single time point, lacking the long-term tracking of spatial quality evolution; (2) Limited emotional dimensions: Emotion perception models often focus on single dimensions such as safety and esthetics, neglecting the compound effects of negative emotions such as oppression and boredom on spatial quality; (3) Insufficient mechanism explanation: The separation between scene recognition and emotion analysis makes it difficult to interpret the driving factors behind changes in the built environment’s spatial quality [9,10].
To address the aforementioned research gaps, this paper proposes a dynamic spatial quality evaluation framework that integrates spatiotemporal street view images, an emotion perception model, RSS-CNN (Ranking Streetscore Convolutional Neural Network), and scene recognition technology (Places365-ResNet) in the historic districts, and validates this framework with Tianjin’s Five Avenues as a case study. By constructing a multi-stage street view dataset from 2013 to 2020, this study systematically explores the following scientific questions:
How can the spatiotemporal differentiation characteristics of spatial quality in historic districts be quantified?
What patterns emerge in the spatial quality evolution during different planning stages?
What are the key driving factors affecting the dynamic changes in spatial quality?
This study achieves three breakthroughs at the methodological level:
(1) It proposes a dynamic emotion perception model to evaluate the built environment spatial quality for historic districts based on temporal street view imagery.
(2) It constructs an “emotion–scene” coupling analysis framework to elucidate the evolutionary mechanisms of spatial quality in historic districts.
(3) It validates the differentiated intervention effects of policy texts on the spatial quality of historic districts.
This paper is divided into six chapters: Section 1 explains the research background and problems; Section 2 reviews the research progress in spatial quality evaluation and street view image analysis; Section 3 details the research methods and technical approach; Section 4 introduces the case study area and data sources; Section 5 presents the results of spatiotemporal evolution and driving factor analysis; Section 6 summarizes the research conclusions and proposes planning recommendations.

2. Related Work

2.1. Definition and Dynamic Evaluation of Built Environmental Framework Quality for Historic Districts

Spatial quality is a core indicator for measuring the functionality and humanity of urban environments. Its connotation has evolved from early static physical attributes (such as street width and greenery coverage) to more dynamic and multifaceted factors [11]. It has gradually expanded to include a multidimensional dynamic concept encompassing cultural atmosphere and emotional experience [12]. Kevin Lynch, in The Image of the City, pointed out that the essence of spatial quality lies in “the perception and interaction of people with their environment”, emphasizing its subjectivity and time dependence [13]. In recent years, scholars have attempted to capture the evolutionary characteristics of spatial quality through dynamic data (such as social media and mobile trajectories) [14]. For example, H. Zhou et al. used street view images and social media data to construct a dynamic evaluation model of urban visual perception equity [15]. However, existing studies primarily focus on modern commercial districts, lacking targeted research on historic districts, a special type of area [16]. The spatial quality of historic districts not only involves physical environment updates but also requires balancing the conflict between cultural heritage preservation and tourism development [17]. This gap urgently needs to be addressed.

2.2. The Potential and Limitations of Street View Images in Built Environment Spatial Quality

With its high resolution and spatiotemporal traceability, street view imagery has become an important data source for built environment spatial quality evaluation [18]. Biljecki, Filip, and Koichi Ito provided a systematic review of the applications of street view images in areas such as vegetation monitoring and traffic studies, demonstrating that they can effectively quantify the physical characteristics of street environments [6]. L. He et al. further used semantic segmentation models to reveal the correlation between street view elements (such as green visibility and building façade continuity) and socio-economic indicators (such as housing prices and crime rates) [19]. However, existing research has two main limitations:
Lack of temporal dimension: Most analyses are based on street view images from a single point in time, making it difficult to reveal the dynamic evolution patterns of urban spaces [20].
Single emotional dimension: Emotional perception models often focus on positive dimensions such as safety and esthetics, neglecting the complex impacts of negative emotions like oppression and boredom [21].

2.3. The Integration Progress of Deep Learning and Emotional Perception Models for Evaluation the Built Environment Spatial Quality

Deep learning technology provides powerful tools for the automated analysis of street view images [22]. Scene recognition models like Places365-ResNet, through training on massive datasets of images, can accurately classify street view functions (such as residential areas, commercial streets) [23]. Emotional perception models like Ranking Streetscore-CNN, through pairwise comparison learning, quantify the public’s emotional feedback on the spatial environment (such as vitality and oppression) [24]. Recent studies have attempted to combine both types of models. For example, Liang et al., through time series street view images, tracked the ten-year evolution of visual clusters in Singapore’s streets and found a trend of high-density visual experience zones spreading to emerging towns [9]. However, such studies mainly focus on modern cities and have not deeply analyzed the underlying mechanisms of emotional evolution in historic districts (such as the impact of cultural heritage preservation on the perception of beauty). Additionally, they lack a verification of the correlation between policy interventions and spatial quality [25].

2.4. The Built Environment Spatial Quality Research in Historic Districts

The evolution of spatial quality in historic districts has unique cultural and social attributes [26]. X. Zhu and S.-C. Chiou pointed out that the preservation of historic districts requires balancing “authenticity” and “functionality”, with excessive commercialization, potentially weakening their cultural identity [27]. Baloch et al. proposed a framework for sustainable ecotourism development, using surveys and hierarchical regression analysis. They found that tourism development brought socio-economic benefits but also led to the degradation of the natural environment and increased social environmental vulnerability. They proposed a framework for balancing commercial interests with environmental protection [28]. However, existing research still faces methodological limitations:
Insufficient data granularity: Relying on surveys or small sample street views makes it difficult to cover long-term, large-scale spatial changes [29];
Mechanistic explanation weakness: The separation between emotion perception and scene recognition models results in an inability to interpret the driving factors (e.g., how policy documents influence emotional scores through specific scene renovations).
In summary, this study uses the Tianjin Five Avenues Historic District as a case to develop a dynamic evaluation framework that integrates temporal street view imagery, emotion and scene recognition models, and policy text analysis. The research employs a multi-stage street view dataset (2013–2020) to uncover temporal changes in the spatial quality of historic districts, expands the evaluation by incorporating negative emotions such as oppression and boredom, and clarifies how planning interventions drive spatial quality evolution by combining scene recognition with policy analysis.

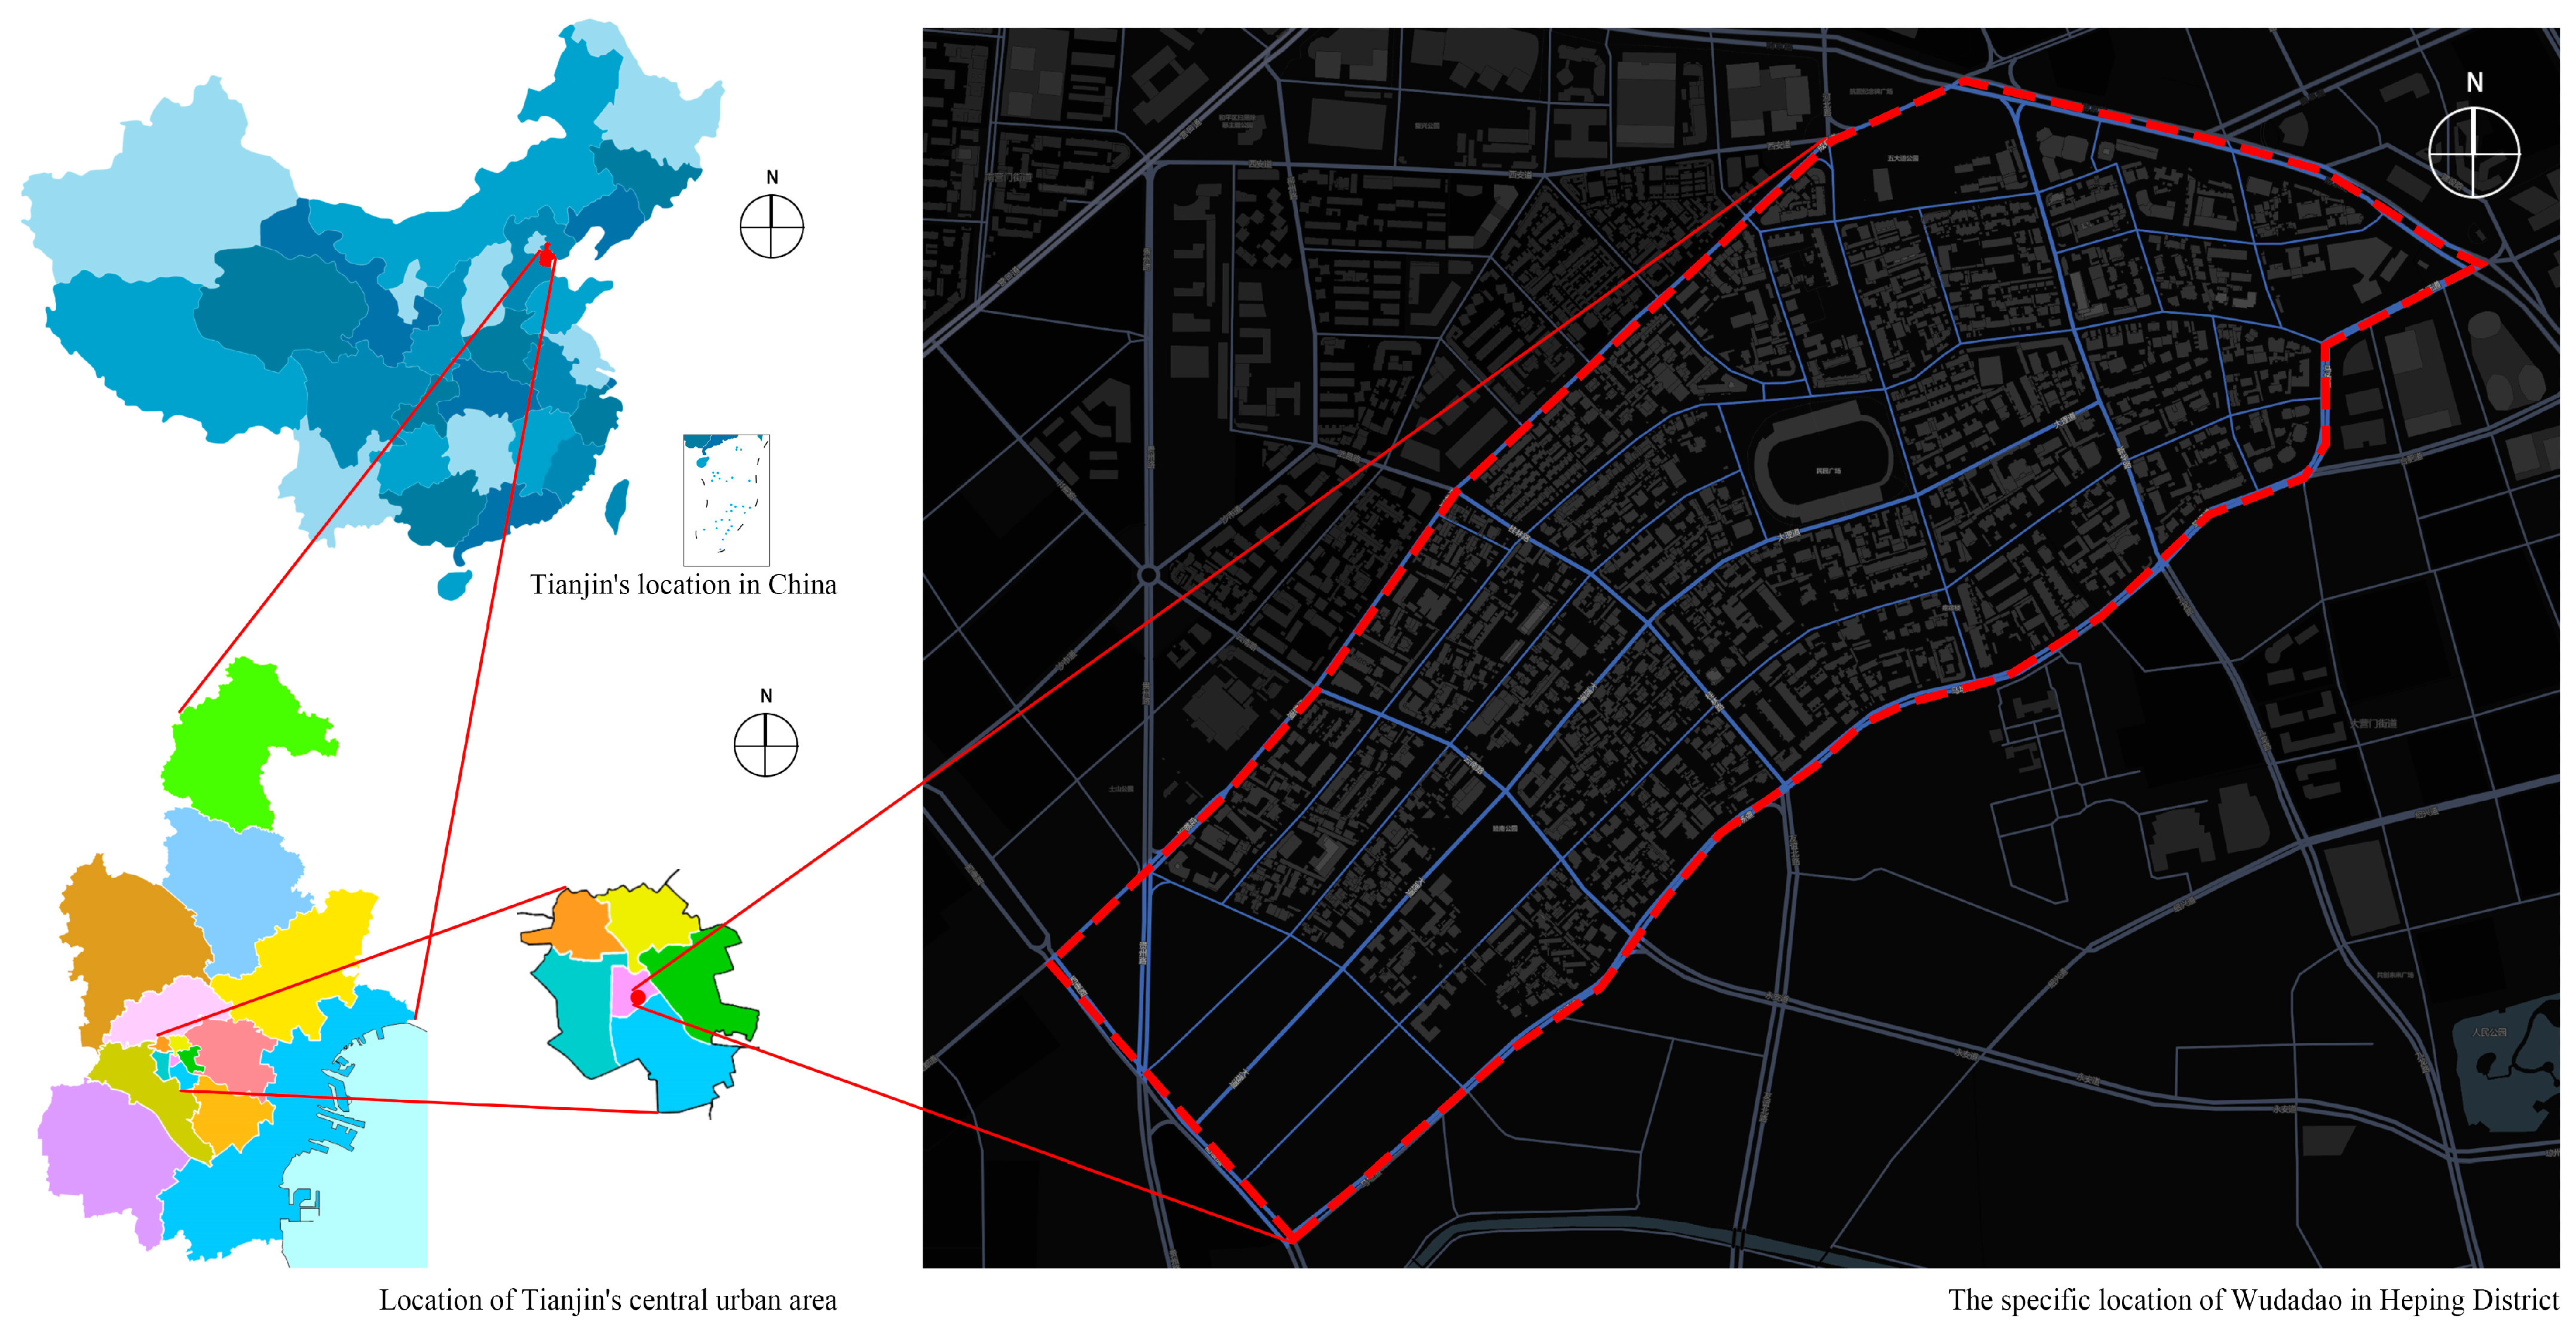
3. Experimental Area

3.1. Experimental Area Overview

Tianjin’s Five Avenues, located in the Heping District, is an integral part of the city’s historic and cultural heritage (Figure 1). Its origins date back to the late 19th and early 20th centuries, when it became a treaty port, attracting consular institutions and immigrants from multiple countries, including the UK, France, Italy, Germany, and Spain. This area developed a multicultural urban landscape [30]. The Five Avenues are famous for their diverse architectural styles, including British Victorian, French eclecticism, Italian Renaissance, German modernism, and Spanish Baroque, primarily composed of terraced houses and villas. The structures are solid and finely decorated, reflecting the blend of Western architectural techniques and Eastern lifestyles.
The Five Avenues have not only been witness to the historical development of Tianjin but also serve as an important platform for Sino-foreign cultural exchange. It was once home to numerous foreign diplomats, merchants, and intellectuals, fostering rich cultural activities and social interactions. Today, it is a key tourist destination, attracting a large number of domestic and international visitors. Through the conversion of historical buildings into boutique hotels, cafes, and art galleries, the Five Avenues have achieved an organic integration of heritage protection and modern development. Government and related institutions ensure the preservation of its historical value, setting a benchmark for urban cultural heritage protection [31].

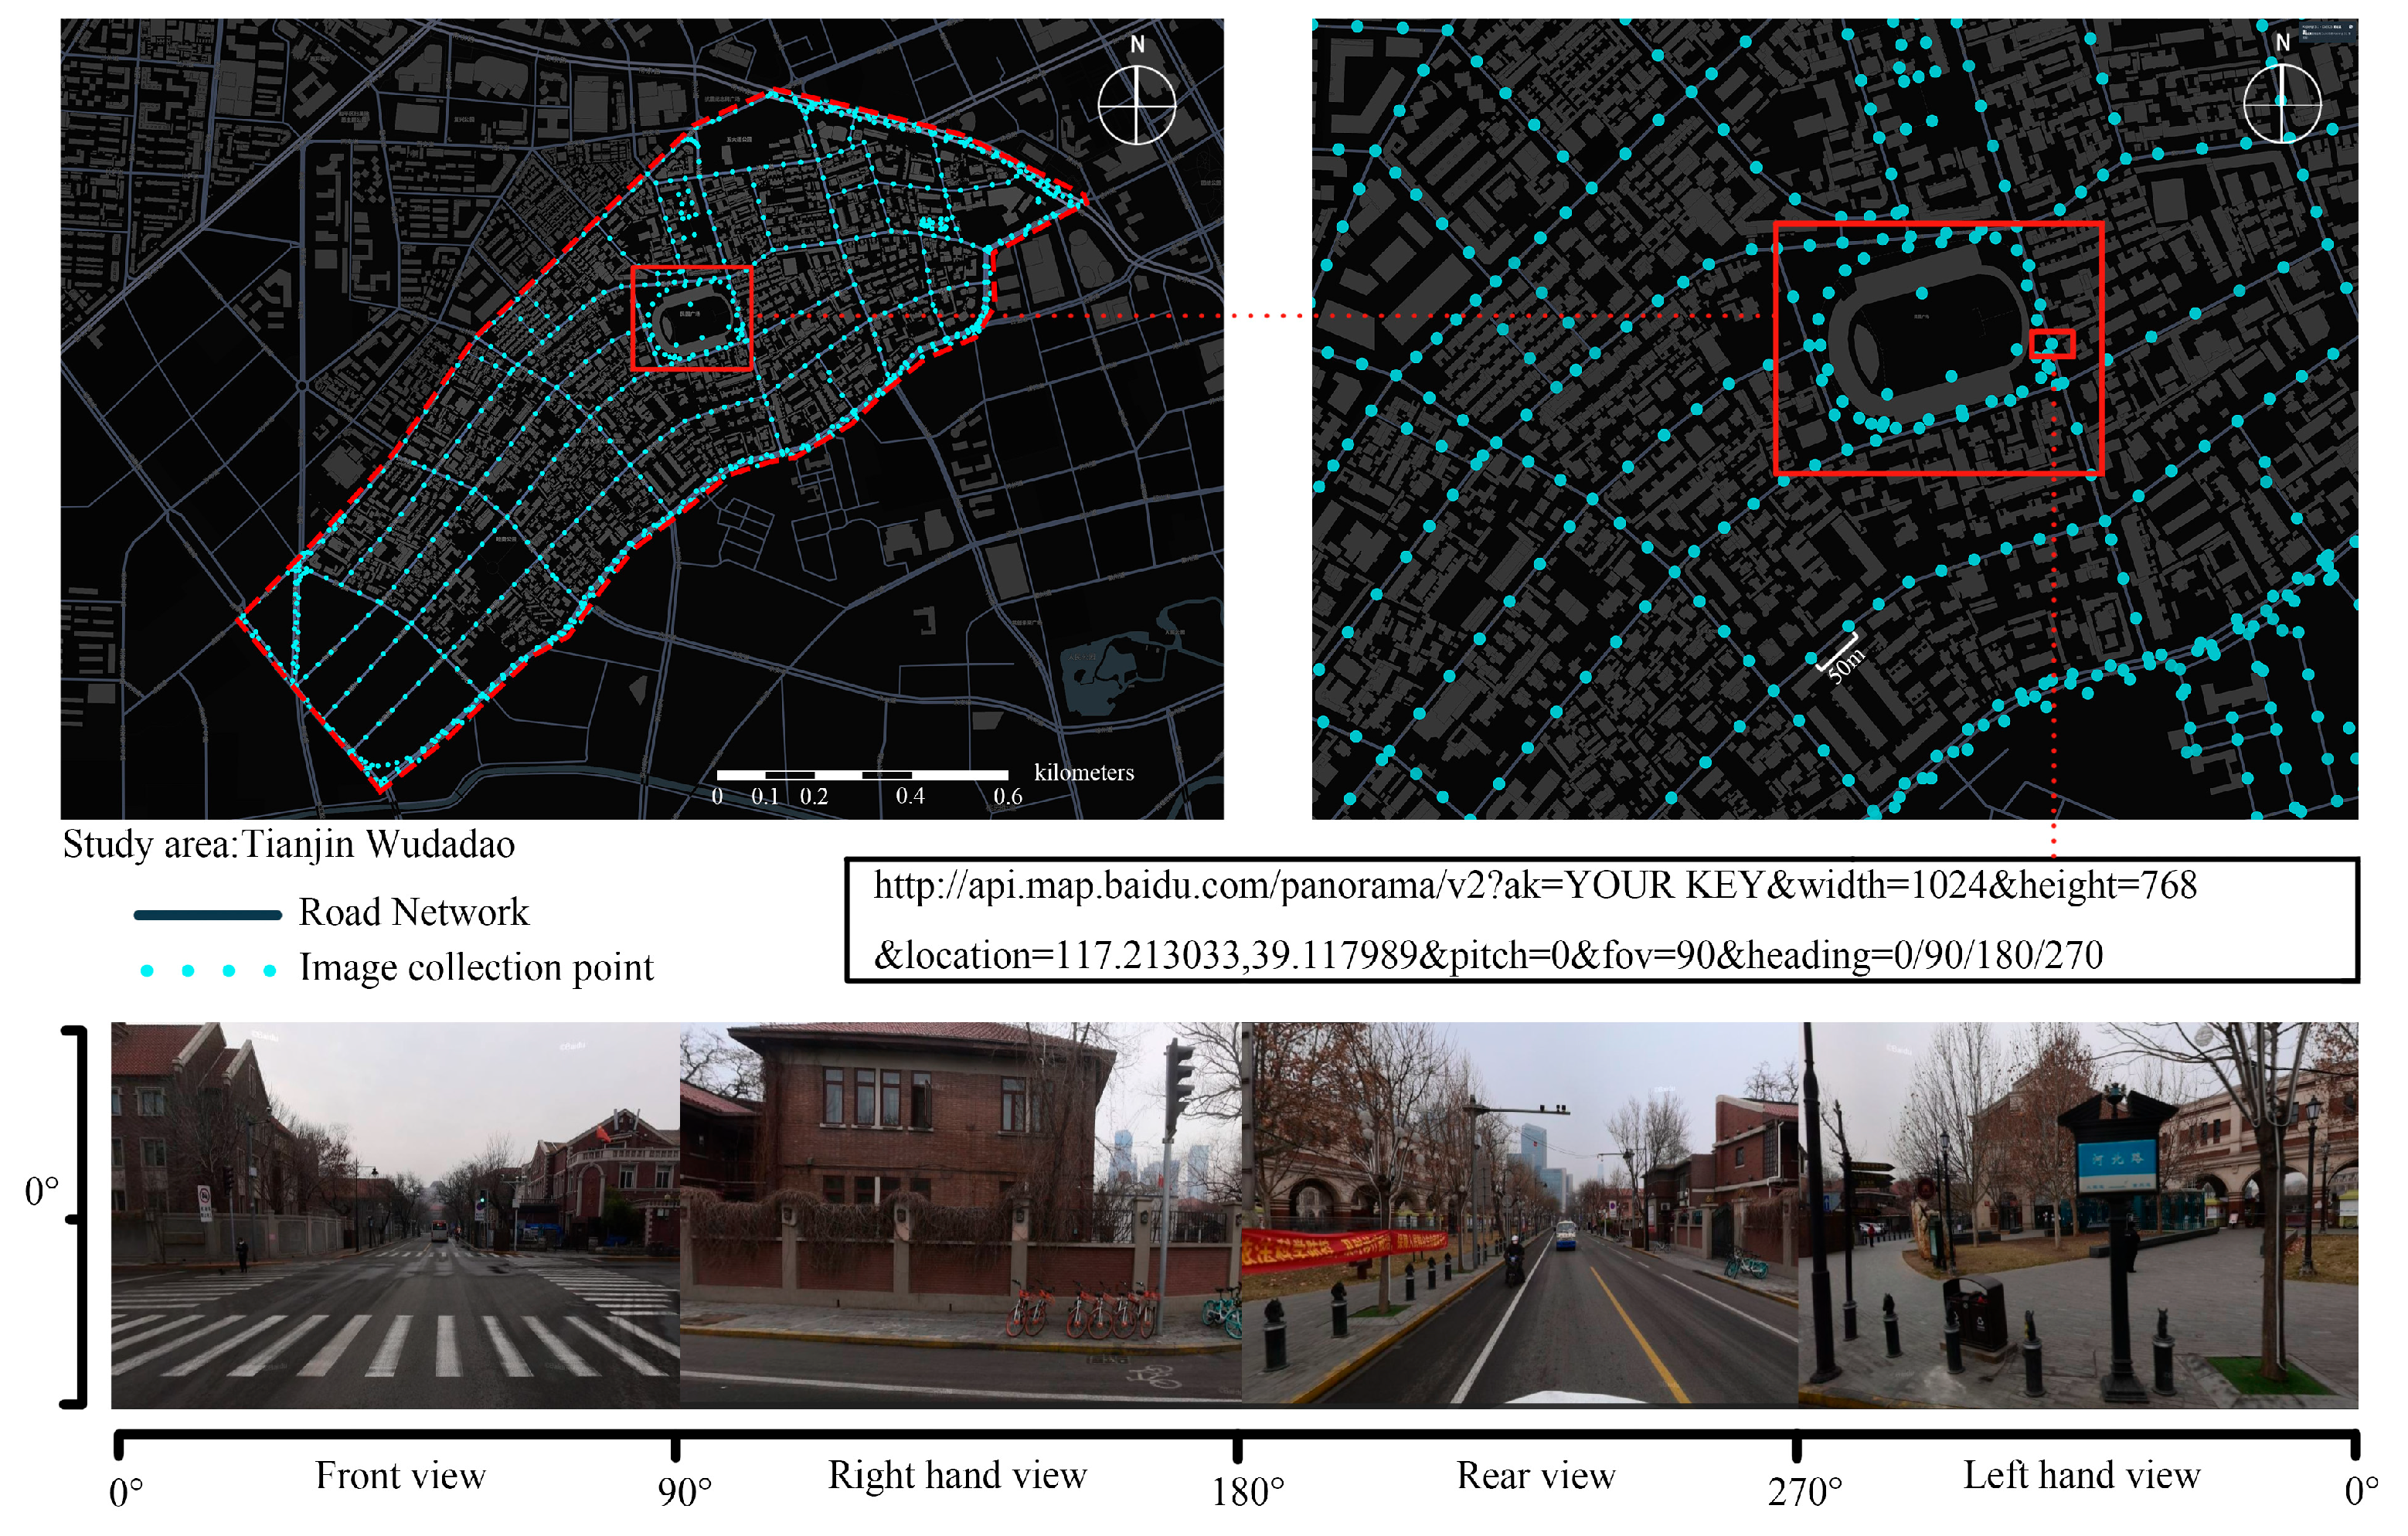
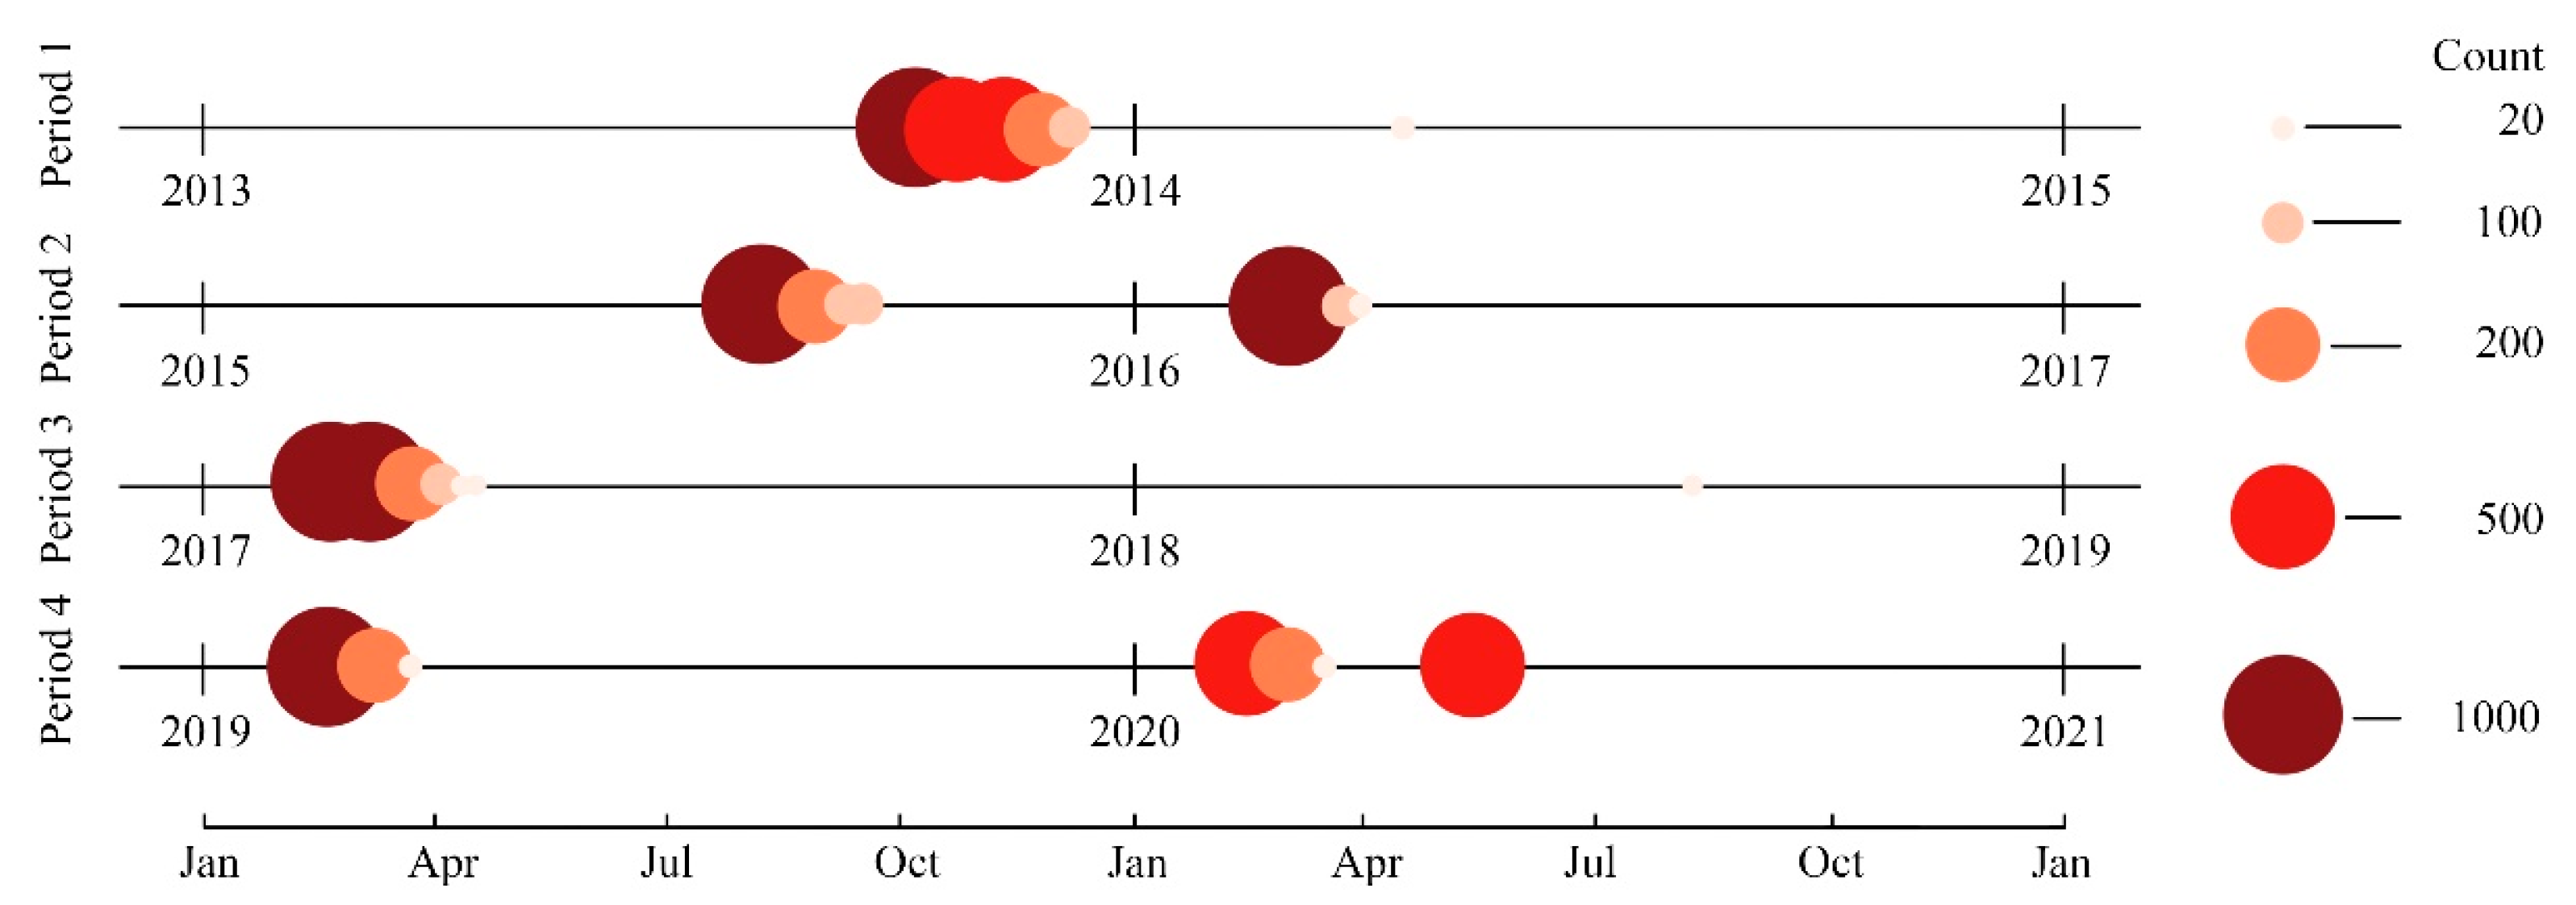
3.2. Data Collection Method

In this study, we initially obtained vector data of the Wudadao historic district from the OpenStreetMap platform and used QGIS software to extract road network data. Subsequently, we imported the data into ARCGIS software and performed coordinate projection transformation to ensure spatial consistency and accuracy. We then selected sampling points along the road network at 50 m intervals, which served as the locations for street view data collection (Figure 2).
Street view imagery was gathered using the Baidu Maps API from four distinct angles (0°, 90°, 180°, and 270°), with the pitch angle set to 0° to closely approximate the pedestrian’s perspective. This adjustment minimizes experimental error and enhances the realism of the street view data collection [32]. This approach enabled the collection of street view images from the same set of coordinates within the study area across different years, facilitating the tracking of the spatial quality evolution of the Wudadao historic district over time.
However, due to the limitations in the frequency of street view image collection on Baidu Maps, the volume of street view data collected each year was not consistent. The specific data collection results for the Wudadao historic district are as follows: 2310 images in 2013, 30 images in 2014, 1397 images in 2015, 1162 images in 2016, 2393 images in 2017, 24 images in 2018, 1210 images in 2019, and 1254 images in 2020 (Figure 3).
Given the variation in the number of street view images collected, we took into account the average distribution of data and the reasonableness of the annual intervals. Consequently, we divided the data into four phases: the first phase (2013–2014), the second phase (2015–2016), the third phase (2017–2018), and the fourth phase (2019–2020).

4. Evaluation Model for the Built Environment Spatial Quality in Historic Districts

4.1. Principle of the Method

Based on the street view images collected in Section 3.2, this study employs the affective perception model (Ranking SS-CNN) to quantitatively assess spatial quality within the research area. Leveraging the temporal characteristics of the street view images, the model identifies trends in spatial quality across different periods and highlights areas exhibiting significant feature changes. Furthermore, by integrating a scene recognition model (Places365-ResNet), we classify the scenes within these areas of pronounced change to pinpoint the specific factors influencing spatial quality evolution. The detailed experimental procedure is illustrated in Figure 4.

4.2. Emotion Perception Model for Evaluation the Built Environment Spatial Quality

We use the Ranking Streetscore-CNN (RSS-CNN) as the basic emotional perception model for evaluating the built environment spatial quality. The Ranking Streetscore-CNN (RSS-CNN) neural network model is derived from the Place Pulse 2.0 (PP 2.0) project developed by the MIT Media Lab. It evaluates six emotional dimensions of urban space quality through the comparison of city street images: safety, lively, boring, wealthy, depressing, and beautiful. The model does not explicitly define or standardize the physical characteristics corresponding to each perceptual attribute—such as safety, lively, boring, wealthy, depressing, and beautiful—in the study. The deep learning model (RSS-CNN) enables the neural network to directly learn the underlying visual patterns behind human perception from comparative image data. During training, the network automatically extracts visual features associated with perceptual attributes, which may include (but are not limited to) the following: the appearance and maintenance of buildings, the cleanliness or clutter of streets, population density and street-level activity, greenery coverage and natural elements, and visual esthetics such as lighting brightness and color saturation. All these features were manually labeled through subjective evaluation as a pre-labeled training dataset, and then classified into emotional categories (e.g., beautiful, boring, depressing, lively, safety, wealthy) using the model of RSS-CNN (Ranking Streetscore Convolutional Neural Network). Data collection is achieved through a crowdsourced online game, wherein participants engage in pairwise comparisons of urban street view images. The dataset comprises 110,988 images from 56 cities and includes 1,170,000 paired comparisons provided by 81,630 online volunteers. Specifically, users are randomly presented with two Google Street View images and asked questions such as “Which place looks safer?” or “Which place looks more lively?”. The strength of the model lies in its use of a large-scale, globally diverse dataset, which captures a wide range of visual contexts and enables the identification of patterns in universal human perception [24].
RSS-CNN consists of two main components: a dual feature extractor and a ranking subnetwork. The network learns image ranking through fully connected layers. The model training combines classification loss (for binary classification) and ranking loss (for sorting images within the entire dataset), which significantly enhances prediction accuracy. The function formulas for the classification loss (Lc) and ranking loss (Lr) are as follows (1) and (2).
L c = i , j , y P k K 1 y = k log g k x i , x j
L r = i , j , y P ( max 0 , y f r x j f r x i ) 2
In this context, { x i } i = 1 m represents the image pixel space of m images, and { i k , j k , y k } k = 1 N denotes a series of N image comparison triplets, where i , j 1 , , m , y + 1 , 1 . These triplets specify a pairwise comparison between image i   and image j with y = +1 indicating that image i wins, and y = −1 indicating that image j wins. The model’s objective is to learn a ranking function f r x i based on the raw image pixels, as shown in Equation (3), that satisfies the maximum number of constraint conditions.
y f r x i f r x j > 0   i , j , y P
At the same time, the loss function L   is minimized, which is a weighted combination of the classification (or softmax) loss (Lc) and the ranking loss (Lr) expressed as L = Lc(P) + λLr(P), P = i K , j K , y K , k = 1 N . P refers to the set of all comparison relations between image pairs in the training set. The hyperparameter λ is set through grid search on the validation set to maximize classification accuracy.

4.3. “Emotion–Scene” Coupling Analysis Framework

To construct an “Emotion–Scene”-coupled analytical framework, this study integrates an affective perception model (Ranking SS-CNN) with a scene recognition model (Places365-ResNet) to accurately assess urban spatial quality. The Places365-ResNet model is derived from the MIT Places database project, which comprises over 10 million images covering 98% of global scene types and annotated with 434 distinct scene categories. Based on the residual network (ResNet) architecture, Places365-ResNet is specifically designed for scene classification tasks and trained on the Places365-Standard dataset, which contains more than 8 million images across 365 scene categories. This model exhibits outstanding classification performance, achieving over 54% Top-1 accuracy (the proportion of predictions where the model’s top predicted category matches the true label) and exceeding 85% Top-5 accuracy (the proportion where the true label appears within the model’s five highest-ranked predictions) on both validation and test datasets, demonstrating its robustness in large-scale scene classification tasks [23]. By leveraging the emotion ranking capability of the Ranking SS-CNN model and the scene classification strength of the Places365-ResNet model, the proposed “Emotion–Scene”-coupled analytical framework can simultaneously perform affective perception and scene categorization on urban street view images. This integration allows the framework to accurately characterize the spatial distribution of emotional attributes within urban areas and precisely identify the specific scene-related factors influencing these emotional perceptions. Consequently, this coupled approach enables a quantitative and refined assessment of urban spatial quality, effectively capturing perceptual characteristics across large urban areas, and providing more precise data support and evidence-based decision-making for urban design and planning.

5. Experimental Analysis

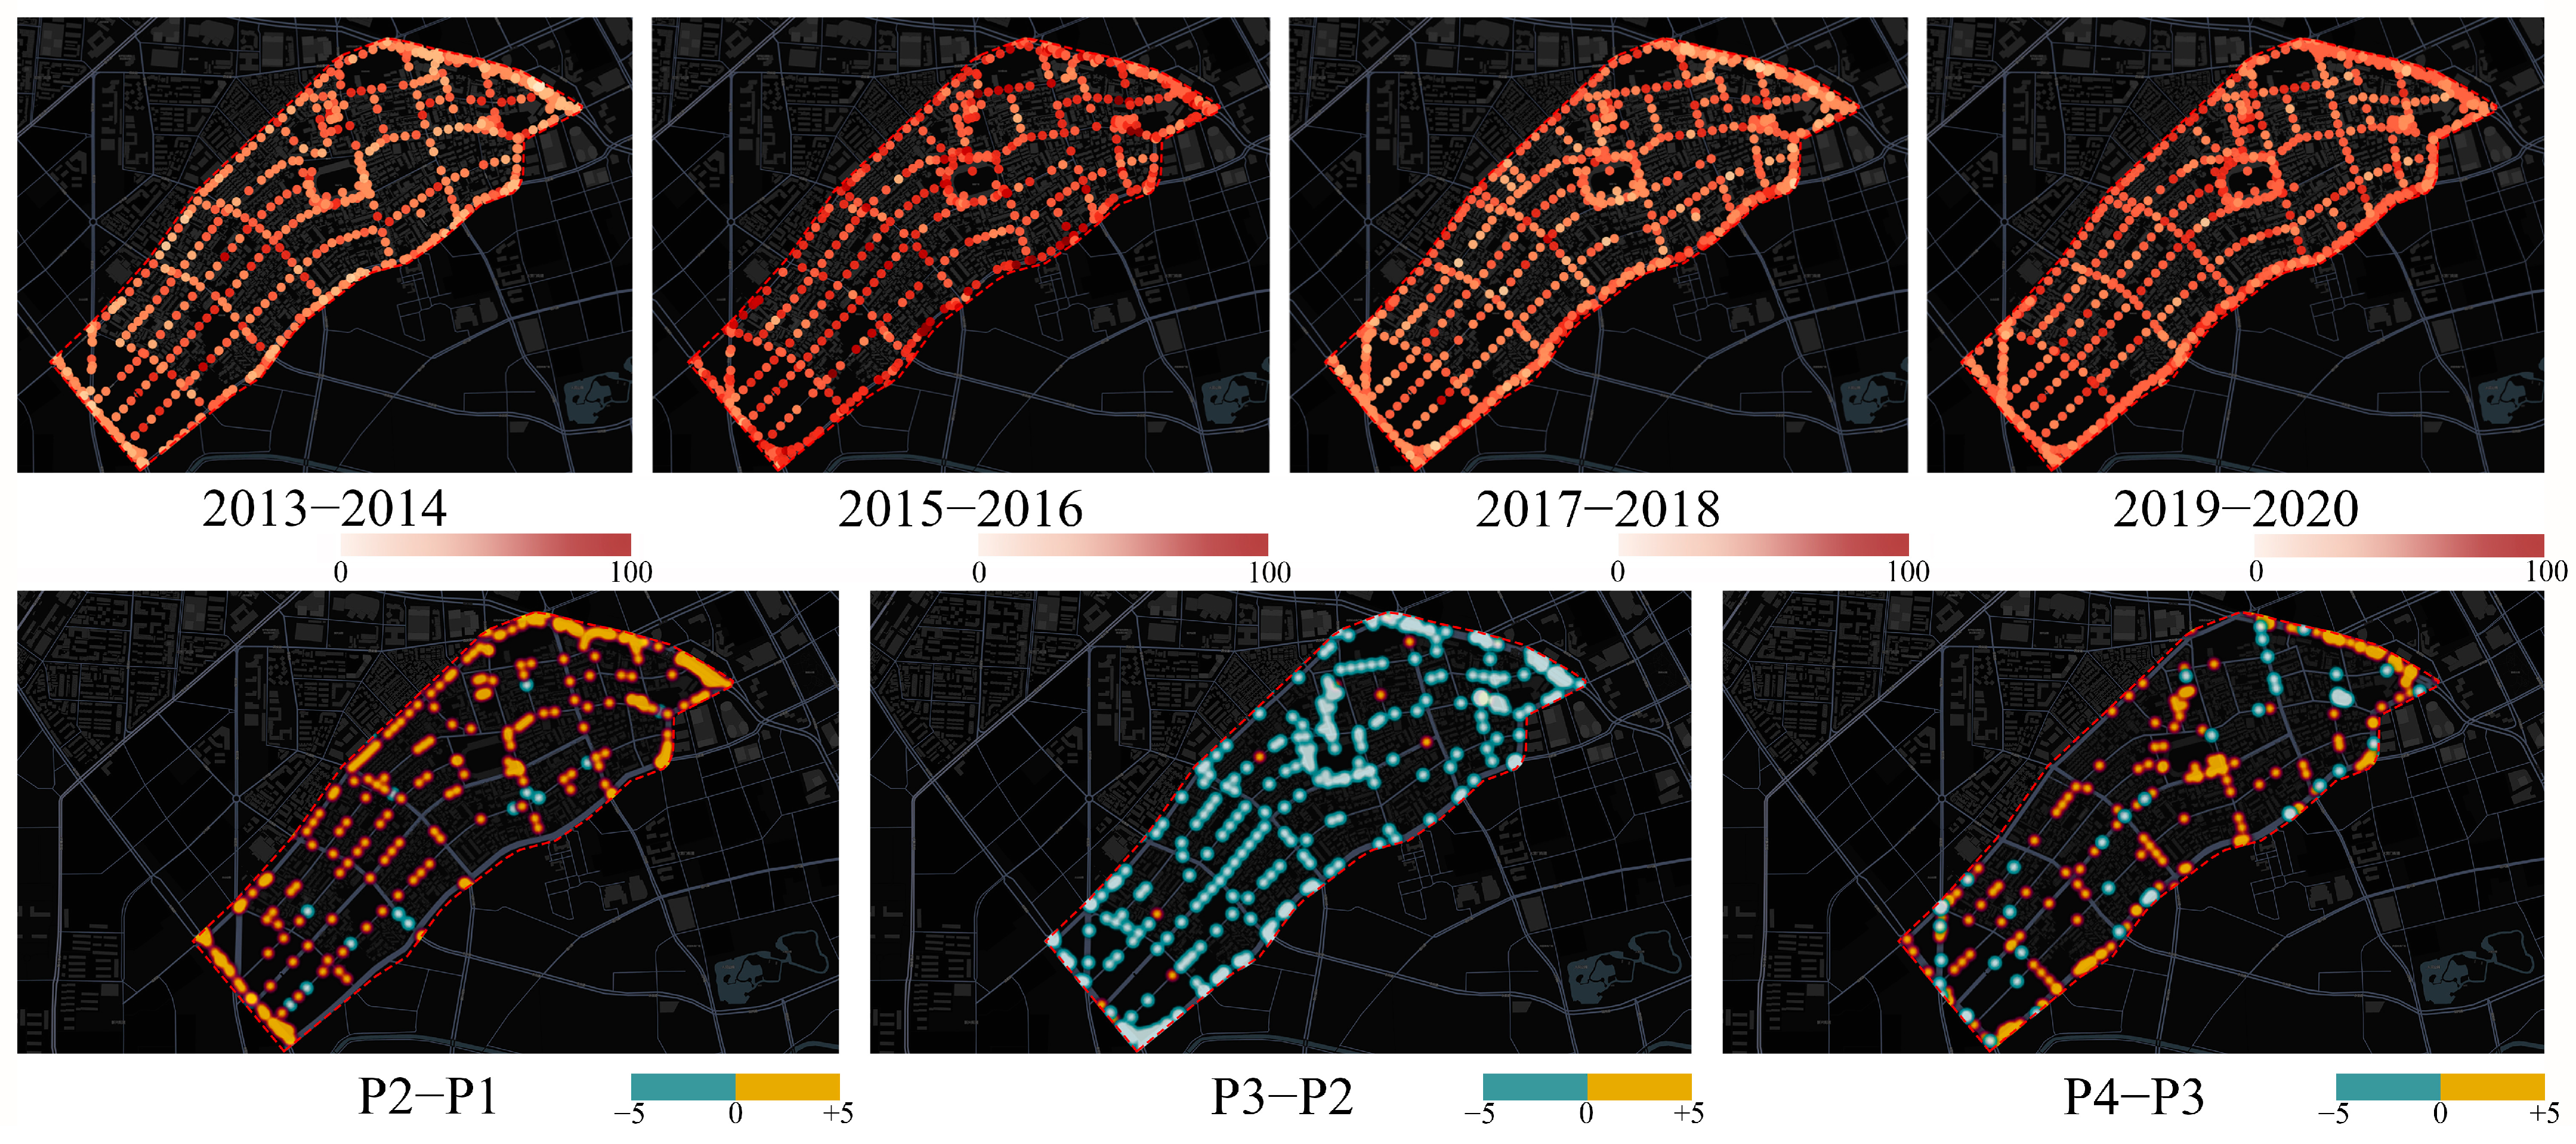
5.1. Results of Emotion Perception Model for the Study Area

The RSS-CNN model used in this study effectively predicts six key emotional perception indicators of the streets in the Wudadao historic district, including safety, vibrancy, esthetic appeal, wealth, oppression, and boredom. The model trained on this dataset demonstrates high accuracy, with a root mean square error (RMSE) below 10%. By applying the RSS-CNN model to the collected street view images, each image from various angles of a location is assigned a score, and the average perception score for each location is calculated. The average scores for all locations are then aggregated to create a temporal emotional perception distribution map of the spatial quality of the Wudadao historic district.
Additionally, to better observe the variations and their range, we subtract the scores of street view images from different stages and visualize the absolute values of the differences greater than five.

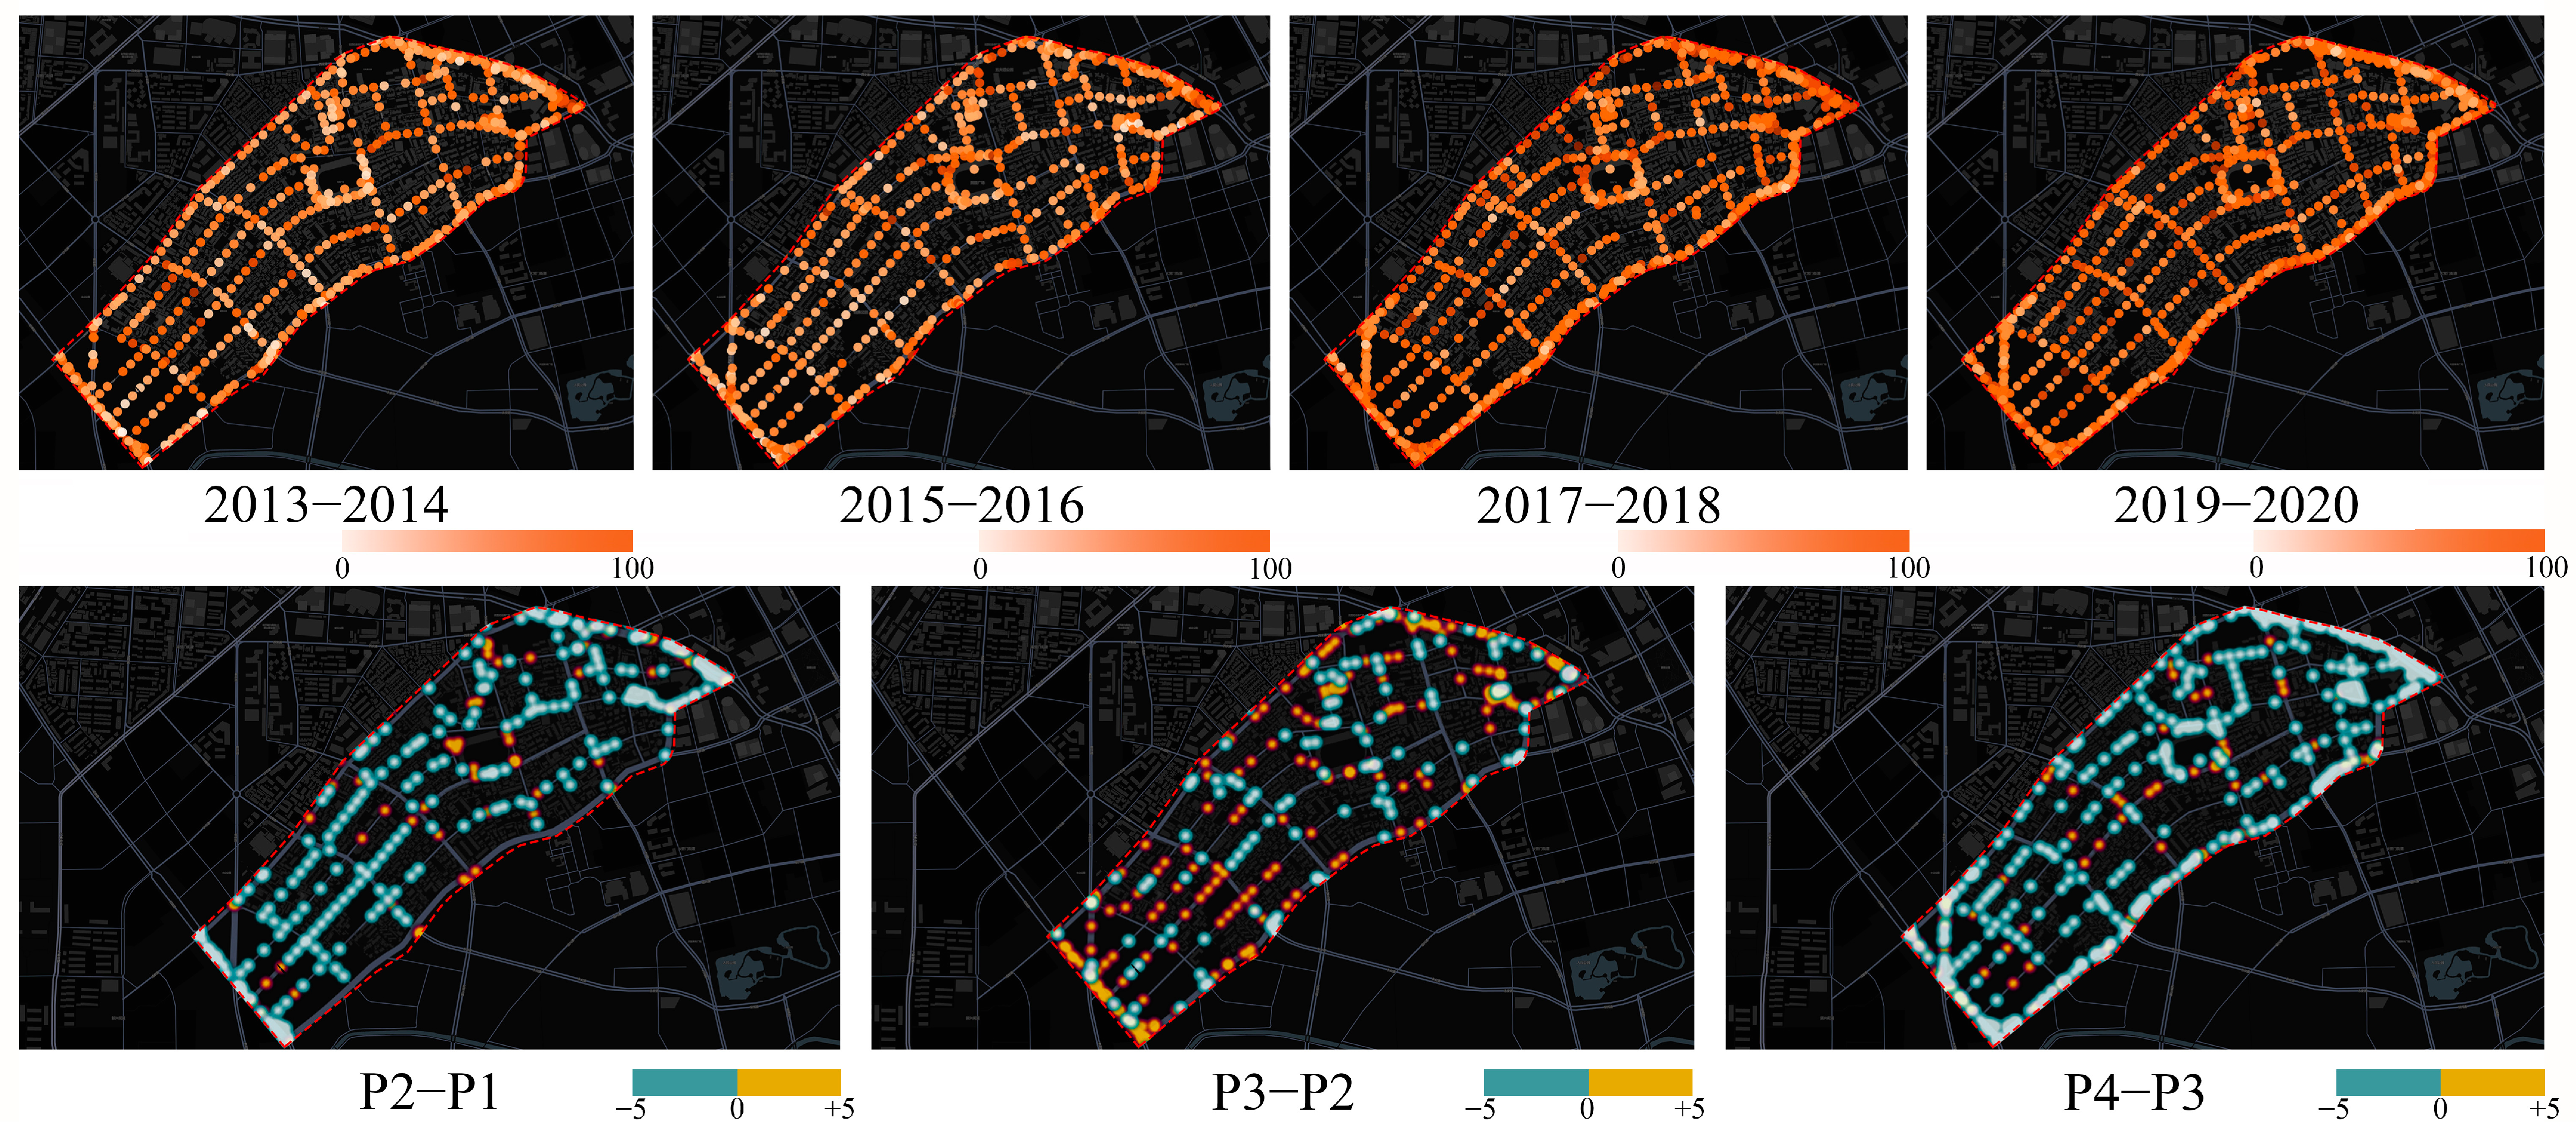
5.1.1. Beautiful Emotion Perception

Spatiotemporal Evolution of Beautiful Sentiment
Based on the sentiment scoring analysis using the RSS-CNN model, the perception of beauty in the Wudadao area has shown significant phase transitions between 2013 and 2020 (Figure 5). In the early stages (2013–2014), the overall beauty perception of the area was relatively low, with high-scoring regions sparsely distributed in the central areas, which may be attributed to insufficient greenery and the homogenization of architectural styles. As the related policies, such as the “Comprehensive Management Measures for the Wudadao Area in Heping District (Trial)” implemented in 2014, gradually took effect, the beauty perception significantly improved from 2015 to 2016, with the high-scoring areas expanding, especially along the main streets and key landscape nodes. However, between 2017 and 2018, the beauty perception experienced a decline, with the peripheral areas seeing a decrease in landscape quality due to delayed maintenance and construction impacts. By 2019–2020, although there was some recovery in the beauty perception, it did not return to the peak level, reflecting the diminishing marginal returns of resource investments.
In terms of spatial differentiation, the analysis of stage-to-stage differences reveals that the improvement in beauty perception from 2015 to 2016 was concentrated in the central areas, while the decline from 2017 to 2018 was more significant in the peripheral areas. This differentiation is directly related to the uneven spatial distribution of policy resources—central areas were prioritized for greenery enhancements and architectural restoration, while the renovation of peripheral areas lagged for an extended period.
Driving Mechanisms
The fluctuations in beauty perception are mainly driven by two types of factors:
Positive Drivers: Protective restoration of historical buildings, enhancements in street greenery, and the optimization of pedestrian systems significantly improved visual attractiveness.
Negative Suppressors: Over-commercialization led to visual clutter, and insufficient resource investment in peripheral areas weakened the overall esthetic appeal.

5.1.2. Boring Emotion Perception

Spatiotemporal Evolution of Boring Sentiment
Based on sentiment scoring analysis, the perception of boredom in the Wudadao area exhibited phase fluctuations between 2013 and 2020 (Figure 6). In the early stages (2013–2014), the overall boredom perception of the area was relatively low, with the central region displaying strong spatial vitality due to the cultural appeal of historical buildings and frequent public activities. From 2015 to 2016, the implementation of policies such as the “Comprehensive Management Measures for the Wudadao Area in Heping District (Trial)” further optimized public spaces (e.g., the addition of walkways and small plazas), which helped reduce boredom. The peripheral areas, due to improvements in infrastructure, experienced a vitality boost for the first time. However, between 2017 and 2018, the central region saw a significant rise in boredom due to over-commercialization, which led to scene homogenization (e.g., the dense presence of chain stores). At the same time, the peripheral areas experienced a decline in vitality due to halted renovations. By 2019–2020, although some local areas alleviated boredom through the introduction of cultural activities (e.g., art markets), the overall perception of boredom did not return to its earlier levels.
Spatial Differentiation: The difference analysis indicates that the intensification of boredom was concentrated in streets with a high degree of commercialization and single functionality, while areas dense with cultural facilities consistently maintained lower levels of boredom. This spatial differentiation reveals the suppressive effect of scene diversity and functional mix on boredom perception.
Driving Mechanisms
The evolution of boredom is primarily influenced by the following factors:
Negative Drivers: Scene Homogenization: Over-commercialization led to repetitive store types, weakening the appeal for exploration. Public Space Deactivation: The peripheral areas lacked continuous maintenance, causing some plazas and walkways to gradually fall into disuse.
Positive Suppressors: Cultural Activity Injection: Temporary markets and art exhibitions significantly enhanced interaction within the area. Mixed-Function Development: The transformation of historical buildings into “cultural + commercial” mixed-use spaces enriched the layers of the scene.

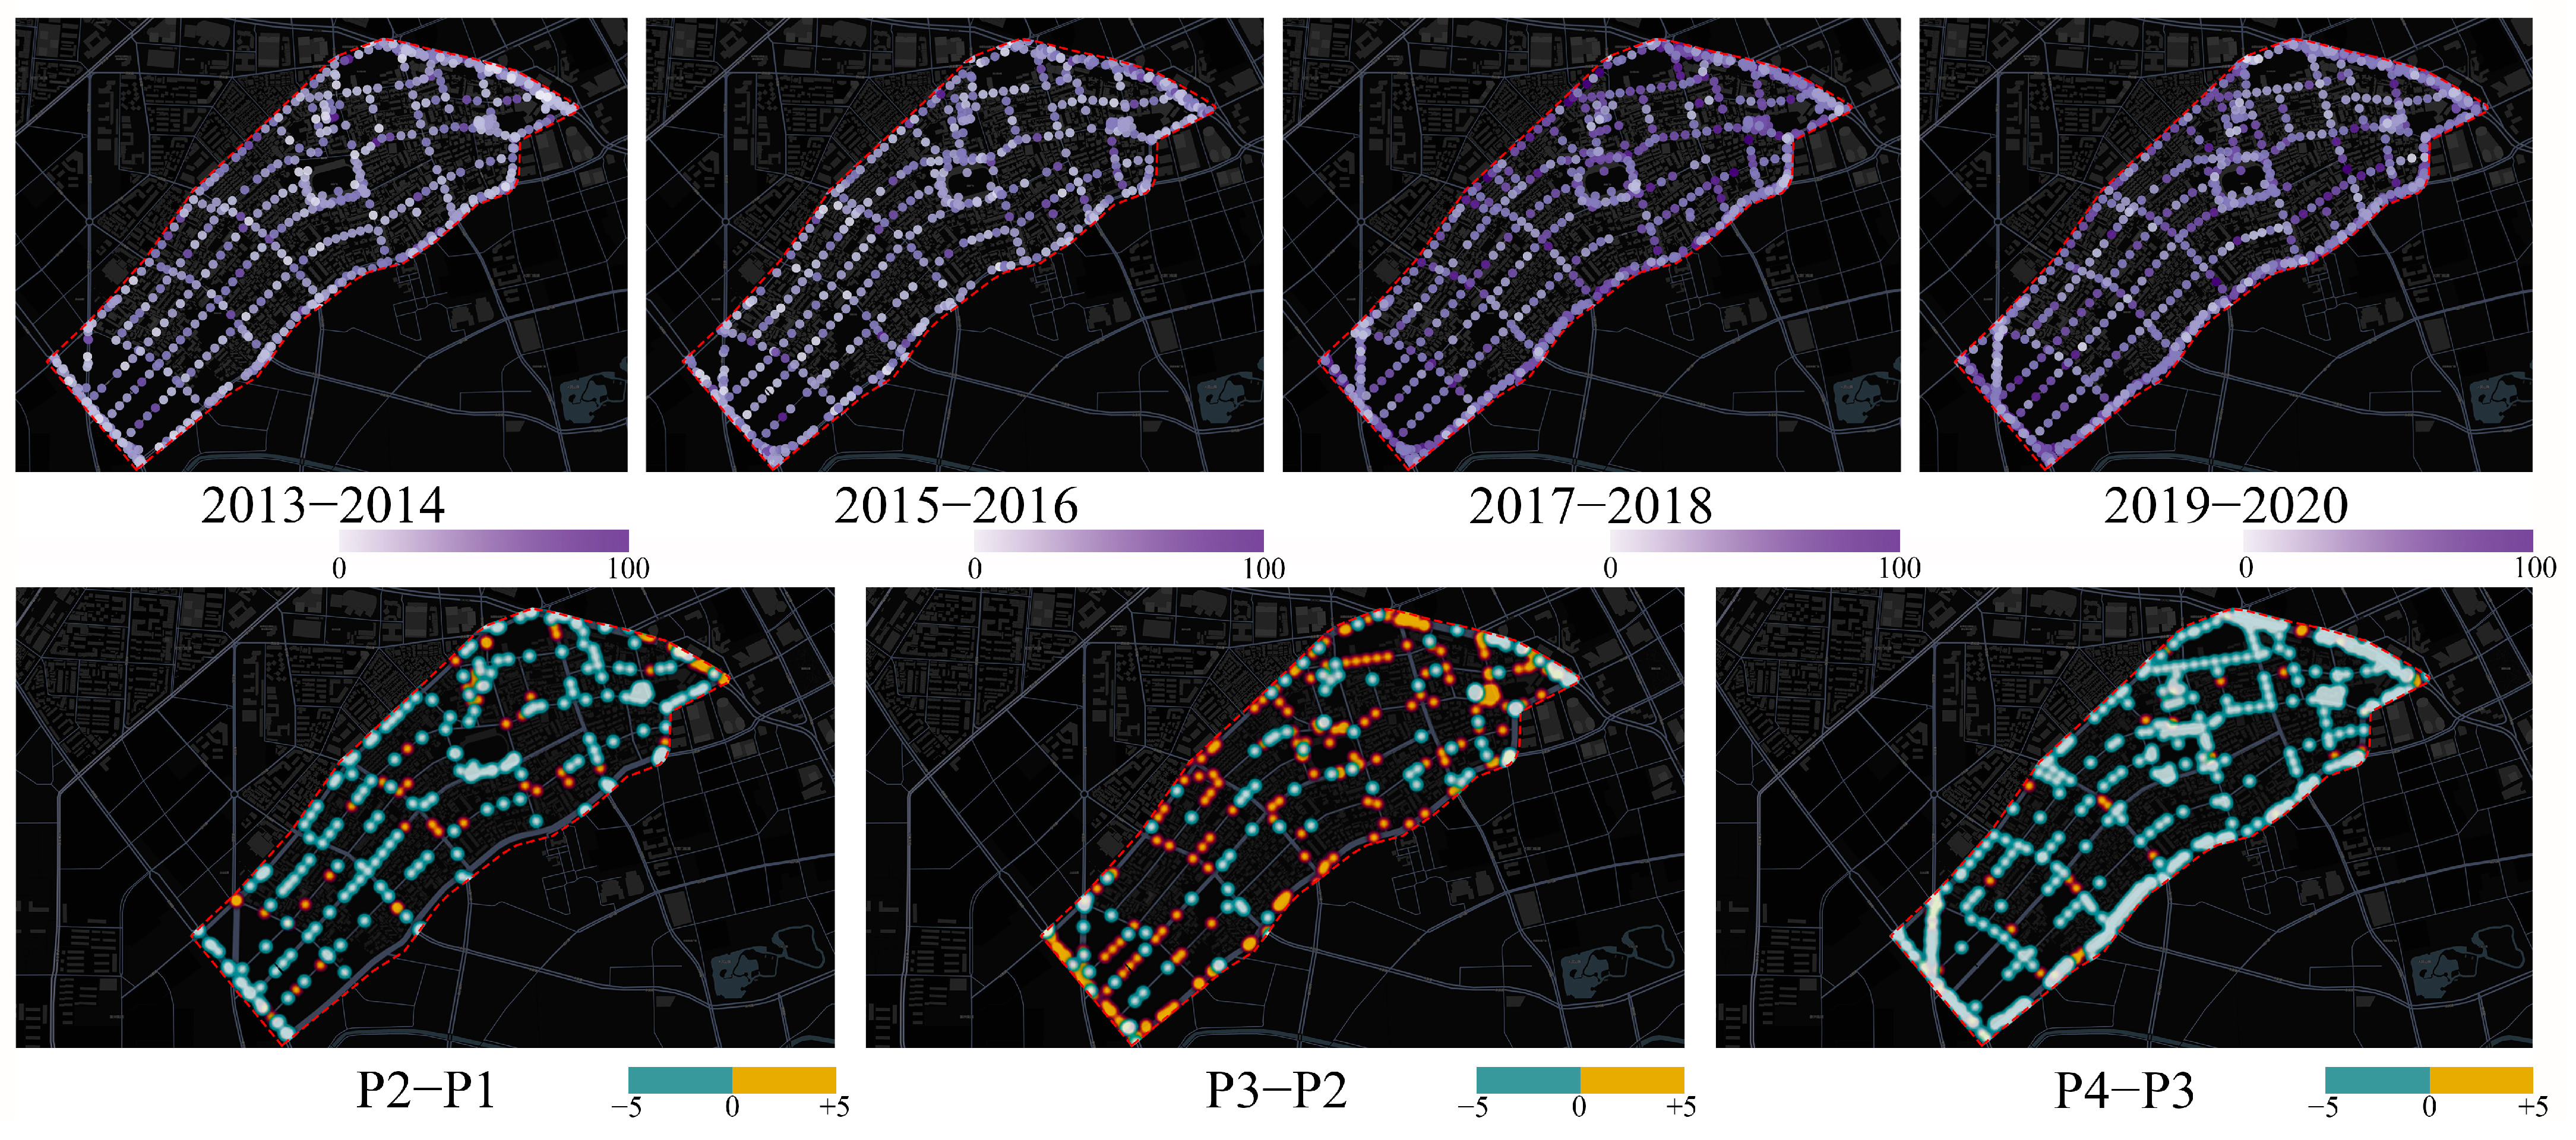
5.1.3. Depressing Emotion Perception

Spatiotemporal Evolution of Depressing Sentiment
Based on sentiment scoring analysis, the perception of depressing sentiment in the Wudadao area exhibited phase fluctuations between 2013 and 2020 (Figure 7). In the early stages (2013–2014), the overall depressing sentiment in the area was relatively low, with the open façades of historical buildings and continuous green belts creating a calming spatial atmosphere. From 2015 to 2016, as policies such as the “Comprehensive Management Measures for the Wudadao Area in Heping District (Trial)” promoted the optimization of the pedestrian system and green space, the perception of depressing sentiment further decreased, particularly in the central area, where street widening and the addition of public spaces led to significant improvements. However, between 2017 and 2018, certain areas saw a significant rise in depressing sentiment due to high-density commercial development (e.g., newly built high-rise hotels) and the prolonged presence of construction barriers, which enhanced spatial enclosure. By 2019–2020, the removal of temporary barriers and the optimization of building setbacks alleviated some of the depressing sentiment, but certain narrow streets still maintained a high level of depressing sentiment due to delayed renovations.
Spatial Differentiation: The intensification of depressing sentiment was concentrated in streets with high building density and a lack of greenery, while open plazas and riverside areas consistently exhibited lower levels of depressing sentiment. This spatial differentiation reflects the role of spatial openness and visual permeability in alleviating depressing sentiment.
Driving Mechanisms
The evolution of depressing sentiment is primarily driven by the following factors:
Negative Drivers: Uncontrolled Building Density and Height: New high-rise buildings that surpassed the neighborhood’s architectural guidelines intensified the street canyon effect. Temporary Construction Impact: Prolonged barriers and the accumulation of construction materials obstructed pedestrian sightlines and hindered movement, negatively affecting the experience.
Positive Suppressors: Improvement of Open Spaces: The removal of barriers and the addition of street greenery effectively enhanced spatial permeability. Optimization of Setback Design: The introduction of arcade-style colonnades and buffer zones in front of buildings alleviated the street’s oppressive feeling.

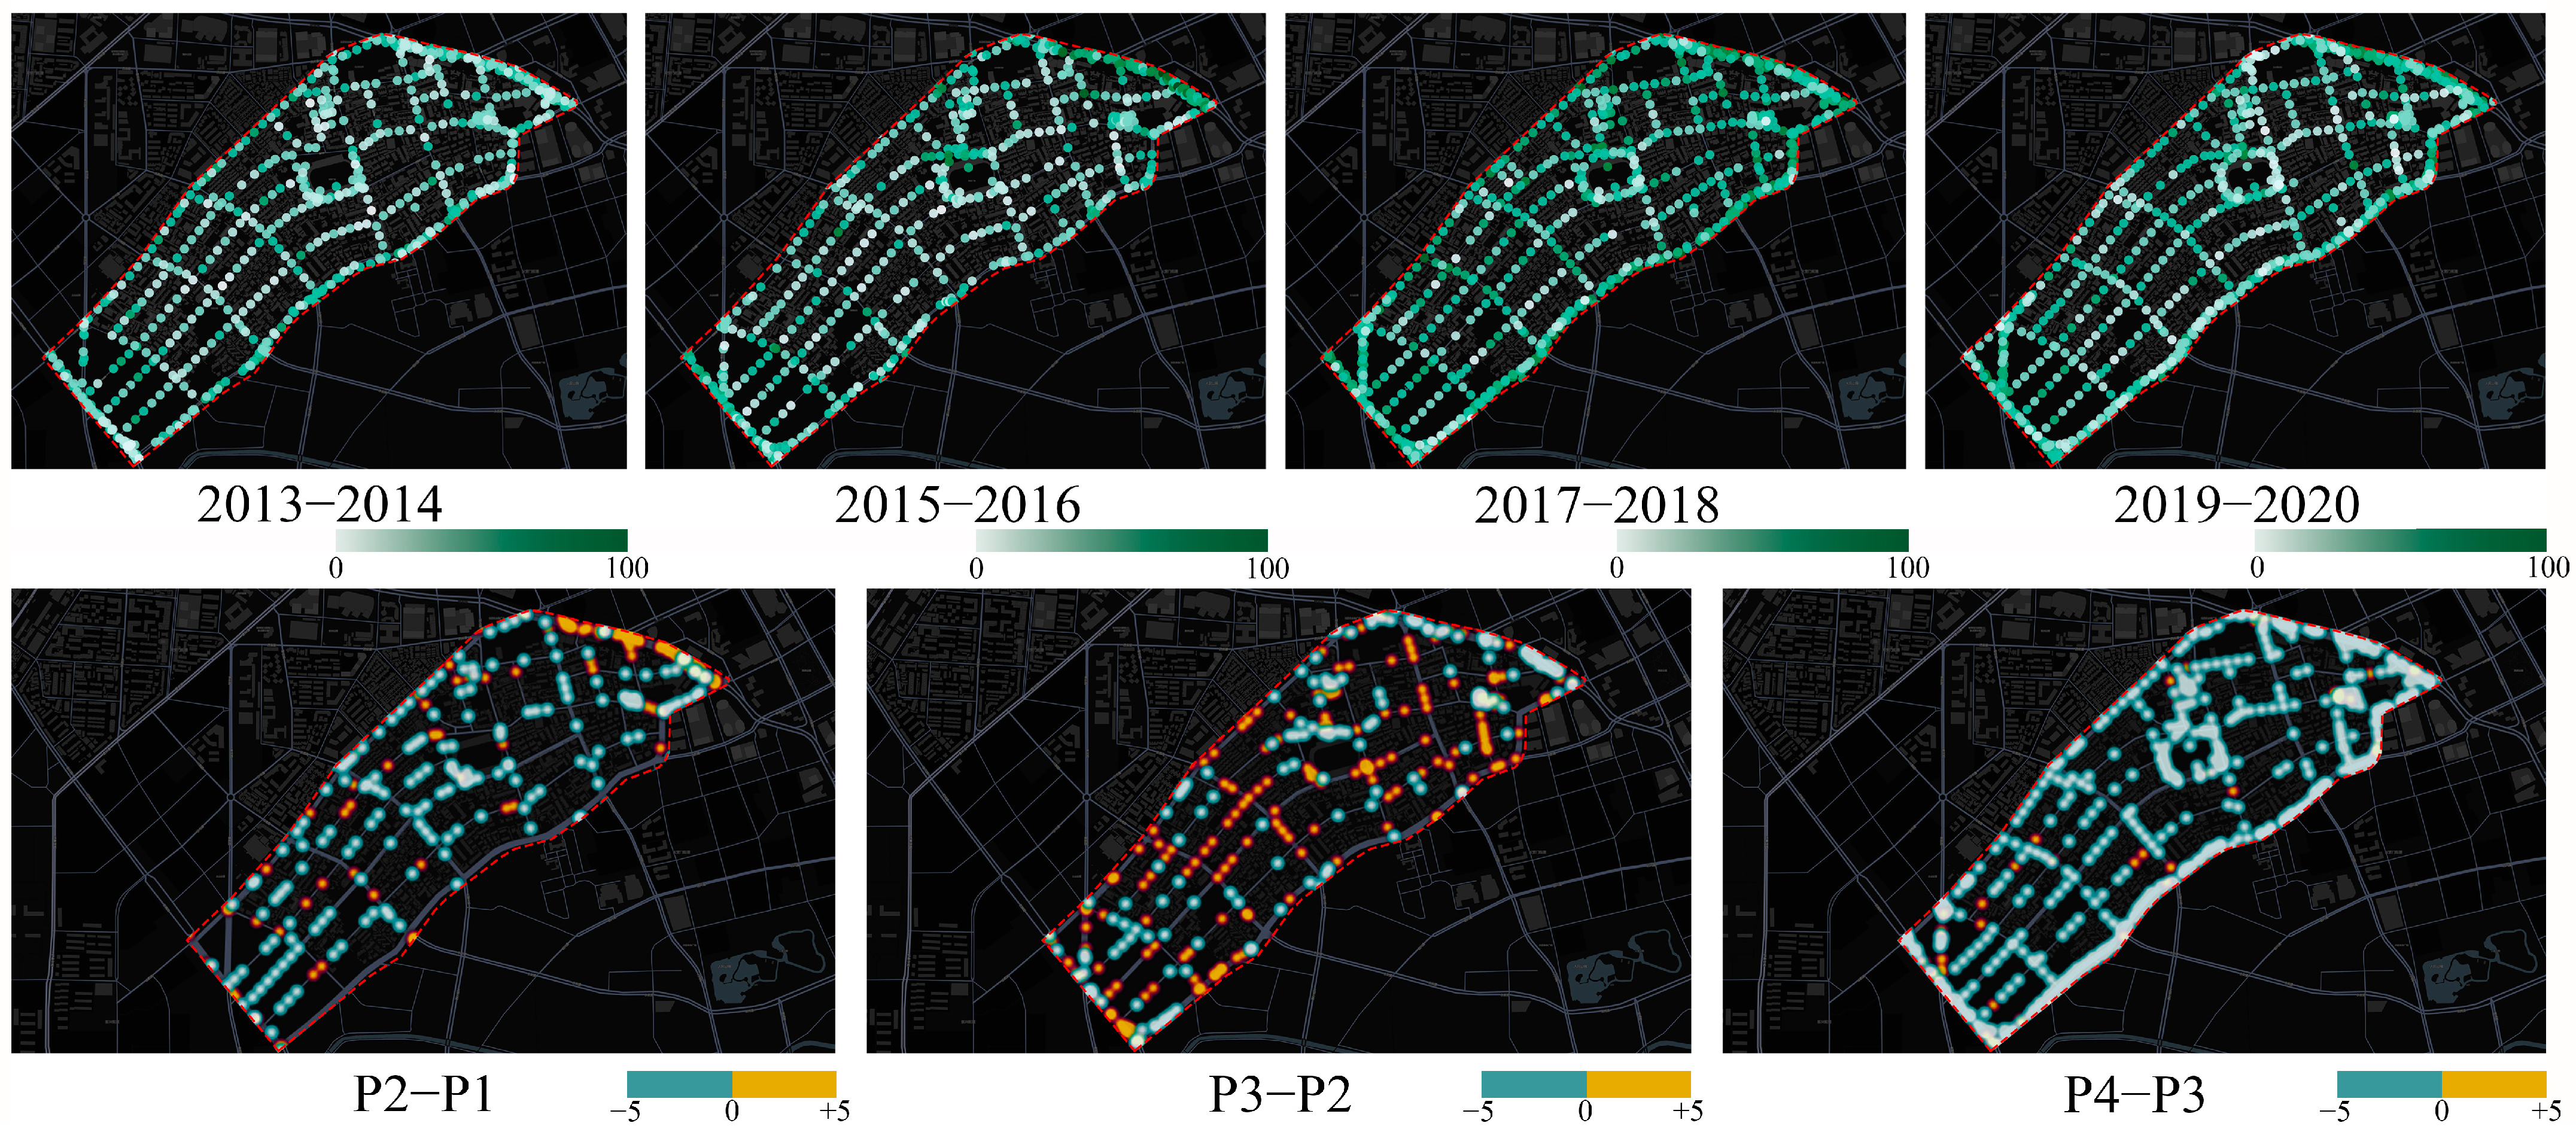
5.1.4. Lively Emotion Perception

Spatiotemporal Evolution of Lively Sentiment
The perception of lively sentiment in the Wudadao area exhibited significant phase changes between 2013 and 2020 (Figure 8). In the early stages (2013–2014), the level of lively sentiment in the area was relatively low, with public activities concentrated around scattered historical building nodes, while the peripheral areas lacked vibrancy due to a single-function design. From 2015 to 2016, with the optimization of the pedestrian system and the introduction of cultural markets, lively sentiment significantly increased in the central area, enhancing street interaction and commercial activity. However, between 2017 and 2018, certain areas experienced a decline in lively sentiment due to excessive commercialization (e.g., the clustering of chain stores), leading to homogenized scenes. Additionally, the vitality in peripheral areas further decreased due to aging facilities. By 2019–2020, the introduction of seasonal art activities and community markets helped revive lively sentiment in some parts, but the overall level remained lower than the peak observed in the second stage.
Spatial Differentiation: High-value lively sentiment areas were concentrated around cultural facilities and mixed-use districts (e.g., around Minyuan Square), while single-function streets (e.g., purely residential areas) consistently maintained low levels of lively sentiment. This differentiation reflects the key role that functional diversity and cultural activities play in fostering vibrancy.
Driving Mechanisms
The evolution of lively sentiment is influenced by the following factors:
Positive Drivers: Cultural markets, pedestrian-friendly design, and mixed-use development (e.g., “commercial + exhibition” spaces).
Negative Suppressors: Homogenization of business types, underutilization of public spaces, and the aging of peripheral area facilities.

5.1.5. Safety Emotion Perception

Spatiotemporal Evolution of Safety Sentiment
The perception of safety in the district showed a trend of “initial decline, followed by a rise and subsequent fluctuation” between 2013 and 2020 (Figure 9). In the early stage (2013–2014), the overall safety sentiment was high, as the low traffic flow in the historic district and the closed community management provided a stable environment. Between 2015 and 2016, a surge in tourist population and inadequate nighttime lighting led to a decrease in safety sentiment, especially in the peripheral backstreets and alleys. From 2017 to 2018, safety sentiment significantly improved due to the installation of surveillance equipment and the widening of sidewalks. However, between 2019 and 2020, safety sentiment fluctuated again due to the excessive expansion of commercial activities in certain areas (e.g., street vendors occupying the streets).
Spatial Differentiation: High-value safety areas were concentrated in strictly managed closed communities and main streets, while backstreets and temporary commercial zones consistently exhibited low safety values.
Driving Mechanisms
The fluctuation in safety sentiment is mainly influenced by the following factors:
Positive Drivers: Smart security systems, street lighting enhancements, and pedestrian–vehicle separation designs.
Negative Suppressors: Lack of management of street vendors and the single functionality of areas at night.

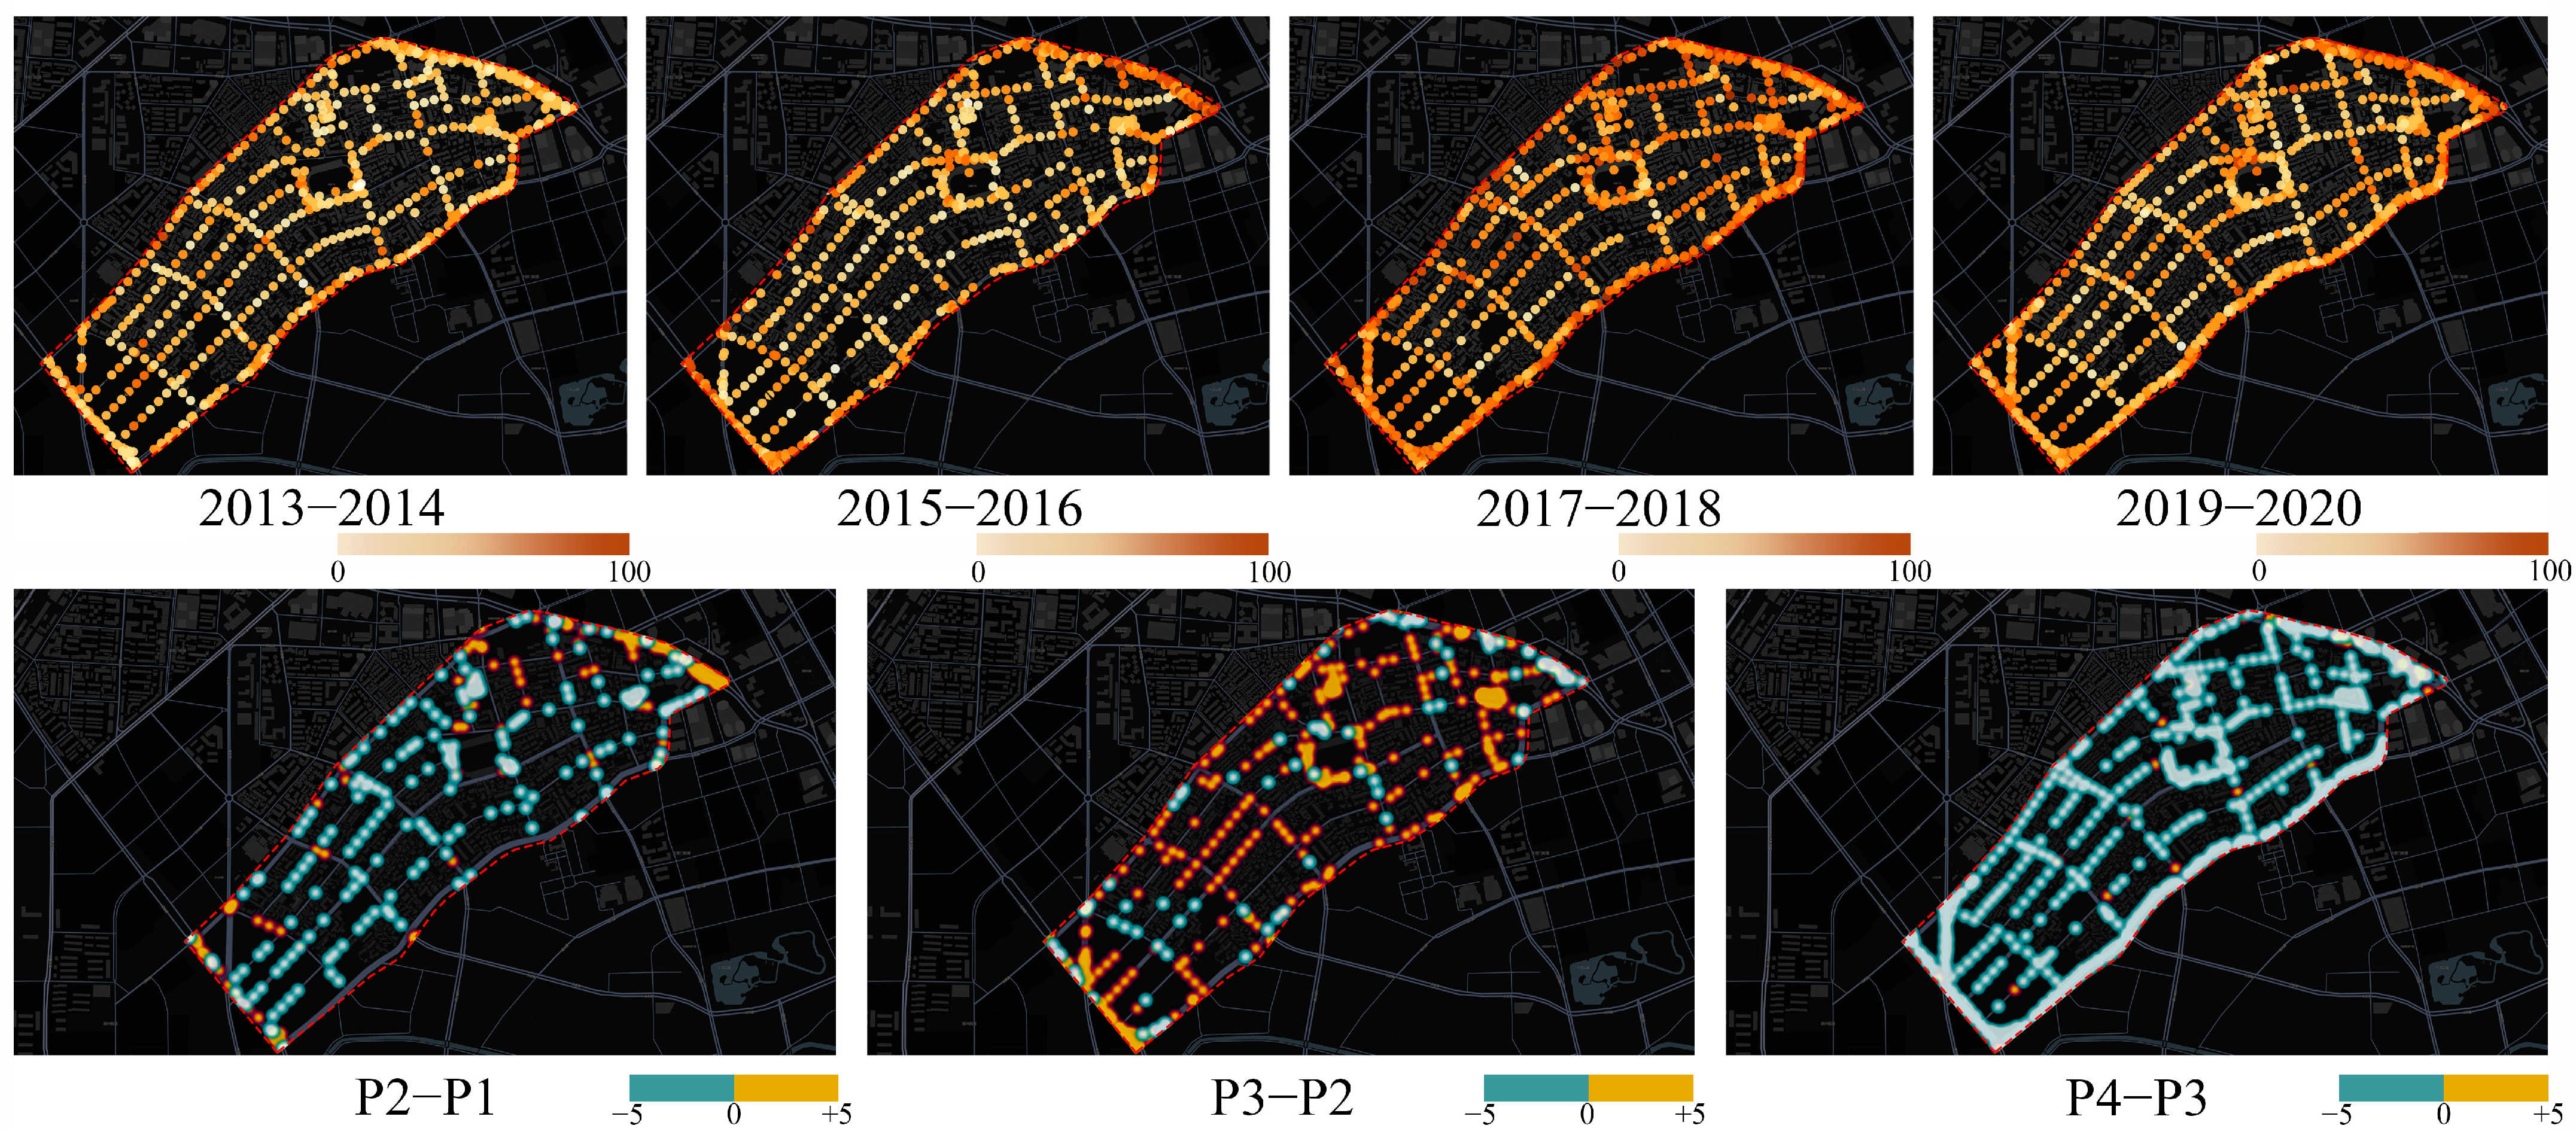
5.1.6. Wealthy Emotion Perception

Spatiotemporal Evolution of Wealthy Sentiment
The perception of wealth in the district exhibited characteristics of “central polarization and peripheral decline” between 2013 and 2020 (Figure 10). In the early stage (2013–2014), the distribution of wealthy sentiment was relatively balanced, with high-end residential areas mixed with ordinary communities. Between 2015 and 2016, the central area saw a sharp increase in wealthy sentiment due to the arrival of luxury stores and the high-end renovation of historical buildings, while the peripheral areas, lagging in facilities, began to show disparities. From 2017 to 2020, wealthy sentiment in the central area slowed down due to the over-concentration of commercial activities, leading to esthetic fatigue. In contrast, the peripheral areas saw a partial alleviation of the declining trend due to the introduction of a few boutique guesthouses.
Spatial Differentiation: High-value wealthy areas were concentrated around renovated colonial-style architectural complexes, while areas with ordinary residences remained consistently low in wealthy sentiment.
Driving Mechanisms
The differentiation in wealthy sentiment was primarily driven by the following factors:
Positive Drivers: The introduction of high-end commercial spaces and the refined restoration of architectural features.
Negative Suppressors: Gentrification-induced community segregation and insufficient investment in peripheral areas.

5.1.7. Summary of Policy Documents

By analyzing the policy documents related to the Five Avenues area, it is evident that multiple policies have had a profound impact on the overall planning, urban management, environmental improvement, and the promotion of cultural tourism functions in the area. Notably, the “Comprehensive Management Measures for the Five Avenues Area in Heping District (Trial)” issued in 2014, as well as subsequent renovation mobilization and comprehensive improvement meetings, have provided a policy basis for the changes in the level of wealth in the Five Avenues district. The formation of the cultural historic district, the increase in commercial activities, and the optimization of infrastructure have all contributed to the enhancement of the wealthy sentiment in the central area. However, the economic stagnation in the peripheral areas reflects an ineffective allocation of resources. In terms of future policy design, based on the issues identified through the analysis of six emotional perceptions in Section 5.1.1, Section 5.1.2, Section 5.1.3, Section 5.1.4, Section 5.1.5 and Section 5.1.6, we propose targeted optimization strategies for each emotion. The corresponding recommendations are summarized in Table 1.

5.1.8. Summary of Six Types of Sentiment

In the study of the six types of sentiment, we analyzed the distribution characteristics and evolution trends of different sentiments in different stages, conducted differential analysis, identified areas with significant changes, and analyzed the reasons behind those changes. It is clear that the introduction and implementation of planning policies play a crucial role in improving the spatial quality of historic districts. These policies have had a positive impact on beauty, liveliness, wealthy sentiment, and safety, while also inhibiting the emergence of depressing and boring sentiments. However, uneven planning resource allocation and unreasonable arrangements within the area have had negative effects on the spatial quality of certain regions. A search for the keyword “Five Avenues” in the Tianjin Municipal Planning and Natural Resources Bureau reveals that planning policies were concentrated around 2015, which also explains why significant fluctuations in the six types of sentiment occurred in 2015–2016, the second phase. However, subsequent spatial planning and detailed architectural planning did not keep pace. Between April 2015 and March 2020, no planning documents specifically addressing the Five Avenues district were issued, leading to a decline in the overall spatial quality of the area. Naturally, the impact of the COVID-19 pandemic also cannot be underestimated, as it negatively affected perceptions of liveliness and safety.

5.2. Results of the “Emotion–Scene” Coupling Analysis Framwork

The above content only analyzed the regions and reasons for changes but did not conduct a detailed analysis of the specific content of these changes. In the following section, we will use the Places365-ResNet model to perform scene recognition on street view images in the study area that exhibited significant changes in sentiment scores. We will extract the coordinates of street view images with noticeable changes (where the absolute value of the difference between two adjacent stages is greater than five), and perform scene recognition on the images from different stages in the four cardinal directions. Based on different sentiment types, the recognition results will be classified and summarized. The specific categories are shown in Table 2 below.
Using the classification in the table above, the visualization and analysis of dynamic scene recognition results for different emotions within the study area are presented as follows.

5.2.1. Beautiful Driving Factors

Analysis of the Driving Scenes for the Emotion of Beauty
Based on the results of scene recognition (Figure 11), the dynamic changes in the sense of beauty in the Wudadao area are significantly associated with the adjustments in functional scenes. The study finds that the continuous expansion of public cultural facilities is the core driver of the enhancement of the sense of beauty. The addition of high-value scenes such as libraries and art galleries in historic districts, along with the collaborative design of building facade restoration and surrounding greening, has not only strengthened the cultural imagery but has also significantly increased visual appeal. For example, the renovation project of the art museum on the west side of Minyuan Square, which preserved the colonial-style arcade and added a glass curtain wall atrium, successfully integrated historical and modern esthetics, becoming a typical case of beauty enhancement.
The optimization of residential scenes is also crucial. The restoration of traditional courtyards and low-rise residences, combined with the moderate development of high-end apartments, injects modern living esthetics while retaining the continuity of historical styles. This type of renovation balances protection and renewal needs, alleviating the tendency for the district to become static. The improvement of transportation scenes has been achieved through the landscape design of infrastructure (such as green plant walls and artistic paving), reducing the visual abruptness of traditional facilities. However, the over-concentration of parking lots and highways has led to the homogenization of certain areas, with the eastern section of Chongqing Road consistently scoring lower than the average for its beauty due to the high proportion of parking lots.
The adjustments in commercial and leisure scenes show a dual impact on the sense of beauty. Initially, the functional positioning of commercial facilities gradually shifted toward esthetics and social value, with additions like small restaurants and restaurant terraces enriching the living atmosphere. However, excessive commercialization (such as clustering of chain brands) has led to the homogenization of scenes, weakening the appeal of exploration. In the leisure scenes, parks and promenades, as high-quality public spaces, have always been an important part of the sense of beauty, but insufficient subsequent maintenance has resulted in a decline in the continuity of ecological and cultural landscapes.
Planning Insights
Sustainable enhancement of the sense of beauty requires attention to the dynamic balance of scene functions:
Limit the single-function expansion: Control the proportion of transportation and industrial facilities through planning guidelines to avoid visual fragmentation.
Strengthen the cultural-leisure network: Embed small parks and exhibition galleries in the peripheral areas to address the “center-periphery” differentiation.
Conceal infrastructure: Employ underground parking lots and landscape shielding designs to balance functional and esthetic needs.

5.2.2. Boring Driving Factors

Analysis of the Driving Scenes for the Emotion of Boring
The spatial–temporal differentiation of the sense of boredom in the Wudadao area shows a significant association with the adjustments in functional scenes (Figure 12). The study finds that scene homogenization is the core factor contributing to the intensification of boredom. Between 2015 and 2016, the introduction of new walkways and small plazas briefly enhanced the vitality of the area, but later excessive commercialization led to the concentrated distribution of chain stores, which weakened the freshness of exploration. For example, the eastern section of Munan Road had a sustained higher boredom score than the district average from 2017 to 2020 due to the concentration of similar retail establishments, reflecting the negative impact of single-function spaces on spatial attraction.
The inactivity of residential and public scenes further exacerbated the sense of boredom. Early courtyards and community squares maintained basic vitality through spontaneous activities (such as markets and tea gatherings), but as some squares became abandoned due to lack of maintenance, their social function significantly declined. At the same time, delayed residential renovations in peripheral areas failed to meet modern living demands, exacerbating the tendency for scenes to become static. In contrast, the introduction of temporary cultural markets and art exhibitions, through short-term scene activation, provided partial relief to the boredom, but the lack of a long-term supply mechanism made the effects unsustainable.
The layout contradiction in transportation and industrial scenes is also crucial. Although the optimization of metro stations and walkways improved accessibility, the over-concentration of parking lots and loading docks led to functional stagnation in certain areas. For instance, the western section of Chongqing Road, due to frequent freight vehicle traffic and temporary storage piles, showed a significant positive correlation between scene disorder and boredom.
Planning Insights
To systematically reduce boredom, it is necessary to focus on scene diversity and functional mix:
Control of business type proportions: Limit the density of single-business types through district guidelines and encourage mixed functions such as “culture + commerce”.
Activation of small spaces: Transform idle squares into community markets or open-air theaters, incorporating daily activities led by residents.
Dynamic scene supply: Establish a collaborative mechanism for seasonal art activities (such as the Autumn Creative Culture Week) and fixed cultural IPs (such as monthly intangible cultural heritage performances) to ensure sustained vitality.

5.2.3. Depressing Driving Factors

Analysis of the Driving Scenes for the Emotion of Depressing
He spatiotemporal differentiation of the depressing feeling in the Five Avenues District is closely related to adjustments in spatial form and scene functions (Figure 13). The study found that high-density development and enclosed scenes are the main driving factors for the intensification of the depressing feeling. From 2015 to 2016, the district briefly improved spatial permeability by removing walls and adding street green spaces. However, after 2017, newly constructed high-rise hotels broke the original esthetic control requirements, leading to a prominent street canyon effect with a significant reduction in visible sky coverage in some areas, thereby notably enhancing the visual sense of oppression.
The impact of temporary construction scenes cannot be ignored either. During the metro station construction period, long-term barriers blocked pedestrian flow and interrupted visual continuity, while the accumulation of construction materials further exacerbated the scene disorder. In contrast, improvements in open spaces and setback design optimizations alleviated the sense of depressing in certain areas by enhancing visual permeability.
The imbalanced distribution of green spaces amplifies spatial disparities. In the central areas, the integration of vertical greening and pocket parks has enhanced green coverage, while in the peripheral areas, the lack of maintenance and the degradation of vegetation have led to insufficient green coverage. Such spatial differentiation directly impacts psychological comfort.
Planning Insights
The systematic regulation of the depressing emotion requires three types of spatial interventions:
Rigid esthetic control: Strictly limit building height (≤18 m) and floor-to-area ratio (≤65%) to ensure the preservation of historic district scales.
Dynamic construction management: Use transparent barriers and phased construction strategies, reducing the enclosure period to less than three months.
Ecological compensation for peripheral areas: Ensure a green coverage rate of ≥25% through vertical greening and the transformation of abandoned land.

5.2.4. Lively Driving Factors

Analysis of the Driving Scenes for Lively Emotion
The spatiotemporal evolution of liveliness in the Wudadao area is significantly correlated with adjustments in functional scenes (Figure 14). The study reveals that the expansion and diversification of public facilities are the core drivers of liveliness. The continuous addition of high-value scenes such as libraries and art galleries, coupled with architectural esthetics and open spaces, has strengthened the cultural atmosphere and social vitality. For instance, the art gallery on the west side of Minyuan Square, through its integration of a glass curtain wall atrium and colonial-style arcades, has become a hotspot for interaction between residents and visitors.
The optimization of residential scenes injects sustained momentum into liveliness. The combination of traditional courtyard restoration and high-end apartment development has enhanced the interactivity and visual appeal of the living environment while retaining the historical style. The incorporation of rooftop gardens and balcony landscapes balances static preservation with dynamic living needs, alleviating the tendency toward functional stagnation in the district.
The diversification of recreational and entertainment scenes plays a crucial role in enhancing liveliness. The corridor, as a fundamental social space, ensures continuity and daily vibrancy. Later additions, such as markets and open-air theaters, further enrich the dynamic experience. However, an overreliance on short-term activities leads to fluctuating vitality, and the absence of long-term cultural intellectual properties diminishes the sustained appeal.
Mechanisms Driving the Decline of Liveliness:
The weakening of transportation facilities significantly impacts liveliness. The reduction in parking lots and roadways has led to the loss of core dynamic scenes. Although the new subway stations have compensated for part of the functionality, their insufficient landscaping (such as a lack of green plant barriers) has failed to effectively maintain the original vitality. Although the commercial area has enhanced the living atmosphere through restaurant terraces, the excessive concentration of chain brands has led to homogeneity, reducing the interest in exploration.
The contraction of living-oriented scenes in residential areas further exacerbates the issue. The growth in the number of high-end apartments has not offset the reduction in traditional courtyards and community markets, thus compressing spaces for spontaneous resident activities. In the realm of public facilities, the increase in purely functional scenes such as fire escape routes, coupled with a lack of cultural and sports facilities, has created an imbalance in dynamism.
Planning Insights
Functionality and Mixed-Use Orientation: Guide regulations to limit the proportion of single-use business types (e.g., chain stores ≤ 20%) and encourage “culture + commerce” mixed scenes.
Activation of Small Micro-Spaces: Transform idle corner spaces into community gardens or street theaters, ensuring spaces for daily interaction.
Long-Term Vitality Supply: Establish a dynamic mechanism combining fixed cultural intellectual properties (e.g., seasonal themed markets) with flexible activities.

5.2.5. Safety Driving Factors

Analysis of Driving Scenes for Safety Perception
The safety perception in the Five Avenues District exhibited fluctuating evolution between 2013 and 2020 (Figure 15), with its changes closely related to adjustments in functional scenes and spatial management. The study found that the expansion of residential areas and the optimization of public facilities are the core driving forces behind the improvement of safety perception. From 2015 to 2016, the addition of fencing, improvements in community greening, and upgrades to nighttime lighting significantly increased residents’ trust in their living environment. The maintenance and restoration of historic buildings further strengthened the continuity of the district’s character, preserving its historical scale while improving emergency evacuation conditions.
The standardized management of public spaces played a key role in enhancing safety perception. From 2017 to 2020, through the optimization of pedestrian systems and enhanced public area surveillance, both the physical safety and psychological sense of safety in the district were improved simultaneously.
However, the decline in safety perception is mainly attributed to the degradation of two types of scenes:
Decline in Traffic Facilities: The reduction in parking lots and bus stops led to decreased convenience for residents’ travel, and in some areas, the delayed management of alternative facilities exacerbated traffic chaos and safety anxiety.
Deactivation of Public Spaces: The reduction in cultural spaces such as libraries and corridors weakened social interaction frequencies, indirectly affecting community cohesion and safety perception.
Planning Insights
Balanced Facility Distribution: Ensure comprehensive coverage of basic services (such as bus stops and police stations) through the “15 min living circle” planning.
Dynamic Safety Monitoring: Utilize intelligent security systems for real-time monitoring in high-density areas and optimize emergency response capabilities.
Community Participation in Governance: Enhance residents’ sense of belonging by collaborating through community councils to manage small-scale spaces (e.g., alleyway greening, lighting maintenance).

5.2.6. Wealthy Driving Factors

Analysis of Driving Scenes for Wealthy Perception
The perception of wealth in the Five Avenues District exhibited an “urban core polarization and peripheral decline” evolution from 2013 to 2020 (Figure 16). The study found that the concentrated development of high-end scenes was the core driving force behind the enhancement of wealthy perception. From 2015 to 2016, the establishment of luxury stores and high-end renovations of historic buildings significantly improved the quality image of the central area. These renovations, through detailed facade restoration and functional upgrades, reinforced the district’s rarity and cultural capital value.
The optimization of transportation facilities provided indirect support for the wealthy perception. The landscaped designs of parking lots and metro stations (e.g., plant-enclosed walls, artistic paving) enhanced the modern feel and convenience of the area, while the continuity of the pedestrian system (e.g., newly added tree-lined walkways) further improved the accessibility of high-end consumption scenes. The diversification of leisure and entertainment spaces (e.g., corridors, cafes) improved the quality of social spaces and conveyed a shift towards a more high-end lifestyle.
Mechanisms Driving the Decline in Wealthy Perception:
The decline in the peripheral areas is the main cause of the differentiation in wealthy perception. After 2017, the central area suffered from esthetic fatigue due to excessive commercial concentration, with diminishing returns on resource investments. Meanwhile, the peripheral areas faced a reduction in transportation facilities (e.g., parking lots) and public services, exacerbating the decline in living convenience. The reduction in the number of residential areas further weakened community stability, especially with the disappearance of traditional courtyards, leading to the “gentrification” of living spaces, which reduced ordinary residents’ sense of access to quality spaces.
Planning Insights
Balanced Development Strategy: Support small-scale updates in peripheral areas (e.g., historical residential renovation subsidies) through a “landscape compensation fund”.
Mixed-use Control: Retain 20% affordable businesses in high-end commercial areas to ensure social inclusivity.
Long-term Quality Maintenance: Establish a system for regular facade maintenance and public space management to avoid short-term development trends.

6. Summary and Outlook

6.1. Main Findings of the Study

This research provides a systematic examination of the dynamic evolution mechanisms of spatial quality in historic districts through a case study of Tianjin’s Five Avenues. The findings indicate that spatial quality evolves through complex interactions among policy interventions, scene modifications, and emotional perceptions. Specifically, the “Comprehensive Management Measures” policy implemented in 2014 significantly boosted spatial perceptions of beauty and safety by promoting infrastructure development and heritage conservation. However, the analysis also reveals persistent challenges. The depressing emotion and boring emotion are closely linked to factors such as monotonous commercial environments, underused public spaces, and construction-related disruptions. Peripheral areas continue to suffer from resource under-allocation and slower development, weakening emotional perceptions of beauty, safety, and prosperity in those zones. Importantly, the absence of new planning policies between 2015 and 2020, combined with the impact of the COVID-19 pandemic, contributed to a decline in overall spatial quality and emotional vitality, particularly in the second phase (2015–2016). These findings underscore the need for continuous, equitable, and fine-grained policy intervention to sustain emotional well-being and spatial quality in historic districts over time.
The study highlights three primary drivers influencing spatial quality evolution. First, the careful preservation and esthetic enhancement of historical architecture and public spaces foster emotional identity and improve visual quality. Second, scene diversity and mixed functionalities substantially enhance the vitality and liveliness of urban spaces. Conversely, excessive commercialization and repetitive scene elements negatively influence emotional experiences by increasing boredom and feelings of oppression. Lastly, reduced transportation infrastructure and the neglected maintenance of peripheral areas exacerbate spatial inequalities.
Methodologically, the proposed dynamic “spatiotemporal imagery–emotion–scene” evaluation framework effectively addresses limitations inherent in traditional static evaluations, providing a robust analytical tool for continuous urban space quality monitoring. This approach not only facilitates a deeper understanding of urban space dynamics but also supports evidence-based policymaking for sustainable tourism and heritage preservation initiatives.

6.2. Limitations of the Study

The conclusions of this study are primarily based on a single case of the Five Avenues area in Tianjin, and the generalizability of these conclusions should be approached with caution. Although this area holds research value as a typical representative of modern concession architecture, historic districts with different cultural backgrounds (e.g., ancient water towns in the Jiangnan region or industrial heritage districts) may exhibit distinct evolutionary paths due to differences in preservation policies and functional positioning. For instance, the quality evolution of traditional villages may rely more on community autonomy than planning interventions, while industrial heritage areas are driven by both technical restoration and the creative economy. This necessitates future research that validates the transferability of the theory through cross-regional comparisons.
While the emotional perception model can capture the public’s intuitive response to streetscapes, its sensitivity to negative emotions (such as depressing or boring feelings) is insufficient, which may weaken the accuracy of analysis for complex social emotions. Additionally, the annotated data used to train the model still contains subjective biases—different cultural groups may have drastically different emotional responses to the same scene. Moreover, situational factors such as season, weather, and other environmental elements have not been incorporated into the evaluation framework, further limiting the stability of the results. Future research should combine physiological sensors (e.g., eye-tracking, heart rate monitoring) with semantic analysis technologies to construct a framework for emotional assessment that integrates both subjective and objective aspects.
The multidimensionality of spatial quality also presents an important limitation of this study. Although streetscape imagery can reflect visual and emotional dimensions, it is difficult to capture the composite impact of sensory experiences such as sound environments (e.g., traffic noise, market chatter) or odors (e.g., plant fragrance, cooking fumes) on spatial perception. For example, the visual appeal of Minyuan Square may be significantly diminished by the diffusion of cooking fumes from nearby restaurants. Such multisensory conflicts should be analyzed more deeply through interdisciplinary methods (e.g., wearable device monitoring).
On the technical front, the “black box” nature of deep learning models results in a lack of interpretability for the driving mechanisms. Although scene recognition technologies have revealed correlations between functional layout and emotional feedback, the causal pathways between the two (e.g., “why does increased greenery reduce feelings of depression”) still need to be verified using traditional methods such as spatial syntax and behavioral annotations. Furthermore, the scale and quality of annotated data used for model training limit its generalizability to small-scale, highly heterogeneous districts, making the development of lightweight adaptive models an important direction for future breakthroughs.

6.3. Future Research Directions

The findings of this study provide a foundational framework for the dynamic analysis of built environment spatial quality in historic districts. However, further theoretical refinement and practical application still require multidimensional expansion. Firstly, cross-regional and cross-cultural comparative studies urgently need to be promoted. The diversity of historic districts in China (e.g., Jiangnan water towns, industrial heritage, and minority settlements) offers a natural laboratory to verify the universality of evolutionary mechanisms. For example, the spatial quality of ancient water towns in Jiangnan may rely more on water systems and community autonomy, while industrial heritage districts are driven by both technical restoration and the creative economy. By comparing the policy response patterns and emotional feedback differences, more adaptable planning theories can be distilled.
Secondly, the multisensory interaction mechanisms of spatial quality have not been fully revealed. While the visual analysis of streetscapes can capture explicit environmental features, the modulation effects of soundscapes (e.g., market noise, flowing water) and scentscapes (e.g., traditional food aromas, plant fragrances) on emotional experience cannot be ignored. Future research can combine wearable sensors with semantic segmentation technology to build a “visual–auditory–olfactory”-coupled evaluation model, analyzing the deeper impacts of multisensory conflicts (e.g., the offsetting effect of beautiful streetscapes and traffic noise) on spatial identity.
From a technical perspective, the transparency and adaptability of deep learning models need to be enhanced simultaneously. The development of dynamic quality simulation tools based on reinforcement learning can quantify the long-term effects of different planning scenarios (e.g., mixed-use, green space connectivity), providing a “policy testbed” for decision-makers. At the same time, the exploration of lightweight adaptive models will enhance the analytical precision for small-scale, highly heterogeneous districts, advancing the methodology from “case validation” to “global simulation”.
Lastly, spatial quality research needs to be deeply integrated into the sustainable development agenda. By linking with the United Nations Sustainable Development Goals (SDGs), a “quality enhancement—ecological resilience—social equity” synergistic pathway can be established. For example, embedding low-carbon materials and community co-governance elements in historic district renewal can ensure that spatial optimization simultaneously serves cultural heritage protection, carbon neutrality, and inclusive development, achieving the co-evolution of multidimensional values.

6.4. Conclusions

This study proposes an intelligent evaluation framework that integrates spatiotemporal street view imagery, affective perception modeling, and scene recognition to uncover the complex influences of policy interventions, environmental changes, and infrastructure conditions on spatial quality, and validates with Tianjin’s Wudadao Historic District. The empirical findings indicate that targeted policy measures significantly enhance residents’ emotional well-being, particularly in terms of esthetics, vibrancy, and perceived safety. However, they also reveal persistent disparities in spatial quality arising from uneven resource allocation.
Key insights suggest that the sustainable improvement of spatial quality in historic districts largely depends on the balanced preservation of cultural heritage, functional diversity, mixed-use recreational environments, and people-centered urban design principles. In contrast, excessive commercialization and spatial homogenization may undermine emotional resonance and lead to adverse outcomes, underscoring the necessity of refined scene management and equitable resource distribution.
Despite methodological innovations, this study acknowledges certain limitations, such as the cultural sensitivity of affective perception models and their adaptability across different socio-cultural contexts. Future research should incorporate multisensory environmental data and enhance model interpretability and adaptability to better accommodate the diverse historical settings of urban spaces.
Overall, the proposed intelligent evaluation framework not only advances the technological application of urban planning and design but also offers actionable insights for building resilient, equitable, and culturally vibrant built environments. It provides a practical means to bridge the gap between technological innovation and sustainable governance in the context of historical urban districts.

Author Contributions

Conceptualization, Y.L.; Methodology, Y.L.; Validation, B.Y.; Investigation, B.Y.; Resources, L.H.; Data curation, L.H.; Writing—original draft, Y.L.; Writing—review & editing, L.H.; Supervision, B.Y. All authors have read and agreed to the published version of the manuscript.

Funding

This research received no external funding.

Data Availability Statement

Due to the sensitive nature of certain data presented in this paper, the data are not being made publicly available for the time being. Researchers who are interested in accessing the experimental data may contact the corresponding author by email.

Conflicts of Interest

The authors declare no conflict of interest.

References

  1. Go, H.; Kang, M. Metaverse tourism for sustainable tourism development: Tourism agenda 2030. Tour. Rev. 2023, 78, 381–394. [Google Scholar] [CrossRef]
  2. Qianqian, Z.; Chengcai, T.; Ying, Z. Evaluation and Enhancement Model of the Development Potential of Green Tourism in Beijing’s Ecological Conservation Area. J. Resour. Ecol. 2024, 15, 484–495. [Google Scholar] [CrossRef]
  3. Encalada-Abarca, L.; Ferreira, C.C.; Rocha, J. Measuring tourism intensification in urban destinations: An approach based on fractal analysis. J. Travel Res. 2022, 61, 394–413. [Google Scholar] [CrossRef]
  4. Ramkissoon, H. Perceived social impacts of tourism and quality-of-life: A new conceptual model. J. Sustain. Tour. 2023, 31, 442–459. [Google Scholar] [CrossRef]
  5. Stessens, P.; Canters, F.; Huysmans, M.; Khan, A.Z. Urban green space qualities: An integrated approach towards GIS-based assessment reflecting user perception. Land Use Policy 2020, 91, 104319. [Google Scholar] [CrossRef]
  6. Biljecki, F.; Ito, K. Street view imagery in urban analytics and GIS: A review. Landsc. Urban Plan. 2021, 215, 104217. [Google Scholar] [CrossRef]
  7. Yu, X.; Her, Y.; Huo, W.; Chen, G.; Qi, W. Spatio-temporal monitoring of urban street-side vegetation greenery using Baidu Street View images. Urban For. Urban Green. 2022, 73, 127617. [Google Scholar] [CrossRef]
  8. Hamim, O.F.; Ukkusuri, S.V. Towards safer streets: A framework for unveiling pedestrians’ perceived road safety using street view imagery. Accid. Anal. Prev. 2024, 195, 107400. [Google Scholar] [CrossRef]
  9. Liang, X.; Zhao, T.; Biljecki, F. Revealing spatio-temporal evolution of urban visual environments with street view imagery. Landsc. Urban Plan. 2023, 237, 104802. [Google Scholar] [CrossRef]
  10. He, J.; Zhang, J.; Yao, Y.; Li, X. Extracting human perceptions from street view images for better assessing urban renewal potential. Cities 2023, 134, 104189. [Google Scholar] [CrossRef]
  11. Nguyen, P.-Y.; Astell-Burt, T.; Rahimi-Ardabili, H.; Feng, X. Green space quality and health: A systematic review. Int. J. Environ. Res. Public Health 2021, 18, 11028. [Google Scholar] [CrossRef] [PubMed]
  12. Amin, A. Collective culture and urban public space. City 2008, 12, 5–24. [Google Scholar] [CrossRef]
  13. Lynch, K. The Image of the City; MIT Press: Cambridge, MA, USA, 1964. [Google Scholar]
  14. Fleischmann, M.; Feliciotti, A.; Kerr, W. Evolution of urban patterns: Urban morphology as an open reproducible data science. Geogr. Anal. 2022, 54, 536–558. [Google Scholar] [CrossRef]
  15. Zhou, H.; He, S.; Cai, Y.; Wang, M.; Su, S. Social inequalities in neighborhood visual walkability: Using street view imagery and deep learning technologies to facilitate healthy city planning. Sustain. Cities Soc. 2019, 50, 101605. [Google Scholar] [CrossRef]
  16. Pike, A.; Béal, V.; Cauchi-Duval, N.; Franklin, R.; Kinossian, N.; Lang, T.; Leibert, T.; MacKinnon, D.; Rousseau, M.; Royer, J. ‘Left behind places’: A geographical etymology. Reg. Stud. 2024, 58, 1167–1179. [Google Scholar] [CrossRef]
  17. Machicao, J.; Specht, A.; Vellenich, D.; Meneguzzi, L.; David, R.; Stall, S.; Ferraz, K.; Mabile, L.; O’brien, M.; Corrêa, P. A deep-learning method for the prediction of socio-economic indicators from street-view imagery using a case study from Brazil. Data Sci. J. 2022, 21, 6. [Google Scholar] [CrossRef]
  18. Fan, Z.; Zhang, F.; Loo, B.P.; Ratti, C. Urban visual intelligence: Uncovering hidden city profiles with street view images. Proc. Natl. Acad. Sci. USA 2023, 120, e2220417120. [Google Scholar] [CrossRef] [PubMed]
  19. He, L.; Páez, A.; Liu, D. Built environment and violent crime: An environmental audit approach using Google Street View. Comput. Environ. Urban Syst. 2017, 66, 83–95. [Google Scholar] [CrossRef]
  20. Li, Y.; Peng, L.; Wu, C.; Zhang, J. Street View Imagery (SVI) in the built environment: A theoretical and systematic review. Buildings 2022, 12, 1167. [Google Scholar] [CrossRef]
  21. Chen, C.; Li, H.; Luo, W.; Xie, J.; Yao, J.; Wu, L.; Xia, Y. Predicting the effect of street environment on residents’ mood states in large urban areas using machine learning and street view images. Sci. Total Environ. 2022, 816, 151605. [Google Scholar] [CrossRef]
  22. Sangers, R.; van Gemert, J.; van Cranenburgh, S. Explainability of Deep Learning models for Urban Space perception. arXiv 2022, arXiv:2208.13555. [Google Scholar]
  23. Zhou, B.; Lapedriza, A.; Khosla, A.; Oliva, A.; Torralba, A. Places: A 10 million image database for scene recognition. IEEE Trans. Pattern Anal. Mach. Intell. 2017, 40, 1452–1464. [Google Scholar] [CrossRef]
  24. Dubey, A.; Naik, N.; Parikh, D.; Raskar, R.; Hidalgo, C.A. Deep learning the city: Quantifying urban perception at a global scale. In Proceedings of the Computer Vision–ECCV 2016: 14th European Conference, Amsterdam, The Netherlands, 11–14 October 2016; pp. 196–212. [Google Scholar]
  25. Wei, H.; Zhou, M.; Kang, S.; Zhang, J. Sense of place of heritage conservation districts under the tourist gaze—Case of the Shichahai heritage conservation district. Sustainability 2022, 14, 10384. [Google Scholar] [CrossRef]
  26. Zhang, Y.; Han, Y. Vitality evaluation of historical and cultural districts based on the values dimension: Districts in Beijing City, China. Herit. Sci. 2022, 10, 137. [Google Scholar] [CrossRef]
  27. Zhu, X.; Chiou, S.-C. A study on the sustainable development of historic district landscapes based on place attachment among tourists: A case study of Taiping old street, Taiwan. Sustainability 2022, 14, 11755. [Google Scholar] [CrossRef]
  28. Baloch, Q.B.; Shah, S.N.; Iqbal, N.; Sheeraz, M.; Asadullah, M.; Mahar, S.; Khan, A.U. Impact of tourism development upon environmental sustainability: A suggested framework for sustainable ecotourism. Environ. Sci. Pollut. Res. 2023, 30, 5917–5930. [Google Scholar] [CrossRef]
  29. Wang, L.; Han, X.; He, J.; Jung, T. Measuring residents’ perceptions of city streets to inform better street planning through deep learning and space syntax. ISPRS J. Photogramm. Remote Sens. 2022, 190, 215–230. [Google Scholar] [CrossRef]
  30. Chen, Y.; Ren, X.; Xu, X.; Wang, R.; Xu, Y. Evaluation of Living Environment Quality in Urban Residential Areas under the Concept of Urban Renewal—A Case Study of Binjiang District, Hangzhou, China. Sustainability 2023, 15, 14104. [Google Scholar] [CrossRef]
  31. Liu, X. The effects of commercialisation on urban heritage in Tianjin: A study of citizens’ livelihood in the Five Avenues (Wudadao) historical district. Built Herit. 2024, 8, 42. [Google Scholar] [CrossRef]
  32. Lu, Y. Using Google Street View to investigate the association between street greenery and physical activity. Landsc. Urban Plan. 2019, 191, 103435. [Google Scholar] [CrossRef]
Figure 1. Study area location map.
Buildings 15 01953 g001
Figure 2. Schematic diagram of street view image collection.
Buildings 15 01953 g002
Figure 3. The number and temporal distribution of street view images utilized in this study (breakdown by the considered periods).
Buildings 15 01953 g003
Figure 4. Evaluation framework diagram.
Buildings 15 01953 g004
Figure 5. The changes in the beautiful emotional phase and the phase differences.
Buildings 15 01953 g005
Figure 6. The changes in the boring emotional phase and the phase differences.
Buildings 15 01953 g006
Figure 7. The changes in the depressing emotional phase and the phase differences.
Buildings 15 01953 g007
Figure 8. The changes in the lively emotional phase and the phase differences.
Buildings 15 01953 g008
Figure 9. The changes in the safety emotional phase and the phase differences.
Buildings 15 01953 g009
Figure 10. The changes in the wealth emotional phase and the phase differences.
Buildings 15 01953 g010
Figure 11. The dynamic recognition results of the beautiful emotion.
Buildings 15 01953 g011
Figure 12. The dynamic recognition results of the boring emotion.
Buildings 15 01953 g012
Figure 13. The dynamic recognition results of the depressing emotion.
Buildings 15 01953 g013
Figure 14. The dynamic recognition results of the lively emotion.
Buildings 15 01953 g014
Figure 15. The dynamic recognition results of the safety emotion.
Buildings 15 01953 g015
Figure 16. The dynamic recognition results of the wealth emotion.
Buildings 15 01953 g016
Table 1. Policy recommendations.
EmotionCorresponding Optimization Policy
Beautiful EmotionBalance heritage preservation with equitable development; increase greenery; maintain pedestrian-friendly environments; minimize visual clutter; invest equitably in peripheral areas
Boring EmotionEnhance functional diversity; activate peripheral micro-public spaces; regularly introduce diverse cultural activities and mixed-use developments
Depressing EmotionImplement architectural controls on building density and height; manage construction dynamically (shorter barrier periods, transparent fencing); create open spaces and architectural setbacks; introduce small-scale spatial interventions (e.g., pocket parks, art installations)
Lively EmotionEncourage community-driven initiatives; implement flexible zoning policies; support cultural markets and mixed-use spaces
Safety EmotionApply time-specific management strategies (e.g., pedestrian-only streets at night); enhance smart security and street lighting; introduce localized policing solutions (micro-police stations)
Wealthy EmotionPromote inclusive development (retain affordable commercial options); establish equitable resource distribution and scenic compensation mechanisms for peripheral areas
Table 2. Classification.
ClassificationScenario Factors
Transportation facilitiesBus station/indoor, Subway station/platform, Railway station/platform, Airport terminal, Highway, Runway, Race track, Parking lot, Parking lot/outdoor, Parking garage/outdoor, Garage/outdoor, Lane
RecreationPark, Playground, Skating rink/outdoor, Skating rink/outdoor, Ski resort, Beer garden, Picnic area, Promenade, Terrace, Zen garden, Market/outdoor, Arcade
Residential areaResidential area, Apartment building/outdoor, Luxury house, Ordinary house, Courtyard, Roof garden, Balcony/outdoor, House, Inn/outdoor
Public facilitiesAtrium/public, Hospital, Library/outdoor, Campus, Fire station, Fire exit, Prison, Prison cell, Embassy
Commercial areaRepair shop, Gas station, Fast food restaurant eatery/outdoor, Department store/outdoor, Storefront, Ticket booth, Restaurant/Outdoor restaurant terrace, Telephone booth
Industry and InfrastructureIndustrial area, Construction site, Building façade, Car factory, Car showroom, Motel, Dam, Canal/city, Server room, Lock, Lock chamber, Loading dock, Barn door, Drying room, Stable, Slum, Tree house, Hunting lodge/outdoors
Disclaimer/Publisher’s Note: The statements, opinions and data contained in all publications are solely those of the individual author(s) and contributor(s) and not of MDPI and/or the editor(s). MDPI and/or the editor(s) disclaim responsibility for any injury to people or property resulting from any ideas, methods, instructions or products referred to in the content.

