Article

Analysis of Filled Soil-Induced Pier Offset and Cracking in a Highway Bridge and Retrofitting Scheme Development: A Case Study

1
School of Architectural Engineering, Zhengzhou Shengda University, Zhengzhou 451191, China
2
School of Civil Engineering, Zhengzhou University, Zhengzhou 450001, China
3
Henan Transportation Research Institute Co., Ltd., Zhengzhou 450015, China
*
Authors to whom correspondence should be addressed.
Buildings 2025, 15(11), 1929; https://doi.org/10.3390/buildings15111929
Submission received: 24 April 2025 / Revised: 24 May 2025 / Accepted: 27 May 2025 / Published: 2 June 2025
(This article belongs to the Section Building Materials, and Repair & Renovation)

Abstract

This study investigates the underlying causes of pier displacement and cracking in a highway link bridge. The initial geological assessment ruled out slope instability as a contributing factor to pier movement. Subsequently, a comprehensive analysis, integrating in situ soil investigation and finite element modeling, was conducted to evaluate the influence of additional fill loads on the piers. The findings reveal that the additional filled soil loads were the primary driver of pier tilting and lateral displacement, leading to a significant risk of cracking, particularly in the mid-section of the piers. Following the removal of the filled soil, visual inspection of the piers confirmed the development of circumferential cracks on the columns of Pier 7, with the crack distribution closely aligning with the high-risk zones predicted by the finite element analysis. To address the observed damage and residual displacement, a reinforcement strategy combining column strengthening and alignment correction was proposed and validated through load-bearing capacity calculations. This study not only provides a scientific basis for analyzing the causes of accidents and bridge reinforcement but, more importantly, it provides a systematic method for analyzing the impact of additional filled soil loads on bridge piers, offering guidance for accident analysis and risk assessment in similar engineering projects.

1. Introduction

With the acceleration of global urbanization, infrastructure construction is undergoing rapid changes. The construction and renewal of infrastructure require a significant amount of building materials and generate a large volume of construction waste [1,2,3,4]. Against the backdrop of rapid urban construction development, the amount of construction waste produced each year is staggering, accounting for 30–40% of the total waste produced in cities [5]. This construction waste is difficult to recycle effectively [4], and due to constraints, such as urban space and topography, the random filling of construction waste and discarded soil in the suburbs of cities is a common phenomenon. A considerable amount is directly backfilled under bridges, which can easily cause movement of the surrounding soil. When the height of the dump is significant, it is prone to landslides and collapses [6].
Landslides are one of the most common geological disasters, characterized by high frequency, potential for significant destruction, and a high incidence rate [7,8]. Under the pressure exerted by landslides and the weight of backfilled materials, multiple complex soil deformation mechanisms are triggered [9]. The increased overburden pressure from backfilling induces soil consolidation, leading to gradual settlement and horizontal displacement. This process generates additional lateral earth pressure on bridge piers through soil consolidation-induced lateral expansion and shear stress transfer at the soil interfaces. In addition, during a landslide, the sliding soil mass produces a substantial thrust force. The magnitude of this thrust is affected by factors such as the volume and velocity of the sliding soil, the friction coefficient between the soil and the underlying surface, and the slope angle [9]. In recent years, bridge accidents caused by landslides have occurred frequently. For example, on 2 February 2015, a landslide near the E18 highway in Norway damaged the foundations of two parallel bridges, the Mofjellbekken bridges, also known as the Skjeggestad bridges, leading to the partial collapse of one of them [9]. On 7 August 2021, a catastrophic rainfall-induced landslide occurred at Mount Silabaku in the source area of the Yusui Stream, Taiwan, with massive landslide deposits severely damaging the Minbaklu Bridge [10,11,12].
Although existing research has made valuable contributions to understanding the impact of landslides on bridge structures, certain aspects warrant further exploration. Recent studies have primarily employed on-site monitoring or single numerical simulation methods to investigate the response of bridges under additional loads [13,14,15]. However, these studies have not thoroughly analyzed the multi-factor interaction mechanisms that influence pile displacement and cracking under additional backfill loads. Unlike these studies, this research combines on-site investigations to obtain first-hand data and employs finite element modeling for precise simulation. It more comprehensively considers the complex interrelationships between backfill characteristics, geological conditions, and structural responses, thereby providing a new perspective for a deeper understanding of the problem. Furthermore, this study proposes a comprehensive reinforcement scheme that integrates cross-section enlargement with steel jacket reinforcement. This novel approach has not been sufficiently explored in existing research. The proposed reinforcement scheme is validated through detailed load-carrying capacity calculations, providing practical guidance for addressing similar bridge engineering issues.
The application of the finite element method (FEM) in analyzing surcharge impact on adjacent bridges has yielded valuable insights [16,17], yet its integration with comprehensive field validation appears somewhat limited. While the section enlargement method has proven effective in enhancing the load-bearing capacity of reinforced concrete bridges [18,19,20,21,22], a more holistic approach combining reinforcement with displacement correction may be necessary for bridge piers that have experienced displacement and damage due to surcharge-induced soil movement. Bridge reinforcement can restore the stiffness and resistance of the bridge, which is an important means of extending the service life of the bridge [23,24,25]; further research in this area, incorporating reinforcement techniques with displacement correction, could potentially offer more robust solutions.
In the field of bridge engineering, the interaction mechanisms among fill loads, geological conditions, and structural responses under complex geological settings remain poorly understood. Most existing research relies on simplified models or focuses solely on individual influencing factors, failing to systematically analyze the combined effects of multiple factors in real-world scenarios. This limitation creates a significant research gap that warrants further exploration. Against this backdrop, this study presents a detailed investigation into a specific case of pier displacement and cracking in a highway bridge. Employing a comprehensive approach that integrates on-site surveys, experimental testing, and finite element analysis, the research pursues four key objectives. First, it endeavors to uncover the coupled mechanisms among fill loads, geological conditions, and structural responses, thereby identifying the fundamental causes of pier damage. Second, this study aims to quantitatively evaluate the impact of additional foundation loads on piers, mediated through soil deformation processes. Third, it focuses on developing targeted reinforcement and correction strategies that effectively address both damage repair and displacement adjustment. Finally, the research seeks to offer directly applicable engineering insights for the inspection and remediation of similar bridge pathologies. By synergistically validating measured data with numerical simulations, this study effectively bridges the long-standing divide between theoretical research and practical engineering applications. As such, the findings of this research not only enrich the existing body of knowledge but also provide crucial references for understanding soil–structure interactions in complex geological environments.

2. Project Background

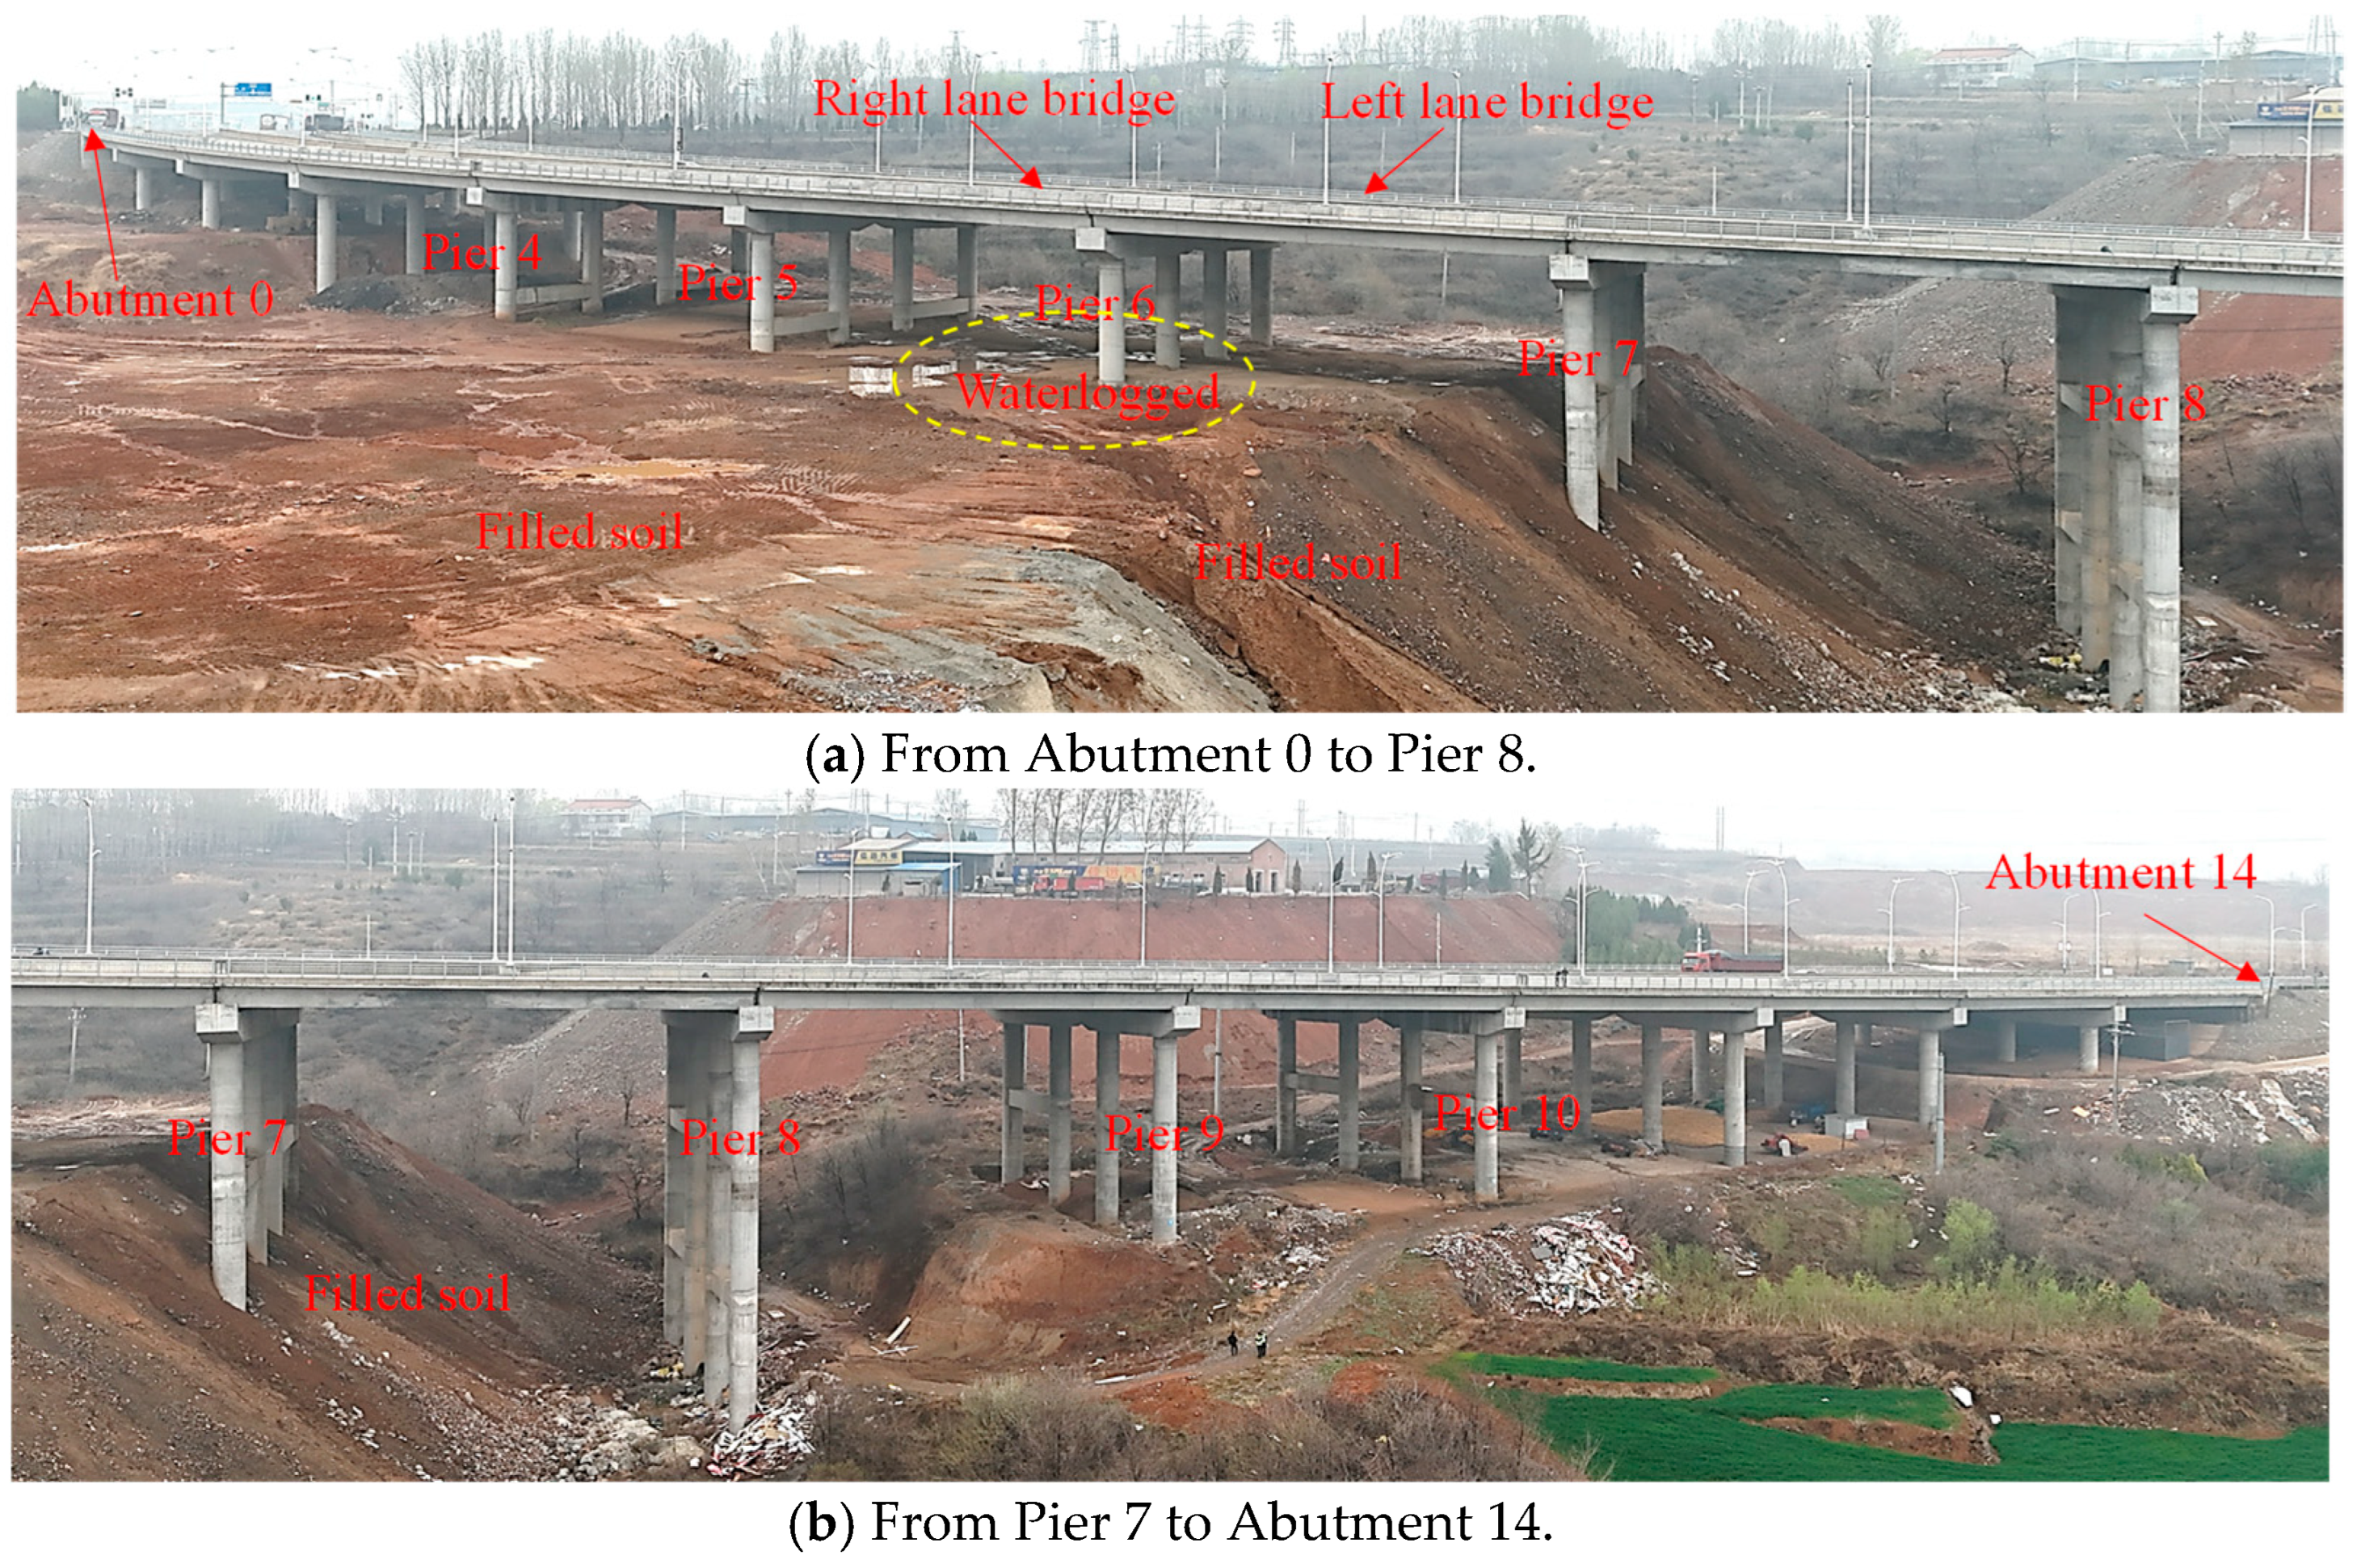
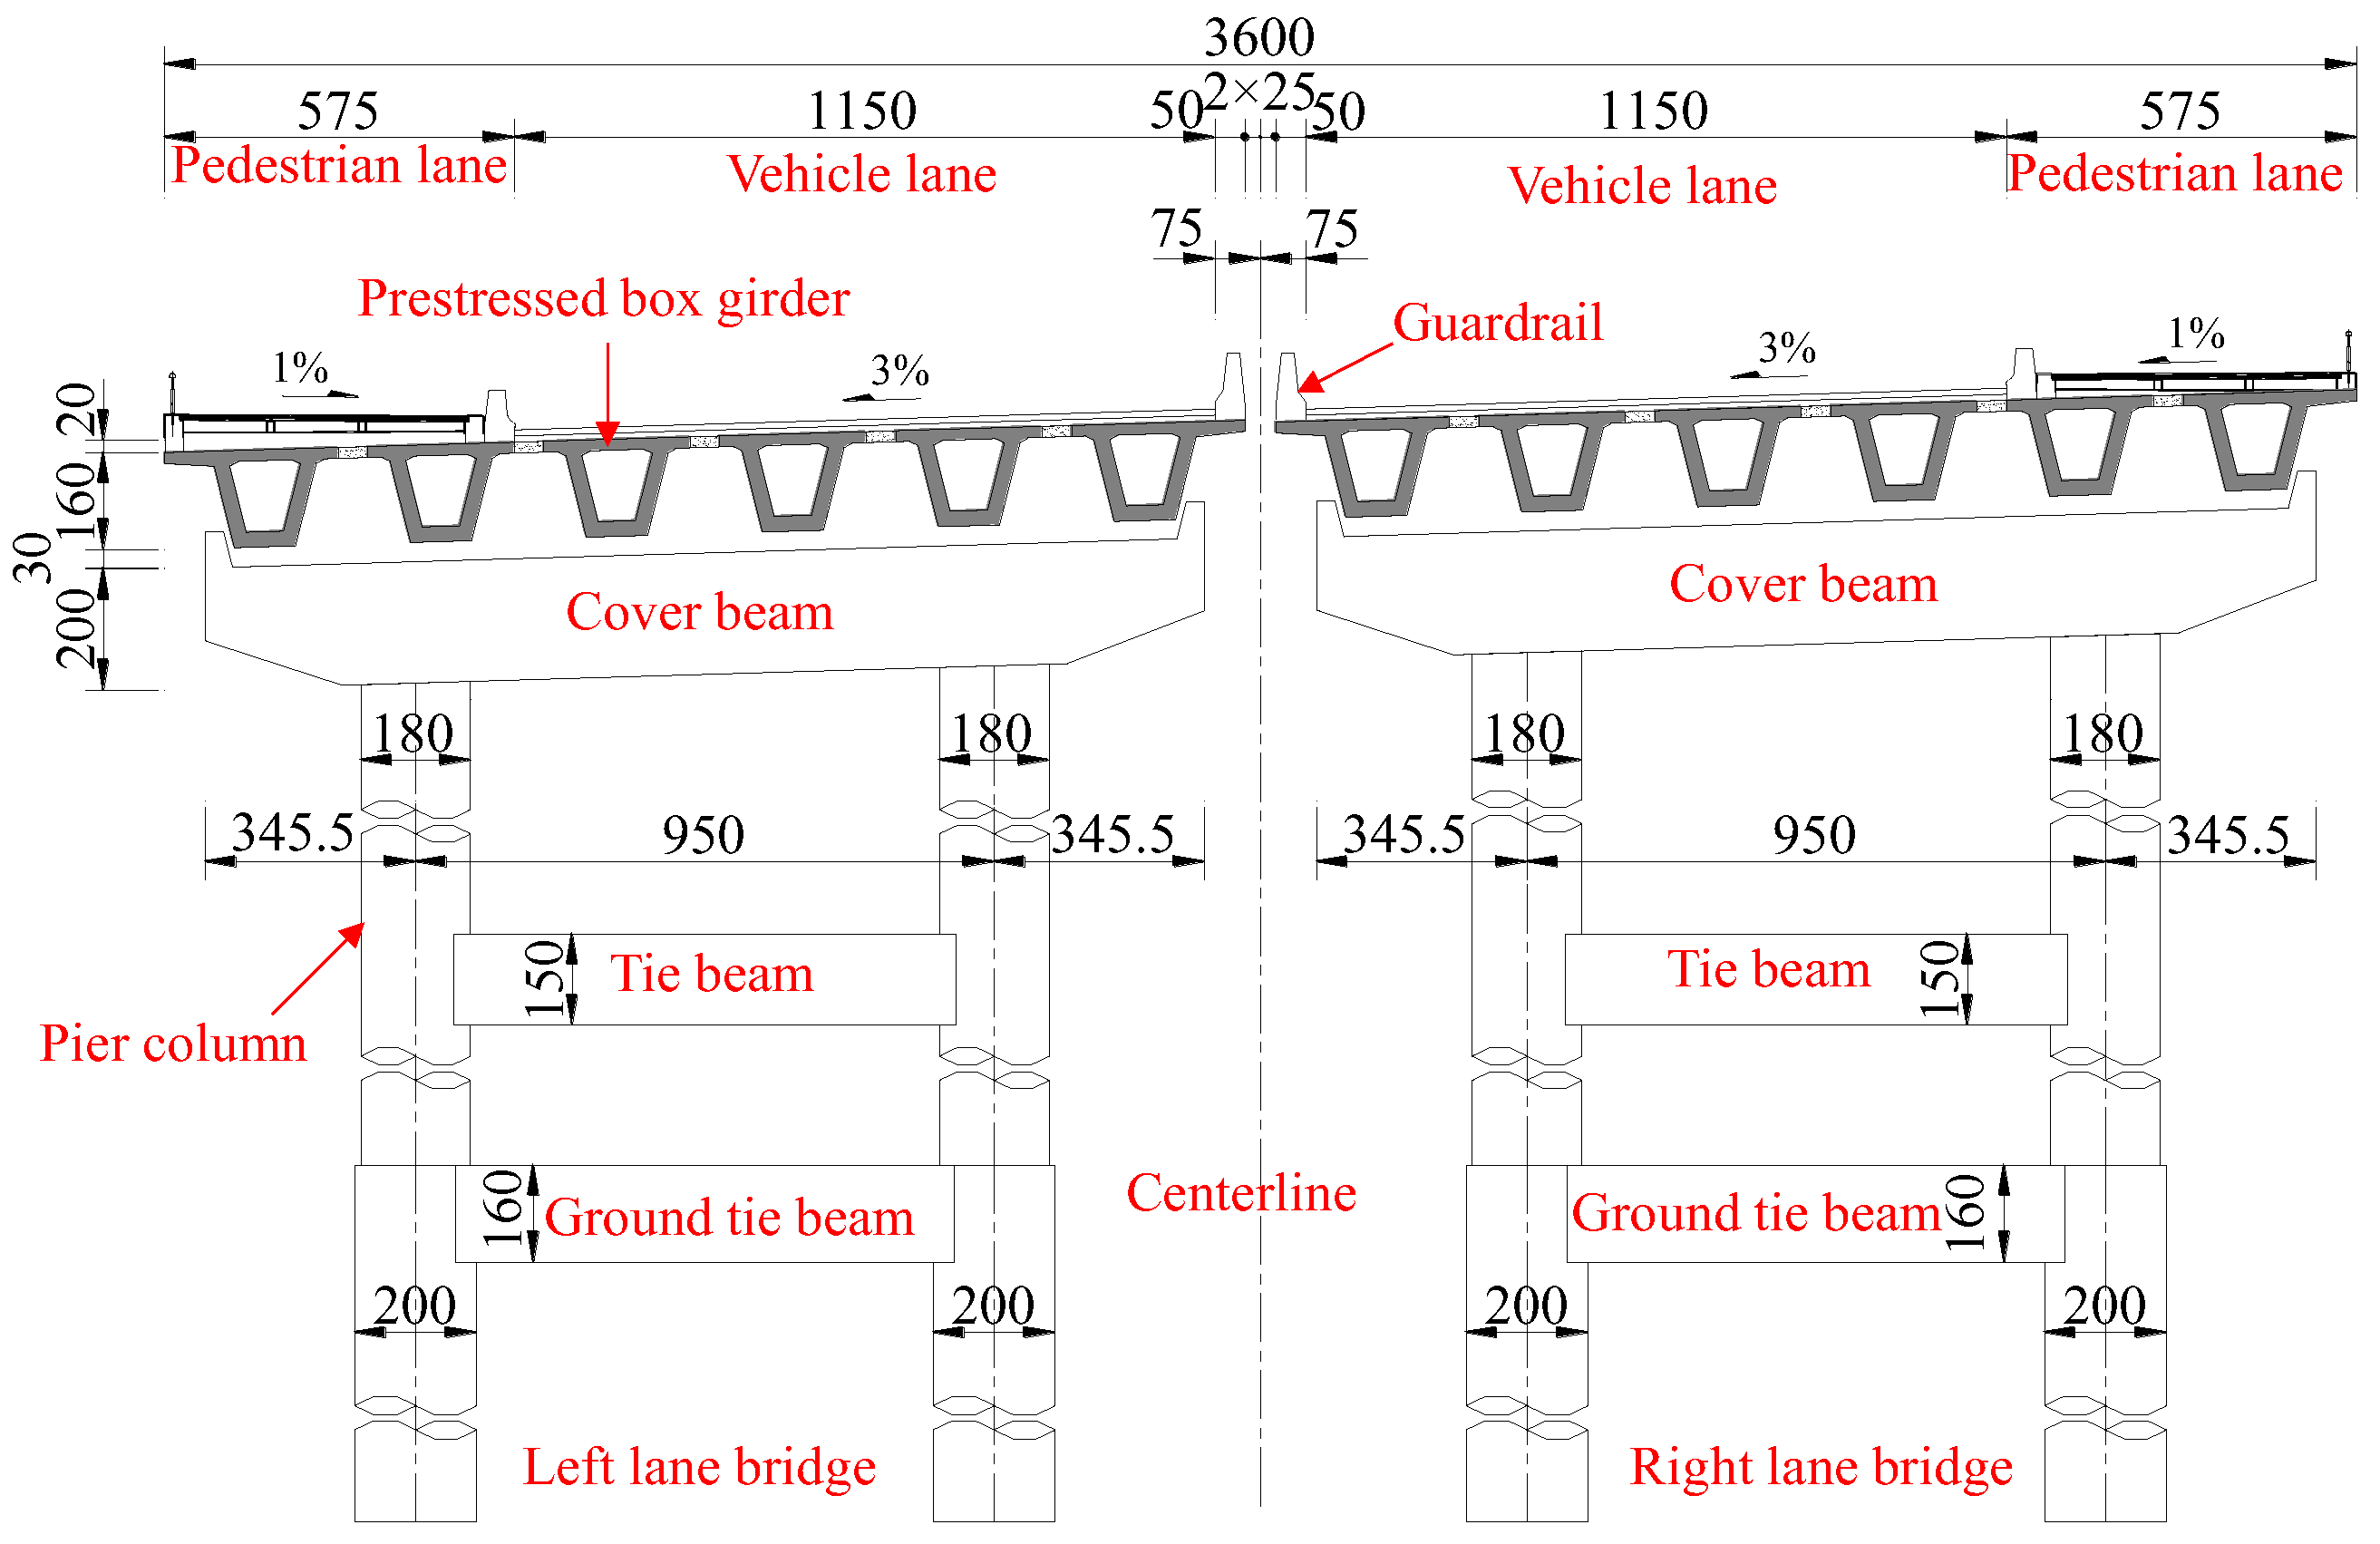
2.1. Bridge Overview and Accident

As shown in Figure 1, the highway-connecting bridge, situated on a circular curve with a radius of 300 m, utilizes prefabricated assembled box girders for its superstructure. The bridge is divided into left and right lane bridges, each spanning a total of 420 m with a combination of (4 × 30 + 3 × 30 + 3 × 30 + 4 × 30) m. The bridge is designed with a service life of 100 years and a design speed of 60 km/h. According to the Chinese municipal bridge design specification [26], the design load level is classified as City A-Level.
As depicted in Figure 2, the bridge features a transverse full width of 36.0 m. Its cross-section includes a 5.75 m pedestrian lane, an 11.5 m vehicle lane, a 0.5 m guardrail, a 0.5 m central divider, another 0.5 m guardrail, followed by another 11.5 m vehicle lane, and a final 5.75 m pedestrian lane. The bridge piers are constructed as column piers, all resting on pile foundations. Abutment 0 is a U-shaped abutment with an enlarged foundation, while Abutment 14 is a ribbed slab abutment supported by a pile foundation. The precast box girder of the superstructure is fabricated from C50 concrete, while the bridge piers, tie girders, and abutments are made of C40 concrete. The pile foundation consists of C30 submerged concrete, and the bridge deck is constructed with C50 waterproof concrete. The box girder is prestressed using 1860 high-strength, low-relaxation strands, and the bridge’s reinforcement bars include HRB400 and HPB300 steel.
The bridge was officially opened to traffic in July 2020 and remained in good condition until July 2023. Subsequently, gradual backfilling operations were conducted under the bridge, and by May 2024, noticeable deformations, including shifted main girders and tilted piers, were identified. However, no cracking was observed in the visible sections of the piers.

2.2. Investigation of Geological Conditions at the Bridge Location

The bridge site area exhibits a gully geomorphology characteristic of middle and low mountains, with a U-shaped gully that remains dry year-round. The local topography features significant undulation, with ground elevations ranging from 684.72 to 728.75 m, resulting in a maximum height difference of 44.03 m. Through engineering-geological surveys, sampling tests, and in situ testing, the geotechnical structural characteristics and mechanical properties of the bridge site were investigated, and the stability of the bridge site and foundation was geological survey data reveal that the strata at the site comprise Quaternary Holocene (Q4ml) plain fill, Quaternary Upper Pleistocene (Q3dl), Quaternary Middle Pleistocene (Q2dl), Carboniferous Taiyuan Formation (C3t) limestone, mudstone, and sandstone, as well as Ordovician Peak Formation (O2f) limestone. As shown in Table 1, the geotechnical strata at the bridge site are divided into eight layers, with the basic allowable bearing capacity ranging from 60 to 2000 kPa, indicating generally high strength.
A geological survey of the site identified no folds, faults, or other complex geological formations, indicating a simple geological structure. The groundwater at the site is classified as Ordovician tuff karst water, primarily recharged by lateral surface water systems and infiltration from atmospheric precipitation, reflecting simple hydrogeological conditions.
A comprehensive evaluation of the bridge’s geological investigation report concluded that the foundation stability of the site is relatively good. Additionally, the abutment areas on both sides are broad and flat, presenting no slope stability concerns. Consequently, the possibility of pier tilting and girder displacement due to slope sliding in the original landform was essentially ruled out.

3. Investigation of Filled Soil and Pier Offsets

In order to ascertain the safety status of the bridge structure, analyze the extent of damage and its causes, and establish a foundation for the subsequent rehabilitation efforts, an investigation was conducted in April 2024. The assessment focused on determining the sequence, thickness, and distribution of the filled soil beneath the bridge, as well as measuring the offsets of the bridge piers.

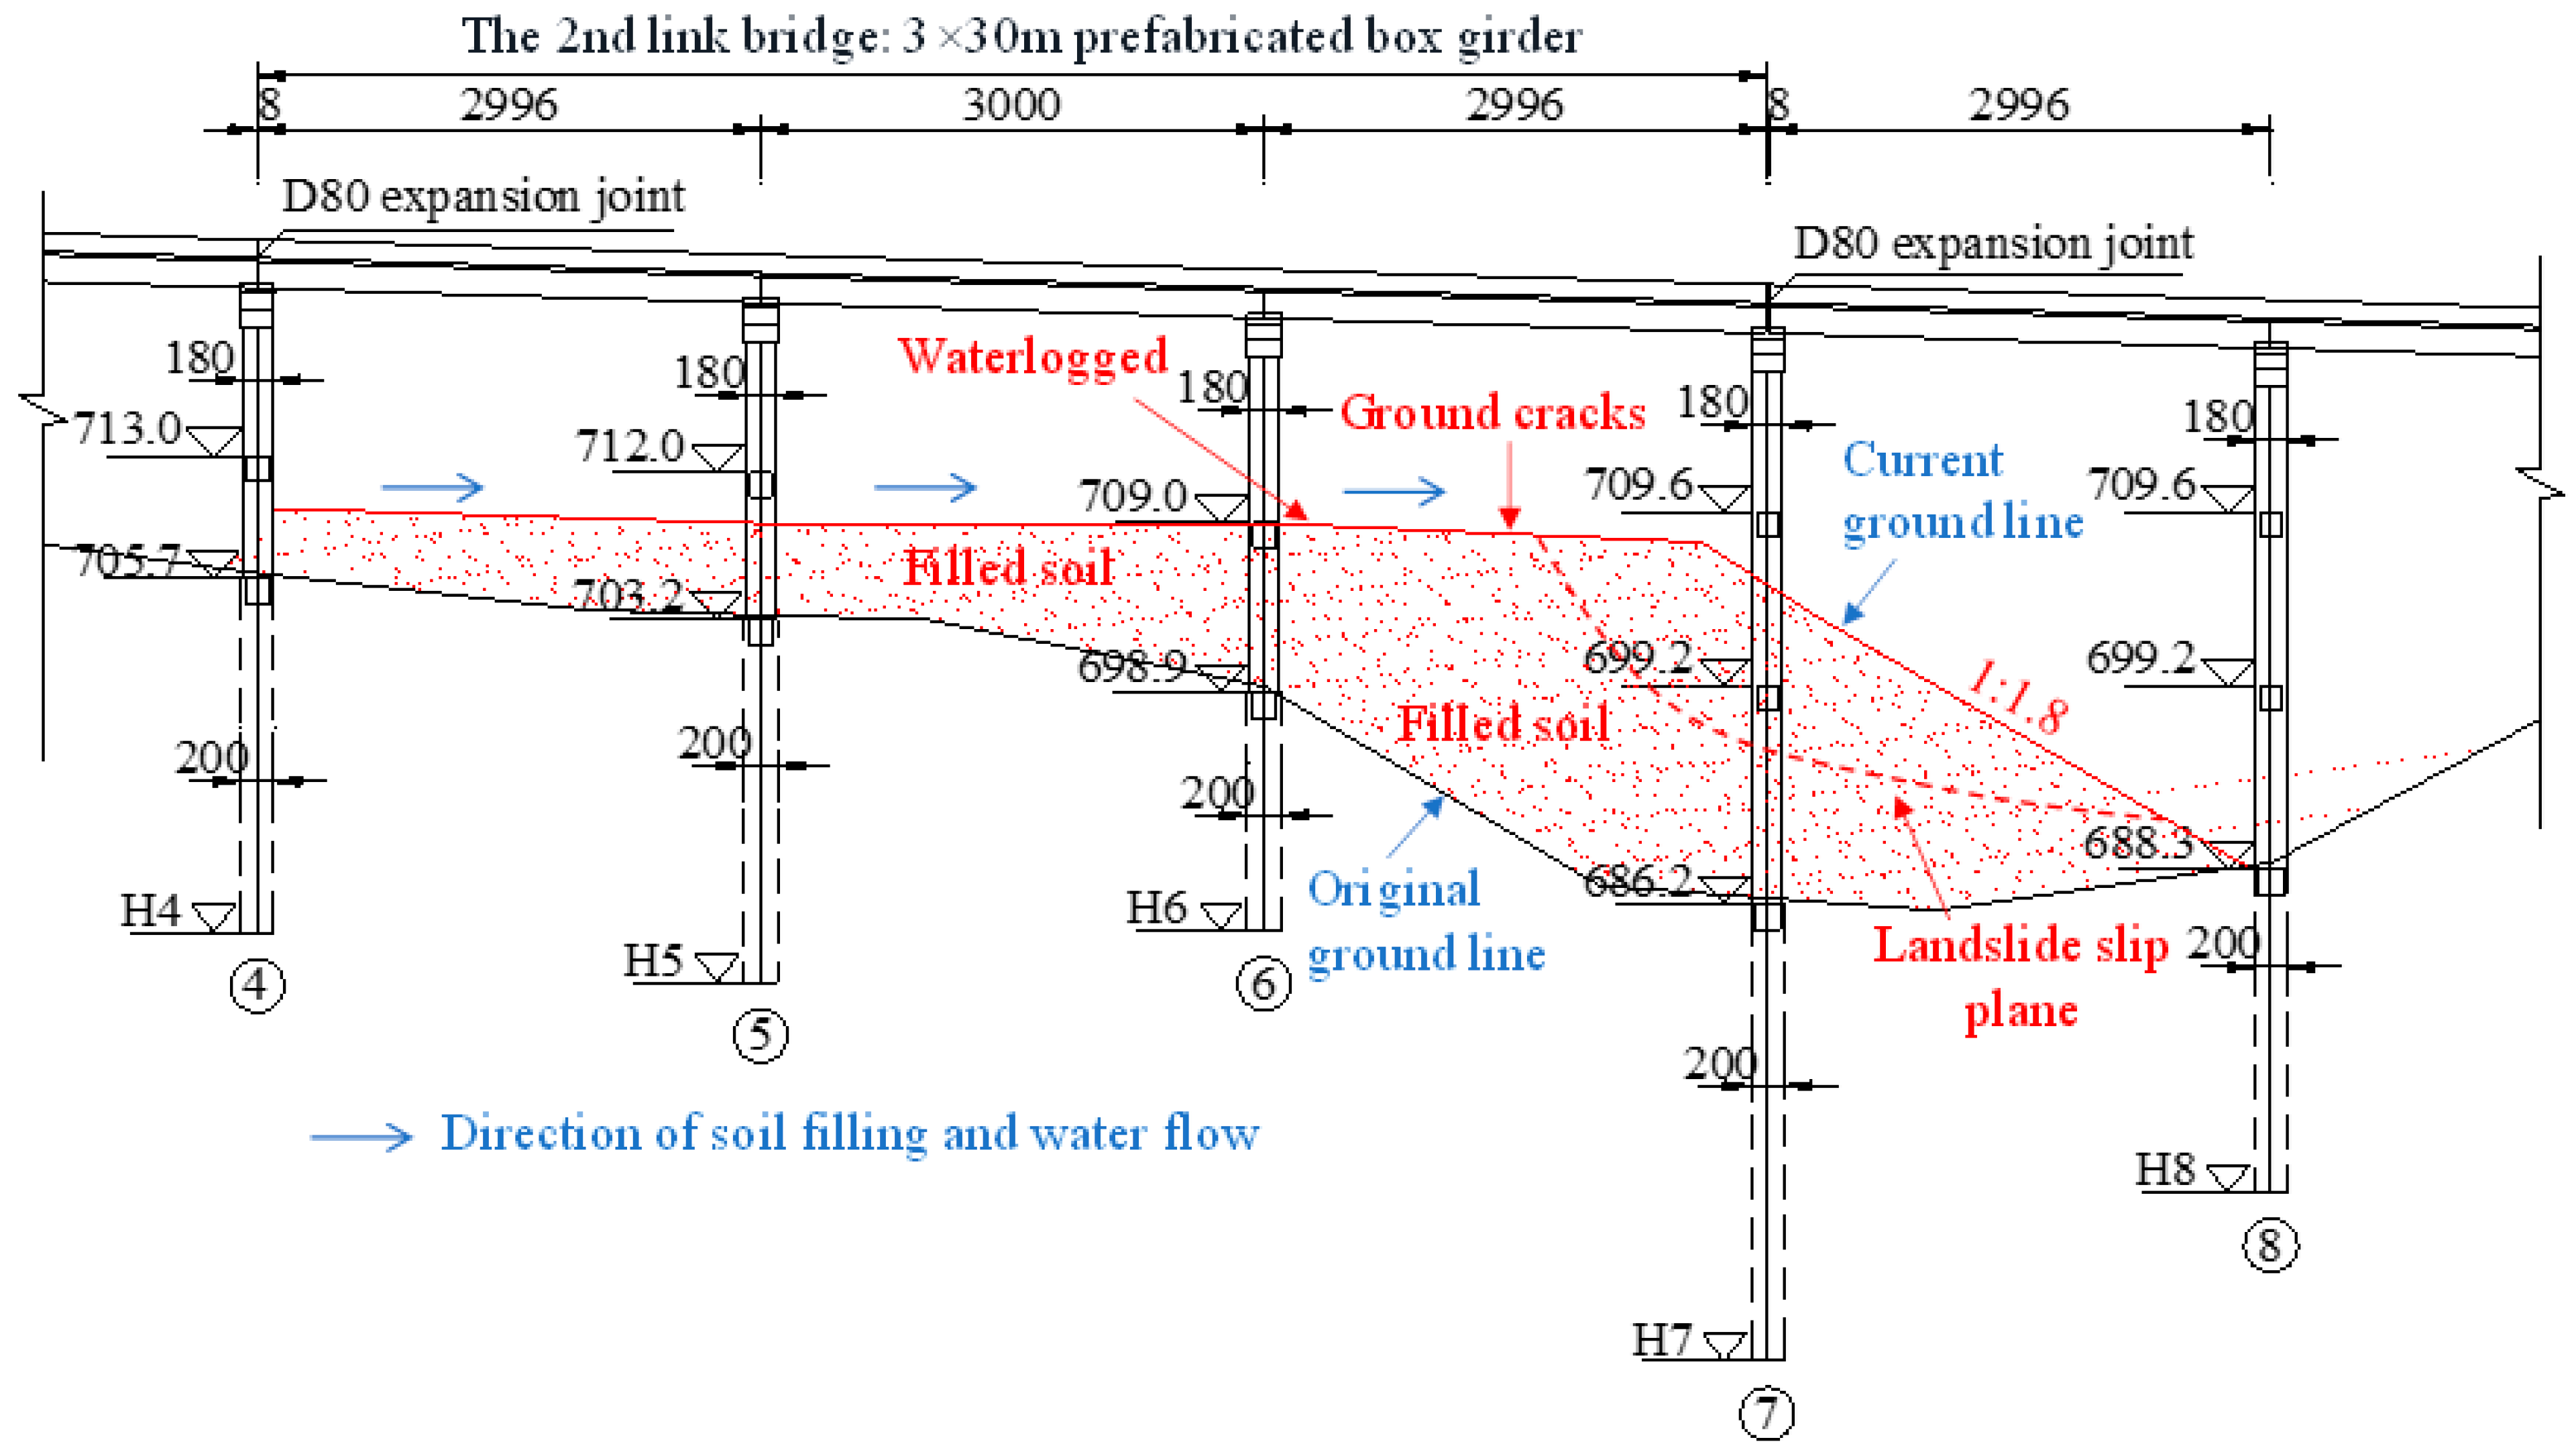
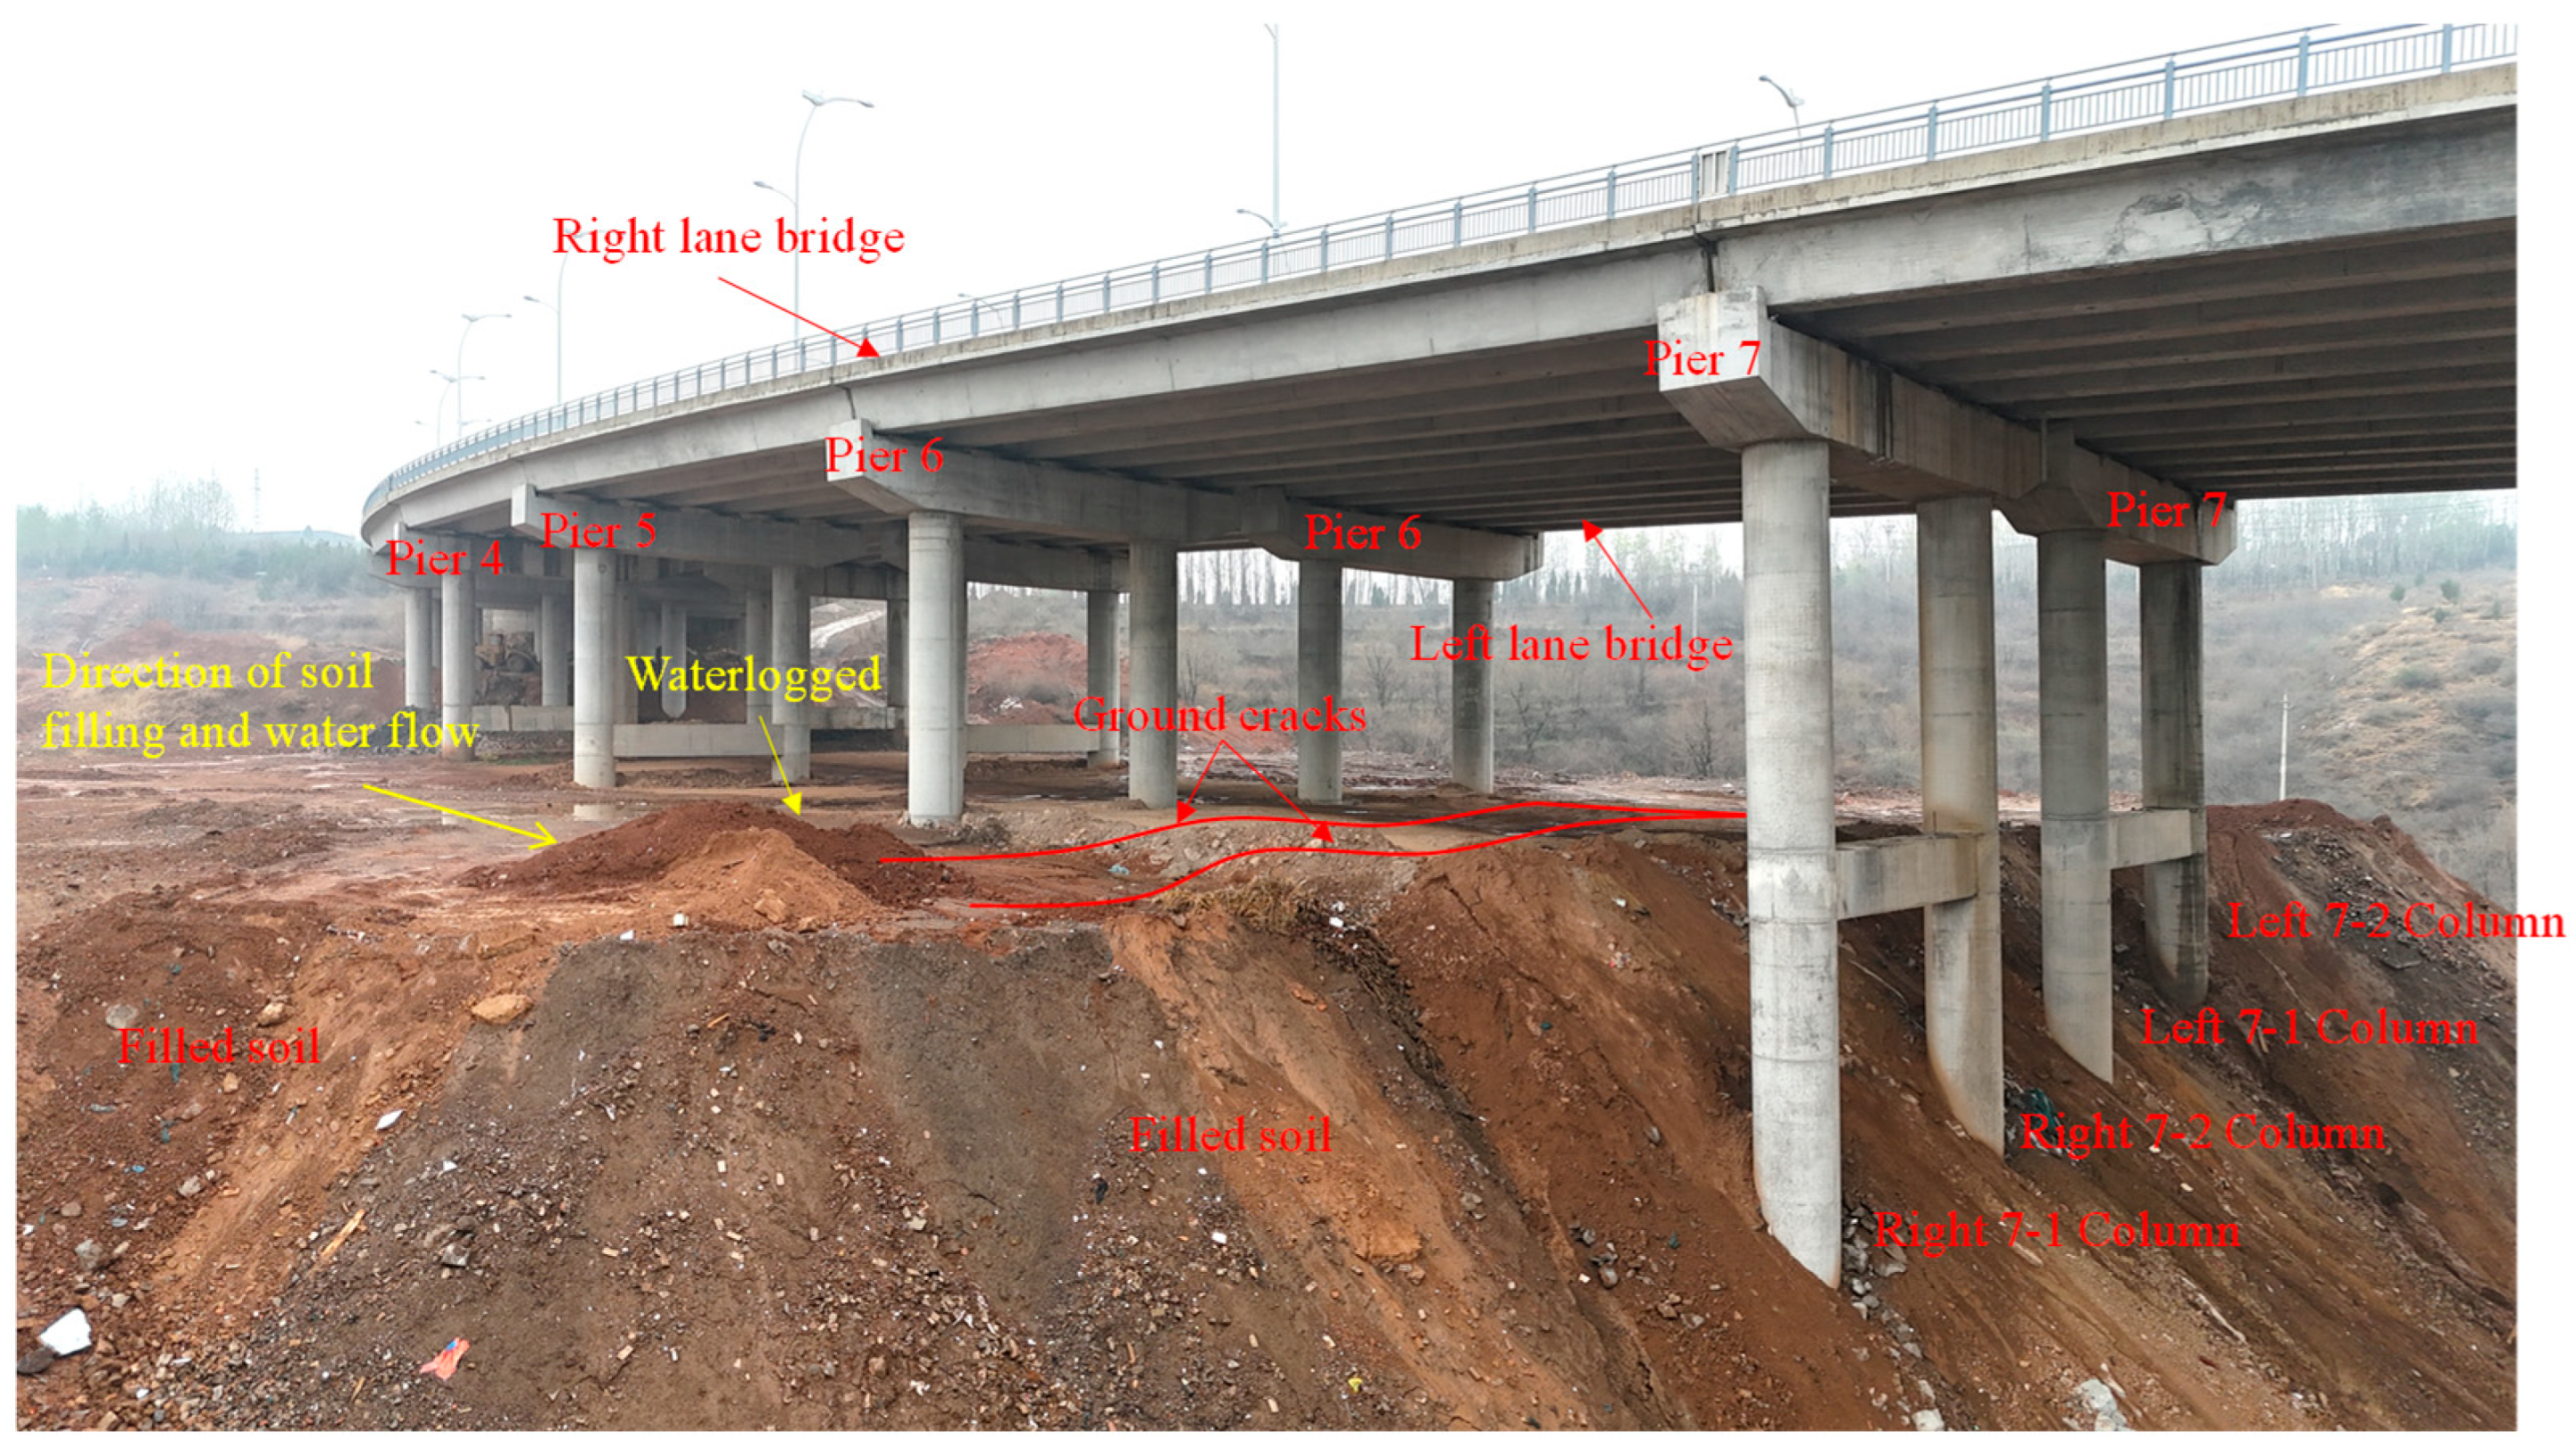
3.1. Investigation of Filled Soil Under the Bridge

As illustrated in Figure 3, the filled soil beneath the bridge is predominantly located under the left and right lanes of the second link bridge, specifically between Piers 4 and 7, with the soil thickness increasing progressively from Pier 4 to Pier 7. Measurements of the exposed heights of Piers 4–7 of the second link bridge and the current ground line were taken. Utilizing the design height of the piers and the original ground elevation, the thickness (unit: m) of the filled soil beneath the left and right lane bridge Piers 4–7 was calculated, with the results presented in Table 2. The maximum soil thickness, 19.65 m, was recorded at column 7-2 of Pier 7 on the left lane bridge, which is positioned adjacent to the slope and thus subject to unilateral soil pressure. Due to the fact that the ground surface has been completely covered by fill materials, direct measurement of the original ground elevation is infeasible. Consequently, the ground elevation at the bridge site was derived from the design drawings, and the fill thickness was calculated accordingly. While minor discrepancies may exist in this approach, they are deemed insufficient to compromise the overall assessment of the fill-induced effects on the bridge structure.
Filled soil is known for its heterogeneous composition, uneven particle size distribution, low compactness, high compressibility, variable permeability, and poor stability [27,28]. The water content significantly affects the physical properties and engineering characteristics of filled soil. When filled soil encounters water, the cohesive forces between the soil particles are weakened, leading to a decrease in strength, an increase in deformation, and a reduced ability to resist landslides, which can potentially cause landslides or collapses [7,29,30]. Landslide movement near bridge structures can result in structural damage or even collapse [31,32]. As depicted in Figure 3 and Figure 4, the site investigation revealed water accumulation on the surface near Pier 6, indicating that the filled soil was in a wet condition. Additionally, two wider surface cracks were observed between Pier 6 and Pier 7. Consequently, it can be inferred that the accumulated water infiltrated the interior of the filled soil, reducing its strength and triggering soil sliding. This created a significant additional lateral thrust on Pier 7.

3.2. Detection and Analysis of Pier Offset

In the presence of lateral shear, the columns undergo substantial lateral deformations [33]. Concurrently, the negative friction engendered by the filled soil augments the vertical axial force on the columns, thereby inducing secondary bending moments. This, in turn, engenders an escalation in the lateral deformation and stress on the columns. To accurately measure the offsets of Piers 4–7 of the left and right lane bridges, a Leica TS50 (Leica Geosystems AG, Balgach, Switzerland) high-precision total station was utilized in the prism-free mode to assess the verticality of the piers, as illustrated in Figure 5. The Leica TS50 total station is renowned for its high measurement accuracy and ease of use [34]. For each pier, three independent measurements were carried out in both the longitudinal and transverse deviations, and the mean value was calculated as the final result. The duration of a single measurement cycle was restricted to 30 min. To mitigate the influence of structural thermal expansion and contraction induced by solar temperature variations, measurements were exclusively conducted during early morning hours when ambient temperatures remained relatively stable. Prior to each measurement session, the total station was meticulously leveled and precisely centered. Instrument accuracy was rigorously verified through repeated observations of established reference points, ensuring that measurement errors remained within ±1 mm, thereby guaranteeing the repeatability of the measurements and control of the environmental variables. The center of the pier base served as the reference datum. Coordinates of the top characteristic points were obtained using the total station, which was subsequently utilized to compute the pier verticality.
The offset measurement results for Piers 4–7 of the left and right lane bridges are presented in Table 3. The numerical positive and negative signs in Table 2 are defined as follows: in the longitudinal direction of the bridge, the bias toward the larger pile number is positive, and the bias toward the smaller pile number is negative; in the transverse direction of the bridge, the bias toward the right side is positive, and the bias toward the left side is negative.
The results presented in Table 3 reveal several key observations regarding the verticality of the pier columns for both the left and right-lane bridges:
  • The columns of Piers 4–6 for both the left and right lane bridges exhibit satisfactory longitudinal and transverse verticality, with no discernible tilt detected.
  • The columns of Pier 7 for the right lane bridge, however, show clear offsets in both the longitudinal and transverse directions. The maximum longitudinal offset was recorded at the 7-1 column, reaching 342.7 mm. Given that the height of the 7-1 column is 31.814 m, the H/1000 limit is 31.814 mm; this longitudinal offset is 10.77 times the H/1000 limit and 17.13 times the 20 mm limit, corresponding to a verticality of 2.57%. Additionally, the maximum transverse offset was observed at the 7-2 column, measuring −258.2 mm. For the 7-2 column with a height of 31.814 m, this transverse offset is 8.12 times the H/1000 limit and 12.91 times the 20 mm limit, resulting in a verticality of −2.05%. These values significantly exceed the normative permissible deviations (≤H/1000 and ≤20 mm, where H is the height of the pier [35]).
  • Similarly, the columns of Pier 7 of the left lane bridge also display clear offsets in both the longitudinal and transverse directions. The maximum longitudinal offset at the 7-1 column is 210.9 mm. For the 7-1 column with a height of 31.814 m, this longitudinal offset is 6.63 times the H/1000 limit and 10.55 times the 20 mm limit, corresponding to a verticality of 1.72%. The maximum transverse offset at the 7-1 column is −71.9 mm, which is 2.26 times the H/1000 limit and 3.60 times the 20 mm limit, resulting in a verticality of −0.59%. These values also significantly exceed the normative permissible deviations (≤H/1000 and ≤20 mm, where H is the height of the pier [35]).
Preliminary analysis of the offset measurements indicated that cracking damage is less probable at Pier 4–6 of the left and right lane bridges and more probable at Pier 7 of the left and right lane bridges.

4. Risk Assessment of Cracking Using Finite Element Analysis

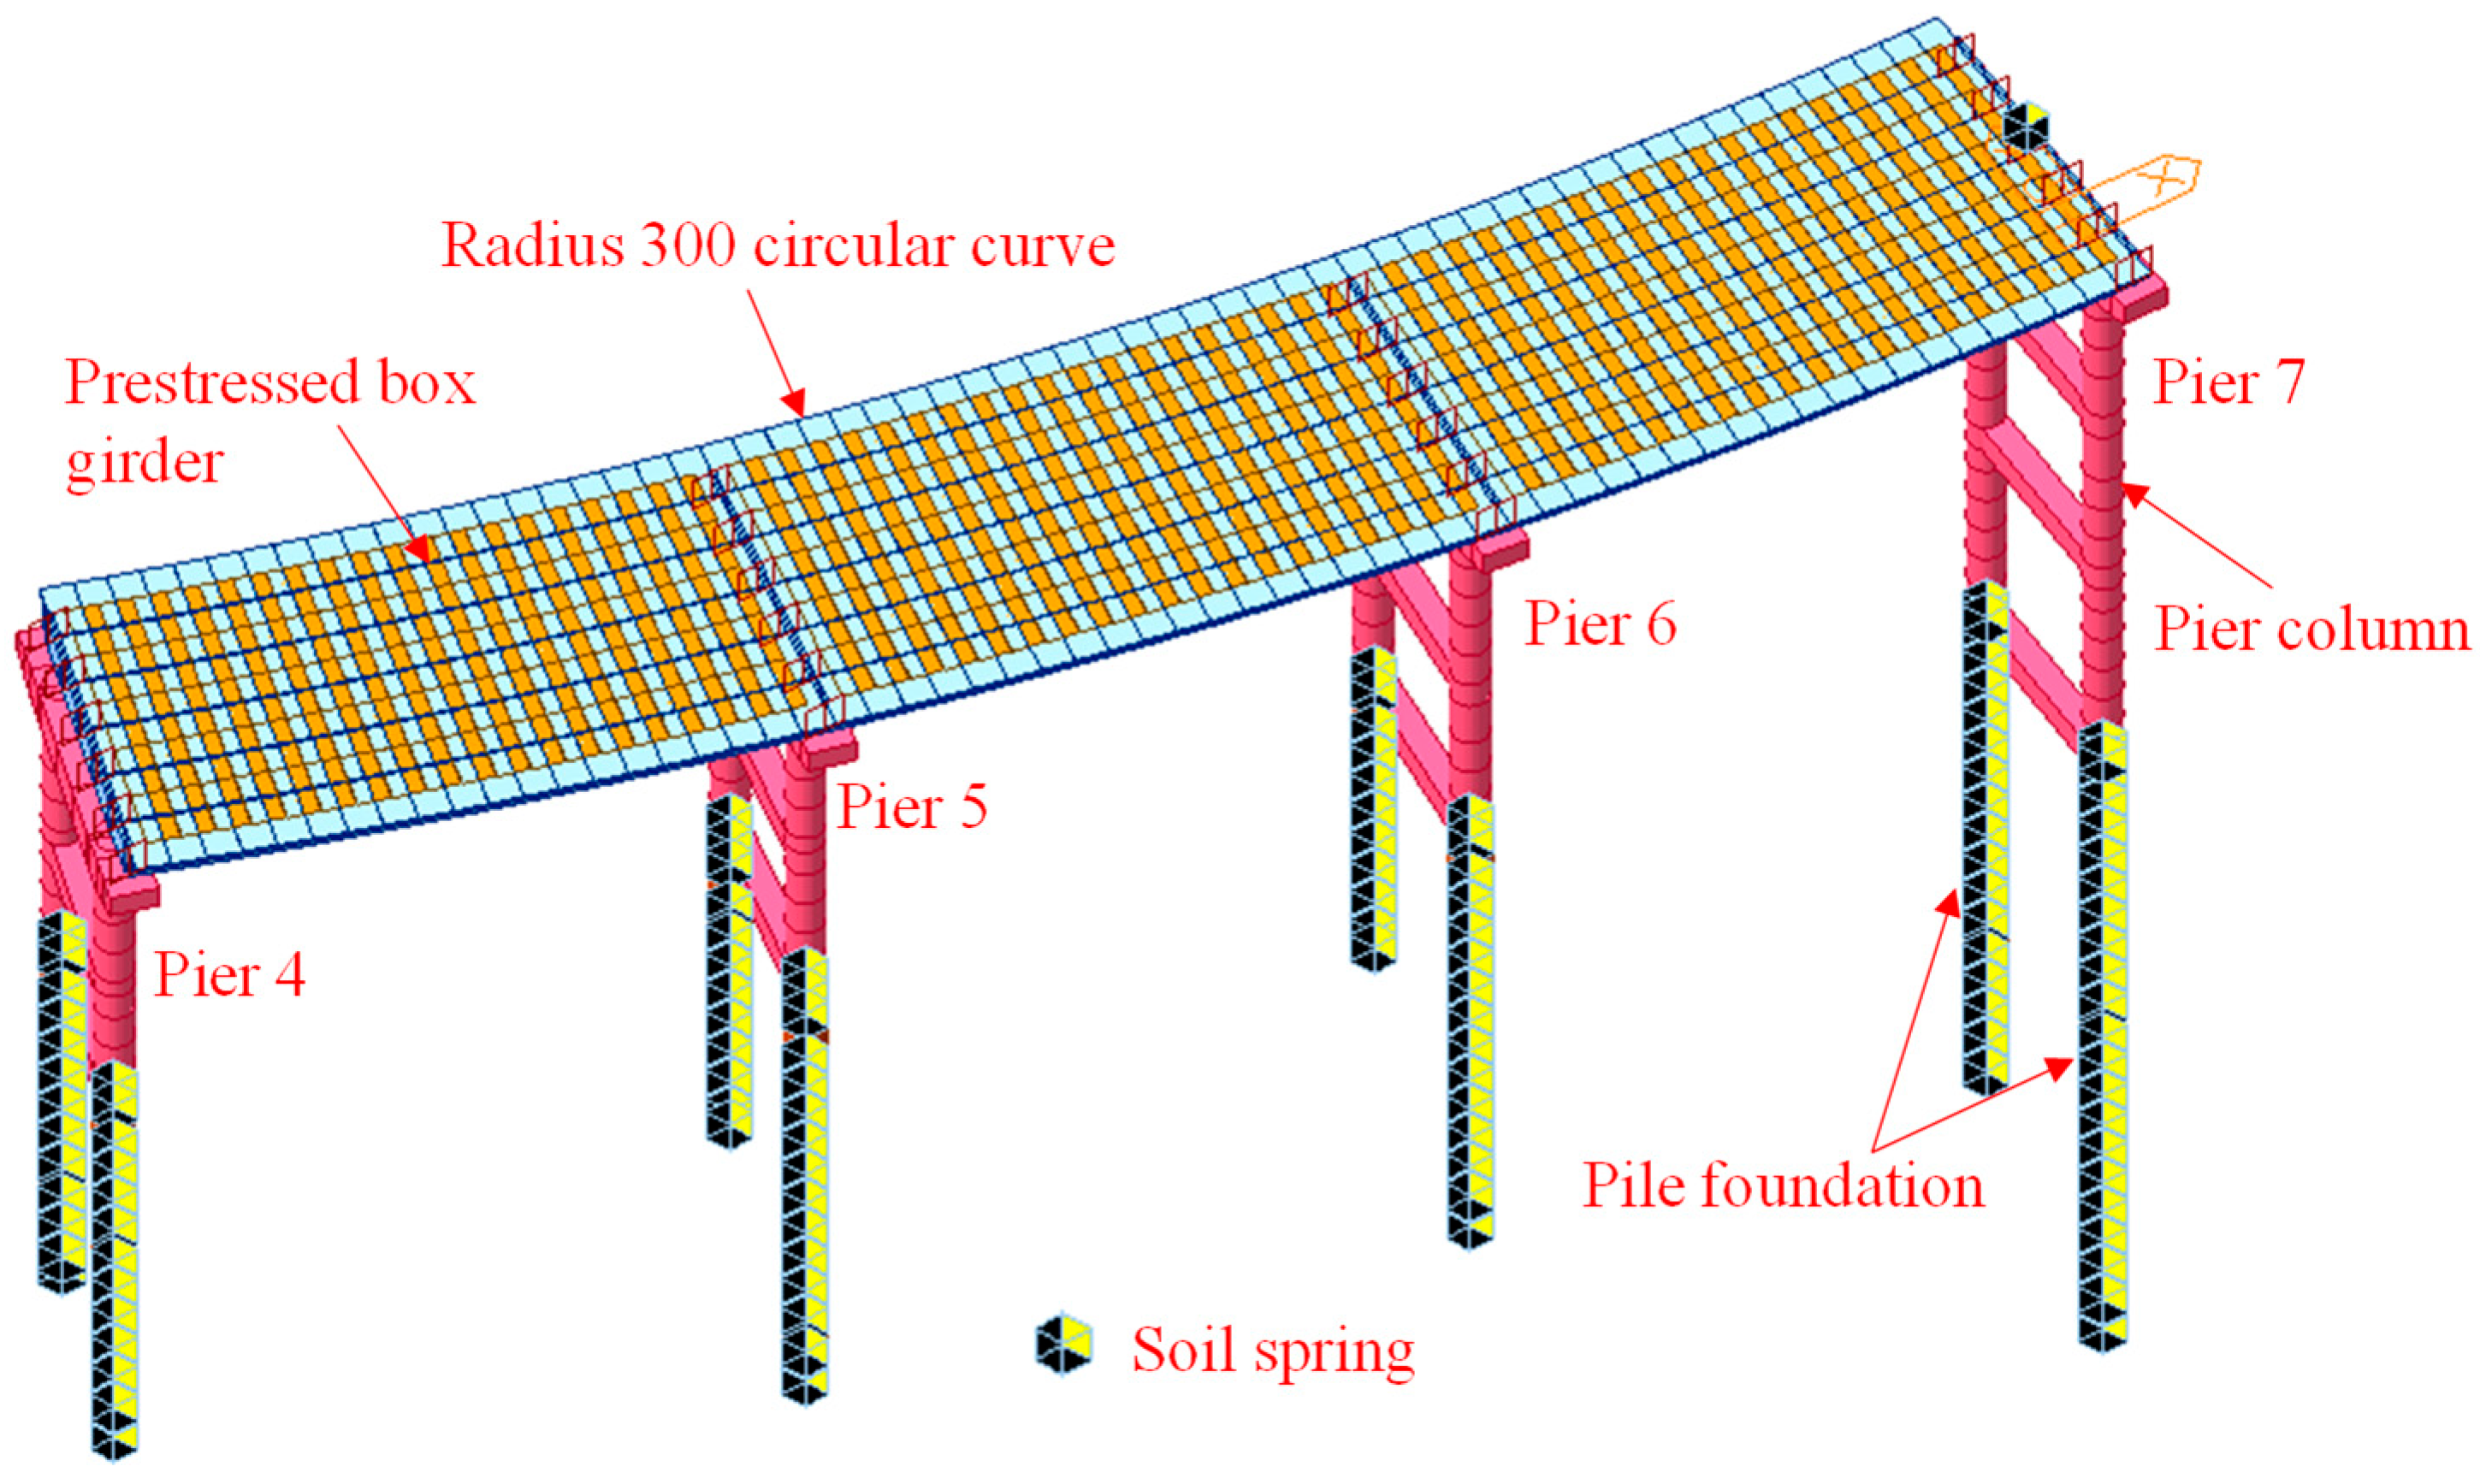
4.1. Finite Element Calculation Model

Finite element-based numerical analysis serves as an effective method for predicting and deducing the stress state of structures [36,37,38]. To further analyze the impact of the filled soil beneath the bridge on the piers, as depicted in Figure 6, a finite element model of the right lane bridge was developed using the Midas/Civil finite 2021 element analysis software for force and deformation studies. In the finite element model, the structure was simulated using beam elements. The model was divided into 1995 nodes and 2540 elements in total, and the interaction between piles and soil was considered. The M-method, which is based on the theory of elastic foundation beams, has been shown to effectively simulate pile-soil interactions [39]. Therefore, in the model, the soil spring stiffness coefficients of the pile foundations of each pier were calculated according to the M-method in the specification; the results are shown in Table 4. The calculated soil spring stiffness coefficients were set and applied as boundary conditions to the pile body to simulate the interaction between the soil and the pile foundation. The cross-sectional dimensions and material properties in the model were obtained from the design drawings and specifications. For the bridge structure, C50 concrete was employed for the main girders of the superstructure, C40 concrete for the piers, and C30 concrete for the pile foundations. The mechanical properties of these concrete materials are presented in Table 5.
Based on the surveyed fill heights and cracking positions on the fill surfaces at each pier, the slope stability analysis using the Swedish circular slip method was performed to calculate the landslide thrust [40]. The lateral earth pressure exerted by the fill on the bridge piers was determined according to Coulomb’s earth pressure theory. By converting the fill into equivalent loads, the additional soil stress in the foundation was computed using Boussinesq’s equation [41]. In this study, the landslide thrust, lateral earth pressure, and additional foundation stress induced by the fill are collectively termed fill-induced additional loads.

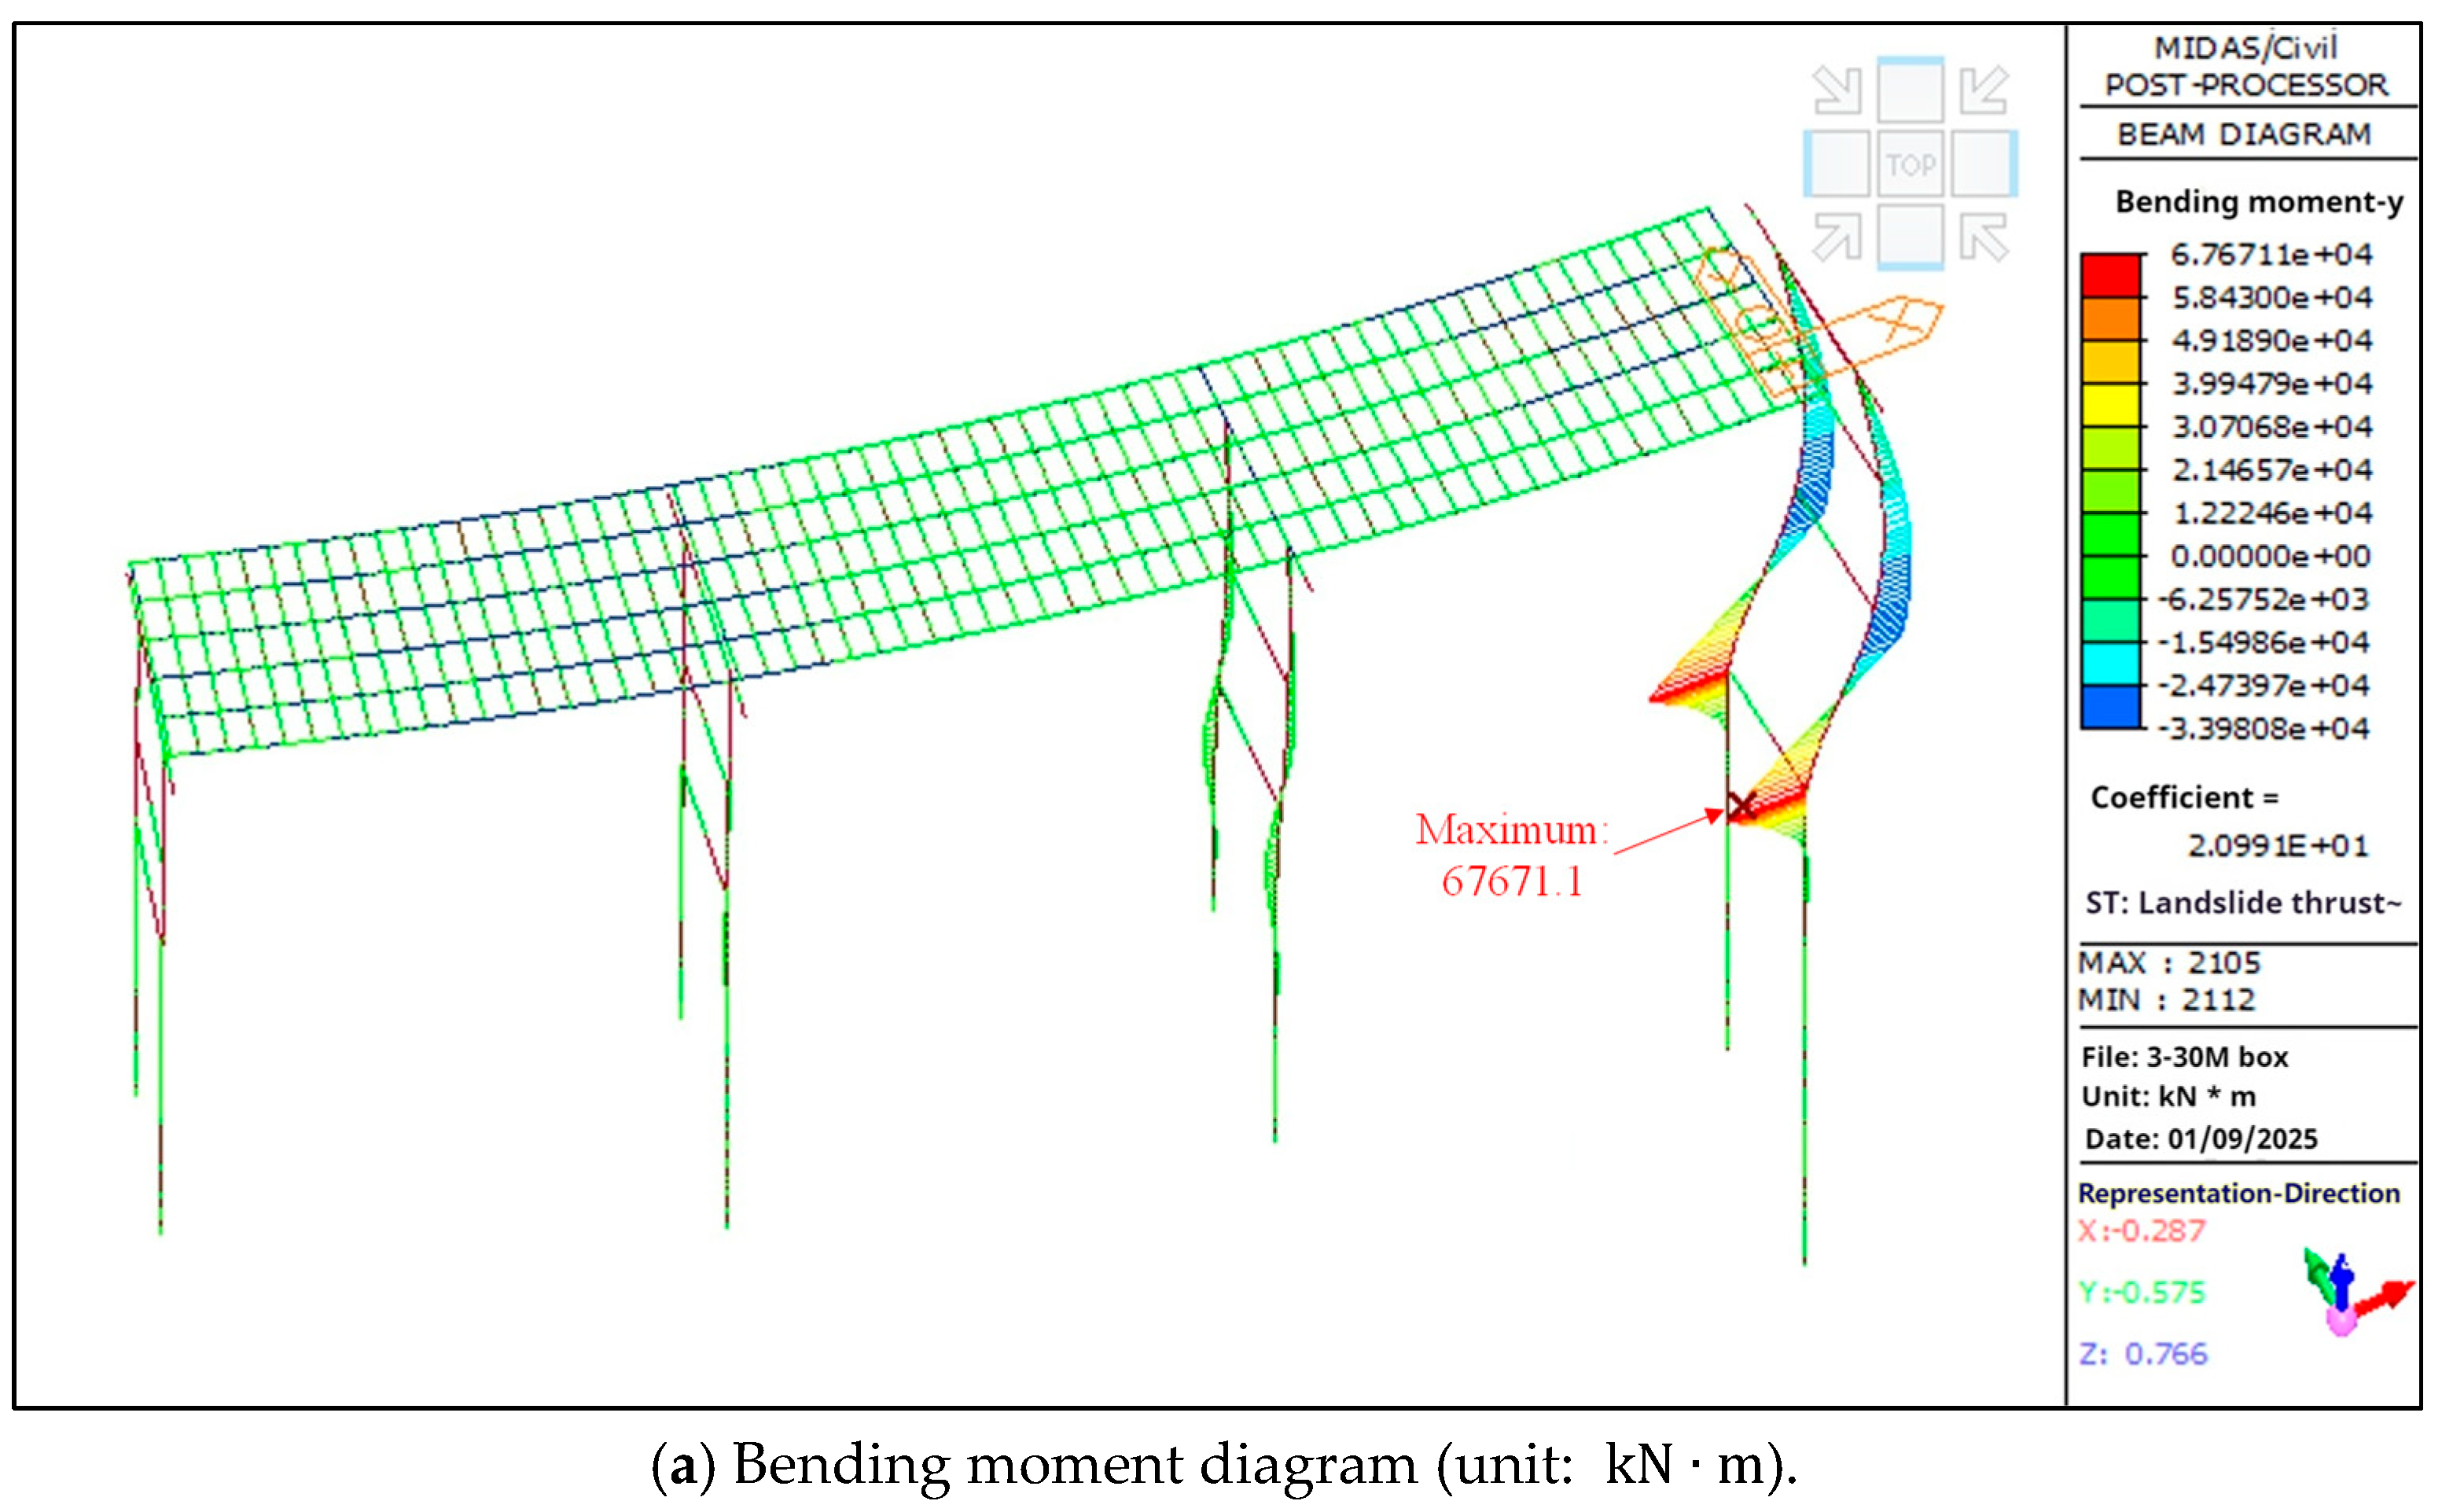
4.2. Cracking Risk Analysis of Pier Columns

To evaluate the effects of fill-induced additional loads on the structural response, these loads were applied to the bridge finite element model, including forces transmitted to piers and pile foundations. The combined effect of additional loads, structural self-weight, and vehicle loads was analyzed to calculate the bridge’s internal forces and deformations, with the results presented in Figure 7. For the columns of Pier 7, the maximum bending moment reached 67,671.1 kN∙m, and the maximum shear force was 21,143.0 kN, both significantly exceeding the pier’s load-bearing capacity. Without considering plastic deformation, the maximum longitudinal displacement at the midpoint of the columns was 226.86 mm. However, the measured maximum longitudinal displacement at the midpoint of Pier 7’s columns was 342.7 mm, far greater than the calculated value of 226.86 mm, indicating that plastic deformation had occurred in the columns. This finding is consistent with the regular circumferential cracking observed in subsequent inspections of the columns. Additionally, finite element analysis shows that the maximum tensile stress in the middle of Pier 7’s columns reached 59.4 MPa, far exceeding the standard tensile strength of C40 concrete (2.40 MPa), which indicates a severe cracking risk in the Pier 7 concrete, although the reinforcement has not yet yielded. The tensile and compressive stresses in Piers 4 to 6 did not exceed the design values of C40 concrete, suggesting a low cracking risk for these piers. The force distribution in the left lane bridge is essentially identical to that in the right lane bridge, confirming consistency across both structures.

5. Unloading Scheme and Inspection of Piers After Unloading

5.1. Unloading Scheme

The results of the above investigations and finite element analyses indicate that the additional loads from the filled soil were the main cause of the pier’s offset. Therefore, the filled soil under the bridge had to be removed immediately. As Pier 7 had been severely displaced under the load of the filled soil, there was going to be a certain amount of deformation recovery after the filled soil was unloaded. In order to avoid rapid unloading caused by rapid deformation recovery leading to bearing slippage, thereby endangering the safety of the superstructure, filled soil unloading was carried out step by step, layer by layer. Unloading is carried out from distant to nearby areas in layers, with the thickness of each layer not exceeding 2 m, gradually approaching the bridge pier. The left and right sides of the piers were unloaded symmetrically and synchronously to maintain the symmetry of the left and right forces of the piers. At the same time, the displacement of the pier was monitored throughout the unloading process, providing timely feedback to adjust the unloading speed. When unloading approached the pier, the process was slowed to prevent the mechanical equipment from disturbing or damaging the pier.

5.2. Crack Inspection of Bridge Piers After Unloading

Following the removal of the filled soil, an inspection was conducted to assess the cracking status of the columns of Piers 4–7. The inspection utilized an HC-F600 Integrated Crack Tester, which combines ultrasonic principles with microscopic imaging technology. This device features dual-function capabilities, automatically measuring both crack depth (range: 5–500 mm) and width (range: 0–10 mm) with a precision of ±0.01 mm. Equipped with a 5-inch high-definition color touchscreen and a professional dual-channel processor, the tester can automatically interpret ultrasonic wave arrival times and amplitudes, eliminating manual judgment errors. Before data collection, the device was calibrated using standard reference blocks, and duplicate measurements were performed at 10% of randomly selected points to ensure a measurement variance of less than 5%. Additionally, a second inspector cross-checked 20% of the data for reliability. The composition of the HC-F600 Integrated Crack Tester and on-site inspection photos are shown in Figure 8.
No cracks were detected in the columns of Piers 4–6 on both the left and right lane bridges, indicating that the additional loads from the filled soil have not negatively impacted these piers. However, regular circumferential cracking was observed on the large pile faces of the columns of Pier 7 on both the left and right spans of the bridge. The distribution of the column cracking patterns is presented in Table 6, while the cracking patterns are illustrated in Figure 9 and Figure 10. The crack depths measured in Table 3 indicate severe internal damage to the columns of Pier 7. The 96 mm depth observed in the right 7-2 column penetrates a substantial portion of the column’s cross-section, reducing its effective load-bearing area and compromising its structural integrity. Such deep cracks have already weakened the load-bearing capacity and may induce instability under sustained loading. Additionally, specifications stipulate that the maximum allowable crack width for reinforced concrete components in freeze-thaw environments shall not exceed 0.2 mm [42]. However, the measured depths in Pier 7 columns range from 56 mm to 96 mm, significantly exceeding this limit and indicating a high-risk level that mandates immediate reinforcement measures.

5.3. Longitudinal Offsets of Columns After Unloading

Monitoring conducted during the unloading of the filled soil revealed a noticeable recovery in the offsets of the left and right lane bridges’ Pier 7 columns as the soil was progressively removed. These pier columns, with a height of 31.8 m each, had their deviations plotted using the bottom of the piers as the reference elevation point. Figure 11 and Figure 12 illustrate the longitudinal offset comparisons for the right 7-1 and 7-2 columns and the left 7-1 and 7-2 columns, respectively, before and after unloading. It is evident from these figures that significant offset recovery occurred in the columns following the removal of the fill, predominantly due to elastic deformation. However, some plastic deformation took place as a result of pier cracking. Structural stress analysis indicates that the load applied to the piers did not reach the yield strength of the reinforcement. Instead, the plastic deformation and resulting residual offset were primarily caused by concrete cracking. Cracks in the concrete reduced its load-bearing capacity and stiffness, preventing the pier from fully recovering to its original position even after the complete removal of the fill. For instance, the right 7-2 column retained a longitudinal offset of 139.2 mm, while the left 7-2 column had a remaining offset of 70.0 mm. Consequently, a combination of reinforcement and offset correction was proposed as a remedial measure for the damaged pier columns.

6. Bridge Pier Reinforcement and Offset Correction Study

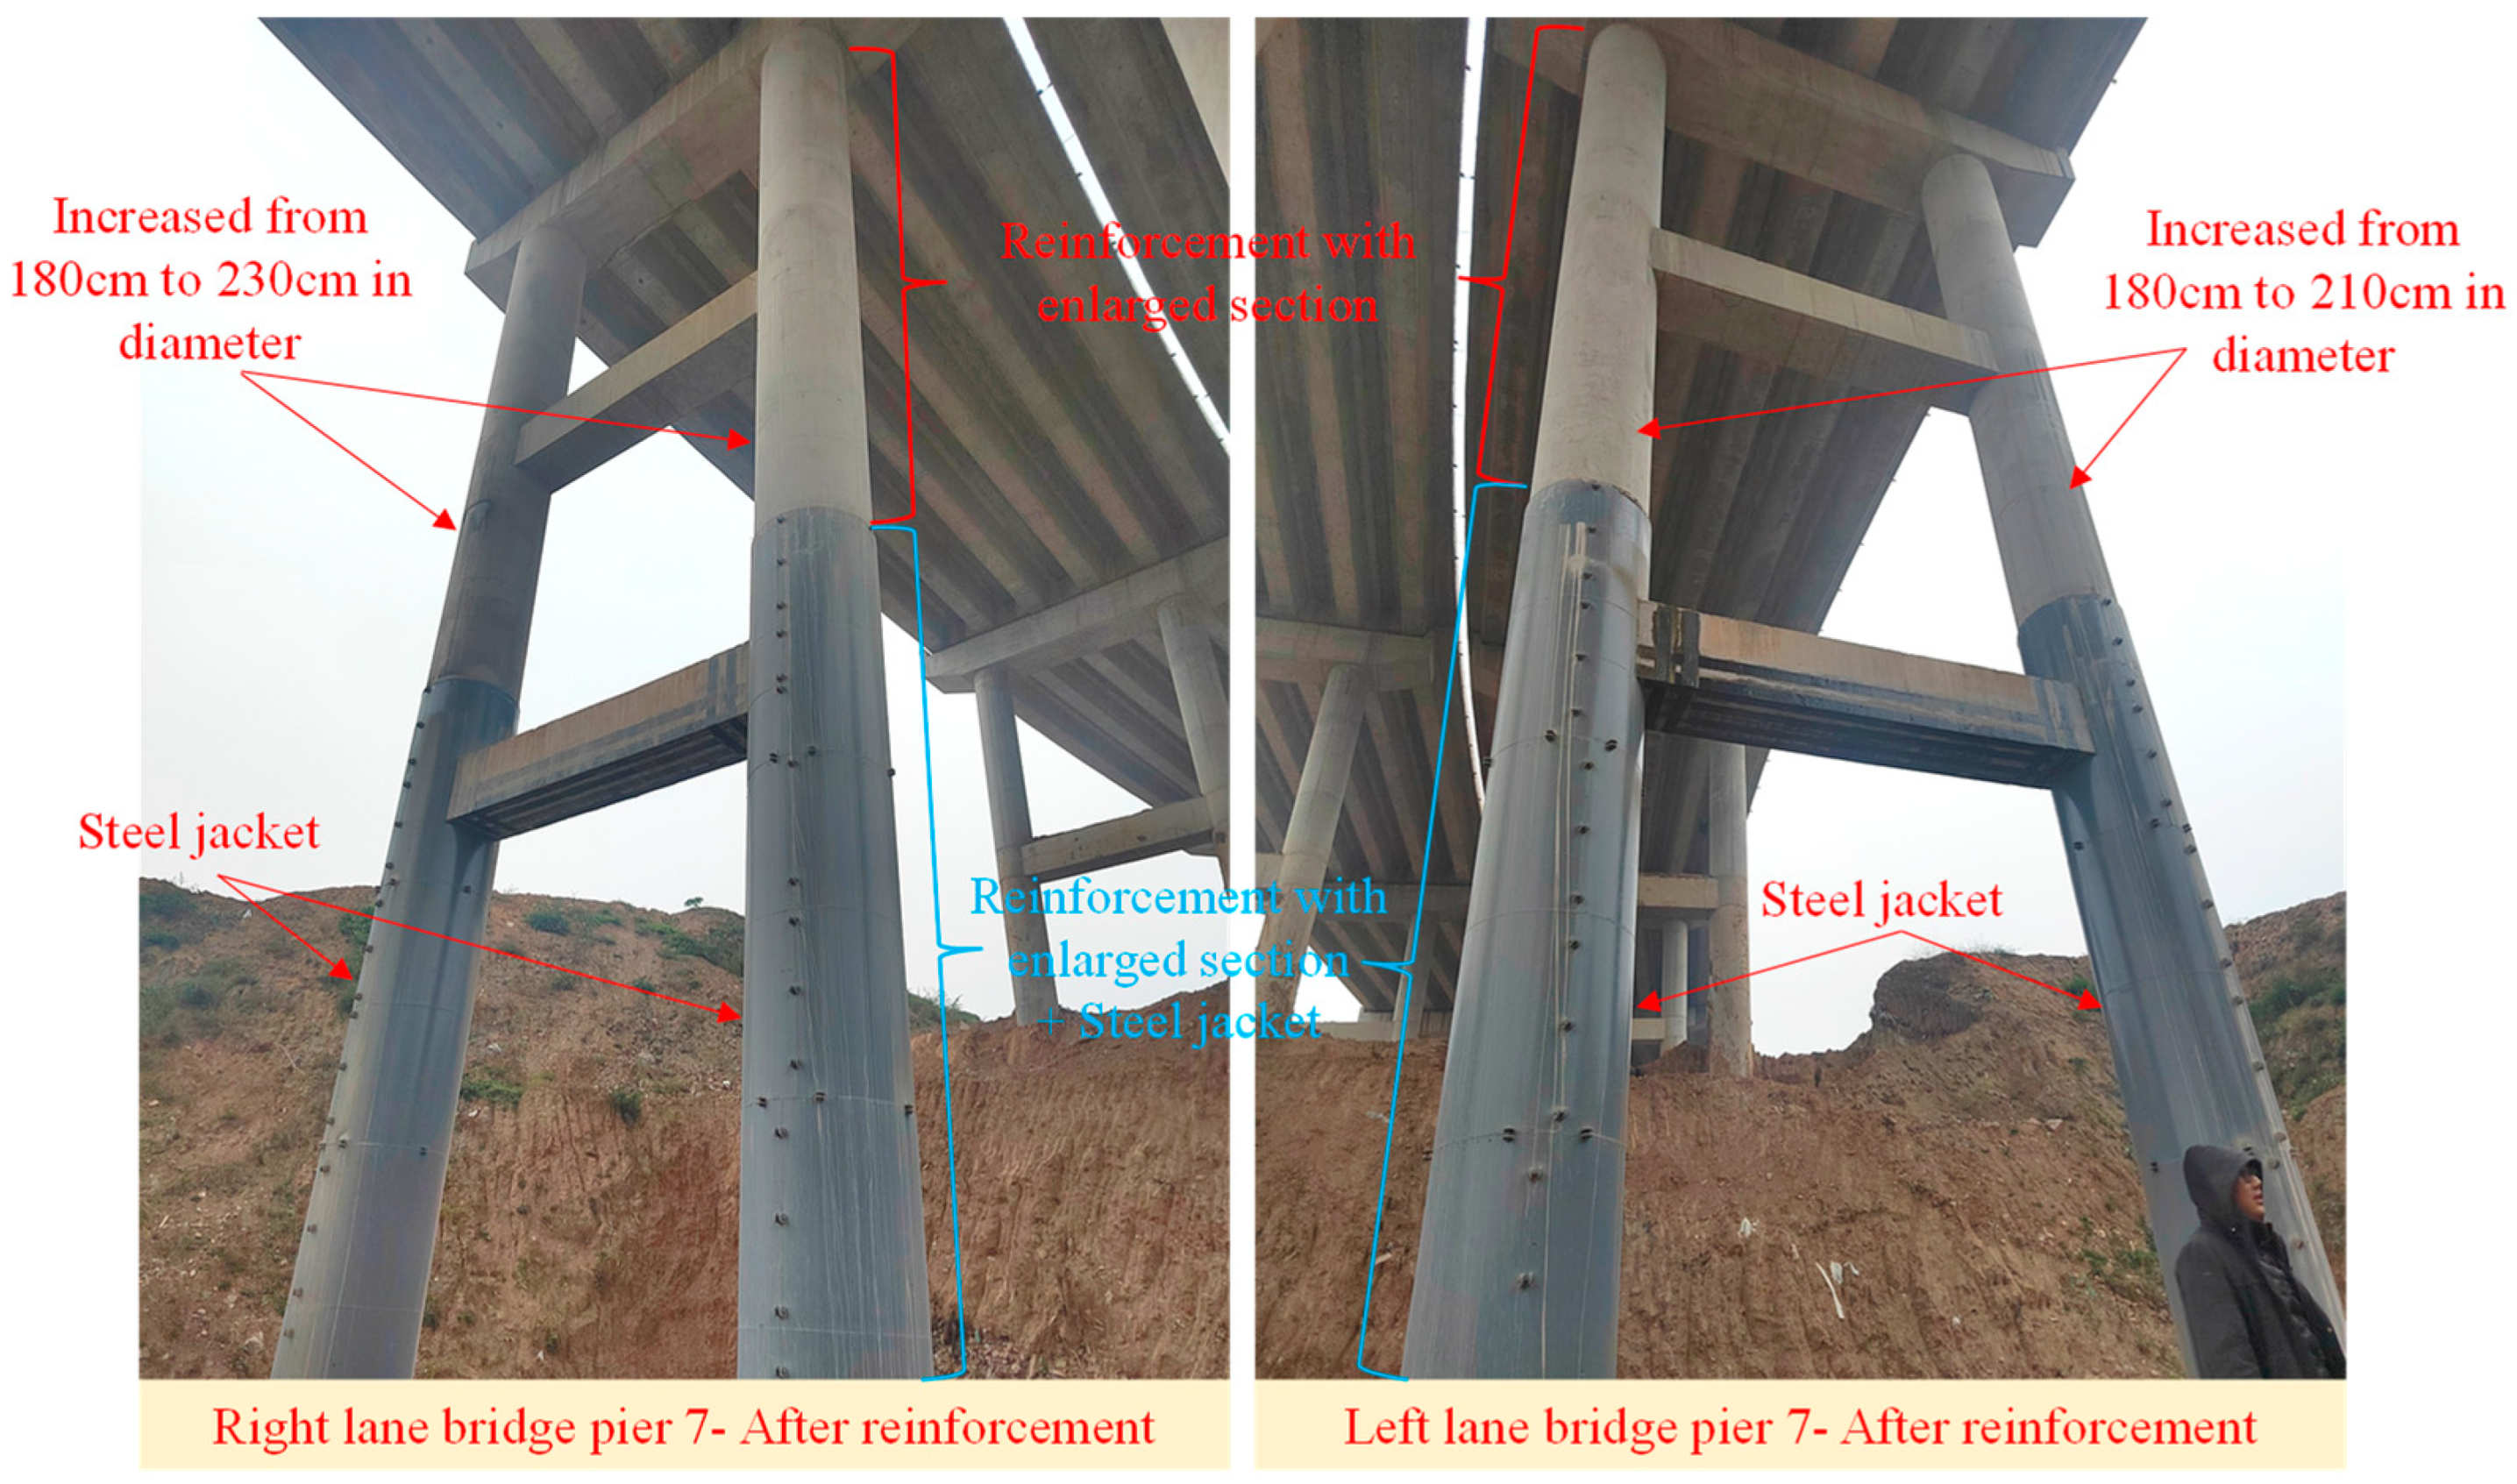
6.1. Reinforcement Scheme Combining Section Enlargement and Steel Jacket

Pouring concrete into steel tubes or setting steel jackets around concrete components can enhance the stiffness and load-bearing capacity of the components [43,44]. The composite reinforcement method of enlarging a section with the addition of a steel jacket has been demonstrated to enhance the ductility and load-bearing capacity of structures [45]. Despite Pier 7 recouping a portion of its deformation following filling and unloading, the column exhibited substantial offset, accompanied by cracking and damage. Consequently, to ensure that the verticality of the columns met the necessary standards and to restore their load-bearing capacity, a reinforcement scheme combining verticality correction and load-bearing capacity restoration was required. To avoid potential secondary damage caused by active correction methods, such as jacking or dragging, a passive correction scheme with an enlarged concrete section was adopted for column alignment. As shown in Figure 13, a composite reinforcement scheme with an enlarged concrete section and an external steel jacket was applied to the lower half of the column, while a reinforcement scheme with an enlarged concrete section was applied to the upper half of the column.
The reinforcement zoning directly corresponds to the high-risk zones identified by the finite element (FEM) analysis and field inspection results. The FEM results indicate that the lower half of Pier 7 columns had undergone significant stress and deformation, presenting a higher risk of cracking. Field inspections further confirmed the presence of regular circumferential cracks in this area, indicating severe damage. Therefore, a composite reinforcement scheme (enlarged concrete section + external steel jacket) was adopted for the lower half to correct the verticality and restore the load-bearing capacity. In contrast, the upper half of the columns exhibited negligible cracking risk in the FEM predictions, and no visible cracks were detected during the field inspections. Here, only the enlarged concrete section method was used, primarily to correct the verticality while maintaining the structural integrity. This zoned approach optimized material usage by focusing reinforcement on high-risk areas, reasonably controlling project costs.
An important objective of reinforcement is to “encase” the offset column through section enlargement and to ensure that the verticality of the reinforced column meets the requirements by varying the thickness of the lateral “encasement”. Therefore, the diameter of the column after section enlargement was determined by the maximum offset value of the pier body. For the right 7-2 column, the maximum offset after unloading was 139.2 mm, and for the left 7-2 column, it was 70.0 mm. Consequently, the diameter of the enlarged section for the right 7-1 and right 7-2 columns was set at 230 mm, while for the left 7-1 and left 7-2 columns, it was set at 210 mm. The center of the enlarged section was aligned with the original center of the pier column, ensuring that the enlarged section would fully encase the column after offset correction. To reinforce the upper half of the column, plant reinforcement was applied to the original column’s surface, and the reinforcement mesh was retied. C40 self-compacting concrete was then poured. For the lower half of the column, as depicted in Figure 14, an 18 mm thick Q235 steel jacket was added around the column’s perimeter. C40 self-compacting concrete was subsequently poured into the gap between the steel jacket and the column, achieving composite reinforcement. Finally, the steel jacket’s surface was brushed and coated with a corrosion-resistant coating. Following the reinforcement of the measured pier columns, their verticality was satisfactory and fell within the prescribed normative allowable values. The results are presented in Table 7.

6.2. Bearing Capacity Calculation of Reinforced Columns

In the bearing capacity calculations of the columns, secondary effects, such as temperature, concrete shrinkage, and creep, were ignored, while the combined effects of vehicle loads, structural self-weight, and additional fill loads were considered in accordance with the specifications [46]. The forces acting on the left and right lane bridges were essentially equivalent, with the most unfavorable column of Pier 7 subjected to an axial force of N = 13,516 k N and a bending moment of M = 7109 k N · m under the basic combination of loads. In accordance with the specification requirements [47], the calculation of the reinforced columns’ bearing capacity was conducted based on the compression-dominated steel tube concrete column design. The diameter of the reinforced column for Pier 7 of the right lane bridge is 230 cm, while for the left lane bridge, it is 210 cm. Consequently, the column of Pier 7 from the left lane bridge, which has the smaller cross-section, was selected for calculation.
(1) The design value of the column’s axial compressive stability bearing capacity N u was calculated as follows:
N u = φ N 0
N 0 = A s c f s c
f s c = 1.212 + B θ + C θ 2 f c
α s c = A s A c
θ = α s c f f c
In the above equations, N u represents the design value of the axial compression stability bearing capacity of the steel pipe concrete column; φ is the stability coefficient for axially compressed members, calculated as 0.856 according to the specifications [47], as shown in Table 5.1.10 of Reference [47]; N 0 is the design value of the axial compression strength bearing capacity of the short steel pipe concrete column; A s c is the cross-sectional area of the steel pipe concrete member, which is the sum of the area of the steel pipe and the concrete inside the pipe; f s c is the design value of the compressive strength of steel pipe concrete; A s ,   a n d   A c are the areas of the steel pipe and the concrete inside the pipe, respectively; α s c is the steel content ratio of the steel pipe concrete member, where the area of the original column’s steel reinforcement is not included; θ is the confining coefficient of the steel pipe concrete member; f is the design value of the compressive strength of steel, which was taken as 205 MPa according to the steel structure design standard [48]; f c is the design value of the compressive strength of concrete, which was taken as 14.3 MPa according to the concrete structure design specification [49]; B   a n d   C are the coefficients that represent the influence of the cross-sectional shape on the confining effect, which were taken from the specifications [47], as shown in Table 5.1.2 of Reference [47].
Based on the actual dimensions and values specified in the code, the calculated design value of the axial compressive strength bearing capacity of the column is N 0 = 87,456.05   k N , and the design value of the axial compressive stability bearing capacity of the steel pipe concrete column is N u = 74,862.38   k N .
(2) The design bending stability capacity of the column was calculated as M u :
M u = γ m W s c f s c
W s c = π r 0 4 r c i 4 4 r 0
In the above equations, M u is the design value of the axial bending stability capacity of the concrete-filled steel tube column; W s c is the section modulus for bending of the member; γ m is the plastic development coefficient; for solid circular sections, it was taken as 1.2; r 0 is the equivalent circular radius, corresponding to the radius for circular sections; r c i is the hollow radius, taken as 0 for solid members.
(3) The column’s capacity under combined compression and bending was verified.
Under the combined action of axial force and the bending moment, the load-bearing capacity of the column should meet the requirements of Equation (8):
N 2.17 N u + β m M M u 1 0.4 N / N E ' 1
N E = π 2 E s c A s c 1.1 λ 2
E s c = 1.3 k E f s c
In the above equations, N is the axial compression force, and M is the bending moment acting on the column, with values of N = 13,516   k N and M = 7109   k N · m , respectively; β m is the equivalent bending moment coefficient, which, according to the steel structure design standard [48], was taken as 0.9; E s c is the elastic modulus of the concrete-filled steel tube column; k E is the conversion coefficient for the elastic modulus of the concrete-filled steel tube under axial compression, and according to the specification, for Q235 steel, it was 918.9; λ is the slenderness ratio of the column, with a calculated value of 114.3.
The calculated elastic modulus of the concrete-filled steel tube column E s c was 30,162.89 MPa, and the coefficient N E was 71,676.30. Substituting these values into the left side of Equation (8) yielded a result of 0.218, which meets the requirements. Therefore, the reinforced pier satisfies the load-bearing capacity requirements under the combined action of compression and bending and maintains a safety margin.

7. Conclusions

This study conducted a comprehensive investigation into the causes of pier displacement and cracking of a highway link bridge, integrating field surveys, finite element analysis, and reinforcement strategies. By systematically analyzing the geological conditions, filled soil characteristics, and structural responses, several key findings were obtained. These results not only address the specific problems of the studied bridge but also offer implications for broader bridge engineering practices. The main conclusions are summarized as follows:
  • Field investigations and geological assessments confirm that the bridge site had stable foundations and no slope stability issues, effectively ruling out slope sliding as the cause of pier displacement. Instead, the accumulation of filled soil beneath the bridge, especially concentrated under the second link bridges of both lanes, was identified as the primary culprit. The filled soil’s sliding and cracking behaviors exerted substantial additional loads on the piers. Finite element analysis quantitatively demonstrated that these additional loads significantly increased the internal forces and displacements of the piers and pile foundations. Notably, the tensile and compressive stresses in the middle and bottom sections of Pier 7 columns far exceeded the design values of C40 concrete, indicating a high risk of cracking in these areas.
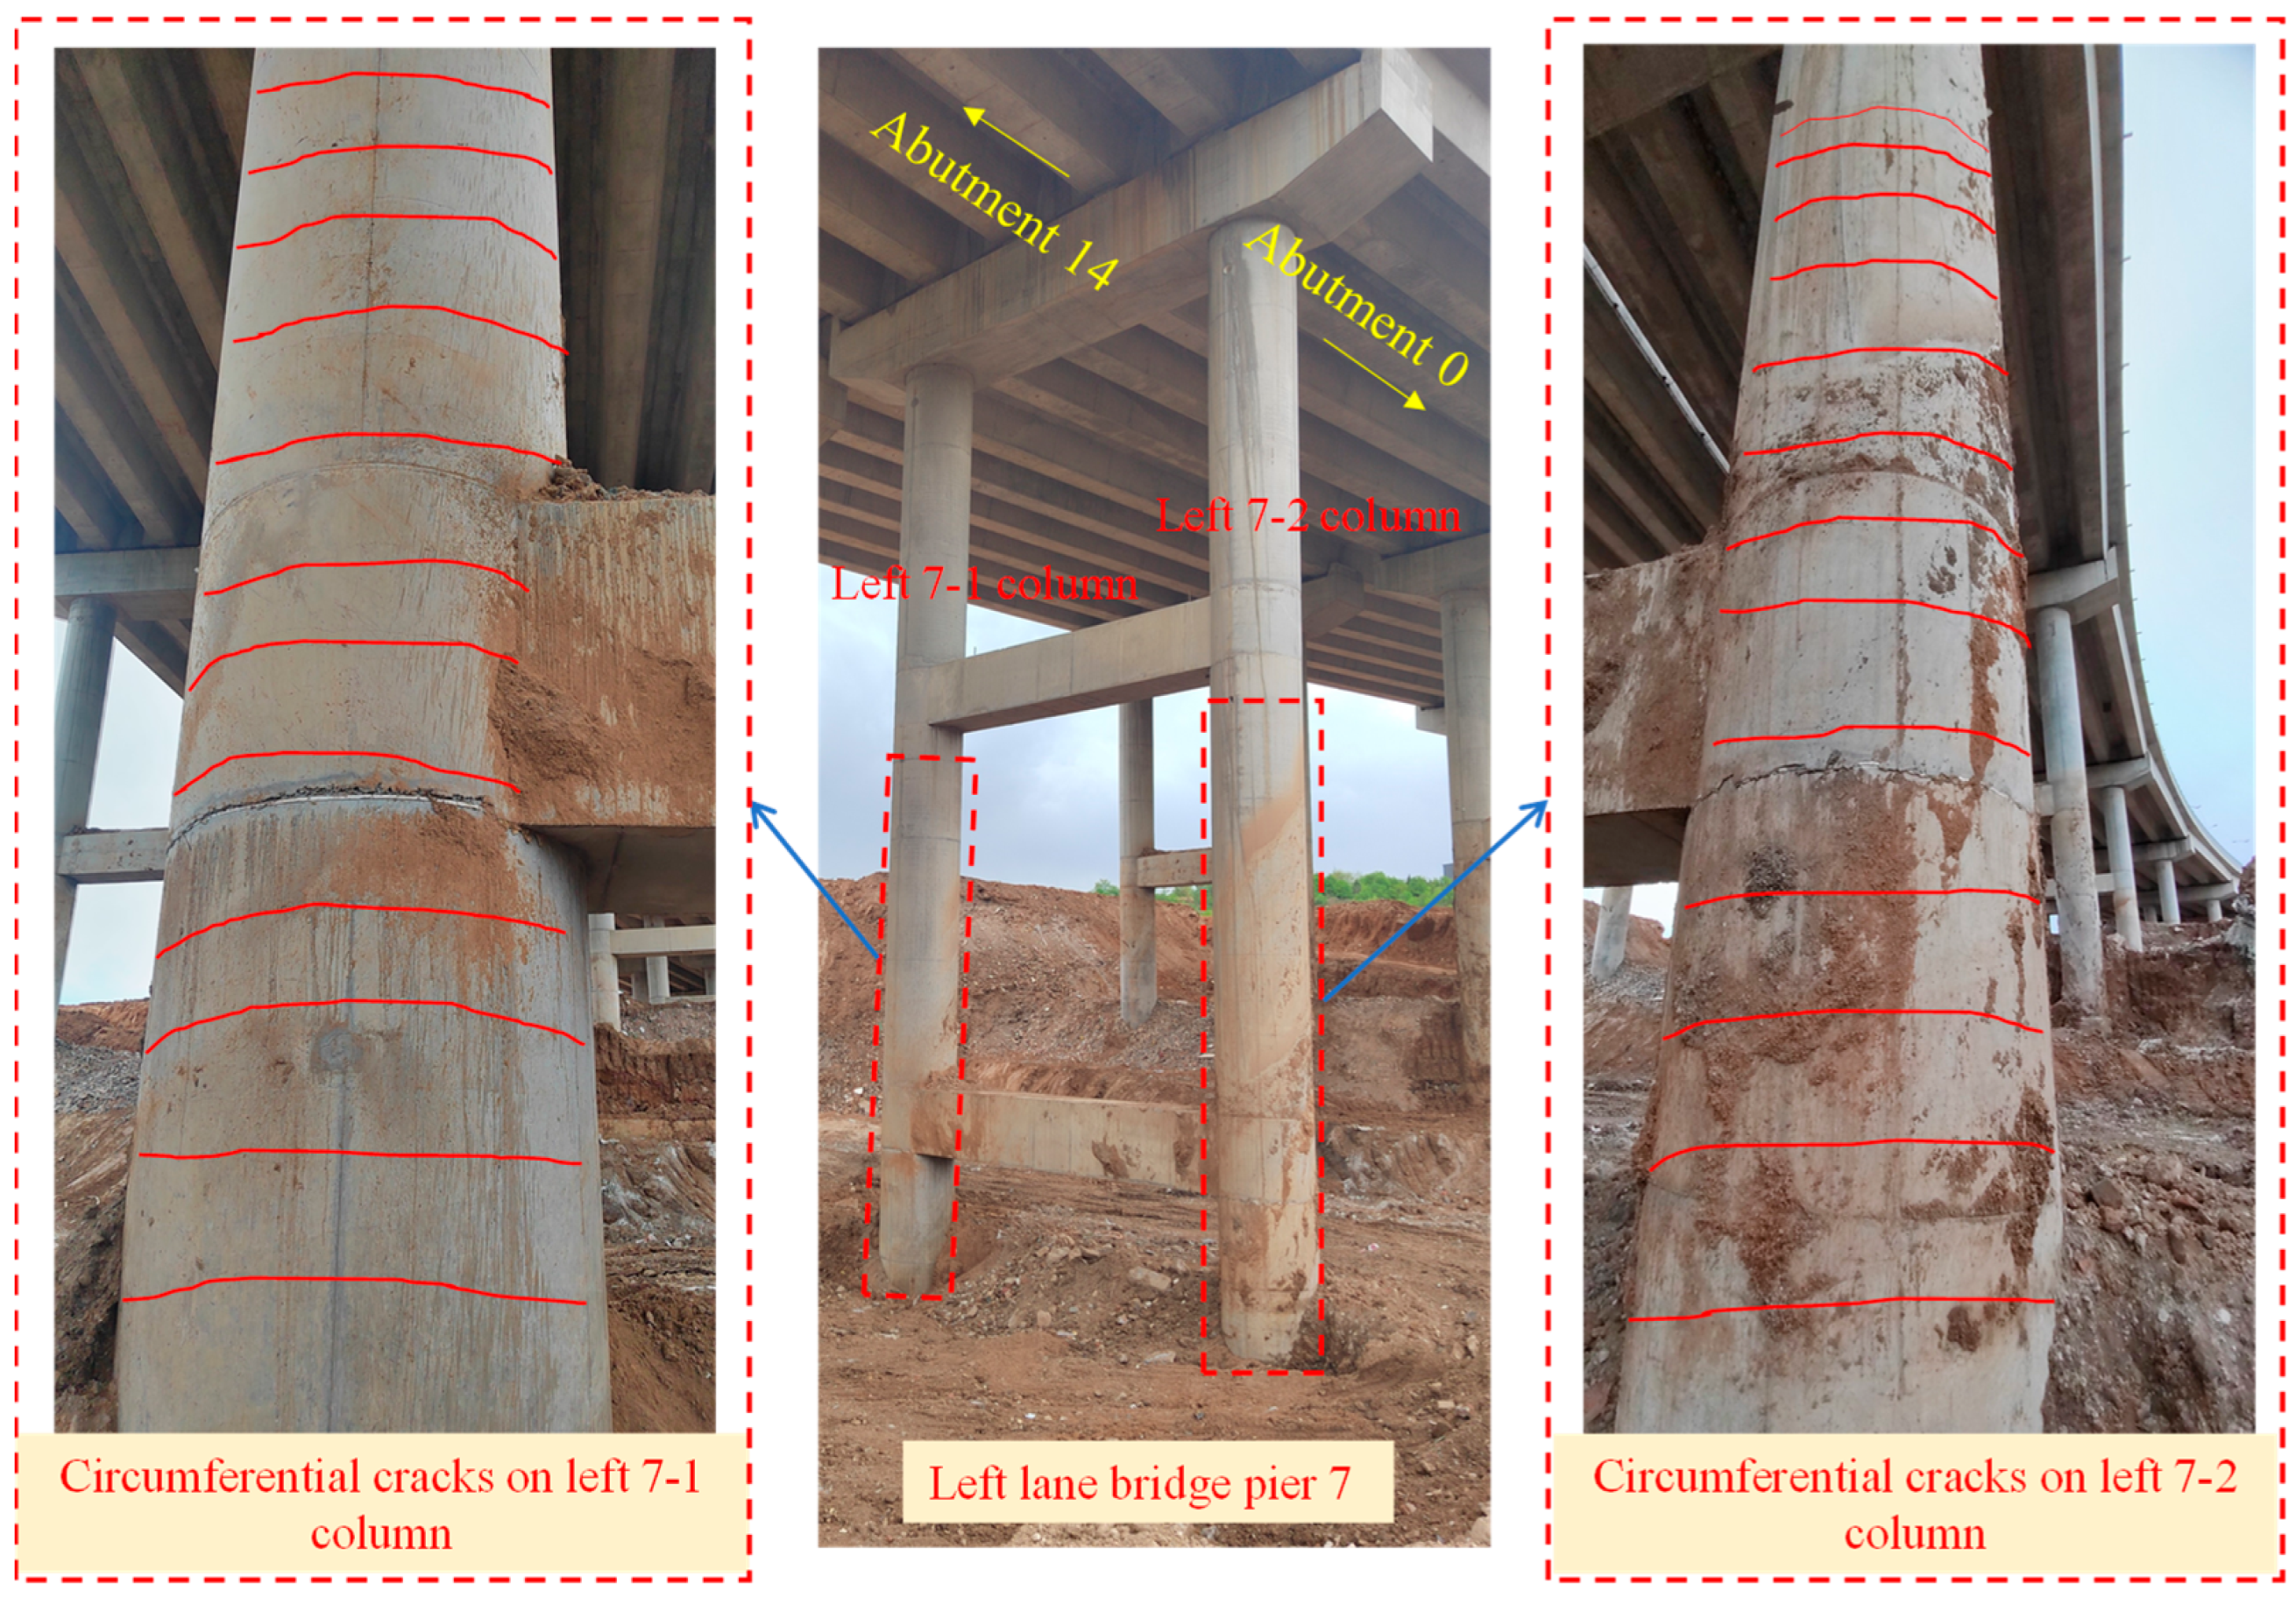
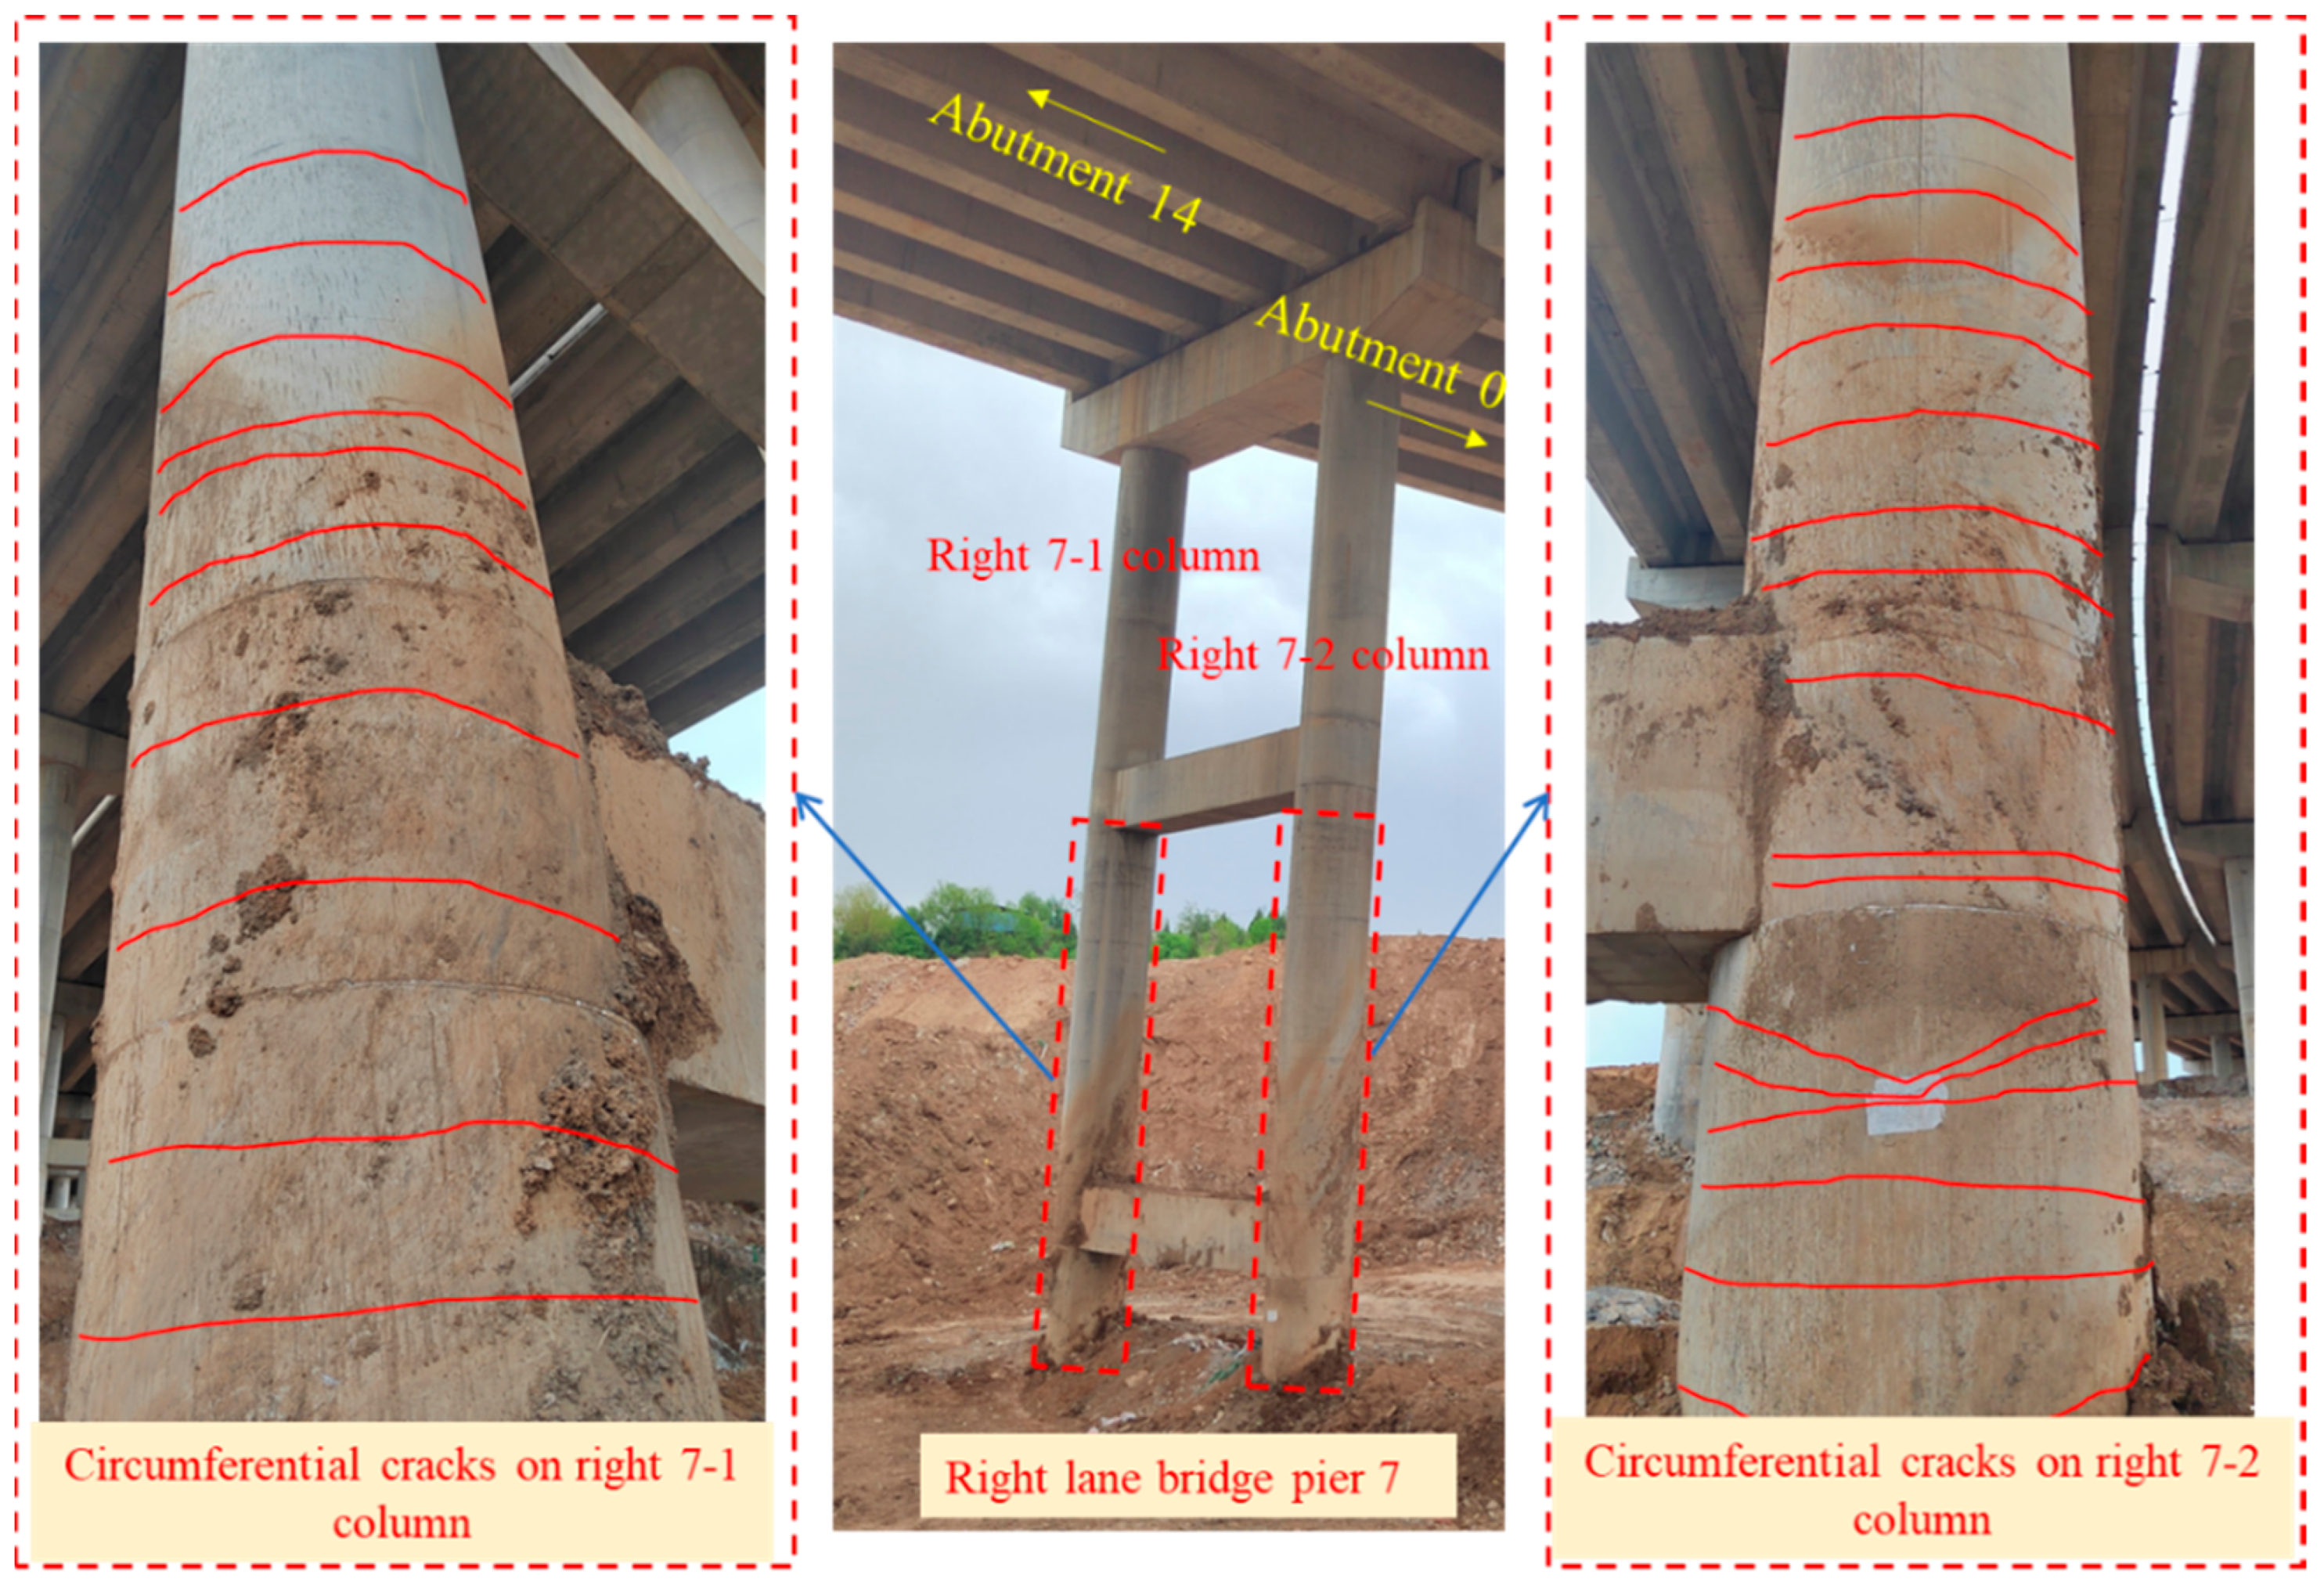
  • After unloading the filled soil, detailed inspections of the pier columns were carried out. The observed regular annular cracks on the Pier 7 columns of both the left and right lane bridges were in remarkable agreement with the high-risk zones predicted by the finite element analysis. This consistency validates the effectiveness of the integrated approach combining field investigations and numerical simulations in accurately diagnosing bridge damage. It suggests that such an approach can serve as a reliable methodology for similar accident investigations in bridge engineering, enabling engineers to quickly and accurately identify the root causes of structural failures.
  • The reinforcement scheme, which combined section enlargement and steel jacket addition for Pier 7 columns, successfully addressed the residual displacement and restored the bearing capacity of the damaged piers. Post-reinforcement measurements showed that the verticality of the columns met the required standards, and load-bearing capacity calculations confirmed that the reinforced piers could safely withstand combined compression and bending forces with a sufficient safety margin. This demonstrates the practicality and effectiveness of the proposed reinforcement strategy, providing a valuable reference for the repair and reinforcement of piers with similar damage patterns.
  • From a broader perspective, this study highlights the importance of considering the impact of surrounding soil-related factors, such as filled soil loads, in bridge design, construction, and maintenance. It emphasizes the necessity of strict regulations regarding the disposal of construction waste and soil filling near bridge structures to prevent potential safety hazards. The research methodology and findings can be extended to other bridge projects facing similar challenges, helping engineers to better anticipate, assess, and mitigate risks associated with soil-structure interaction.
However, several limitations of this study should be noted. First, this research was conducted on a single bridge in a specific geological environment with fill soil effects, which may limit the direct applicability of the findings to bridges in different environments. For example, in soft soil areas or seismic-prone regions, additional considerations for foundation stability and dynamic load resistance may be required. Second, the complexity of fill soil pressure and landslide effects was only calculated based on classical theories and formulas in this study. The additional loads generated by filled soil could be better simulated through experimental data and complex numerical models. Finally, this study focused only on one specific type of bridge pier structure; reinforcement strategies may need adjustment for different column geometries or material compositions.

Author Contributions

X.T.: Writing—review and editing, writing—original draft preparation, formal analysis, and data curation. H.L.: Writing—review and editing, writing—original draft preparation, software, methodology, conceptualization, and funding acquisition. J.L.: Supervision, resources, investigation, and funding acquisition. P.Y.: Project administration and data curation. J.Z.: Investigation and methodology. All authors have read and agreed to the published version of the manuscript.

Funding

This research was funded by the Transportation Science and Technology Planning Project of Henan Province, China (Grant No. 2021J2 and Grant No. 2015X01-2), the Henan Province Major Science and Technology Project, China (Grant No. 151100310900), Henan Province Science and Technology Key Project (Grant No. 252102320310), and the Science and Technology Planning Project of Henan Construction Science and Technology Association (Grant No. YJKJP-202506).

Data Availability Statement

All data, models, and code generated or used in this study are available from the corresponding author upon request.

Conflicts of Interest

Authors Haikuan Liu and Pinde Yu were employed by the company Henan Transportation Research Institute Co., Ltd. The remaining authors declare that the research was conducted in the absence of any commercial or financial relationships that could be construed as potential conflicts of interest.

References

  1. Lee, S.; Chang, H.; Lee, J. Construction and Demolition Waste Management and Its Impacts on the Environment and Human Health: Moving Forward Sustainability Enhancement. Sustain. Cities Soc. 2024, 115, 105855. [Google Scholar] [CrossRef]
  2. Sagan, J.; Mach, A. Construction Waste Management: Impact on Society and Strategies for Reduction. J. Clean. Prod. 2025, 486, 144363. [Google Scholar] [CrossRef]
  3. Cudecka-Purina, N.; Kuzmina, J.; Butkevics, J.; Olena, A.; Ivanov, O.; Atstaja, D. A Comprehensive Review on Construction and Demolition Waste Management Practices and Assessment of This Waste Flow for Future Valorization via Energy Recovery and Industrial Symbiosis. Energies 2024, 17, 5506. [Google Scholar] [CrossRef]
  4. de Magalhães, R.F.; de M.F. Danilevicz, Â.; Saurin, T.A. Reducing Construction Waste: A Study of Urban Infrastructure Projects. Waste Manag. 2017, 67, 265–277. [Google Scholar] [CrossRef] [PubMed]
  5. Islam, N.; Sandanayake, M.; Muthukumaran, S.; Navaratna, D. Review on Sustainable Construction and Demolition Waste Management—Challenges and Research Prospects. Sustainability 2024, 16, 3289. [Google Scholar] [CrossRef]
  6. Zhao, Y.; Liu, Z.; Liang, T.; He, F.; Zhan, L.; Chen, Y.; Ling, D.; Wang, J. Soil Fluidisation Induced by Fine Particles Migration: Insights from the Shenzhen 2015 Landfill Landslide. Eng. Geol. 2024, 343, 107783. [Google Scholar] [CrossRef]
  7. Zhang, J.; Qian, J.; Lu, Y.; Li, X.; Song, Z. Study on Landslide Susceptibility Based on Multi-Model Coupling: A Case Study of Sichuan Province, China. Sustainability 2024, 16, 6803. [Google Scholar] [CrossRef]
  8. Bhuyan, K.; Rana, K.; Ozturk, U.; Nava, L.; Rosi, A.; Meena, S.R.; Fan, X.; Floris, M.; van Westen, C.; Catani, F. Towards Automatic Delineation of Landslide Source and Runout. Eng. Geol. 2024, 345, 107866. [Google Scholar] [CrossRef]
  9. Haugen, S.; Henderson, A.; Amdal, Å. Case-Study of a Quick Clay Landslide That Caused the Partial Collapse of Mofjellbekken Bridges in Norway; CRC Press: Boca Raton, FL, USA, 2016; pp. 1091–1097. [Google Scholar]
  10. Arafianto, A.; Rahardjo, P.P. Back-Analysis of Ground Movement Based on Displacement Matching Approach: A Case Study of Landslide at Bridge Abutment Using 3D Finite Element Method; Springer: Singapore, 2021; pp. 1061–1074. [Google Scholar]
  11. Ma, Y.-G.; Wang, Y.-F.; Chen, C. Force Analysis and Handling Measures for Offsetting of Bridge Passive Piles under Action of Stacked Load. Bridge Constr. 2014, 44, 22–26. [Google Scholar]
  12. Yang, C.-M.; Chao, W.-A.; Weng, M.-C.; Fu, Y.-Y.; Chang, J.-M.; Huang, W.-K. Outburst Debris Flow of Yusui Stream Caused by a Large-Scale Silabaku Landslide, Southern Taiwan. Landslides 2022, 19, 1807–1811. [Google Scholar] [CrossRef]
  13. Wang, J.; Wei, K.; Cai, H. Dynamic Response of Cylindrical Bridge Pier Subjected to the Impact of Flash Flooding Considering the Effect of Soil–Structure Interactions. Structures 2025, 72, 108199. [Google Scholar] [CrossRef]
  14. Jiang, L.; Xiao, W.; Lai, Z.; Mou, B. Dynamic Characteristics and Impact Load Properties of High-Speed Railway Piers under Debris Flow Impact. Transp. Geotech. 2025, 52, 101562. [Google Scholar] [CrossRef]
  15. Wu, T.; Fan, G.; Dou, C.; Li, X.; Dou, C.; Che, J.; Wang, T.; Rao, J. Simulation Study on Damage Behavior of a Shallow-Buried Foundation Bridge under Combined Action of Flood Scouring and Heavy Vehicle Load. Ocean Eng. 2025, 323, 120410. [Google Scholar] [CrossRef]
  16. Xiang, W.; Lifang, P.; Honggang, W. Simulation Analysis and Experimental Study on the Damage of Bridge Structure Caused by Tilt Collapse and Rockfall on the Slope of Lalin Railway. Chin. J. Rock Mech. Eng. 2020, 39, 1622–1633. [Google Scholar] [CrossRef]
  17. Bounds, T.D.; Muraleetharan, K.K.; Miller, G.A. Lateral Movements of Bridge Embankments on Soft Soils: A Case Study Inspired Investigation. Geotech. Geol. Eng. 2023, 42, 121–139. [Google Scholar] [CrossRef]
  18. Jia, L.; Tao, L.; Hong, H.; Jian, J.; Zhi, H. Experimental Test on Bridge Reinforcement by Enlarging Section-Prestress Method; EDP Sciences: Paris, France, 2020; Volume 165, p. 04015. [Google Scholar]
  19. Li, W.; Liang, H.; Lu, Y.; Xue, J.; Liu, Z. Axial Behavior of Slender RC Square Columns Strengthened with Circular Steel Tube and Sandwiched Concrete Jackets. Eng. Struct. 2019, 179, 423–437. [Google Scholar] [CrossRef]
  20. Yang, K.-H. Axial Behavior of Reinforced Concrete Columns Strengthened with New Section Enlargement Approaches. ACI Struct. J. 2019, 116, 87–96. [Google Scholar] [CrossRef]
  21. Lu, C.; Ouyang, K.; Wang, Q.; Zhu, W.; Chen, H.; Lei, Z.; Qin, Z. Axial Behavior of RC Column Strengthened with Laterally Reinforced FRHPC Jacket. Struct. Concr. 2022, 23, 1718–1734. [Google Scholar] [CrossRef]
  22. Wang, Y.D.; Yang, S.; Han, M.; Yang, X. Experimental Study of Section Enlargement with Reinforced Concrete to Increase Shear Capacity for Damaged Reinforced Concrete Beams. Appl. Mech. Mater. 2012, 256–259, 1148–1153. [Google Scholar] [CrossRef]
  23. Liu, H.; Li, J.; Tao, X.; Zhang, H. Research on Assessment of Hollow Slab Bridge Hinge Joint Damage and Reinforcement Method Based on Steel Strip-Tie Rod Clamping. Case Stud. Constr. Mater. 2024, 20, e02885. [Google Scholar] [CrossRef]
  24. Huber, T.; Grasl, P.; Kleiser, M.; Kromoser, B.; Preinstorfer, P. Holistic Life Cycle Cost Analysis of Road Bridges with Non-Metallic Reinforcement. Dev. Built Environ. 2024, 20, 100533. [Google Scholar] [CrossRef]
  25. Liu, H.; Li, J.; Zhang, J.; Pang, D. Decision Analysis of a Reinforcement Scheme for In-Service Prestressed Concrete Box Girder Bridges Based on AHP and Evaluation of the Reinforcement Effect. Buildings 2022, 12, 1771. [Google Scholar] [CrossRef]
  26. CJJ 11-2011; Code for Design of the Municipal Bridge (2019 Edition). Ministry of Housing and Urban-Rural Development of the People’s Republic of China: Beijing, China, 2019.
  27. Chen, Y.; Wang, H.; Zhang, F.; Meng, Q.; Liu, Z. Study on the Calculation Model of Mutually Embedded Displacement between Miscellaneous Fill and Soft Soil. Bull. Eng. Geol. Environ. 2024, 83, 348. [Google Scholar] [CrossRef]
  28. Chen, Y.; Qu, X.; Zhang, F.; Liu, Z. Study on the Influence of Matrix on Mechanical and Failure Characteristics of Miscellaneous Fill. J. Test. Evaluation 2024, 52, 1189–1205. [Google Scholar] [CrossRef]
  29. Tichavský, R.; Ballesteros-Cánovas, J.A.; Šilhán, K.; Tolasz, R.; Stoffel, M. Dry Spells and Extreme Precipitation Are The Main Trigger of Landslides in Central Europe. Sci. Rep. 2019, 9, 14560. [Google Scholar] [CrossRef]
  30. Qiu, H.; Su, L.; Tang, B.; Yang, D.; Ullah, M.; Zhu, Y.; Kamp, U. The Effect of Location and Geometric Properties of Landslides Caused by Rainstorms and Earthquakes. Landforms 2024, 49, 2067–2079. [Google Scholar] [CrossRef]
  31. Tang, D.; Huang, M. The Sustainable Development of Bridges in China: Collapse Cause Analysis, Existing Management Dilemmas and Potential Solutions. Buildings 2024, 14, 419. [Google Scholar] [CrossRef]
  32. Deng, L.; Wang, W.; Yu, Y. State-of-the-Art Review on the Causes and Mechanisms of Bridge Collapse. J. Perform. Constr. Facil. 2015, 30, 04015005. [Google Scholar] [CrossRef]
  33. Cheng, M.-L.; Gao, W.-W. Study on the Impact Law of V-Shaped Gully Debris Avalanches on Double-Column Piers. Buildings 2024, 14, 577. [Google Scholar] [CrossRef]
  34. Borowski, L.; Pienko, M.; Wielgos, P. Evaluation of Inventory Surveying of Façade Scaffolding Conducted During ORKWIZ Project. In Proceedings of the 2017 Baltic Geodetic Congress (BGC Geomatics), Gdansk, Poland, 22–25 June 2017; pp. 189–192. [Google Scholar]
  35. JTG F80/1—2017; Inspection and Evaluation Quality Standards for Highway Engineering: Section 1 Civil Engineering. Research Institute of Highway Ministry of Transport: Beijing, China, 2018.
  36. Li, X.-M.; Liu, Y.; Wu, H.; Ding, C.-Y.; Dong, J.; Peng, W.; Zhang, D.-H.; Sun, J. A Comprehensive Analytical Model for Tensile-Bending Straightening in Strip Processing by Coupling Residual Stress and Buckling Deformation. J. Mech. Work. Technol. 2025, 339, 118802. [Google Scholar] [CrossRef]
  37. Yao, S.; Chen, Y.; Sun, C.; Zhao, N.; Wang, Z.; Zhang, D. Dynamic Response Mechanism of Thin-Walled Plate under Confined and Unconfined Blast Loads. J. Mar. Sci. Eng. 2024, 12, 224. [Google Scholar] [CrossRef]
  38. Sogut, H.; Ozcelik, R.; Sogut, K.; Erdal, F. Experimental Behavior and FE Modeling of Buckling Restrained Braced Frame with Slip-Critical Connection. Appl. Sci. 2025, 15, 5626. [Google Scholar] [CrossRef]
  39. Gao, L.; Zhuang, M.-L.; Zhang, Q.; Bao, G.; Yu, X.; Du, J.; Zhou, S.; Wang, M. Displacement and Internal Force Response of Mechanically Connected Precast Piles Subjected to Horizontal Load Based on the M-Method. Buildings 2024, 14, 1943. [Google Scholar] [CrossRef]
  40. Wyllie, D.C.; Mah, C.W. Rock Slope Engineering; CRC Press: Boca Raton, FL, USA, 2017. [Google Scholar]
  41. Das, M.B.; Sobhan, K. Principles of Geotechnical Engineering; Cengage Learning: Boston, MA, USA, 2018. [Google Scholar]
  42. JTG 3362-2018; Specifications for Design of Highway Reinforced Concrete and Prestressed Concrete Bridges and Culverts. Ministry of Transport of the People’s Republic of China: Beijing, China, 2018.
  43. Huang, Y.; Liu, E.; Lu, Y.; Jiao, Y. Axial Performance of Square Steel Tube and Sandwiched Concrete Jacketed Circular CFST Columns. Eng. Struct. 2024, 313, 118200. [Google Scholar] [CrossRef]
  44. Wan, S.; Li, S.; Chen, Z.; Tang, Y. An Ultrasonic-AI Hybrid Approach for Predicting Void Defects in Concrete-Filled Steel Tubes via Enhanced XGBoost with Bayesian Optimization. Case Stud. Constr. Mater. 2025, 22, e04359. [Google Scholar] [CrossRef]
  45. Zhuang, L.-D.; Zhao, J.-Z.; Wang, C.; Liang, H.-Q.; Tang, M.-X. Experimental Study on the Composite Reinforcement Method for Single-Column Piers in Existing Bridges. Structures 2024, 65, 106734. [Google Scholar] [CrossRef]
  46. JTG D60-2015; General Specifications for Design of Highway Bridges and Culverts. Ministry of Transport of the People’s Republic of China: Beijing, China, 2015.
  47. GB 50936-2014; Technical Code for Concrete Filled Steel Tubular Structures. Ministry of Housing and Urban-Rural Development of the People’s Republic of China: Beijing, China, 2014.
  48. GB 50017-2017; Standard for Design of Steel Structures. Ministry of Housing and Urban-Rural Development of the People’s Republic of China. General Administration of Quality Supervision, Inspection and Quarantine: Beijing, China, 2017.
  49. GB 50010-2010 (2015 Edition); Code for Design of Concrete Structures. Ministry of Housing and Urban-Rural Development of the People’s Republic of China. General Administration of Quality Supervision, Inspection and Quarantine: Beijing, China, 2015.
Figure 1. Photograph of bridge (after filling, before unloading).
Buildings 15 01929 g001
Figure 2. Layout of bridge cross-section (in cm).
Buildings 15 01929 g002
Figure 3. Illustration of the extent of filled soil under the bridge (in cm).
Buildings 15 01929 g003
Figure 4. Surface water accumulation and ground cracks.
Buildings 15 01929 g004
Figure 5. Photo of Leica TS50 total station measurement.
Buildings 15 01929 g005
Figure 6. Finite element model of the right lane bridge.
Buildings 15 01929 g006
Figure 7. Force and displacement analysis of right lane bridge.
Buildings 15 01929 g007aBuildings 15 01929 g007b
Figure 8. The HC-F600 Integrated Crack Tester and on-site photos.
Buildings 15 01929 g008
Figure 9. Illustration of cracking at Pier 7 of the left lane bridge.
Buildings 15 01929 g009
Figure 10. Illustration of cracking at Pier 7 of the right lane bridge.
Buildings 15 01929 g010
Figure 11. Comparison of offsets before and after unloading of the left 7-1 and 7-2 columns.
Buildings 15 01929 g011
Figure 12. Comparison of offsets before and after unloading of the right 7-1 and 7-2 columns.
Buildings 15 01929 g012
Figure 13. Photograph of bridge columns after reinforcement.
Buildings 15 01929 g013
Figure 14. Section of pier column after reinforcement (in cm).
Buildings 15 01929 g014
Table 1. Stratification of geotechnical strata and bearing capacity characteristics at bridge site.
Soil LayersGeotechnical NameBasic Allowable Bearing Capacity f a 0 (kPa)
1Plain Fill60
2Silty Soil140
3Silty Clay210
4Limestone2000
5Fully Weathered Mudstone250
6Moderately Weathered Mudstone700
7Sandstone2000
8Limestone2000
Table 2. Fill thickness findings under the bridge.
BridgesPier NumberColumn NumberDesign Pier Height (m)Exposed Pier Height (m)Thickness of the Fill (m)
Right lane bridgePier 4Right 4-115.01511.083.94
Right 4-215.01510.824.20
Pier 5Right 5-116.61410.735.88
Right 5-216.61410.436.18
Pier 6Right 6-120.01410.379.64
Right 6-220.0149.5410.47
Pier 7Right 7-131.81413.3618.45
Right 7-231.81412.6119.20
Left lane bridgePier 4Left 4-115.01510.584.44
Left 4-215.0159.745.28
Pier 5Left 5-116.61410.166.45
Left 5-216.6149.027.59
Pier 6Left 6-120.0149.3610.65
Left 6-220.0148.8911.12
Pier 7Left 7-131.81412.2419.57
Left 7-231.81412.1619.65
Table 3. Column offset and verticality measurement results of Piers 4–7.
BridgesPier NumberColumn NumberExposed Pier Height (m)Longitudinal Offset/Column VerticalityTransverse Offset/Column Verticality
Offset (mm)VerticalityOffset (mm)Verticality
Right lane bridgePier 4Right 4-111.08−14.8−0.13%1.70.02%
Right 4-210.8210.70.10%11.70.11%
Pier 5Right 5-110.73−15.4−0.14%20.10.19%
Right 5-210.43−9.8−0.09%19.80.19%
Pier 6Right 6-110.37−15.1−0.15%6.50.06%
Right 6-29.54−4.2−0.04%−5.6−0.06%
Pier 7Right 7-113.36342.72.57%−171.8−1.29%
Right 7-212.61312.92.48%−258.2−2.05%
Left lane bridgePier 4Left 4-110.588.10.08%0.60.01%
Left 4-29.74−5.7−0.06%5.60.06%
Pier 5Left 5-110.16−16.5−0.16%−7.3−0.07%
Left 5-29.02−19.9−0.22%−17.4−0.19%
Pier 6Left 6-19.36−14.2−0.15%15.20.16%
Left 6-28.89−18.2−0.20%12.80.14%
Pier 7Left 7-112.24210.91.72%−71.9−0.59%
Left 7-212.16204.51.68%−22.4−0.18%
Table 4. Soil spring stiffness coefficients for the pile foundation elements in the FEM model.
Pier NumberPile Length (m)Soil Layer Thickness (m)Soil Proportional Coefficient
(kN/m4)
Soil Spring Stiffness (kN/m)
Pier 42445000108,000
45000324,000
1610,0006,912,000
Pier 52865000243,000
45000432,000
1810,0009,234,000
Pier 6282500027,000
105000945,000
1610,0008,640,000
Pier 7403450007,803,000
610,0005,994,000
Table 5. Mechanical parameters of concrete materials.
Strength GradeStandard Value of Axial Compressive Strength (MPa)Standard Value of Axial Tensile Strength (MPa)Elastic Modulus (MPa)Poisson’s RatioLinear Expansion Coefficient (1/°C)Unit Weight (kN/m3)
C3020.102.01 3.00 × 10 4 0.2 1.00 × 10 5 25.0
C4026.802.40 3.25 × 10 4 0.2 1.00 × 10 5 25.5
C5032.402.65 3.45 × 10 4 0.2 1.00 × 10 5 26.0
Table 6. Crack detection results for Pier 7 of the left and right lane bridges.
BridgesStructural MemberCrack Development PatternsMaximum Width/Depth of Cracks (mm)
Left lane bridgeLeft 7-1As illustrated in Figure 9, there is a regular pattern of circumferential cracking on the face of the column’s large pile number, with a crack spacing of 20–40 cm. The cracking extends from the middle of the column to the bottom, with a length of approximately 18 m (design elevation of 685–703).0.41/56
Left 7-2As illustrated in Figure 9, there is a regular pattern of circumferential cracking on the face of the column’s large pile number, with a crack spacing of 20–40 cm. The cracking extends from the middle of the column to the bottom, with a length of approximately 18 m (design elevation of 685–703).0.83/63
Right lane bridgeRight 7-1As illustrated in Figure 10, there is a regular pattern of circumferential cracking on the face of the column’s large pile number, with a crack spacing of 20–40 cm. The cracking extends from the middle of the column to the bottom, with a length of approximately 20 m (design elevation of 685–705).0.66/65
Right 7-2As illustrated in Figure 10, there is a regular pattern of circumferential cracking on the face of the column’s large pile number, with a crack spacing of 20–40 cm. The cracking extends from the middle of the column to the bottom, with a length of approximately 20 m (design elevation of 685–705).1.37/96
Table 7. Verticality of Pier 7 column after reinforcement.
BridgesPier NumberColumn NumberHeight (m)Longitudinal Displacement/Verticality of the ColumnTransverse Displacement/Verticality of the Column
Displacement (mm)VerticalityDisplacement
(mm)
Verticality
Left lane bridgePier 7Left 7-131.81410.20.03%5.70.02%
Left 7-231.814−13.3−0.04%3.50.01%
Right lane bridgePier 7Right 7-131.814−17.2−0.05%−8.9−0.03%
Right 7-231.814−12.3−0.04%−13.6−0.04%
Disclaimer/Publisher’s Note: The statements, opinions and data contained in all publications are solely those of the individual author(s) and contributor(s) and not of MDPI and/or the editor(s). MDPI and/or the editor(s) disclaim responsibility for any injury to people or property resulting from any ideas, methods, instructions or products referred to in the content.

