Article

Mechanical Properties and Microstructure Damage of Limestone Concrete Under Triaxial Stress

Shaanxi Key Laboratory of Safety and Durability of Concrete Structures, Xijing University, Xi’an 710123, China
*
Author to whom correspondence should be addressed.
Buildings 2025, 15(11), 1924; https://doi.org/10.3390/buildings15111924
Submission received: 8 May 2025 / Revised: 26 May 2025 / Accepted: 28 May 2025 / Published: 2 June 2025
(This article belongs to the Special Issue Advanced Research on Concrete Materials in Construction)

Abstract

This study takes limestone crushed stone concrete as the research object and systematically investigates its mechanical property changes and microstructural damage characteristics under different confining pressures using triaxial compression tests, scanning electron microscope (SEM) tests, and digital image processing techniques. The results show that, in terms of macro-mechanical properties, as the confining pressure increases, the peak strength increases by 192.66%, the axial peak strain increases by 143.66%, the elastic modulus increases by 133.98%, and the ductility coefficient increases by 54.61%. In terms of microstructure, the porosity decreases by 64.35%, the maximum pore diameter decreases by 75.69%, the fractal dimension decreases by 19.56%, and the interfacial transition zone cracks gradually extend into the aggregate interior. The optimization of the microstructure makes the concrete more compact, reduces stress concentration, and thereby enhances the macro-mechanical properties. Additionally, the failure characteristics of the specimens shift from diagonal shear failure to compressive flow failure. According to the Mohr–Coulomb strength criterion, the calculated cohesion is 6.96 MPa, the internal friction angle is 38.89°, and the breakage angle is 25.53°. A regression analysis established a quantitative relationship between microstructural characteristics and macro-mechanical properties, revealing the significant impact of microstructural characteristics on macro-mechanical properties. Under low confining pressure, early volumetric expansion and rapid volumetric strain occur, with microcracks mainly concentrated at the aggregate interface that are relatively wide. Under high confining pressure, volumetric expansion is delayed, volumetric strain increases slowly, and microcracks extend into the interior of the aggregate, becoming finer and more dispersed.

1. Introduction

In recent years, with the rapid development of technology and the continuous improvement of construction engineering standards, underground projects, protective structures, and marine development projects are constantly expanding into deeper underground and deep-sea areas [1,2,3,4,5]. These infrastructures and protective engineering structures, such as subways and undersea tunnels, are usually built within soil or rock strata and are characterized by complex stress environments, primarily featuring triaxial stress states [6]. Against this backdrop, concrete, with its high strength, excellent impermeability, and corrosion resistance, has been widely used in underground construction [7,8]. However, as natural sand and gravel resources gradually deplete and ecological protection policies become increasingly stringent, the supply of traditional coarse aggregates for concrete is facing challenges. Limestone crushed stone, with its easy availability and excellent mechanical properties, has gradually become an important alternative to traditional concrete coarse aggregates in the field of civil engineering [9,10,11,12]. Therefore, an in-depth study of the mechanical properties of limestone crushed stone concrete under triaxial compression is of great significance for the scientific design and safety assurance of underground projects.
Scholars, both domestic and international, have extensively investigated the mechanical properties of various materials under different stress conditions. Kan et al. [13] studied the mechanical properties of high-performance concrete under different curing conditions using uniaxial tension and compression tests. Li et al. [14] revealed the significant impact of bedding angle on the mechanical properties of coal rock through uniaxial and triaxial compression tests and numerical simulations. Rong et al. [15] conducted uniaxial compression tests on concrete specimens with single cracks of varying lengths and found that the strength decreased with increasing crack length and the elastic modulus initially increased and then decreased; the failure modes were categorized as axial splitting, shear failure, and tensile-shear mixed failure, depending on the crack length. Chen et al. [16] investigated the triaxial mechanical properties of coral coarse aggregate-sea sand-seawater concrete (CSSC) and discovered that its stress–strain curve exhibited a “stress plateau” and bilinear behavior under lateral confining pressure. Lin et al. [17] and Wang et al. [18] respectively studied the behavior of ultra-high-performance geopolymer concrete (UHPGC) and ultra-high-performance concrete (UHPC) reinforced with steel-polypropylene hybrid fibers under triaxial compression. They found that as the confining pressure increased, the peak axial stress and toughness of UHPGC increased, and the strength and deformation capacity of UHPC were significantly enhanced by the confining pressure and steel fibers.
Cheng et al. [19] examined the mechanical properties of limestone crushed stone concrete under biaxial compression and discovered that the peak stress and peak strain of limestone crushed stone concrete increased with growing lateral pressure. Yang et al. [20] conducted triaxial compression tests on limestone crushed stone concrete specimens under different confining pressures (0, 2, 5, and 10 MPa), finding that both the peak stress and peak strain of the concrete gradually increased with the increase of confining pressure. Tugrul Tunc [21] investigated the compressive strength and splitting tensile strength of limestone aggregate concrete specimens using a combination of destructive tests (compressive strength and splitting tensile strength tests) and non-destructive Schmidt hammer rebound hardness tests. Zhang et al. [22] found that concrete exhibited significant differences in mechanical properties under confining pressure. As the confining pressure increased, the compressive strength and peak strain of the concrete significantly increased, its deformation capacity was enhanced, and it transformed from brittleness to ductility.
In terms of microstructure, Li et al. [23] used digital image processing (DIP) technology to study the fracture surface characteristics of limestone crushed stone concrete after uniaxial compression and splitting tensile tests. Huang et al. [24] investigated the failure behavior of limestone crushed stone concrete under compression-shear loading using compression-shear tests combined with digital image correlation (DIC), acoustic emission (AE), and scanning electron microscopy (SEM) techniques, revealing the influence of pre-existing crack angles on the peak load, failure modes, and damage degree of the specimens. Wang et al. [25] studied the micropore structure and mechanical properties of concrete when weathered granite (WG) and recycled coarse aggregate (RCA) were combined and found that when WG replaced RCA, the porosity of the concrete decreased, the interfacial transition zone (ITZ) became denser, and the microstructure was optimized, enhancing its mechanical properties. Mohamed et al. [26] investigated the application of natural milled nano-zeolite (NZ) in concrete and found that its addition improved the mechanical properties and microstructure of concrete, resulting in a denser microstructure and better corrosion resistance in different aggressive environments. Buettner et al. [27] analyzed the influence of carbon nanofibers (CNFs) on the micropore structure of recycled aggregate concrete (RAC) using SEM and energy dispersive spectroscopy (EDS) and found that the addition of CNFs to RAC significantly reduced the porosity and permeability, thereby improving RAC’s durability and mechanical properties. Wu et al. [28] studied the influence of interface inclination on the stability of coal-concrete specimens using uniaxial compression and acoustic emission experiments and found that the stress–strain curve experienced three stages, and the peak stress, peak strain, and elastic modulus exhibited a “U”-shaped distribution with the change of inclination angle. Peng et al. [29] found that under the same confining pressure, the higher the porosity of the concrete, the greater the deviatoric stress required to produce the same axial strain. Zheng et al. [30] investigated the influence of carbonation on the microstructure and mechanical properties of dam concrete specimens from the Meishan Double-Arch Dam through SEM, X-CT, and combined uniaxial compression and acoustic emission tests. They revealed the changes in the concrete’s microstructural characteristics, such as porosity, pore size distribution, and pore morphology, due to carbonation, as well as the influence on the material’s damage evolution characteristics. They found that carbonation reduced the compressive strength and elastic modulus of concrete. Shi et al. [31] found that the microfracture toughness of recycled sand concrete is closely related to its macro-mechanical properties, and the optimization of its microstructure significantly enhanced the strength and modulus of concrete. In terms of fractal dimension research, Jin et al. [32] established a relationship model between strain rate and fracture fractal dimension (FD) using Hopkinson pressure bar tests and SEM tests. They found that changes in microstructure are consistent with macroscopic failure modes, and the FD of the pore area increases with increasing strain rate.
Despite extensive research on the mechanical properties and microstructural characteristics of various building materials under different stress conditions, studies on limestone crushed stone concrete remain relatively limited. Specifically, research on its mechanical properties has primarily focused on biaxial compression, with insufficient exploration of its behavior under triaxial stress conditions. Microstructural studies have mostly concentrated on the fracture surfaces of specimens subjected to uniaxial compression, splitting tensile, and compression-shear tests, as well as changes in microstructure after concrete modification. However, there is a lack of in-depth analysis on how microstructure evolution under different confining pressures in triaxial conditions affects mechanical properties. Additionally, existing studies have not yet fully established quantitative relationships in the joint analysis of microstructure and macro-mechanical properties.
In light of the aforementioned limitations, this study takes limestone crushed stone concrete as the research subject and employs a comprehensive set of methods, including triaxial compression tests, SEM tests, and digital image processing techniques, to systematically investigate the changes in mechanical properties and microstructural damage characteristics of limestone crushed stone concrete under different confining pressures. The experimental research plan is shown in Figure 1; the specific research process is as follows: First, raw materials were precisely prepared, and the mix proportions were carefully calculated. Subsequently, specimens were cast and formed. Based on this, triaxial compression tests were conducted to analyze in detail the changes in macro-mechanical properties of limestone crushed stone concrete, such as peak strength, axial peak strain, elastic modulus, and ductility coefficient, under different confining pressures. The study also explored the stage-wise changes in specimen failure characteristics with increasing confining pressure and calculated the corresponding strength parameters based on the Mohr–Coulomb strength criterion. Meanwhile, by using SEM and digital image processing techniques, the evolution of microstructural features, including porosity, maximum pore diameter, fractal dimension, and interfacial transition zone cracks, was closely observed with changes in confining pressure. Regression analysis was employed to establish quantitative relationships among confining pressure, peak strength, elastic modulus, and fractal dimension. The relationship between volumetric strain and the level of micro-cracking was further analyzed. Additionally, the conclusions drawn from this study were compared with existing research findings to provide a solid theoretical basis for the application of limestone crushed stone concrete in complex stress environments and to offer scientific guidance for engineering construction in fields such as underground projects.

2. Test Preparation

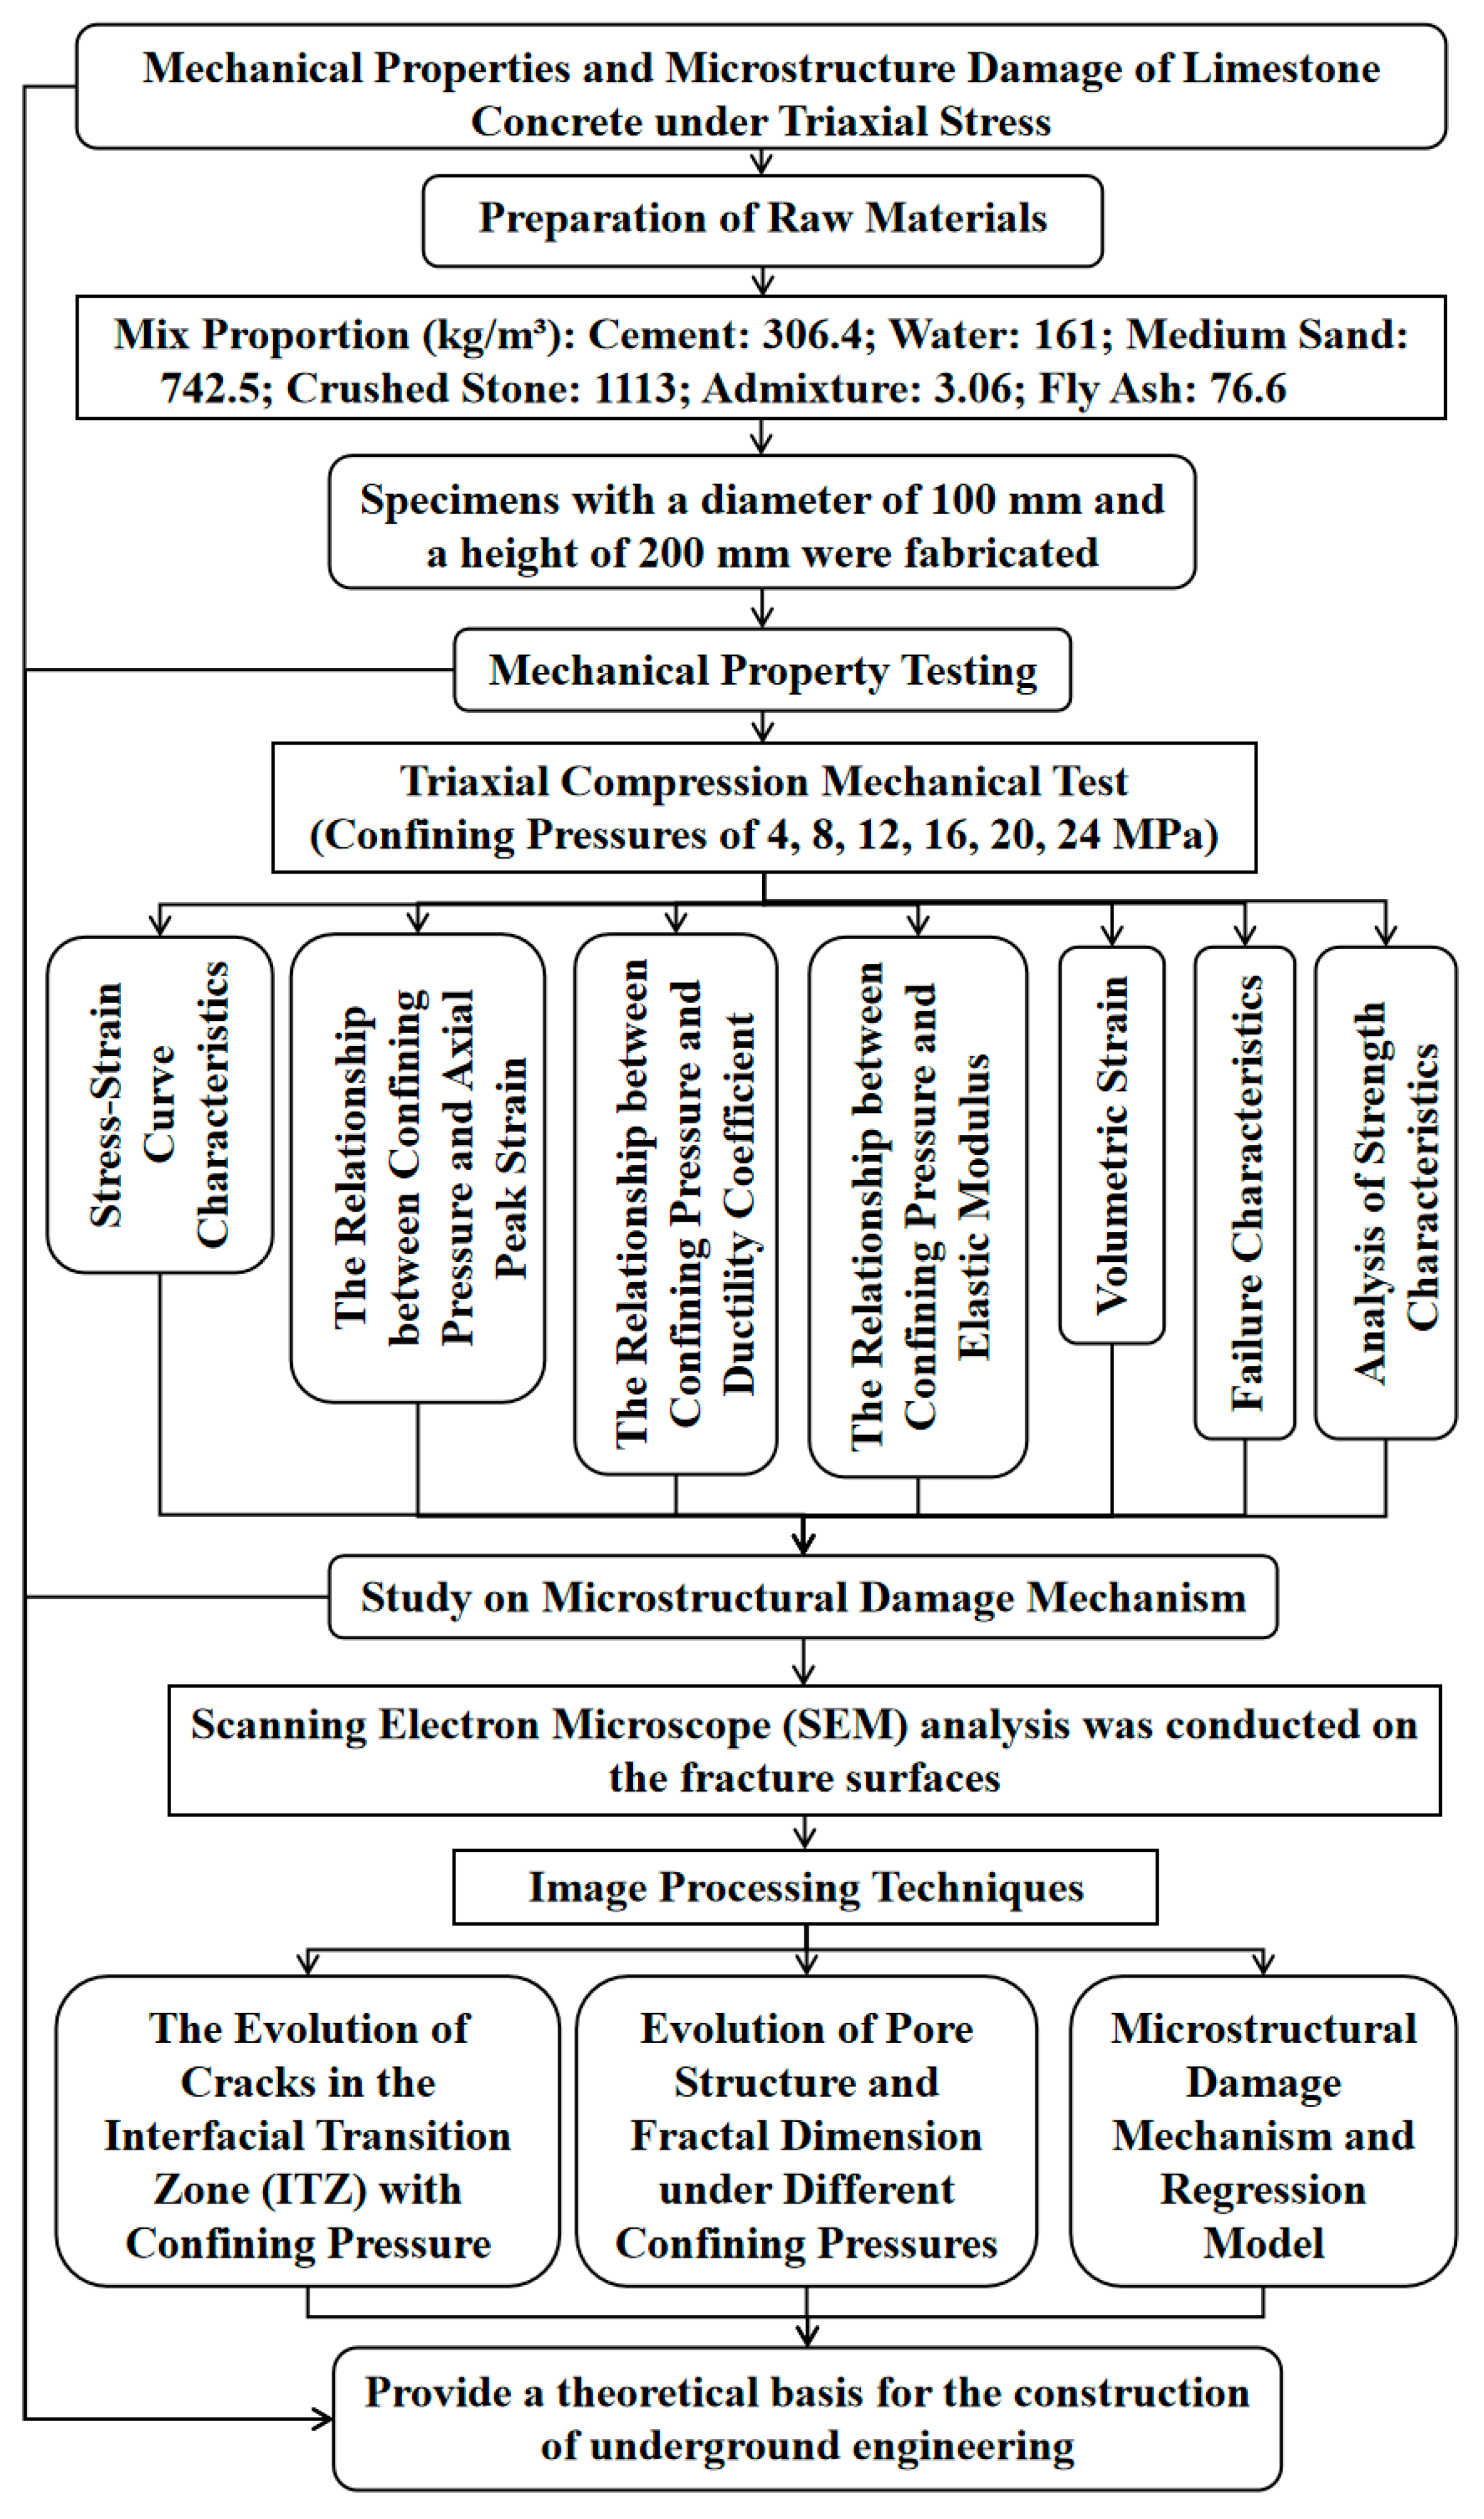
2.1. Raw Materials and Mix Proportion of Test Pieces

The design strength of the limestone crushed stone concrete is C40. The specific selection of raw materials is as follows: ① Ordinary tap water. ② P.O 42.5 ordinary Portland cement, with the main chemical components including calcium oxide (CaO) at approximately 60–65%, silicon dioxide (SiO2) at approximately 20–25%, aluminum oxide (Al2O3) at approximately 5–8%, and iron oxide (Fe2O3) at approximately 3–5%. The physical properties include a specific surface area of ≥300 m2/kg, moderate fineness, an initial setting time of ≥45 min, a final setting time of ≤600 min, a 3-day compressive strength of ≥17.0 MPa, a 28-day compressive strength of ≥42.5 MPa, a 3-day flexural strength of ≥3.5 MPa, and a 28-day flexural strength of ≥6.5 MPa. ③ Fine aggregate: Medium sand, with a particle size range of 0.35 mm to 0.5 mm, an apparent density of 2655 kg/m3, a bulk density of 1400–1600 kg/m3, porosity of approximately 30–40%, and a water absorption rate of 1–3%. The main chemical component is silicon dioxide (SiO2), with a content of 90–99%, which may contain small amounts of impurities such as aluminum oxide (Al2O3) and iron oxide (Fe2O3). ④ Coarse aggregate: Limestone crushed stone (from the Xishan limestone group in Hancheng, Weinan, Shaanxi Province, China), with a crushing value of 2.8, a water absorption rate of 0.73%, a diameter of 5–31.5 mm, and an apparent density of 2691 kg/m3. ⑤ Admixtures: Fly ash (Class F), a Grade I admixture, was used at a dosage of 20%. Its physical properties include a density of 2250 kg/m3, a low water demand ratio (≤95%), and a specific surface area ranging from 300 to 600 m2/kg. Chemically, it is primarily composed of SiO2 and Al2O3, with a low loss on ignition (≤5%). According to the “Code for Design of Concrete Mix Proportions” (JGJ55-2019 [33]), Class F fly ash is predominantly low-calcium fly ash, characterized by low calcium content (typically with CaO content less than 10%) and high pozzolanic reactivity. It reacts with Ca(OH)2 during cement hydration to form calcium silicate hydrate (C-S-H), thereby enhancing the later-age strength and durability of concrete. Therefore, Class F fly ash was selected in this design to meet the C40 strength requirement of limestone crushed stone concrete and to improve its durability. ⑥ Superplasticizer: Polycarboxylate superplasticizer (liquid form), added at 0.8% by weight, with a water reduction rate of 30%. According to the standard “Code for Design of Mix Proportions of Normal Concrete” (JGJ55-2019), the water-to-binder ratio of the limestone crushed stone concrete is calculated to be 0.42, with a sand ratio of 40%. The specific mix proportion is shown in Table 1.

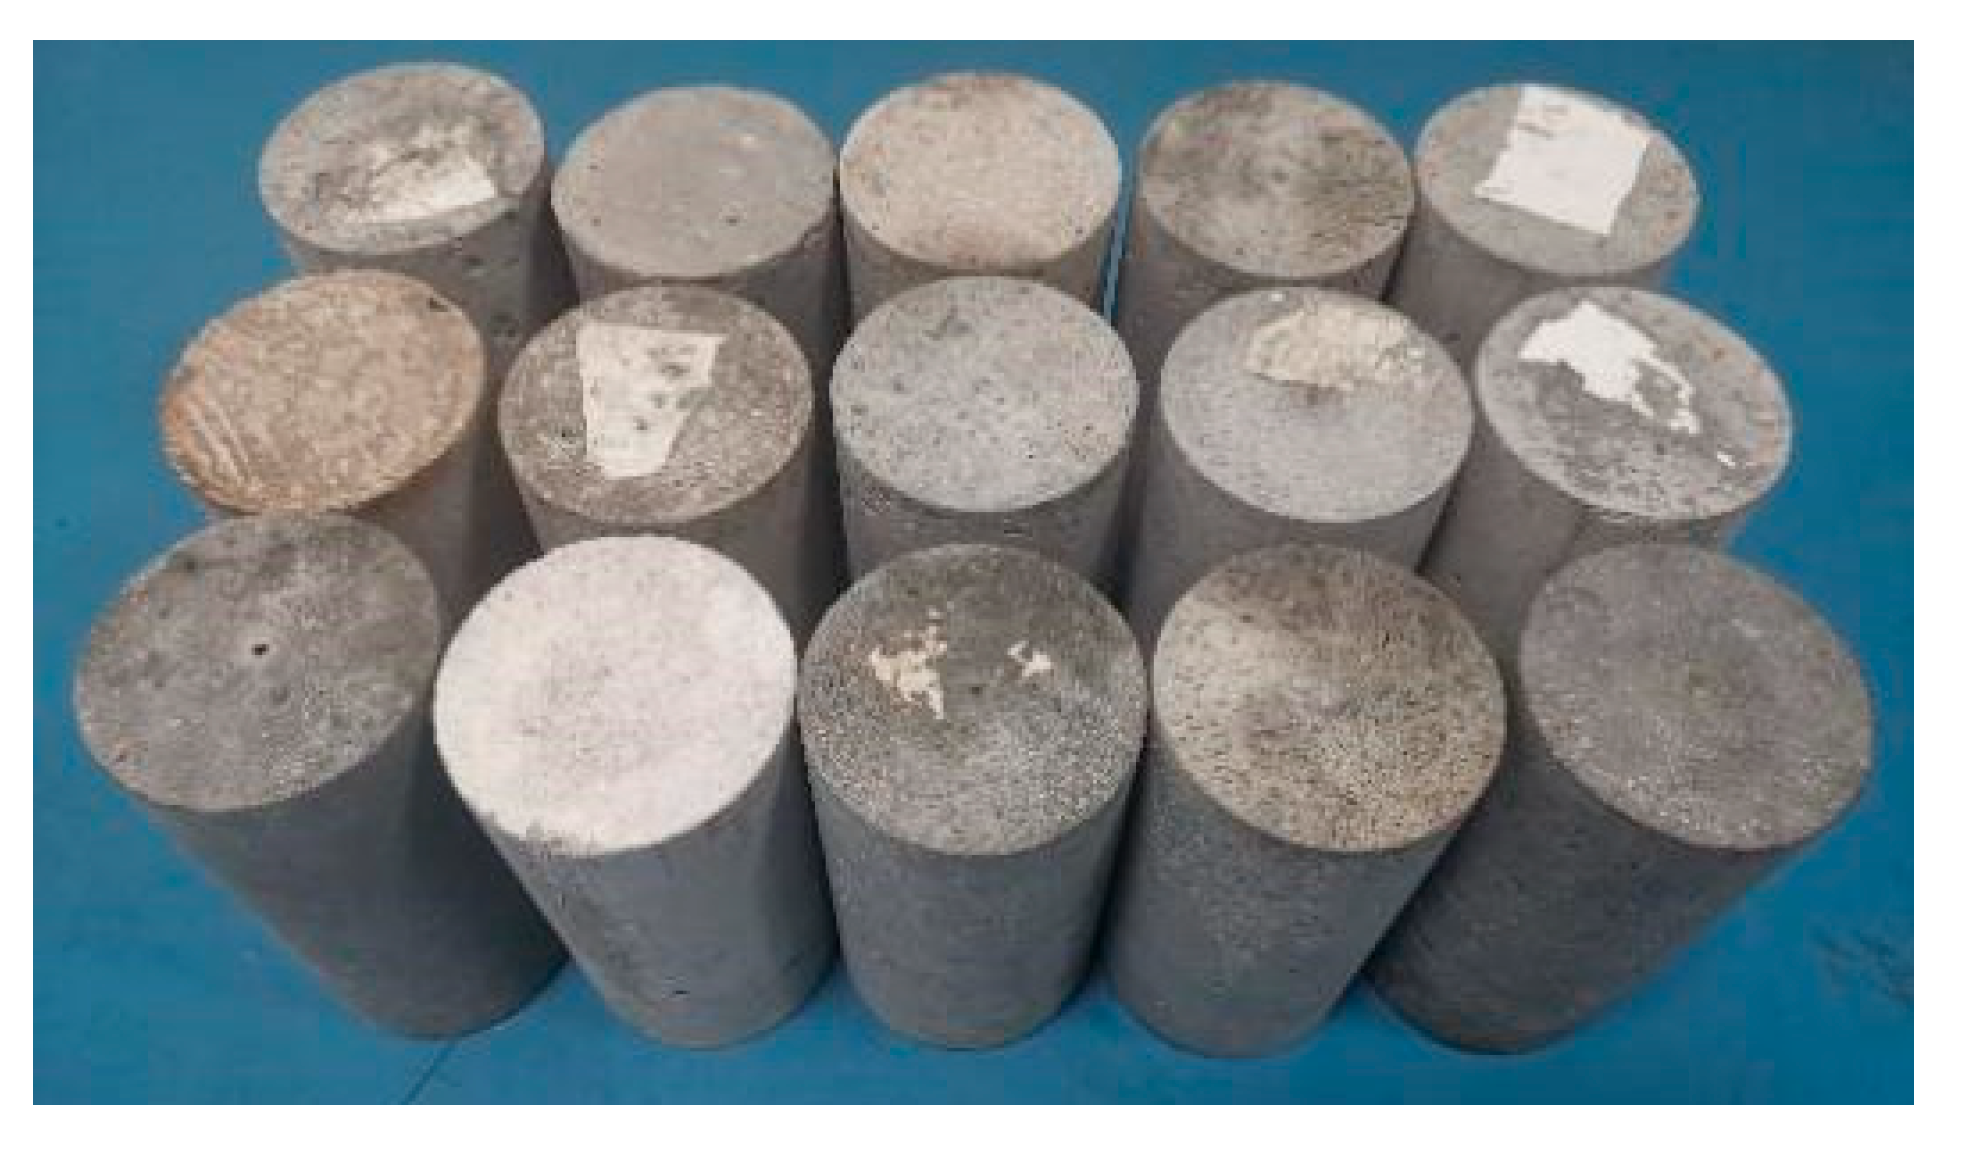
2.2. Sample Design and Fabrication

2.2.1. Triaxial Compression Test

Concrete specimens were fabricated and cured in accordance with the relevant provisions of the national standard “Standard for Test Methods of Properties of Normal Concrete Mixtures” (GBT 50081-2019 [34]). The curing age of the specimens was 28 days, and the final specimen was a cylinder with a diameter of 100 mm and a height of 200 mm, as shown in Figure 2.
To minimize the variability of the limestone crushed stone concrete specimens and eliminate those with visible defects or structural inhomogeneity, 12 limestone crushed stone concrete specimens were initially selected. These specimens were divided into six groups according to the magnitude of the confining pressure, with two specimens in each group. The specimens were numbered LC-i-x, where LC is the abbreviation for limestone crushed stone concrete, i represents the magnitude of the confining pressure (in MPa), and x denotes the number of one of the two specimens in each group. For each confining pressure, two tests were conducted. Ultimately, the results closest to the average value of each group were selected as the representative results for analysis.

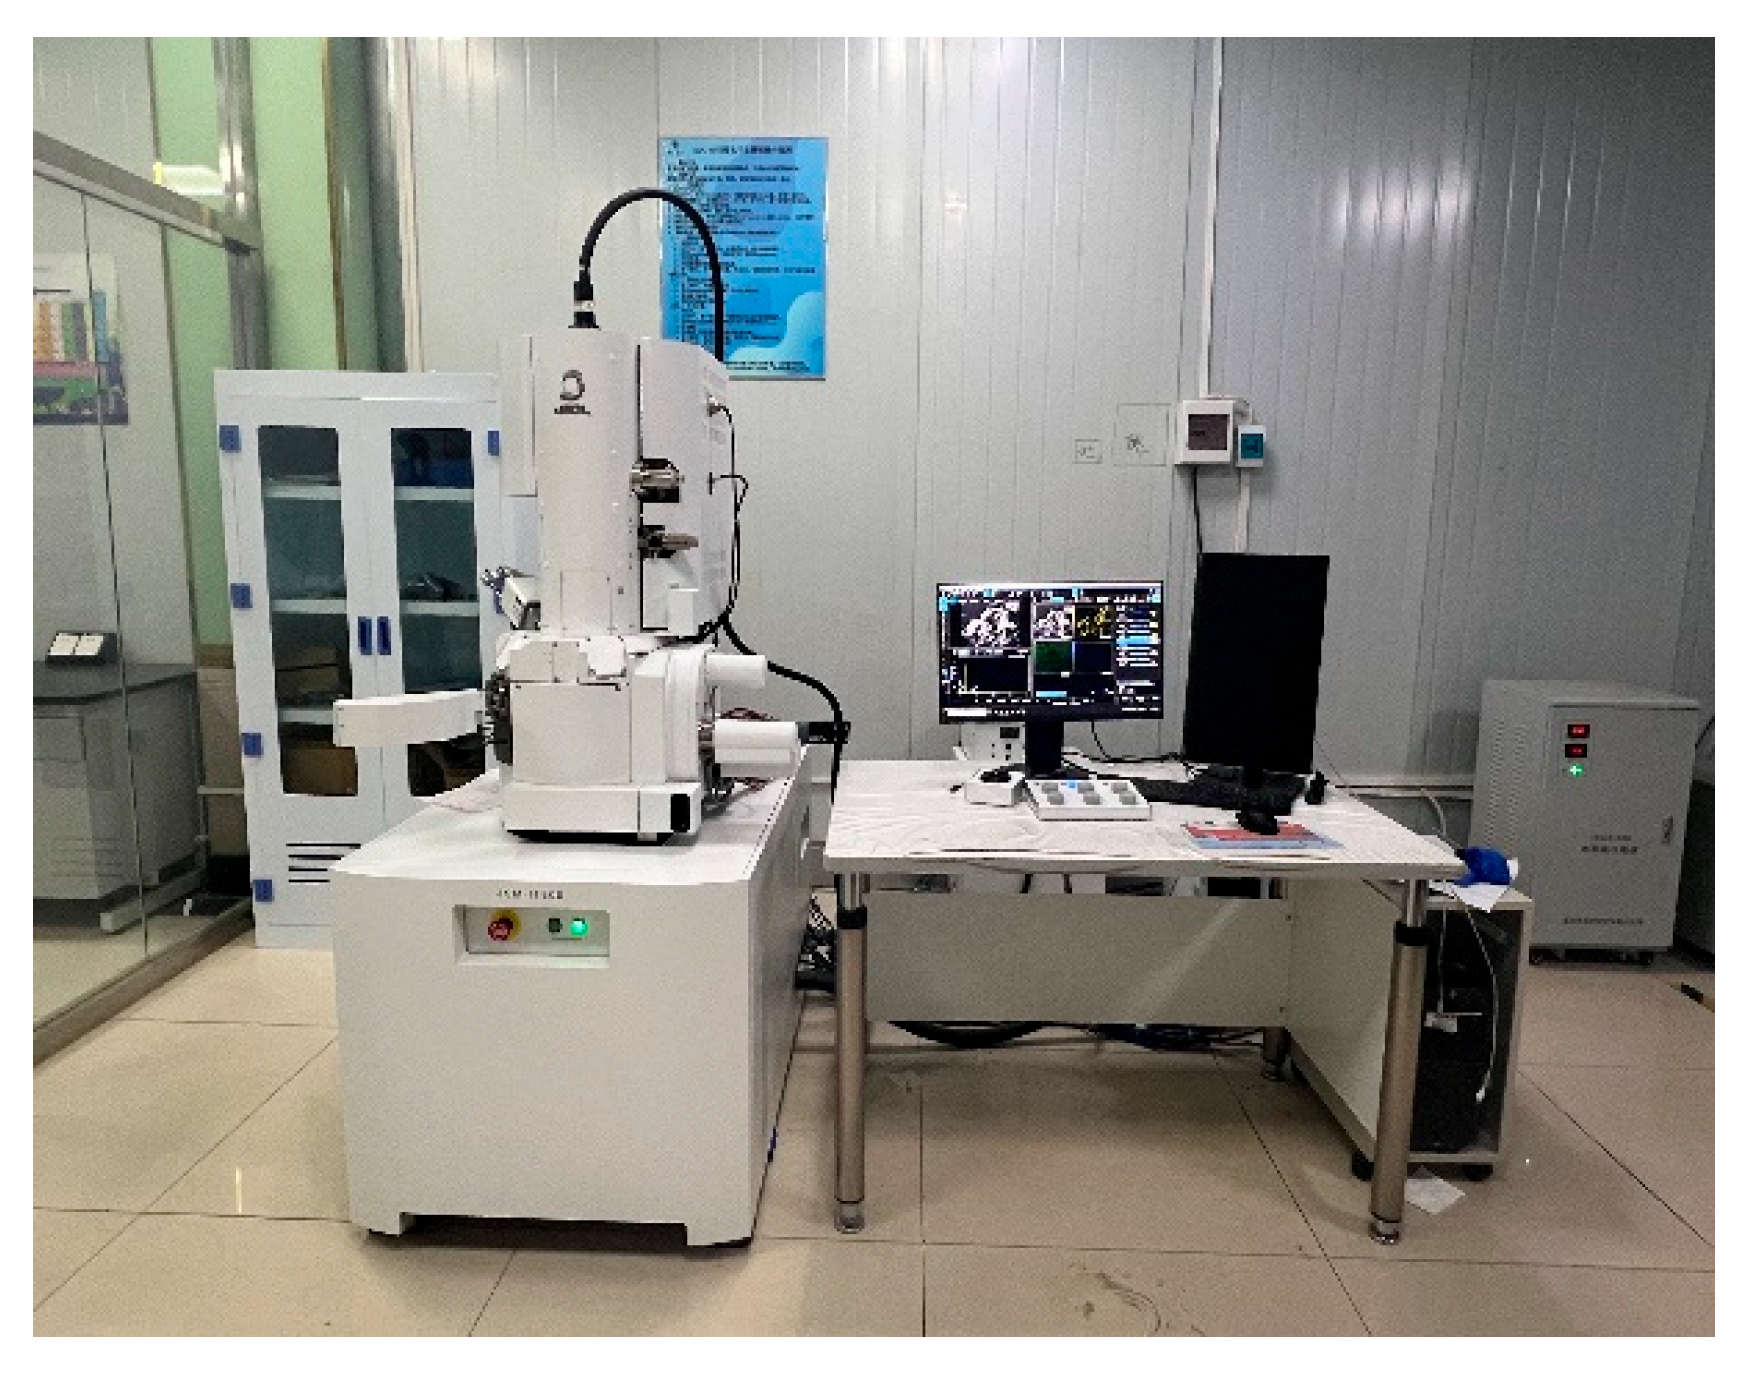
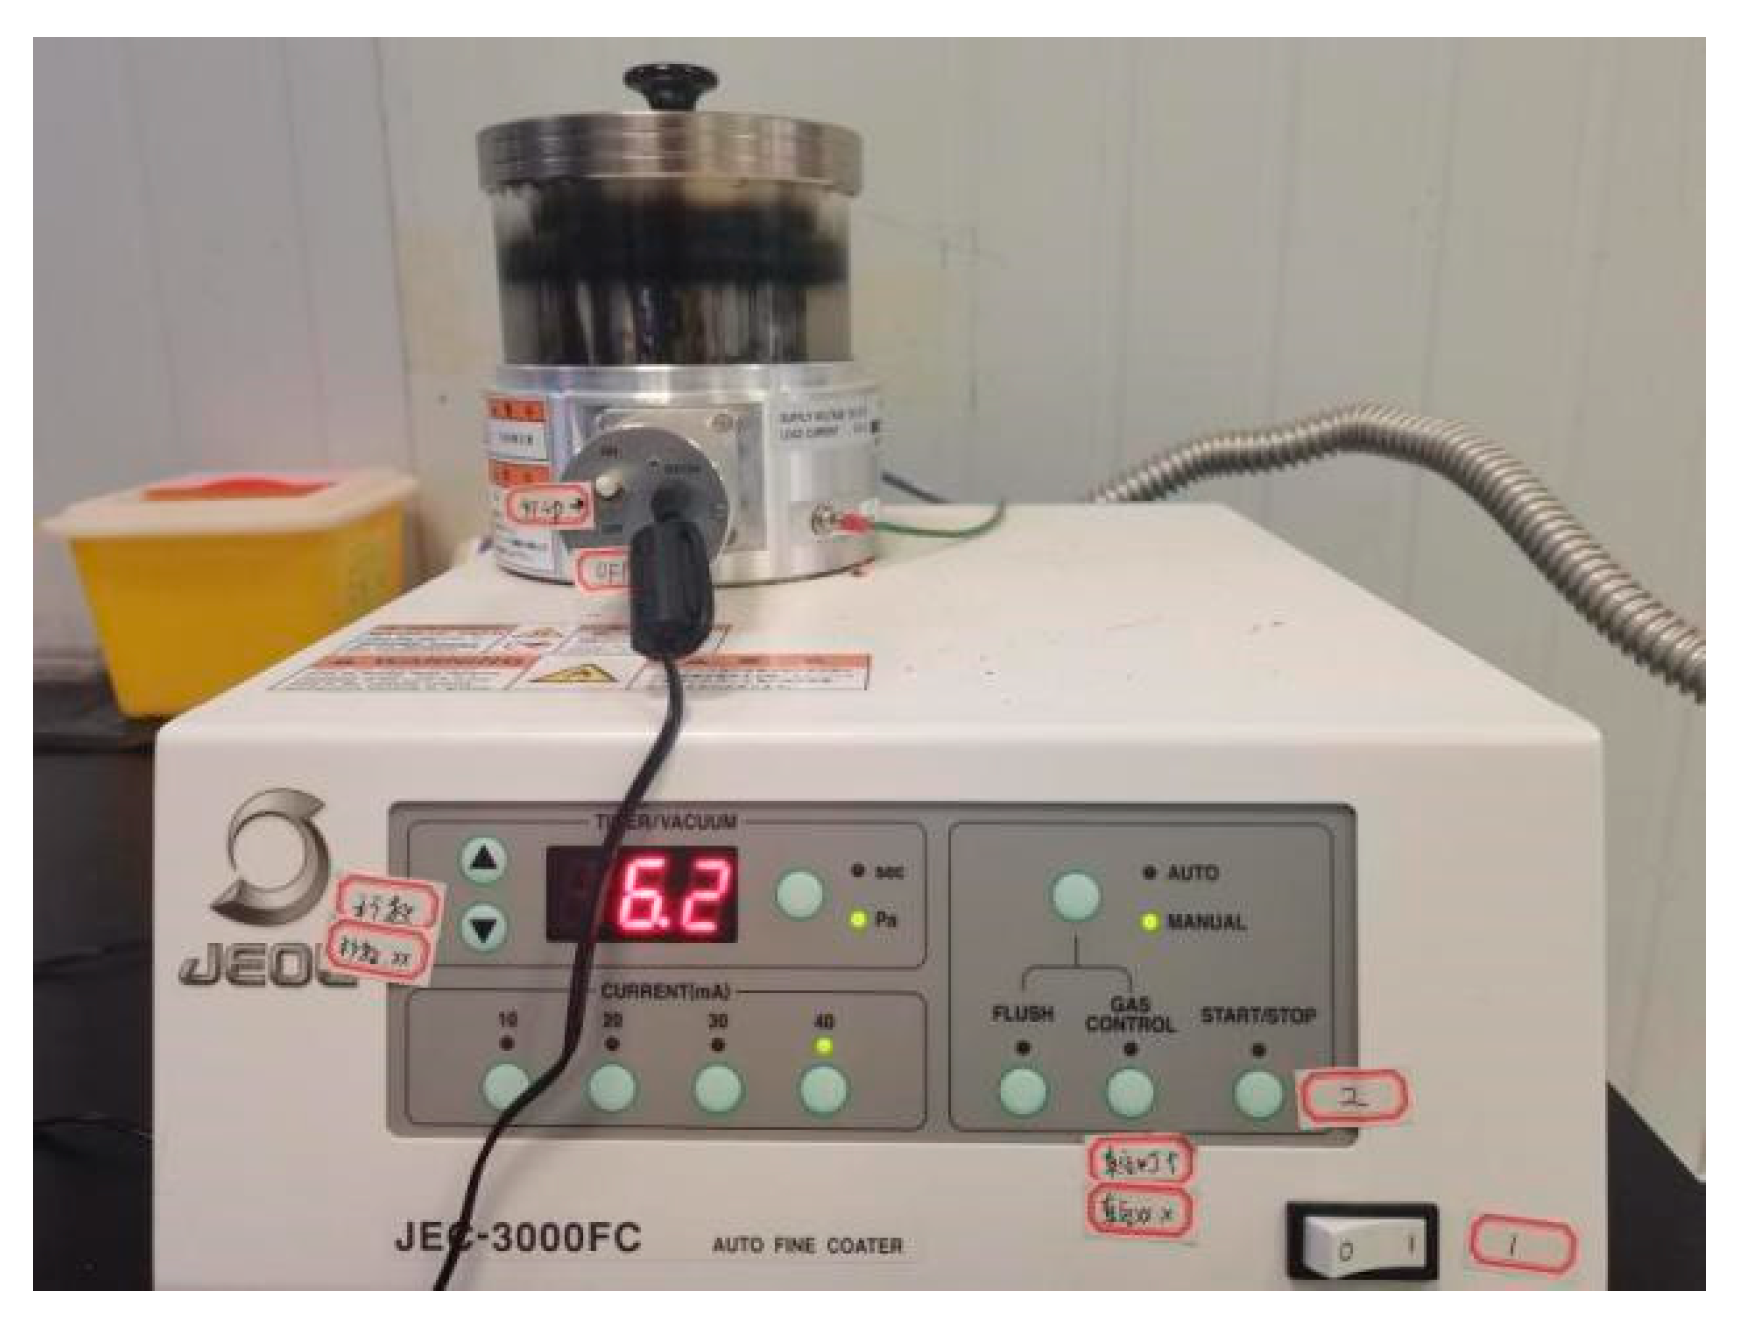
2.2.2. Scanning Electron Microscope Test

During the SEM analysis, according to the method standard of the scanning electron microscope and energy dispersive spectrometer (GB/T1736-2013 [35]) for the identification of clay minerals in sedimentary rocks by micro beam analysis, samples were taken from the fracture surfaces of the limestone crushed stone concrete specimens that had undergone triaxial compression tests under different confining pressures. These samples were prepared into block-shaped specimens with a diameter not exceeding 10 mm, and representative fresh fracture surfaces were selected for analysis. For each confining pressure condition, one specimen of limestone crushed stone concrete was prepared, and the specimens were numbered from left to right as SEM4, SEM8, SEM12, SEM16, SEM20, and SEM24, as shown in Figure 3.

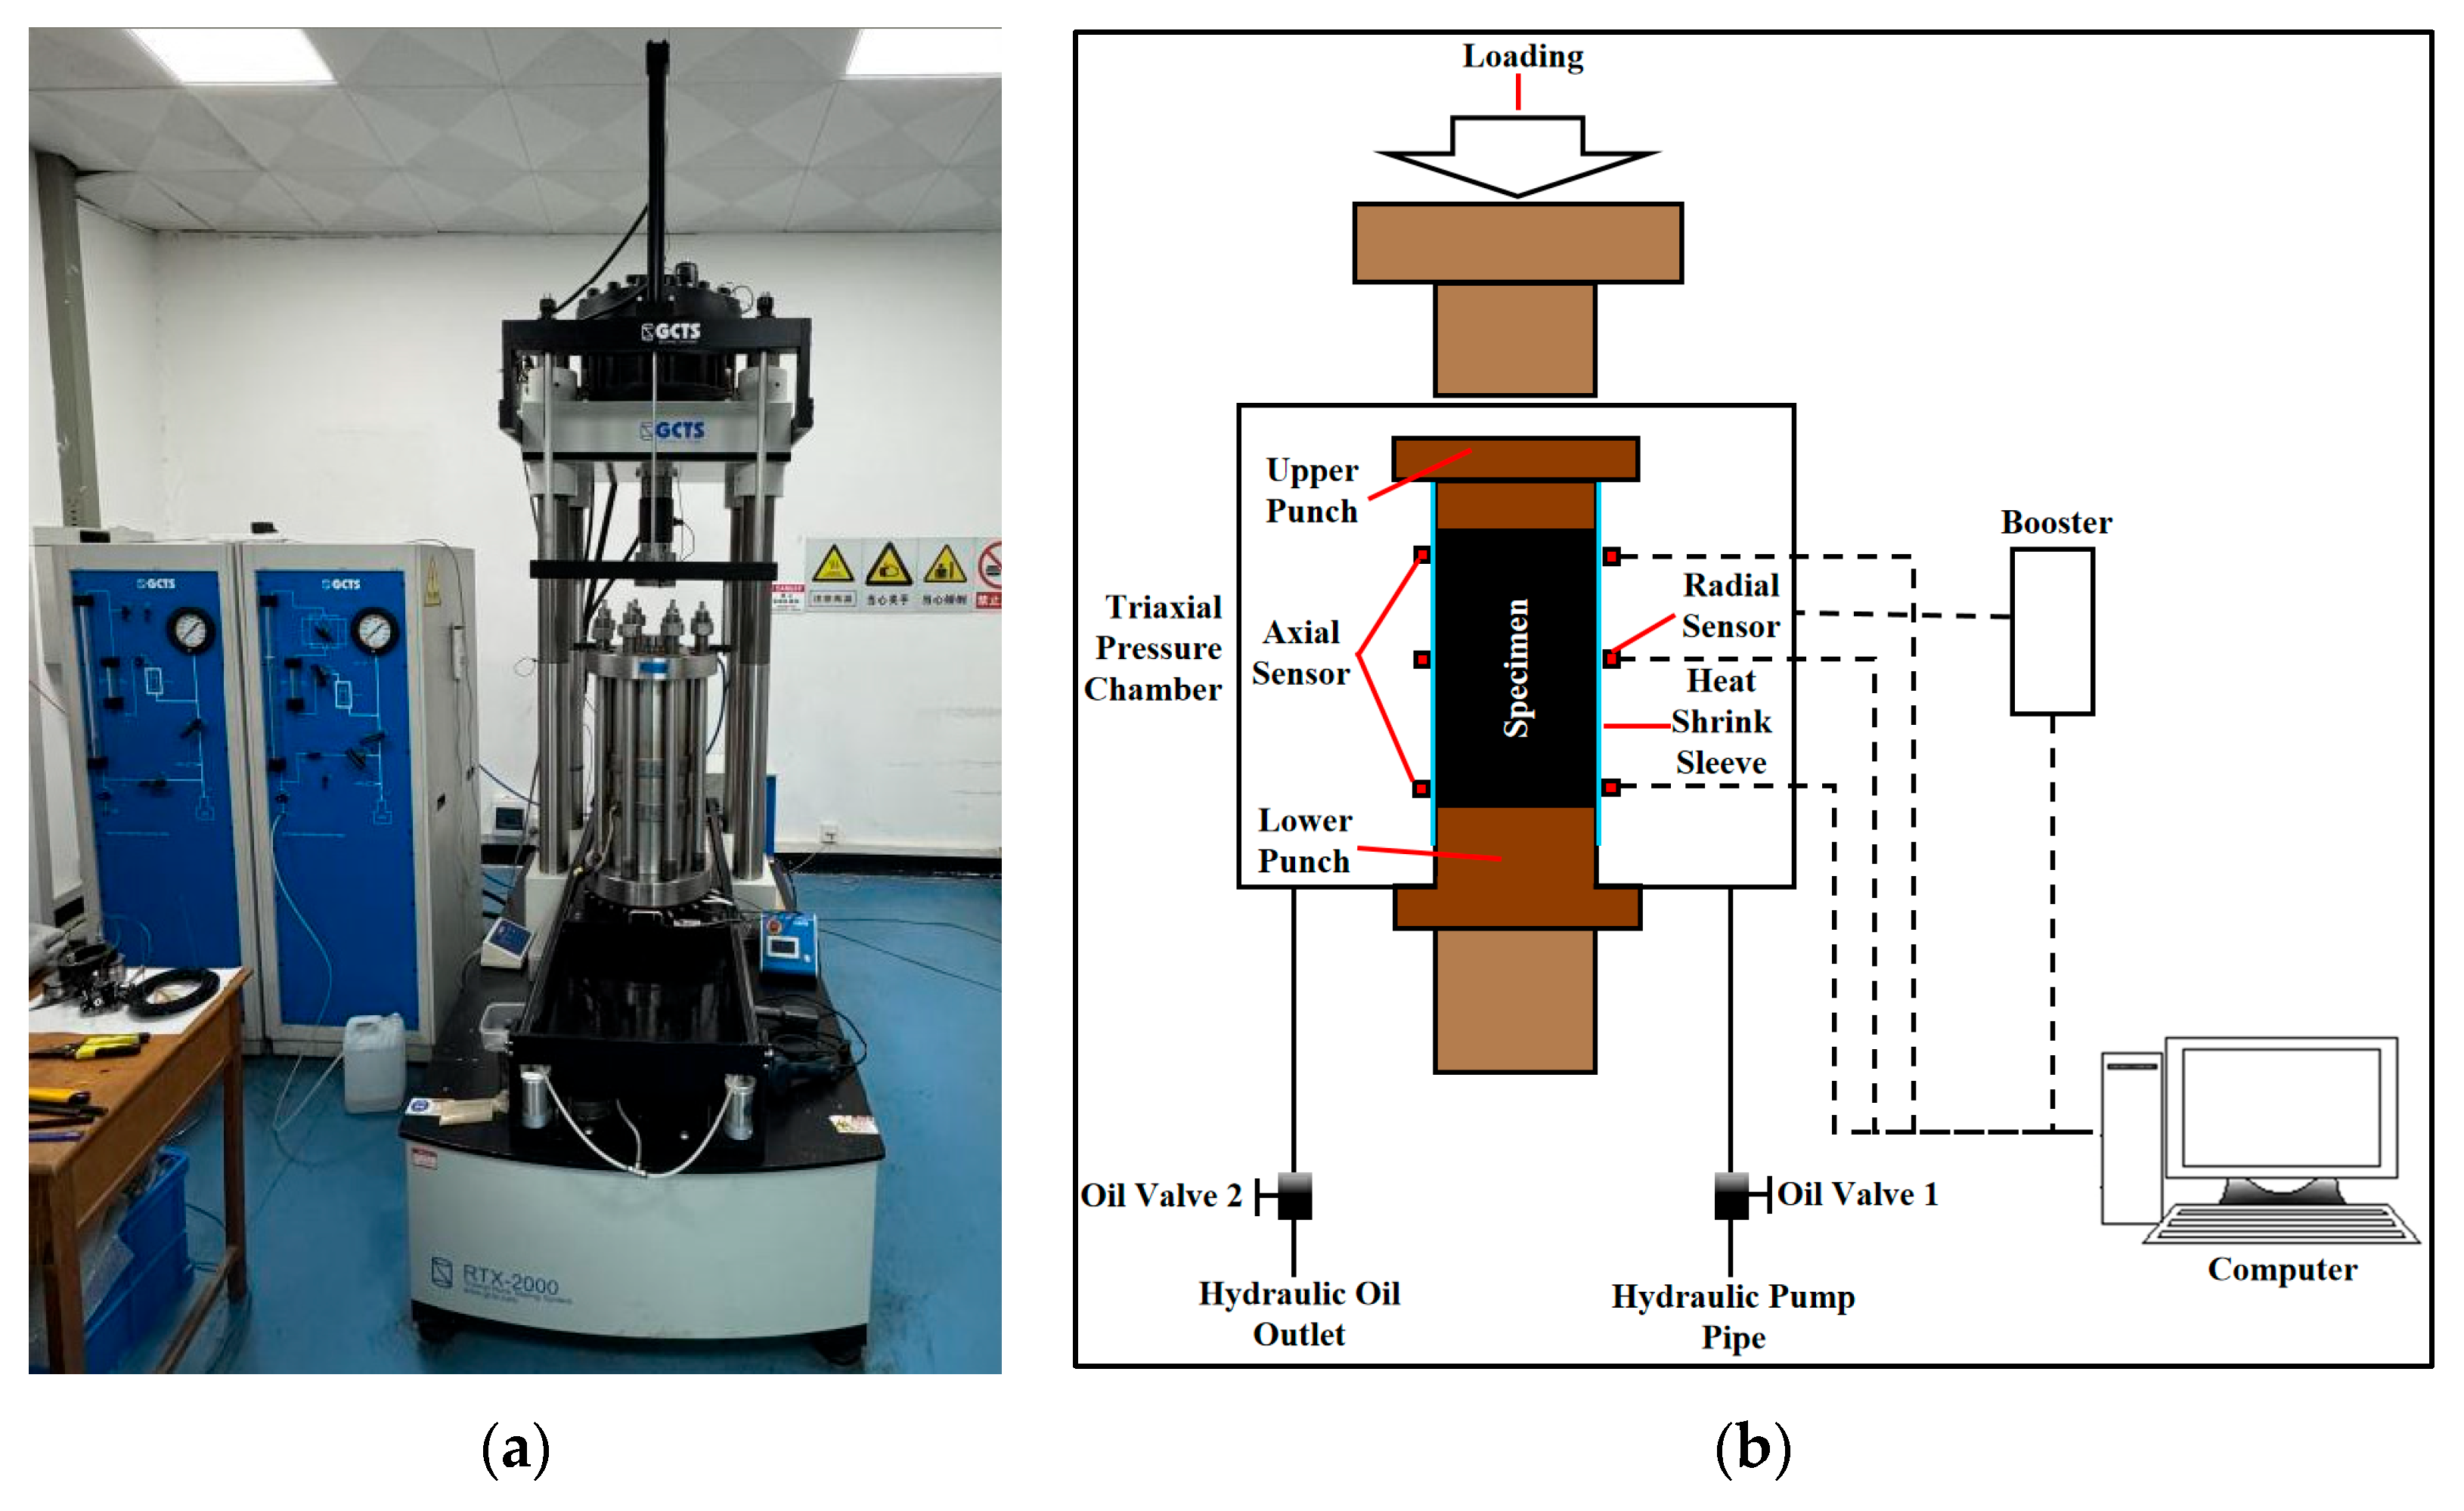
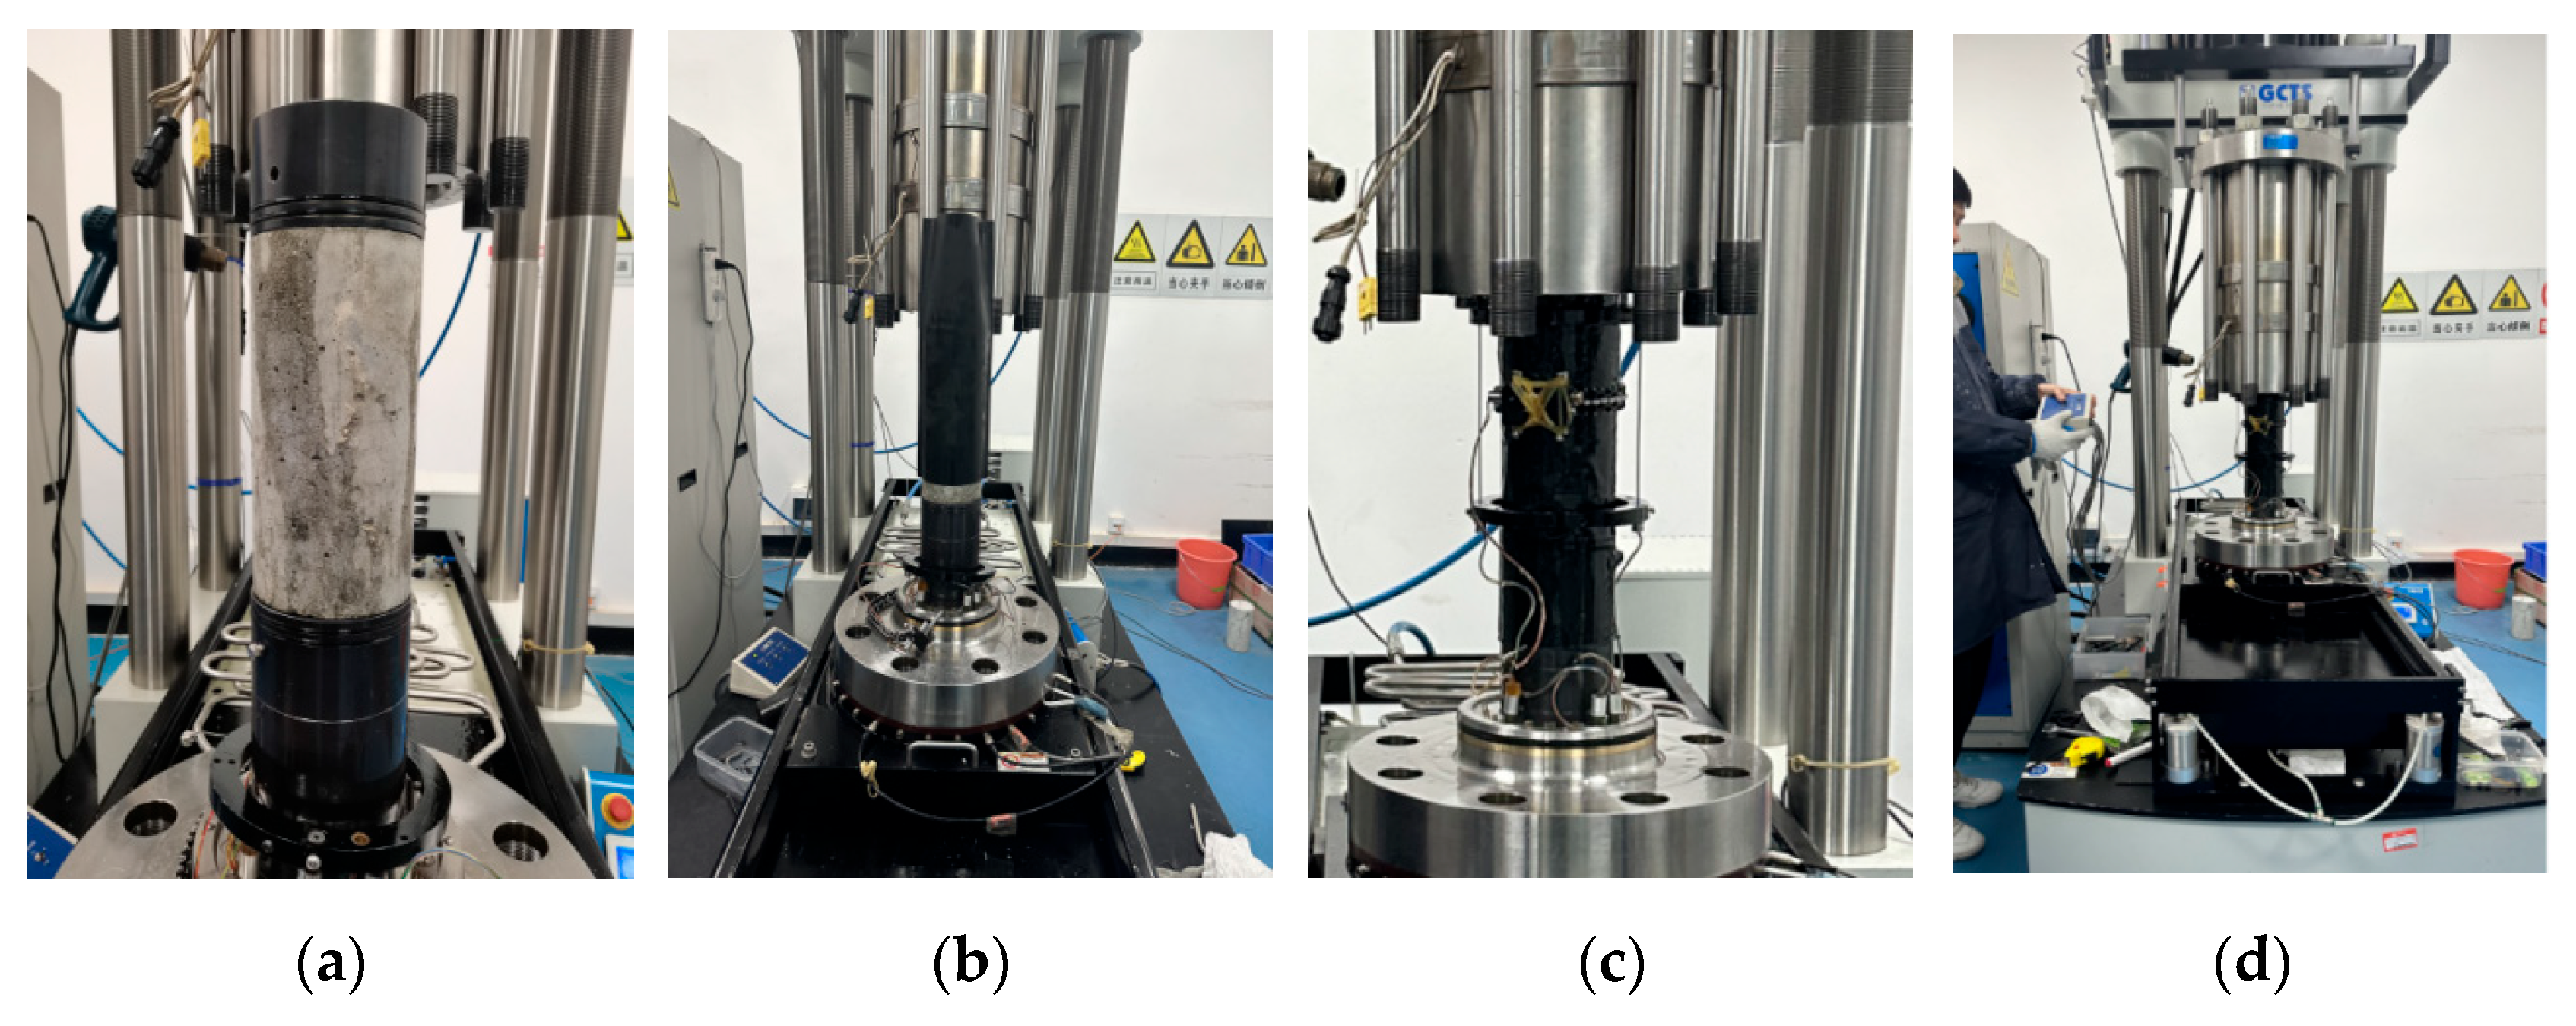
2.3. Test Device and Method

2.3.1. Triaxial Compression Test

The conventional triaxial compression full-process tests were conducted using the RTX-2000 kN high-temperature and high-pressure electrohydraulic servo rock triaxial instrument from the American GCTS company (San Jose, CA, USA) (Figure 4a), located in the Key Laboratory of Concrete Structure Safety and Durability of Shaanxi Province at Xijing University, the schematic diagram of the test setup is shown in Figure 4b. The testing procedure followed the ASTM D7012-14e1 standard [36], with the specific steps as follows: ① Equipment Calibration: First, the power supply of the equipment was connected, the oil-free silent air compressor and hydraulic station were started, and the computer controlling the instrument was turned on to check whether all indicators were normal. If any abnormality was detected, the equipment staff were contacted for adjustment. An emergency stop button for the instrument was located next to the computer controlling the instrument to prevent accidents. ② Specimen Preparation: The numbered specimens were prepared for installation, before which, the specimens were ground as flat as possible with smooth surfaces. Cement mortar on the upper and lower surfaces was wiped clean with a towel to avoid friction between the specimen and the loading head during the loading process, which could affect the test results. ③ Specimen Installation: The specimen with clean surfaces was placed on the base (Figure 5a), and a heat shrink tube was fitted over it. A heat gun was used to carefully shrink the tube, starting from the middle of the specimen, ensuring that the tube tightly adhered to the specimen surface (Figure 5b). ④ Sensor Installation: To improve the accuracy of displacement measurement, the total height of the spacer and specimen was divided into three parts using a ruler, with measurements of 74 mm, 157 mm, and 240 mm from the top of the upper spacer. This facilitated the installation of the sensors. Before fixing the axial sensor, a level was used to ensure that the axial sensor was on the same horizontal line. The circumferential sensor was then installed to maintain the same horizontal line (Figure 5c). After the sensors were installed, their parameters were adjusted, with the axial sensor set to approximately −2.400 mm and the circumferential sensor to approximately 5.700 mm. The base was raised, repositioned, and the pressure chamber was lowered (Figure 5d), taking care not to press the sensor wires, which could affect the test results. ⑤ The loading procedure was carried out considering the influence of rock mass confining pressure in triaxial mechanical tests and the relationship between confining pressure and rock burial depth, as shown in Equation (1), especially given that a dark matter laboratory has been constructed at a burial depth of 2400 m underground [2].
σ3 = k × ρ × g × H × 10−6
In the formula, σ3 represents the confining pressure, in units of MPa; k is the rock lateral pressure coefficient, which is generally less than 1 and is taken as 0.1–0.5 in this study; ρ is the average density of the overburden, taken as 2200 kg/m3 in this study; g is the acceleration due to gravity, taken as 9.8 m/s2; H is the burial depth of the rock, in units of m. The confining pressure range obtained is 5.3–26.4 MPa. Therefore, the confining pressures set for this test were 4.0 MPa, 8.0 MPa, 12 MPa, 16 MPa, and 20 MPa. The test parameters were input into the system, with a loading strain rate of 0.05 mm/min [37]. After that, a preloading of 1 MPa was applied, and the formal loading test was carried out after waiting for 5 min. If any problem occurred, the loading was restarted after the problem was solved until the specimen failed. ⑥ For specimen unloading, the confining pressure was first reduced to 0.1 MPa, and the distance of the loading ram was increased. To avoid affecting the next test, sufficient space was reserved to remove the RAM. The fixing screws, rods, sensors, and heat shrink tubes were removed, and the failed roller-compacted concrete specimen was taken out. The residual debris on the testing equipment was cleaned, and the equipment was placed in an open area.

2.3.2. Scanning Electron Microscope Test

The SEM testing was conducted using the organic polymer optoelectronic materials key laboratory at Xijing University’s JEOL-JSM-IT800 thermal field emission scanning electron microscope from Japan (JEOL Ltd., Tokyo, Japan) (Figure 6). During the test, the prepared samples were first adhered to the sample stage using conductive adhesive, ensuring that the analysis surface was parallel to the surface of the sample stage. Then, the samples were sputtered with gold using a JEC-300FC (JEOL Ltd., Tokyo, Japan) ion sputtering device (Figure 7). After that, the sample chamber was opened to load the samples and then closed for vacuum extraction. Once the vacuum extraction was completed, the position of the stage was manually adjusted using the stage lift lever to locate the target area on the surface to be tested. The contrast and brightness of the image were then adjusted, and the image was captured and saved. The samples were tested by the experimental steps.

3. Analysis of Mechanical Properties

The triaxial compression tests yielded the conventional triaxial compression deviatoric stress–strain full-process curves for representative limestone crushed stone concrete under different confining pressures (Figure 8), where ε 1 , ε 3 ,   a n d   ε v represent the axial, radial, and volumetric strains, respectively, and σ 3 is the confining pressure. The test data are organized in Table 2, where H is the height, D is the diameter, σ 1 m is the axial peak stress, ε 1 m is the axial strain, ε 3 m is the radial strain, ε v m is the volumetric strain, and E is the elastic modulus.

3.1. Analysis of Deformation Characteristics

To clearly illustrate the influence mechanism of confining pressure on the deformation characteristics of limestone crushed stone concrete, the conventional triaxial compression curves of limestone crushed stone concrete under the six confining pressures given in Figure 8 are plotted in the same coordinate system (Figure 9) for comparative analysis.

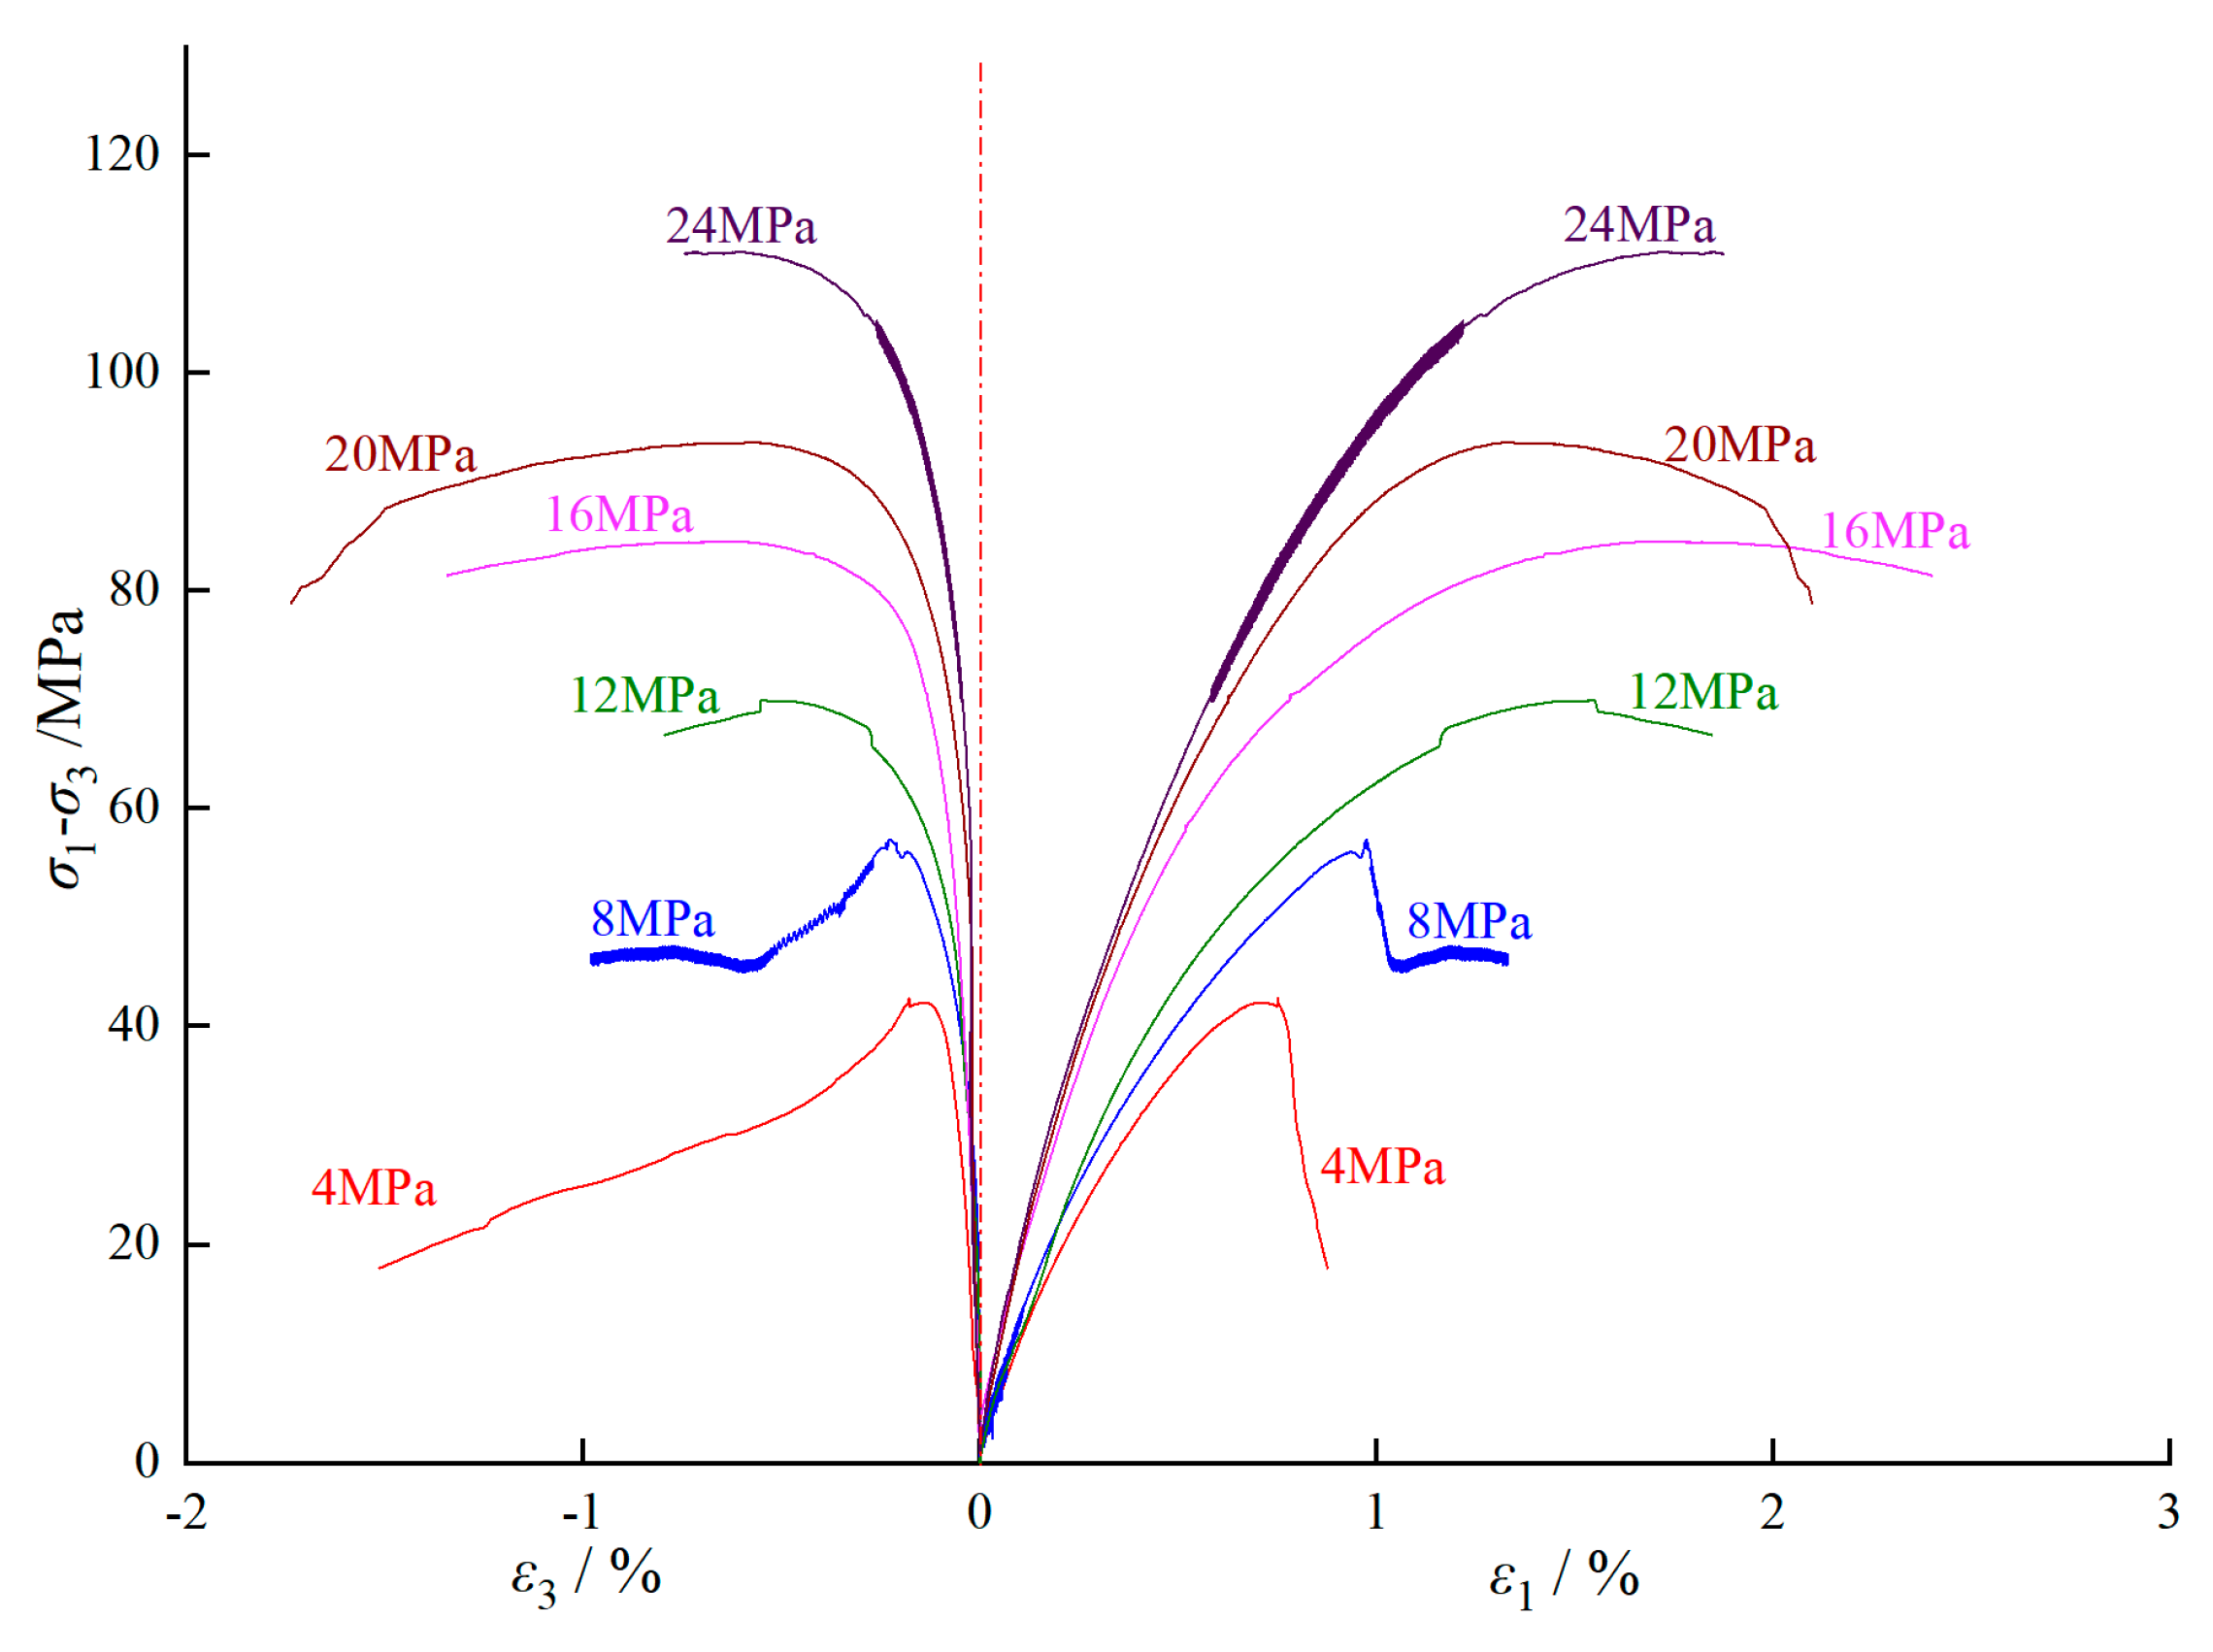
3.1.1. Characteristic Analysis of Deviatoric Stress–Strain Curve

An analysis of the deviatoric stress–strain curve shapes of limestone crushed stone concrete under different confining pressures shown in Figure 9 reveals that: ① Under triaxial conditions, as the confining pressure increases, it becomes difficult to distinguish between the compaction stage and the elastic stage. The stages that can be identified are mainly the elastic, yielding, failure, and post-failure plastic stages. It is evident that the confining pressure has a significant compaction effect on limestone crushed stone concrete, and the initial compaction stage is essentially completed during the application of the confining pressure. ② The deviatoric stress–strain curves of limestone crushed stone concrete gradually transition from strain softening at low confining pressures to strain plasticity at high confining pressures. When the confining pressure is between 4 MPa and 8 MPa, the deviatoric stress–strain curves of the specimens show a steep decline after the peak point. When the confining pressure is between 12 MPa and 20 MPa, the peak point of the deviatoric stress–strain curves begins to blur, and the decline after the peak point becomes more gradual. When the confining pressure is 24 MPa, the deviatoric stress–strain curve of limestone crushed stone concrete no longer shows a significant decline, indicating plastic flow shear failure. As the confining pressure increases, the plastic deformation capacity of limestone crushed stone concrete is enhanced. ③ Restricted by the confining pressure, the peak of the deviatoric stress–strain curve of limestone concrete gradually shifts towards the upper right corner, and the failure process of the specimen becomes slower.

3.1.2. Relationship Between Confining Pressure and Axial Peak Strain

Figure 10 illustrates the relationship between different confining pressures and the axial peak strain of limestone crushed stone concrete. From Figure 10, it can be observed that with the gradual increase in confining pressure, the axial peak strain shows an overall upward trend. The axial peak strain increases from 0.71% to 1.73%, an increase of 143.66%. This is mainly because the confining pressure restricts the lateral deformation of the specimen, thereby alleviating the stress concentration within the crushed stone concrete and slowing down the development of cracks, which in turn enhances the compressive strength of the specimen. In addition, as the confining pressure increases, the negative impact on weak areas, such as the connection between aggregate and concrete, gradually decreases, enabling the strength of the entire limestone crushed stone concrete to be continuously improved. Further fitting of the test results yields the relationship function between confining pressure and axial peak strain as: y= − 0.0034x2 + 0.1429x + 0.171, with R2 = 0.825.

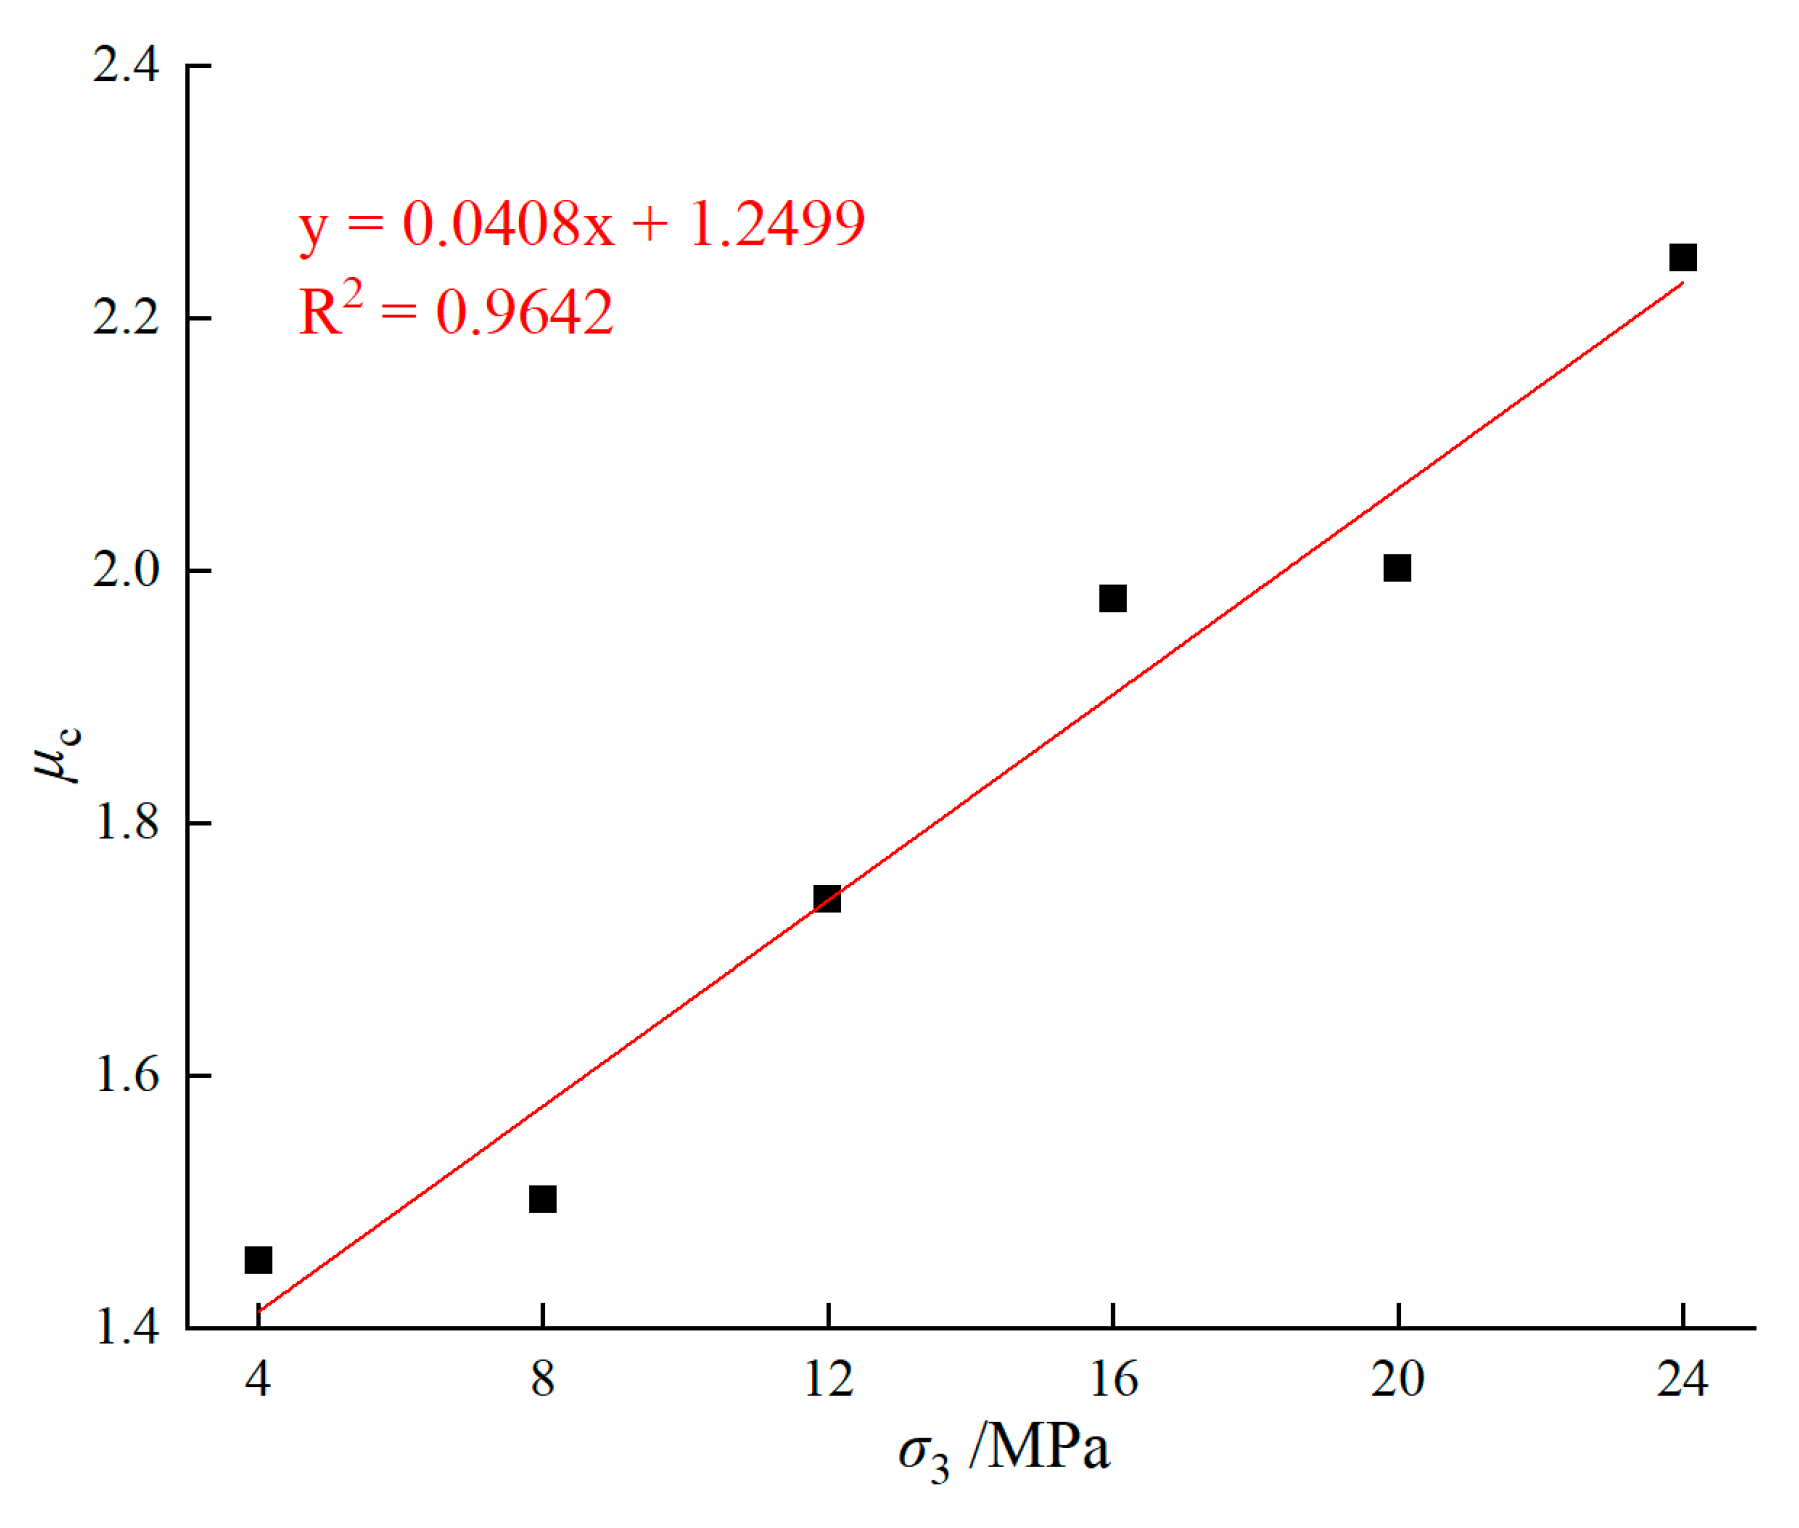
3.1.3. Relationship Between Confining Pressure and Ductility Coefficient

Ductility is one of the important indicators for judging the deformation capacity of materials [38]. In this paper, the ductility coefficient u c is used to represent the deformation capacity of crushed stone concrete. See Equation (2) for the expression:
u c = u u u y  
In the formula, u y represents the yield strain, which is taken as 70% of the peak strain; u u represents the failure strain of the specimen (the strain value when the peak stress decreases to 85%) or the strain value at the end of loading.
Figure 11 presents the relationship between the ductility coefficient of the specimens and the confining pressure. As shown in Figure 11, the ductility coefficient of limestone crushed stone concrete increases with the increase in confining pressure. Specifically, when the confining pressure is 4, 8, 12, 16, 20, and 24 MPa, the ductility coefficients are 1.454, 1.502, 1.740, 1.978, 2.002, and 2.248, respectively. The ductility coefficient increases from 1.454 to 2.248, which is an increase of 54.61%. When the confining pressure is 24 MPa, the ductility coefficient reaches its maximum value, which is 1.546 times that at 4 MPa. This indicates that the lateral confining force significantly improves its ductility and enables it to exhibit good deformation performance. The regression equation is y = 0.0408x + 1.2499, with R2 = 0.9642.

3.1.4. Relationship Between Confining Pressure and Elastic Modulus

Figure 12 shows the relationship between the confining pressure and the elastic modulus. As can be seen in the figure, the elastic modulus of limestone crushed stone concrete increases with the increase of confining pressure (the elastic modulus E at σ3 = 24 MPa is 133.98% higher than that at σ3 = 4 MPa). The reason for this is analyzed as follows: The lateral confining force can restrict the lateral deformation of limestone crushed stone concrete, thereby significantly enhancing its axial resistance to deformation and effectively limiting the expansion and propagation of cracks in weak areas, which in turn improves the compressive strength and toughness of limestone crushed stone concrete. Further fitting of the test results yields the relationship function between elastic modulus and confining pressure as: y= 0.4781x + 3.7853, with R2 = 0.9819.

3.1.5. Volumetric Strain

Figure 13 shows the deviatoric stress–volumetric strain curves of limestone crushed stone concrete under different confining pressures, where the formula determines the volumetric strain εv = ε1 + 2ε2 [39]. As shown in Figure 13, the volumetric peak strain of limestone crushed stone concrete under triaxial stress conditions has the following characteristics: ① Under confining pressure, the volumetric strain of the specimen exhibits linear elastic behavior before reaching the peak stress. At this stage, microcracks within the material have not yet extensively propagated and interconnected, and the deformation is primarily elastic. The volumetric peak strain increases linearly with the increase in load. ② As the specimen approaches peak stress, the volumetric strain curve begins to bend to the left, indicating the onset of dilatancy (volumetric expansion). This is due to the extensive propagation and interconnection of microcracks near the peak stress, leading to macroscopic volumetric expansion. This marks the transition from elastic to plastic deformation. ③ When the confining pressure is relatively low (≤8 MPa), cracks easily propagate and interconnect, and the dilatancy phenomenon occurs close to the peak point. In contrast, when the confining pressure is higher (>8 MPa), crack propagation is inhibited, and the dilatancy phenomenon occurs later, with the inflection point shifting to the left. ④ Before the inflection point, the volumetric strain is dominated by compression. After the inflection point, the non-principal compressive strain increases sharply, and the volumetric strain becomes dominated by tension, exhibiting an expansion state. This is consistent with the transition from compression to dilatancy under triaxial loading.

3.2. Analysis of Damage and Strength Characteristics of Limestone Crushed Stone Concrete

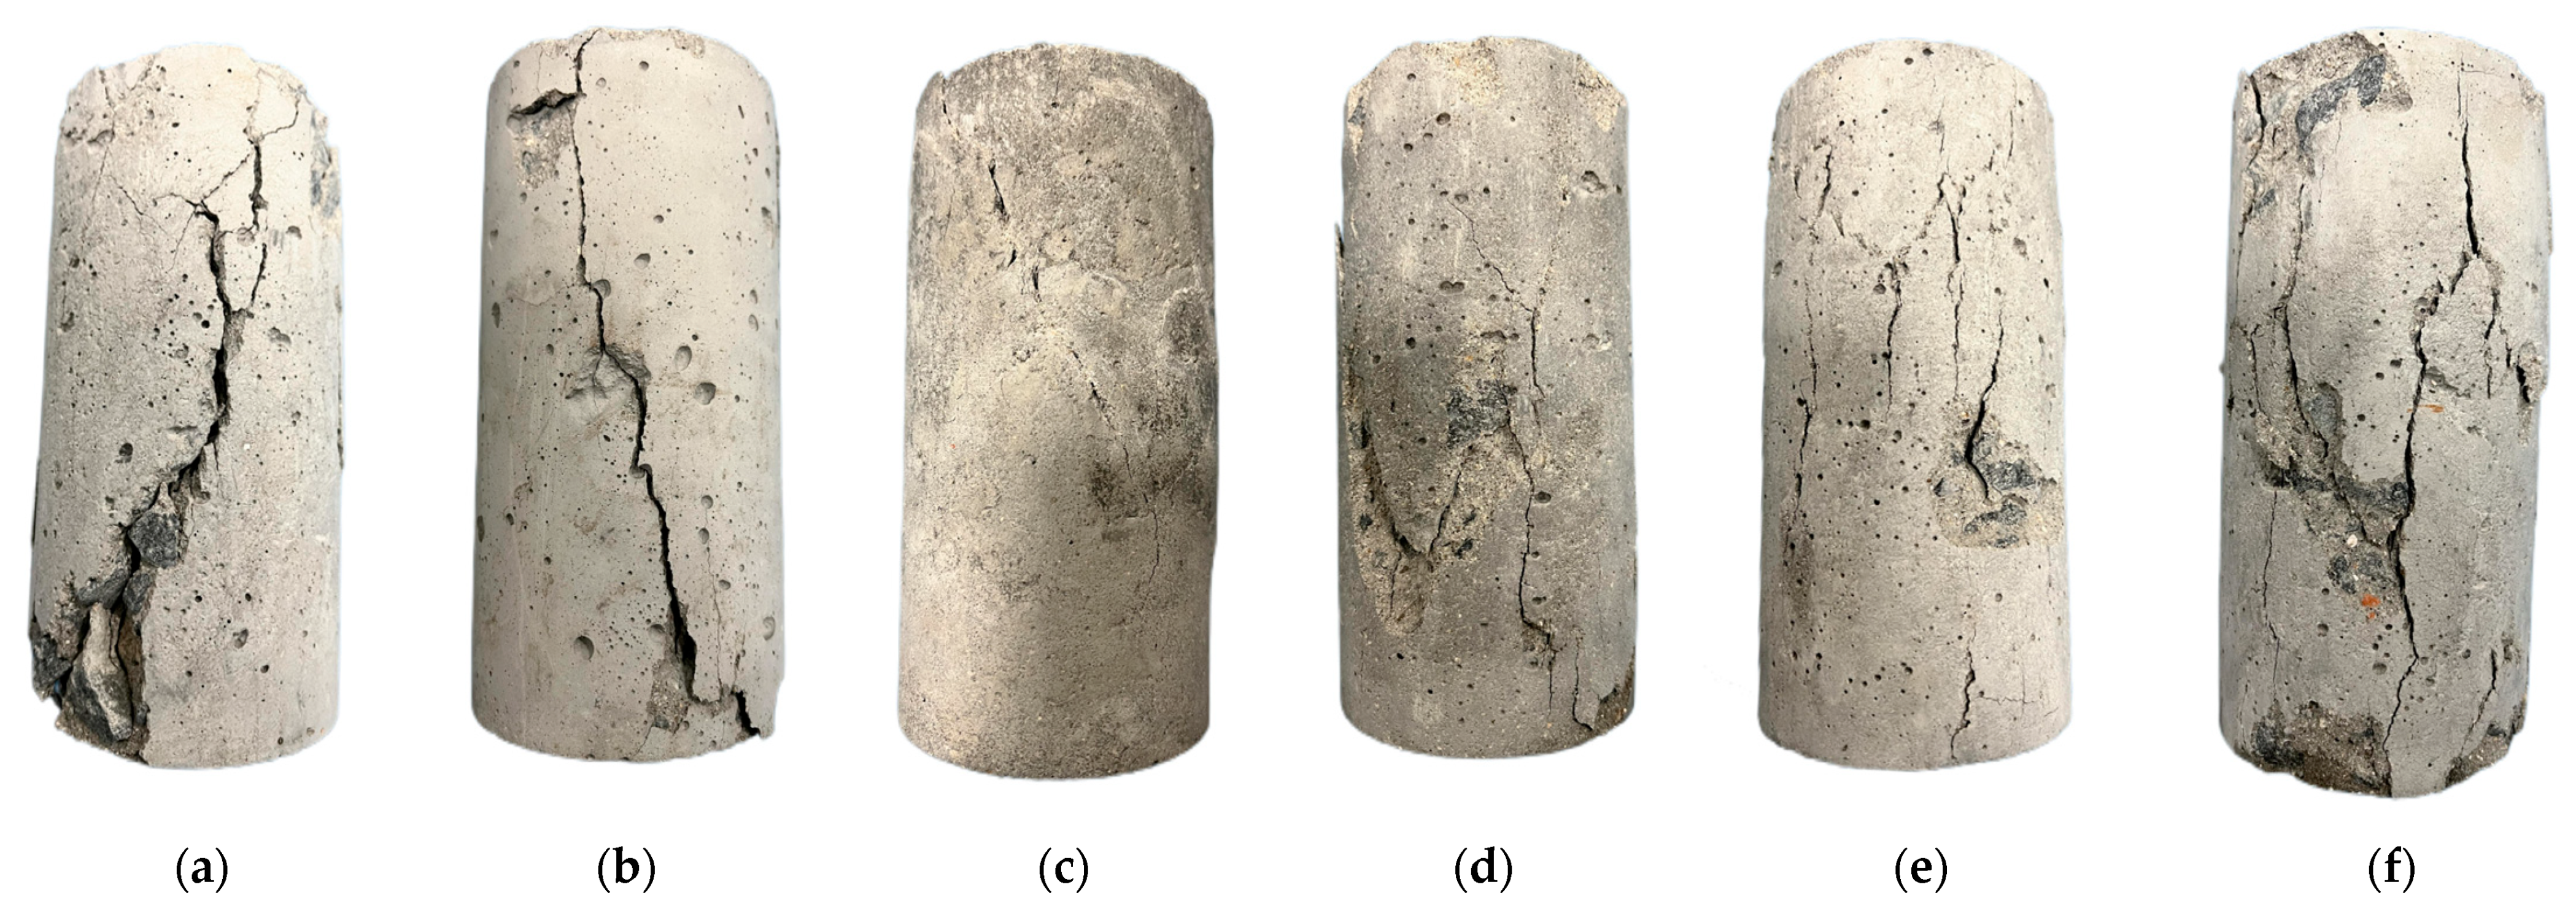
3.2.1. Damage Characteristics

In the triaxial compression tests, the top and bottom surfaces of the specimens are subject to frictional constraints from the upper and lower bases, which significantly restrict the lateral deformation and failure behavior of these surfaces. As a result, the failure characteristics are not prominent, and almost no failure occurs. The sides of the specimens are subjected to the confining pressure, but the constraining effect is relatively small. Therefore, the propagation of side cracks is more pronounced. Thus, this study focuses on analyzing the side failure to clearly demonstrate the main fracture characteristics of the specimens.
The failure modes of limestone crushed stone concrete specimens vary significantly under different confining pressures. Figure 14 shows the failure modes of limestone crushed stone concrete specimens under different confining pressures. The failure characteristics exhibit distinct stages with the increase of confining pressure. Specifically: ① When the confining pressure is between 4 MPa and 12 MPa, the failure mode is primarily diagonal shear failure, with the crack angle to the horizontal plane ranging from 45° to 70°. As the confining pressure increases, this angle gradually increases while the crack width decreases. At 12 MPa in particular, a slight bulging appears in the middle of the specimen, but the cracks do not fully penetrate. ② When the confining pressure is further increased from 16 MPa to 24 MPa, the failure mode changes to a crushing flow failure. At this stage, multiple intersecting cracks appeared in the middle of the specimen, forming a spiderweb-like pattern. As the confining pressure increases, this crack pattern becomes more pronounced. Meanwhile, the mortar layer surrounding the coarse aggregate is significantly stripped off, and the internal material of the specimen exhibits plastic flow characteristics. The middle part of the specimen bulges significantly, and the crack width increases. This indicates that under high confining pressure, the lateral confining pressure effectively suppresses crack development, maintains the integrity of the specimen, and promotes plastic deformation of the material, resulting in a reduction in specimen height and an increase in volume. Overall, the confining pressure plays a key role in inhibiting crack development, preventing aggregate debonding, enhancing the bond strength of the aggregate-mortar interface, and improving the overall strength and ductility of the material.

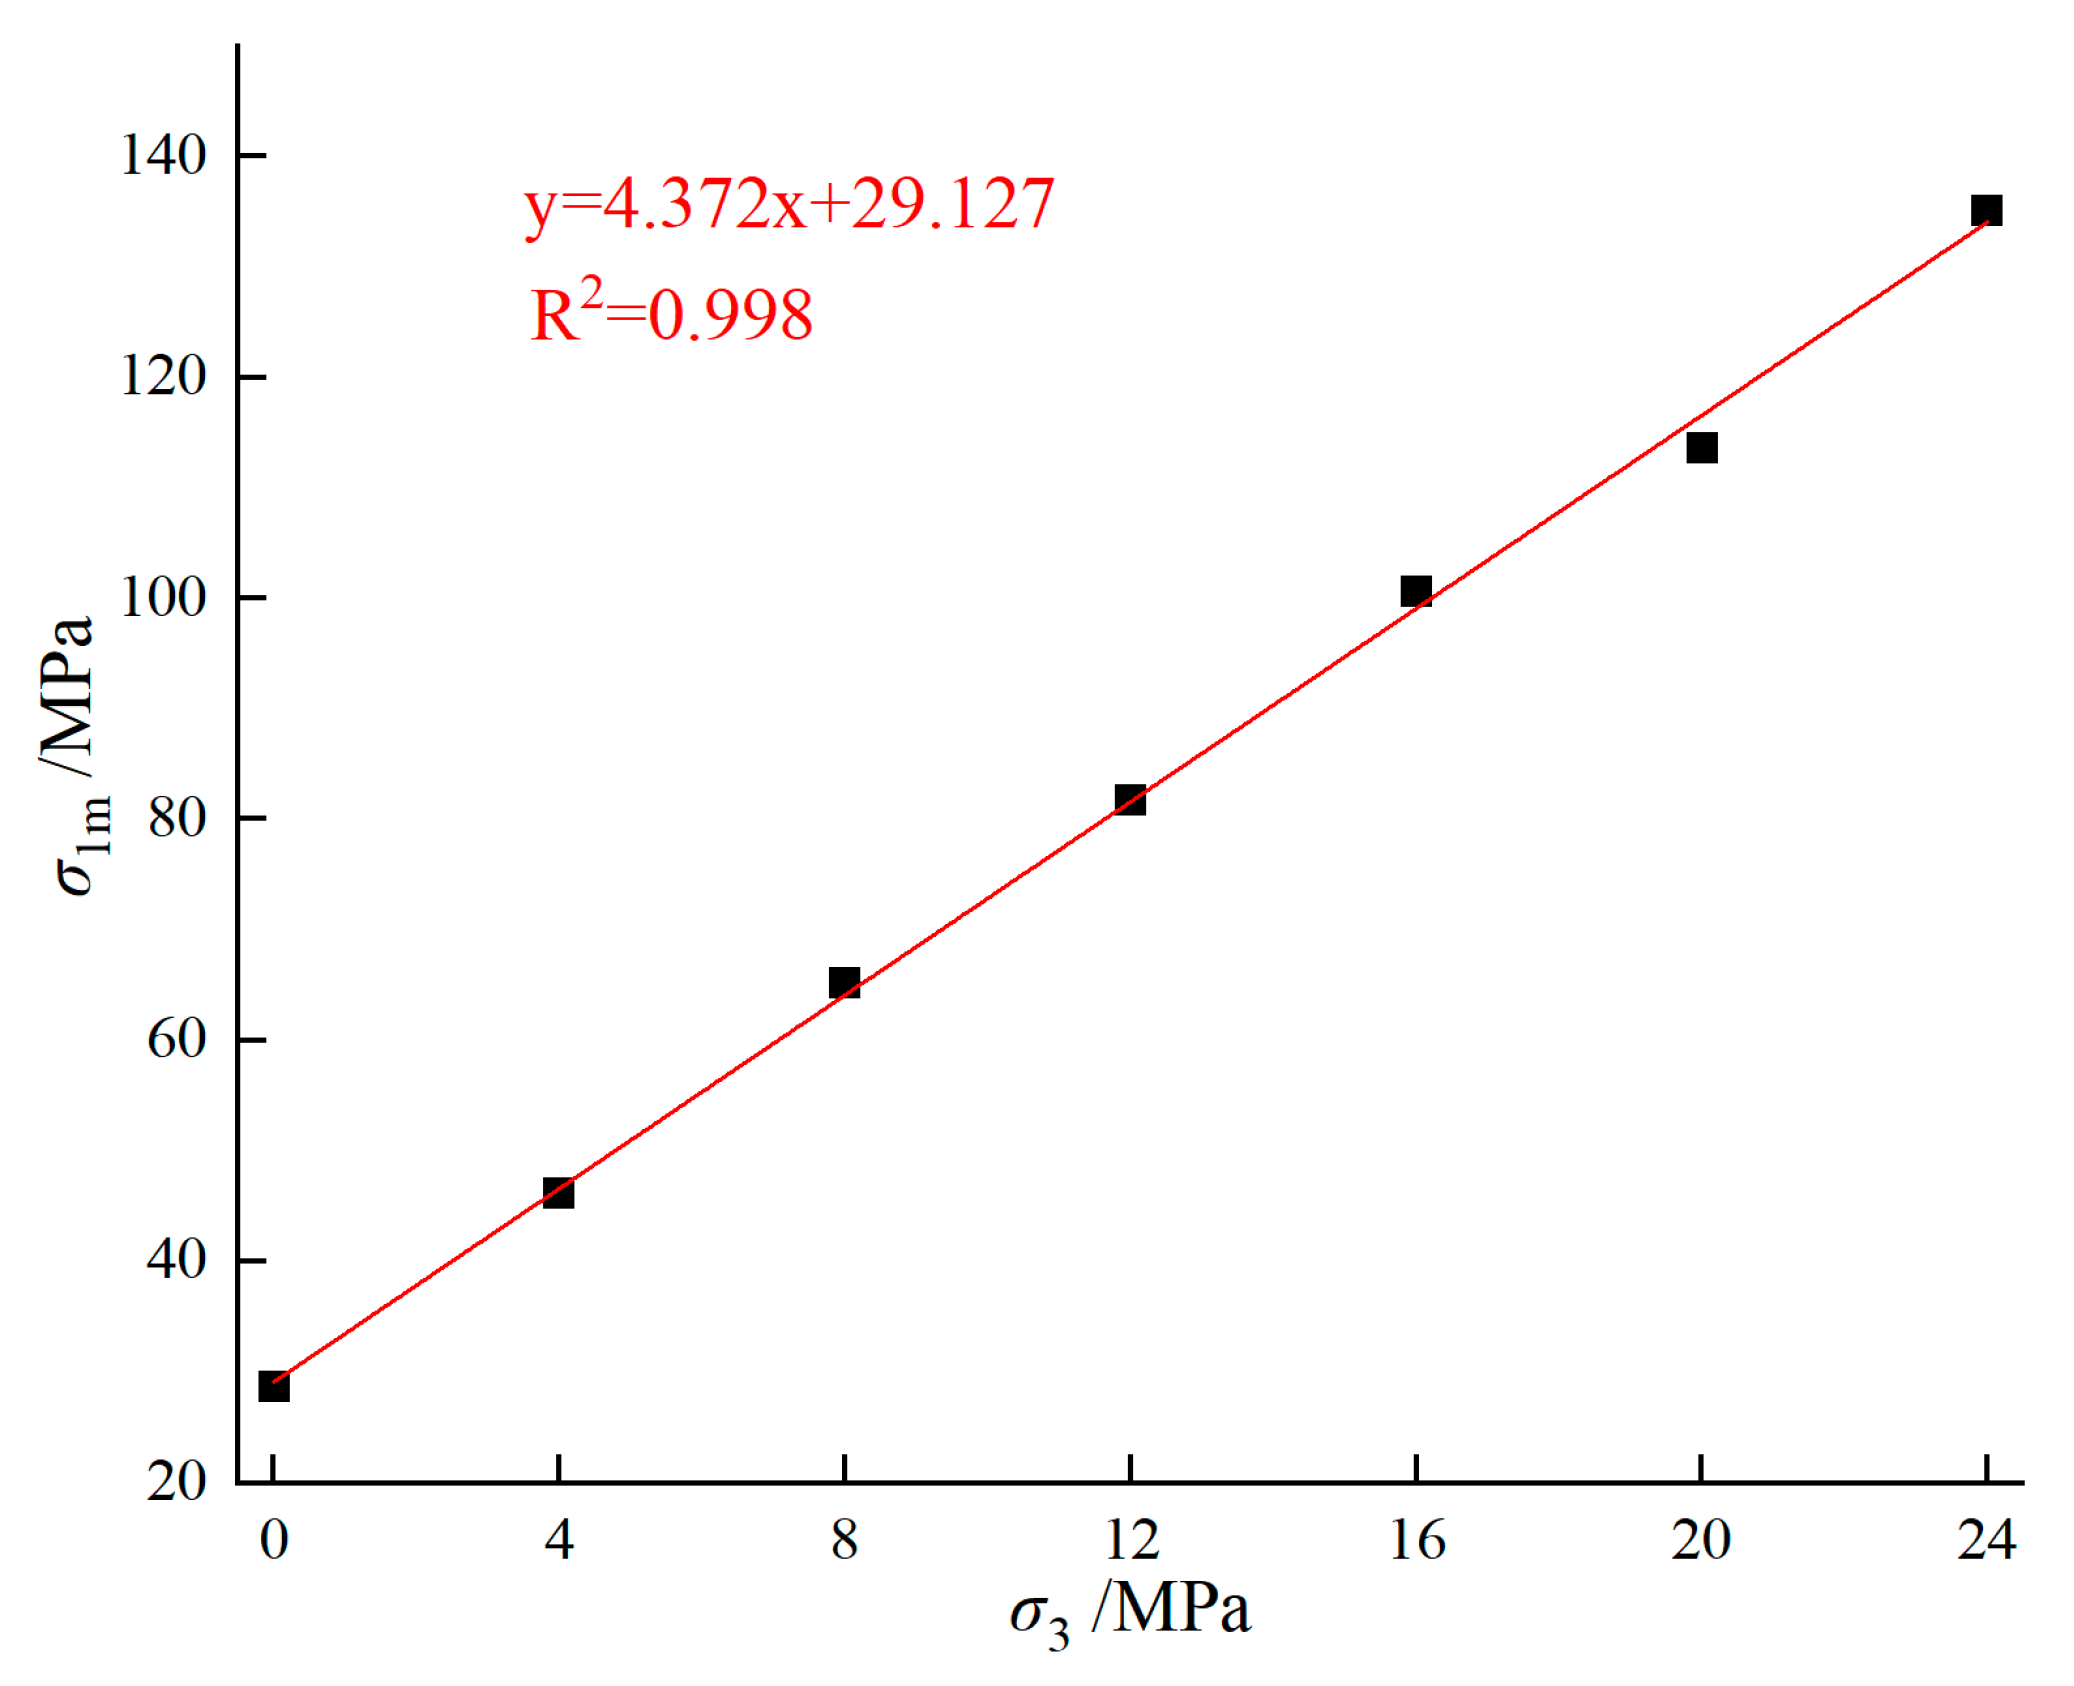
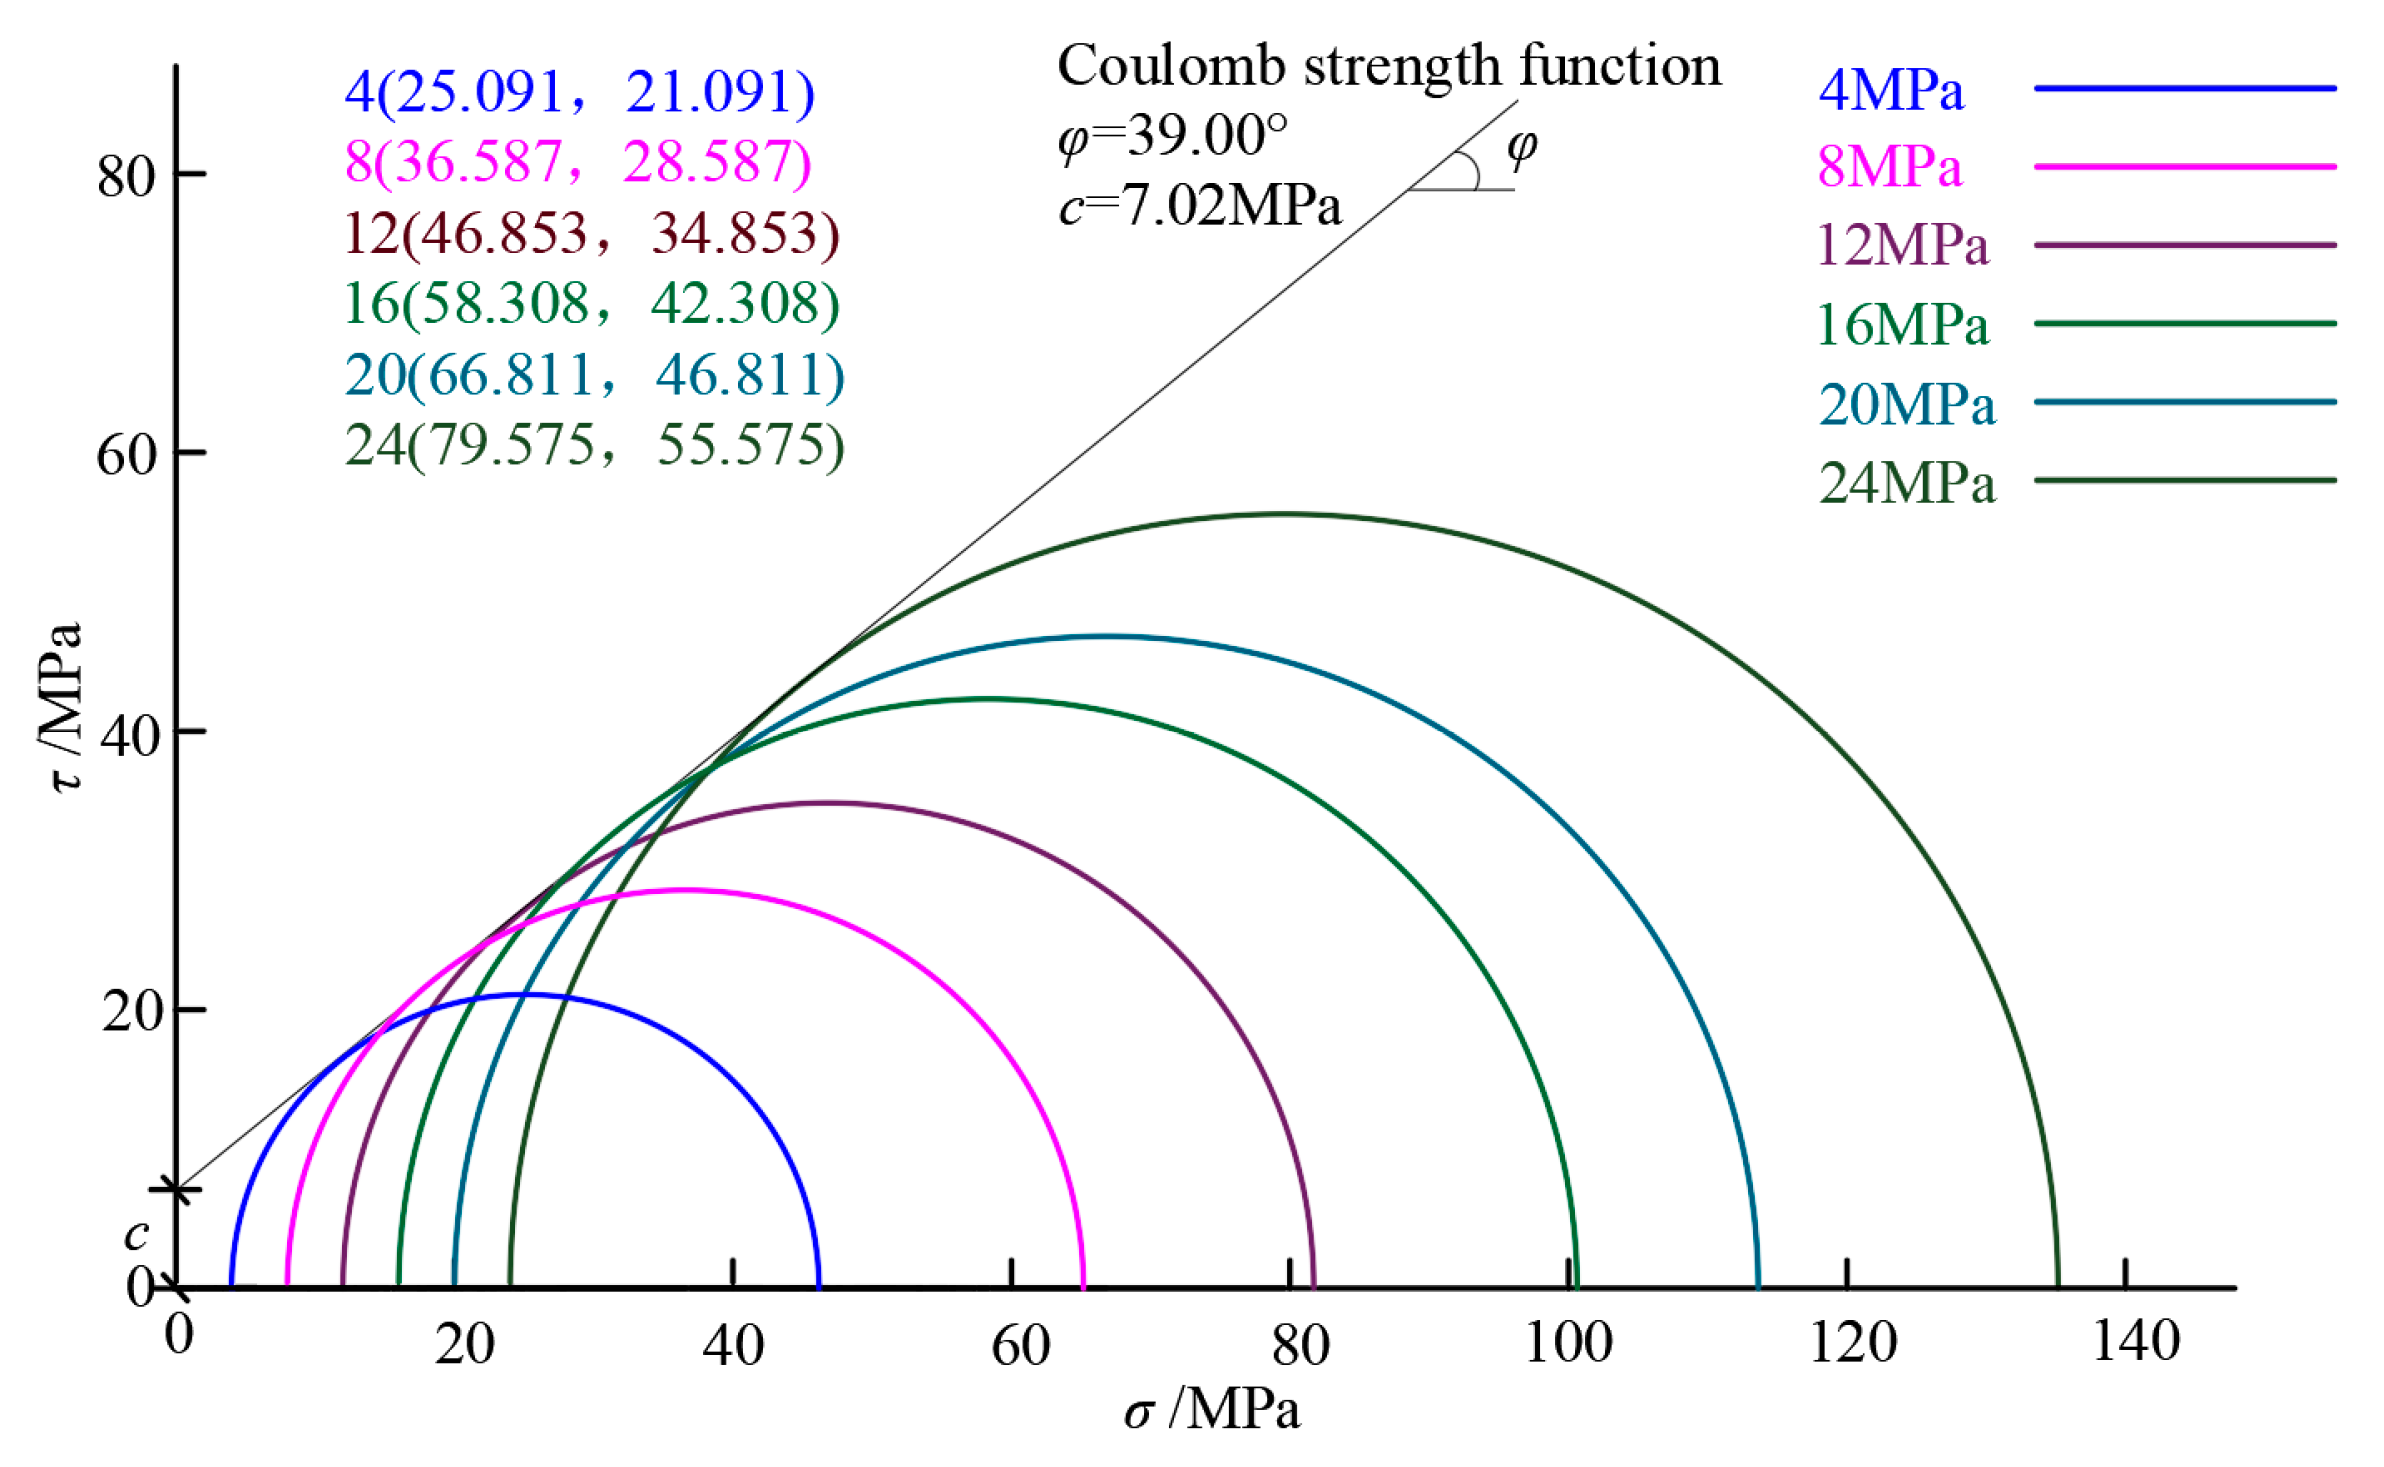
3.2.2. Analysis of Strength Characteristics of Limestone Crushed Stone Concrete

In this study, the Mohr–Coulomb (M-C) strength criterion was selected to analyze the mechanical properties of limestone crushed stone concrete, primarily due to its simplicity and practicality. The key parameters of the M-C criterion, namely cohesion (c) and internal friction angle (φ), can be directly determined using conventional triaxial compression tests. This approach is computationally straightforward and yields stable results, effectively avoiding the errors and uncertainties associated with more complex testing procedures. In contrast, the Willam–Warnke model, although capable of more precisely describing the failure behavior of materials, requires a greater number of complex parameters, such as shape factors and stress ratio parameters. Determining these parameters typically relies on extensive experimental data and empirical fitting, which increases the complexity and uncertainty of the testing process. Therefore, considering the requirement of this study to calculate only the values of c and φ, the M-C criterion not only meets the accuracy requirements but also significantly improves research efficiency, making it a more rational choice.
According to the Mohr–Coulomb strength criterion, the shear strength can be determined by cohesion and internal friction [40] and is expressed as
τ m = c + σ tan φ
In Equation (3), φ represents the angle of internal friction, and σ is the normal stress on the shear failure plane. When expressed in terms of principal stresses, the Coulomb strength criterion [41] becomes
σ 1 = b + k σ 3  
Equation (4) characterizes the linear relationship between the maximum principal stress σ 1 and the minimum principal stress σ 3 for a given specimen. Here, k represents the coefficient of the influence of confining pressure on axial bearing capacity, and b is the strength corresponding to complete shear failure of the specimen under uniaxial compression.
Further, by plotting the stress state of the limestone crushed stone concrete under triaxial compression failure on the τσ plane coordinate diagram, the Mohr stress circle can be obtained. Based on the Mohr stress circle, the relationship between the cohesion c and the angle of internal friction φ can be expressed as
σ 1 = 2 c cos φ 1 sin φ + 1 + sin φ 1 sin φ σ 3  
The expressions for k and b can be obtained by converting Equation (5):
b = 2 c cos φ 1 sin φ k = 1 + sin φ 1 sin φ  
From Equation (6), it can be concluded that
φ = a r c sin k 1 k + 1 c = b 1 sin φ 2 cos φ  
Based on the test results in Table 2, with σ 1 m and σ 3 as the vertical and horizontal coordinates, respectively, the relationship between σ 1 m and σ 3 for the limestone crushed stone concrete specimens was analyzed using Equation (4). The fitting results are shown in Figure 15. From Figure 15, the fitting equation for the limestone crushed stone concrete specimens is y = 4.372x + 29.127, where b = 29.127 and k = 4.372, with R2 = 0.988. This indicates that the Mohr–Coulomb criterion can accurately describe the triaxial failure characteristics of this concrete. Substituting the fitted values of b and k into Equation (7), the cohesion c of the limestone crushed stone concrete specimen is determined to be 6.96 MPa, and the friction angle φ is 38.89°.
It can also be observed that the peak strength increases linearly with the confining pressure. The peak strength at σ 3   = 24 MPa is 192.66% higher than that at σ 3   = 4 MPa. The reason for this is analyzed as follows: when the confining pressure is low, the specimen’s weak areas are prone to crack development due to the premature failure of the bond interface. As the confining pressure increases, its effect on the bond interface increases, reducing the difference between the bond interface and the stressed area of the specimen, thereby improving the compressive strength. When the confining pressure is relatively high, applying confining pressure to the specimen inhibits the formation and development of microcracks, allowing the mechanical properties between the aggregates to function better, thus affecting the strength of the crushed stone concrete. Additionally, the irregular shape of the crushed stones leads to easier crack connections between adjacent crushed stones on the bond surface.
At the same time, based on the triaxial test results of limestone crushed stone concrete, the normal and shear stresses on the shear plane can be used as the horizontal and vertical coordinates, respectively. In this study, only the maximum principal stress (σ1) and the minimum principal stress (σ3) were used to draw the Mohr stress circles. The specific steps are as follows: Mark σ1 and σ3 on the horizontal axis, use ((σ1 + σ3)/2, 0) as the center of the circle, and use (σ1σ3)/2 as the radius to draw the Mohr stress circles of water-bearing sandstone with initial σ3 values of 4 MPa, 8 MPa, 12 MPa, 16 MPa, 20 MPa, and 24 MPa. Then, draw the Coulomb strength curve, which is a straight line envelope, representing the relationship between the shear stress and normal stress of limestone crushed stone concrete at critical failure. The angle between this line and the σ axis is φ, and the intercept on the τ axis is c, thus obtaining the triaxial compressive shear strength parameters c and φ of limestone crushed stone concrete, as shown in Figure 16; the triaxial compressive shear strength parameters c and φ of the concrete are 7.02 MPa and 39.00°, respectively.
There is a certain error in the strength parameters c and φ of sandstone with different water contents calculated by the two methods. Both methods are based on the relationship between shear and normal stresses on the shear plane and the axial and confining pressures. The strength parameters obtained by the two methods should essentially be consistent. The deviation mainly results from the differences in data processing between the two methods. When processing the data, it is advisable to take the average value of the two [42], that is, the c and φ values are 6.99 MPa and 38.95°, respectively.
Furthermore, according to the Coulomb strength criterion [40], the formula for the fracture angle is as follows:
α = 45 ° φ 2  
The fracture angle of the limestone crushed stone concrete obtained is 25.53°.

4. Research on Microstructural Damage Mechanism

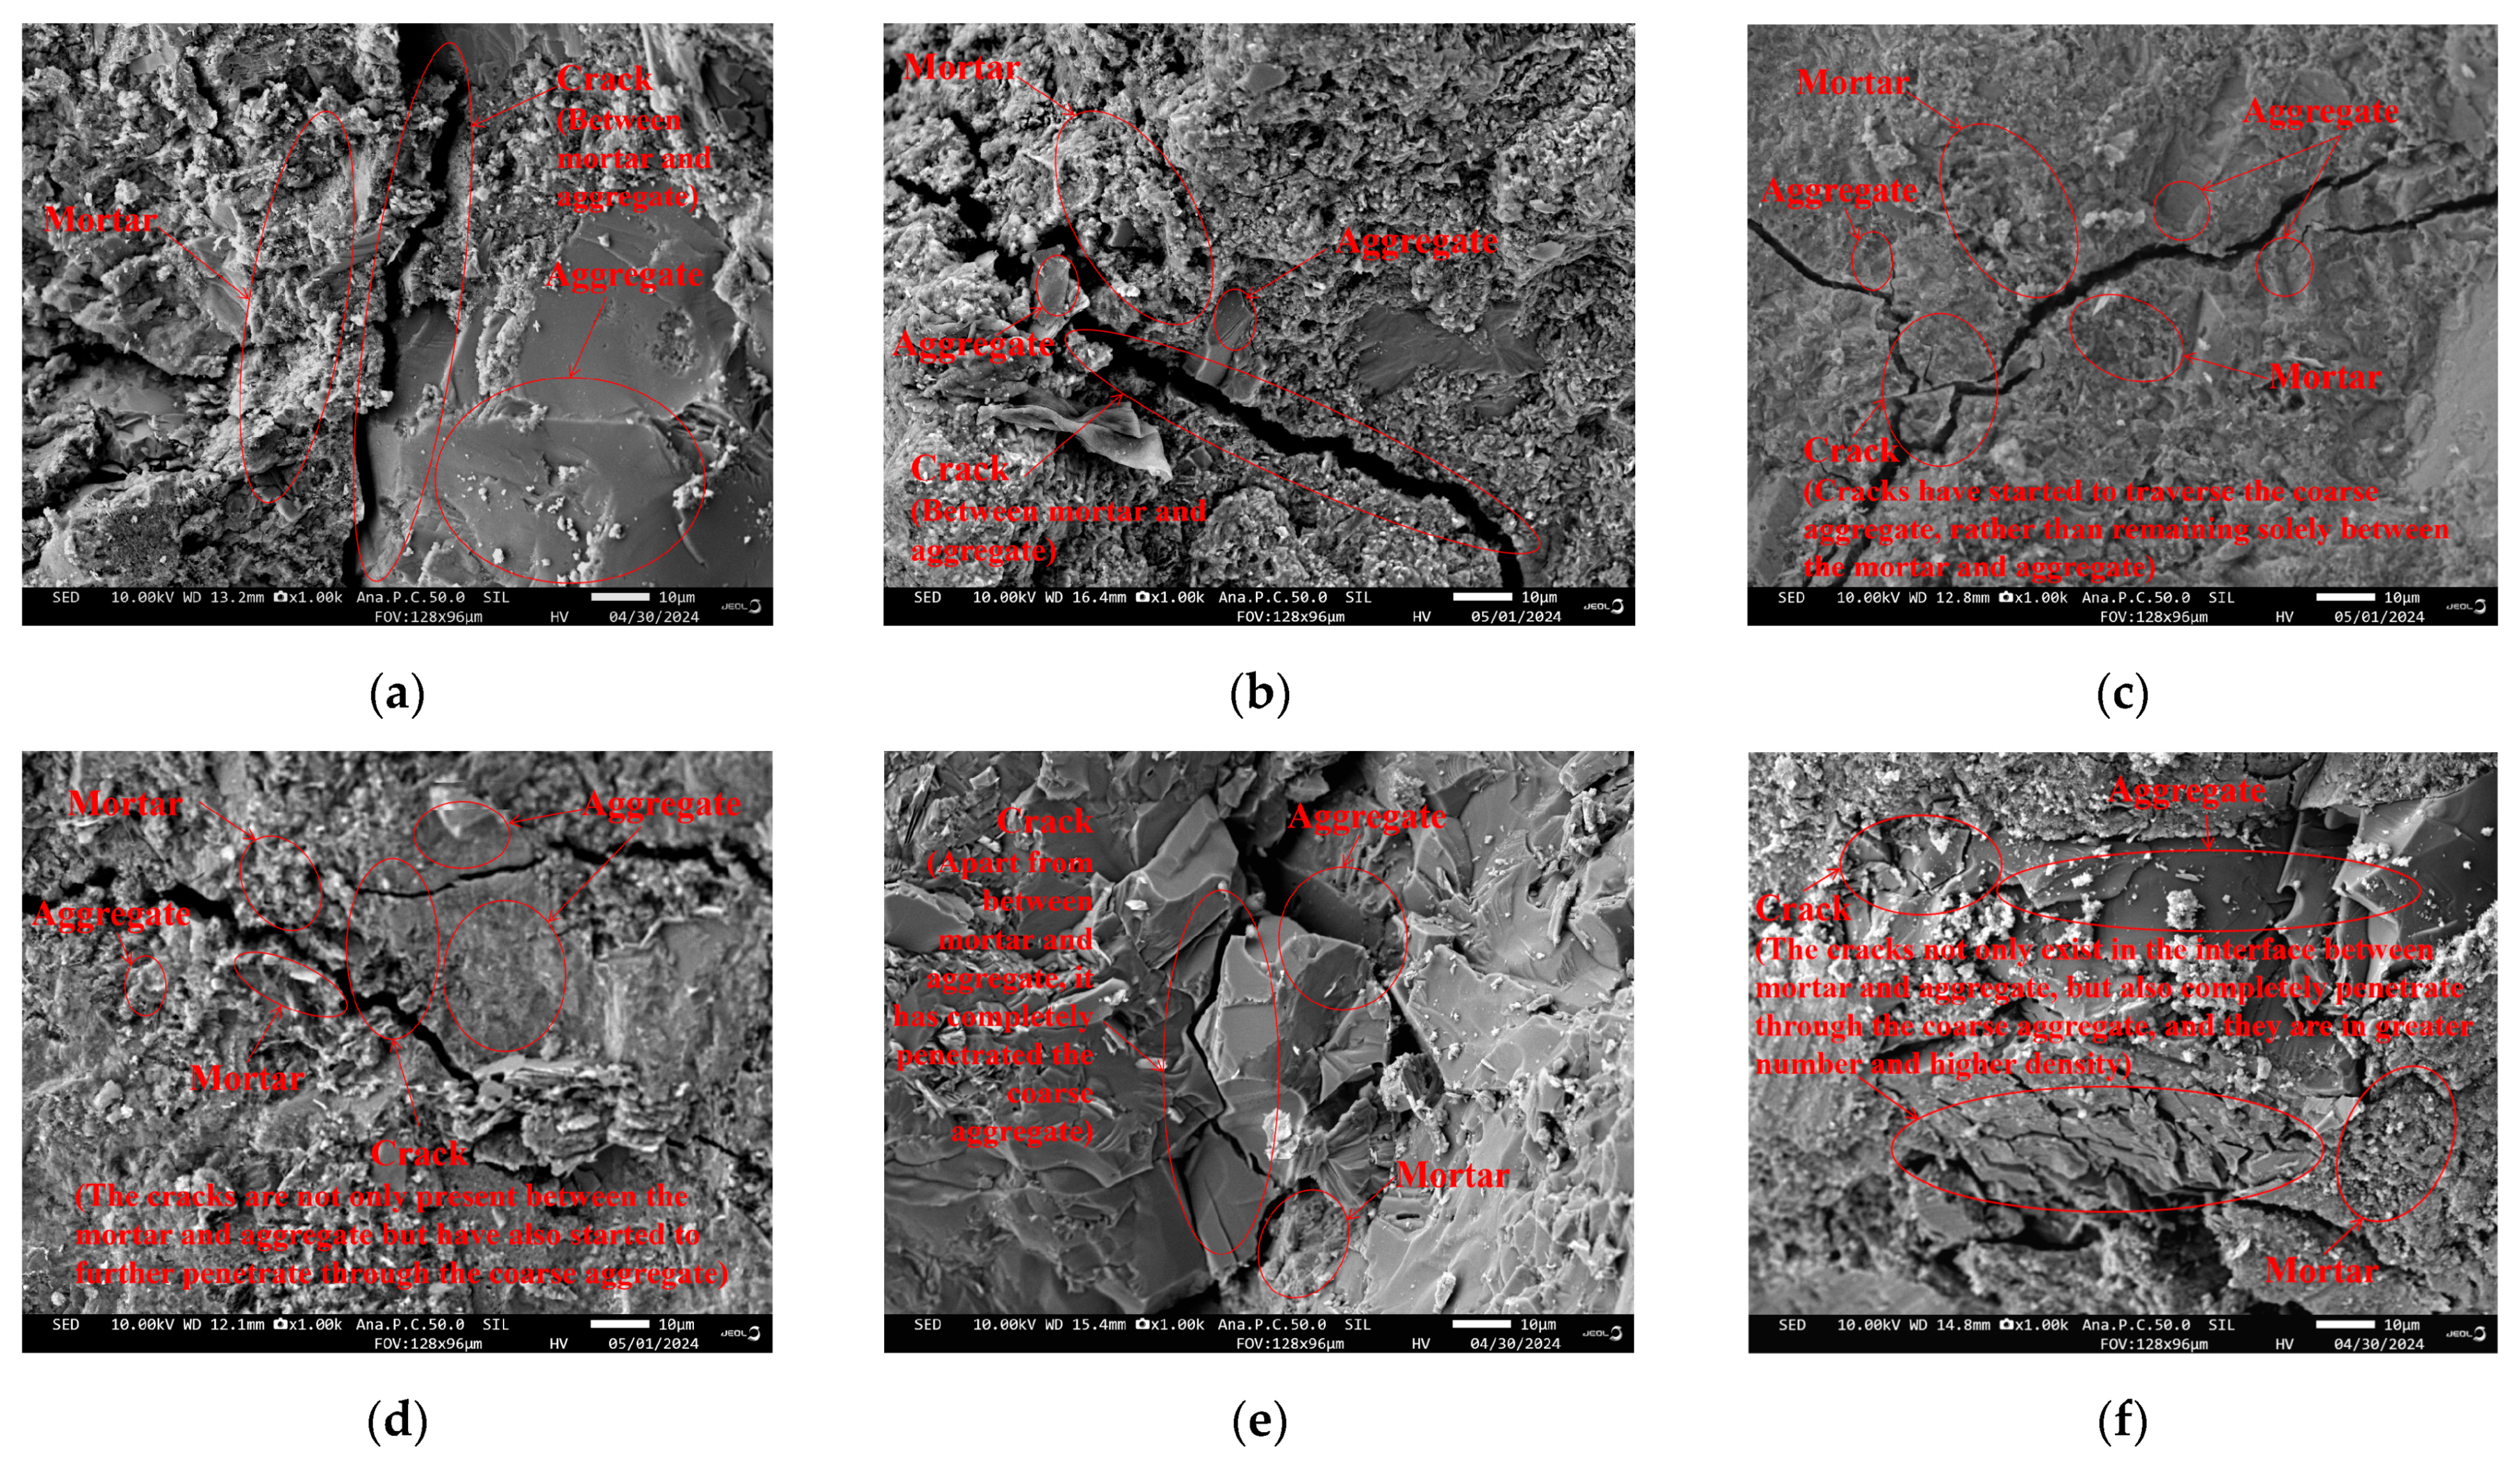
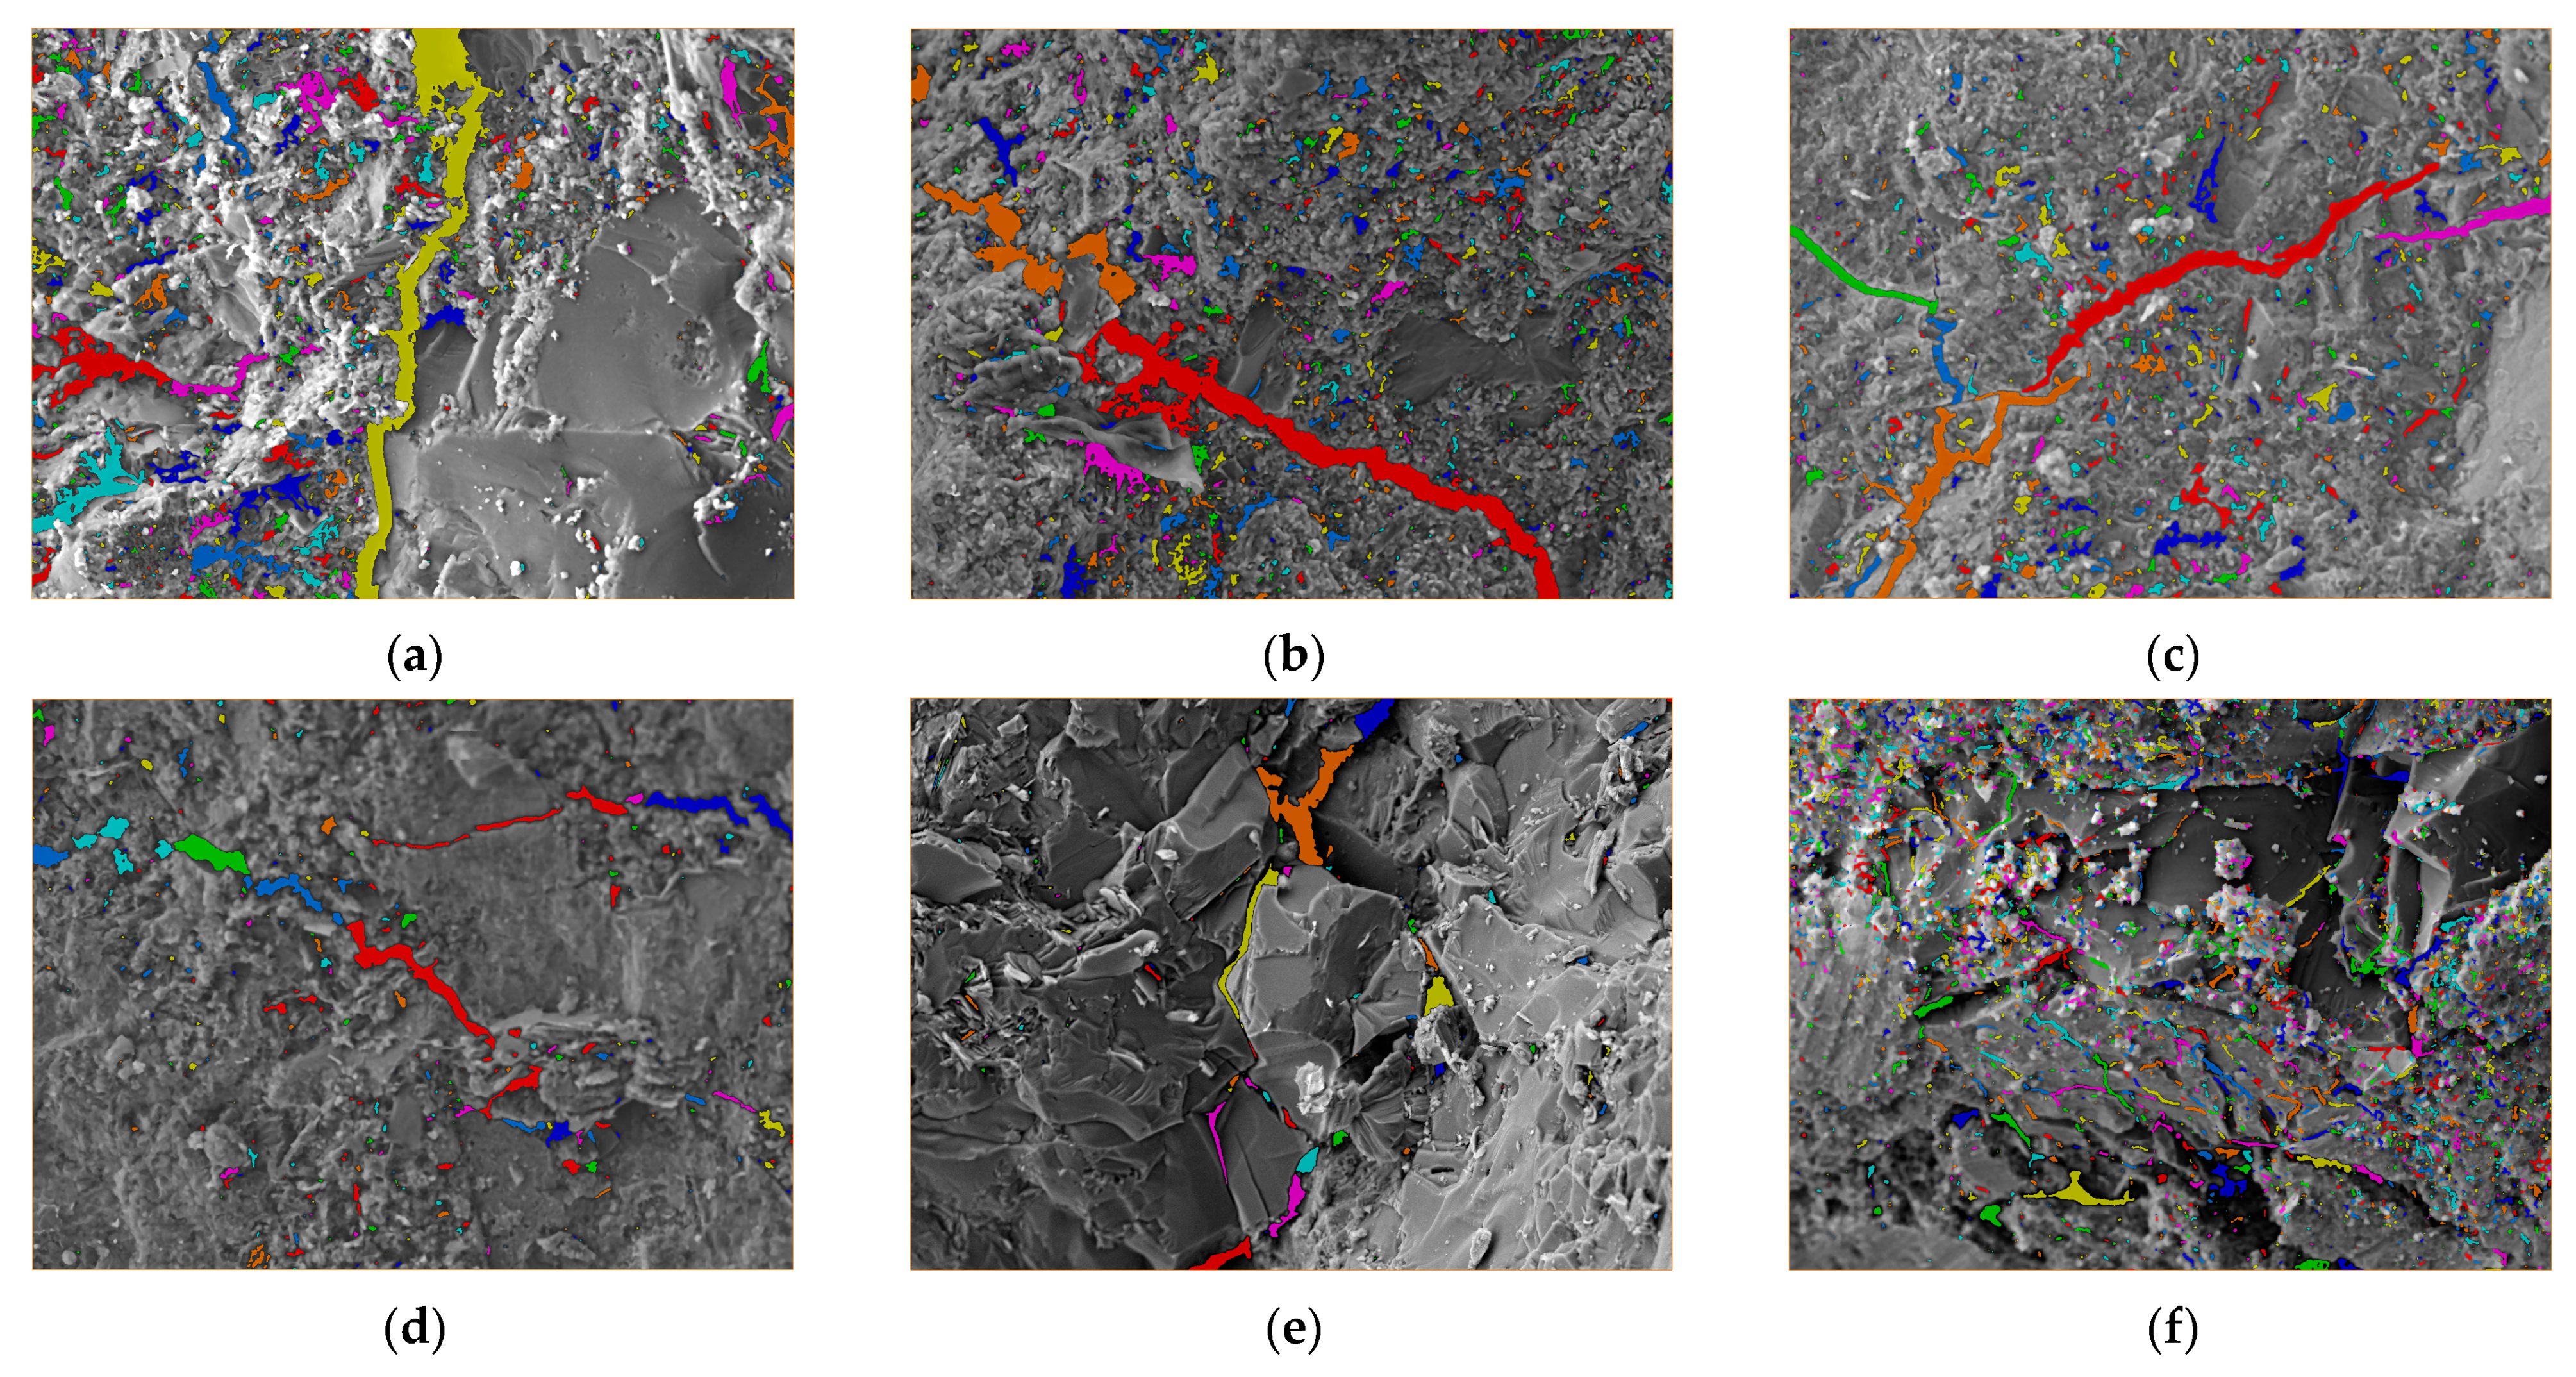
4.1. Evolution of Interface Transition Zone Cracks Under Different Confining Pressures

The interfacial transition zone (ITZ) of concrete is the boundary region between the cement paste and the aggregate, and it is also the weakest connection in concrete, significantly affecting the mechanical properties and durability of concrete. To investigate the characteristics of the ITZ under different confining pressures, SEM images obtained under various confining pressure conditions were analyzed (Figure 17). As can be seen from Figure 17, under triaxial compression with varying confining pressures, cracks first appear in the interfacial transition zone and continue to expand with the gradual increase of confining pressure, eventually gradually penetrating the coarse aggregate. Specifically, when the confining pressure σ3 is between 4 and 8 MPa, the cracks mainly develop along the interface between the aggregate and the mortar and bypass the aggregate. When the confining pressure σ3 increases to 12 MPa, in addition to the cracks at the interface between the aggregate and the mortar, cracks begin to gradually develop into the interior of the aggregate, but the number is relatively small. When the confining pressure σ3 increases to 16 MPa, in addition to the cracks at the interface between the aggregate and the mortar, the cracks further develop into the interior of the aggregate. When the confining pressure σ3 increases to 20 MPa, in addition to the cracks at the interface between the aggregate and the mortar, the cracks completely penetrate the aggregate. When the confining pressure σ3 has reached 24 MPa, a large number of cracks have developed inside the aggregate. This further indicates that the increase in confining pressure limits the development of cracks, forcing them to develop into the interior of the aggregate, while also compressing the loose parts of the interfacial transition zone more tightly, thereby increasing the density of the specimen, which in turn shows that the strength increases with the increase of confining pressure.

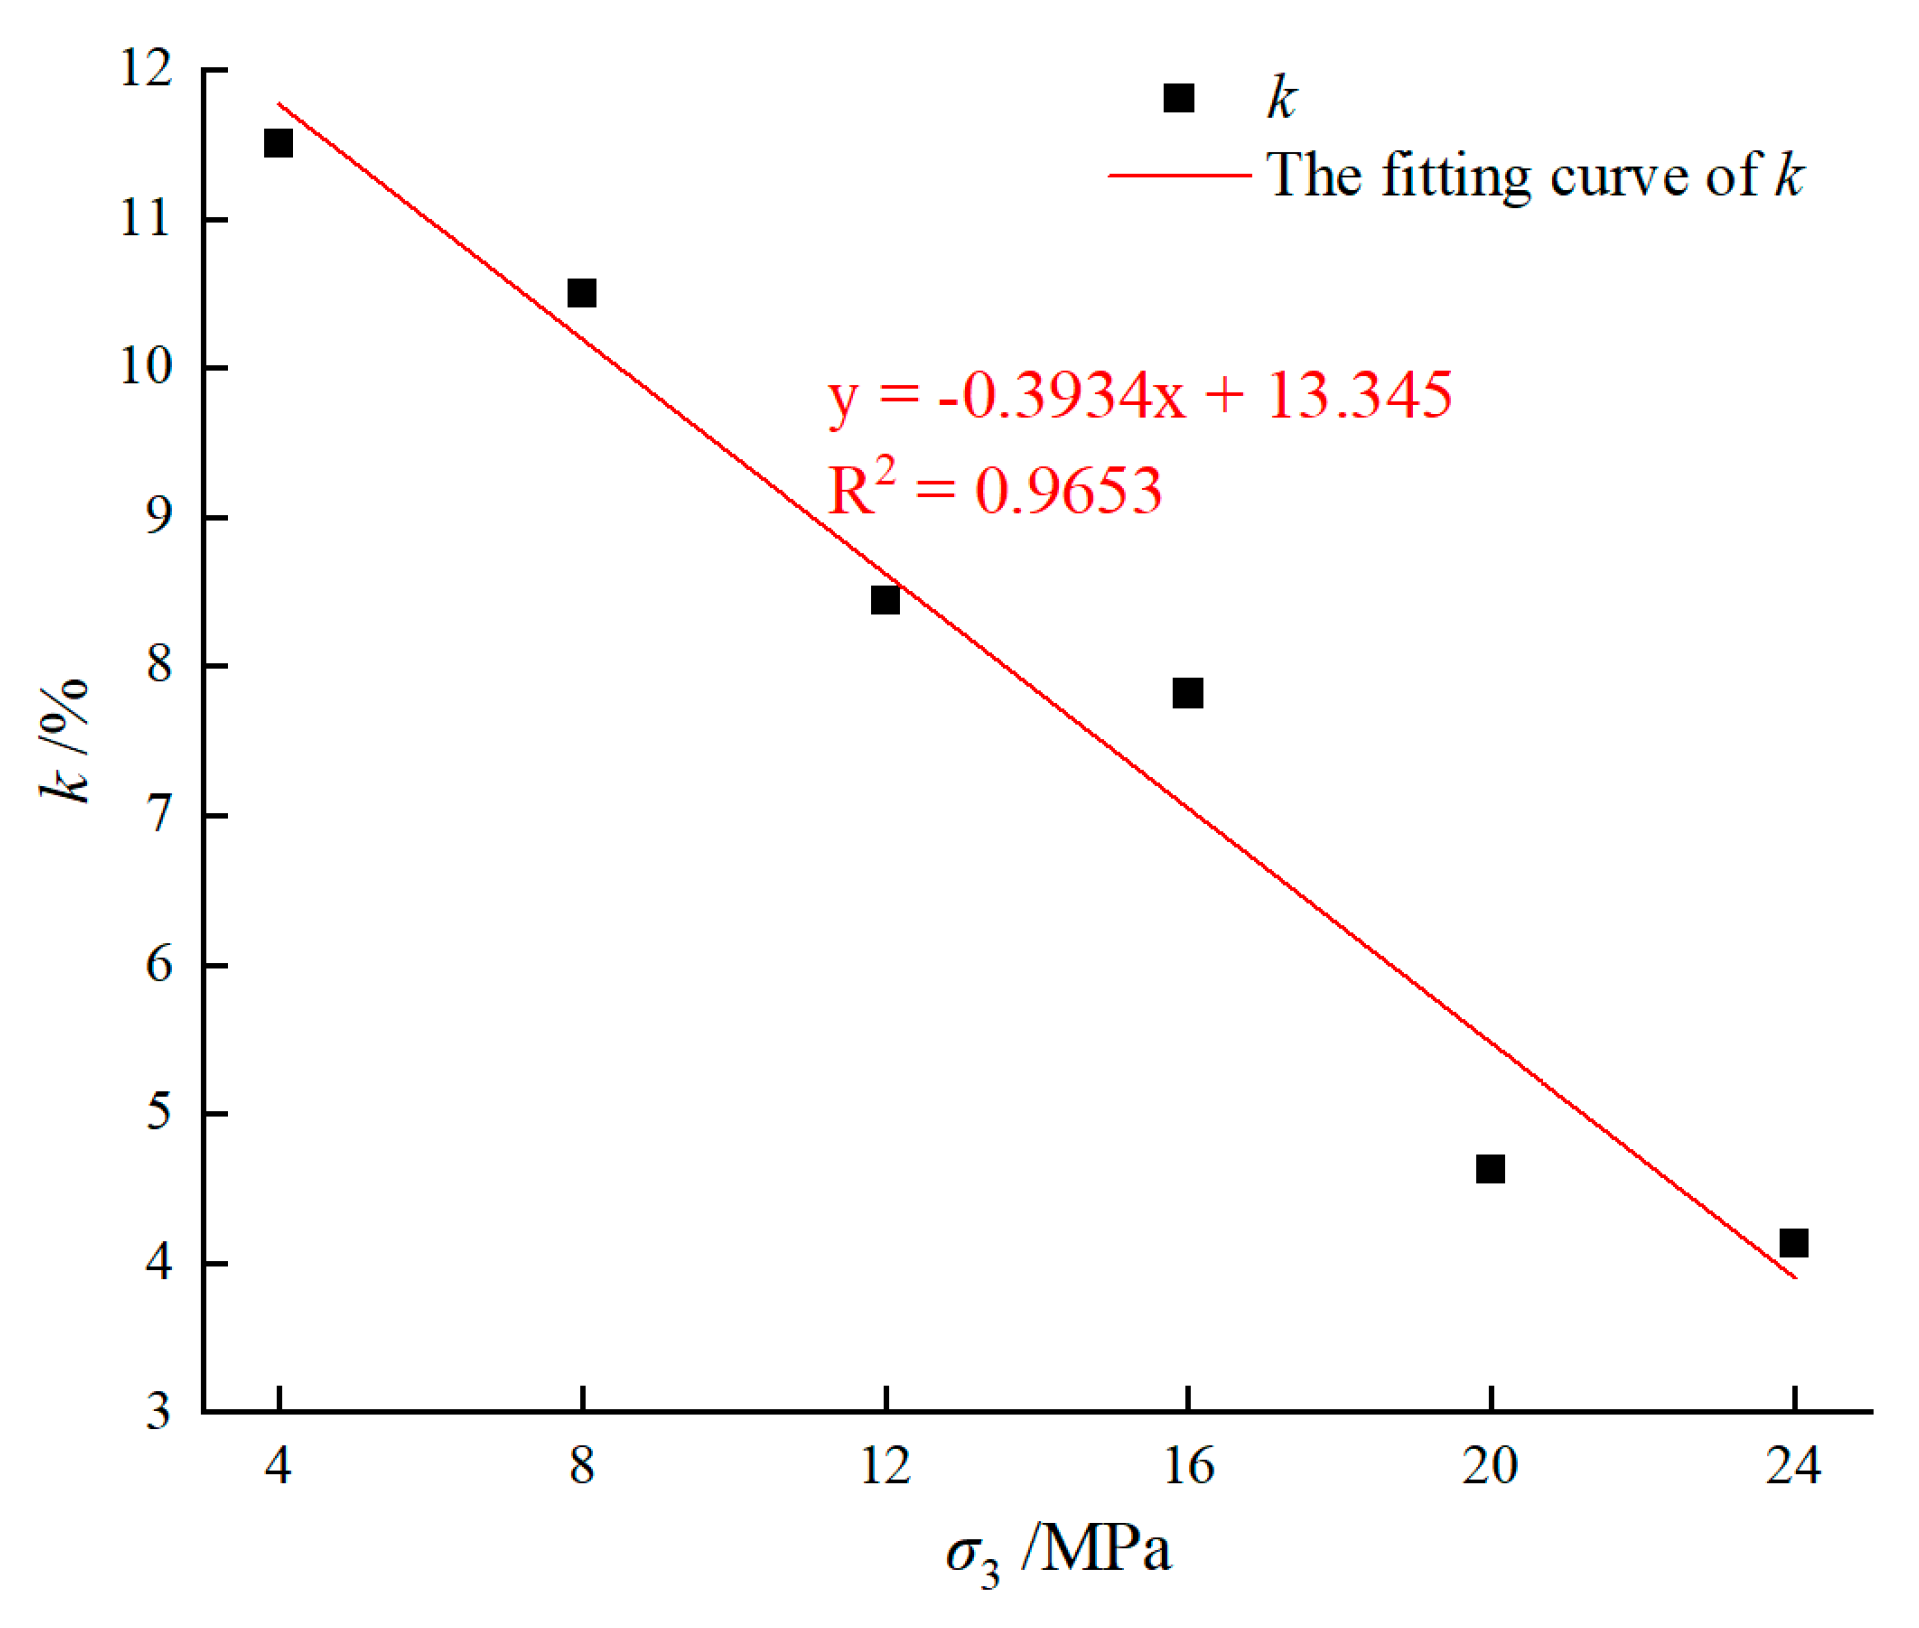
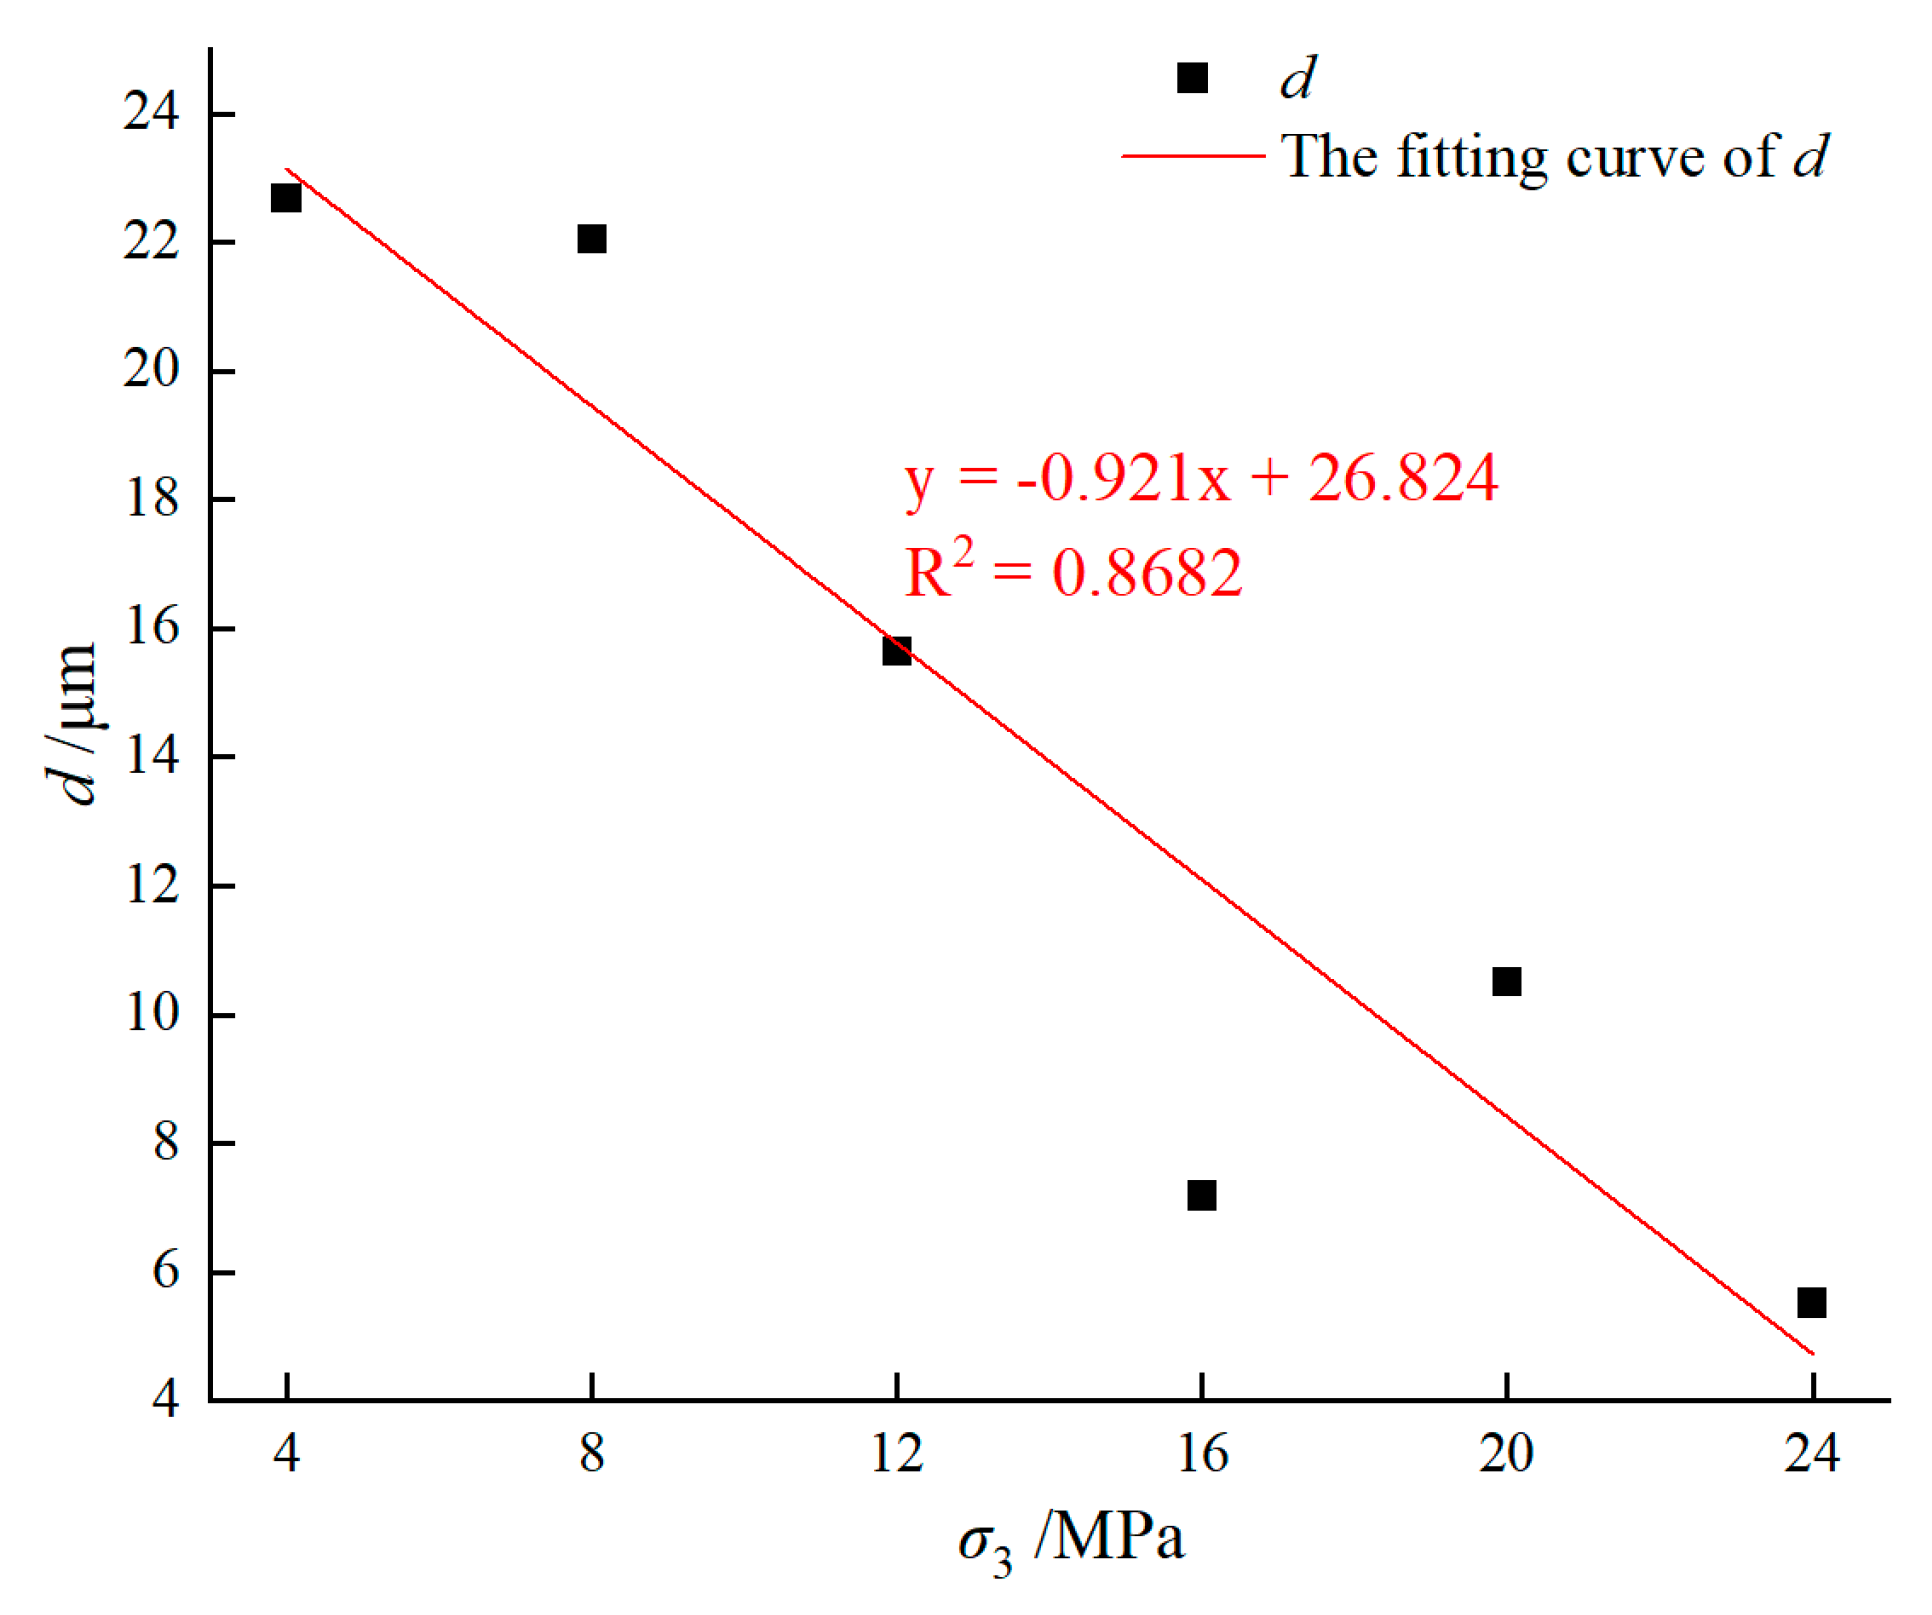
4.2. Evolution of Pore Structure and Fractal Dimension Under Different Confining Pressures

Porosity is one of the important factors affecting the mechanical properties of concrete. Higher porosity weakens the continuity and integrity of the concrete’s internal structure, thereby reducing its strength, as the presence of pores decreases the volume of material available for effective load-bearing. In addition, there is a significant difference in the impact of pores of different sizes on the mechanical properties of concrete. The existence of large pores can significantly reduce the strength of concrete, while small pores have a relatively smaller effect on strength [43].
Fractal theory primarily studies complex phenomena that exhibit characteristics such as scale invariance and randomness under certain conditions. Fractal dimension is one of the key concepts in fractal theory, and its fractal dimension indicator can reasonably and accurately reflect the complexity of the rock fracture network [44,45]. In this study, the box-counting dimension algorithm is used to calculate the fractal dimension. This method is based on the idea of grid division, where the object is covered with squares (or boxes) of different sizes, and then the number of boxes needed to completely cover the surface or boundary of the object under study is calculated. The specific mathematical algorithm is defined as follows: the box dimension can be defined using the box-covering method. Suppose there is a set or space that can be covered by a series of boxes (or grids). The size of each box can be different, but usually, the shape of the box is a square or a cube [46,47,48,49]. Then, the box dimension of this set is defined as the order of magnitude of the number of boxes needed when the box size approaches zero. It can be defined by the following Formula (9):
D = l i m ε 0   log N ( ε ) log ( 1 / ε )  
In the formula, N ( ε ) is the minimum number of squares (in two-dimensional space) or cubes (in three-dimensional space) with side length ε required to cover the set.
The specific analysis process for the evolution of pore structure and fractal dimension of the fracture surfaces of limestone crushed stone concrete under different confining pressures is shown in Figure 18: ① Secondary electron images of limestone crushed stone concrete obtained using SEM; ② import the secondary electron images into ImageJ-win64 software to determine their pixel density; ③ import the secondary electron images into Avizo software (version 2019), set their pixel density, and then extract the region of interest; ④ use a median filter to denoise the image (effectively maintaining image edge clarity while removing noise); ⑤ perform interactive threshold segmentation to distinguish between the matrix and pores, and calculate the porosity by dividing the extracted pores by the region of interest; ⑥ use the label analysis and fractal dimension functions to calculate the pore structure characteristics and fractal dimension of the extracted pores. The pore structure and fractal dimension information are shown in Figure 19 and Table 3, where k is the porosity, d is the maximum pore diameter, and D is the fractal dimension.
Figure 20 shows the relationship between the confining pressure (σ3) and the porosity (k) of the limestone crushed stone concrete specimens. Figure 21 shows the relationship between σ3 and the maximum pore diameter (d), and Figure 22 shows the relationship between σ3 and the fractal dimension (D). As can be seen from Figure 20, k decreases as σ3 increases. Specifically, when σ3 increases from 4 MPa to 8 MPa, k decreases by 1% (a reduction of about 8.70%); when it increases from 8 MPa to 12 MPa, k decreases by 2.1% (a reduction of about 20.00%); when it increases from 12 MPa to 16 MPa, k decreases by 0.6% (a reduction of about 7.14%); when it increases from 16 MPa to20 MPa, k decreases by 3.2% (a reduction of about 41.03%); and when it increases from 20 MPa to 24 MPa, k decreases by 0.5% (a reduction of about 10.87%). Overall, k decreases from 11.5% to 4.1%, a total reduction of about 64.35%. Similarly, as can be seen from Figure 21, excluding the d corresponding to a confining pressure of 20 MPa, d decreases from 22.681 μm to 5.515 μm, a total reduction of approximately 75.70%. As can be seen from Figure 22, D decreases from 1.442 to 1.160, a reduction of about 19.57%.
The reasons for these changes are as follows: ① Pore compression and closure: As the confining pressure increases, the pores within the limestone crushed stone concrete are compressed, and the pore volume gradually decreases, with some pores being completely closed, thereby reducing the distribution range of the originally dispersed pores and cracks; ② Particle rearrangement and compaction: The increase in confining pressure causes a change in the relative positions of the limestone crushed stone particles and the cement matrix, with particles adjusting to a more compact arrangement. This particle rearrangement compresses and simplifies the originally complex pore and crack network; ③ Optimization of the interfacial transition zone: The interfacial transition zone typically has higher k and d, and under the action of confining pressure, the pores at the interface are compressed, making the interfacial transition zone more dense.

4.3. Microscopic Damage Mechanism and Regression Model

In terms of crack changes in the interfacial transition zone (ITZ), as described in Section 4.1, cracks initially form at the interface between the aggregate and mortar and gradually propagate into the interior of the aggregate. Since the strength of the aggregate is significantly higher than that of the interface between the aggregate and mortar, this crack propagation path has a significant impact on the mechanical properties of concrete. Specifically, the expansion of cracks at the interface between the aggregate and mortar weakens the structural integrity of this area, but when cracks propagate into the interior of the aggregate, the high strength of the aggregate limits further crack propagation. Although the propagation path of cracks within the aggregate locally weakens the strength of the aggregate, overall, the high strength of the aggregate limits further crack propagation, thereby reducing the destructive effect of cracks on the overall structure and thus increasing its strength and elastic modulus.
Figure 23 shows the relationship between σ3 and k, d, E, D, and σ1m of limestone crushed stone concrete. As can be seen from Figure 23, there is a strong correlation between k, d, E, D, and σ1m of limestone crushed stone concrete under different confining pressures. In terms of pore structure, as described in Section 4.2, the gradual decrease in porosity and maximum pore radius optimizes the microstructure, making the concrete more compact and significantly reducing stress concentration within the specimen. The decrease in fractal dimension further confirms this phenomenon. A lower fractal dimension indicates reduced complexity of the crack network and pore structure, and a more uniform and dense microstructure, which also increases its strength and elastic modulus.
Further regression fitting of σ1m with k, d, and D was conducted (Figure 24), and the resulting equations are given in Equations (10)–(12):
σ1m = −0.0897k + 15.93
σ1m = −0.213d + 33.189
σ1m = −0.0034D + 1.6365
Equation (10) indicates that for every 1% reduction in porosity, the peak strength increases by 0.0897 MPa, further demonstrating that a decrease in porosity helps to enhance the material’s strength. Equation (11) shows that for every 1 μm reduction in the maximum pore diameter, the peak strength increases by 0.213 MPa, highlighting that reducing the maximum pore diameter can significantly improve the material’s strength. Equation (12) reveals that for every 1 unit decrease in the fractal dimension, the peak strength increases by 0.0034 MPa, indicating that a lower fractal dimension can enhance the material’s strength.
Further regression fitting of E with k, d, and D was conducted (Figure 25), and the resulting equations are given in Equations (13)–(15):
E = −0.8453k + 16.598
E = −2.0079d + 34.79
E = −0.032D + 1.6603
Equation (13) indicates that for every 1% reduction in porosity, the elastic modulus increases by approximately 0.8453 GPa, further confirming that a decrease in porosity helps to enhance the material’s elastic modulus. Equation (14) shows that for every 1 μm reduction in the maximum pore diameter, the elastic modulus increases by 2.0079 GPa, emphasizing that reducing the maximum pore diameter can improve the material’s elastic modulus. Equation (15) reveals that for every 1 unit decrease in the fractal dimension, the elastic modulus increases by 0.032 GPa, which further illustrates that a lower fractal dimension can enhance the material’s elastic modulus.
This provides a deeper analysis of the influence of microstructural characteristics and fractal properties on the material’s σ1m and E.

5. Discussion

5.1. Relationship Between Volumetric Strain and the Level of Micro-Cracking

By analyzing the deviatoric stress–volumetric strain curves of limestone crushed stone concrete under different confining pressures (see Figure 13), it can be found that under low confining pressure (4 ≤ σ 3 ≤ 8 MPa) conditions, the volumetric expansion point occurs earlier, and the volumetric strain increases rapidly. This indicates that microcracks begin to expand extensively at lower stress levels (see Figure 17a,b). Microcracks are mainly concentrated at the interface between the aggregate and mortar, and the cracks are relatively wide. As the confining pressure increases (>8 MPa), the volumetric expansion point appears later, and the increase in volumetric strain slows down, indicating that higher confining pressure inhibits the early expansion of microcracks (see Figure 17c–f). Microcracks gradually extend into the interior of the aggregate, evolving from relatively wide microcracks to a finer and more dispersed microcrack network. This further demonstrates that the change in volumetric strain is closely related to the generation, expansion, and distribution of microcracks. Confining pressure significantly improves the mechanical properties of the material by altering the expansion pathways and density of microcracks.

5.2. Comparison and Analysis with Existing Research

In this study, a combination of triaxial compression tests and microstructural analysis was employed to systematically investigate the mechanical properties and microstructural damage characteristics of limestone crushed stone concrete under different confining pressures. To further verify the scientific and rational nature of the results obtained in this study, a detailed comparative analysis was conducted with relevant existing research.
Regarding mechanical properties, the peak strength, axial peak strain, elastic modulus, and ductility coefficient of limestone crushed stone concrete all exhibited significant increasing trends with the increase in confining pressure. This finding is highly consistent with the conclusions drawn by Yang et al. [20]. Yang et al. [20] conducted triaxial compression tests on limestone crushed stone concrete specimens under different confining pressures and confirmed that both the peak stress and peak strain of the concrete increased gradually with the increase in confining pressure. The research by Zhang et al. [22] also demonstrated that the compressive strength and peak strain of concrete were significantly enhanced under confining pressure, with a notable improvement in its deformation capacity, exhibiting a transition from brittleness to ductility. These research results corroborate each other, fully confirming that confining pressure has a significant enhancing effect on the mechanical properties of concrete, especially under high confining pressure conditions, where the load-bearing capacity and deformation capacity of concrete are greatly improved, resulting in more excellent mechanical properties.
Regarding failure characteristics, this study observed that limestone crushed stone concrete exhibited a diagonal shear failure mode under low confining pressure conditions, while it transformed into a compressive flow failure mode under high confining pressure conditions, showing good ductility. This change in failure mode is consistent with the findings of Liu et al. [50], who pointed out that under confining pressure, the failure mode of concrete transitions from brittleness to ductility, reflecting the significant impact of confining pressure on the failure mechanism of concrete.
In terms of strength criteria, the Mohr–Coulomb strength criterion was used in this study to analyze the triaxial compression test results of limestone crushed stone concrete in detail. The analysis showed that this criterion can fit the experimental data well and accurately describe the strength characteristics of concrete under different confining pressures. This method is consistent with the research approach of Zhang et al. [22], further validating the applicability and effectiveness of the Mohr–Coulomb strength criterion in analyzing the triaxial compression test results of concrete.
Regarding microstructure, this study utilized SEM and digital image processing techniques to reveal the significant reduction in porosity and maximum pore diameter, as well as the decrease in fractal dimension of limestone crushed stone concrete under high confining pressure. These changes indicate that the microstructure of limestone crushed stone concrete becomes more uniform and dense under high confining pressure. This finding is in line with the results of Wang et al. [25], who found that when weathered granite (WG) and recycled coarse aggregate (RCA) are used together, the porosity of concrete decreases, the interfacial transition zone (ITZ) becomes denser, and the microstructure is optimized, thereby significantly improving the mechanical properties of concrete. The research by Mohamed et al. [26] also pointed out that adding natural milled nano-zeolite (NZ) can significantly improve the microstructure of concrete, making it denser and enhancing its corrosion resistance in different corrosive environments. These research results indicate that optimizing the microstructure of concrete can significantly enhance its mechanical properties and durability.
Through a detailed comparative analysis with existing research, this study not only further verified the significant impact of confining pressure on the mechanical properties and microstructure of concrete but also confirmed the significant enhancement effect of microstructural optimization on these characteristics. The findings of this study provide an important theoretical basis for optimizing the performance of concrete materials and guiding applications in complex stress environments such as underground engineering, and have significant scientific and practical application value.

6. Conclusions

The conclusions drawn from this study about the mechanical properties and microstructural damage mechanisms of limestone crushed stone concrete under triaxial stress conditions are as follows:
(1) Significant improvement in mechanical properties: With the increase in confining pressure, the macroscopic mechanical properties of limestone crushed stone concrete are significantly enhanced. Specifically, the peak strength increases from 46.18 MPa at 4 MPa to 135.15 MPa at 24 MPa, a rise of 192.66%; the axial peak strain rises from 0.71% to 1.73%, an increase of 143.66%; the elastic modulus increases from 6.15 GPa to 14.39 GPa, a growth of 133.98%; and the ductility coefficient climbs from 1.454 to 2.248, an addition of 54.61%. These results indicate that the increase in confining pressure significantly boosts the strength and deformation capacity of limestone crushed stone concrete.
(2) Microstructural optimization: In terms of microstructure, the porosity drops from 11.5% to 4.1%, a reduction of 64.35%; the maximum pore diameter decreases from 22.681 μm to 5.515 μm, a decrease of 75.69%; and the fractal dimension falls from 1.442 to 1.160, a decline of 19.56%. Cracks in the interfacial transition zone gradually extend into the interior of the aggregate. The optimization of the microstructure makes the concrete more compact and reduces stress concentration, thereby enhancing macroscopic mechanical properties.
(3) Change in failure characteristics: From 4 MPa to 12 MPa, the failure mode is diagonal shear failure, with the angle between the crack and the horizontal plane ranging from 45° to 70° and gradually increasing, and the crack width narrowing. From 16 MPa to 24 MPa, it shifts to compressive flow failure, with spider-web-like cracks appearing in the middle, the outer layer of mortar peeling off, the internal material undergoing plastic flow and expansion, and the crack width widening. This indicates that high confining pressure suppresses crack development, maintains the integrity of the specimen, and promotes plastic deformation.
(4) Verification of strength criterion: According to the Mohr–Coulomb strength criterion, the calculated cohesion is 6.96 MPa, the internal friction angle is 38.89°, and the failure angle is 25.53°. A quantitative relationship between microstructural characteristics and macroscopic mechanical properties has been established using regression analysis, revealing the significant impact of microstructural characteristics on macroscopic mechanical properties. These results show that the Mohr–Coulomb strength criterion can accurately describe the triaxial failure characteristics of limestone crushed stone concrete.
(5) The relationship between volumetric strain and the development of microcracks: Under low confining pressure, the volumetric expansion point of limestone crushed stone concrete occurs early, and the volumetric strain increases rapidly. Relatively wide microcracks develop extensively at the interface between the aggregate and mortar. In contrast, under high confining pressure, the volumetric expansion point is delayed, and the increase in volumetric strain is slower. Microcracks extend into the interior of the aggregate, becoming finer and more dispersed.
(6) Significance for engineering applications: This study reveals the intrinsic link between the mechanical properties and microstructural damage of limestone crushed stone concrete under triaxial stress conditions, providing a theoretical basis for optimizing concrete material properties and guiding applications in complex stress environments such as underground engineering.

Author Contributions

K.L.: Writing—review & editing, Writing—original draft, Funding acquisition, Formal analysis, Data curation, Conceptualization. S.Z.: Writing—review & editing, Software, Project administration, Formal analysis, Conceptualization. D.W.: Writing—original draft, Data curation, Software, Conceptualization. W.Y.: Supervision, Conceptualization. C.S.: Investigation, Conceptualization. Y.X. and Q.W.: Software, Project administration, Investigation. All authors have read and agreed to the published version of the manuscript.

Funding

This work is supported by The National Nature Science Foundation of China (No. 52104222, No. 51909224), the Natural Science Foundation Research Project of Shaanxi Province (2021JLM-48, 2025JCBMS-511, 2019JM-182), and the Special Fund for High-level Talents of Xijing University (XJ24B12). The authors would like to express sincere thanks to the reviewers for their thorough reviews and valuable advice.

Data Availability Statement

Data are contained within the article.

Conflicts of Interest

The authors declare no conflicts of interest.

References

  1. Yuan, Q.; Chang, J. Research Progress of Dark Matter Particle Explore. Chin. Sci. Bull. 2021, 66, 1299–1306. [Google Scholar] [CrossRef]
  2. Pu, F.; Ding, Z.; Tang, J. Shanghai Jiao Tong University’s Institute of Advanced Technology Vice Director Liu Jianglai: Capturing dark matter 2,400 meters underground and repeatedly breaking international records. Everyday Econ. News 2024, 54. [Google Scholar]
  3. Pu, F.; Ding, Z.; Tang, J. Detecting dark matter in the world’s deepest and largest underground laboratory. Mil. Dig. 2024, 8, 28–29. [Google Scholar]
  4. Wang, W.; Ren, J.; Ding, Z.; Liu, Q. Failure mechanisms and stability control principles of high geostressed deep mining structures: Investigation by FDEM and field measurements. Eng. Fail. Anal. 2025, 169, 109233. [Google Scholar] [CrossRef]
  5. Wang, W.; Gao, X.; Ding, Z.; Ma, H.; Ren, J.; Liu, Z. Fracture characteristic and support effect around deep lined tunnels using CGP-FDEM simulation and field investigation analysis. Eng. Anal. Bound. Elem. 2024, 161, 29–47. [Google Scholar] [CrossRef]
  6. Xia, W.; Wang, G.; Ge, T.; Bai, E.; Qin, L.; Zhao, J.; Liu, G. Dynamic compression mechanical behavior and strength prediction modeling of sulfate attacked concrete under triaxial static pre-loading. J. Build. Eng. 2025, 100, 111784. [Google Scholar] [CrossRef]
  7. An, F. Experimental study on mix proportion optimization of high performance concrete for tunnel secondary lining. Util. Fly. Ash 2021, 35, 100–104. [Google Scholar]
  8. Yang, F.; Teng, M.; Song, Q.; Ding, X. Study on damage characteristics and impermeability of concrete under triaxial loading and unloading. Peoples Yangtze River 2024, 55, 195–202. [Google Scholar]
  9. Bousleh, A.; El Euch Khay, S. Shrinkage performance and modelling of concretes incorporating crushed limestone sand with a high content of fillers for pavement slabs. Eur. J. Environ. Civ. Eng. 2024, 28, 1696–1713. [Google Scholar] [CrossRef]
  10. Xiao, Y.; Zhang, Y.; Lu, J.; Cheng, W. Experimental analysis on pre-stress friction loss of crushed limestone sand concrete beams. Appl. Sci. 2018, 8, 683. [Google Scholar] [CrossRef]
  11. Arsène, M.I.L.; Frédéric, C.; Nathalie, F. Improvement of lifetime of compressed earth blocks by adding limestone, sandstone and porphyry aggregates. J. Build. Eng. 2020, 29, 101155. [Google Scholar] [CrossRef]
  12. Tanijaya, J.; Tappi, S. The mechanical properties of limestone as an aggregate on high strength concrete. IOP Conf. Ser. Mater. Sci. Eng. 2021, 1088, 12098. [Google Scholar]
  13. Kan, L.; Wang, F.; Wu, H.; Duan, X. Mechanical Properties and Cracking Characteristics of UHPC with Hybrid Steel Fibers at Early Age under Different Curing Conditions. J. Ceram. Soc. Chin. 2022, 50, 429–437. [Google Scholar]
  14. Wu, Z.; Wong, H.S.; Buenfeld, N.R. Effect of confining pressure and microcracks on mass transport properties of concrete. Adv. Appl. Ceram. 2014, 113, 485–495. [Google Scholar] [CrossRef]
  15. Rong, H.; Zhang, J.; Liu, H.; Niu, L.; Zhang, N.; Gu, J.; Dong, H. Study on mechanical properties and fracture characteristics of single cracked concrete under uniaxial compression. Concrete 2019, 10, 62–68. [Google Scholar]
  16. Chen, Y.; Li, P.; Zhang, S. Experimental investigation on triaxial mechanical properties of coral coarse aggregate-sea sand seawater concrete. Constr. Build. Mater. 2023, 409, 134213. [Google Scholar] [CrossRef]
  17. Lin, S.; Liu, J.; Liu, C.; Liu, K.; Liu, P.; Su, Y. Triaxial Compressive Behaviour of Ultra-high Performance Geopolymer Concrete (UHPGC) and Its Applications in Contact Explosion and Projectile Impact Analysis. Constr. Build. Mater. 2024, 449, 138394. [Google Scholar] [CrossRef]
  18. Wang, S.; Xu, L.; Li, B.; Liu, S.; Chi, Y. Mechanical behavior and stress-strain model of steel-polypropylene hybrid fiber reinforced ultra-high performance concrete under triaxial compression. Constr. Build. Mater. 2024, 450, 138595. [Google Scholar] [CrossRef]
  19. Cheng, Z.; Wang, Q.; Wang, P.; Sun, S.; Liu, M. Dynamic mechanical properties and failure criteria of concrete under biaxial compression. J. Hydraul. Eng. 2019, 5, 101–107. [Google Scholar]
  20. Yang, N.; Chen, D.; Peng, G.; Xiao, J.; Xu, T. Mechanical properties of concrete under confining pressure after cyclic loading. J. Hydraul. Eng. 2017, 4, 89–96. [Google Scholar]
  21. Tugrul Tunc, E. Relationship Between Schmidt Hammer Rebound Hardness Test and Concrete Strength Tests for Limestone Aggregate Concrete Based on Experimental and Statistical Study. Materials 2025, 18, 1388. [Google Scholar] [CrossRef] [PubMed]
  22. Zhang, Y.; Yao, H.; Zhu, D.; Li, Y. Research on the conventional triaxial compressive properties of saturated concrete. Concrete 2015, 3, 63–66. [Google Scholar]
  23. Li, X.; Lin, H.; Chen, W.; Liang, S.; Huang, L. A numerical study on the tensile splitting of concrete with digital image processing. J. Mater. Res. Technol. 2023, 25, 1626–1641. [Google Scholar] [CrossRef]
  24. Huang, K.; Huang, S.; Ding, X.; Zhang, Y.; Liu, Z.; Han, G.; Dai, Z. Mechanical behavior and failure characteristics of limestone-concrete specimens with different prefabricated fracture angles under compressive-shear loading. Constr. Build. Mater. 2025, 476, 141284. [Google Scholar] [CrossRef]
  25. Wang, C.; Zhao, X.; Zhao, J.; Zhao, Y. Synergistic application of weathered granite and recycled coarse aggregate in concrete: Mechanical properties and microstructural mechanisms. Constr. Build. Mater. 2025, 482, 141695. [Google Scholar] [CrossRef]
  26. Mohamed, A.; Abdelaziz, M.; Farid, A.; Osman, K. Nano-Zeolite-Modified Concrete: A Comprehensive Study of Mechanical Properties, Corrosion Resistance, and Microstructural of Concrete under Varied Exposure Conditions. Clean. Eng. Technol. 2025, 25, 100900. [Google Scholar] [CrossRef]
  27. Buettner, N.; Iyacu, G.; Dal Poggetto, G.; Akono, A.T. The Effect of Carbon Nanofibers on the Microstructure, Chemistry, and Pore Structure of Concrete Made with Fine Recycled Concrete Aggregates. Nanomaterials 2025, 15, 253. [Google Scholar] [CrossRef] [PubMed]
  28. Wu, F.; Liu, Y.; Gao, R.; Li, C.; Chen, J.; Ye, C. Study on the influence mechanism of interfacial inclination angle on the mechanical behavior of coal and concrete specimens. Constr. Build. Mater. 2024, 443, 137787. [Google Scholar] [CrossRef]
  29. Peng, Z.; Wan, Y.; Liu, W.J.; Huang, S.; Qin, Q. Influence of different porosity on concrete strength under high stress level. Hunan Transp. Sci. Technol. 2021, 47, 27–30+59. [Google Scholar]
  30. Zheng, K.; Lu, W.; Zhou, C.; Chen, B.; Dong, C. Effect of carbonation on mesostructures and mechanical properties of dam concrete. Adv. Sci. Technol. Hydr. Eng. 2025, 45, 8–15. [Google Scholar]
  31. Shi, H.; Li, H.; Huang, F.; Li, L.; Dong, H.; Yang, Z. Study on uniaxial compressive properties and microfracture toughness of interface transition zones in recycled sand concrete. Constr. Build. Mater. 2025, 477, 141365. [Google Scholar] [CrossRef]
  32. Jin, Z.; Xie, F.; Yang, T.; Han, X.; Chen, X.; Zhang, Y. Fractal dimension analysis of concrete specimens under different strain rates. J. Build. Eng. 2023, 76, 107044. [Google Scholar] [CrossRef]
  33. JGJ 55-2019; Code for Mix Proportion Design of Ordinary Concrete. China Architecture & Building Press: Beijing, China, 2019.
  34. GB/T 50081-2019; Standards for Test Methods of Physical and Mechanical Properties of Concrete. China Architecture & Building Press: Beijing, China, 2019.
  35. GB/T 17361-2013; Microbeam Analysis - Identification of Authigenic Clay Mineral in Sedimentary Rock by Scanning Electron Microscope and Energy Dispersive Spectrometer. Standardization Administration of China: Beijing, China, 2013.
  36. ASTM D7012-14e1; Standard Test Methods for Determination of Carbon, Hydrogen, and Nitrogen in Petroleum Products and Lubricants. ASTM International: West Conshohocken, PA, USA, 2014.
  37. Zhang, L.; Cheng, H.; Wang, X. Energy evolution law and failure criterion of high strength concrete under conventional triaxial compression. J. Jilin Univ. 2025, 55, 974–985. [Google Scholar]
  38. Pan, M.; Li, X.; Liu, L.; Qin, L.; Liang, Y.; Chen, Z. Investigation on triaxial compressive mechanical properties of glass fiber coral seawater concrete. Acta Mater. Compos. Sin. 2023, 40, 3459–3472. [Google Scholar]
  39. Liu, Q.; Liu, K.; Zhu, J.; Lu, X. Study of mechanical properties of raw coal under high stress with triaxial compression. Chin. J. Rock. Mech. Eng. 2014, 33, 24–34. [Google Scholar]
  40. Cai, M.F. Rock Mechanics and Engineering; Science Press: Beijing, China, 2002; pp. 219–228. [Google Scholar]
  41. Chen, H.F.; Salop, A.F. Elasticity and Plasticity; China Architecture & Building Press: Beijing, China, 2005; pp. 281–301. [Google Scholar]
  42. Li, X.; Xiao, T.; Wang, B.; Xu, P. Experimental study of Jinping II hydropower station marble under loading and unloading stress paths. Chin. J. Rock Mech. Eng. 2012, 31, 882–889. [Google Scholar]
  43. Xu, J.; Zhao, D.; Wang, S.; Chen, X.; Wu, X.; Han, Z.; Liu, Y. Quantitative analysis of pore structure’s impact on early mechanical properties and durability of foam concrete: Macroscopic and mesoscopic insights. Constr. Build. Mater. 2025, 459, 139775. [Google Scholar] [CrossRef]
  44. Zou, M. Fracal Theory and Its Applications to Porous Media, Rough Surface Ard Thermal Contact Conductance; Huazhong University of Science and Technology: Wuhan, China, 2007. [Google Scholar]
  45. Li, H.; Wang, W.; Qi, Q.; Zhang, L. Study on fissure development rule of overlying strata influenced by mining based on fractal theory. J. Chin. Coal Soc. 2014, 39, 1023–1030. [Google Scholar]
  46. Yi, H.; Kang, X.; Hu, J.; Ren, J. Study on fractal characteristics of overburden fracture evolution in coal seam mining under the influence of double faults. Min. Saf. Environ. Prot. 2025, 25, 113–120. [Google Scholar]
  47. Liu, C. Quantitative Analysis of the Spatial Pattern of Ding Village Settlement in Xiangfen County Based on the Integration of Urban Form and Geographic Information; Beijing Jiaotong University: Beijing, China, 2019. [Google Scholar]
  48. Li, J. Study on the Influence of Pre-Existing Microcracks on Rock Crushing Performance; Jilin University: Changchun, China, 2024. [Google Scholar]
  49. Hu, Z.; Zhang, R.; Ma, Y.; Peng, N. Study on the correlation between fractal dimension values of Dongting Lake drainage system based on DEM and geological disasters. Earth Sci. Front. 2025. Available online: https://link.cnki.net/urlid/11.3370.p.20250423.0946.002 (accessed on 7 May 2025).
  50. Liu, X.; Liu, S.; Qin, B. Experimental study on strength and deformation feature of hybrid-fiber high-strength concrete under conventional triaxial compression. J. Henan Polytech. Univ. 2013, 32, 225–229. [Google Scholar]
Figure 1. Experimental research plan.
Buildings 15 01924 g001
Figure 2. Limestone crushed stone concrete specimen.
Buildings 15 01924 g002
Figure 3. Scanning electron microscope specimen of limestone macadam concrete.
Buildings 15 01924 g003
Figure 4. GCTS RTX-2000 kN rock triaxial mechanical testing system and its schematic diagram: (a) RTX-2000 kN high-temperature and high-pressure electro-hydraulic servo rock triaxial testing machine; (b) Schematic diagram of the RTX-2000 kN high-temperature and high-pressure electro-hydraulic servo rock triaxial testing machine.
Buildings 15 01924 g004
Figure 5. Test process: (a) Sample installation; (b) Fitting the heat shrink tube; (c) Installing the Displacement transducers; (d) Lowering the pressure chamber.
Buildings 15 01924 g005
Figure 6. JEOL-JSM-IT800 thermal field emission scanning electron microscope.
Buildings 15 01924 g006
Figure 7. JEC-300FC ion sputtering device.
Buildings 15 01924 g007
Figure 8. Triaxial compression test results of limestone macadam concrete: (a) σ 3 = 4 MPa; (b) σ 3 = 8 MPa; (c) σ 3 = 12 MPa; (d) σ 3 = 16 MPa; (e) σ 3 = 20 MPa; (f) σ 3 = 24 MPa.
Buildings 15 01924 g008
Figure 9. Deviatoric stress–strain curve of limestone macadam concrete under different confining pressures.
Buildings 15 01924 g009
Figure 10. Relationship between confining pressure and axial peak strain.
Buildings 15 01924 g010
Figure 11. Relationship between confining pressure and ductility coefficient.
Buildings 15 01924 g011
Figure 12. Relationship between confining pressure and elastic modulus.
Buildings 15 01924 g012
Figure 13. Deviatoric stress–volumetric strain curves of limestone crushed stone concrete under different confining pressures.
Buildings 15 01924 g013
Figure 14. Fracture characteristics of limestone crushed stone concrete specimens under different confining pressures: (a) LC-04-1; (b) LC-08-2; (c) LC-12-1; (d) LC-16-1; (e) LC-20-2; (f) LC-24-2.
Buildings 15 01924 g014
Figure 15. Fitting results of confining pressure and peak stress.
Buildings 15 01924 g015
Figure 16. Mohr circles of the conventional triaxial compression test.
Buildings 15 01924 g016
Figure 17. Microscopic characteristics of interface transition zone of limestone crushed stone concrete under different confining pressures: (a) σ 3 = 4 MPa; (b) σ 3 = 8 MPa; (c) σ 3 = 12 MPa; (d) σ 3 = 16 MPa; (e) σ 3 = 20 MPa; (f) σ 3 = 24 MPa.
Buildings 15 01924 g017
Figure 18. Specific analysis process of pore structure information and fractal dimension of limestone crushed stone concrete under different confining pressures.
Buildings 15 01924 g018
Figure 19. Extraction of pores and cracks in limestone crushed stone concrete under different confining pressures: (a) σ 3 = 4 MPa; (b) σ 3 = 8 MPa; (c) σ 3 = 12 MPa; (d) σ 3 = 16 MPa; (e) σ 3 = 20 MPa; (f) σ 3 = 24 MPa.
Buildings 15 01924 g019
Figure 20. Fitting curves of porosity k of limestone crushed stone concrete under different confining pressures.
Buildings 15 01924 g020
Figure 21. Fitting curves of the fractal dimension d of limestone crushed stone concrete under different confining pressures.
Buildings 15 01924 g021
Figure 22. Fitting curves of maximum pore diameter d of limestone crushed stone concrete under different confining pressures.
Buildings 15 01924 g022
Figure 23. Relationship between σ3 and k, d, E, D, and σ1m of limestone crushed stone concrete.
Buildings 15 01924 g023
Figure 24. Relationship between σ1m and k, d, D of limestone crushed stone concrete.
Buildings 15 01924 g024
Figure 25. Relationship between E and k, d, D of limestone crushed stone concrete.
Buildings 15 01924 g025
Table 1. Mix proportion of limestone crushed stone concrete.
MaterialCementWaterMedium SandCrushed StoneAdmixtureFly Ash
Volume mass/kg/m3306.40161.00742.501113.003.0676.60
Table 2. Triaxial compression test results of limestone macadam concrete.
Number σ 3 /
MPa
H/
mm
D/
mm
σ 1 m /
MPa
ε 1 m /
10–2
ε 3 m /
10–2
ε v m /
10–2
E/
GPa
LC-04-14.0020010046.180.71−0.140.426.15
LC-08-28.0020010065.170.97−0.230.527.03
LC-12-112.0020010081.711.51−0.520.479.12
LC-16-116.00200100100.621.73−0.650.4311.84
LC-20-220.00200100113.621.36−0.610.1413.80
LC-24-224.00200100135.151.73−0.620.5114.39
Table 3. k, d, and D values of limestone crushed stone concrete under different confining pressures.
σ3/MPa4812162024
k/%11.510.58.47.84.64.1
d/μm22.68122.04915.6537.18210.5035.515
D1.4421.4271.4011.3031.2331.160
Disclaimer/Publisher’s Note: The statements, opinions and data contained in all publications are solely those of the individual author(s) and contributor(s) and not of MDPI and/or the editor(s). MDPI and/or the editor(s) disclaim responsibility for any injury to people or property resulting from any ideas, methods, instructions or products referred to in the content.

