Article

Study on Performance Index of Near-Zero-Energy Consumption Residence in Towns of Southern Jiangsu Province

1
School of Architecture, Nanjing Tech University, Nanjing 211816, China
2
College of Civil Engineering, Nanjing Tech University, Nanjing 211816, China
3
School of Fine Arts, Nanjing Xiaozhuang University, Nanjing 211171, China
4
School of Architecture and Regional Planning, Suzhou University of Science and Technology, Suzhou 215009, China
*
Author to whom correspondence should be addressed.
Buildings 2025, 15(11), 1922; https://doi.org/10.3390/buildings15111922
Submission received: 18 April 2025 / Revised: 24 May 2025 / Accepted: 28 May 2025 / Published: 2 June 2025
(This article belongs to the Section Building Energy, Physics, Environment, and Systems)

Abstract

This study initially examined the thermal comfort of rural residents in southern Jiangsu, analyzing their tolerance levels and expected temperature ranges during winter and summer. Subsequently, Design Builder 7.02.004 software was utilized to simulate the energy consumption of typical residential buildings. Furthermore, an orthogonal test method was employed to investigate the significant relationships among seven factors influencing building energy consumption in both winter and summer. These factors include external wall heat transfer coefficient, roof heat transfer coefficient, external window heat transfer coefficient, external window solar heat gain coefficient (SHGC), window-to-wall-area ratio, air tightness, and building orientation. Finally, based on the findings from the thermal comfort study, recommended passive design parameters for near-zero-energy residential buildings in southern Jiangsu were proposed. This provides valuable references for the future construction efforts of such buildings within this region.

1. Introduction

In recent years, there has been a growing interest in the research of zero-energy buildings (ZEBs). Since the oil crisis of the 1970s, both the engineering community and governments worldwide have engaged in discussions regarding indoor thermal environments and energy consumption in buildings, striving to develop new optimization strategies [1]. In terms of total energy consumption, residential buildings in China account for a significant portion of the energy used to maintain indoor thermal comfort [2]. ZEB aims to minimize energy consumption through the implementation of energy-saving technologies and renewable energy sources. Recently, ZEB has gained popularity as an effective means to reduce greenhouse gas emissions and address climate change challenges [3]. Furthermore, ZEB can lead to substantial savings on energy costs for residents [4]. However, it is important to note that the design and construction of ZEBs may be more complex and costly compared to traditional buildings. This complexity necessitates multidisciplinary collaboration among architects, engineers, builders, and energy experts. Despite these challenges, ZEB is still considered a crucial component in transitioning towards a more sustainable and low-carbon future. It holds significant potential for reducing both overall energy consumption and greenhouse gas emissions associated with maintaining indoor thermal comfort within buildings [5].
In order to promote the development of ZEB, relevant scholars and research institutions have conducted a lot of research on the factors affecting building energy consumption. Ferrara [6] optimized the building envelope and energy supply system to minimize energy consumption throughout the entire life cycle of the building. Jankovic [7] believes that the key to achieving net-zero carbon performance in residential buildings is to design the building envelope structure before introducing renewable energy systems. Zheng [8] used Design Builder software to analyze the thermal environment of residential buildings and found that simple envelope structures and single materials are the main reasons for poor indoor thermal environment in naturally ventilated buildings. Gaarder [9] determined the optimal insulation thickness for zero-energy buildings in cold climates to reduce energy consumption. Abdou’s [10] multi-objective optimization method makes it possible to achieve zero-energy consumption for all houses in Morocco. Huo [11,12] proposed that external shading systems play a crucial role in indoor thermal environments and used EnergyPlus 2013 software to comprehensively analyze and discuss the effects of different shading panel angles, directions, and window-to-wall ratios on indoor thermal environments in order to obtain the optimal shading layout for zero-energy buildings in different climate zones in China. Ventilation rate is also an important factor affecting the indoor thermal comfort environment of buildings. Bienvenido huertas [13] proposed that although the overall energy consumption of buildings with natural ventilation is reduced, at the same time, the satisfaction of indoor comfort is also reduced. Even natural ventilation buildings in mild climate areas still have problems in maintaining indoor comfort [14]. Therefore, in the design of ZEBs, it is essential to take into account the thermal comfort of occupants, as this factor is directly linked to energy consumption.
China possesses a vast territory, and its complex geographical environment results in significant disparities in environmental and economic development across various climatic regions [15]. Over the past few decades, numerous researchers have investigated indoor thermal comfort across different types of buildings nationwide, contributing valuable insights to architectural design, energy conservation, and thermal comfort studies [16,17,18,19,20,21]. However, most of these investigations primarily focus on urban public buildings [21]. In contrast to urban residents, rural inhabitants exhibit distinct living habits and thermal expectations influenced by socio-economic, physiological, and psychological factors, among others. These characteristics demonstrate strong regional variations [22,23,24,25,26,27]. Zhang [22] conducted an investigation into the indoor thermal and humidity environment of traditional residential buildings in the northern Dong region of China. Their findings indicate that the indoor thermal comfort of these traditional residences is not entirely satisfactory. Xiong [23] conducted a study on the differences in thermal comfort and related adaptive behaviors between urban and rural residents in regions characterized by hot summer and cool winter (HSCW). Their research indicates that rural residents exhibit a greater tolerance for winter cold; however, their tolerance for summer heat is comparatively lower. Consequently, they proposed an effective adaptive strategy to address this issue. However, China’s “Technical Standard for Nearly Zero Energy Buildings” (GB/T 51350-2019) [28] stipulates fixed values for indoor environmental parameters, as shown in Table 1. This standard fails to account for the variations in thermal comfort temperatures among different climate zones and diverse populations.
Southern Jiangsu stands out as one of the most economically dynamic regions in China. It is well positioned to lead the way in achieving energy-saving goals for nearly zero-energy consumption buildings. Nevertheless, there is a scarcity of research concerning nearly zero-energy consumption structures within villages and towns in southern Jiangsu. Based on surveys conducted with permanent residents of southern Jiangsu, this paper analyzes the primary and secondary relationships between the thermal performance of various envelope structures and building energy consumption while ensuring resident comfort. It further examines performance indicators pertinent to nearly zero-energy residential buildings situated in rural areas characterized by hot summers and cold winters—specifically represented by southern Jiangsu—and provides recommended values aimed at guiding the construction and development of such residential buildings within rural contexts.

2. Materials and Methods

2.1. Description of the Study Area

2.1.1. Geographic Information

Southern Jiangsu is situated in the heart of the Yangtze River Delta, along China’s southeastern coast. It shares borders with Shanghai to the east, Anhui to the west, and Zhejiang to the south. This region represents the most advanced area within Jiangsu Province and ranks among the most developed and modernized zones in China. Southern Jiangsu encompasses the cities of Nanjing, Suzhou, Wuxi, Changzhou, and Zhenjiang, covering a total area of 27,872 square kilometers. This accounts for 27.17% of Jiangsu Province’s total land area, where plains occupy 50.45%, hills make up 28.4%, and water bodies cover 21.15%. The region boasts an expansive Taihu Plain, a dense network of waterways, and the Yangtze River flowing from east to west. In 2019, the total GDP reached 5.66 trillion yuan, with per capita GDP surpassing 150,000 yuan—nearly matching that of developed nations. Urbanization levels exceed 70%, and all counties (cities) rank among China’s top 100 counties by comprehensive strength, including seven counties (cities) in the top 10. For this study, the focus areas are rural towns located in Lishui (Nanjing), Liyang (Changzhou), and Taicang (Suzhou).

2.1.2. Climate Information

The southern Jiangsu area is located in the mid-latitude region along the eastern coast of the Asian continent and features a subtropical humid monsoon climate. This climate is influenced by various factors such as solar radiation, atmospheric circulation, and the distinct geographical and topographical features of the region. Consequently, the area experiences four distinct seasons, significant monsoon activity, cold winters, and hot summers. Temperatures in spring can be variable, whereas autumn is typically cool and dry. Precipitation and warmth coincide during the same season, with substantial rainfall concentrated in specific periods, especially during the plum rain season. Moreover, the region benefits from abundant sunshine and warmth throughout the year. In southern Jiangsu, the average annual temperature falls between 13.6 °C and 16.1 °C, with winter averages around 3.0 °C. The lowest temperatures recorded across the region generally occur in January or February, while summer averages reach approximately 25.9 °C. The highest temperatures are usually observed in July or August. Spring has an average temperature of 14.9 °C, and autumn averages about 16.4 °C, making both seasons relatively mild and pleasant.

2.2. Research Methods

2.2.1. Sample Sources and Survey Methods

However, due to differences in living habits and microclimates, the thermal tolerance and temperature expectations of rural residents are slightly different from those of urban residents. In the design of near-zero-energy buildings in rural areas, the setting of indoor temperature should be differentiated. In order to obtain the average heat acceptance rate of rural residents in the southern Jiangsu region and the expected temperature in winter and summer, field visits were conducted to villages and towns in Nanjing Lishui, Changzhou Liyang, Suzhou Taicang, and other places in winter and summer to conduct comfort surveys and data analysis. This survey collected background information from 264 and 258 permanent residents of villages and towns in summer and winter, respectively. The statistical results are shown in Table 2. By measuring indoor and outdoor physical parameters, it was statistically found that the highest indoor temperature in Sunan Village during summer is 36 °C, the average temperature is 31 °C, and the minimum value is 27 °C. The maximum indoor temperature in winter is 14 °C, the average temperature is 6.7 °C, and the minimum value is only 3 °C.

2.2.2. Thermal Sensation Voting Survey and Analysis

  • Investigation on the thermal comfort of rural residents in southern Jiangsu:
The thermal comfort of rural residents in southern Jiangsu Province was evaluated using the thermal sensation voting (TSV) method, which quantifies human thermal perception under specific temperature conditions. The TSV survey utilized a seven-point scale, aligning with the scale recommended by ASHRAE [29]. Numerous researchers [30,31,32] have identified TSV as a critical metric for assessing thermal comfort. According to the summer survey results (Figure 1), approximately 52.7% of residents reported dissatisfaction with their indoor thermal environment, while only 11.1% found it acceptable. In contrast, the winter survey showed that for unheated rooms, nearly 40% of residents were dissatisfied with the indoor thermal conditions, and about 30% considered them acceptable. For heated rooms, roughly 50% of residents expressed dissatisfaction with the indoor thermal environment, while another 50% perceived it as moderate.
  • Tolerance temperature analysis:
Collecting and organizing the voting values regarding residents’ perceptions of indoor thermal comfort at varying indoor temperatures during winter and summer, we obtained the heat unacceptability rates for rural residents in both seasons. The fitting analysis of these research results is presented in Figure 2.
The regression equation between the unacceptable summer heat rate of rural residents and indoor temperature is:
y = 0.039x2 − 0.16x + 1.46,
According to the equation between the unacceptable heat rate in summer and indoor temperature, when the indoor temperature is below the range of 30.2 °C, it can meet the thermal comfort level of 80% of residents in villages and towns in southern Jiangsu.
The regression equation between the unacceptable winter heat rate of rural residents and indoor temperature is:
y = 0.0029x2 − 0.108x + 1.069,
According to the equation between the unacceptable cold rate in winter and indoor temperature, when the indoor temperature is above the 11.5 °C range, it can meet the thermal comfort level of 80% of residents in villages and towns in southern Jiangsu.
  • Expected temperature analysis:
At various indoor temperatures, the percentage of individuals whose expected thermal environment differs from the current thermal conditions—specifically, those with anticipated temperatures either higher or lower than the present temperature—is calculated and illustrated on a single graph. The fitting results are presented in Figure 3.
According to Figure 3a, the fitting formulas for the percentage of people with expected summer temperatures higher or lower than the current temperature are as follows:
y = 0.148x − 4.00 R2 = 0.95
y = −0.014x + 0.45 R2 = 0.82
To validate the accuracy of the regression model, an analysis of variance was conducted. The results of this analysis are presented in Table 3. The results indicate a significant linear relationship between the independent and dependent variables in both models.
According to Figure 3b, the fitting formulas for the percentage of people with expected winter temperatures higher or lower than the current temperature are as follows:
y = −0.118x + 2.05 R2 = 0.98
y = 0.0319x − 0.36 R2 = 0.73
To validate the accuracy of the regression model, an analysis of variance was conducted. The results of this analysis are presented in Table 4. The results indicate a significant linear relationship between the independent and dependent variables in both models.
By calculating the expected temperature, it was found that the anticipated high temperatures for rural residents during winter and summer are 16.06 °C and 27.92 °C, respectively. Given the discrepancies with the indoor environmental parameters outlined in China’s Technical Standard for Nearly Zero Energy Buildings (GB/T 51350-2019) in Table 1, this indicates that residents of villages and towns in southern Jiangsu exhibit a greater tolerance to temperature variations.

2.2.3. Energy Consumption Simulation and Experimental Scheduling

Some studies [11,33,34] show that energy consumption software (such as Energy Plus, CFD fluent, Design Builder and other energy consumption simulation software) can be used to simulate the relationship between the thermal performance of the building envelope and the indoor thermal environment. Design Builder energy consumption simulation software is developed based on Energy Plus software. When buildings are exposed to different environments and operating conditions, the tool can simulate the use of energy, such as heating and cooling. This article uses the Design Builder energy consumption simulation software to analyze the impact of different influencing factors on building energy consumption through orthogonal experiments, providing targeted recommendations for the construction of near-zero-energy residential buildings.
  • Build model:
Southern Jiangsu is the first to carry out new rural construction in China. Rural residential buildings have abandoned the traditional different construction modes and adopted the construction mode of unified planning. In this paper, the typical residential building units in southern Jiangsu are selected for survey, mapping, and performance index research. The details of typical residential building units in southern Jiangsu are shown in Table 5.
A typical residential building is divided into two floors, with the rooms on the first floor mainly serving as the main hall, bedrooms for the elderly, kitchen, dining room, bathroom, etc. The main functions of the second floor are the master bedroom, secondary bedroom, bathroom, etc. The roof is a 45° sloping roof, with suspended ceilings in the second-floor rooms and no attic. The total construction area is 145 square meters, and the windows are distributed in a north–south orientation. The comprehensive window-to-wall-area ratio is 10%, as shown in Figure 4.
  • Experimental arrangement:
1.
Experimental Purpose and Indicators
The purpose of this experiment is to determine the key factors of passive design that affect building energy consumption. According to the requirements for the technical parameters of rural buildings and near-zero-energy consumption buildings in southern Jiangsu, seven main parameters are selected. The seven factors are external wall heat transfer coefficient, roof heat transfer coefficient, external window heat transfer coefficient, solar heat gain coefficient (SHGC), window-to-wall-area ratio, air exchange rate (building air tightness), and building orientation. The annual unit building area cooling and heating capacity was used as the experimental indicator, and the factor levels were selected as shown in Table 6. Meanwhile, in order to reduce the error of the experiment, a blank column H is added for error analysis
The values of the three influencing factors are based on the field survey and measurement results of rural buildings in southern Jiangsu (Table 4) and the provisions of China’s Technical Standard for Nearly Zero Energy Buildings (GB/T 51350-2019) [28]. The technical standards regarding the maintenance of structural technical parameters are outlined in Table 7.
2.
Refinement of Outdoor Meteorological Parameter Settings
The climate simulation parameters are derived from the typical annual meteorological data files included in the energy consumption simulation software, Design Builder. This software encompasses meteorological data for 260 cities across China. In this study, we selected the meteorological parameters of Nanjing as representative outdoor climatic conditions.
3.
Refinement of Indoor Temperature Environment Settings
The indoor temperature for winter is set at 16.06 °C, while the baseline room temperature is established at 11.5 °C. In summer, the indoor temperature is designated as 27.92 °C, with a baseline room temperature of 30.2 °C. Based on the living habits and usage patterns of electrical appliances among residents in regions characterized by hot summers and cold winters, specific conditions regarding human activity and lighting equipment are defined for each room. The heating and cooling systems are configured as split-type air conditioners. It should be noted that no heating or cooling will be provided in stairwells, kitchens, equipment rooms, or restrooms. Based on the living habits of rural residents in southern Jiangsu, a typical daily living pattern is set as follows: Bedroom: from 22:00 to 07:00 (every day), with 1–2 people in each room. Living room/dining room: 08:00–12:00, 16:00–20:00 (daily), 2–4 people. The efficiency parameters of the HVAC system comply with the provisions of the Chinese energy efficiency standard GB 21455-2019 [35]. Cooling mode: coefficient of performance = 3.2, set temperature = 27.92 °C (meeting the expected thermal comfort in summer). Heating mode: coefficient of performance = 2.8, set temperature = 16.06 °C (meeting the expected thermal comfort in winter). Stairwells, kitchens, and bathrooms are not heated/cooled, and they rely on natural ventilation.
4.
Experimental Process Design
This article employs a three-level analysis for each factor, utilizing an orthogonal table designed with SPSS 27.0 software. The design outcomes indicate that for eight factors, the required number of experiments at three levels is 27. The arrangement of the orthogonal experiments is presented in Table 8.

3. Results

3.1. Simulation Results of Building Energy Consumption

To simulate the energy consumption of buildings under various combinations of influencing factors, we utilize Nanjing’s meteorological parameters for outdoor conditions, employing split air conditioning systems for both cooling and heating indoors. The temperature settings for air conditioning during winter and summer will be designated as the target research temperatures. During the experiment, external sunshade louvers will be added to the outer windows; these louvers will remain closed in summer to minimize solar radiation heat gain, and they will be opened in winter to enhance solar radiation heat absorption. In the simulation process, adjustments can be made to the window-to-wall ratio by modifying the width of existing external windows without altering their quantity. The results of this simulation are presented in Table 9.
By comparing the energy consumption simulation results with China’s Technical Standard for Nearly Zero Energy Buildings (GB/T 51350-2019) energy efficiency indicators for buildings with near-zero energy consumption (Table 10), it can be seen that the building energy consumption is close to the threshold specified in the standards, which proves the accuracy of the model and the feasibility of the study.

3.2. Analysis of Orthogonal Test Results

After the completion of the experiment, an experimental plan will be implemented to assess the significance of each influencing factor on the results and to identify the optimal combination of these factors. This experiment involves eight factors, each with three levels. An orthogonal design is employed, resulting in nine experiments for each level. The outcomes from these experiments are aggregated to compute the sum of results for each factor at corresponding levels. The level associated with the lowest K value is deemed optimal for that particular factor.
  • Winter working conditions:
According to the calculation results (Table 11), the second level of factor A is the best, the second level of factor B is the best, the second level of factor C is the best, the third level of factor D is the best, the second level of factor E is the best, the first level of factor F is the best, and the second level of factor G is the best. Utilizing the minimum heating energy consumption values obtained for each factor allows us to propose a potential optimal combination for experimental schemes as A2B2C2D3E2F1G2.
  • Summer working conditions:
According to the calculation results (Table 12), the first level of factor A is the best, the second level of factor B is the best, the second level of factor C is the best, the third level of factor D is the best, the second level of factor E is the best, the third level of factor F is the best, and the first level of factor G is the best. Utilizing the minimum heating energy consumption values obtained for each factor allows us to propose a potential optimal combination for experimental schemes as A1B2C2D2E2F3G1.
We calculate the range of the sum of results obtained from each factor at various levels, which represents the difference between the maximum and minimum values of these results. Taking factor A (heating) as an example, the calculated range is 5.38. Employing the same methodology, we compute the ranges corresponding to the other six factors. The calculation results are presented in Table 8. Based on these derived range values, we identify the influencing factors pertinent to this experiment.
  • For winter conditions:
F > E > D > G > C > A > B
A: external wall heat transfer coefficient; B: roof heat transfer coefficient; C: external window heat transfer coefficient; D: external window solar heat gain coefficient; E: window-to-wall-area ratio; F: air exchange rate (building air tightness); G: building orientation.
To ensure the accuracy of the results, an analysis of variance (Table 13) and residual diagnosis (Table 14) were conducted on the orthogonal experimental results. The analysis of variance verified the significance of each factor to the results, and the residual diagnosis was used to determine whether the assumptions of the statistical model held.
  • For summer conditions:
E > D > G > B > A > C > F
A: external wall heat transfer coefficient; B: roof heat transfer coefficient; C: external window heat transfer coefficient; D: external window solar heat gain coefficient; E: window-to-wall-area ratio; F: air exchange rate (building air tightness); G: building orientation.
To ensure the accuracy of the results, an analysis of variance (Table 15) and residual diagnosis (Table 16) were conducted on the orthogonal experimental results. The analysis of variance verified the significance of each factor on the results, and the residual diagnosis was used to determine whether the assumptions of the statistical model held.
  • Result analysis
(1) Regions characterized by hot summers and cold winters necessitate both winter insulation and effective indoor heat dissipation; thus, the significance of factors influencing winter and summer working conditions varies considerably.
(2) Achieving an energy consumption standard of less than 8 kWh/m2 for winter heating is more challenging than meeting the standard of less than 23.2 kWh/m2 for summer cooling in order to attain near-zero energy consumption in rural residential areas of southern Jiangsu.

4. Discussion

According to China’s Technical Standard for Nearly Zero Energy Buildings (GB/T 51350-2019), the area ratio of single-facing windows to walls in each direction should not exceed 0.40 for both the south and north orientations, while the east and west directions should not exceed 0.30. In typical rural residential areas of southern Jiangsu, the window-to-wall-area ratios facing south and north are approximately 0.3 and 0.16, respectively. The overall window-to-wall-area ratio is around 0.12, which falls below the stipulated standards. Consequently, no key analysis will be performed; instead, a quantitative assessment will be conducted regarding the impact of building air tightness, building orientation, external wall heat transfer coefficient, and external window heat transfer coefficient on energy consumption.

4.1. Optimization Analysis of Air Tightness of Outer Envelope Structure

China’s Technical Standard for Nearly Zero Energy Buildings (GB/T 51350-2019) provide recommended values for thermal parameters of enclosure structures in hot summer and cold winter areas, as shown in Table 17.
The technical parameters of each enclosure structure are taken as the lowest recommended values in China’s Technical Standard for Nearly Zero Energy Buildings (GB/T 51350-2019). The energy consumption of rural residential buildings is simulated and analyzed under different indoor air exchange rate (building air tightness), as shown in Table 18.
The simulation results show that to achieve the goal of annual heating consumption of less than 8 kWh/m2 in winter for rural residential buildings in southern Jiangsu, the building’s air exchange rate (building air tightness) needs to be ≤0.4 ac/h.

4.2. Optimization Analysis of Building Orientation

A simulation analysis was conducted on the energy consumption of typical residential buildings in villages and towns in southern Jiangsu with different orientations, where 0 represents facing south, a negative sign represents south west, and a positive sign represents south east. The simulation scheme and results are shown in Table 19.
Experiments have shown that typical residential buildings in villages and towns in southern Jiangsu have the lowest energy consumption when facing south by west at an angle of 10 degrees, which is the optimal orientation.

4.3. Optimization Analysis of Thermal Performance of Exterior Walls

The thermal parameters of external windows and roofs are taken as the optimal values of thermal performance recommended by China’s Technical Standard for Nearly Zero Energy Buildings (GB/T 51350-2019). The building orientation is set to 10 degrees south by west, and the air exchange rate is set to 0.1 ac/h. Simulation tests are conducted on residential energy consumption under different heat transfer coefficients of the exterior walls. The test plan and results are shown in Table 20.
Experiments have shown that when the heat transfer coefficient of the exterior wall is between 0.15 and 0.45W/m2 · K, residential buildings can achieve near-zero-energy consumption targets. Compared with the thermal performance recommendations for exterior walls in China’s Technical Standard for Nearly Zero Energy Buildings (GB/T 51350-2019), the experimental results have a wider range of values and increased selectivity in exterior wall construction.

4.4. Optimization Analysis of Thermal Performance of External Windows

The thermal parameters of the exterior walls and roofs are taken as the optimal values for thermal performance recommended by China’s Technical Standard for Nearly Zero Energy Buildings (GB/T 51350-2019). The building orientation is set to 10 degrees south by west, and the air exchange rate is set to 0.1. Simulation tests are conducted on residential energy consumption under different heat transfer coefficients of the external windows. The test plan and results are shown in Table 21.
Experiments have shown that when the heat transfer coefficient of external windows is less than 3 W/(m2·K), residential buildings can achieve near-zero-energy consumption goals. Compared with the thermal performance recommendations for external walls in China’s Technical Standard for Nearly Zero Energy Buildings (GB/T 51350-2019), the range of experimental results is wider, and the selectivity of external window construction is increased.

4.5. Optimization Analysis of Roof Thermal Performance

When the thermal parameters of the external windows are set to the optimal values of the thermal performance recommended by China’s Technical Standard for Nearly Zero Energy Buildings (GB/T 51350-2019), the building orientation is set to 10 degrees south by west, the air exchange rate is set to 0.1 ac/h, and the roof heat transfer coefficient is between 0.15 and 1.5 W/(m2·K), the near-zero-energy consumption goal can be achieved. A simulation test was conducted on residential energy consumption with a ventilation rate of 0.3 ac/h. The test plan and results are shown in Table 22.
Experiments have shown that when the heat transfer coefficient of the roof is between 0.15 and 1.35 W/(m2·K), residential buildings can easily achieve the goal of near-zero-energy consumption. Compared with China’s Technical Standard for Nearly Zero Energy Buildings (GB/T 51350-2019), the range of thermal performance values for roofs is larger, and the selectivity of roof construction is increased.

5. Conclusions

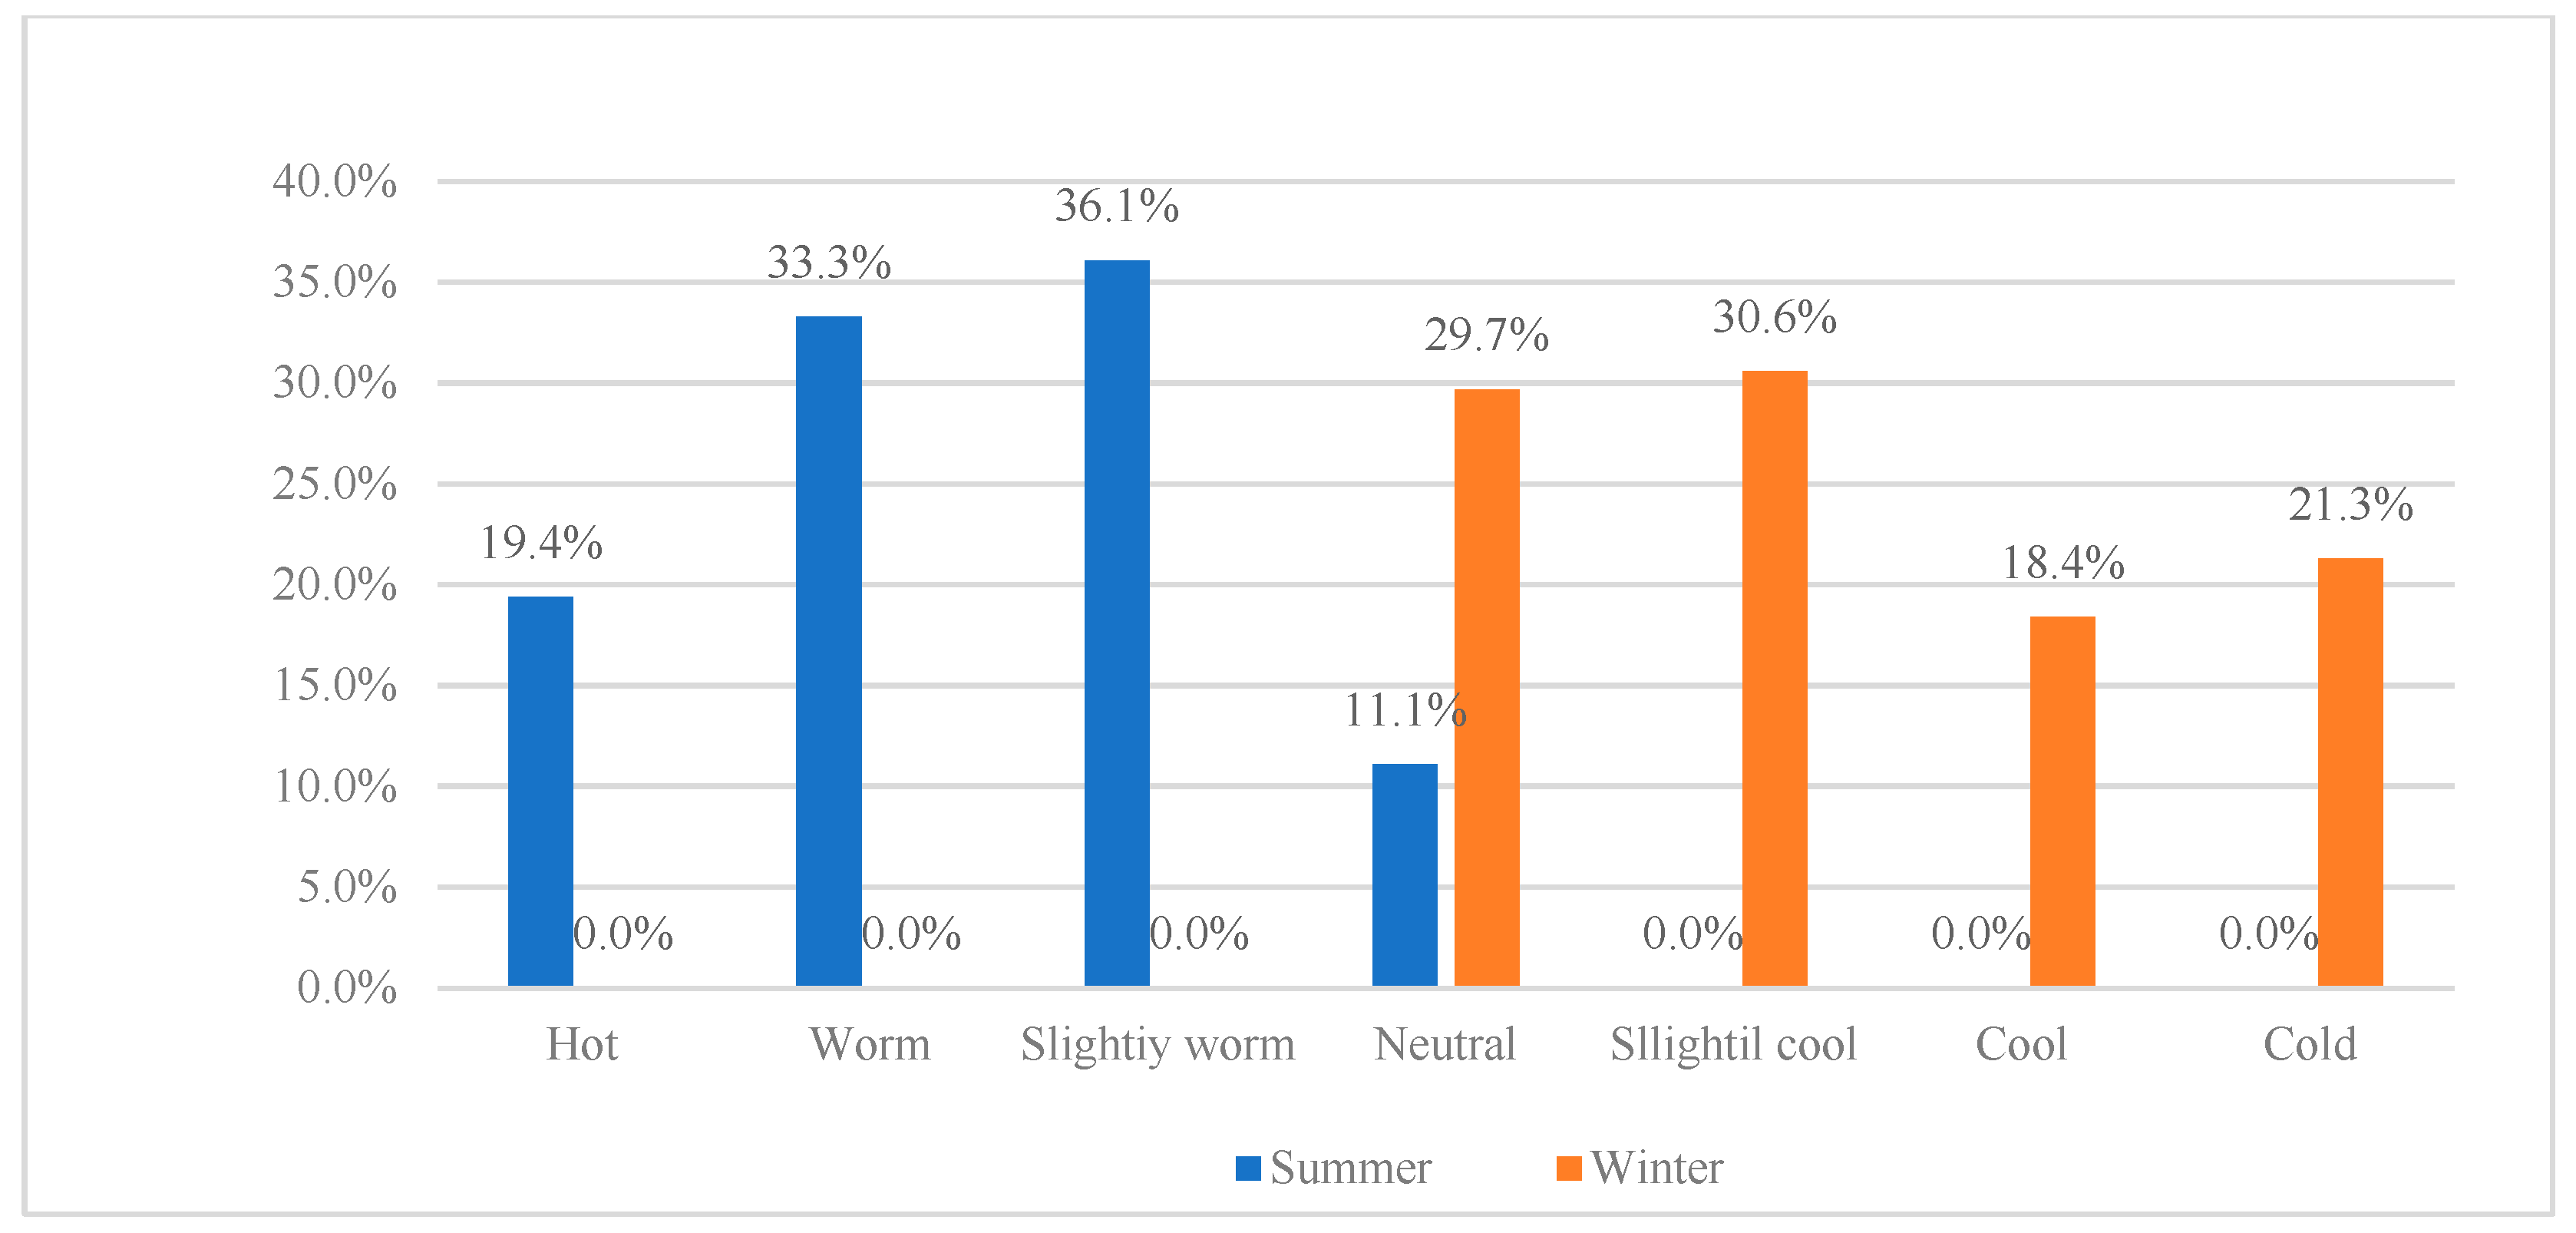
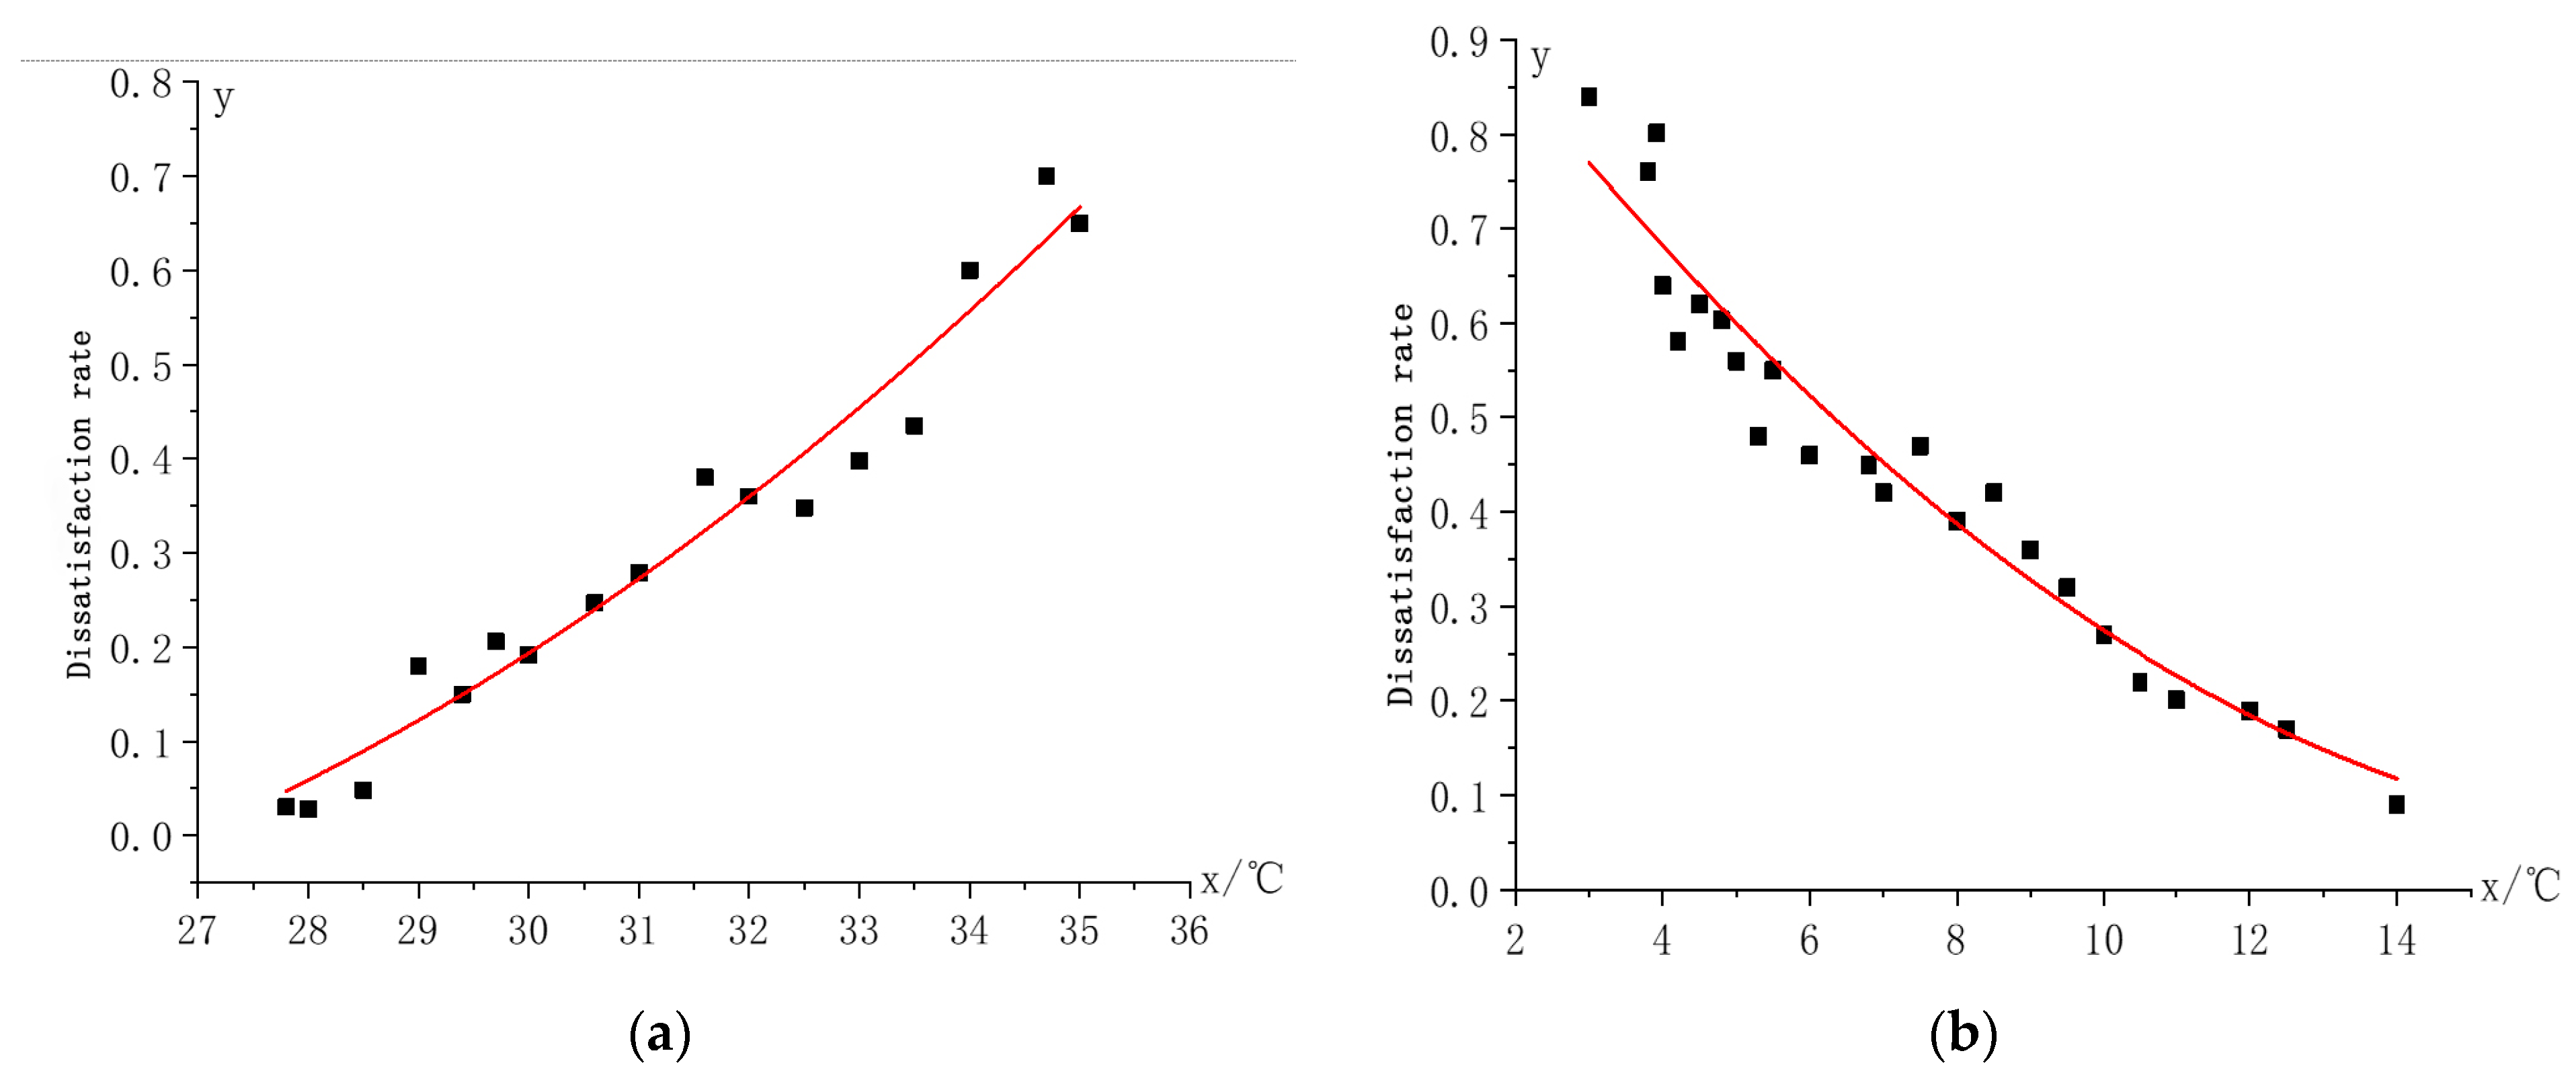
In this paper, the TSV method is used to investigate the thermal comfort of rural residents in southern Jiangsu, and the tolerance temperature and expected temperature of rural residents in southern Jiangsu in winter and summer are obtained. Then, according to the survey results of rural housing in southern Jiangsu, a typical residential building model in southern Jiangsu is established. The influencing factors of building energy consumption are analyzed using the method of orthogonal test, and the main influencing factors are quantitatively studied. The main conclusions are as follows:
(1) In summer, when the indoor temperature is below 30.2 °C, it can meet the thermal comfort level for 80% of residents in southern Jiangsu, with an expected temperature of 27.92 °C. In winter, when the indoor temperature is within the range of 11.5 °C, it can also satisfy the thermal comfort level for 80% of residents in southern Jiangsu, with an expected temperature of 16.06 °C. This indicates that there are discrepancies between the expected and tolerated temperatures of rural residents in southern Jiangsu and the requirements for indoor thermal environments outlined in China’s Technical Standards for Nearly Zero Energy Buildings (GB/T 51350-2019) [28], which stipulate a minimum winter temperature greater than 20 °C and a maximum summer temperature less than 26 °C (Table 1).
(2) For winter working conditions, the importance of factors affecting building energy consumption is as follows:
Building air tightness > building window-to-wall ratio > external window solar heat gain coefficient > building orientation > external window heat transfer coefficient > roof heat transfer coefficient > external wall heat transfer coefficient.
For summer working conditions, the importance of factors affecting building energy consumption is as follows:
Building window-to-wall ratio > external window solar heat gain coefficient > building orientation > roof heat transfer coefficient > external wall heat transfer coefficient > external window heat transfer coefficient > building air tightness.
(3) Through the analysis of energy consumption simulation results, it is evident that for residential buildings in southern Jiangsu towns, achieving a winter heating energy consumption standard of less than 8 kWh/(m2·a) is more challenging than meeting the summer cooling energy consumption standard of less than 23.2 kWh/(m2·a). Therefore, in the design of near-zero-energy residential buildings in southern Jiangsu towns, particular attention should be given to the impact of passive design strategies on winter energy consumption metrics.
(4) Through the quantitative analysis of seven important factors in the passive design of zero-energy consumption buildings, the design parameter values of near-zero-energy consumption residential buildings in southern Jiangsu are obtained, as shown in Table 23. Compared with the recommended values for technical parameters in China’s Technical Standard for Nearly Zero Energy Buildings (GB/T 51350-2019), the range of recommended values given in this article is larger, and the selectivity of building construction is increased.

Author Contributions

Conceptualization, L.J.; methodology, L.J. and W.L.; software, L.J.; validation, L.Z., J.X. and W.L.; formal analysis, L.J. and L.Z.; investigation, L.J.; resources, L.J. and L.Z.; data curation, L.J.; writing—original draft preparation, L.J. and L.Z.; writing—review and editing, L.Z., W.L., J.X. and D.L.; visualization, L.Z., J.X., W.L. and D.L.; supervision, J.X., W.L. and D.L.; project administration, J.X., W.L. and D.L.; funding acquisition, L.J., W.L. and D.L. All authors have read and agreed to the published version of the manuscript.

Funding

This research was funded by the Young Scientists Fund of National Natural Science Foundation of China, grant number 51908393; Science and Technology Project Ministry of Housing and Urban–Rural Development of China, grant number K12018230.

Data Availability Statement

Data are contained within the article.

Conflicts of Interest

The authors declare no conflicts of interest.

Abbreviations

The following abbreviations are used in this manuscript:
ZEBZero Energy Building
SHGCSolar Heat Gain Coefficient
HSCWHot Summer and Cool Winter
TSVThermal Sensation Voting

References

  1. Papadopoulos, A.M. Forty Years of Regulations on the Thermal Performance of the Building Envelope in Europe: Achievements, Perspectives and Challenges. Energy Build. 2016, 127, 942–952. [Google Scholar] [CrossRef]
  2. Belussi, L.; Barozzi, B.; Bellazzi, A.; Danza, L.; Devitofrancesco, A.; Fanciulli, C.; Ghellere, M.; Guazzi, G.; Meroni, I.; Salamone, F.; et al. A Review of Performance of Zero Energy Buildings and Energy Efficiency Solutions. J. Build. Eng. 2019, 25, 100772. [Google Scholar] [CrossRef]
  3. Mohammed, G.A.; Mabrouk, M.; He, G.; Abdrabo, K.I. Towards Sustainable Cities: A Review of Zero Energy Buildings Techniques and Global Activities in Residential Buildings. Energies 2023, 16, 3775. [Google Scholar] [CrossRef]
  4. Imessad, K.; Derradji, L.; Messaoudene, N.A.; Mokhtari, F.; Chenak, A.; Kharchi, R. Impact of Passive Cooling Techniques on Energy Demand for Residential Buildings in a Mediterranean Climate. Renew. Energy 2014, 71, 589–597. [Google Scholar] [CrossRef]
  5. Wei, J.; Li, J.; Zhao, J.; Wang, X. Hot Topics and Trends in Zero-Energy Building Research—A Bibliometrical Analysis Based on CiteSpace. Buildings 2023, 13, 479. [Google Scholar] [CrossRef]
  6. Ferrara, M.; Rolfo, A.; Prunotto, F.; Fabrizio, E. EDeSSOpt—Energy Demand and Supply Simultaneous Optimization for Cost-Optimized Design: Application to a Multi-Family Building. Appl. Energy 2019, 236, 1231–1248. [Google Scholar] [CrossRef]
  7. Jankovic, L.; Bharadwaj, P.; Carta, S. How Can UK Housing Projects Be Brought in Line With Net-Zero Carbon Emission Targets? Front. Built Environ. 2021, 7, 754733. [Google Scholar] [CrossRef]
  8. Zheng, W.; Wei, F.; Su, S.; Cai, J.; Wei, J.; Hu, R. Effect of the Envelope Structure on the Indoor Thermal Environment of Low-Energy Residential Building in Humid Subtropical Climate: In Case of Brick–Timber Vernacular Dwelling in China. Environ. Technol. Innov. 2022, 28, 102884. [Google Scholar] [CrossRef]
  9. Gaarder, J.E.; Friis, N.K.; Larsen, I.S.; Time, B.; Møller, E.B.; Kvande, T. Optimization of Thermal Insulation Thickness Pertaining to Embodied and Operational GHG Emissions in Cold Climates—Future and Present Cases. Build. Environ. 2023, 234, 110187. [Google Scholar] [CrossRef]
  10. Abdou, N.; El Mghouchi, Y.; Hamdaoui, S.; El Asri, N.; Mouqallid, M. Multi-Objective Optimization of Passive Energy Efficiency Measures for Net-Zero Energy Building in Morocco. Build. Environ. 2021, 204, 108141. [Google Scholar] [CrossRef]
  11. Huo, H.; Xu, W.; Li, A.; Cui, G.; Wu, Y.; Liu, C. Field Comparison Test Study of External Shading Effect on Thermal-Optical Performance of Ultralow-Energy Buildings in Cold Regions of China. Build. Environ. 2020, 180, 106926. [Google Scholar] [CrossRef]
  12. Huo, H.; Xu, W.; Li, A.; Lv, Y.; Liu, C. Analysis and Optimization of External Venetian Blind Shading for Nearly Zero-Energy Buildings in Different Climate Regions of China. Solar Energy 2021, 223, 54–71. [Google Scholar] [CrossRef]
  13. Bienvenido-Huertas, D.; Sánchez-García, D.; Rubio-Bellido, C. Analysing Natural Ventilation to Reduce the Cooling Energy Consumption and the Fuel Poverty of Social Dwellings in Coastal Zones. Appl. Energy 2020, 279, 115845. [Google Scholar] [CrossRef]
  14. Ameur, M.; Kharbouch, Y.; Mimet, A. Optimization of Passive Design Features for a Naturally Ventilated Residential Building According to the Bioclimatic Architecture Concept and Considering the Northern Morocco Climate. Build. Simul. 2020, 13, 677–689. [Google Scholar] [CrossRef]
  15. Wang, Z.; Ji, Y.; Ren, J. Thermal Adaptation in Overheated Residential Buildings in Severe Cold Area in China. Energy Build. 2017, 146, 322–332. [Google Scholar] [CrossRef]
  16. Hawks, M.A.; Cho, S. Review and Analysis of Current Solutions and Trends for Zero Energy Building (ZEB) Thermal Systems. Renew. Sustain. Energy Rev. 2024, 189, 114028. [Google Scholar] [CrossRef]
  17. Lu, M.L.; Sun, Y.J.; Kokogiannakis, G.; Ma, Z.J. Design of Flexible Energy Systems for Nearly/Net Zero Energy Buildings under Uncertainty Characteristics: A Review. Renew. Sustain. Energy Rev. 2024, 205, 114828. [Google Scholar] [CrossRef]
  18. Yang, Y.; Wang, Z.; Zhou, F.; Liu, C.; Duanmu, L.; Zhai, Y.; Lian, Z.; Cao, B.; Zhang, Y.; Zhou, X.; et al. Comparison of Indoor Thermal Environments and Human Thermal Responses in Northern and Southern China during Winter. J. Build. Eng. 2024, 82, 108131. [Google Scholar] [CrossRef]
  19. Ibrahim, M.; Harkouss, F.; Biwole, P.; Fardoun, F.; Ouldboukhitine, S. Building Retrofitting towards Net Zero Energy: A Review. Energy Build. 2024, 322, 114707. [Google Scholar] [CrossRef]
  20. Yang, L.; Wang, F.; Zhao, S.; Gao, S.; Yan, H.; Sun, Z.; Lian, Z.; Duanmu, L.; Zhang, Y.; Zhou, X.; et al. Comparative Analysis of Indoor Thermal Environment Characteristics and Occupants’ Adaptability: Insights from ASHRAE RP-884 and the Chinese Thermal Comfort Database. Energy Build. 2024, 309, 114033. [Google Scholar] [CrossRef]
  21. Xu, J.; Meng, W.; Yang, W.; Lu, Z.; Xie, G.; Wang, X. Impact of Transition Spaces on the Indoor Thermal Environment: A Case Study of Traditional Dwellings in Southern Shaanxi, China. J. Build. Eng. 2024, 95, 110283. [Google Scholar] [CrossRef]
  22. Zhang, F.; Shi, L.; Liu, S.; Shi, J.; Ma, Q.; Zhang, J. Climate Adaptability Based on Indoor Physical Environment of Traditional Dwelling in North Dong Areas, China. Sustainability 2022, 14, 850. [Google Scholar] [CrossRef]
  23. Xiong, Y.; Liu, J.; Kim, J. Understanding Differences in Thermal Comfort between Urban and Rural Residents in Hot Summer and Cold Winter Climate. Build. Environ. 2019, 165, 106393. [Google Scholar] [CrossRef]
  24. Jin, Y.; Zhang, N. Comprehensive Assessment of Thermal Comfort and Indoor Environment of Traditional Historic Stilt House, a Case of Dong Minority Dwelling, China. Sustainability 2021, 13, 9966. [Google Scholar] [CrossRef]
  25. Li, E.; Zhu, J. Parametric Analysis of the Mechanism of Creating Indoor Thermal Environment in Traditional Houses in Lhasa. Build. Environ. 2022, 207, 108510. [Google Scholar] [CrossRef]
  26. Timur, B.A.; Başaran, T.; İpekoğlu, B. Thermal Retrofitting for Sustainable Use of Traditional Dwellings in Mediterranean Climate of Southwestern Anatolia. Energy Build. 2022, 256, 111712. [Google Scholar] [CrossRef]
  27. Zou, Y.; Guo, J.; Xia, D.; Lou, S.; Huang, Y.; Yang, X.; Zhong, Z. Quantitative Analysis and Enhancement on Passive Survivability of Vernacular Houses in the Hot and Humid Region of China. J. Build. Eng. 2023, 71, 106431. [Google Scholar] [CrossRef]
  28. GB/T 51350-2019; The National Standard “Technical Standard for Nearly Zero Energy Buildings”. Ministry of Housing and Urban-Rural Development of the People’s Republic of China (MOHURD): Beijing, China, 2019.
  29. ANSI/ASHRAE Standard 55-2017; Thermal Environmental Conditions for Human Occupancy. American Society of Heating. Refrigerating and Air-Conditioning Engineers: Atlanta, GA, USA, 2017.
  30. Wang, M.; Li, Q.; Wang, F.; Yuan, Z.; Wang, L.; Zhou, X. Residential Indoor Thermal Environment Investigation and Analysis on Energy Saving of Air Conditioning in Hot Summer and Warm Winter Zone in China. Urban Clim. 2023, 47, 101369. [Google Scholar] [CrossRef]
  31. Yan, H.; Sun, Z.; Shi, F.; Yuan, G.; Dong, M.; Wang, M. Thermal Response and Thermal Comfort Evaluation of the Split Air Conditioned Residential Buildings. Build. Environ. 2022, 221, 109326. [Google Scholar] [CrossRef]
  32. Xu, C.; Li, S.; Zhang, X.; Shao, S. Thermal Comfort and Thermal Adaptive Behaviours in Traditional Dwellings: A Case Study in Nanjing, China. Build. Environ. 2018, 142, 153–170. [Google Scholar] [CrossRef]
  33. Wi, S.; Chang, S.J.; Kim, S. Improvement of Thermal Inertia Effect in Buildings Using Shape Stabilized PCM Wallboard Based on the Enthalpy-Temperature Function. Sustain. Cities Soc. 2020, 56, 102067. [Google Scholar] [CrossRef]
  34. Tong, S.; Wen, J.; Wong, N.H.; Tan, E. Impact of Façade Design on Indoor Air Temperatures and Cooling Loads in Residential Buildings in the Tropical Climate. Energy Build. 2021, 243, 110972. [Google Scholar] [CrossRef]
  35. GB 21455-2019; The National Standard “Minimum Allowable Values of The Energy Efficiency and Energy Efficiency Grades for Room Air Conditioners”. National Standardization Committee of the People’s Republic of China: Beijing, China, 2019.
Figure 1. Indoor environment satisfaction.
Buildings 15 01922 g001
Figure 2. Dissatisfaction analysis: (a) summer; (b) winter.
Buildings 15 01922 g002
Figure 3. Temperature expectation fitting: (a) summer; (b) winter.
Buildings 15 01922 g003
Figure 4. Building model: (a) first floor plan; (b) second floor plan; (c) model. 1. Living room; 2. Restaurant; 3. Kitchen; 4. Toilet; 5. Bedroom; 6. Balcony.
Buildings 15 01922 g004
Table 1. Provisions on indoor thermal and humid environmental parameters in China’s Technical Standard for Nearly Zero Energy Buildings (GB/T 51350-2019).
Indoor Thermal and Humid Environmental ParametersWinterSummer
Temperature (°C)≥20≤26
relative humidity (%)≥30≤60
Table 2. The research sample analysis.
SummerWinter
sample size264258
male140 (53%)134 (52%)
female124 (47%)124 (48%)
maximum age7270
minimum age1013
average age42.341.5
standard deviation11.210.6
active stateStand or sitStand or sit
Table 3. Analysis of variance in summer regression models.
ModelSSdfMSFSignificance
HigherRegression0.93410.934120.409Significant
Residual0.04760.008
Total0.9817
LowerRegression0.00810.00827.533Significant
Residual0.00260.000
Total0.0107
Table 4. Analysis of variance in winter regression models.
ModelSSdfMSFSignificance
HigherRegression1.11711.117235.140Significant
Residual0.02960.005
Total1.1467
LowerRegression0.04310.04316.393Significant
Residual0.01660.003
Total0.0587
Table 5. Detailed information on residential buildings in the villages and towns of southern Jiangsu.
FactorLevel
Building area156~205
Building floors2
Number of rooms6~10
Window-to-wall-area ratio10~30%
External window heat transfer coefficient0.147~0.304
External wall heat transfer coefficient 0.982~1.573
Roof heat transfer coefficient0.162~0.310
Building orientation−30~30
Table 6. Influencing factors and level value.
DesignationFactorLevel 1Level 2Level 3
AExternal wall heat transfer coefficient0.1470.1980.304
BRoof heat transfer coefficient0.1620.2620.310
CExternal window heat transfer coefficient0.9820.7801.573
DExternal window solar heat gain coefficient0.4550.4740.520
EWindow-to-wall-area ratio0.20.10.3
FAir exchange rate (building air tightness)0.10.51.0
GBuilding orientation−30030
HBlank column (used for error testing)
Table 7. Technical parameter specifications for envelope structures of zero-energy consumption buildings in HSCW regions.
FactorLevel
External wall heat transfer coefficient0.15~0.40
Roof heat transfer coefficient0.15~0.35
External window heat transfer coefficient≤2.0
External window solar heat gain coefficient≥0.4 (Winter)≤0.3 (Summer)
Table 8. Orthogonal experimental arrangement.
Serial NumberA 1B 2C 3D 4E 5F 6G 7H 8
10.1470.1620.9820.4550.20.1−30°1
20.1470.1620.9820.4740.10.52
30.1470.1620.9820.5200.3130°3
40.1470.2620.7800.4550.1130°1
50.1470.2620.7800.4740.30.1−30°2
60.1470.2620.7800.5200.20.53
70.1470.3101.5730.4550.30.51
80.1470.3101.5730.4740.21−30°2
90.1470.3101.5730.5200.10.130°3
100.1980.1620.7800.5200.2130°1
110.1980.1620.7800.4550.30.52
120.1980.1620.7800.4740.10.1−30°3
130.1980.2621.5730.5200.10.5−30°1
140.1980.2621.5730.4550.20.130°2
150.1980.2621.5730.4740.313
160.1980.3100.9820.5200.30.11
170.1980.3100.9820.4550.1130°2
180.1980.3100.9820.4740.20.5−30°3
190.3040.1621.5730.4740.31−30°1
200.3040.1621.5730.5200.10.130°2
210.3040.1621.5730.4550.20.53
220.3040.2620.9820.4740.30.530°1
230.3040.2620.9820.5200.10.12
240.3040.2620.9820.4550.21−30°3
250.3040.3100.7800.4740.111
260.3040.3100.7800.5200.20.1−30°2
270.3040.3100.7800.4550.30.530°3
1 A: external wall heat transfer coefficient; 2 B: roof heat transfer coefficient; 3 C: external window heat transfer coefficient; 4 D: external window solar heat gain coefficient; 5 E: window-to-wall-area ratio; 6 F: air tightness; 7 G: building orientation; 8 H: blank column (used for error testing).
Table 9. Simulation results of building energy consumption.
Serial NumberCooling Energy Consumption (kWh/(m2·a))Heating Energy Consumption (kWh/(m2·a))Total Energy Consumption (kWh/(m2·a))
118.222.140.3
210.28.318.5
322.328.450.7
412.16.218.3
516.320.536.8
614.210.324.5
720.116.436.5
810.424.334.7
918.34.222.5
1016.124.440.5
1120.210.530.7
1210.36.116.4
1312.220.432.6
1418.44.122.5
1522.28.330.5
1620.314.434.7
1710.528.138.6
1814.110.224.3
1922.428.350.7
2010.14.314.4
2118.516.334.8
2220.410.430.8
2312.36.418.7
2416.224.240.4
2512.424.336.7
2614.314.228.5
2722.18.430.5
Table 10. Regulations on energy efficiency indicators of near-zero-energy consumption residential buildings in hot summer and cold winter regions.
Building Energy ConsumptionNumerical Value (kWh/(m2·a))
Cooling energy consumption≤23.2
Heating energy consumption≤8
Total energy consumption≤55
Table 11. Analysis of orthogonal experimental results under winter working conditions.
A 1B 2C 3D 4E 5F 6G 7H 8
K1140.7148.3162.3166.5132.396.7162.5
K2136.2134.5124.9120.698.4104.3117.2
K3136.4144.1130.2116.4169.9194.6120.3
K avg 115.6316.4818.0318.5014.7010.7418.06
K avg 215.1314.9413.8813.4010.9311.5913.02
K avg 315.1616.0114.4712.9318.8821.6213.37
R0.501.544.155.577.9510.885.04
Optimal levelLevel 2Level 2 Level 2Level 3Level 2Level 1Level 2
DegreeGeneralGeneralGeneralGeneralImportantKeyImportant
Repetition frequency9999999
1 A: external wall heat transfer coefficient; 2 B: roof heat transfer coefficient; 3 C: external window heat transfer coefficient; 4 D: external window solar heat gain coefficient; 5 E: window-to-wall-area ratio; 6 F: air tightness; 7 G: building orientation; 8 H: blank column (used for error testing).
Table 12. Analysis of orthogonal experimental results under summer working conditions.
A 1B 2C 3D 4E 5F 6G 7H 8
K1142.1147.3144.3153.8136.5148.1122.6
K2144.3133.9138.8122.7120.1143.9150.1
K3148.7142.4142.6158.2178.1142.4142.3
K avg 115.7916.3716.0317.0915.1716.4613.62
K avg 216.0314.4815.4213.6313.3415.9916.68
K avg 316.5215.8215.8417.5819.7915.8215.81
R0.731.490.613.956.450.463.06
Optimal levelLevel 1Level 2 Level 2Level 2Level 2Level 3Level 1
DegreeMinorGeneralGeneralGeneralKeyGeneralImportant
Repetition frequency9999999
1 A: external wall heat transfer coefficient; 2 B: roof heat transfer coefficient; 3 C: external window heat transfer coefficient; 4 D: external window solar heat gain coefficient; 5 E: window-to-wall-area ratio; 6 F: air tightness; 7 G: building orientation; 8 H: blank column (used for error testing).
Table 13. Variance analysis of experimental results under winter conditions.
FactorSSdfMSFSignificance
A13.0526.522.20Insignificant
B47.52223.768.00Insignificant
C108.36254.1818.24Insignificant
D174.06287.0329.30Significant
E285.572142.7948.08Significant
F659.072329.54110.95Significant
G143.37271.6924.14Significant
H5.9422.97
Table 14. Residual diagnosis of experimental results under winter conditions.
ResultInterpretation
¯ +0.08Close to 0, satisfying unbiasedness assumption
se6.89Dispersion degree of residuals
W, p0.92, 0.07p > 0.05, fail to reject normality
F, p1.56, 0.22p > 0.05, variances are homogeneous
G, Critical2.35 < 2.48No significant outliers
Table 15. Variance analysis of experimental results under summer conditions.
FactorSSdfMSFSignificance
A2.5221.260.53Insignificant
B15.2127.6053.19Insignificant
C5.2222.611.10Insignificant
D83.43241.7217.49Insignificant
E208.82104.443.78Significant
F2.0721.0350.43Insignificant
G59.94229.9712.57Insignificant
H4.7722.385
Table 16. Residual diagnosis of experimental results under summer conditions.
ResultInterpretation
¯ −0.03Close to 0, satisfying unbiasedness assumption
se5.21Dispersion degree of residuals
W, p0.94, 0.12p > 0.05, fail to reject normality
F, p1.23, 0.31p > 0.05, variances are homogeneous
G, Critical1.89 < 2.48No significant outliers
Table 17. Thermal performance and technical parameters of residential building envelope.
Enclosure structure partsexternal wall heat transfer coefficientroof heat transfer coefficientexternal window heat transfer coefficientexternal window solar heat gain coefficient
recommend value0.15~0.40.15~0.35≤2.0≥0.4 (winter)
Table 18. Simulation results of air tightness optimization.
A 1B 2C 3F 4Data 1 5Data 2 6
0.150.150.780.111.034.39
0.150.150.780.210.985.51
0.150.150.780.310.976.73
0.150.150.780.410.988.06
0.150.150.780.511.029.36
0.150.150.780.611.0810.64
1 A: external wall heat transfer coefficient;2 B: roof heat transfer coefficient; 3 C: external window heat transfer coefficient; 4 F: air exchange rate (building air tightness); 5 Data 1: cooling energy consumption (kWh/(m2·a)); 6 Data 2: heating energy consumption (kWh/(m2·a)).
Table 19. Simulation results of energy consumption of residential buildings with different orientations.
A 1B 2C 3F 4G 5Data 1 6Data 2 7
0.150.150.780.1−2011.517.55
0.150.150.780.1−1511.297.6
0.150.150.780.1−1011.137.13
0.150.150.780.1−511.027.87
0.150.150.780.1010.988.06
0.150.150.780.15118.28
0.150.150.780.11011.078.54
0.150.150.780.11511.178.87
1 A: external wall heat transfer coefficient; 2 B: roof heat transfer coefficient; 3 C: external window heat transfer coefficient; 4 F: air exchange rate (building air tightness); 5 G: building orientation; 6 Data 1: cooling energy consumption (kWh/m2); 7 Data 2: heating energy consumption (kWh/m2).
Table 20. Simulation results of energy consumption of residential buildings with different thermal performance of external walls.
B 1C 2F 3A 4Data 1 5Data 2 6
0.150.780.10.1511.034.39
0.150.780.10.2010.745
0.150.780.10.2510.545.58
0.150.780.10.3010.386.2
0.150.780.10.3510.256.78
0.150.780.10.4010.527.37
0.150.780.10.4510.478.02
1 B: roof heat transfer coefficient; 2 C: external window heat transfer coefficient; 3 F: air exchange rate (building air tightness); 4 A: external wall heat transfer coefficient; 5 Data 1: cooling energy consumption (kWh/(m2·a)); 6 Data 2: heating energy consumption (kWh/(m2·a)).
Table 21. Simulation results of energy consumption of residential buildings with different thermal performance of exterior windows.
A 1B 2F 3C 4Data 1 5Data 2 6
0.150.150.10.7811.034.39
0.150.150.10.9811.144.59
0.150.150.11.1810.954.90
0.150.150.11.3810.655.34
0.150.150.11.5810.405.67
0.150.150.11.7810.166.13
0.150.150.11.989.986.48
0.150.150.12.189.836.81
0.150.150.12.389.697.13
0.150.150.12.589.567.43
0.150.150.12.789.467.73
0.150.150.12.989.368.00
1 A: external wall heat transfer coefficient; 2 B: roof heat transfer coefficient; 3 F: air exchange rate (building air tightness); 4 C: external window heat transfer coefficient; 5 Data 1: cooling energy consumption (kWh/(m2·a)); 6 Data 2: heating energy consumption (kWh/(m2·a)).
Table 22. Simulation results of energy consumption of residential buildings with different roof thermal performance.
A 1C 2F 3B 4Data 1 5Data 2 6
0.150.780.10.1510.976.73
0.150.780.10.3010.986.95
0.150.780.10.4510.977.10
0.150.780.10.6010.967.23
0.150.780.10.7510.947.35
0.150.780.10.9011.007.60
0.150.780.11.0510.997.77
0.150.780.11.2010.957.88
0.150.780.11.3510.967.98
0.150.780.11.5010.948.08
1 A: external wall heat transfer coefficient; 2 C: external window heat transfer coefficient; 3 F: air exchange rate (building air tightness); 4 B: roof heat transfer coefficient; 5 Data 1: cooling energy consumption (kWh/(m2·a)); 6 Data 2: heating energy consumption (kWh/(m2·a)).
Table 23. Recommended values of thermal performance and technical parameters of near-zero-energy consumption residential buildings in southern Jiangsu.
Enclosure structure partsexternal wall heat transfer coefficientexternal window heat transfer coefficientroof heat transfer coefficientair exchange ratebuilding orientation
recommended value0.15~0.45<30.15~0.135≤0.4 ac/h10 degrees west by south
Disclaimer/Publisher’s Note: The statements, opinions and data contained in all publications are solely those of the individual author(s) and contributor(s) and not of MDPI and/or the editor(s). MDPI and/or the editor(s) disclaim responsibility for any injury to people or property resulting from any ideas, methods, instructions or products referred to in the content.

