Article

Is Integrating Tree-Planting Strategies with Building Array Sufficient to Mitigate Heat Risks in a Sub-Tropical Future City?

Department of Physics, City University of Hong Kong, Hong Kong SAR, China
Buildings 2025, 15(11), 1913; https://doi.org/10.3390/buildings15111913
Submission received: 31 March 2025 / Revised: 24 May 2025 / Accepted: 28 May 2025 / Published: 1 June 2025
(This article belongs to the Special Issue Natural-Based Solution for Sustainable Buildings)

Abstract

:
Climate change amplifies heat wave effects on outdoor thermal comfort by increasing their frequency, duration, and intensity. The urban heat island effect worsens heat risks in cities and impacts resilience. Nature-based solution (NBS) with tree plantation was reported as an effective mitigation measure. This simulation study, by the well-validated ENVI-met model, aimed to investigate the impact of different tree planting strategies and building parameters on urban heat risk mitigation and microclimate during a typical hot summer day. Hypothetical skyscrapers and super high-rise buildings were assumed in the study site located in southern China. Adopting meteorological inputs from a typical year, the simulation results revealed that both mean radiant temperature (Tmrt) and physiological equivalent temperature (PET) were elevated (Tmrt > 60 °C and PET > 50 °C) in early afternoon in sunlit areas. Three mitigation approaches with different tree planting locations were investigated. While all approaches demonstrated effective cooling (PET down to <35 °C) in the proximity of trees, a superior approach for mitigating the heat risks was not evident. Within the building array, the shade of bulky structures also lowered Tmrt and PET to a thermally comfortable level in the late afternoon. Combining open-space tree planting with optimized building designs is recommended to mitigate heat risks and enhance urban resilience while promoting outdoor activities and their health benefits.

1. Introduction

More frequent, stronger, and longer heat wave events are predicted in the near future due to global climate change [1,2]. The urban population suffers from heat stress not only due to the heat wave but also the urban heat island (UHI) effect. The UHI effect increases the heat risks and deteriorates the outdoor thermal comfort (OTC) [3,4,5], especially in summer in hot and humid regions. The UHI effect causes urban areas to have higher air temperatures than those in rural surroundings (on average 5 °C higher for Asian and Australian cities [6]). The urban thermal discomfort is associated with various human health issues [7,8].
Nature-based solutions (NBSs) have demonstrated significant potential in reducing disaster and climate risks while delivering a wide range of ecological and human well-being benefits. Tree planting is increasingly promoted as an effective strategy to tackle the diverse and interconnected challenges faced by urban areas (see [9] and references therein). Givoni [10] pointed out that one of the aims of urban design in the regions is to minimize the urban thermal discomfort. Urban greenery was documented to be an effective measure to tackle such issues. The green coverage ratio was reported to have a significant effect on the air temperature distribution [11]. A microclimate study using a CFD model with generic building blocks found that a 10% increase in the green-to-built-area ratio would create a 0.8 °C reduction in ambient air temperature [12]. Measurements have shown that urban greening provided a 2 °C air temperature difference between urban areas and green areas in cities (e.g., [13]). Further, previous studies also related microclimate and urban fabric parameters such as wind speed and sky-view factor (SVF) to the OTC. For wind speed, Ahmed [14] revealed the airflow in urban spaces increasing the number of people with thermal satisfaction. Wai et al. [15] demonstrated the importance of wind speed to control the OTC within street canyons by a CFD modelling study. For the SVF, Yahia et al. [16] reported a strong correlation between the area-averaged SVF and PET. Low SVF resulted in improving comfort levels in summer in Taiwan [17]. It is worth noting that most of the studies were performed in low- or mid-rise built environments. Darvina Mohd Jani et al. [18] recommended further research to focus on integrating the building strategy to promote wind speed to decrease the air temperature in high-rise residential areas.
Following the rapid urbanization in China, the construction of skyscrapers (height > 200 m) is intensified. Fourteen skyscraper projects were completed in 2018 (10% of the global total) within a megacity in China, according to the review of the Council on Tall Buildings and Urban Habitat [19]. Figure 1 showcases an example. To be more sustainable in the future, several directions of the future city development, such as smart city, and resilient city, low-carbon city, among others, were proposed (see, for instance, [20,21,22]). Despite the directions, skyscrapers are likely to be a symbol of future cities. Therefore, a quantitative study of the impact of skyscrapers on the urban OTC and microclimate in subtropical areas is urgently needed but is still lacking.
In view of these, this study aimed to test different tree arrangement approaches in search of an optimal one in the context of the urban OTC and microclimate. In addition, various influencing factors that have the potential to provide microclimate regulation and enhance urban cooling efficiency were explored. The factors, including building parameters (orientations, SVF, length), building disposition, and open space, were investigated. The aim benefits those who seek optimal planning of tree planting and provides contribution to the NBS and climate-sensitive design [23,24,25] for the built environment.

2. Materials & Methods

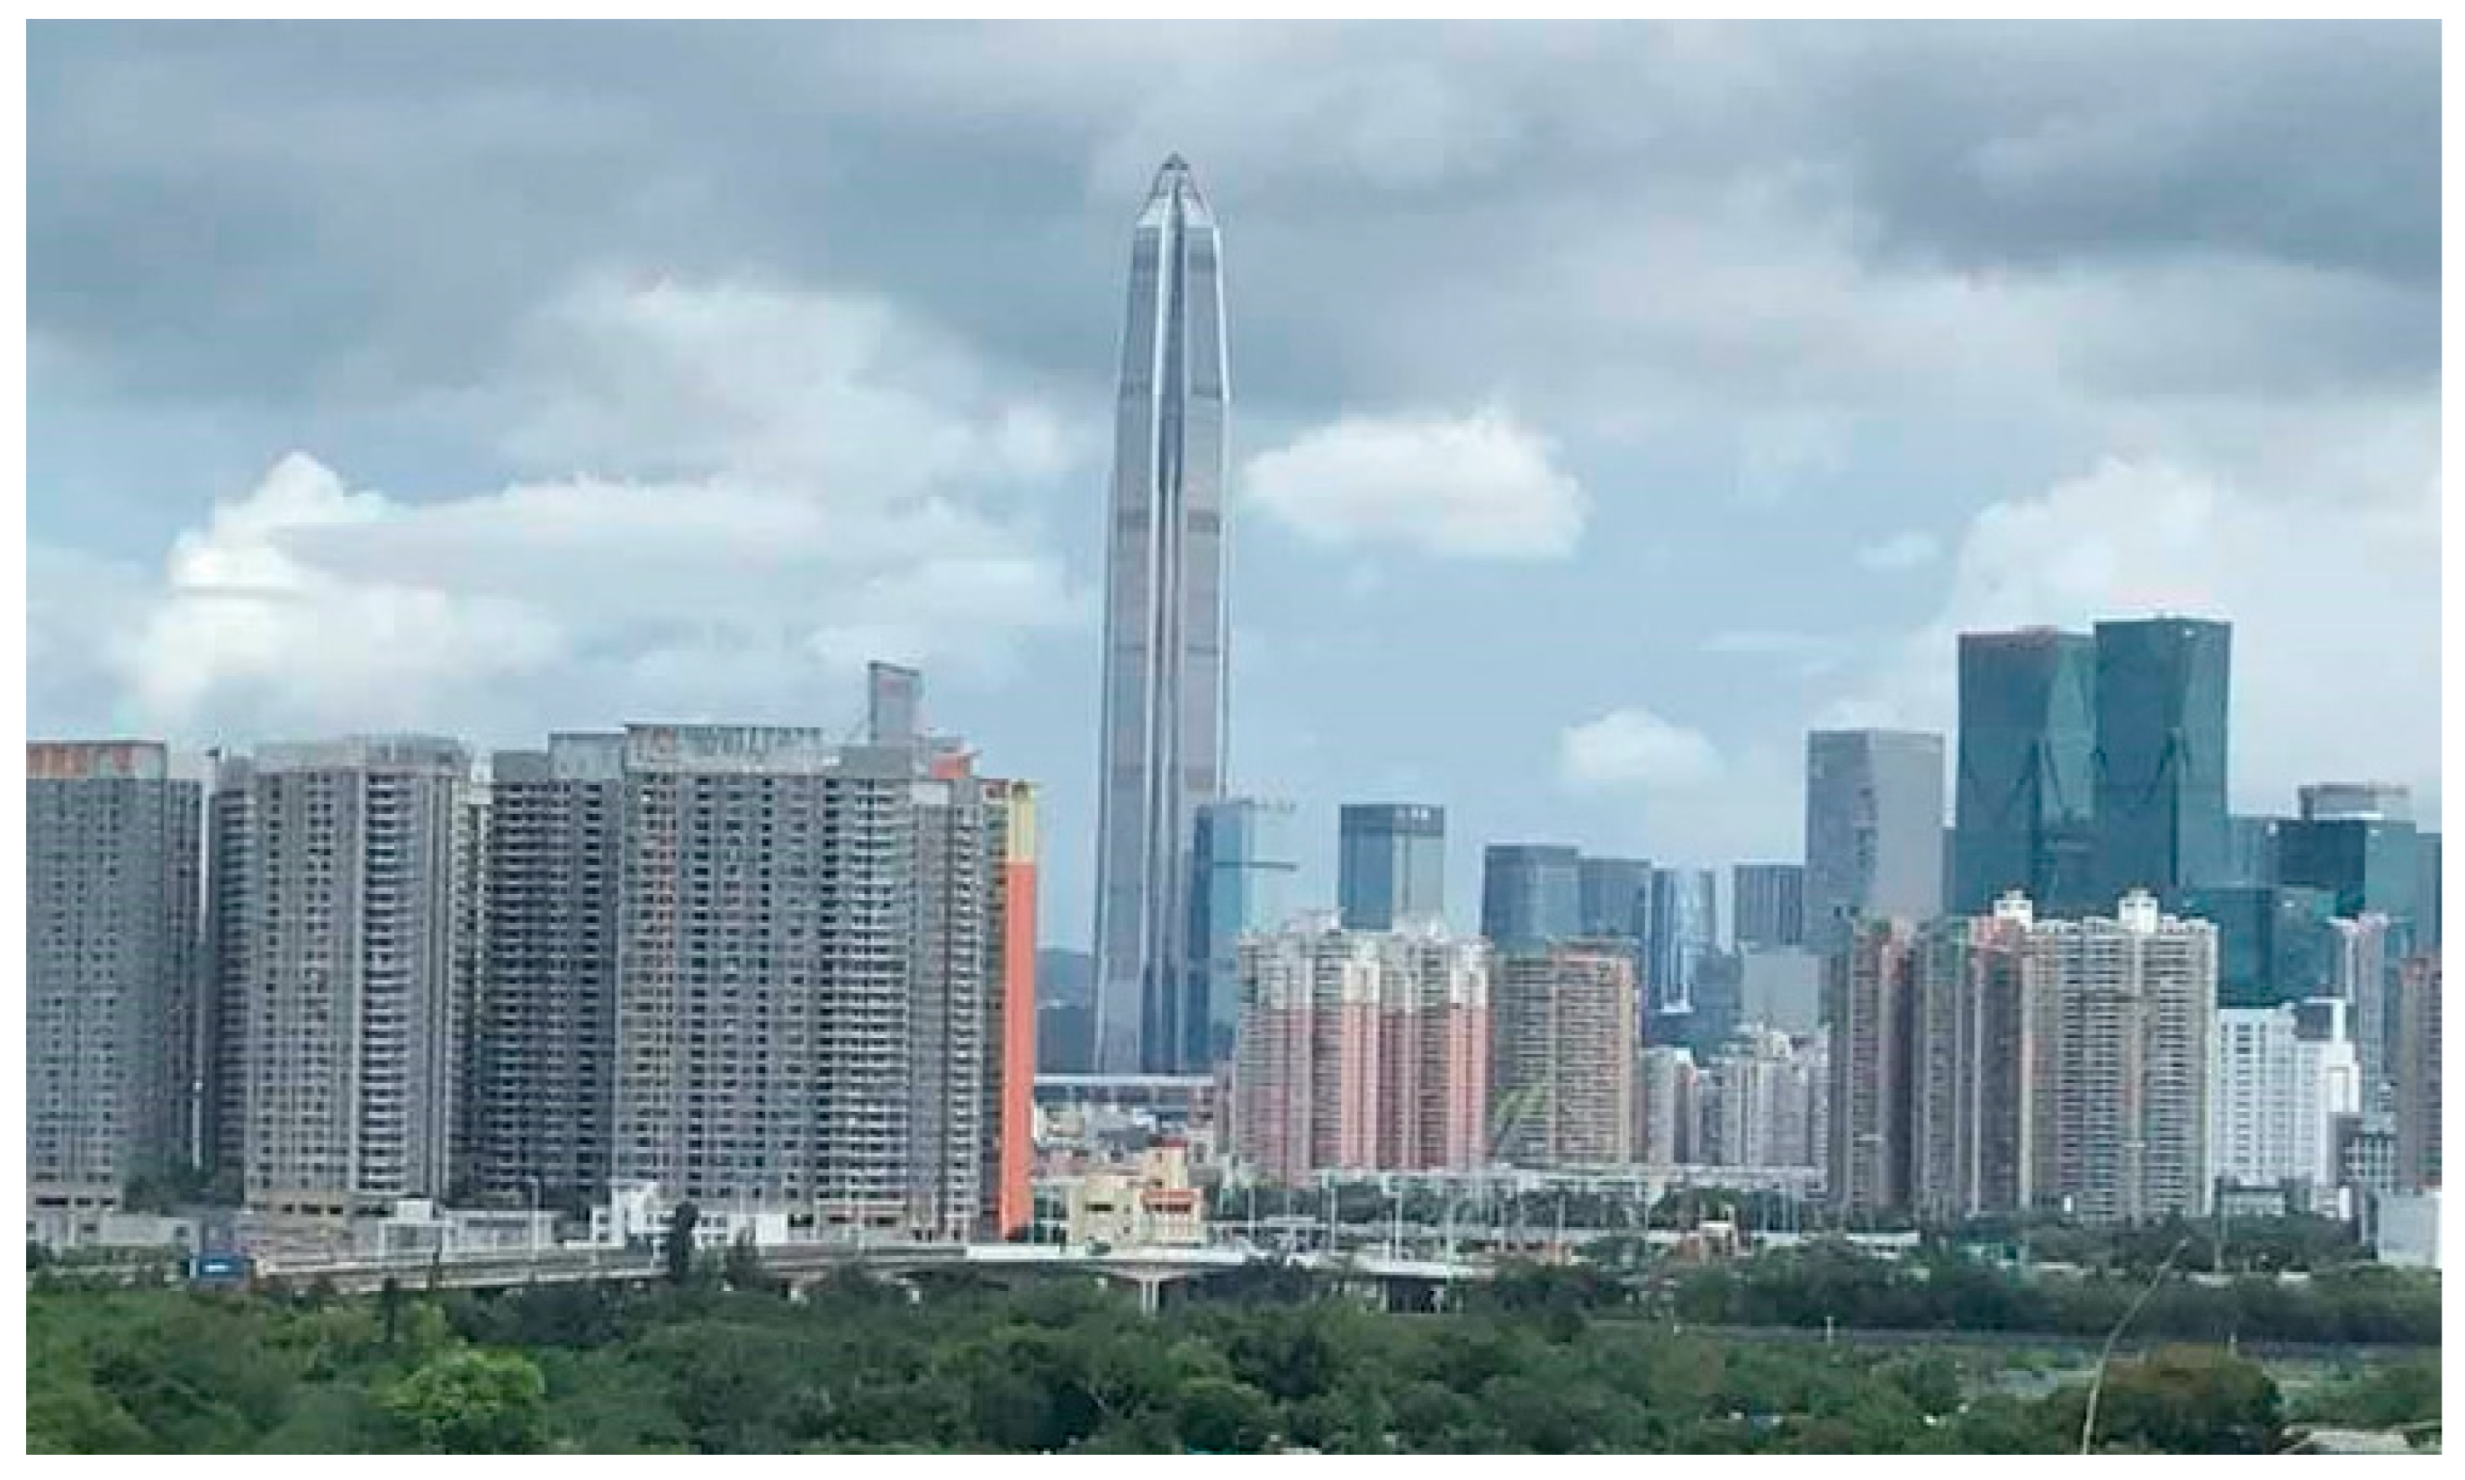
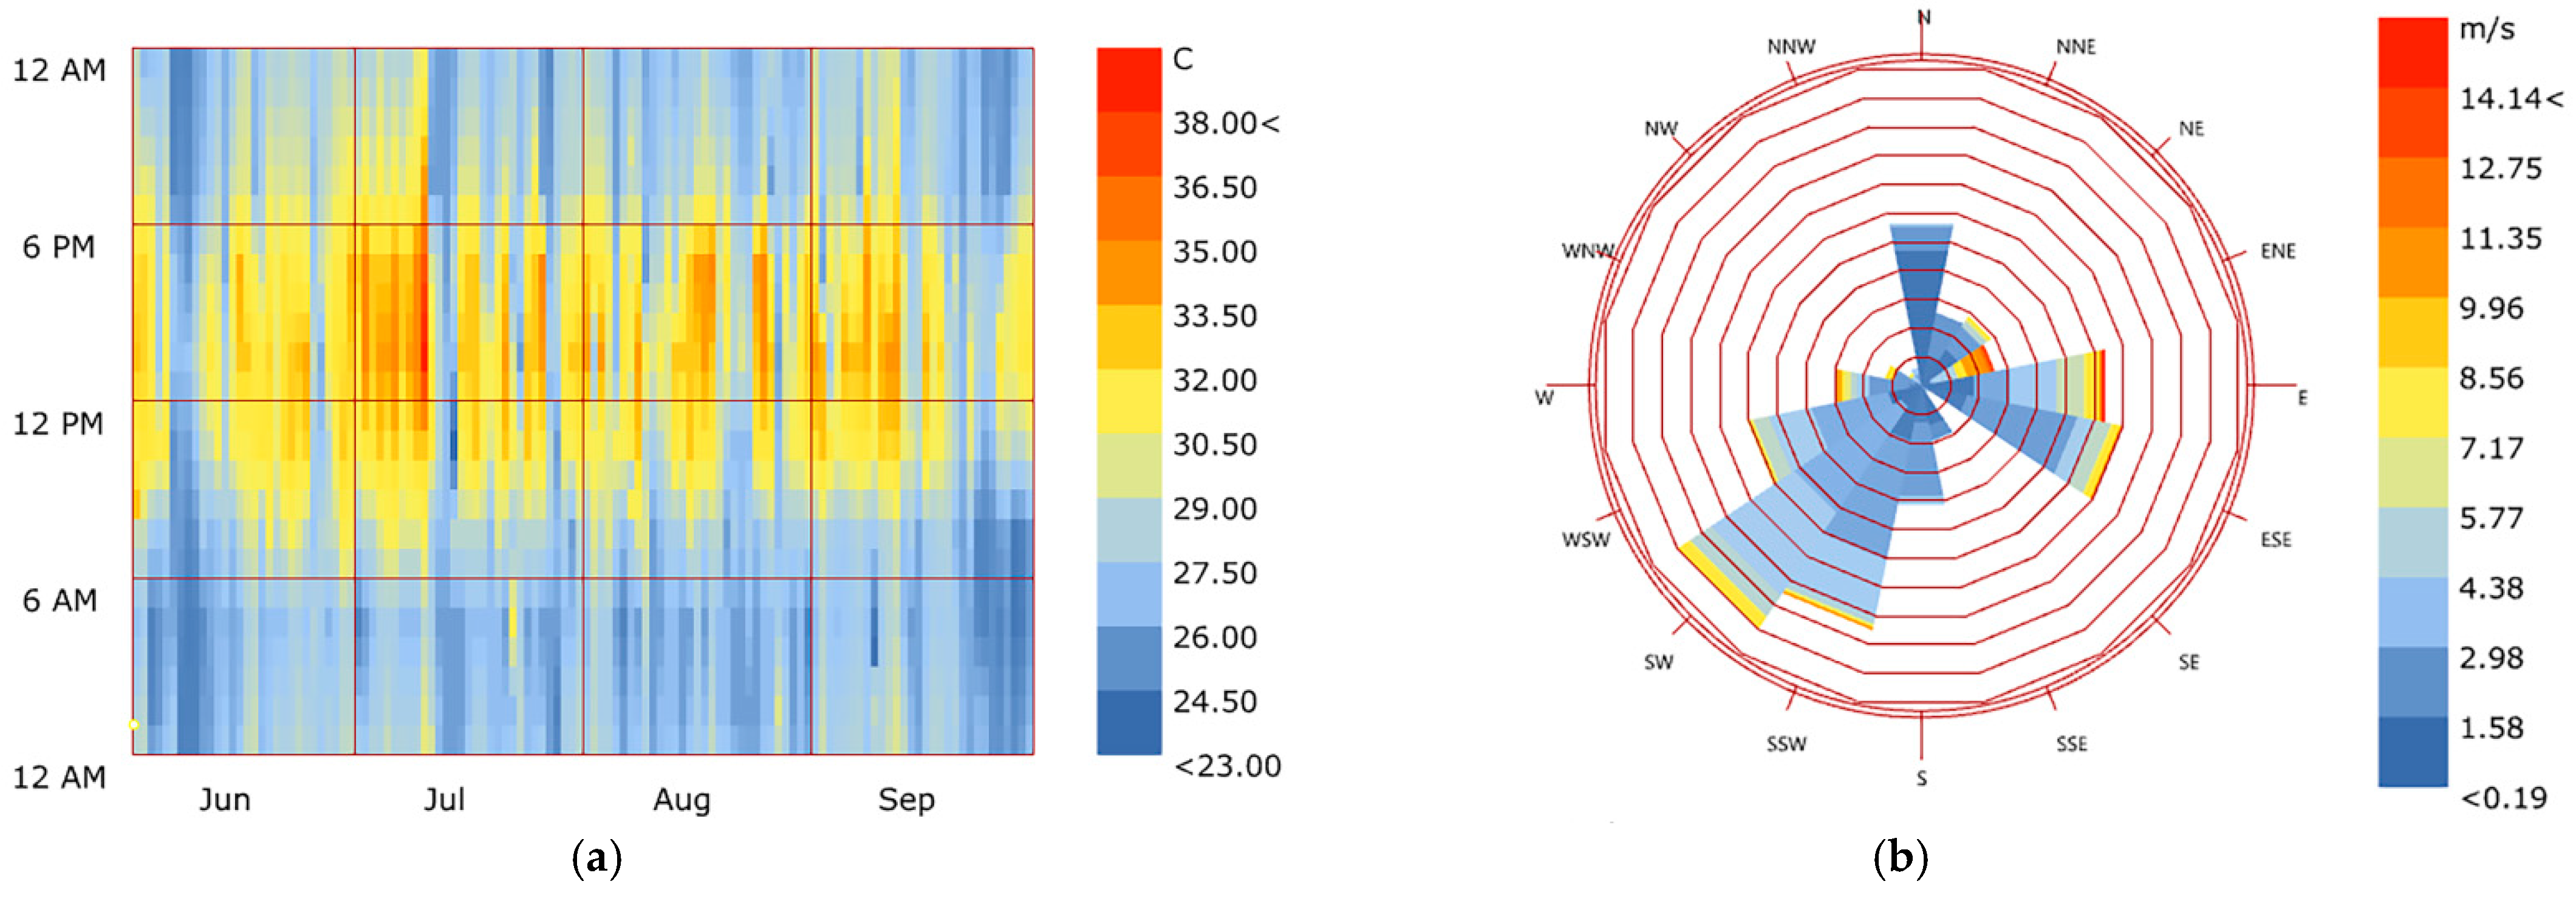
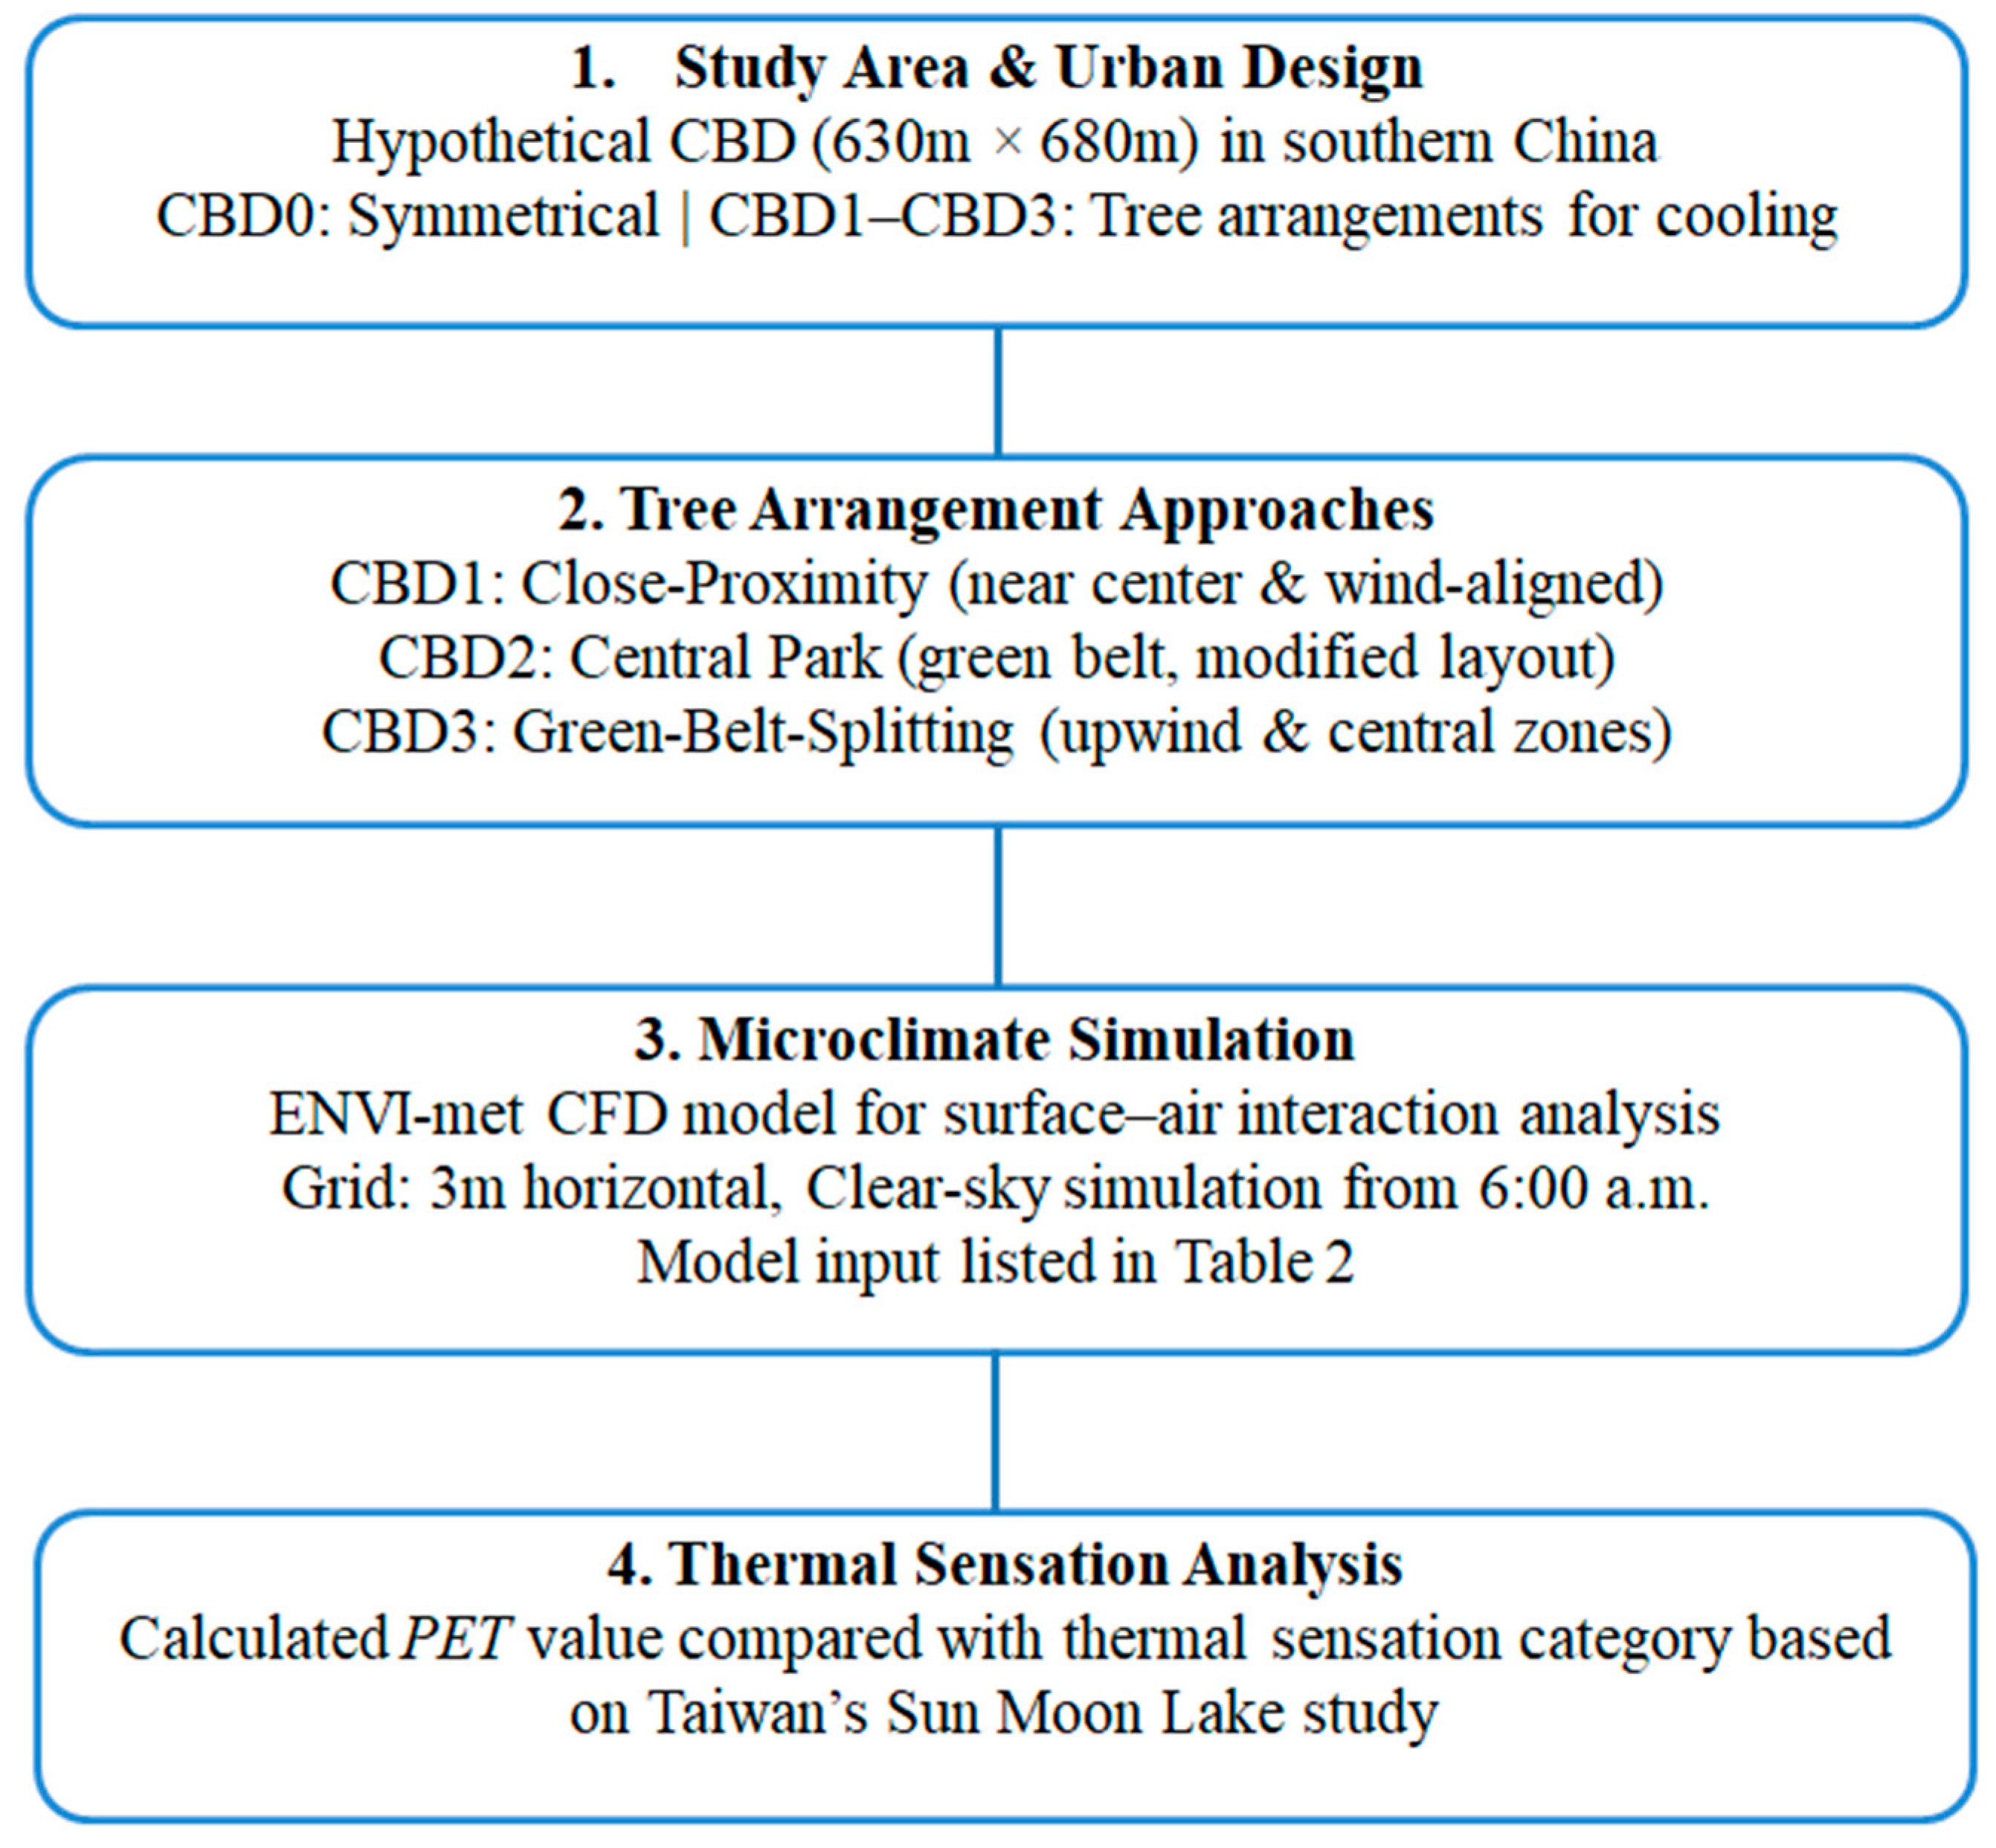
2.1. The Study Area—A Central Business District

A hypothetical central business district (CBD), covering 630 m by 680 m, was assumed to be developed in southern China (22.6° N, 114.1° E). An original design and three different tree arrangement approaches (Figure 2) were included to study the cooling effect due to different arrangements of trees. The original design (i.e., CBD0) was symmetrical about the CBD center. Buildings near the center were the highest (300 m high). Then building heights decreased with distance from the center. Four large podiums with a height of 24 m (6 stories) were located below the buildings with a height of 200 m. Low-rise (20 m high) and long buildings were located at the CBD outskirts. The horizontal dimensions of the building blocks are typical in China. Areas without building blocks were those designated as parks, green zones, roads, and pedestrian walkways. Three different tree arrangement approaches (i.e., CBD1–CBD3) are shown in Figure 2b–d, adopting Ficus microcarpa as a typical native tree species [26]. The number of trees for different approaches was the same for all approaches to have a fair comparison of the cooling effect of trees. The “close-proximity” approach (CBD1) had similar settings as the CBD0 except that trees were arranged near the building blocks located at the CBD central and along with the streamwise (prevailing wind) direction (Figure 2b). The “central-park” approach (CBD2) assigned trees at the middle of the CBD (Figure 2c). The trees formed a green belt perpendicular to the streamwise direction. The rationale is based on the finding of which tree arrangement cools the area downwind [26]. Due to the green-belt occupancy and constant total building volume, the building blocks were required to relocate such that block-to-block distance was reduced. The tallest buildings in the CBD center were relocated near four corners of the CBD. Some blocks were rotated 90° relative to the CBD0. The “green-belt-splitting” approach (CBD3) split the green belt in CBD2 into two, arranging half of the trees at the CBD upwind location and the rest in the middle of the CBD (Figure 2d). The building arrangement for CBD2 and CBD3 was similar. Compared with CBD0 and CBD1, CBD2 and CBD3 reduced the degree of symmetry but increased the heterogeneity of building heights. The CBD2 and CBD3 also increased the size of the central open space of the CBD but reduced the site coverage of podium structures. All designs had orientation such that they faced the streamwise direction, i.e., southwesterly (see below for more description). The current study focused on the modifications of the meteorological and thermal sensation variables due to the high-rise buildings along the streamwise direction.

2.2. ENVI-Met Model Description and Setting

A 3-dimensional computational fluid dynamics (CFD) model (ENVI-met; version 3.1) was used to simulate surface-air interactions within the urban canopy and boundary layer [27]. The model has been successfully applied to simulate the microclimate and thermal comfort within an urban environment (e.g., [12,26,28,29]). Horizontal grid sizes (i.e., dx and dy) in the model domain for all simulations were set to be 3 m. As the thermal environment at pedestrian level was the focus of this study, 3 layers of vertical grids were set in the first 2-m height level. Above 2 m, a telescoping factor was adopted for the vertical grid generation. The building-façade reflectivity was set to 0.2 [30]. Numerical simulations were performed for a clear sky and started at 6:00 a.m. (local time) and ran for a continuous period of 10 h, since the study aimed to evaluate daytime urban heat. One- to two-day ENVI-met simulations for microclimatic studies are most common in the literature (see above). The computational time becomes impractically long for longer-period simulations. Meteorological inputs for the model are detailed in Table 1. Wind speed and direction, relative humidity, and initial air temperature were adopted from a typical year’s hourly meteorological dataset at a site with the same abovementioned location. The dataset is derived from Solar and Wind Energy Resource Assessment (SWERA; https://openei.org/wiki/Solar_and_Wind_Energy_Resource_Assessment_(SWERA)) (accessed on 27 May 2025) which is funded by the United Nations Environment Program. Figure 3a shows the hourly variation of air temperature in summer months of the typical year. The simulation date was selected on 2 July, when a heat event (>33 °C) occurred in early July that lasted for >10 days. It represented a typical hot day in summer for the study area. Figure 3b shows the wind rose in July of the typical year, demonstrating that the prevailing wind direction is southwesterly. The default setting was adopted for PET calculations.

2.3. Adopted Thermal Sensation Category

The human thermal sensation category reported for the study in Taiwan, Sun Moon Lake (23.8° N, 120.9° E; [31]),_was employed (Table 2) because of the similar latitude as the study site. This represented the best information on PET categories available in the literature for the study. Details of the survey (or questionnaires) and the methodology to obtain relevant micrometeorological parameters are referred to in the work and not repeated here.
A structured graphical research framework is shown in Figure 4 in order to enhance the clarity and cohesion of the study methodology.

3. Model Validation

For model validation, it is noted that field measurements inside the studied morphology are impossible since the morphology does not physically exist. Nevertheless, a validation within an existing urban morphology with similar coordinates (22.2° N, 114.8° E) has been undertaken to test whether the model is capable of modelling the urban thermal environment satisfactorily [26]. The existing morphology consists of a regular block array geometry with an average building height of 32 m and a standard deviation of 15 m. The urban canyons in the site are oriented to be parallel, perpendicular, or 45° to the prevailing summer wind from the sea. Experimental details and measurement accuracy for the micrometeorological parameters could be referred to in this work. The 3-function probe TESTO-400 and globe probe were deployed to simultaneously measure air temperature, humidity, wind velocity, and thermal radiant temperature. The values of Tmrt and PET were derived from the recorded variables ([26] and references therein). The results obtained from these measurements were then compared with simulation data for model validation. The calculated Tmrt and PET (derived from measurements) results were compared with simulated ones. Strong correlations between the calculated and simulated results (for Tmrt, r2 = 0.82; for PET, r2 = 0.73) shown in [26] demonstrate that the model is a reliable tool to simulate the urban thermal environment. The model validation for air temperature has been reported in [32], showing good model performance (r2 = 0.90).

4. Results and Discussion

Our discussion was focused on major micrometeorological variables and timings that affect thermal comfort. It is initiated by a detailed discussion of the results for the original design, CBD0. Then the major improvement of the thermal comfort and influencing factors for different mitigated cases (CBD1–CBD3) were analyzed and compared.

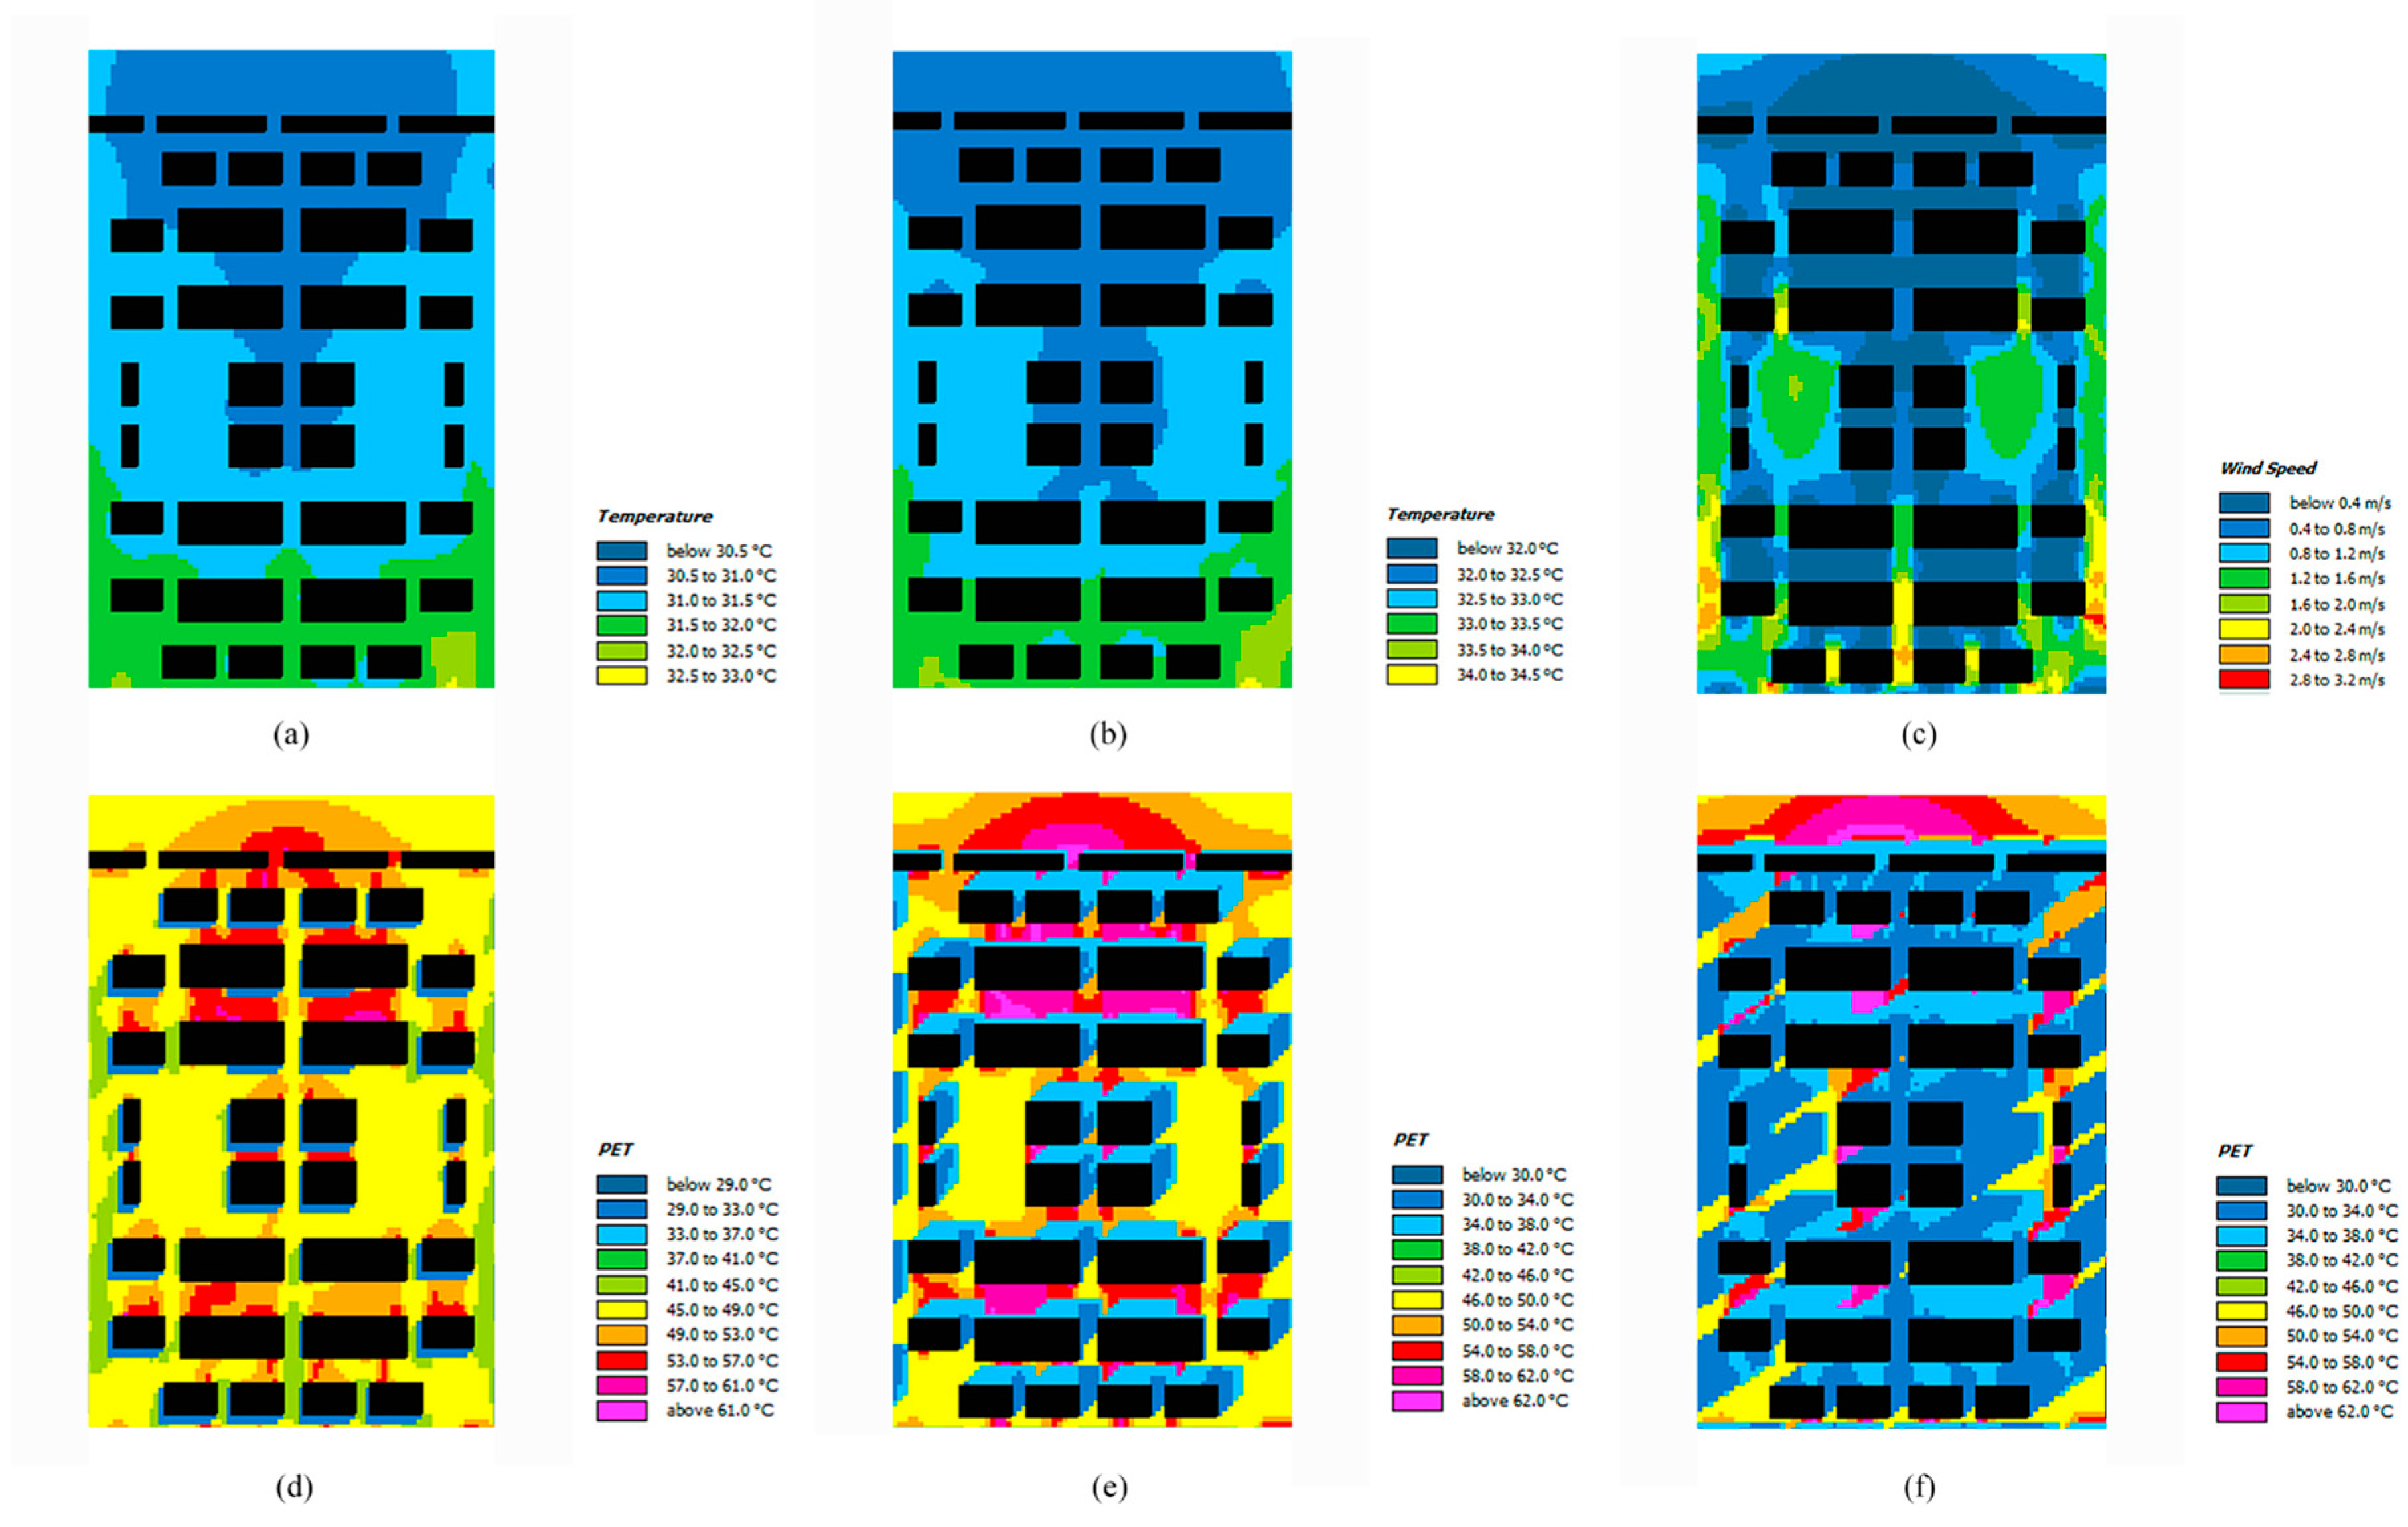
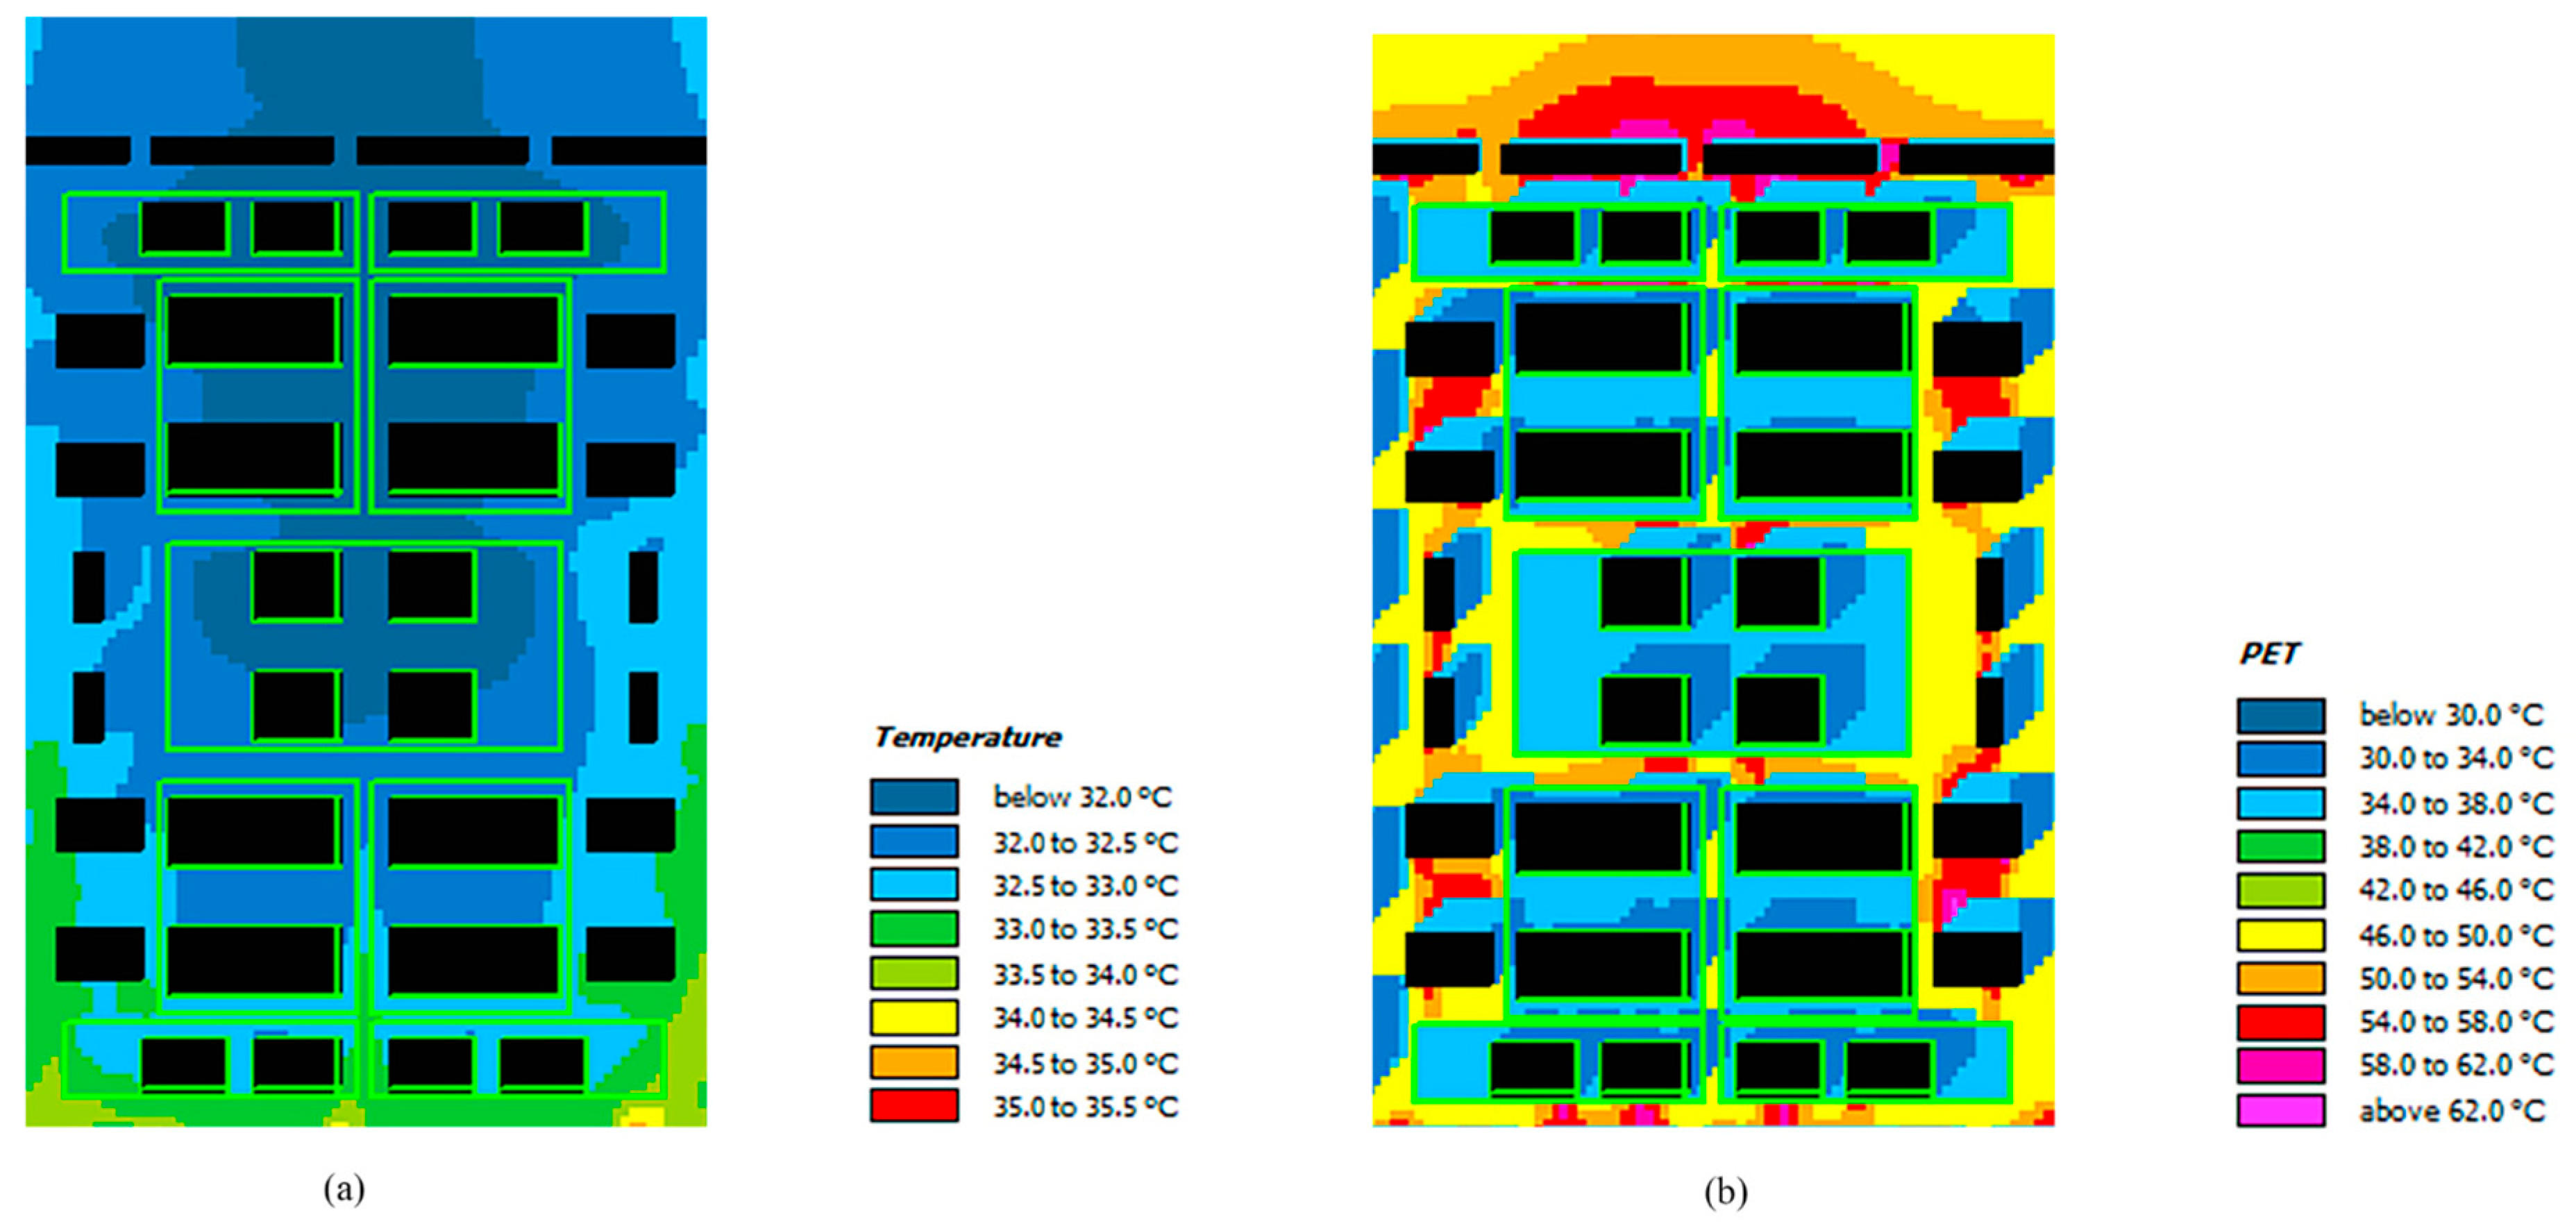
4.1. Pedestrian-Level Air Temperature, Wind Velocity, and PET for the Original Design CBD0

Figure 5a shows pedestrian-level ambient air temperature for CBD0 at 12:00. The temperature distribution had an E-W symmetry because of the symmetric layout design. The result shows low-level hot air advection into the CBD with the prevailing wind, from 32.5 °C to the southwest to 30.5 °C to the northeast of the CBD. Due to the shading effect of large high-rise buildings, near-ground air was exposed to direct solar radiation only for a short period of time near 12:00. In general a 1.5 °C increase was found over the whole CBD at 14:00 (Figure 5b). Compared with the results at 14:00, air temperature remained similar at the windward area of the CBD at 16:00, but there was a 0.5 °C increase at the leeward area due to a continued input of the hot air outside the CBD (figure not shown).
The wind velocity distribution (Figure 5c) shows higher magnitudes of up to 2.8 ms−1 at the windward area. Due to the blocking effect of bulky buildings, the magnitudes were reduced to <0.4 ms−1 at the leeward area. Roads parallel to the streamwise direction were found to have much higher wind velocity, which are the so-called breezeways. On the contrary, wind magnitudes were reduced to <0.8 ms−1 at roads perpendicular to the streamwise direction, even when they were located at the windward area of the CBD. Open spaces at the middle of the CBD promoted wind penetration from outside, such that the wind magnitudes there could reach 2.0 ms−1.
PET, the indicator of human thermal sensation, is governed by air temperature, mean radiant temperature, and wind speed. Therefore, the analysis of PET could be different from that of air temperature above. Figure 5d shows the pedestrian-level PET distribution at 12:00. The thermal sensation category reached very hot (PET 45–49 °C; Tmrt > 60 °C) in areas exposed to direct solar radiation overhead. Low wind speed at the roads perpendicular to the streamwise direction exacerbated the thermal discomfort there. High values of PET are common in subtropical areas (e.g., [33]). Due to strong direct solar radiation, the relatively high wind speed (>2 ms−1) at the breezeways and open spaces had a small effect on reducing PET. At 14:00, when the building shade effect became larger, shades associated with skyscrapers and high-rise buildings produced large areas of excellent cooling (Figure 5e). PET in these areas (i.e., to the northeast of the buildings) was dropped to 34 °C (or slightly warm). Tmrt was <40 °C at the shaded areas, compared with >70 °C at sunlit areas. However, all urban canyons located at leeward areas of buildings have elevated PETs (>60 °C). It was especially true for the leeward areas of podiums with a low aspect ratio of 0.57. The thermal discomfort situation was improved at 16:00, mainly due to the shade effect of bulky building blocks, which led to 90% of areas in the CBD being in the slightly warm category (Figure 5f). Since most of the CBD areas achieved a thermally comfortable condition at 16:00, PET variations were not further discussed at this time. In subsequent sections, PET variations for CBD1–CBD3 at 14:00 were focused on when the unmitigated PET over the CBD was higher.

4.2. Pedestrian-Level Air Temperature, Tmrt, Wind Velocity, and PET for CBD1

Figure 6a shows the air temperature distribution for CBD1. With the deployment of street trees around building blocks near the middle of the CBD along the streamwise direction (i.e., the close-proximity approach), trees provided a cooling of 0.5–1.0 °C at green (tree-covering) areas due to the combination of shading and evapotranspiration effects. Further, the downwind location of green areas also benefited from the tree cooling effect, such that similar cooling magnitudes were achieved at the CDB wake region (Figure 6a). Our discussion was focused on the situation at 14:00 since a similar cooling effect existed at 12:00 and 16:00.
At 14:00, the Tmrt values at exposed areas were >60 °C (figure not shown), which is consistent with the findings in the urban areas of other subtropical cities in the summer (e.g., [17]). The building shades provided a substantial reduction of Tmrt (high-rise buildings: 35–40 °C and skyscrapers: <35 °C). Yahia et al. [16] reported a strong correlation (r2 = 0.97) between the SVF and level of discomfort. Their finding is consistent with the attribution here since higher buildings are associated with smaller SVF and, in turn, lower levels of discomfort (lower Tmrt values). It also explained lower Tmrt at the shade of skyscrapers relative to high-rise buildings. The PET values at the proximity of green areas were dropped to 30–38 °C (slightly warm or warm category; Figure 6b), compared with PET reaching >60 °C for the unmitigated case CBD0. The magnitudes of PET drop were consistent with those reported in the literature (e.g., [34,35,36]), which revealed a reduction of PET by >20 °C after the arrangement of street trees. The CBD wake region also benefited from the cooling effect downwind of green areas, leading to a contraction of the area of thermal discomfort (PET > 42 °C) of 4500 m2. In general, the wind speeds over the entire CBD were similar between CBD1 and CBD0. Therefore, the wind effect on PET variations for CBD1 was small, with respect to CBD0.

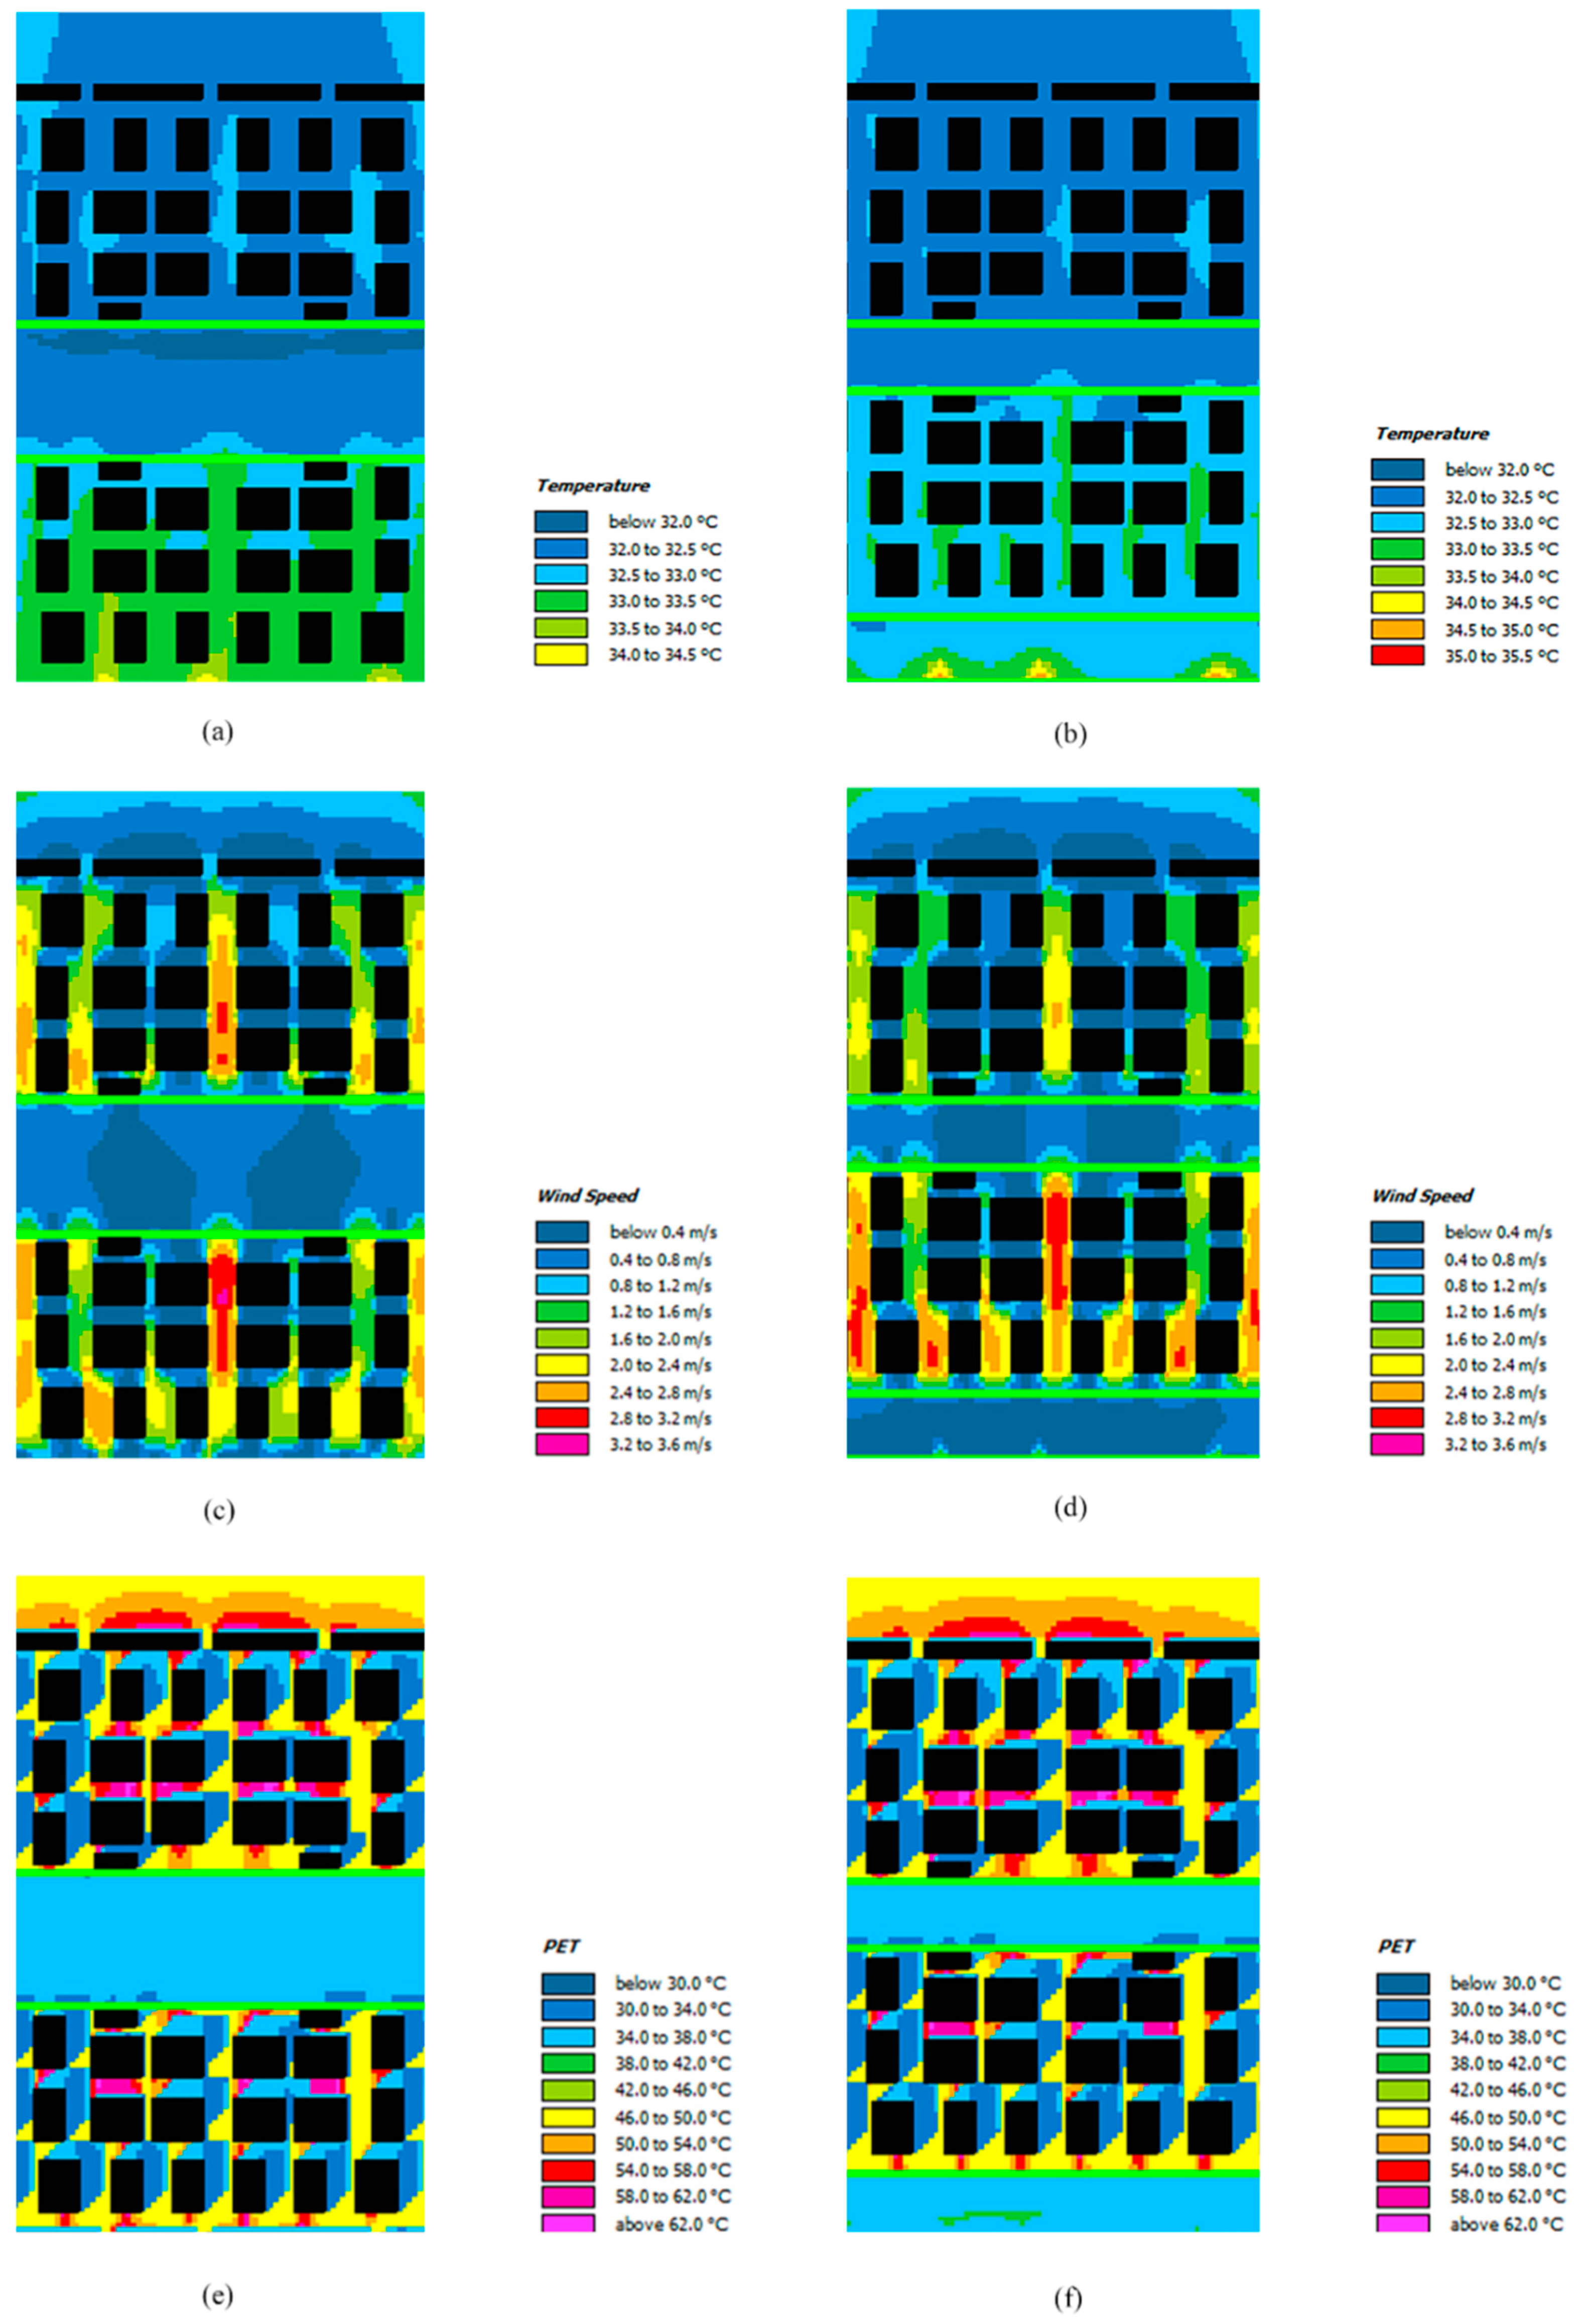
4.3. Pedestrian-Level Air Temperature, Wind Velocity, and PET for CBD2 and CBD3

Air temperature over the leeward area of CBD2 and CBD3 ranged from 32.0–33.5 °C at 14:00 (Figure 7a,b). For CBD2 and CBD3, the CBD became well ventilated, which was explained subsequently. The continual supply of the hot air advected to the leeward area of the CBD counterbalanced the air temperature drop produced by the tree effect. It resulted in a 0.5 °C increase in some windward areas of the CBD for CBD2 relative to CBD0, except for some cooling effects within the tree area. Therefore, the central-park approach (CBD2) might not be an optimal choice for cooling (in terms of air temperature) the entire CBD in subtropical areas during summer. On the contrary, the split-green-belt approach (CBD3) had a cooling benefit over the windward and tree areas of the CBD by 0.5 °C relative to CBD0. It was due to the tree arrangement immediately at the front of the CBD. The change in cooling effect at the leeward area of the CBD due to a reduced number of trees at the middle of the CBD was minimal. Therefore, CBD3 is a better choice than CBD2 for the entire CBD cooling, although its effects are not substantial.
Compared with CBD0 and CBD1, higher wind speeds for CBD2 and CBD3 were found at all roads aligning with the streamwise direction, mainly due to the reduction of block-to-block distances and building height heterogeneity. For instance, wind speed at the central road for CBD2 and CBD3 was up to 2.8 ms−1 at the leeward area (Figure 7c,d), three times higher than those for CBD0 and CBD1. Li and Donn [37] reviewed relevant literature and concluded the improvement of pedestrian-level ventilation by introducing non-uniformity of building heights. The relocation of the skyscrapers to the CBD corners also facilitated the CBD ventilation. Higher wind speeds over the entire CBD were also attributed to the building disposition and open spaces near the middle of the CBD. The latter led to the facilitation of incoming air to the district from the southwest. It resulted in higher wind speed for these mitigated cases at the CBD wake region.
For the pedestrian-level PET distribution at 14:00, areas of elevated PET were found at similar locations in the CBD for CBD2 and CBD3, with similar PET values (Figure 7e,f). They appeared at leeward areas of buildings where stagnant conditions existed. In these areas, the downwind cooling effect by trees could not lower PET to comfortable levels due to high air temperature and strong direct solar radiation at that time. Providing the equal number of trees for CBD1, CBD2, and CBD3, the appearance of the areas of elevated PET for CBD1 was due to the insufficient number of trees to provide a comfortable level there. When comparing with CBD1, therefore, a superior tree arrangement approach with better cooling performance is not evident. The difference between CBD1 and CBD2/CBD3 was the different location of areas of discomfort. The findings also suggest that the cooling effects of trees are localized, with only minimal additional cooling observed in areas downwind of the trees. At the wake region of the CBD, however, the areas of elevated PET for CBD2/CBD3 were reduced by half relative to CBD1. It was attributed to the higher wind speed at the wake region due to the mentioned changes in the urban morphology for the former cases.

5. Conclusions and Remarks

The rapid development of megacities in China is likely to drive the construction of more high-rise buildings. However, the impact of these massive structures on outdoor thermal comfort and the urban microclimate remains insufficiently studied, despite the urgent need for such insights. To address this gap, our study examined the cooling effectiveness of three tree planting strategies (Table 3) using the ENVI-met model, focusing on their performance during a typical hot day exceeding 33 °C in early July. All strategies provided a >20 °C reduction in PET in the proximity of the green areas, achieving a comfortable environment in hot summers. This highlights that urban tree plantation, as an NBS, remains a highly effective measure for mitigating urban heat, even under extreme weather conditions. However, a superior strategy of cooling performance is not evident. Despite this, urban green areas (i.e., CBD2 and CBD3) add living beauty to communities and offer habitat for birds and other fauna. Playgrounds with tree shade encourage outdoor physical activities with their health benefits. Future research utilizing similar methods in a realistic environmental setting is recommended to gain deeper insights.
This study did not assess scalability, cost, or policy challenges associated with tree-planting strategies in high-rise CBDs. Additionally, since microclimatic conditions during multi-day heat events may differ from those examined here, affecting the effectiveness of mitigation measures, further exploration of these factors is warranted. Nevertheless, this study also pointed out that building shade provided effective cooling in a medium-rise to high-rise built environment, with the cooling performance (in terms of PET reduction) equal to or higher than that of the trees. The latter is useful to mitigate the heat risk at open areas. While tree planting and building shade are effective measures to reduce the heat risk and improve the OTC, a combined use of sunshades is necessary under a very unfavorable background thermal environment. To provide a comfortable urban thermal environment, it is crucial to emphasize the importance of climate-sensitive design in urban planning in the early planning stages.

Funding

This research received no external funding.

Data Availability Statement

Data has been contained within this paper.

Acknowledgments

I acknowledge L. Xiao, for his contributions to the early preparation of this work and also acknowledge Z. Tan for the useful discussion of greening strategies.

Conflicts of Interest

The author declares no conflict of interest.

References

  1. Zacharias, S.; Koppe, C.; Mücke, H.-G. Climate Change Effects on Heat Waves and Future Heat Wave-Associated IHD Mortality in Germany. Climate 2015, 3, 100–117. [Google Scholar] [CrossRef]
  2. Baldwin, J.W.; Dessy, J.B.; Vecchi, G.A.; Oppenheimer, M. Temporally compound heat wave events and global warming: An emerging hazard. Earth’s Future 2019, 7, 411–427. [Google Scholar] [CrossRef]
  3. Armson, D.; Stringer, P.; Ennos, A. The effect of tree shade and grass on surface and globe temperatures in an urban area. Urban For. Urban Green. 2012, 11, 245–255. [Google Scholar] [CrossRef]
  4. Adewale, A.O.; Adepoju, K.A.; Awotoye, O.O. Mapping and Assessing Impervious Surface Areas and Urban Heat Island in Osogbo, Nigeria. J. Earth Sci. Clim. Change 2017, 8, 424. [Google Scholar]
  5. Lobaccaro, G.; Acero, J.A.; Martinez, G.S.; Padro, A.; Laburu, T.; Fernandez, G. Effects of orientations, aspect ratios, pavement materials and vegetation elements on thermal stress inside typical urban canyons. Int. J. Environ. Res. Public Health 2019, 16, 3574. [Google Scholar] [CrossRef]
  6. Santamouris, M. Analyzing the heat island magnitude and characteristics in one hundred Asian and Australian cities and regions. Sci. Total Environ. 2015, 512–513, 582–598. [Google Scholar] [CrossRef]
  7. Chau, P.H.; Chan, K.C.; Woo, J. Hot weather warning might help to reduce elderly mortality in Hong Kong. Int. J. Biometeorol. 2009, 53, 461–468. [Google Scholar] [CrossRef]
  8. Aflaki, A.; Mirnezhad, M.; Ghaffarianhoseini, A.; Ghaffarianhoseini, A.; Omrany, H.; Wang, Z.H.; Akbari, H. Urban heat island mitigation strategies: A state-of-the-art review on Kuala Lumpur, Singapore and Hong Kong. Cities 2017, 62, 131–145. [Google Scholar] [CrossRef]
  9. Kibii, C.; Guerra, F.; Bananayo, P.B.; Sandholz, S. Nature-based solutions for climate change adaptation and resilience in urban informal settlements: Insights from Kibera, Kenya and Villa, Argentina. Nat.-Based Solut. 2025, 7, 100216. [Google Scholar] [CrossRef]
  10. Givoni, B. Climate Considerations in Building and Urban Design; John Wiley & Sons: Hoboken, NJ, USA, 1998. [Google Scholar]
  11. Saito, I.; Ishihara, O.; Katayama, T. Study of the effect of green areas on the thermal environment in an urban area. Energy Build. 1991, 15, 493–498. [Google Scholar] [CrossRef]
  12. Dimoudi, A.; Nikolopoulou, M. Vegetation in the urban environment: Microclimatic analysis and benefits. Energy Build. 2003, 35, 69–76. [Google Scholar] [CrossRef]
  13. Chow, W.T.L.; Pope, R.L.; Martin, C.A.; Brazel, A.J. Observing and modeling the nocturnal park cool island of an arid city: Horizontal and vertical impacts. Theor. Appl. Climatol. 2011, 103, 197–211. [Google Scholar] [CrossRef]
  14. Ahmed, K.S. Comfort in urban spaces: Defining the boundaries of outdoor thermal comfort for the tropical urban environments. Energy Build. 2003, 35, 103–110. [Google Scholar] [CrossRef]
  15. Wai, K.-M.; Yuan, C.; Lai, A.; Yu, P.K. Relationship between pedestrian-level outdoor thermal comfort and building morphology in a high-density city. Sci. Total Environ. 2020, 708, 134–516. [Google Scholar] [CrossRef]
  16. Yahia, M.W.; Johansson, E.; Thorsson, S.; Lindberg, F.; Rasmussen, M.I. Effect of urban design on microclimate and thermal comfort outdoors in warm-humid Dar es Salaam, Tanzania. Int. J. Biometeorol. 2017, 62, 373–385. [Google Scholar] [CrossRef] [PubMed]
  17. Lin, T.; Matzarakis, A.; Hwang, R. Shading effect on long-term outdoor thermal comfort. Build. Environ. 2010, 45, 213–221. [Google Scholar] [CrossRef]
  18. Jani, D.M.; Mohd, W.M.N.W.; Salleh, S.A. Effects of High-Rise Residential Building Shape and Height on the Urban Microclimate in a Tropical Region. In IOP Conference Series: Earth and Environmental Science; IOP Publishing: Bristol, UK, 2021; Volume 767, p. 012031. [Google Scholar]
  19. CTBUH. Tall Buildings in Numbers: 2018 Year in Review. 2018. Available online: https://www.skyscrapercenter.com/year-in-review/2018# (accessed on 27 April 2023).
  20. Abu-Rayash, A.; Dincer, I. Development of an integrated model for environmentally and economically sustainable and smart cities. Sustain. Energy Technol. Assess. 2025, 73, 104096. [Google Scholar] [CrossRef]
  21. Aziz, K.M.A.; Daoud, A.O.; Singh, A.K.; Alhusban, M. Integrating digital mapping technologies in urban development: Advancing sustainable and resilient infrastructure for SDG 9 achievement—A systematic review. Alex. Engg. J. 2025, 116, 512–524. [Google Scholar] [CrossRef]
  22. Abbas, S.; Saqib, N.; Mohammed, K.S.; Sahore, N.; Shahzad, U. Pathways towards carbon neutrality in low carbon cities: The role of green patents, R&D and energy use for carbon emissions. Technol. Forecast. Soc. Change 2024, 200, 123109. [Google Scholar]
  23. Perera, N.G.R.; Emmanuel, R. A “Local Climate Zone” based approach to urban planning in Colombo, Sri Lanka. Urban Clim. 2018, 23, 188–203. [Google Scholar] [CrossRef]
  24. Oke, T.R.; Mills, G.; Christen, A.; Voogt, J.A. Climate-Sensitive Design. In Urban Climate; Cambridge University Press: Cambridge, UK, 2017; pp. 408–452. [Google Scholar]
  25. ARC3.2 Summary for City Leaders, Urban Climate Change Research Network. Available online: https://www.uccrn-europe.org/second-uccrn-assessment-report-climate-change-and-cities-arc32-summary-city-leaders (accessed on 27 May 2025).
  26. Wai, K.M.; Tan, T.Z.; Morakinyo, T.; Chan, T.-C.; Lai, A. Reduced effectiveness of tree planting on micro-climate cooling due to ozone pollution—A modeling study. Sustain. Cities Soc. 2020, 52, 101803. [Google Scholar] [CrossRef]
  27. Bruse, M.; Fleer, H. Simulating surface–plant–air interactions inside urban environments with a three dimensional numerical model. Environ. Model. Softw. 1998, 13, 373–384. [Google Scholar] [CrossRef]
  28. Ali-Toudert, F.; Mayer, H. Effects of asymmetry, galleries, overhanging facades and vegetation on thermal comfort in urban street canyons. Sol. Energy 2007, 81, 742–754. [Google Scholar] [CrossRef]
  29. Perini, K.; Magliocco, A. Effects of vegetation, urban density, building height, and atmospheric conditions on local temperatures and thermal comfort. Urban For. Urban Green. 2014, 13, 495–506. [Google Scholar] [CrossRef]
  30. Buildings Department. A Guideline of Building Regulation Submission for Lighting Requirements of Buildings Using Computational Simulations; Buildings Department HKSAR: Hong Kong, China, 2004. [Google Scholar]
  31. Lin, T.; Matzarakis, A. Tourism climate and thermal comfort in Sun Moon Lake, Taiwan. Int. J. Biometeorol. 2008, 52, 281–290. [Google Scholar] [CrossRef]
  32. Wai, K.M.; Xiao, L.; Tan, Z.T. Improvement of the outdoor thermal comfort by water spraying in a high-density urban environment under the influence of a future (2050) climate. Sustainability 2021, 13, 7811. [Google Scholar] [CrossRef]
  33. Spangenberg, J.; Shinzato, P.; Johansson, E.; Duarte, D. Simulation of the influence of vegetation on microclimate and thermal comfort in the city of Sao Paulo. Rev. Soc. Bras. Arborizao Urbana 2008, 3, 1–19. [Google Scholar] [CrossRef]
  34. Berardi, U. The outdoor microclimate benefits and energy saving resulting from green roofs retrofits. Energy Build. 2016, 121, 217–229. [Google Scholar] [CrossRef]
  35. Spagnolo, J.; de Dear, R. A field study of thermal comfort in outdoor and semi-outdoor environments in subtropical Sydney Australia. Build. Environ. 2003, 38, 721–738. [Google Scholar] [CrossRef]
  36. Zaki, S.A.; Toh, H.J.; Yakub, F.; Saudi, A.S.M.; Ardila-Rey, J.A.; Muhammad-Sukki, F. Effects of Roadside Trees and Road Orientation on Thermal Environment in a Tropical City. Sustainability 2020, 12, 1053. [Google Scholar] [CrossRef]
  37. Li, J.; Donn, M. The Influence of Building Height Variability on Natural Ventilation and Neighbor Buildings in Dense Urban Areas. In Proceedings of the Building Simulation 2017: 15th Conference of IBPSA, San Francisco, CA, USA; 2017. [Google Scholar]
Figure 1. A skyscraper and surrounding high-rise buildings (>25 stories) located in an urban area of southern China (photo taken by the author).
Buildings 15 01913 g001
Figure 2. Hypothetical CBD design and its mitigated approaches: (a) the original design CBD0; (b) close-proximity approach CBD1; (c) central-park approach CBD2; and (d) green-belt-splitting approach CBD3. The main analyzed area (dotted red-line box), wake region (dotted blue-line box), length scale (m), and building heights are shown.
Buildings 15 01913 g002
Figure 3. Plots of the (a) hourly variation of air temperature in summer months and (b) wind rose in July of the typical year.
Buildings 15 01913 g003
Figure 4. A framework for the study methodology.
Buildings 15 01913 g004
Figure 5. Pedestrian-level (1.2 m a.g.l.) distribution of air temperature at (a) 12:00 and (b) 14:00; (c) wind velocity at 14:00; PET at (d) 12:00, (e) 14:00, and (f) 16:00 for CBD0. The length scale is given in Figure 2.
Buildings 15 01913 g005
Figure 6. Pedestrian-level (1.2 m a.g.l.) distribution of (a) air temperature and (b) PET at 14:00 for CBD1. The length scale is given in Figure 2. Trees are located in the green box.
Buildings 15 01913 g006
Figure 7. Pedestrian-level (1.2 m a.g.l.) distribution of air temperature for (a) CBD2 and (b) CBD3; wind velocity for (c) CBD2 and (d) CBD3; PET (e) CBD2 and (f) CBD3 at 14:00. The length scale is given in Figure 2. Trees are located in the green box.
Buildings 15 01913 g007
Table 1. Meteorological inputs for the ENVI-met model.
Shenzhen CBD
Initial air temperature27.0 °C
Prevailing wind speed (at 10 m a.g.l.)2.5 ms−1
Prevailing wind direction225°
Relative humidity90%
Roughness length0.1 m
Table 2. Human thermal sensation category for the study.
Thermal SensationPET (°C)
Very cold<14
Cold14 to 18
Cool18 to 22
Slightly cool22 to 26
Neutral26 to 30
Slightly warm30 to 34
Warm34 to 38
Hot38 to 42
Very hot>42
Table 3. Comparative summary of the tree approaches.
Tree ApproachFeaturesRemarks
CBD1The configuration mirrored CBD0, with trees arranged at the CBD center and aligned with the streamwise direction.--
CBD2Trees were placed centrally, forming a green belt perpendicular to the streamwise direction.CBD2 and CBD3 shared a similar building arrangement, reducing symmetry, increasing building height variability, and expanding the central open space compared to CBD0 and CBD1.
CBD3CBD2 green belt was split, placing half the trees upwind and the rest at the CBD center.
Disclaimer/Publisher’s Note: The statements, opinions and data contained in all publications are solely those of the individual author(s) and contributor(s) and not of MDPI and/or the editor(s). MDPI and/or the editor(s) disclaim responsibility for any injury to people or property resulting from any ideas, methods, instructions or products referred to in the content.

