Article

Effect of Sandstone Fineness on Mineral Formation and Hydration Properties of Portland Clinker

1
College of Materials Science and Engineering, Nanjing Tech University, Nanjing 211816, China
2
Key Laboratory for Advanced Technology in Environmental Protection of Jiangsu Province, Yancheng Institute of Technology, Yancheng 224051, China
*
Authors to whom correspondence should be addressed.
Buildings 2025, 15(11), 1910; https://doi.org/10.3390/buildings15111910
Submission received: 21 April 2025 / Revised: 23 May 2025 / Accepted: 29 May 2025 / Published: 1 June 2025

Abstract

The fineness of the raw material is the essential factor affecting the burnability of raw meal, with the fineness of the siliceous material being of the utmost importance. In this paper, Portland clinker was prepared from sandstones with four different particle sizes. The effects of sandstone fineness on calcination, crystal structure, phase assemblage, and hydration of the clinker were investigated by means of thermomechanical analysis (TMA), X-ray diffraction analysis (XRD), isothermal conduction calorimetry (ICC), and thermogravimetric analysis (TGA). The results show that as sandstone fineness decreases, the clinkers undergo a gradual decrease in shrinkage during calcination, alongside a consistent rise in free lime (f-CaO) content. The decrease in sandstone fineness has been shown to have a significant effect on the size of C3S and C2S, but no obvious effect on their crystal structure. The f-CaO rapidly reacts with water to form Ca(OH)2 in the initial stage of cement hydration, resulting in the shortening of the hydration induction period and the advance of the hydration of C3S. Furthermore, the compressive strength of Portland cement increases with the increase in sandstone fineness at every age, and the increase in age compensates for the differences in strength among samples.

1. Introduction

Cement is one of the three fundamental materials in the construction industry, with a wide range of applications including roads, bridges, dams, and other buildings. It is an indispensable building material for economic development and people’s lives [1]. The production of cement requires the consumption of substantial quantities of calcareous and siliceous raw materials, including limestone and clay. However, due to the urgent need for environmental protection, alternative raw materials such as low-grade limestone and some industrial solid waste (sandstone, coal gangue, tailings, etc.) with a high quartz grain content have been used to prepare Portland clinker [2,3,4,5,6]. Extensive studies have demonstrated that the grain size of SiO2 exerts a dominant impact on the properties of Portland clinker [7,8]. Therefore, it is of great significance to study the influence of quartz grain size on clinker calcination and properties, which is conducive to improving clinker quality and reducing energy consumption in the process of cement production.
Maki et al. [9] found that when the distance between quartz grains in the raw meal is less than twice the sum of their radii, a large C2S cluster would aggregate. Christensen et al. [10,11] proposed a reaction theory of SiO2 and CaO. It was highlighted that C2S with different sizes was formed and subsequently reacted with CaO to form C3S during the calcination process of clinker. The C2S formed from small grains of SiO2 has a reduced size, and its conversion rate to C3S is high. In contrast, Shirahama et al. [12] proposed that the effect of quartz grain size on the formation rate of C2S at low temperature is significant, but that the effect on the formation rate of C3S at high temperature is negligible. To date, there have been few studies on the effect of quartz grain size on the calcination and properties of Portland clinker. Furthermore, the quantitative relationship between quartz grain size and the microstructure of clinker, as well as the action mechanism, is also lacking in the current literature.
In this paper, four kinds of sandstone with different fineness were used as raw materials to prepare Portland clinker. The effects of sandstone fineness on the calcination of raw meal, phase assemblage, microstructure, and properties of Portland clinker were investigated. Compared to previous studies, this study, for the first time, employs thermomechanical analysis to investigate the effect mechanism of sandstone fineness on Portland clinker formation. Furthermore, this study establishes quantitative mathematical relationships and equations between sandstone fineness and clinker mineral composition, grain size, and cement mechanical properties.

2. Materials and Methods

2.1. Materials

2.1.1. Raw Materials

The industrial raw materials used in this experiment include low-grade limestone, sandstone, bauxite, iron slag, and desulfurized gypsum. Among these, low-grade limestone, sandstone, bauxite, and iron slag were used for the raw meal production, while desulfurized gypsum was employed for the cement production. Their chemical compositions are presented in Table 1. The grinding of low-grade limestone, bauxite, iron slag, and desulfurized gypsum was conducted in the laboratory ball mill, with a target diameter of D90 less than 80 μm. Sandstone was subjected to a grinding process and was subsequently sieved into four designated particle size grades. They are named S1, S2, S3, and S4, respectively, according to their particle sizes from fine to coarse. The detailed particle size distributions of sandstones are shown in Table 2. The particle size distributions of the aforementioned materials are presented in Figure 1. In addition, the desulfurized gypsum used in this experiment is hemihydrate gypsum, and its XRD pattern is shown in Figure 2.

2.1.2. Preparation of Clinkers

The raw meals were prepared based on the following parameters: KH = 0.92, SM = 2.5, and IM = 1.5. The calculation formulas are listed as follows (Equations (1)–(3)) [13]. The raw meals prepared with sandstones designated S1 to S4 are named R-S1 to R-S4, respectively. The composition of the raw meals is presented in Table 3.
L i m e   s a t u r a t i o n   r a t i o K H = C a O 1.65 A l 2 O 3 0.35 F e 2 O 3 2.80 S i O 2
S i l i c a   r a t i o S M = S i O 2 A l 2 O 3 + F e 2 O 3
A l u m i n a   r a t i o I M = A l 2 O 3 F e 2 O 3
As illustrated in Figure 3a, the particle size distributions of raw meals match the trend observed in the sandstones. In this experiment, raw meals were initially pressed into blocks (60 mm × 60 mm × 5 mm). Subsequently, these blocks were calcined in a high-temperature furnace from room temperature to 900 °C (10 °C/min), with a holding time of half an hour at 900 °C. This was followed by continued calcination to 1450 °C, which was maintained for a further half an hour. After calcination, the blocks were removed from the high-temperature furnace and quickly cooled in air to obtain the Portland clinkers. The clinkers were then ground into powder, and their specific surface area was maintained within a tightly regulated range of 350 ± 10 m2/kg. The Portland clinkers prepared with S1 to S4 sandstones were named P-S1 to P-S4, respectively. Figure 3b shows the particle size distribution of clinkers.

2.1.3. Preparation of Cements and Paste

The cements were formulated by blending clinkers with desulfurized gypsum at a constant 95:5 mass ratio. The cements prepared with sandstones designated S1 to S4 are named C-S1 to C-S4, respectively.
The paste was prepared by mixing cement and water, with a mass ratio of 0.5. The paste was then poured into a separate plastic tube after being stirred for 4 min. It was subsequently placed in a standard curing box (20 ± 2 °C and 95 ± 5% RH) for 2, 4, 8, 12, and 24 h. Upon reaching the curing age, the hardened paste was sectioned into 3 mm × 3 mm specimens and soaked in ethanol. After 3 d of soaking, the samples were extracted from the ethanol and placed in an airtight vacuum desiccator until the tests were conducted.

2.2. Methods

2.2.1. Specific Surface Area Test

The specific surface area of clinkers was measured according to the Blaine method outlined in the Chinese standard GB/T 8024-2008 [14]. An air permeability method was used in the experiment, using the SBT-127 digital Blaine air permeability (Jianyi Experimental Equipment Co., Ltd., Wuxi, China) apparatus to conduct permeation time tests. Given that the porosity of the clinkers is the same as that of the standard sample and the test temperature difference is less than 3 °C, the specific surface area is calculated using Equation (4). The calculated parameters are summarized in Table 4.
S = S S ρ S T ρ T S
where S is the specific surface area of clinkers, SS is the specific surface area of the standard sample, ρ is the density of the clinkers, ρS is the density of the standard sample, T is the permeation time of the clinkers, and TS is the permeation time of the standard sample.

2.2.2. Particle Size Distribution Analysis (PSD)

A Microtrac S3500 laser particle size analyzer (Microtrac Inc., Largo, FL, USA) was utilized to measure the particle size distributions of the samples. This analyzer has a measurement range spanning from 0.01 to 2800 μm. Deionized water was used as the dispersion medium for raw materials and raw meals, and ethanol was used as the dispersion medium for clinkers. The samples were added to the dispersion medium for ultrasonic dispersion for 1 min, after which they were measured.

2.2.3. X-Ray Fluorescence Spectroscopy (XRF)

The X-ray fluorescence spectroscopy technique was employed to analyze the chemical composition of the raw materials and Portland clinker. The samples were tested via the Philips PW2400 XRF spectrometer (Philips, Eindhoven, The Netherlands), with data analysis conducted using UniQuant software (Ver.5.52). Since the raw materials and their mix proportions used for the four kinds of clinker prepared in this paper were all the same, only P-S1 was tested to represent the chemical composition of the clinkers.

2.2.4. Thermomechanical Analysis (TMA)

The Setaram setsys evo thermomechanical analyzer was used to characterize the physical and chemical reactions of raw meals during calcination. The raw meals were fully calcined at 900 °C to avoid the volume change caused by calcium carbonate (CaCO3) decomposition. Subsequently, the calcined raw meals were pressed into a cylindrical sample with a diameter of 2 mm and a height of 4 mm under 2 MPa, and then placed in an alumina crucible for testing. The samples were heated from 50 °C to 1450 °C at 10 °C/min under a N2 atmosphere (20 mL/min).

2.2.5. X-Ray Diffraction Analysis (XRD)

The XRD data were collected using a Rigaku Miniflex (Rigaku Corporation, Tokyo, Japan) with Cu Kα radiation (λ = 0.15406 nm), and an automatic six-sample changer was used. For the purpose of quantitative analysis, the data were collected from 5° to 70° (2θ) in steps of 0.01 at 5°/min. To determine the content of the amorphous phase in the clinker, an external standard method was used for quantification. To ensure the accuracy of the fitting results, the quantitative data were analyzed using Highscore Plus (Ver.5.3a) with requirements of R-weighted pattern (Rwp) < 10.0% and Goodness of fit (Gof) < 2.0. The information on the cards used in the refining process is referred to in Table 5.

2.2.6. Optical Microscope

A Leica DM4M microscope was used to capture microscopic images. The clinkers were embedded in epoxy resin and then polished using a Buehler EcoMet 250 polisher (Buehler, Lake Bluff, IL, USA). The samples were polished with diamond suspensions on polishing discs of 9 μm, 6 μm, 3 μm, and 1 μm, with the polishing times set at 0.5 h, 0.5 h, 1 h, and 1.5 h, respectively. Subsequent to the completion of the polishing process, the samples were ultrasonically cleaned in ethanol and then etched in a 1% nitric acid-ethanol solution.

2.2.7. Raman Spectroscopy

Raman imaging was performed on the Xpiora Plus spectrometer (HORIBA, Kyoto, Japan) featuring an 1800 gr/mm grating and a 532 nm laser. The XY images were recorded on 40 × 40 μm spots with a 0.5 μm step (each lasting 2 s), and the spectral ranges were from 100 cm−1 to 4000 cm−1. The data were processed by using LabSpec6 software (Ver.6.3).

2.2.8. Isothermal Conduction Calorimetry (ICC)

A thermometric TAM Air 8-channel isothermal conduction calorimeter (TA Instruments, New Castle, DE, USA) was used to measure the hydration kinetics of cement at 20 °C over 72 h. The experiment was carried out with internal agitation. A total of 4 g of clinker was weighed and placed into a glass bottle, and 2 g of deionized water was drawn into the syringe. When the temperature in the instrument was stable, the water was injected into the glass bottle, and the data were recorded immediately.

2.2.9. Electrical Conductivity Measurement

The MultiCAD-4 conductivity meter (CAD Instruments, Saint-Quentin-en-Yvelines, France) was used to measure the electrical conductivity of cement. A total of 100 g of deionized water was weighed and added to the test chamber. When the temperature inside the chamber was stabilized at 20 °C, 1 g of cement sample was added, and the data were recorded immediately.

2.2.10. Thermogravimetric Analysis (TGA)

Thermogravimetric analysis of the hydrated samples was performed using a Mettler Toledo TGA/DSC 1/1600 instrument (Mettler Toledo, Zurich, Switzerland). The powder sample was placed in corundum crucibles and heated from 50 °C to 600 °C at a heating rate of 10 °C/min under a N2 atmosphere.

2.2.11. Compressive Strength Test

This experiment involved casting mortars with dimensions of 40 × 40 × 40 mm. The mixture was prepared with a cement–sand–water ratio of 1:3:0.5 by mass. The mortars underwent standard curing under controlled conditions (95 ± 5% RH, 20 ± 2 °C). Compressive strength data were collected at 1, 3, 7, 28, 56, and 90 d using the AEC-201 cement strength testing machine (Ruifeng Instrument Manufacturing Co., Ltd., Shanghai, China), and the average value of the six blocks was taken as the result according to the Chinese standard GB/T 17671–2021 [23].

3. Results and Discussion

3.1. Thermomechanical Analysis of Raw Meals

Figure 4 shows the thermomechanical curve of the raw meals. As depicted in Figure 4, all samples undergo obvious volume changes during calcination, which can be divided into three stages. The first stage is characterized by the low-temperature shrinkage, occurring from approximately 900 °C to 1270 °C. This is followed by a second stage of the medium-temperature, slight expansion from about 1270 °C to 1360 °C. The third stage is marked by the high-temperature shrinkage, from about 1360 °C to 1450 °C.
It is widely acknowledged that the reactions that occur in the low-temperature stage are mainly solid-phase reactions [13,24]. In accordance with the mechanism of solid phase reactions, the volume change before and after the reactions can be calculated (see Table 6). As demonstrated in Table 6, the formation of C2S and C3A is a shrinkage reaction, while the formation of C4AF is an expansion reaction. The manifestation of these reactions is evident as volume shrinkage in the low-temperature stage, attributable to the comparatively limited content of C4AF. When the sandstone particle size is less than 45 μm, the initial shrinkage temperature of the sample increases significantly, and the shrinkage ratio decreases significantly. Combined with Figure 8e, the presence of large quartz grains in the coarse sandstone leads to the formation of C2S clusters, which are more compactly piled up. This phenomenon is indicative of a greater volume shrinkage on a macroscopic level. The slight expansion observed in the second stage can be attributed to the conversion of C2S to C3S. As demonstrated in Table 5, the formation of C3S is a slightly expansive reaction. Moreover, an increase in the expansion temperature with a decrease in sandstone fineness is indicative of a slowing down of the formation rate of C2S. The shrinkage observed in the third stage can be attributed to the formation of the liquid phase. It is evident that the shrinkage rate of the sample decreases with decreasing sandstone fineness. Furthermore, the surface of clinker becomes progressively looser, and the volume shrinkage rate decreases concomitantly with decreasing sandstone fineness (see Figure 5).

3.2. Phase Composition of Clinkers

Figure 6 shows the XRD patterns of Portland clinkers. As shown in Figure 6, the main phases in these clinkers include C3S, C2S, C3A, C4AF, and f-CaO. The peak diffraction (2θ = 29.2°) intensity of C3S gradually decreases with the decrease in the fineness of sandstone, while the peak diffraction (2θ = 37.2°) intensity of f-CaO increases significantly. Table 7 shows the quantitative results of the clinkers by means of the external standard method. As sandstone fineness decreases, the content of C2S and f-CaO gradually increases, while the content of C3S and amorphous phase gradually decreases. Meanwhile, the content of C3A and C4AF remains relatively constant. The contents of C3S and C2S show a linear relationship with the fineness of sandstone (D90), while f-CaO exhibits a non-linear relationship with the fineness of sandstone. Their quantitative mathematical relationships and equations are shown in Figure 7. The increase in C2S content and decrease in C3S content in clinker will lead to an increase in grinding energy consumption and a reduction in early strength of cement. Additionally, excessive f-CaO content (>1.5%) may cause volumetric expansion after cement hardening, thereby affecting its soundness. It has been reported that the grain size of quartz in sandstone is directly proportional to the fineness of sandstone, and the content of f-CaO in clinker is negatively correlated with the grain size of quartz [12]. With an increase in quartz grain size, the contact surface between components decreases correspondingly, resulting in a decrease in the free energy of surface particles and ultimately slowing down the reaction rate [13]. Consequently, it can be concluded that the fineness of the sandstone exerts a substantial influence on the burnability of the raw meals, and that an enhancement in sandstone fineness is conducive to the conversion of C2S to C3S.

3.3. Microstructure Analysis of Clinkers

Figure 8 shows the effect of sandstone fineness on clinker microstructure, which was observed using optical microscopy. As shown in Figure 8a, the C3S has a small size, a distinct boundary, and its crystal shape is primarily columnar and hexagonal flake for P-S1. In contrast, the C3S exhibits a larger size, a less defined boundary, and an irregular shape for P-S2 (see Figure 8c). Furthermore, as illustrated in Figure 8c, a small quantity of C2S is observed to be wrapped by C3S in P-S4. The size of C2S is uniform, measuring between 10 and 30 μm, and its crystal shape is brain-like and pockmarked for P-S1 (see Figure 8b). The number of C2S is significantly higher in P-S4 than in P-S1, and two morphologies of C2S are found in P-S4 (see Figure 8d,e). Some C2S is relatively small in size, exhibiting clear crossed twin-crystal streaks and a circular morphology (see Figure 8d). On the contrary, the other C2S is comparatively large in size, with clear edges and corners (see Figure 8e), and it bears a resemblance to C3S. To ascertain this phase, three points were selected for identification by Raman spectroscopy (see Figure 9). The fluctuations exhibited in their Raman spectra are all the same. This observation serves to substantiate the conclusion that the phases in question are indeed identical, thereby validating the determination that the phase depicted in Figure 8e is C2S. Figure 8f shows the f-CaO in P-S4. The f-CaO is generally distributed in small piles, and the surface of f-CaO is colored pockmarked after being corroded by the nitric acid-ethanol solution.
Figure 10 shows the proportion of C3S and C2S within the same size range for all clinkers. It is evident that the size of C2S increases gradually as the sandstone fineness decreases. The particle size distribution of C3S is found to be similar for P-S1 and P-S2, with the majority of particles measuring below 30 μm. However, a marked increase in the proportion of C3S with a size greater than 30 μm is evident in P-S3 compared to other clinkers. Conversely, the size of C3S is significantly smaller for P-S4 than that for P-S3. Table 8 provides a comprehensive overview of the size statistics of C3S and C2S. The average size of C2S gradually increases with the decrease in sandstone fineness for all clinkers. The change in the average size of C3S is consistent with that of C2S for P-S1, P-S2, and P-S3, but the average size of C3S is clearly smaller for P-S4 than that of P-S3. This discrepancy can be attributed to the fact that the large size of C2S hinders the conversion of C2S to C3S, resulting in a smaller size of C3S for P-S4. The mean grain sizes of C2S and C3S exhibit nonlinear relationships with sandstone fineness (D90), whose quantitative mathematical correlations and equations are presented in Figure 11.

3.4. Hydration Kinetics of Cement

Figure 12 shows the heat flow and cumulative heat of all cements. As shown in Figure 12a, the initial exothermic peak was attributed to the rapid hydration of C3A to produce ettringite (AFt) in the presence of gypsum for all samples [25]. It is evident that the initial exothermic peak of C-S3 and C-S4 is significantly higher than that of C-S1 and C-S2. The second exothermic peak appeared before the induction period for all samples because of the reaction of hemihydrate gypsum with water to form dihydrate gypsum [26]. However, this peak is relatively weak. The third exothermic peak is attributed to the hydration of C3S [27]. A decrease in sandstone fineness results in a reduction of the hydration induction period and advancement of the hydration of C3S. The shoulder peak following the third peak was associated with the renewal dissolution of aluminate and the formation of ettringite (AFt) [28,29]. Figure 13 presents the conductivity measurements of cement during the induction period. The results demonstrate an inverse correlation between cement conductivity and sandstone fineness, attributable to variations in Ca2+ and OH ion concentrations within the cement paste. It has been reported that an increase in the concentration of Ca2+ and OH ions has been shown to promote the nucleation and growth rate of C-S-H gel [30,31,32]. This is consistent with the characteristic features observed in the hydration heat curve.
The cumulative heat of all samples is shown in Figure 12b. Within 30 h of hydration, the cumulative heat of C-S3 and C-S4 was higher than that of C-S1 and C-S2. However, the content of C3S in C-S1 and C-S2 was significantly higher than that in C-S3 and C-S4. With the continuous hydration of C3S, the cumulative hydration heat of C-S1 and C-S2 exceeded that of C-S3 and C-S4 after 30 h due to the presence of a greater quantity of C3S.

3.5. Hydration Products of Cement

In order to further explore the differences among all samples, the hydration products of cements within 24 h were compared. Figure 14 shows the XRD patterns and TG-DTG curves of cements hydrated for 2 h. At 2 h, the f-CaO diffraction peak (2θ = 37.2°) in XRD patterns of all samples disappeared, while the weak Ca(OH)2 diffraction peak (2θ = 18.0°) appeared, indicating that the f-CaO reacts with water to form Ca(OH)2. Furthermore, the TG curves demonstrated that C-S3 and C-S4 undergo greater mass loss at about 450 °C in comparison to C-S1 and C-S2, which corresponds to the dehydration of Ca(OH)2 [33]. Additionally, the diffraction peaks of AFt (2θ = 9.1°) and gypsum (2θ = 11.6°) also appeared in the XRD patterns. Concurrently, the DTG curves exhibit endothermic peaks of AFt and C-S-H gel at 85 °C and gypsum at 130 °C [33]. When the cements were hydrated for 8 h (see Figure 15), the diffraction peaks of gypsum and its endothermic peaks were absent for C-S3 and C-S4. The rate of gypsum consumption was found to be significantly faster for C-S3 and C-S4 than for C-S1 and C-S2. This phenomenon can be attributed to the higher content of f-CaO in C-S3 and C-S4 reacting with water to form increased amounts of Ca(OH)2. It has been reported that the increase in Ca(OH)2 changes the pH of the cement paste, thereby accelerating the consumption of gypsum [34]. At 12 h of hydration (see Figure 16), the diffraction peaks of gypsum and the endothermic peaks of gypsum disappeared for all samples.
Figure 17 shows the quantitative results for the hydrates of cement pastes at different ages. In the early stage of hydration, C3S and f-CaO hydrate rapidly to form Ca(OH)2, and C3A also hydrates rapidly to form AFt. With the increase in age, the contents of Ca(OH)2 and AFt gradually increase, while the contents of C3S and C3A gradually decrease. Meanwhile, the contents of C2S and C4AF remain relatively constant. The hydration degree of C3A is significantly higher for C-S3 and C-S4 than that of C-S1 and C-S2 (see Figure 18a). This observation can be attributed to the elevated content of Ca(OH)2 in C-S3 and C-S4, which augments the concentration of Ca2+ in the paste and promotes the hydration of C3A [33]. Because of the reaction of more f-CaO and the hydration of more C3A, C-S3 and C-S4 have higher initial exothermic peaks (see Figure 12a) and more accumulated heat within 30 h (see Figure 12b) compared to C-S1 and C-S2. Furthermore, the hydration of C3S is advanced due to the rapid hydration of f-CaO to form Ca(OH)2, which is consistent with the hydration heat (see Figure 12a).

3.6. Compressive Strength

Figure 19 shows the compressive strength of all cements at varying curing ages. Although the content of f-CaO in C-S3 and C-S4 is greater than the critical value of 1.5%, its impact on the stability of the cement paste is negligible due to its rapid reaction during the plastic stage. The decrease in the compressive strength with decreasing sandstone fineness at a given age is evident. The 3-day compressive strength of C-S4 was only 50% of that of C-S1, which was attributed to the higher C3S content in C-S1. As the primary mineral phase in cement clinker, C3S demonstrates a faster hydration rate and plays a decisive role in early strength development. The development trend of 7-day compressive strength closely mirrored that observed at 3 days. However, upon extending the curing age to 28 days, C-S3 and C-S4 exhibited marked strength enhancement, as the elevated C2S content in C-S3 and C-S4 played a critical role in enhancing the long-term strength development of the cement [35]. By 90 days, the compressive strength of C-S4 had reached 66.3 MPa, representing 91.0% of that of C-S1.
Figure 20 delineates the quantitative correlation between sandstone fineness (D90) and cement compressive strength development. Linear relationships were established between the fineness parameter and strength values across all curing ages, with their statistically derived regression equations and corresponding determination coefficients (R2) tabulated in Table 9.

4. Conclusions

This study employed thermomechanical analysis (TMA), X-ray diffraction (XRD), and optical microscopy to investigate the influence of sandstone fineness on raw meal calcination, phase assemblage, and clinker microstructure. Isothermal calorimetry (ICC), X-ray diffraction (XRD), thermogravimetric analysis (TGA), and compressive strength testing were utilized to examine the effects of sandstone fineness on cement hydration kinetics, hydration product evolution, and mechanical properties. The following specific conclusions were drawn from the above results and discussion:
(1) The process of clinker calcination can be divided into three stages according to the volume change: The low-temperature shrinkage from approximately 900 °C to 1270 °C, the medium-temperature slight expansion from about 1270 °C to 1360 °C, and the high-temperature shrinkage from about 1360 °C to 1450 °C. The shrinkage in the first and third stages is caused by the solid phase reaction and the formation of the liquid phase, respectively. The slight expansion observed in the second stage is attributed to the conversion of C2S to C3S, as well as the absence of substantial liquid phase formation at this stage;
(2) As the fineness of sandstone decreases, the contents of C2S and f-CaO gradually increase, and the sizes of C3S and C2S also increase. The C3S generated from fine sandstone has a small size, a clear boundary, and its shape is mostly columnar and hexagonal flaky. The C3S generated from coarse sandstone has a large size, a blurred boundary, and an irregular shape. The C2S generated from fine sandstone has a small size and a circular shape, while the C2S generated from coarse sandstone has a large size with clear edges and corners, similar to that of C3S;
(3) During cement hydration, the f-CaO reacts immediately with water to form Ca(OH)2, thereby accelerating the hydration process. This acceleration is reflected in the hydration heat curve by a higher initial exothermic peak intensity, a shortened induction period, and an earlier occurrence of the C3S exothermic peak. In terms of hydration product evolution, it leads to an accelerated dissolution rate of gypsum as well as enhanced hydration degrees of both C3A and C3S;
(4) Despite the higher content of f-CaO in C-S3 and C-S4 exceeding the critical value of 1.5%, its effect on the stability of the cement paste is negligible due to its rapid reaction during the molding stage. Furthermore, the difference in compressive strength between C-S1 and C-S4 showed a decreasing trend with increasing curing age. The 3-day compressive strength of C-S4 is only 50.0% of that of C-S1, and the 90-day compressive strength of C-S4 reaches 66.3 MPa, which is 91.0% of that of C-S1;
(5) Additionally, this study employs linear and parabolic equations to establish quantitative mathematical relationships and equations between sandstone fineness and (i) clinker mineral composition (C3S, C2S, f-CaO content), (ii) crystal grain size (C3S and C2S mean size), and (iii) cement compressive strength. This approach significantly enhances the practical applicability of the research in the cement production industry.

Author Contributions

Conceptualization, X.Z. and H.X.; methodology, X.Z. and W.Y.; software, X.Z. and S.M.; validation, J.S. and H.X.; formal analysis, W.Y.; investigation, X.Z.; resources, S.M.; data curation, X.Z. and H.X.; writing—original draft preparation, X.Z. and W.Y.; writing—review and editing, J.S.; visualization, W.L.; supervision, S.M.; project administration, S.M.; funding acquisition, S.M. and W.L. All authors have read and agreed to the published version of the manuscript.

Funding

This work is supported by the National Key Research and Development Program of China (2024YFE0210300), the Jiangsu Province Science and Technology Plan Project of China (No. BT2024009), and the Project funded by the Priority Academic Program Development of Jiangsu Higher Education Institutions (PAPD).

Data Availability Statement

The data associated with this study are available from the corresponding author upon request.

Acknowledgments

The authors acknowledge the facility support from the Modern Analysis and Testing Center of Nanjing Tech University.

Conflicts of Interest

The authors declare no conflicts of interest.

References

  1. Xu, D.; Cui, Y.; Li, H.; Yang, K.; Xu, W.; Chen, Y. On the future of chinese cement industry. Cem. Concr. Res. 2015, 78, 2–13. [Google Scholar] [CrossRef]
  2. Qiu, G.; Luo, Z.; Shi, Z.; Ni, M. Utilization of coal gangue and copper tailings as clay for cement clinker calcinations. J. Wuhan Univ. Technol. Mater. Sci. Ed. 2011, 26, 1205–1210. [Google Scholar] [CrossRef]
  3. Wang, Q.; Li, J.; Zhu, X.; Yao, G.; Wu, P.; Wang, Z.; Lyu, X.; Hu, S.; Qiu, J.; Chen, P.; et al. Approach to the management of gold ore tailings via its application in cement production. J. Clean. Prod. 2020, 269, 122303. [Google Scholar] [CrossRef]
  4. Sun, C.; Zhang, J.; Yan, C.; Yin, L.; Wang, X.; Liu, S. Hydration characteristics of low carbon cementitious materials with multiple solid wastes. Constr. Build. Mater. 2022, 322, 126366. [Google Scholar] [CrossRef]
  5. Wang, A.; Pan, Y.; Zhao, J.; Liu, P.; Wang, Y.; Chu, Y.; Liu, K.; Sun, D. Research progress of resourceful and efficient utilization of coal gangue in the field of building materials. J. Build. Eng. 2025, 99, 111526. [Google Scholar] [CrossRef]
  6. Young, G.; Yang, M. Preparation and characterization of portland cement clinker from iron ore tailings. Constr. Build. Mater. 2019, 197, 152–156. [Google Scholar] [CrossRef]
  7. Chatterjee, A.K. Chemistry and engineering of the clinkerization process—Incremental advances and lack of breakthroughs. Cem. Concr. Res. 2011, 41, 624–641. [Google Scholar] [CrossRef]
  8. Nie, D.; Li, W.; Xie, L.; Deng, M.; Ding, H.; Liu, K. Effects of fineness and morphology of quartz in siliceous limestone on the calcination process and quality of cement clinker. Materials 2024, 17, 3601. [Google Scholar] [CrossRef]
  9. Maki, I.; Fukuda, K.; Imura, T.; Yoshida, H.; Ito, S. Formation of belite clusters from quartz grains in portland cement clinker. Cem. Concr. Res. 1995, 25, 835–840. [Google Scholar] [CrossRef]
  10. Christensen, N.H. Burnability of cement raw mixes at 1400 °C i the effect of the chemical composition. Cem. Concr. Res. 1979, 9, 219–228. [Google Scholar] [CrossRef]
  11. Christensen, N.H.; Smidth, F.L. Burnability of cement raw mixes at 1400 °C ii the effect of the fineness. Cem. Concr. Res. 1979, 9, 285–294. [Google Scholar] [CrossRef]
  12. Shirahama, N.; Yamashita, M.; Tanaka, H. The influence of crystal properties of quartz in raw materials on the formation of clinker minerals. In Proceedings of the 14th International Congress on the Chemistry of Cement (ICCC 2015), Beijing, China, 13–16 October 2015. [Google Scholar]
  13. Taylor, H.F.W. Cement Chemistry; Thomas Telford: London, UK, 1997. [Google Scholar]
  14. GB/T 8074-2008; Testing Method for Specific Surface of Cement-Blaine Method, China. Standards Press of China: Beijing, China, 2008.
  15. De La Torre, Á.G.; Bruque, S.; Campo, J.; Aranda, M.A.G. The superstructure of c3s from synchrotron and neutron powder diffraction and its role in quantitative phase analyses. Cem. Concr. Res. 2002, 32, 1347–1356. [Google Scholar] [CrossRef]
  16. Primak, W.; Kaufman, H.; Ward, R. X-ray diffraction studies of systems involved in the preparation of alkaline earth sulfide and selenide phosphors1. J. Am. Chem. Soc. 1948, 70, 2043–2046. [Google Scholar] [CrossRef]
  17. Mumme, W.G.; Hill, R.J.; Bushnell-wye, G.; Segnit, E.R. Rietveld crystal structure refinements, crystal chemistry and calculated powder diffraction data for the polymorphs of dicalcium silicate. Neues Jahrb. Mineral. Abhandlungen 1995, 169, 35–68. [Google Scholar]
  18. Goetz-Neunhoeffer, F.; Neubauer, J. Refined ettringite (Ca6Al2(SO4)3(OH)12∙26H2O) structure for quantitative X-ray diffraction analysis. Powder Diffr. 2006, 21, 4–11. [Google Scholar] [CrossRef]
  19. Colville, A.; Geller, S. The crystal structure of brownmillerite, Ca2FeAlO5. Acta Crystallogr. Sect. B Struct. Crystallogr. Cryst. Chem. 1971, 27, 2311–2315. [Google Scholar] [CrossRef]
  20. Abriel, W.; Reisdorf, K.; Pannetier, J. Dehydration reactions of gypsum: A neutron and X-ray diffraction study. J. Solid State Chem. 1990, 85, 23–30. [Google Scholar] [CrossRef]
  21. Palacios, L.; De La Torre, Á.G.; Bruque, S.; García-Muñoz, J.L.; García-Granda, S.; Sheptyakov, D.; Aranda, M.A.G. Crystal structures and in-situ formation study of mayenite electrides. Inorg. Chem. 2007, 46, 4167–4176. [Google Scholar] [CrossRef]
  22. Petch, H. The hydrogen positions in portlandite, Ca(OH)2, as indicated by the electron distribution. Acta Crystallogr. 1961, 14, 950–957. [Google Scholar] [CrossRef]
  23. GB/T 17671–2021; Test Method of Cement Mortar Strength (ISO Method), China. Standards Press of China: Beijing, China, 2021.
  24. Telschow, S.; Frandsen, F.; Theisen, K.; Dam-Johansen, K. Cement formation—A success story in a black box: High temperature phase formation of portland cement clinker. Ind. Eng. Chem. Res. 2012, 51, 10983–11004. [Google Scholar] [CrossRef]
  25. Bullard, J.W.; Jennings, H.M.; Livingston, R.A.; Nonat, A.; Scherer, G.W.; Schweitzer, J.S.; Scrivener, K.L.; Thomas, J.J. Mechanisms of cement hydration. Cem. Concr. Res. 2011, 41, 1208–1223. [Google Scholar] [CrossRef]
  26. Pourchet, S.; Regnaud, L.; Perez, J.P.; Nonat, A. Early c3a hydration in the presence of different kinds of calcium sulfate. Cem. Concr. Res. 2009, 39, 989–996. [Google Scholar] [CrossRef]
  27. Redondo-Soto, C.; Gastaldi, D.; Irico, S.; Canonico, F.; Aranda, M.A.G. Belite clinkers with increasing aluminium content: Effect of calcium aluminates on calcium silicate hydration. Cem. Concr. Res. 2022, 162, 107015. [Google Scholar] [CrossRef]
  28. Hesse, C.; Goetz-Neunhoeffer, F.; Neubauer, J. A new approach in quantitative in-situ xrd of cement pastes: Correlation of heat flow curves with early hydration reactions. Cem. Concr. Res. 2011, 41, 123–128. [Google Scholar] [CrossRef]
  29. Jansen, D.; Goetz-Neunhoeffer, F.; Lothenbach, B.; Neubauer, J. The early hydration of ordinary portland cement (opc): An approach comparing measured heat flow with calculated heat flow from qxrd. Cem. Concr. Res. 2012, 42, 134–138. [Google Scholar] [CrossRef]
  30. Thomas, J.J.; Allen, A.J.; Jennings, H.M. Hydration kinetics and microstructure development of normal and CaCl2-accelerated tricalcium silicate pastes. J. Phys. Chem. C 2009, 113, 19836–19844. [Google Scholar] [CrossRef]
  31. Thomas, N.L.; Double, D.D. Calcium and silicon concentrations in solution during the early hydration of portland cement and tricalcium silicate. Cem. Concr. Res. 1981, 11, 675–687. [Google Scholar] [CrossRef]
  32. Kumar, A.; Sant, G.; Patapy, C.; Gianocca, C.; Scrivener, K.L. The influence of sodium and potassium hydroxide on alite hydration: Experiments and simulations. Cem. Concr. Res. 2012, 42, 1513–1523. [Google Scholar] [CrossRef]
  33. Trauchessec, R.; Mechling, J.M.; Lecomte, A.; Roux, A.; Le Rolland, B. Hydration of ordinary portland cement and calcium sulfoaluminate cement blends. Cem. Concr. Compos. 2015, 56, 106–114. [Google Scholar] [CrossRef]
  34. Chen, H.; Feng, P.; Ye, S.; Sun, W. The coupling effect of calcium concentration and ph on early hydration of cement. Constr. Build. Mater. 2018, 185, 391–401. [Google Scholar] [CrossRef]
  35. Chen, H.; Qin, R.; Chow, C.L.; Lau, D. Recycling thermoset plastic waste for manufacturing green cement mortar. Cem. Concr. Compos. 2023, 137, 104922. [Google Scholar] [CrossRef]
Figure 1. Particle size distributions of sandstones (a) and other raw materials (b).
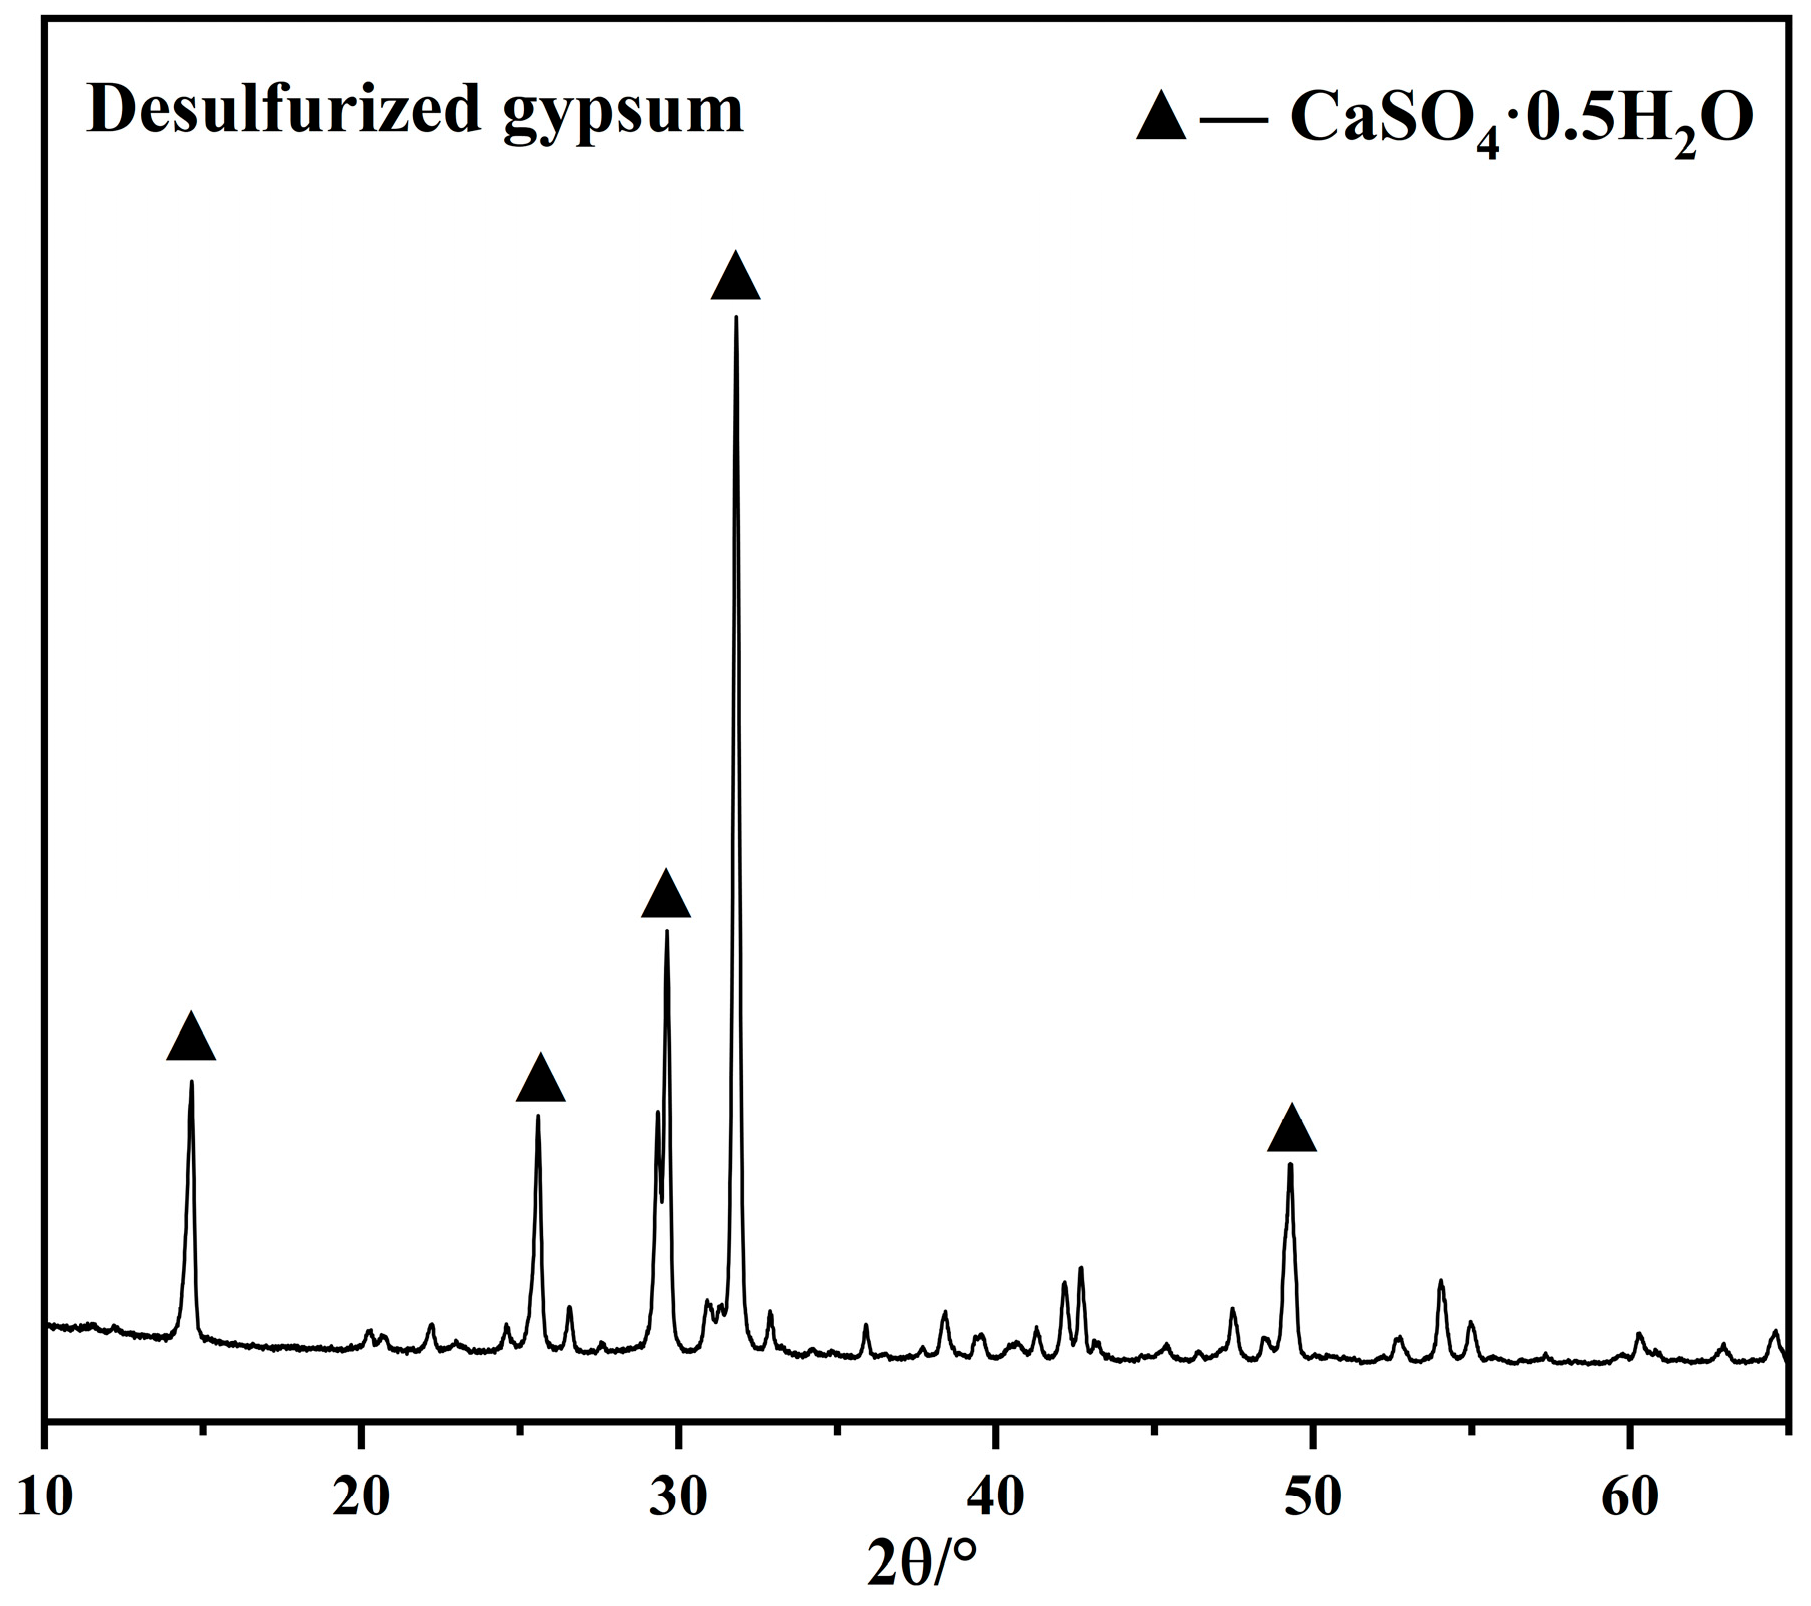
Buildings 15 01910 g001
Figure 2. XRD pattern of desulfurized gypsum.
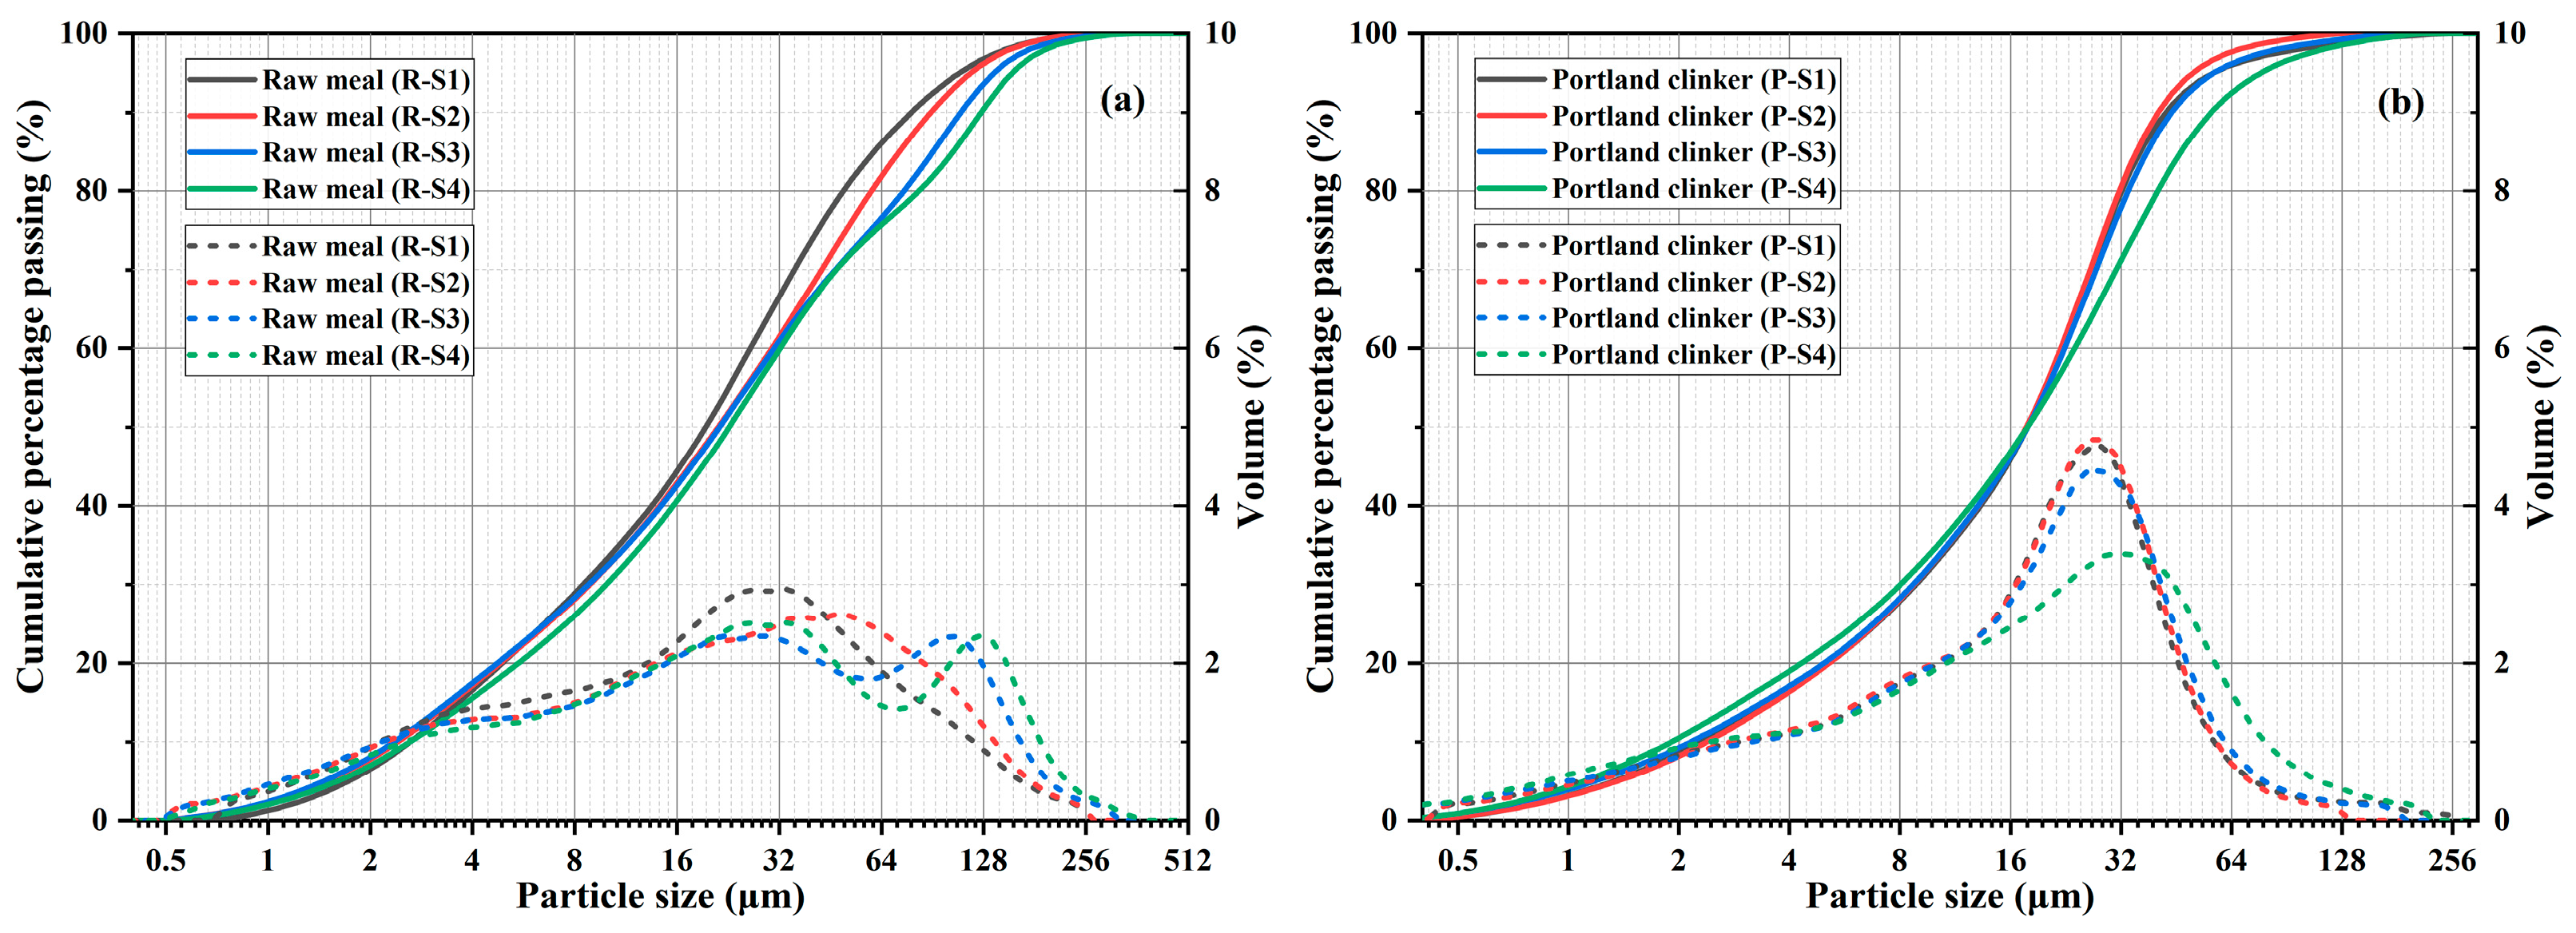
Buildings 15 01910 g002
Figure 3. Particle size distributions of raw meals (a) and Portland clinkers (b).
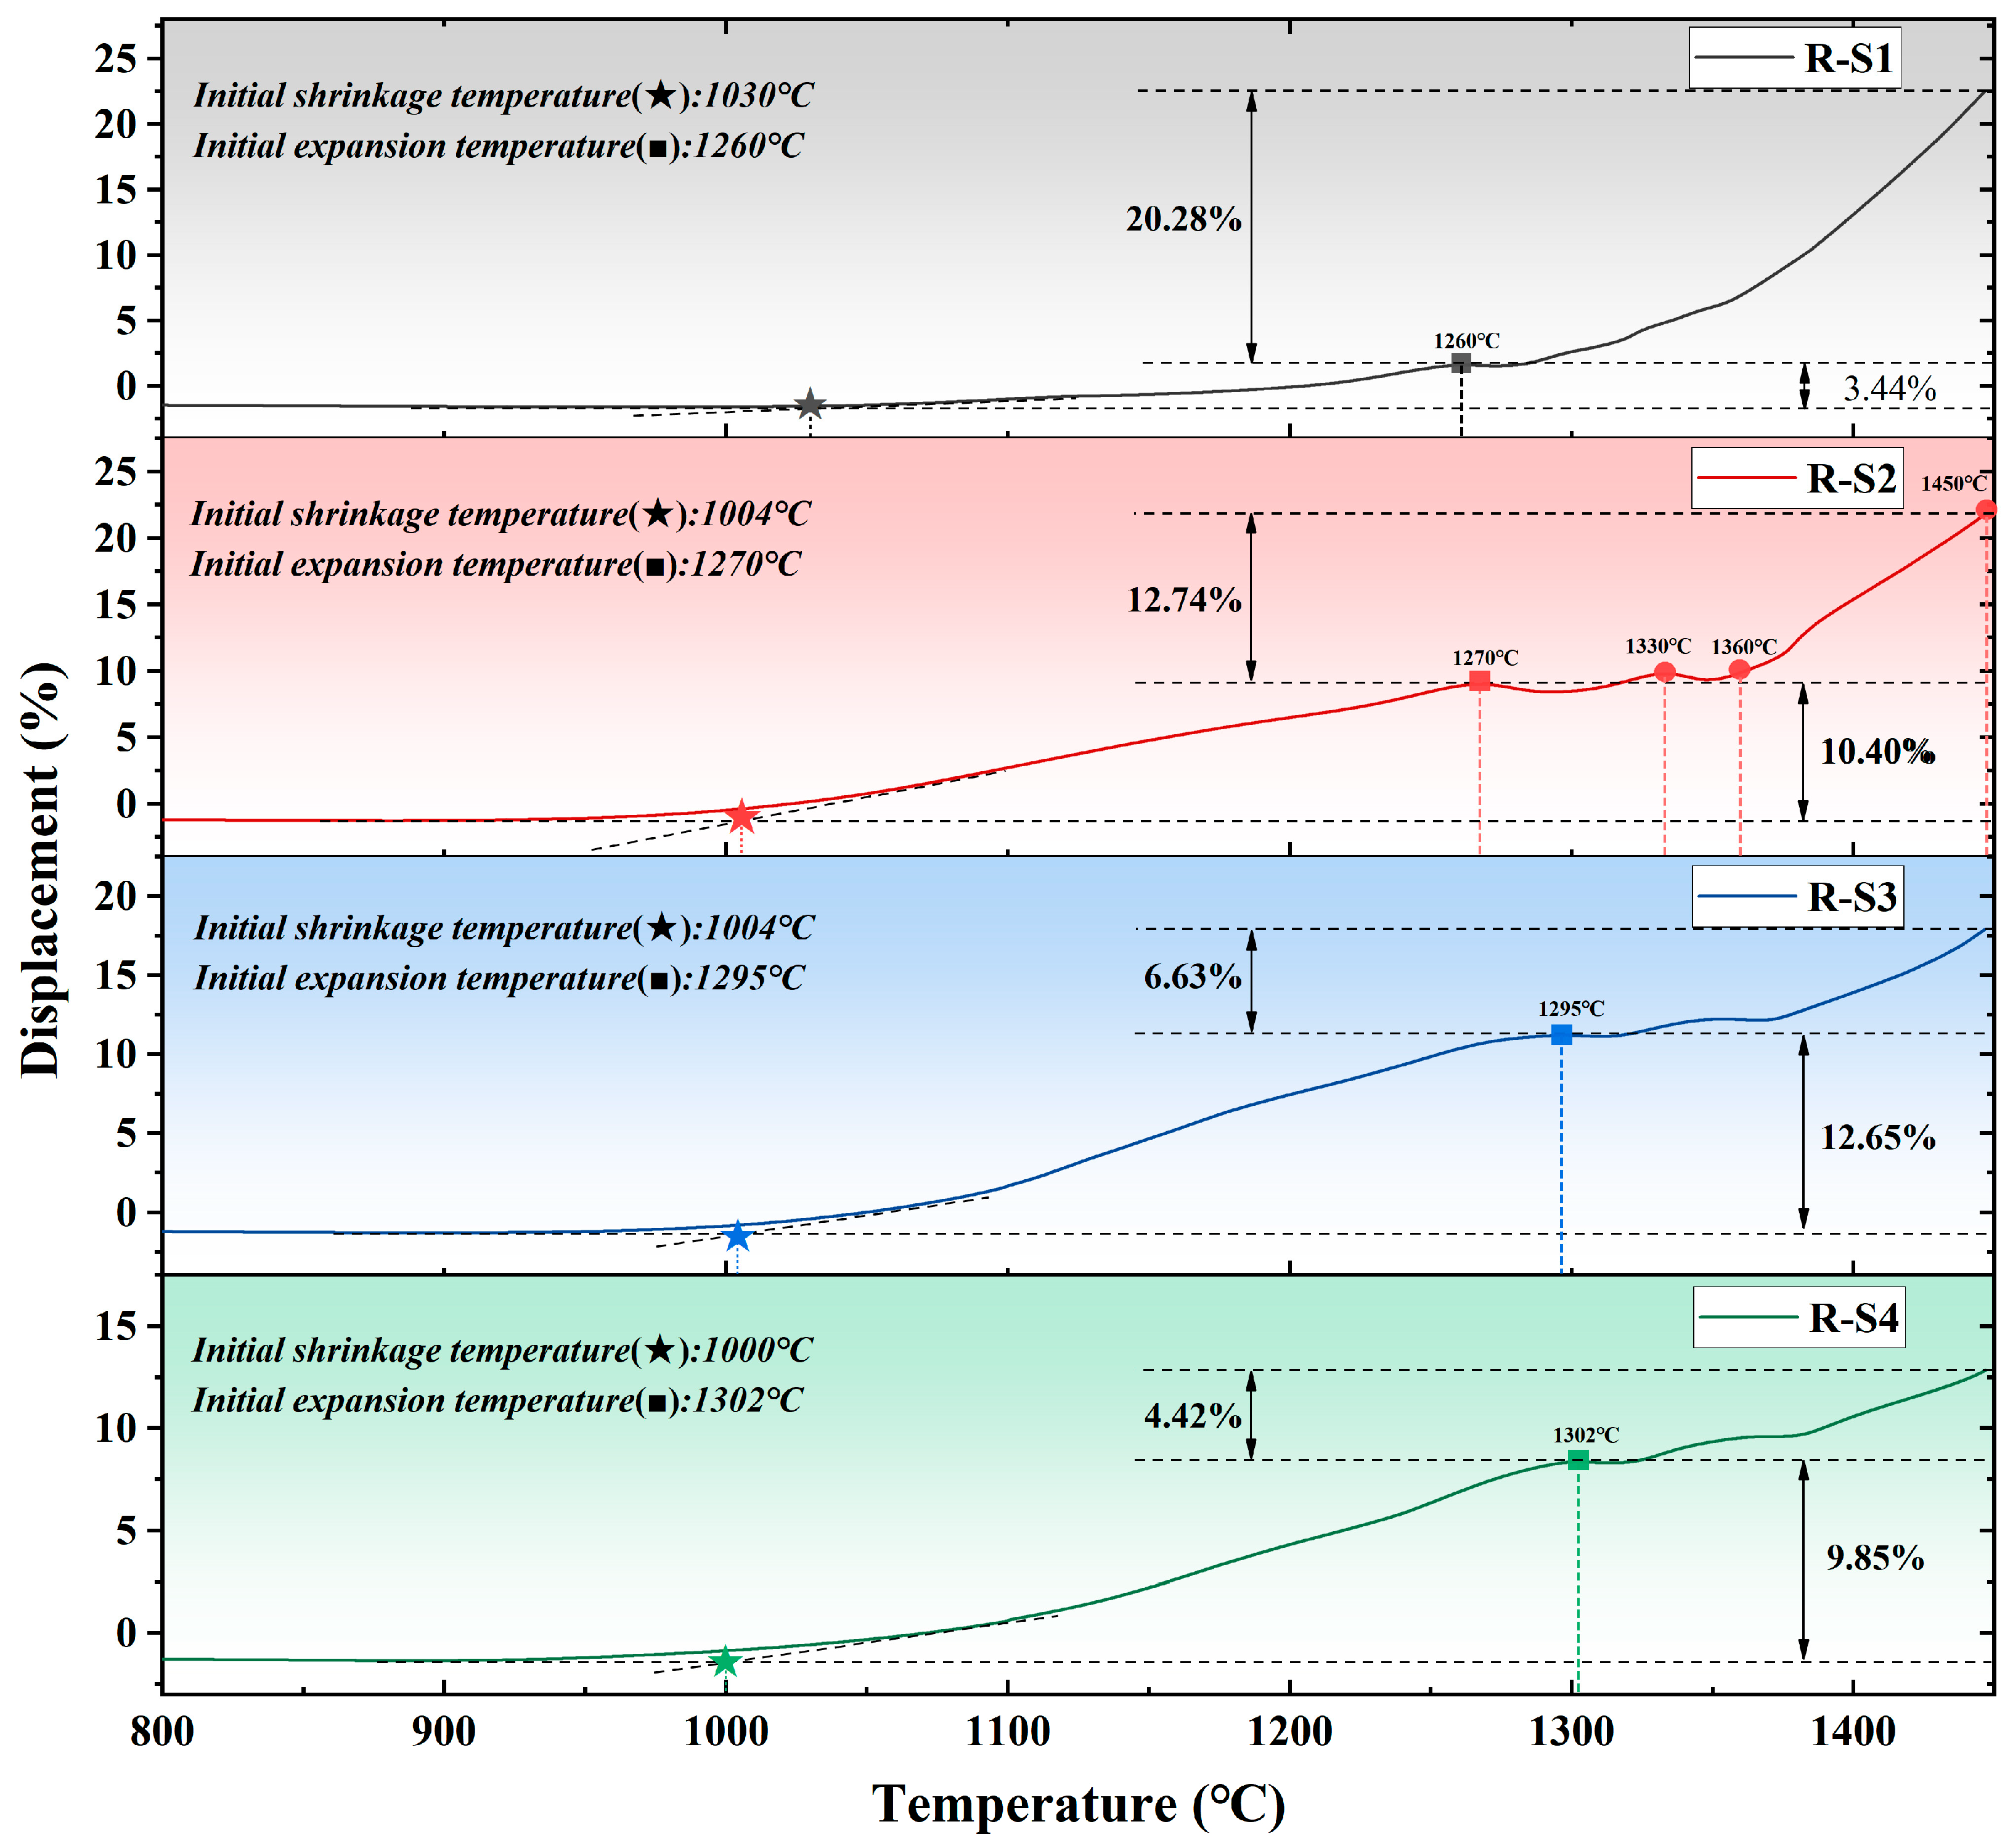
Buildings 15 01910 g003
Figure 4. Thermomechanical curve of raw meals.
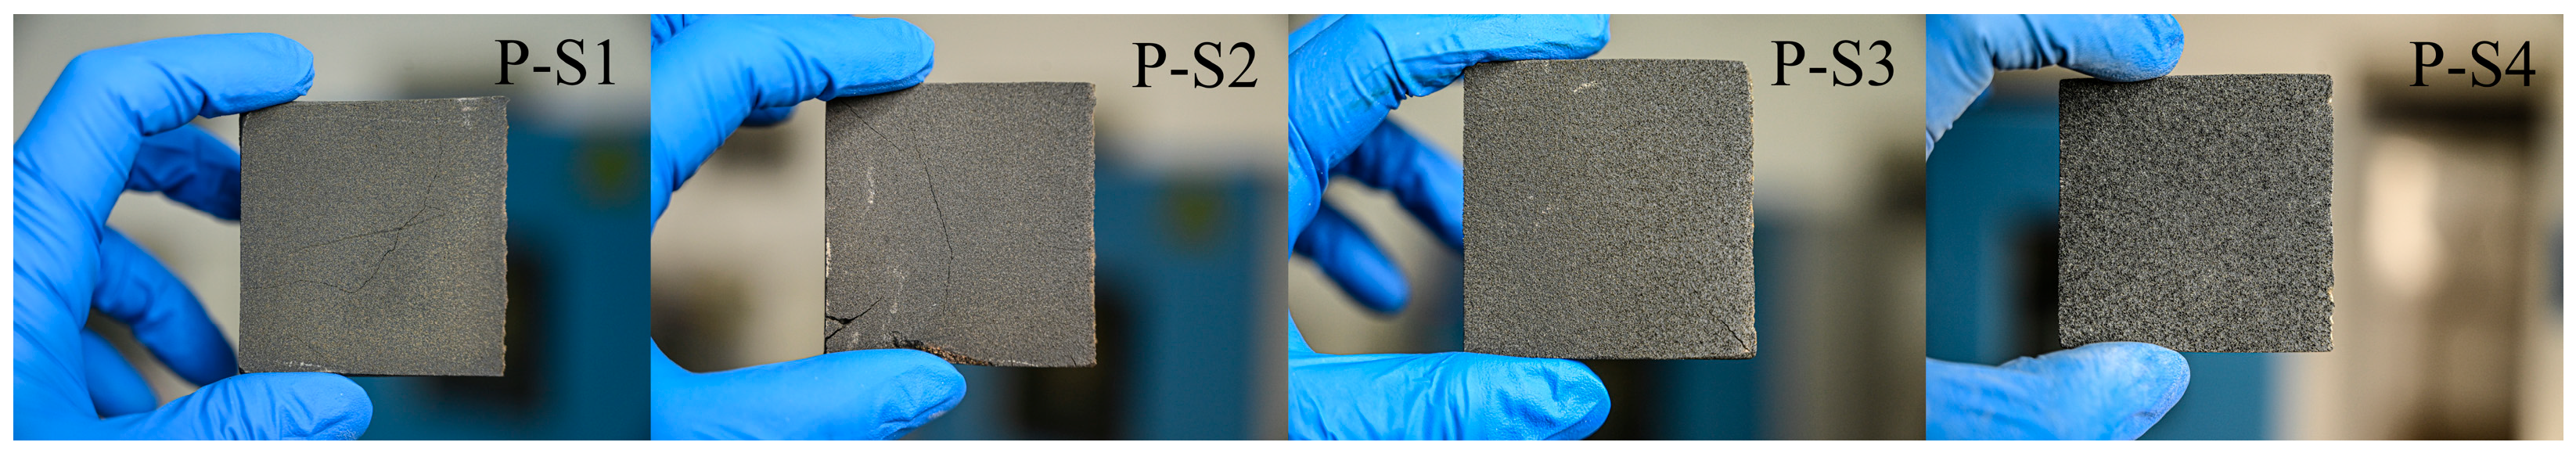
Buildings 15 01910 g004
Figure 5. Diagram of clinker morphology.
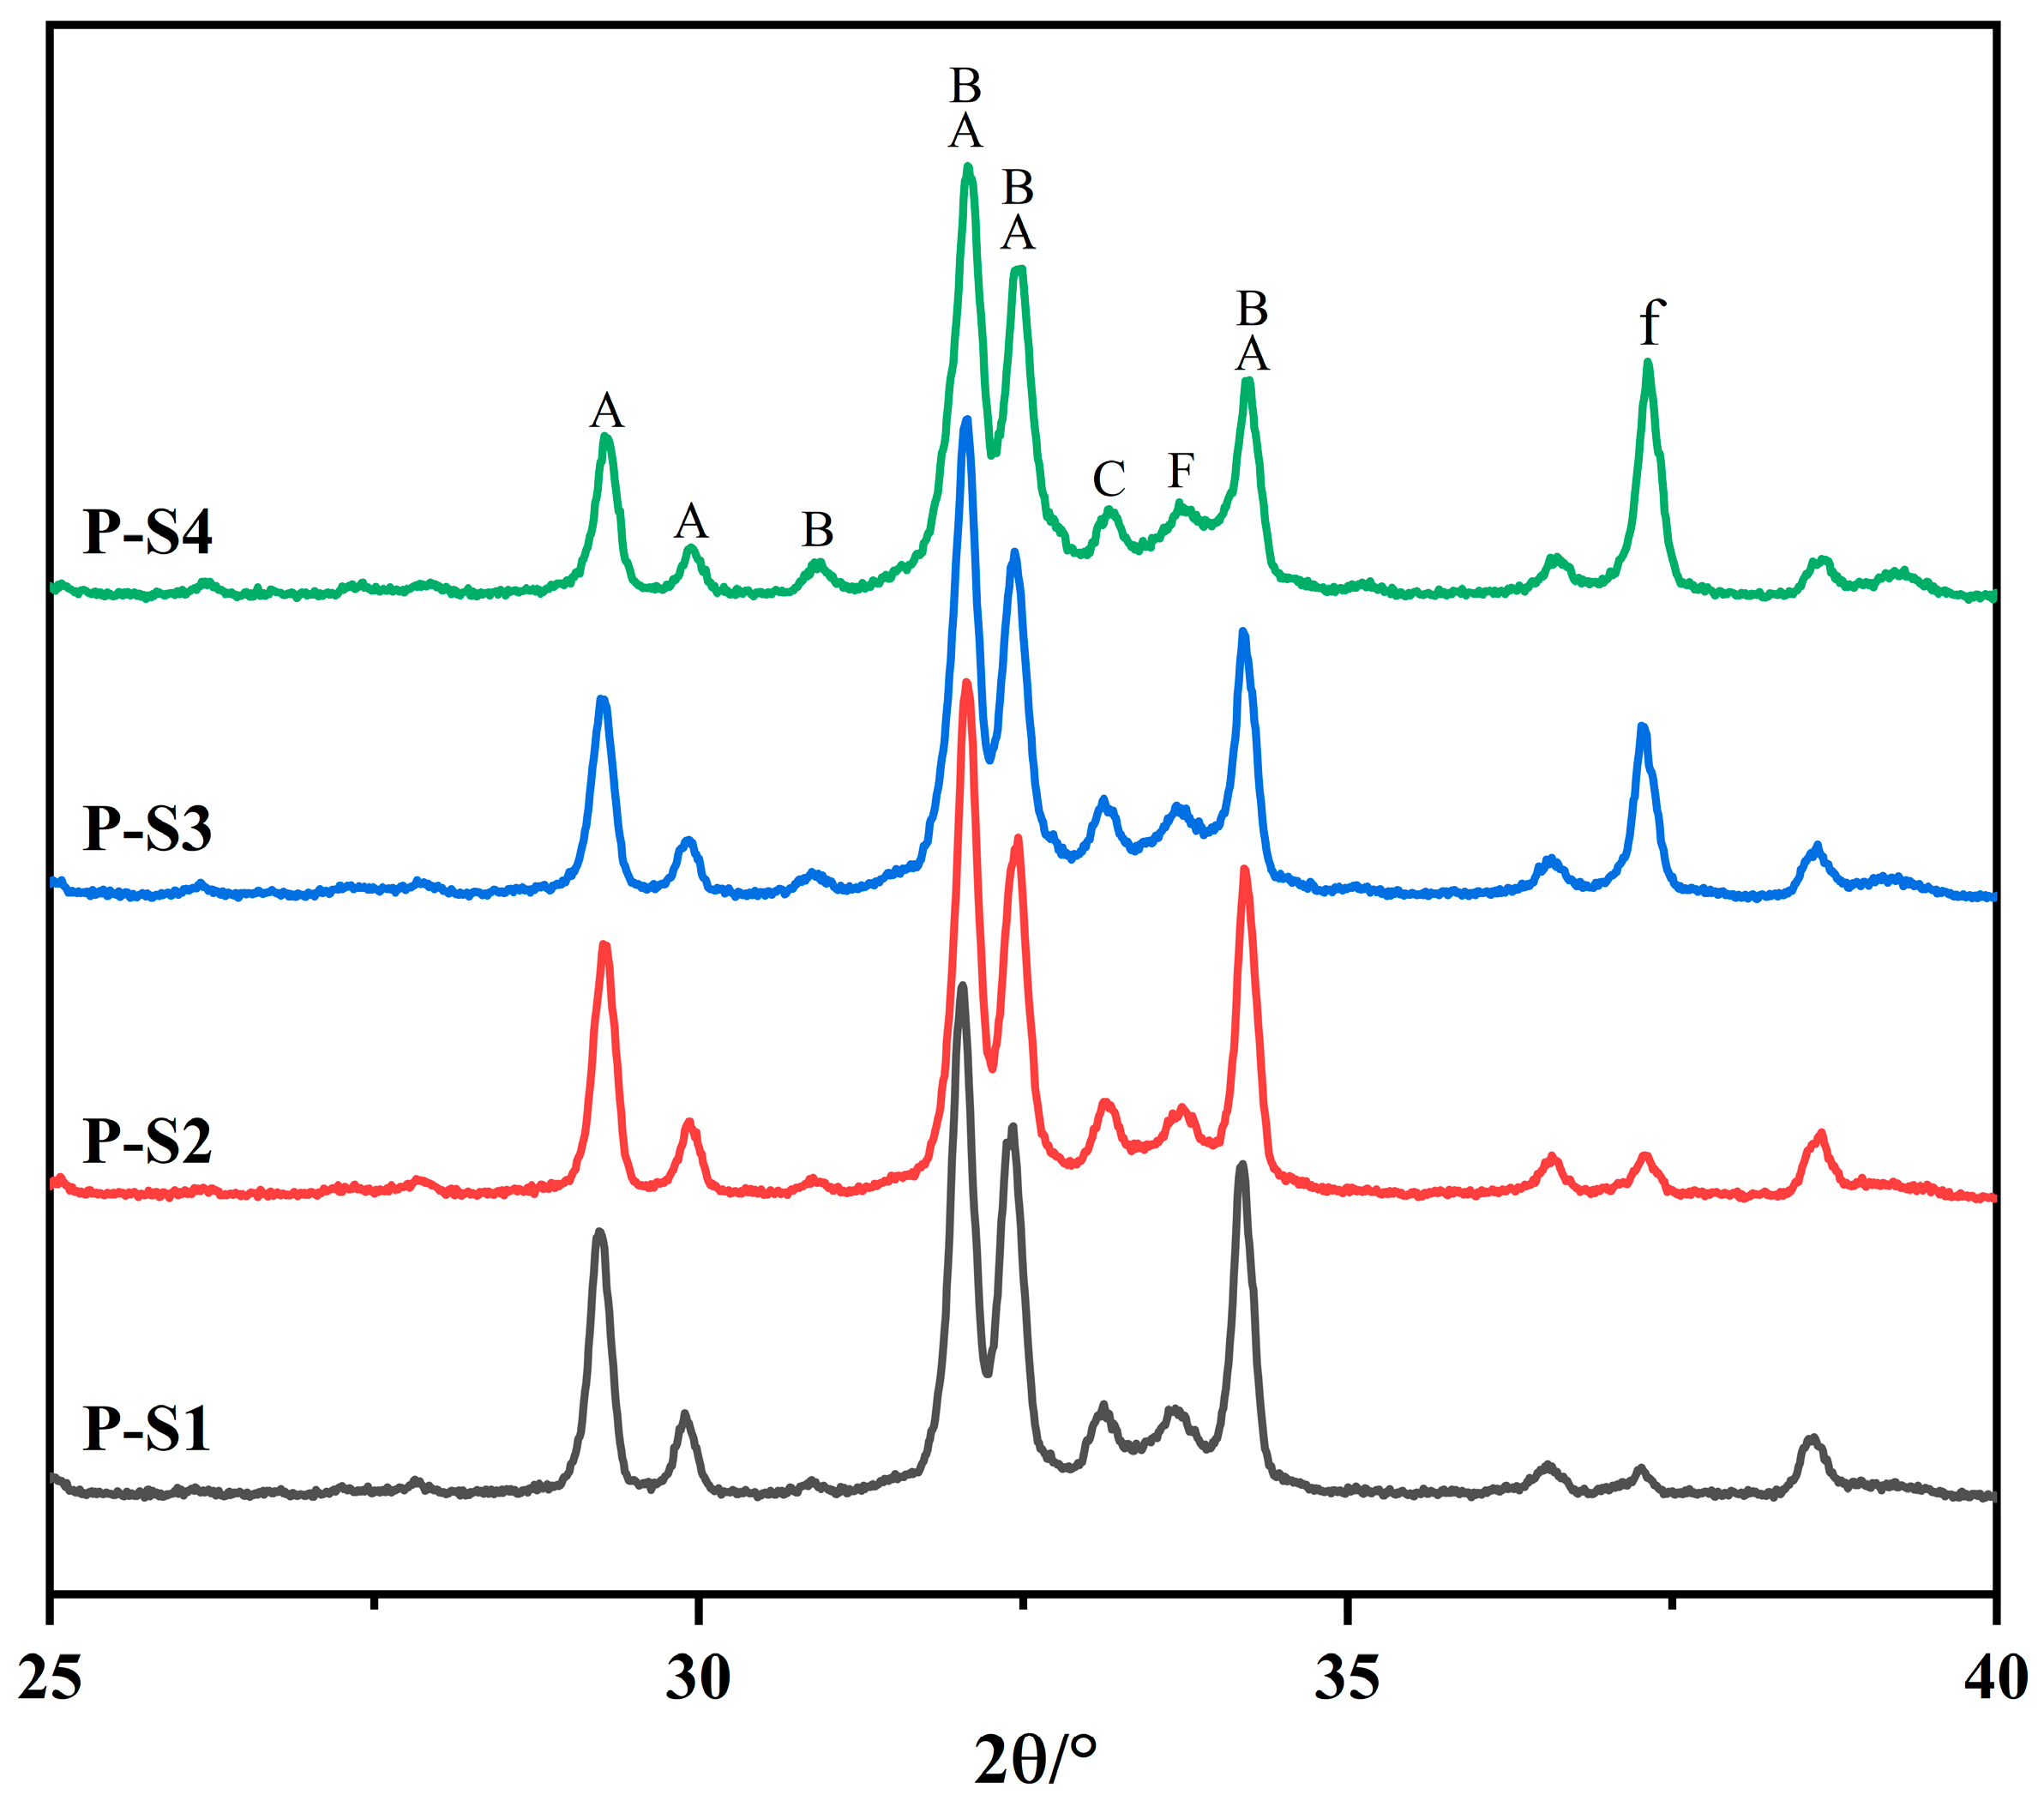
Buildings 15 01910 g005
Figure 6. XRD patterns of Portland clinkers (A: C3S, B: C2S, C: C3A, F: C4AF, and f: f-CaO).
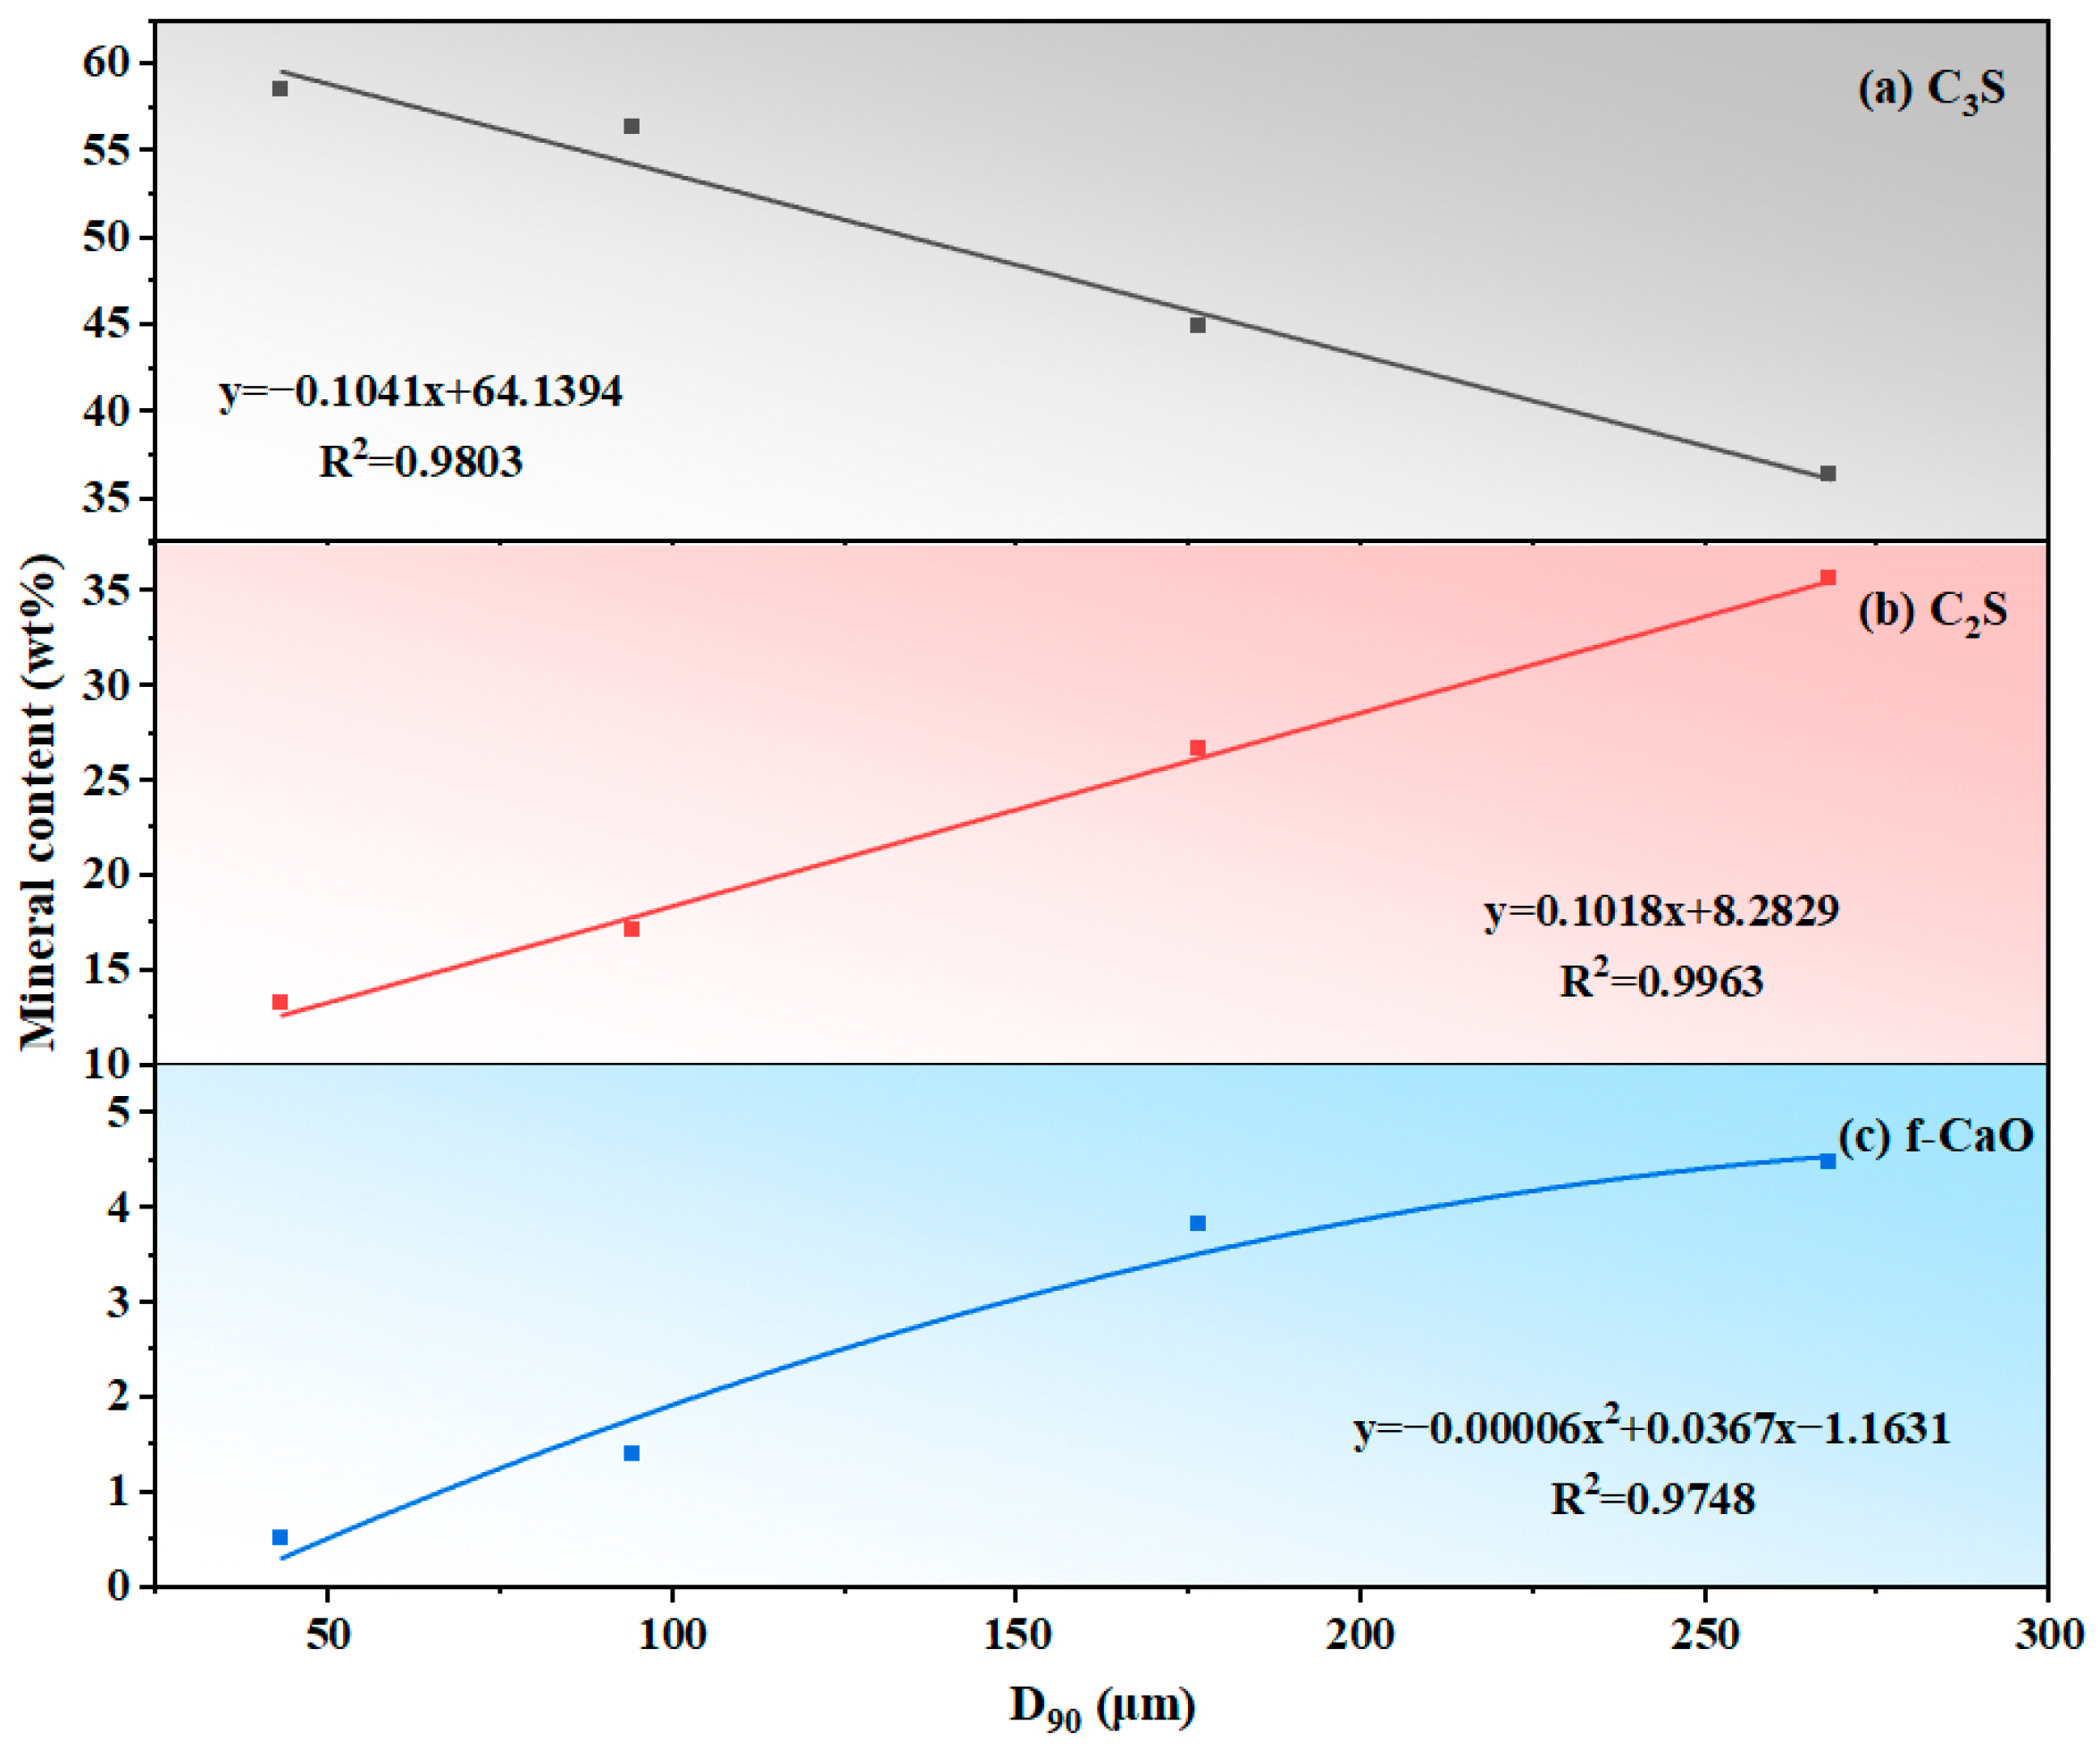
Buildings 15 01910 g006
Figure 7. Quantitative relationship between sandstone fineness (D90) and clinker mineral content: (a) C3S, (b) C2S, and (c) f-CaO.
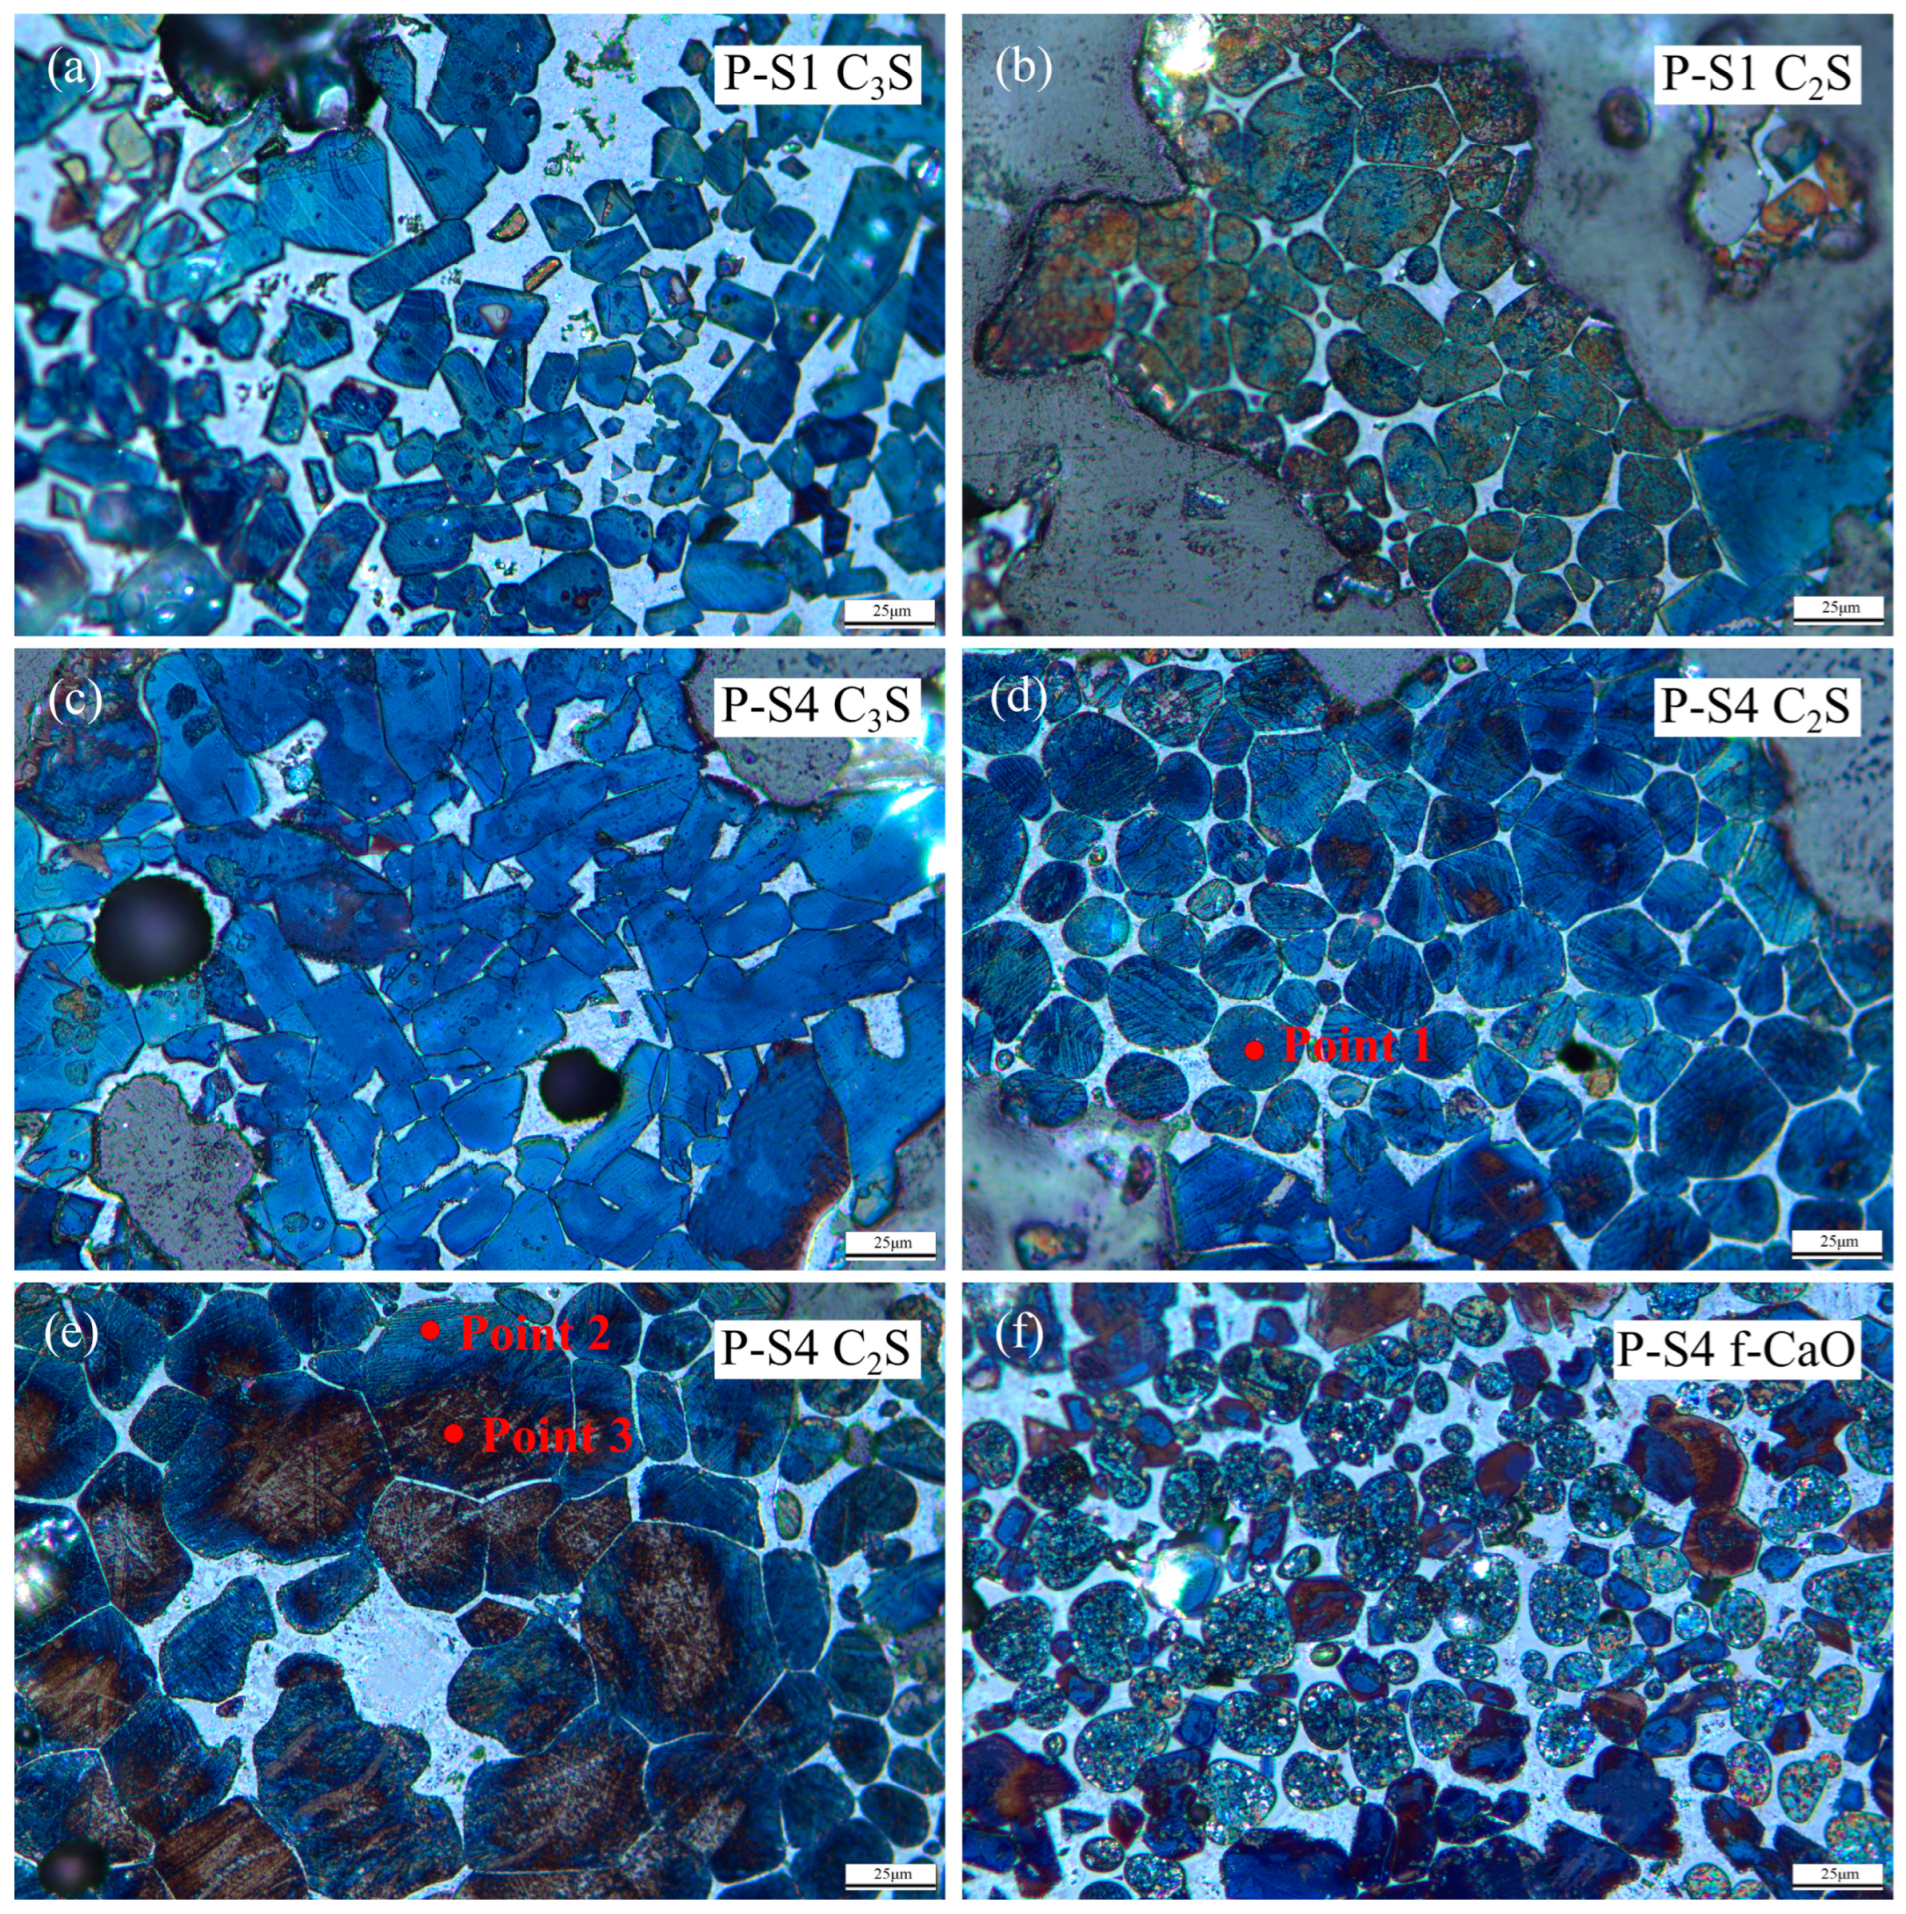
Buildings 15 01910 g007
Figure 8. Microstructure of clinker minerals ((a): C3S of P-S1, (b): C2S of P-S1, (c): C3S of P-S4, (d,e): C2S of P-S4, and (f): f-CaO of P-S4).
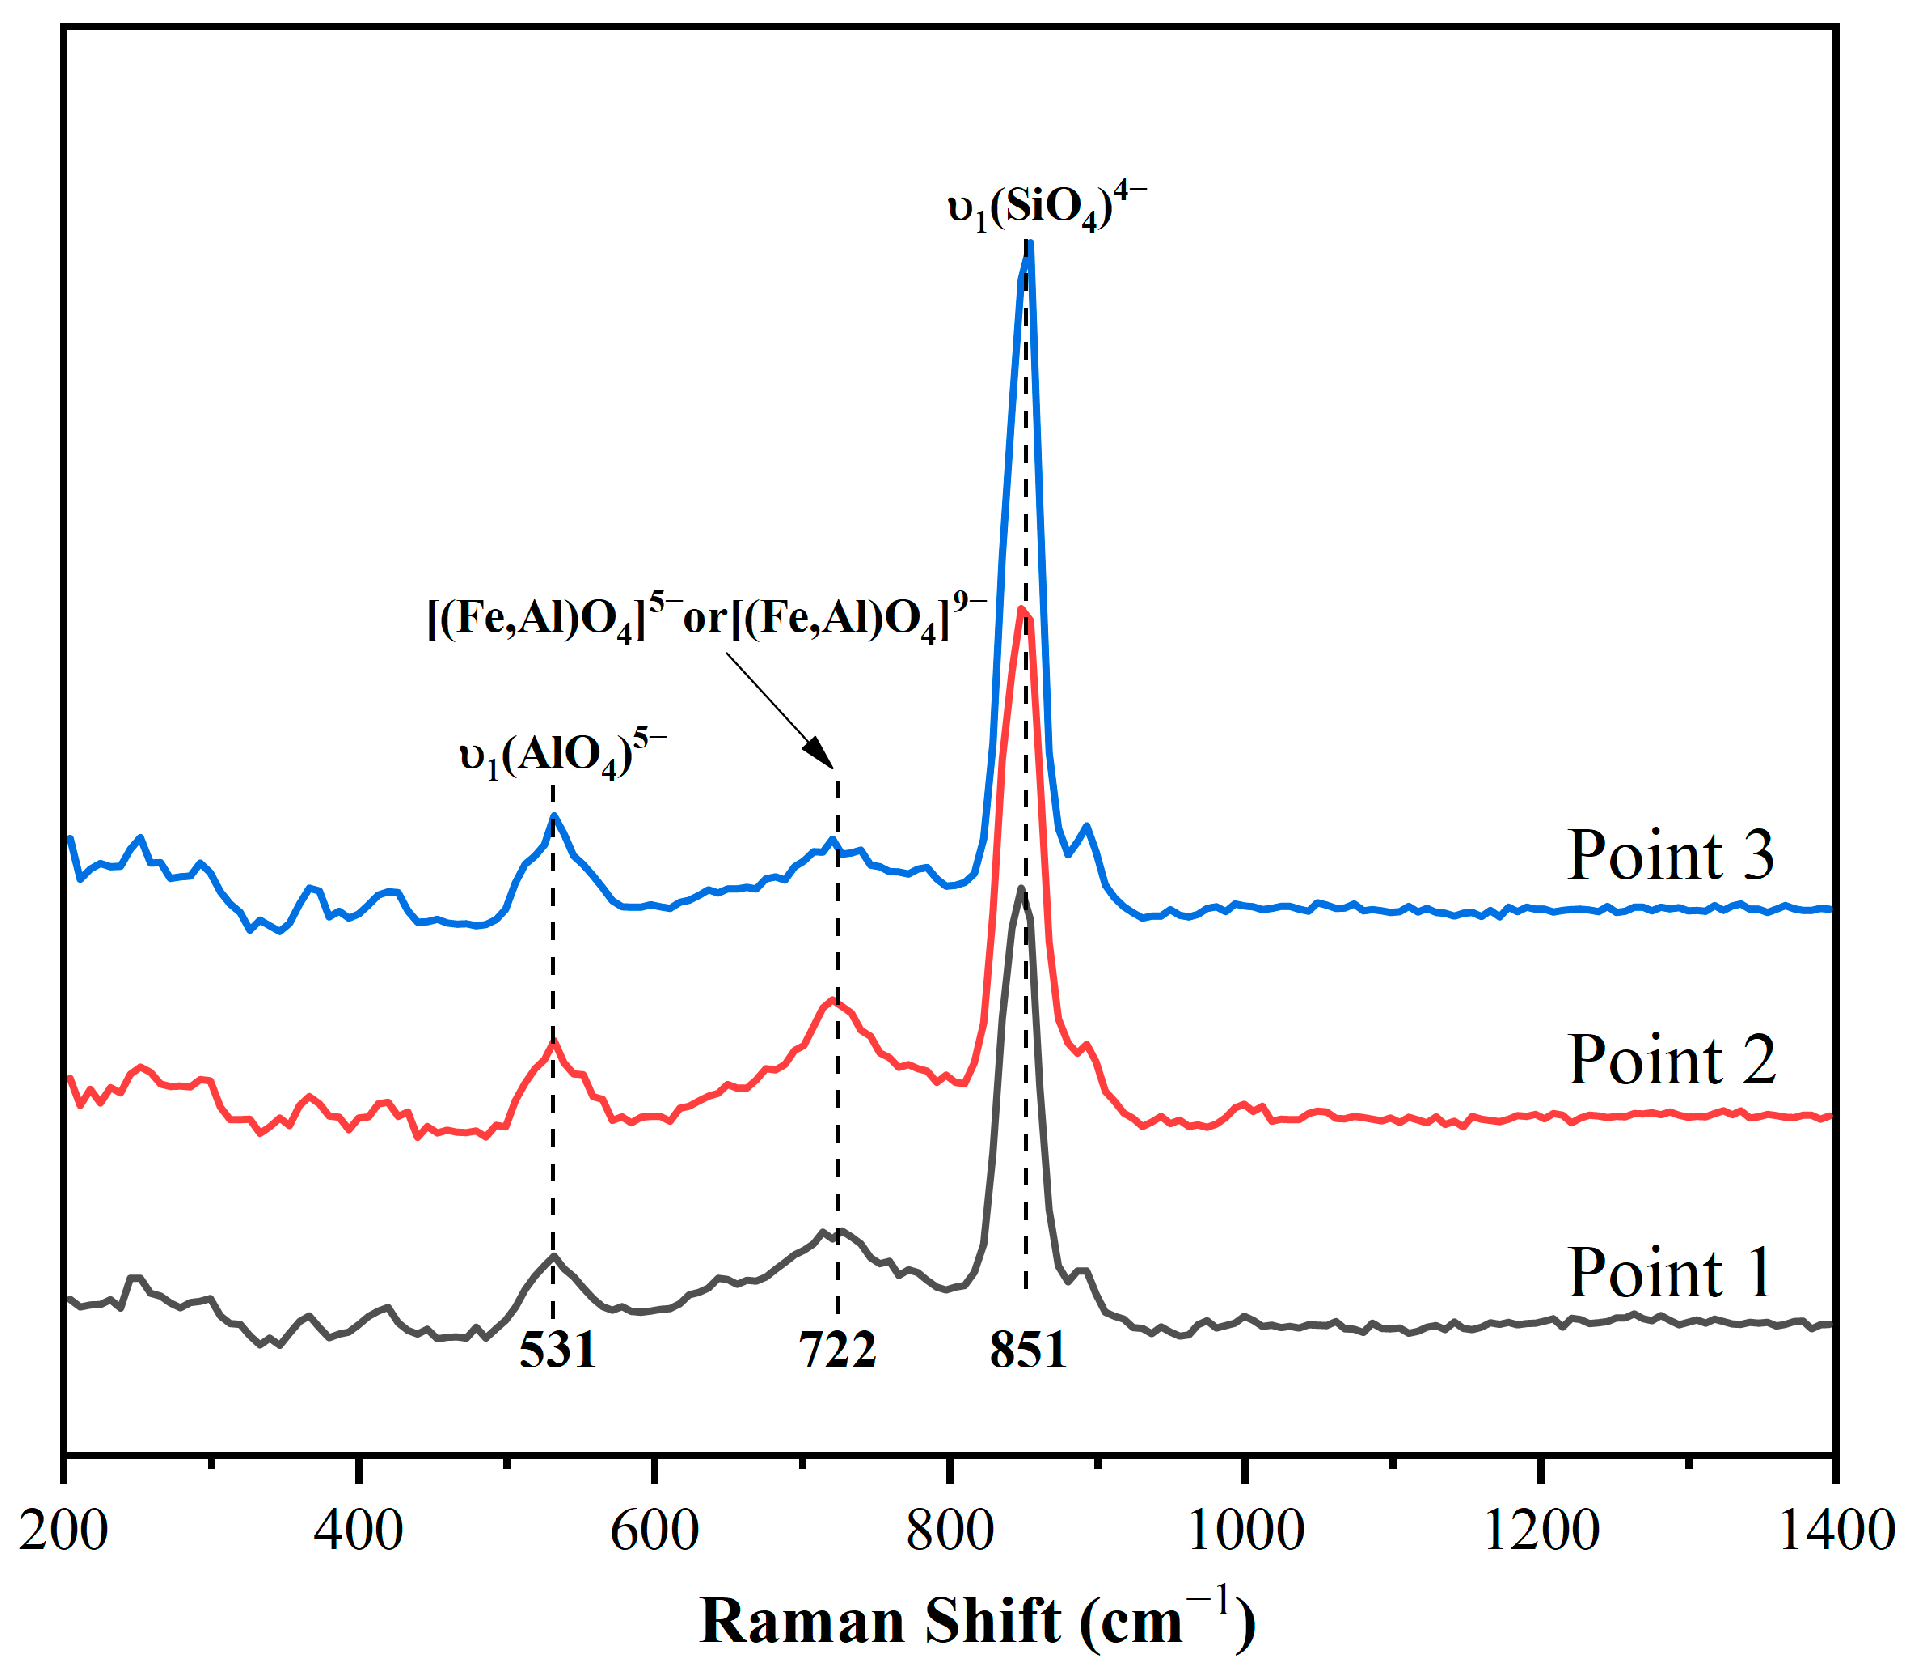
Buildings 15 01910 g008
Figure 9. Raman spectra of clinker minerals.
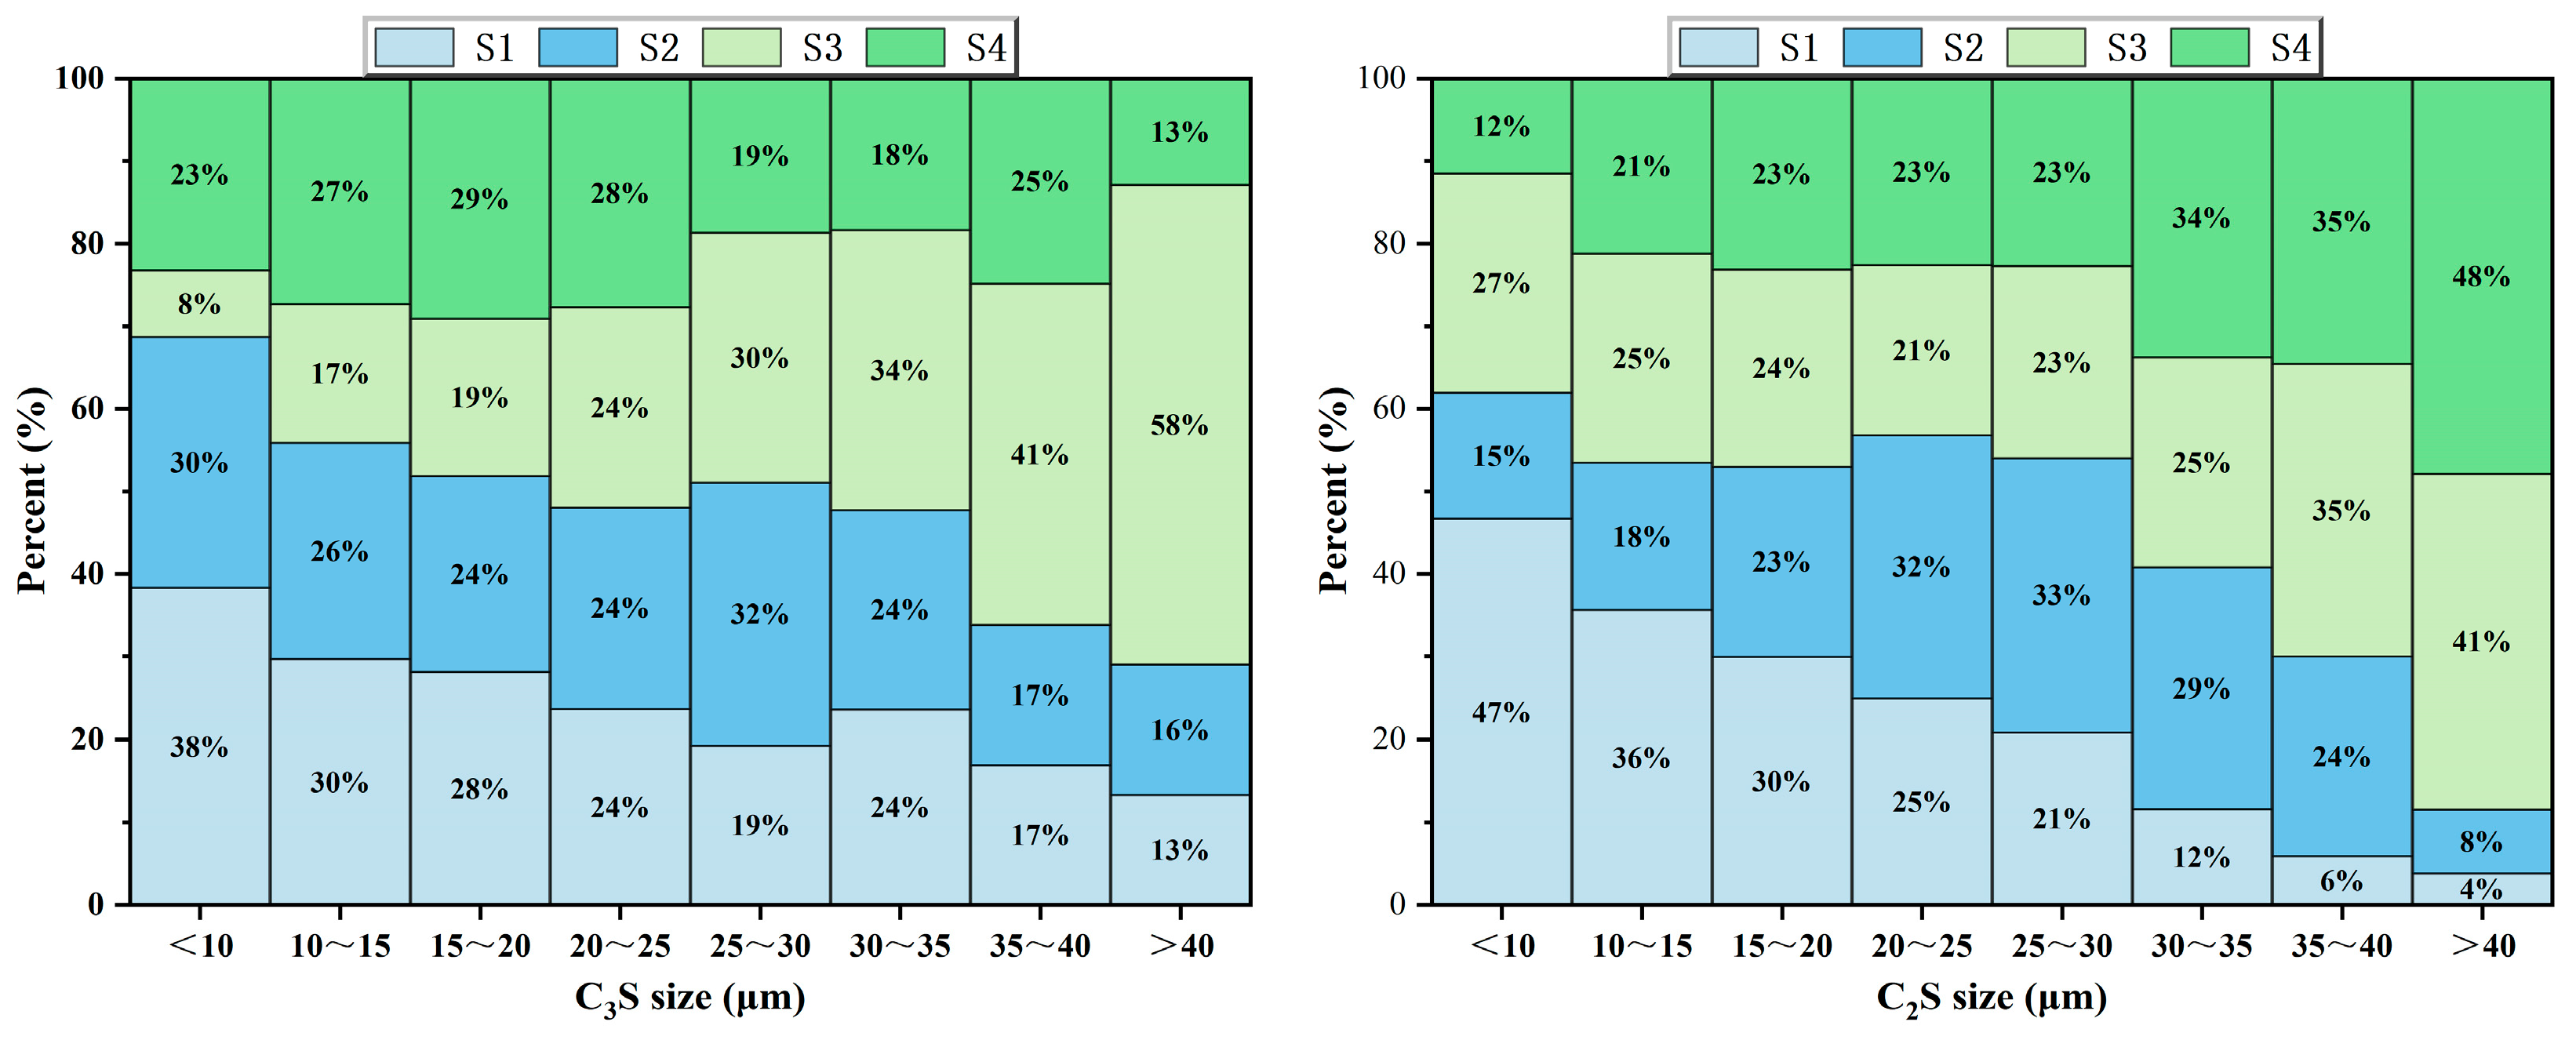
Buildings 15 01910 g009
Figure 10. Proportion of crystal content in the same particle size range of C3S and C2S in all clinkers.
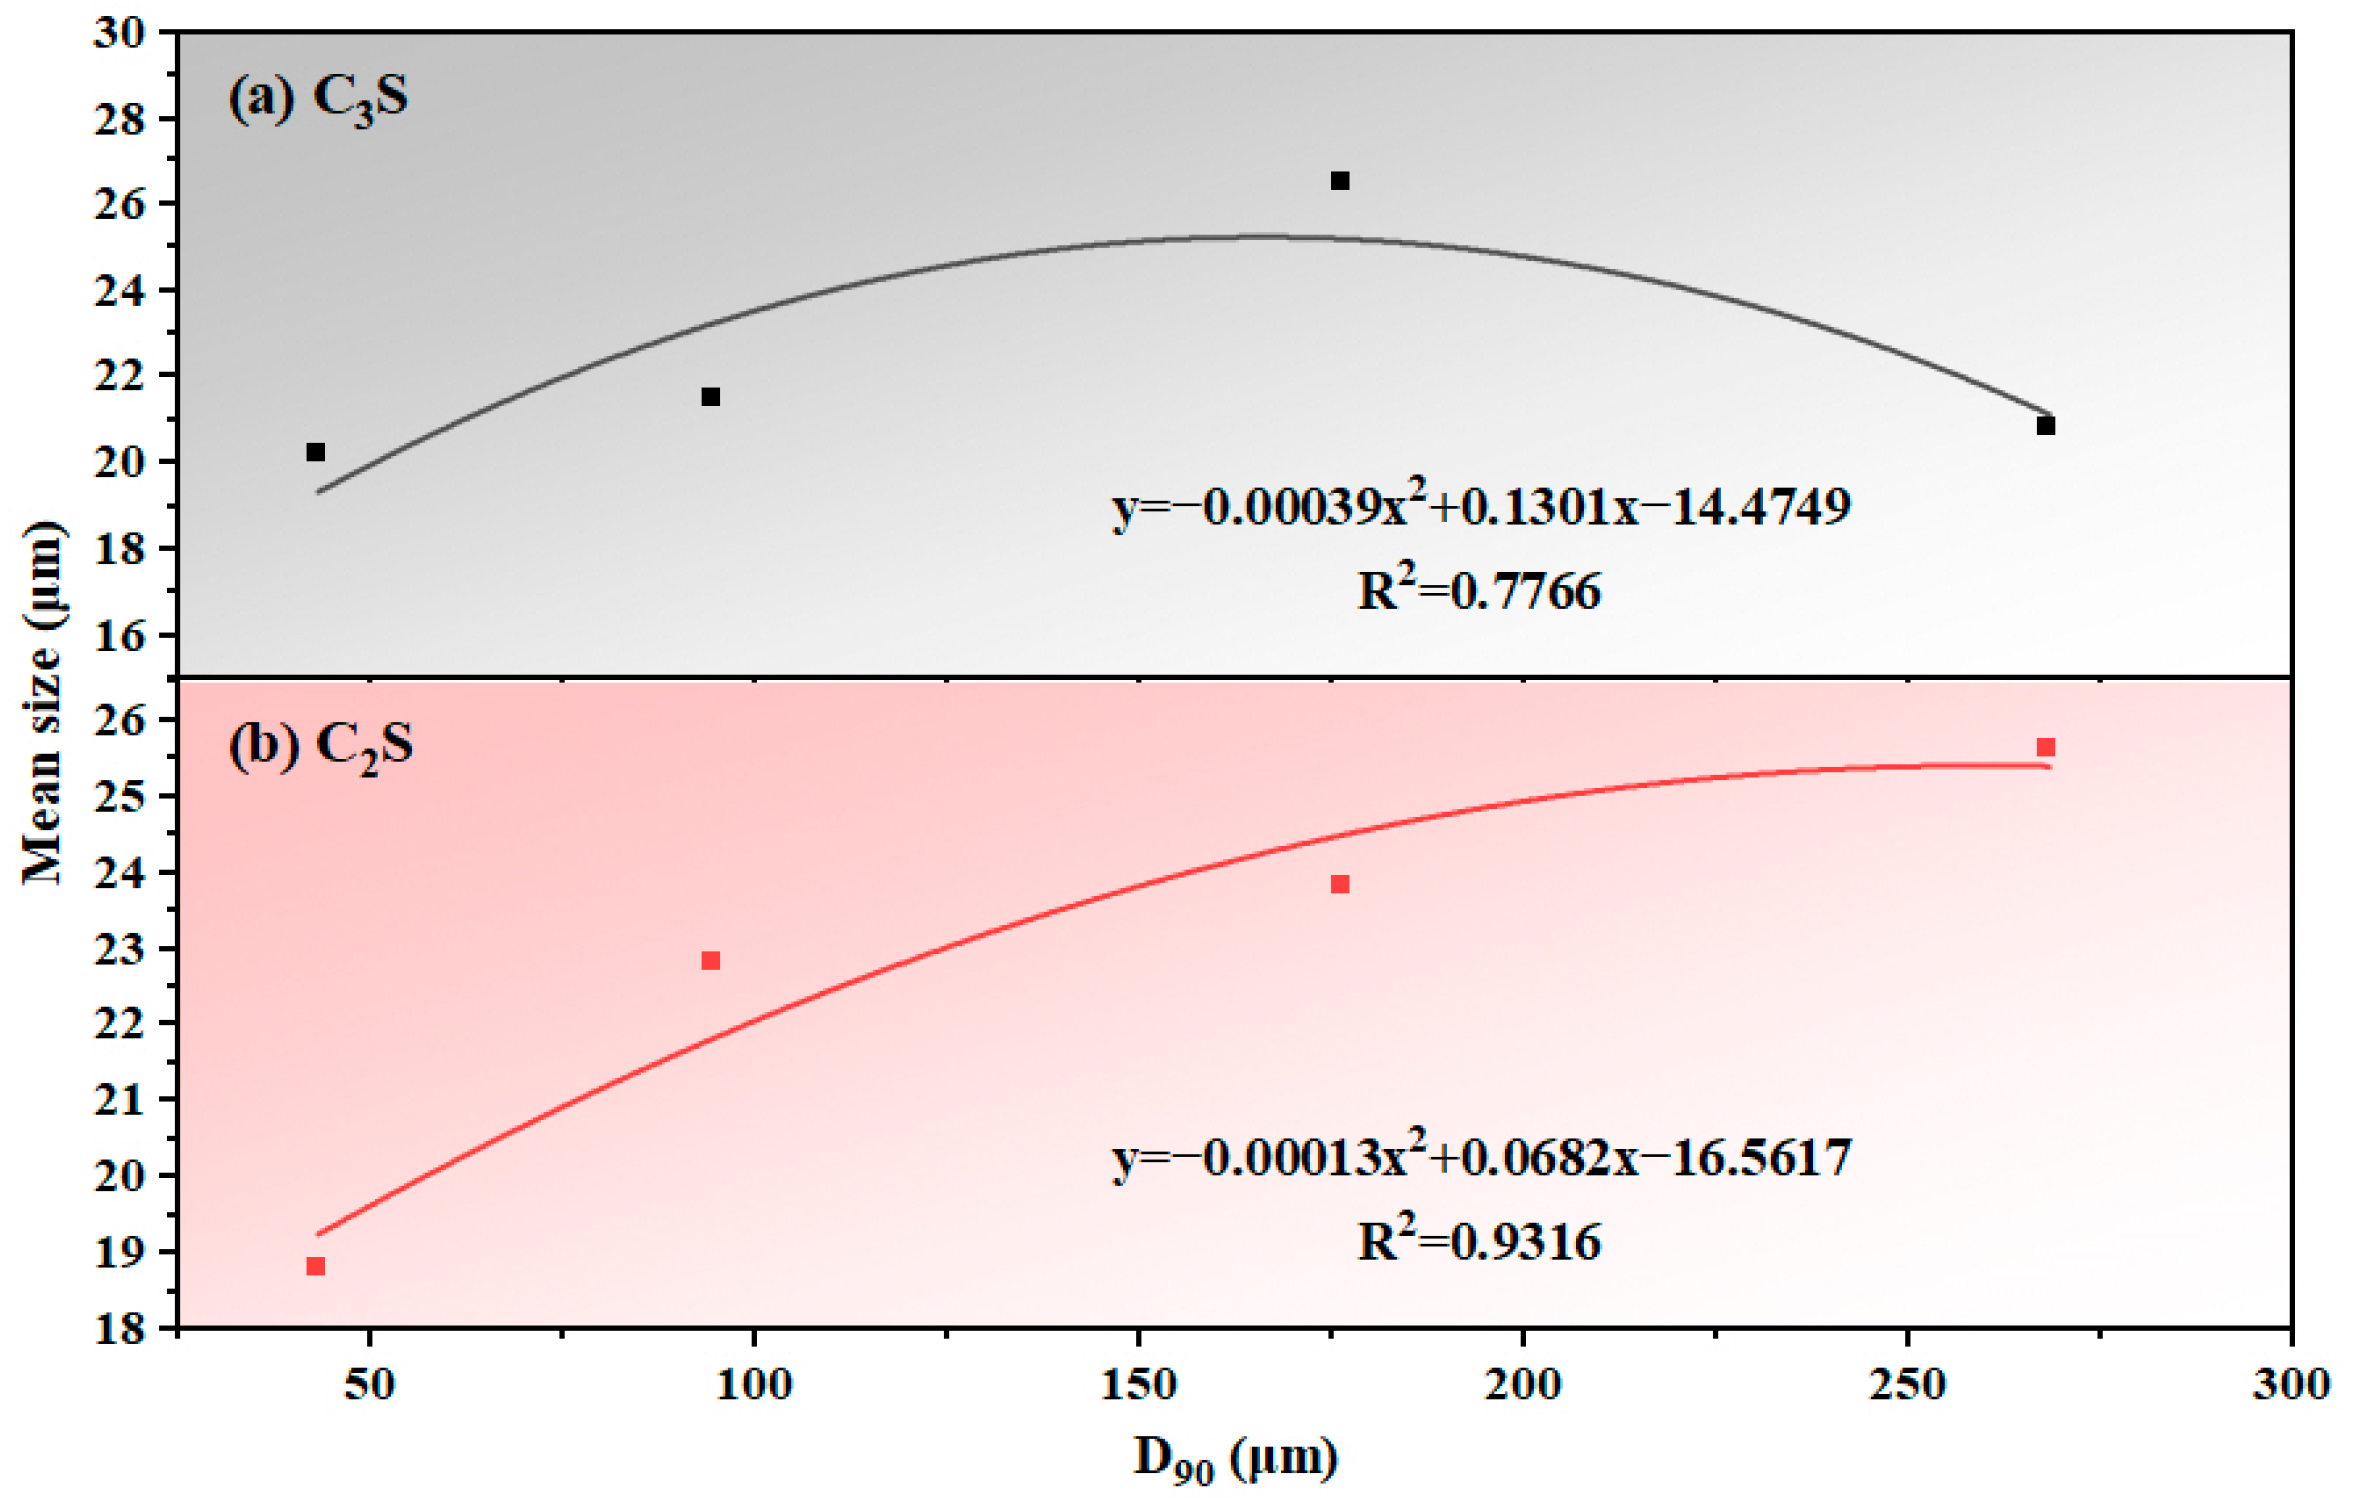
Buildings 15 01910 g010
Figure 11. Quantitative relationship between sandstone fineness (D90) and mean grain size: (a) C3S and (b) C2S.
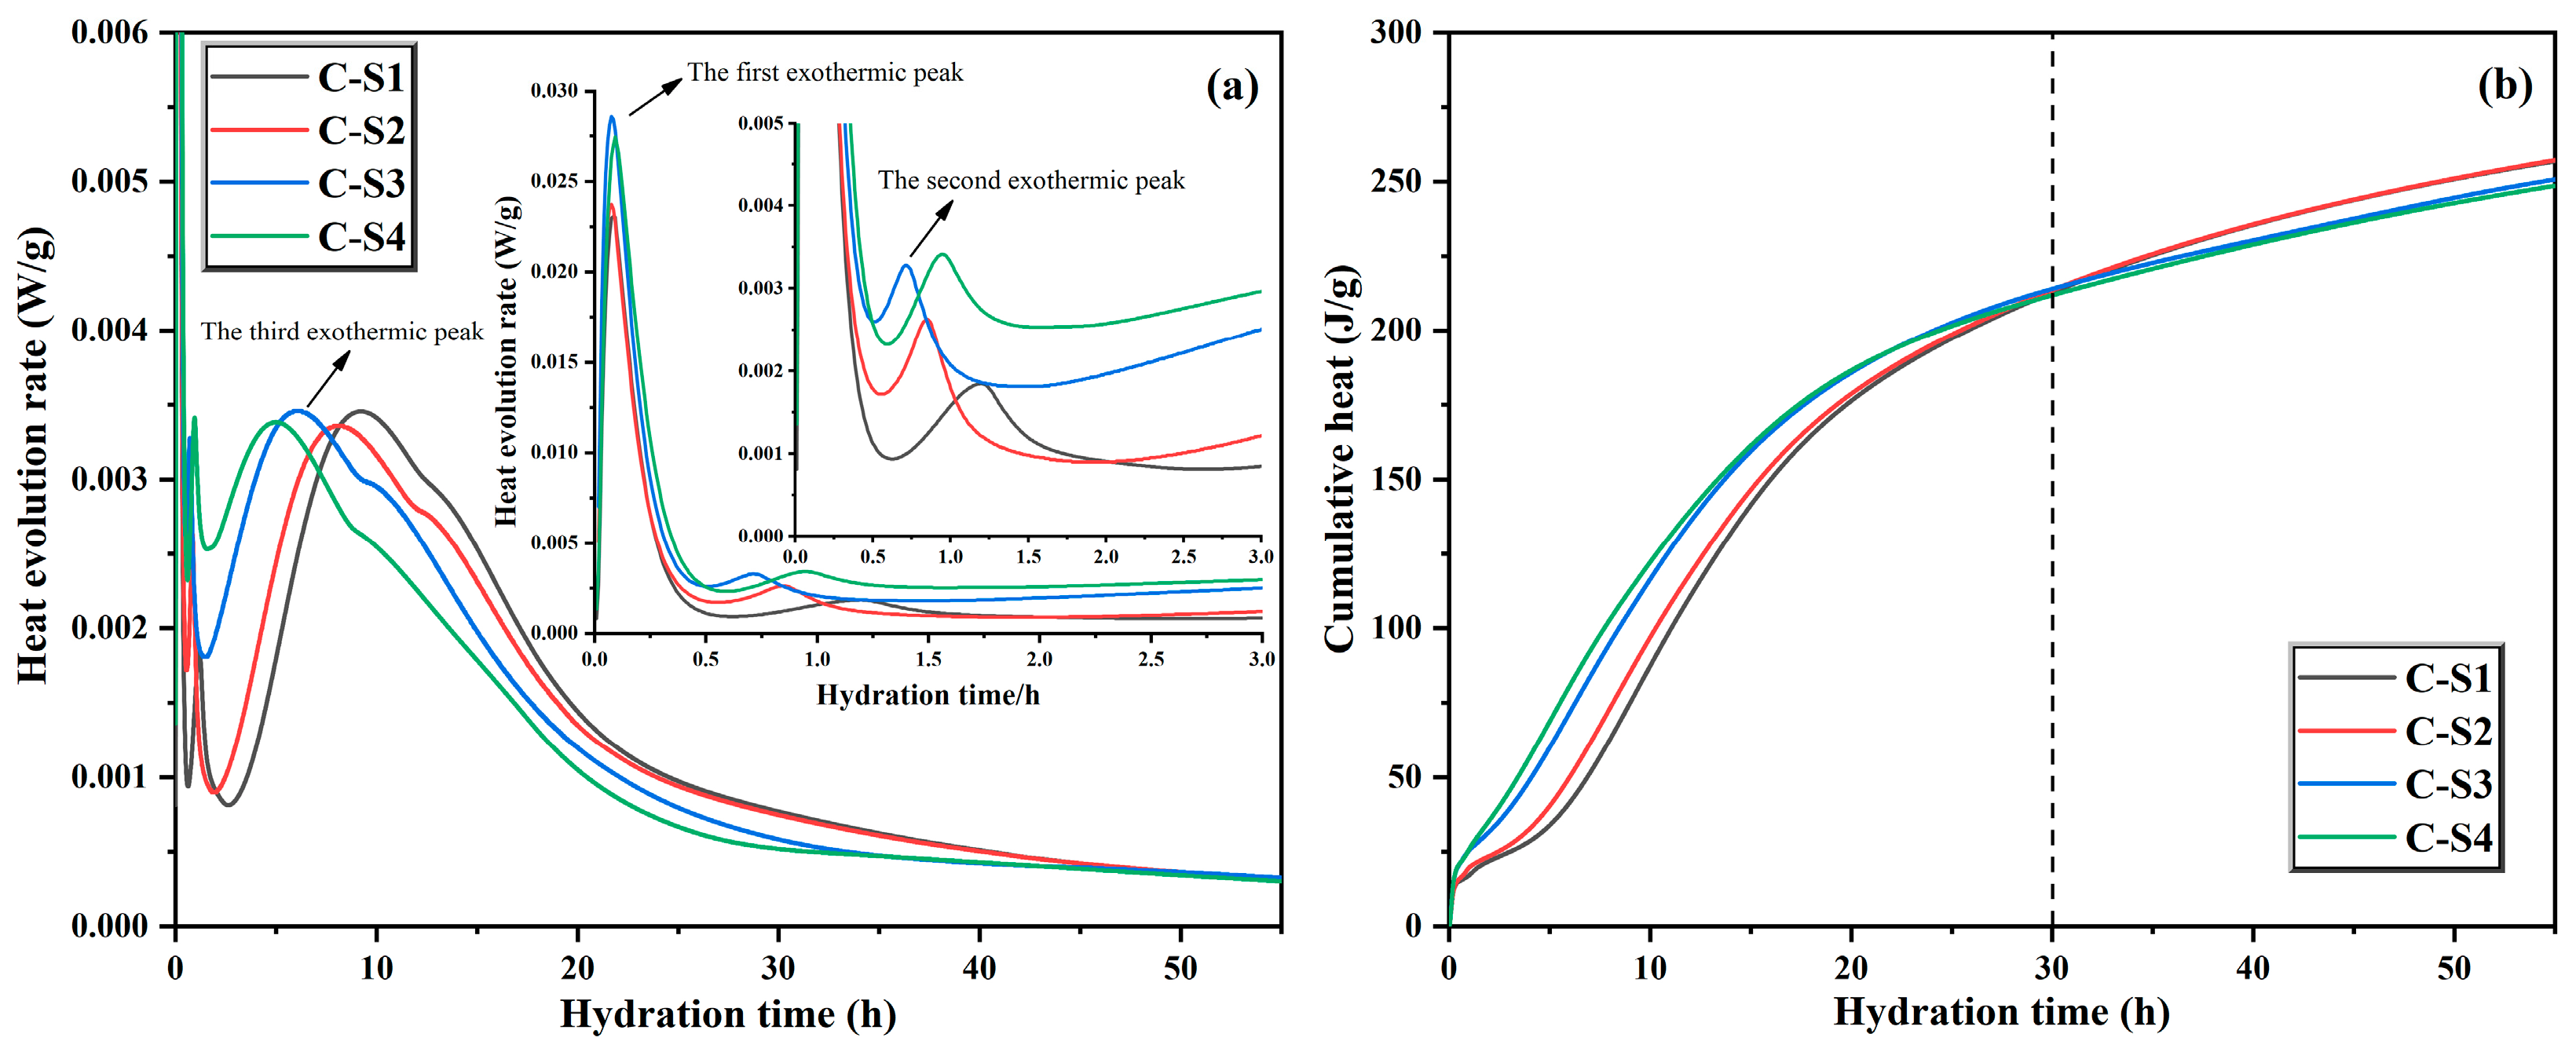
Buildings 15 01910 g011
Figure 12. Hydration heat curve (a) and cumulative heat curve (b) of cement.
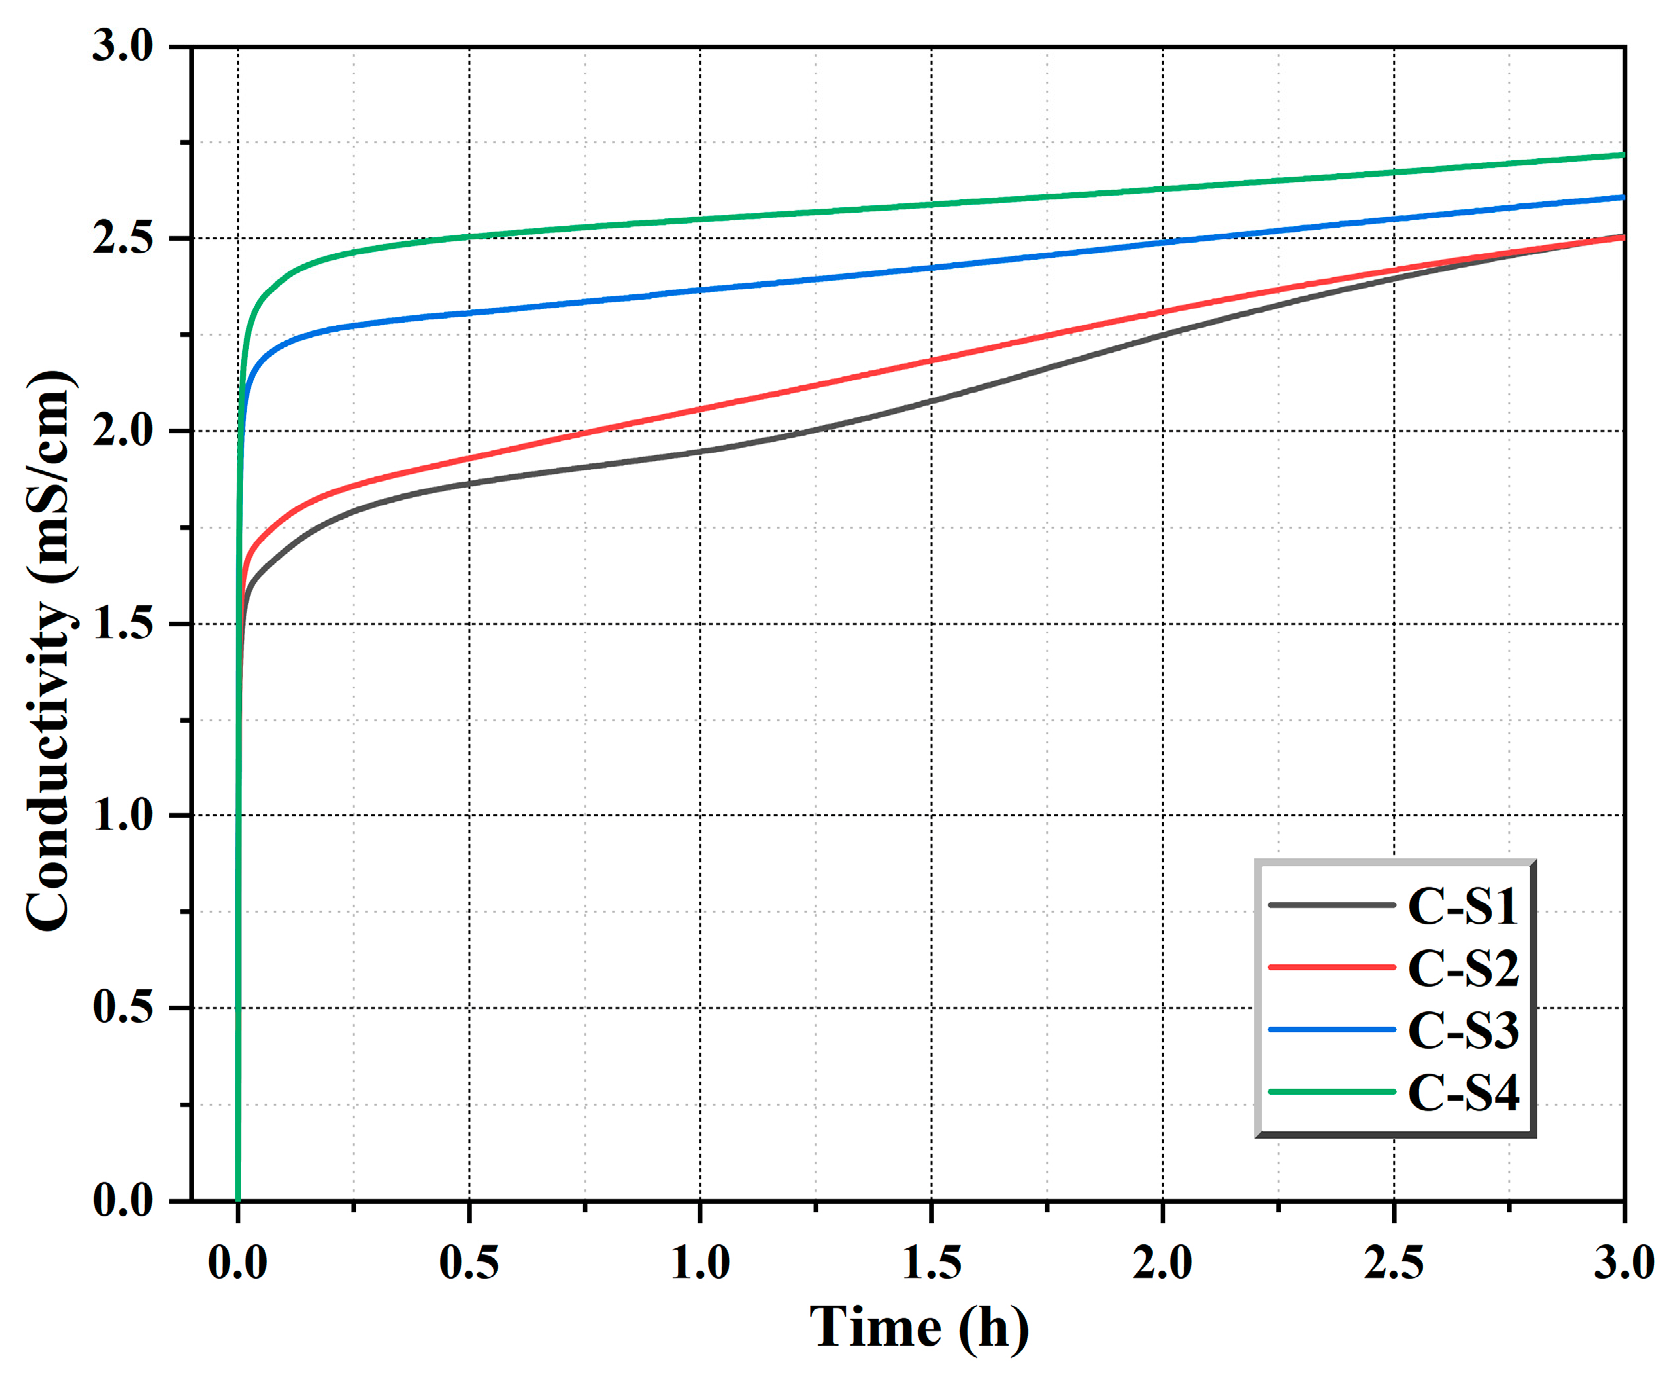
Buildings 15 01910 g012
Figure 13. Conductivity measurements of cement during the induction period.
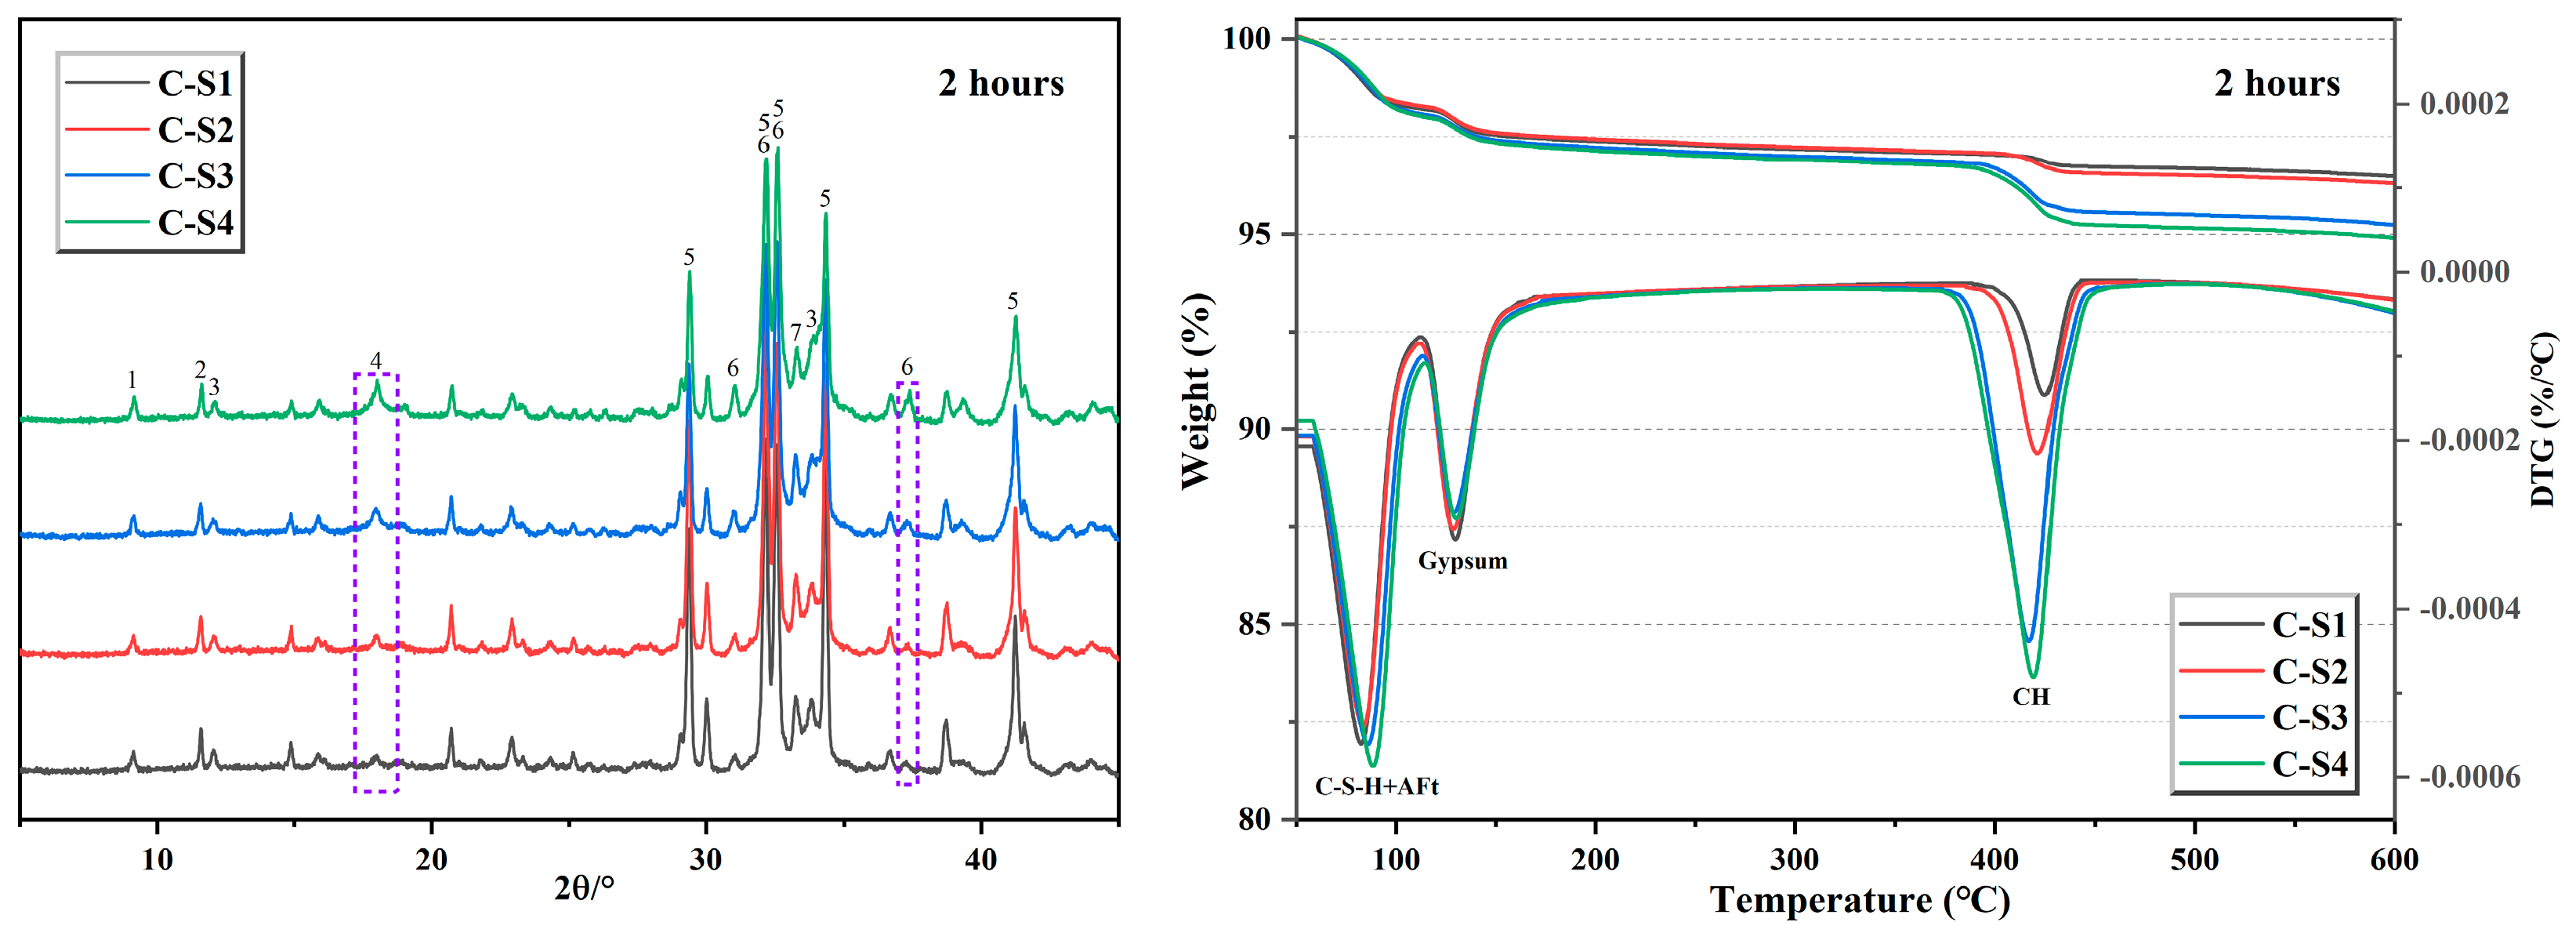
Buildings 15 01910 g013
Figure 14. XRD patterns and TG-DTG curves of cement hydration for 2 h (1-AFt, 2-CaSO4·2H2O, 3-C4AF, 4-Ca(OH)2, 5-C3S, 6-C2S, and 7-C3A).
Buildings 15 01910 g014
Figure 15. XRD patterns and TG-DTG curves of cement hydration for 8 h (1-AFt, 2-CaSO4·2H2O, 3-C4AF, 4-Ca(OH)2, 5-C3S, 6-C2S, and 7-C3A).
Buildings 15 01910 g015
Figure 16. XRD patterns and TG-DTG curves of cement hydration for 12 h (1-AFt, 2-C4AF, 3-Ca(OH)2, 4-C3S, 5-C2S, and 6-C3A).
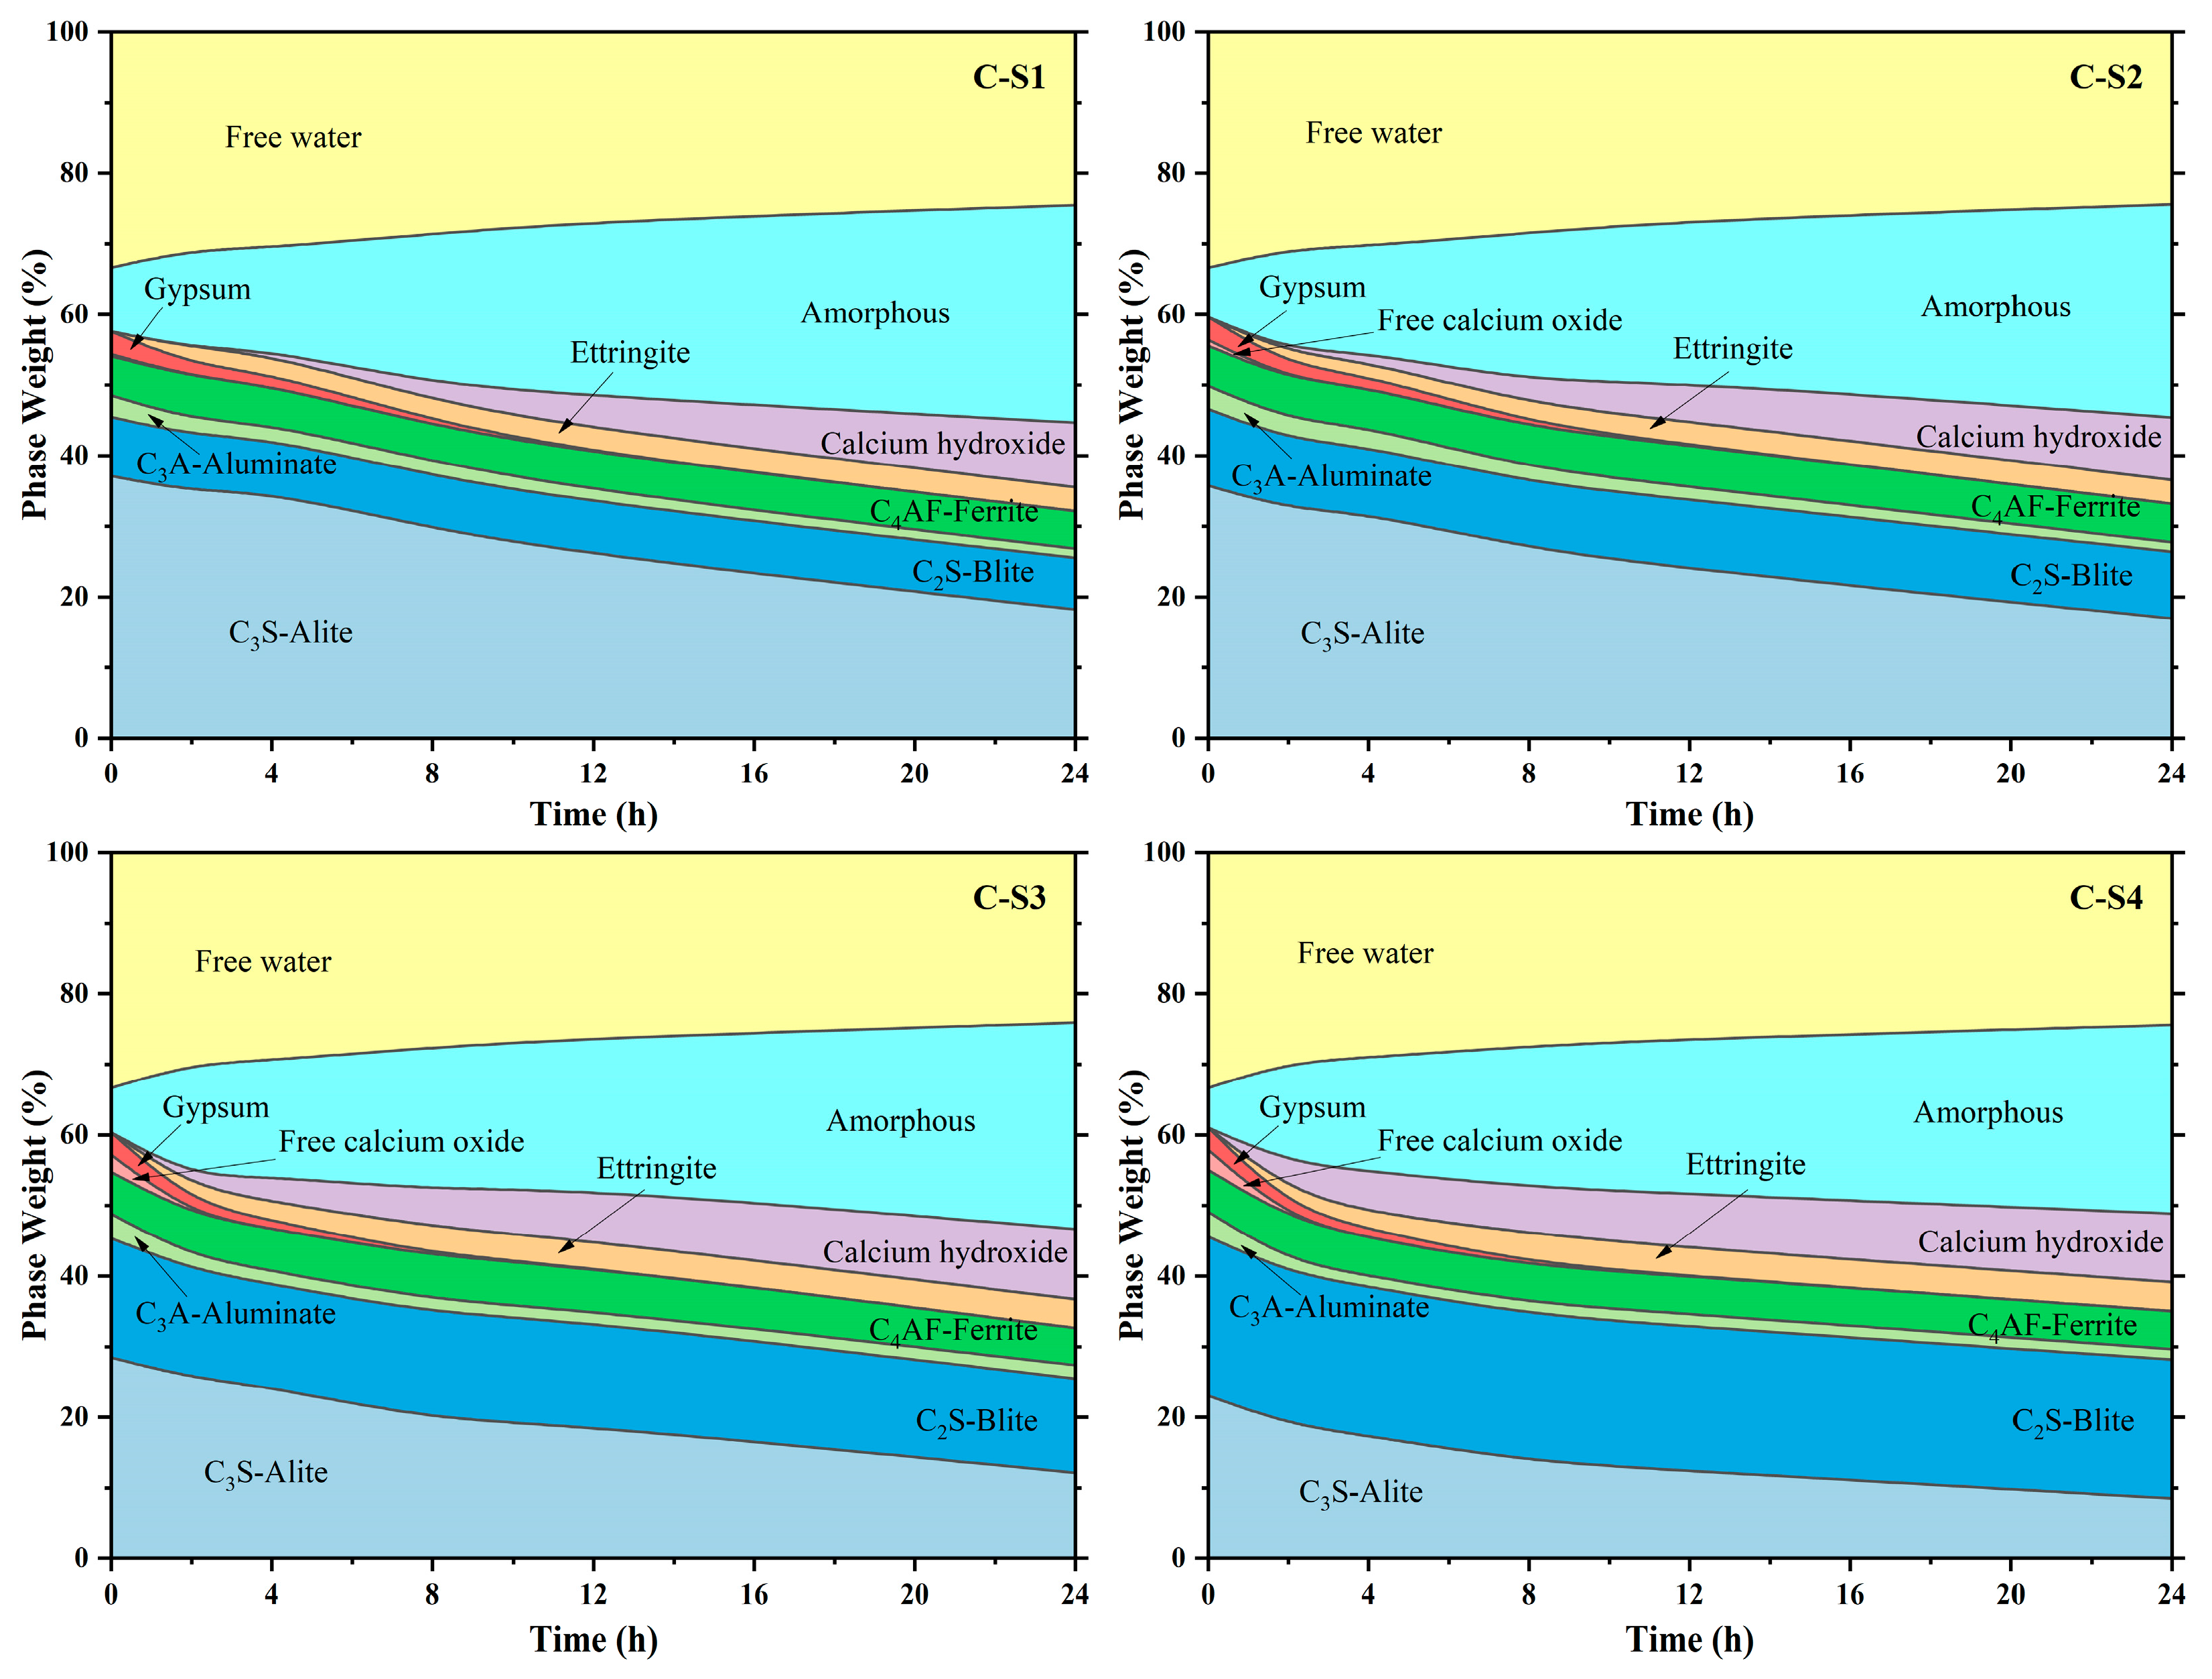
Buildings 15 01910 g016
Figure 17. Quantitative analysis of minerals of cement pastes at different ages.
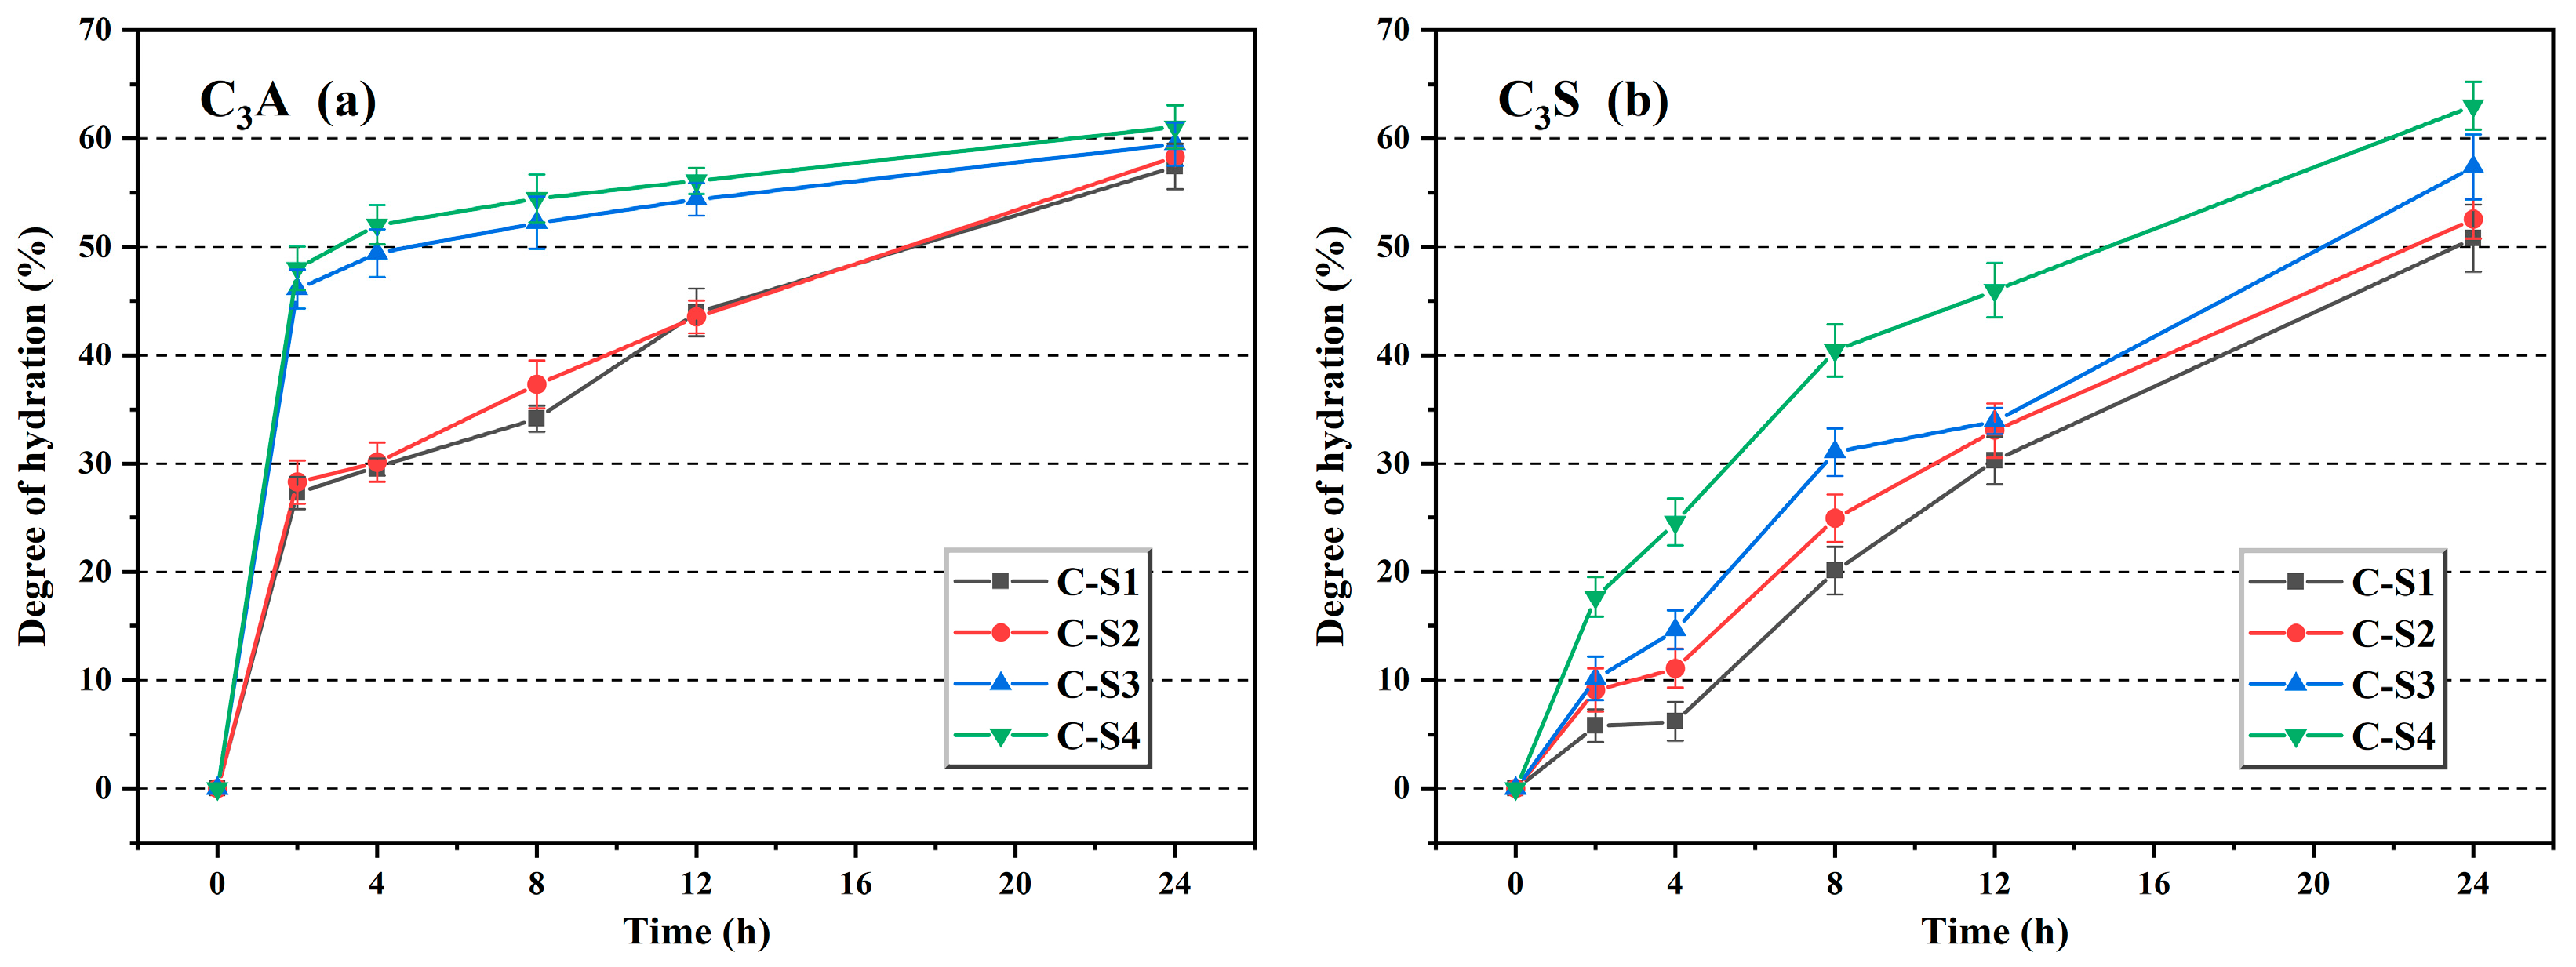
Buildings 15 01910 g017
Figure 18. The hydration degree of C3A (a) and C3S (b).
Buildings 15 01910 g018
Figure 19. Compressive strength of Portland cement at different ages.
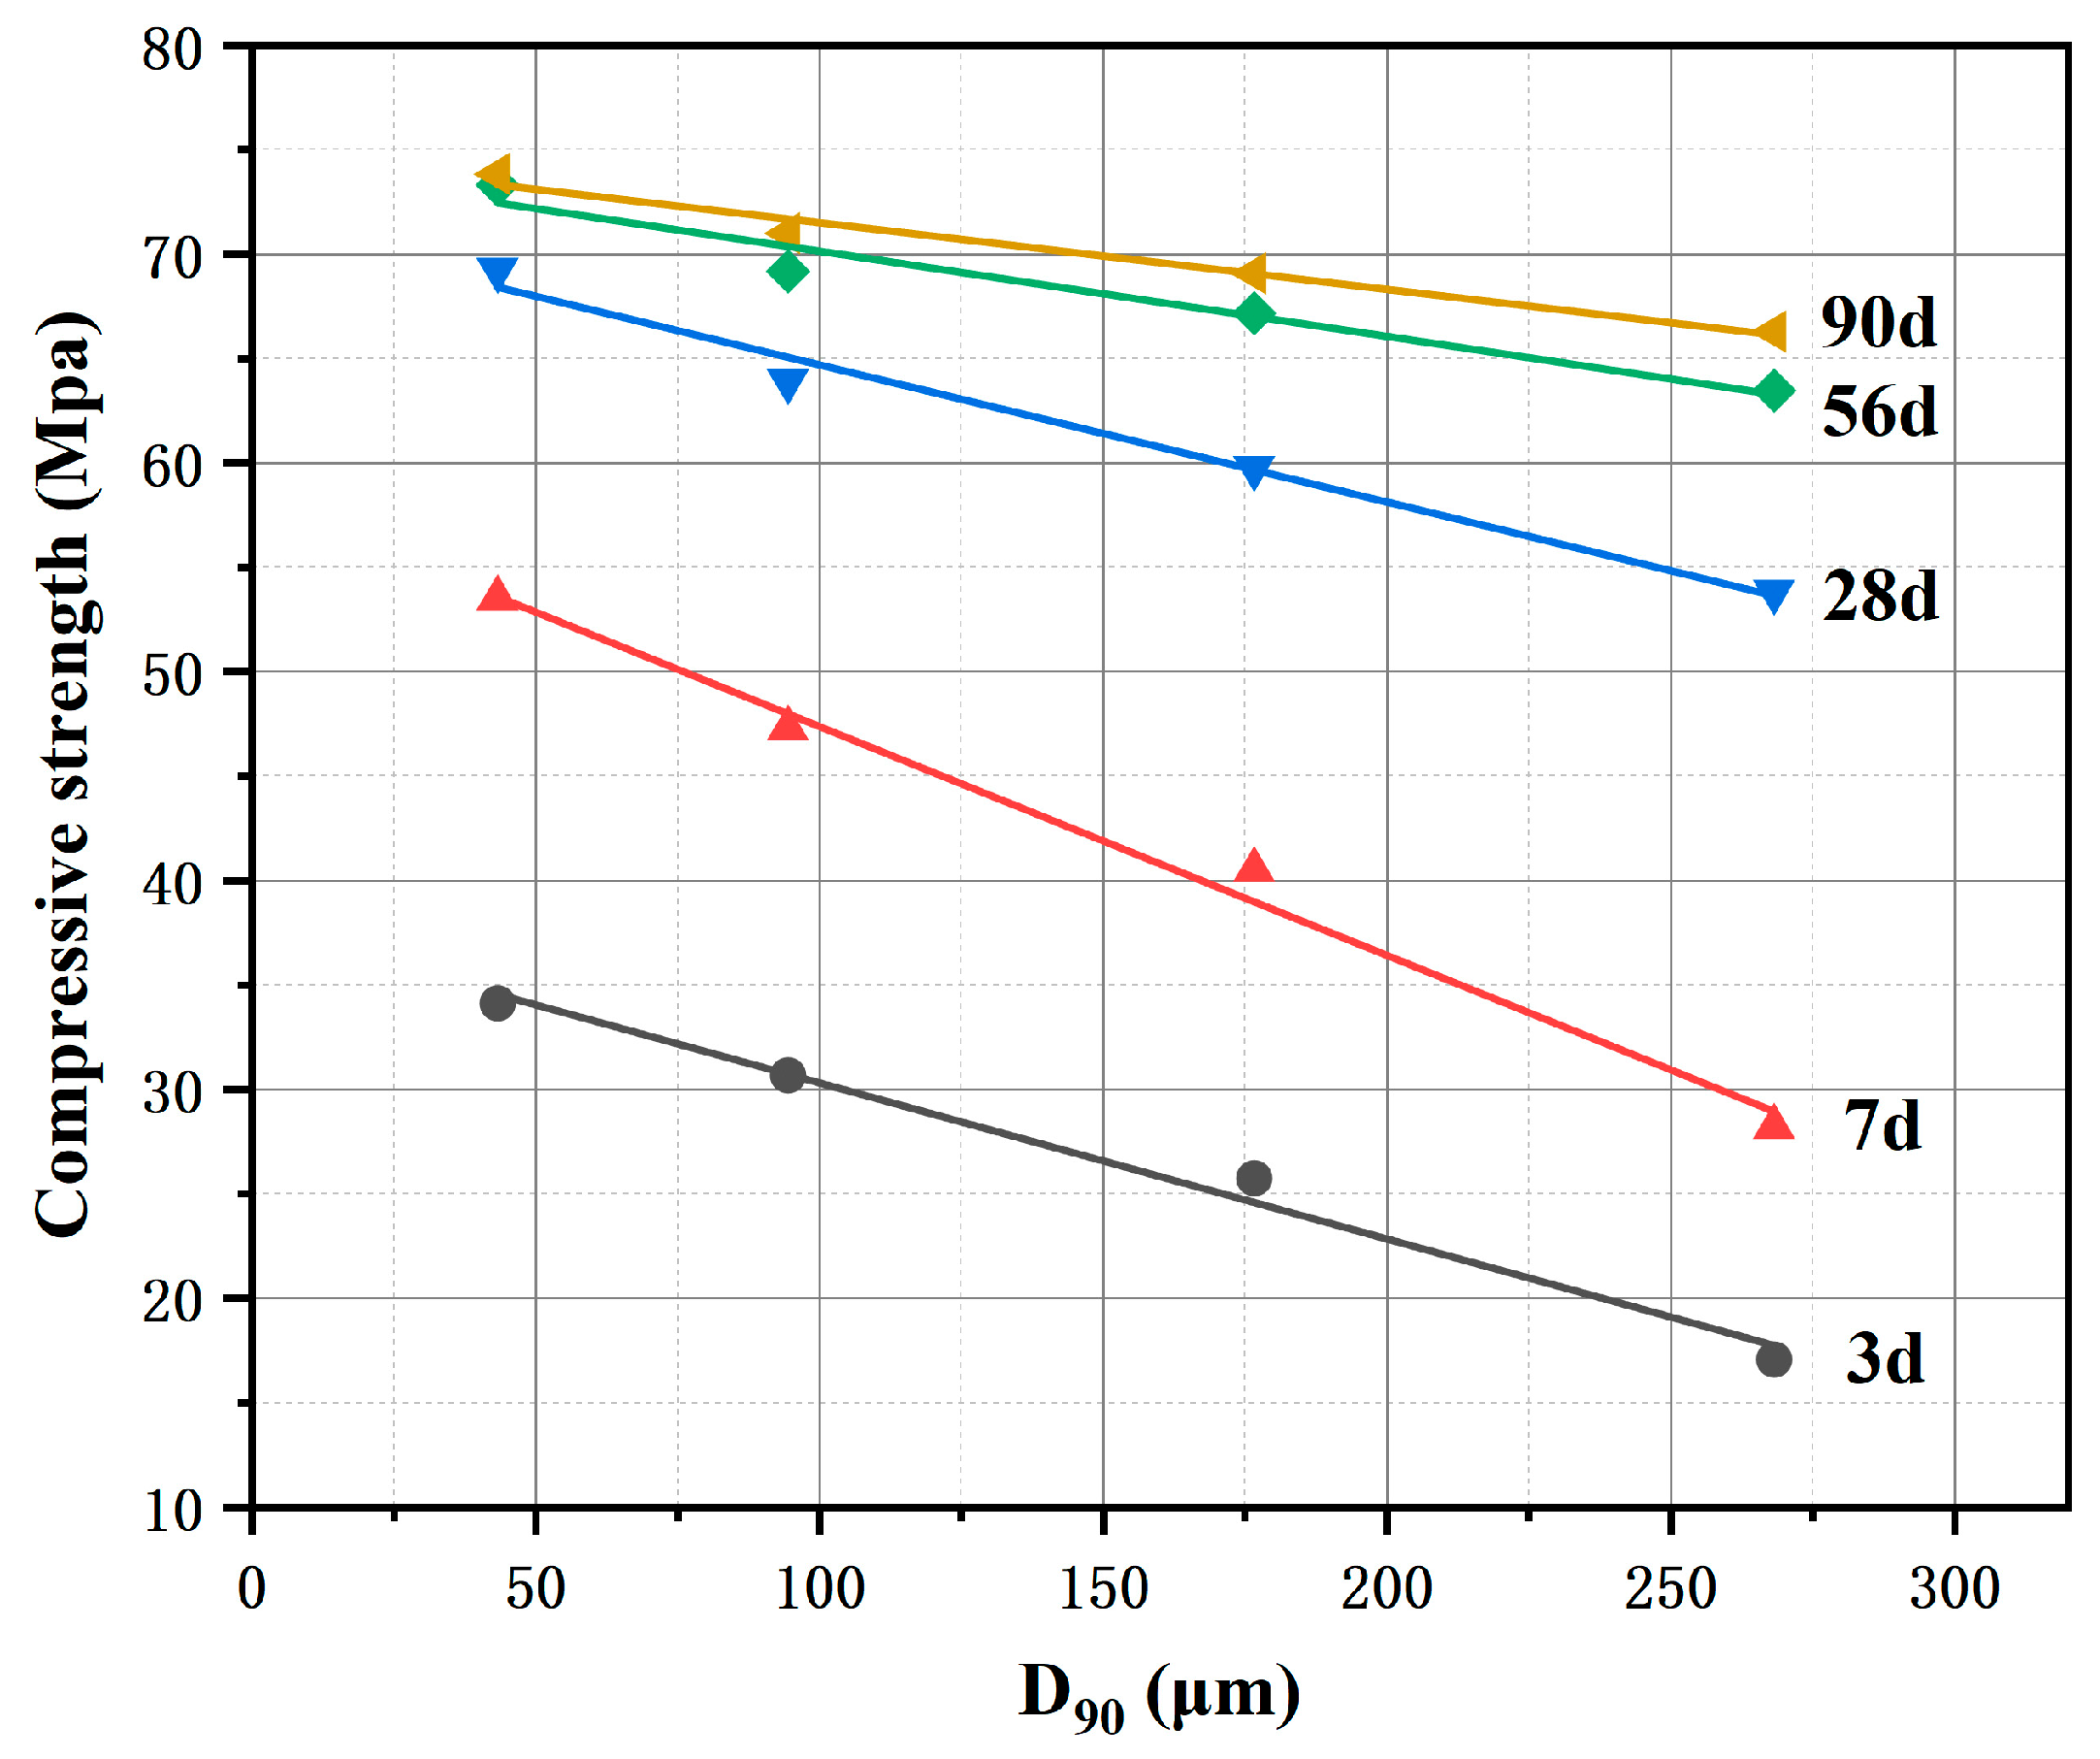
Buildings 15 01910 g019
Figure 20. Quantitative relationship between sandstone fineness (D90) and cement compressive strength.
Buildings 15 01910 g020
Table 1. The chemical compositions of raw materials and Portland clinker (wt.%).
SiO2Al2O3Fe2O3CaOMgOK2ONa2OSO3LOI 1
Low-grade limestone7.631.870.9849.021.220.260.030.2238.90
Sandstone62.356.562.0414.230.471.720.13-11.24
Bauxite31.4556.575.521.370.200.400.06-1.31
Iron slag28.814.1959.12.271.201.150.430.512.40
Desulfurized gypsum2.050.700.2736.210.410.090.1044.9913.87
Portland clinker (P-S1)21.715.273.4266.371.350.140.190.410.28
1 LOI represents loss on ignition.
Table 2. Particle size distributions of sandstones with varying fineness (μm).
D10 1D20D30D40D50D60D70D80D90
S11.73.35.89.514.820.626.232.943.2
S210.430.41.248.454.761.268.678.394.4
S334.483.299.7111.3121.7131.9143.0 156.176.6
S441.7136.0157.9174.0188.4202.218.9238.3268.2
1 DX represents the particle size at which X% of the cumulative particle size distribution is reached.
Table 3. The proportion of raw meals (wt%).
Raw MaterialLow-Grade LimestoneSandstoneBauxiteIron Slag
R-S1 to R-S486.110.12.01.8
Table 4. The calculated parameters of the clinker’s specific surface area.
Standard Sample 1P-S1P-S2P-S3P-S4
Density (g/cm3)3.033.203.203.203.20
Permeation time (s)76.880.081.782.379.0
Specific surface area (m2/kg)358.2346.2349.8351.1343.9
1 The standard sample is Portland cement, and its specific parameters are provided by the manufacturer.
Table 5. Crystallographic reference identifiers (ICSD) for Rietveld refinement components.
PhaseICSD No.Ref.PhaseICSD No.Ref.
C3S-M394742[15]CaO28905[16]
C2S-β81096[17]AFt155395[18]
C4AF9197[19]CaSO4·2H2O27876[20]
C3A1841[21]Ca(OH)215471[22]
Table 6. The volume change of reactions during clinker calcination (cm3).
NumberReaction FormulaVolumeVolume Change
BeforeAfter
1 2 CaO +   SiO 2 2 CaO · SiO 2 60.7052.12−8.58
2 3 CaO +   Al 2 O 3 3 CaO · Al 2 O 3 75.6564.14−11.51
3 4 CaO + Al 2 O 3 +   Fe 2 O 3 4 CaO · Al 2 O 3 · Fe 2 O 3 122.84128.916.07
4 2 CaO · SiO 2 + CaO 3 CaO · SiO 2 68.8471.923.08
Table 7. Quantitative results of clinkers by external standard method.
C3SC2SC3AC4AFCaOACn 1
P-S158.4513.194.778.720.5014.38
P-S256.3317.045.208.871.4011.16
P-S344.8426.625.419.393.819.92
P-S436.2935.565.489.344.478.87
1 ACn represents amorphous and crystalline non-quantified phases.
Table 8. C3S and C2S size statistics.
C3S Size (μm) C2S Size (μm)
S1S2S3S4S1S2S3S4
N total365432326339355348400395
Minimum4.1 6.3 7.0 7.5 7.0 6.8 7.4 8.1
Media18.3 20.1 23.6 19.0 18.0 22.4 21.5 22.7
Maximum52.2 63.3 89.3 61.1 41.9 45.6 62.3 79.0
Mean20.2 21.5 26.5 20.8 18.8 22.8 23.8 25.6
Table 9. Regression equations and coefficients of determination between sandstone fineness (D90) and cement strength at different curing ages.
AgesRegression EquationCoefficient of Determination (R2)
3 days y = 0.0747 x + 37.8081 0.9878
7 days y = 0.1096 x + 58.3558 0.9904
28 days y = 0.0657 x + 71.2903 0.9842
56 days y = 0.0408 x + 74.2441 0.9564
90 days y = 0.0319 x + 74.7257 0.9751
Disclaimer/Publisher’s Note: The statements, opinions and data contained in all publications are solely those of the individual author(s) and contributor(s) and not of MDPI and/or the editor(s). MDPI and/or the editor(s) disclaim responsibility for any injury to people or property resulting from any ideas, methods, instructions or products referred to in the content.

