Article

The Validation and Performance Analysis of a UV Air-Cleaning System for the Indoor Air Quality of Populated Indoor Spaces

Department of Biomechatronics Engineering, National Taiwan University, Taipei 106, Taiwan
*
Author to whom correspondence should be addressed.
Buildings 2025, 15(11), 1893; https://doi.org/10.3390/buildings15111893
Submission received: 3 January 2025 / Revised: 14 March 2025 / Accepted: 26 May 2025 / Published: 30 May 2025

Abstract

Indoor air quality (IAQ) is crucial for occupant health and sustainable urban living. Given the significant time spent indoors in urban areas, maintaining IAQ mitigates health risks and enhances quality of life. This study evaluates the effectiveness of installing a UV air-cleaning device at the outlet of an existing air-conditioning system. The experiments involved measuring the colony-forming units (CFUs) of airborne microorganisms before and after the installation of the UV device. Results demonstrated a significant reduction in CFUs, confirming the device’s efficacy in improving IAQ. Using the UV air-cleaning device for 30 min could reduce bacterial concentration by more than 70.7%. Furthermore, using a model from the literature, the time required to achieve a 90% reduction in pollutant concentration was calculated, providing a quantitative measure of the device’s performance. Using the energy recovery ventilators only requires 25.3 to 49.6 min to achieve a 90% reduction, whereas configurations incorporating UV lamps can reach 90% reduction in 7.1 min. Based on these findings, recommendations for the optimal use of UV air-cleaning devices are proposed, offering valuable insights for future designs of air purification systems.

1. Introduction

Urbanization has led to more people living and working in enclosed spaces, with jobs and education predominantly conducted indoors, resulting in increased time spent inside and altered environmental exposures. Additionally, the COVID-19 pandemic has necessitated isolation in dedicated rooms when infections occur.
Improved indoor air quality (IAQ) is essential for sustainable urban living, especially in densely populated areas, as it reduces health risks and enhances quality of life [1,2]. Ozone is occasionally utilized for microbial reduction [3]. Similarly, UV air-cleaning devices contribute to healthier indoor environments by effectively reducing airborne microorganisms, thereby easing the burden on healthcare systems and improving public health outcomes.
However, conventional air conditioning systems are insufficient for achieving optimal IAQ because they primarily recirculate pollutants without effectively removing contaminants. The Ventilation and Acceptable Indoor Air Quality Standard 62.1 outlines specific methods for evaluating IAQ [4]. Inadequate filtration and fresh air replacement may allow microorganisms to adhere to dust particles and spread throughout indoor spaces, underscoring the need for innovative solutions that integrate air purification with ventilation.
In healthcare facilities, pathogens introduced by patients may spread via air conditioning systems, potentially infecting others on different floors [5].
Kim et al. (2016) found that, despite daily cleaning and basic disinfection, many environmental samples in isolation wards remained positive for MERS-CoV, with the virus surviving in the air for up to 6 days [6].
Using the Wells–Riley equation, incorporating variables such as human movement, pollutant sources, and door opening/closing [7], Nardell (2021) suggested the emission and elimination dynamics of airborne infectious agents [8]. The Wells–Riley equation places emphasis on ventilation-driven dilution. The study validated the effectiveness of upper-room germicidal ultraviolet-C (GUV) systems, which disinfected the upper 22% of indoor air volume. Comparable experiments employing ultraviolet-C irradiation to reduce the viability of various bacterial and viral species have been conducted [9,10,11].
Memarzadeh and Xu (2012) found that, while increasing air changes per hour (ACHs) dilutes pollutant concentrations, it does not automatically improve ventilation efficiency [12]. Their study showed that optimal airflow pathways between pollutant sources and exhaust points are crucial. Under suboptimal conditions, ACH = 12 underperformed compared to ACH = 6 because of flow disturbances, whereas, under optimal conditions, higher ACHs consistently reduced exposure [13]. This highlights the need to both increase the ACH and optimize airflow pathways for effective indoor ventilation.
Buchan et al. (2020) simulated radiation transmission and fluid dynamics using the Boltzmann Transport and Navier–Stokes equations to better understand ventilation, airflow, and ultraviolet inactivation in an atmospheric setting [14]. The results obtained by combining UV and ACH show that, when UV was activated alongside a high ACH, the concentration of SARS-CoV-2 could be most effectively reduced. In the first 15 min, scenarios with UV turned off at a high ACH and UV turned on at low ACH produced similar results; however, over time, the UV-on scenario outperformed the UV-off condition. This suggested that, when cost or space constraints limited ACH, UV disinfection could still achieve effective reduction.
Ciugudeanu et al. (2021) designed a device that combines these two different UV technologies, called the Sterilight-Vent [15]. It used UV LEDs to build the device and could be attached to any required space without modifying the existing HVAC system. When no one was present in the room, UV directly irradiated the surfaces [16]; when people were present, UV irradiated the air entering the filter.
Jensen (2021) proposed that, in addition to the application of UV within ducts, upper-room UV fixtures were another viable approach [17]. When UV fixtures were used in conjunction with ceiling fans to promote air mixing in the upper part of a room, their efficiency was significantly improved compared to using UV alone.
Due to the high cost and difficulty of installing HVAC upgrades, Kahn and Mariita (2021) proposed the K-M model to quantify the usage of UVC on the equivalent Air Change Rate (eACH) and time reduction to decrease the concentration [18]. This model utilized UV air treatment to convert ventilation into an eACH, supplementing existing mechanical ventilation systems. By controlling factors such as reduction time, occupancy restrictions, and UV light intensity, the model enabled a faster and more efficient return to normal life while also being applicable to other types of airborne infectious outbreaks. The K-M model based on airborne transmission risk can be expressed as Equation (1).
  TR ( t ) = R β ( d ) + R ( C ) 1 1 + e t μ s
where TR(t) is the airborne transmission risk, Rβ is the sum of baseline risks, R(C) represents pathogen concentration-related risk, t is the exposure time, μ is the location, and s is the scale. Under the K-M model predictions, a 200 mW system accelerates the risk reduction to 4.2 min, while a 375 mW (lamp) system reduces it to 3.4 min, respectively, generating eACH values of 22 and 25 to supply insufficient mechanical ventilation.
IAQ is vital for sustainable urban living and healthy environments. However, outdoor conditions in urban areas often limit the ability to increase ACH in buildings and public transportation. In these situations, an effective, energy-efficient air purification device is essential for mitigating pollution sources [12,14].
In this study, an innovative UV disinfection device incorporating an energy recovery ventilation (ERV) system for mechanical ventilation is proposed. ACH adjustments combined with UV disinfection. The experiment was designed to enhance the indoor air quality while promoting energy efficiency and sustainability. The findings on the optimal use of UV devices provide valuable insights into designing energy-efficient air purification systems that minimize resource wastage, aligning with urban sustainability goals by reducing energy consumption and environmental impact.

2. Materials and Methods

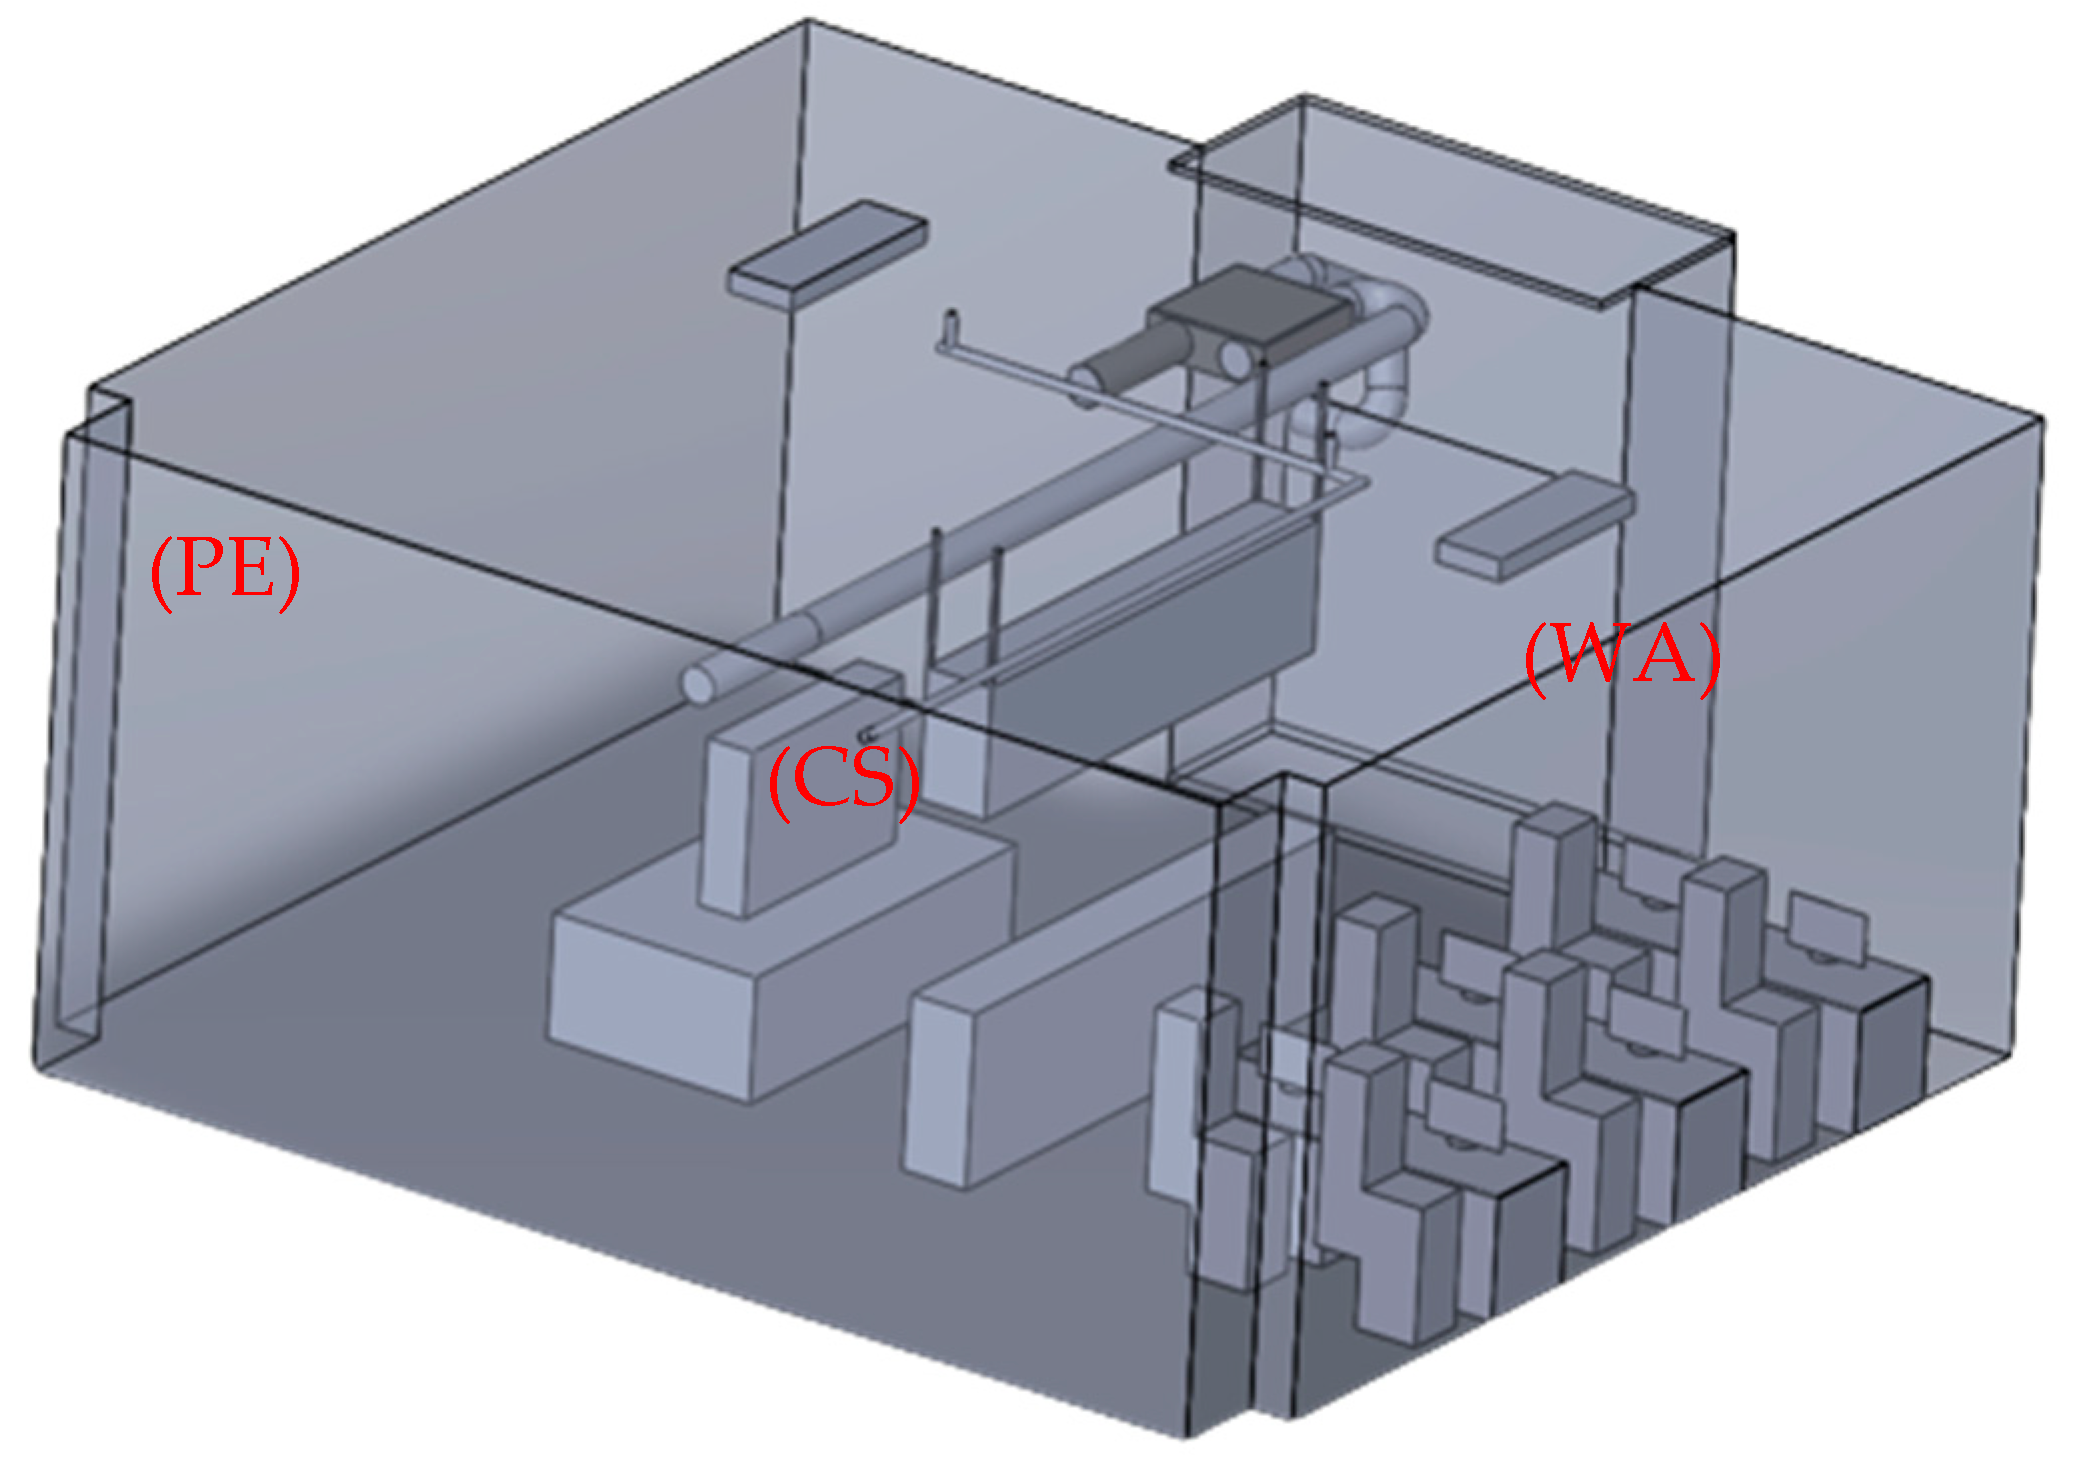
2.1. Experimental Area

This study sought to assess air quality conditions within a representative research environment, typically accommodating 6 to 8 people, where instrumentation was deployed throughout a room measuring 8.6 m by 7.8 m with a ceiling height of 3.3 m, as shown in Figure 1.

2.2. Energy Recovery System (Energy Recovery Ventilator)

Figure 2 illustrates the energy recovery system positioned within the experimental area. It enables forced-air circulation by introducing ambient air from outside, supports the exchange of indoor and outdoor air, and recaptures thermal energy while effectively blocking the transmission of larger particulate contaminants through the filtration system. The energy recovery ventilator is capable of processing an airstream volume reaching 500 cubic meters per hour (CMH). The fan coil air velocity can be adjusted to high (2.2 m/s), medium (1.6 m/s), or low (1.0 m/s). This velocity was measured using the Testo 425 hot-wire anemometer, which has a measurement range of 0.01 to 30 m/s, an accuracy of ±(0.03 m/s + 4.0% of the measured value) for the 0.01 to 20 m/s range, and a resolution of 0.01 m/s.

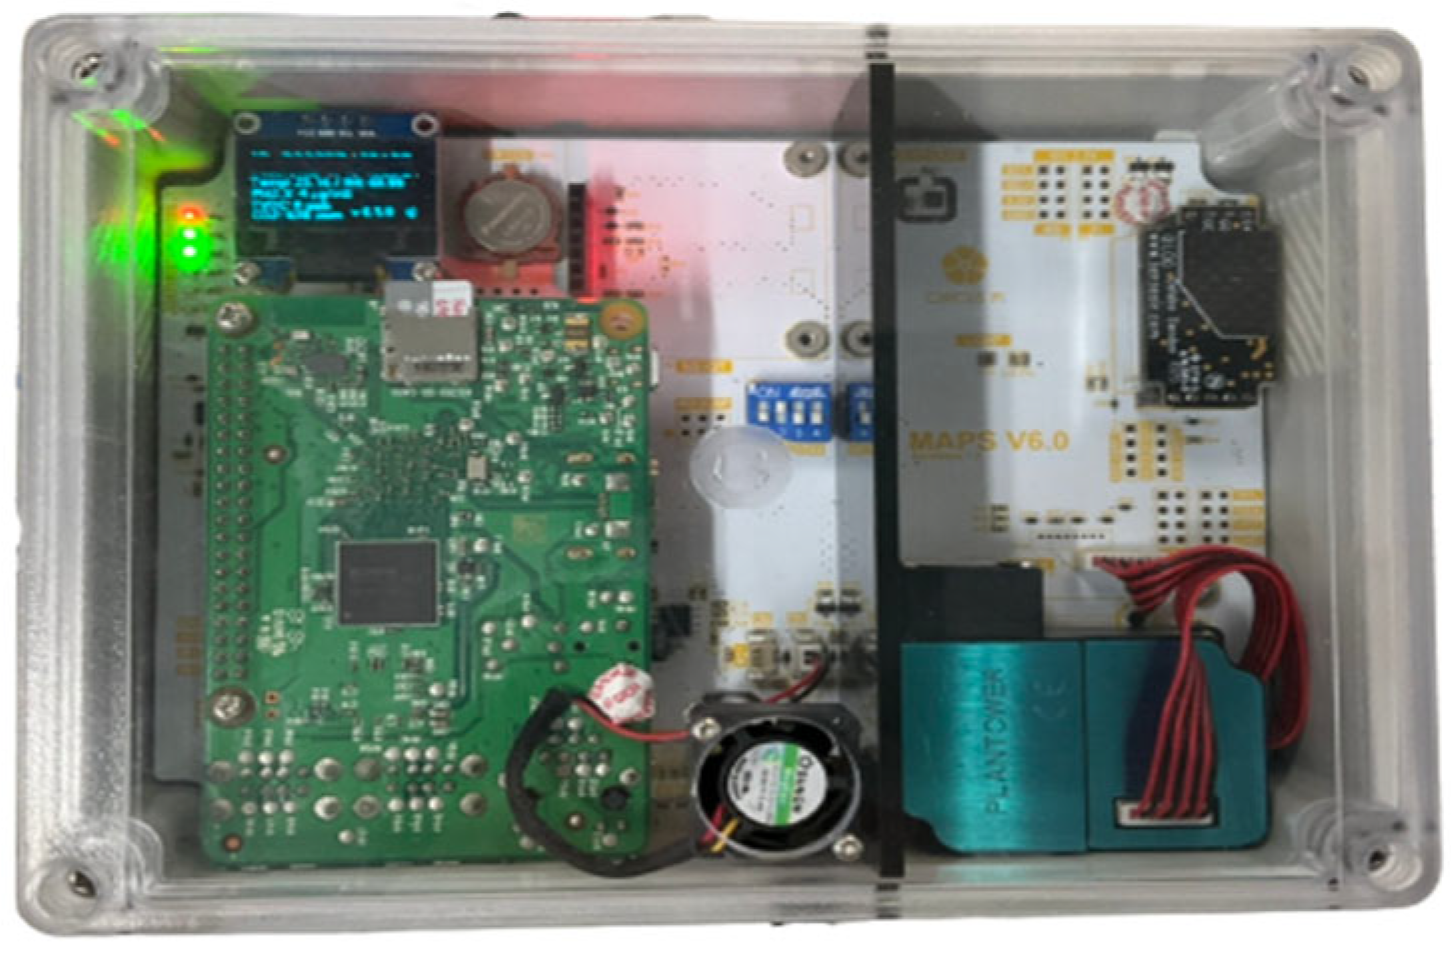
2.3. Air Boxes for Indoor Air Quality Monitoring

Two air boxes (MAPSV6, ICShop, Kaohsiung, Taiwan) were utilized to record indoor air quality history [19]. The sampling frequency was set to once per 5 min. It monitored various parameters, including temperature, humidity, particulate matter (PM1.0, PM2.5, PM10), total volatile organic compounds (TVOCs), and CO2 concentration (ICShop, 2024). The temperature measurement is with an accuracy of ±0.2 °C, an operating range of −40 to 125 °C, and a response time of over 2 s. Relative humidity measurement is with an accuracy of ±2RH%, an operating range of 0–100 RH%, and a response time of 8 s. The particle sensor has an effective range of 0–1000 μg/m3, a resolution of 1 μg/m3, and a response time of 10 s. CO2 measurement is with an accuracy of ±40 ppm, a range of 400–10,000 ppm, and a response time of 30 s. TVOC detection offers a resolution of 1–32 ppb, a measurement range of 0–60,000 ppb, and a response time of 1 s. Data acquisition can be performed using Python-based (version 3.8 or later) scripting for subsequent evaluation or, alternatively, logged onto an SD card, as illustrated in Figure 3.

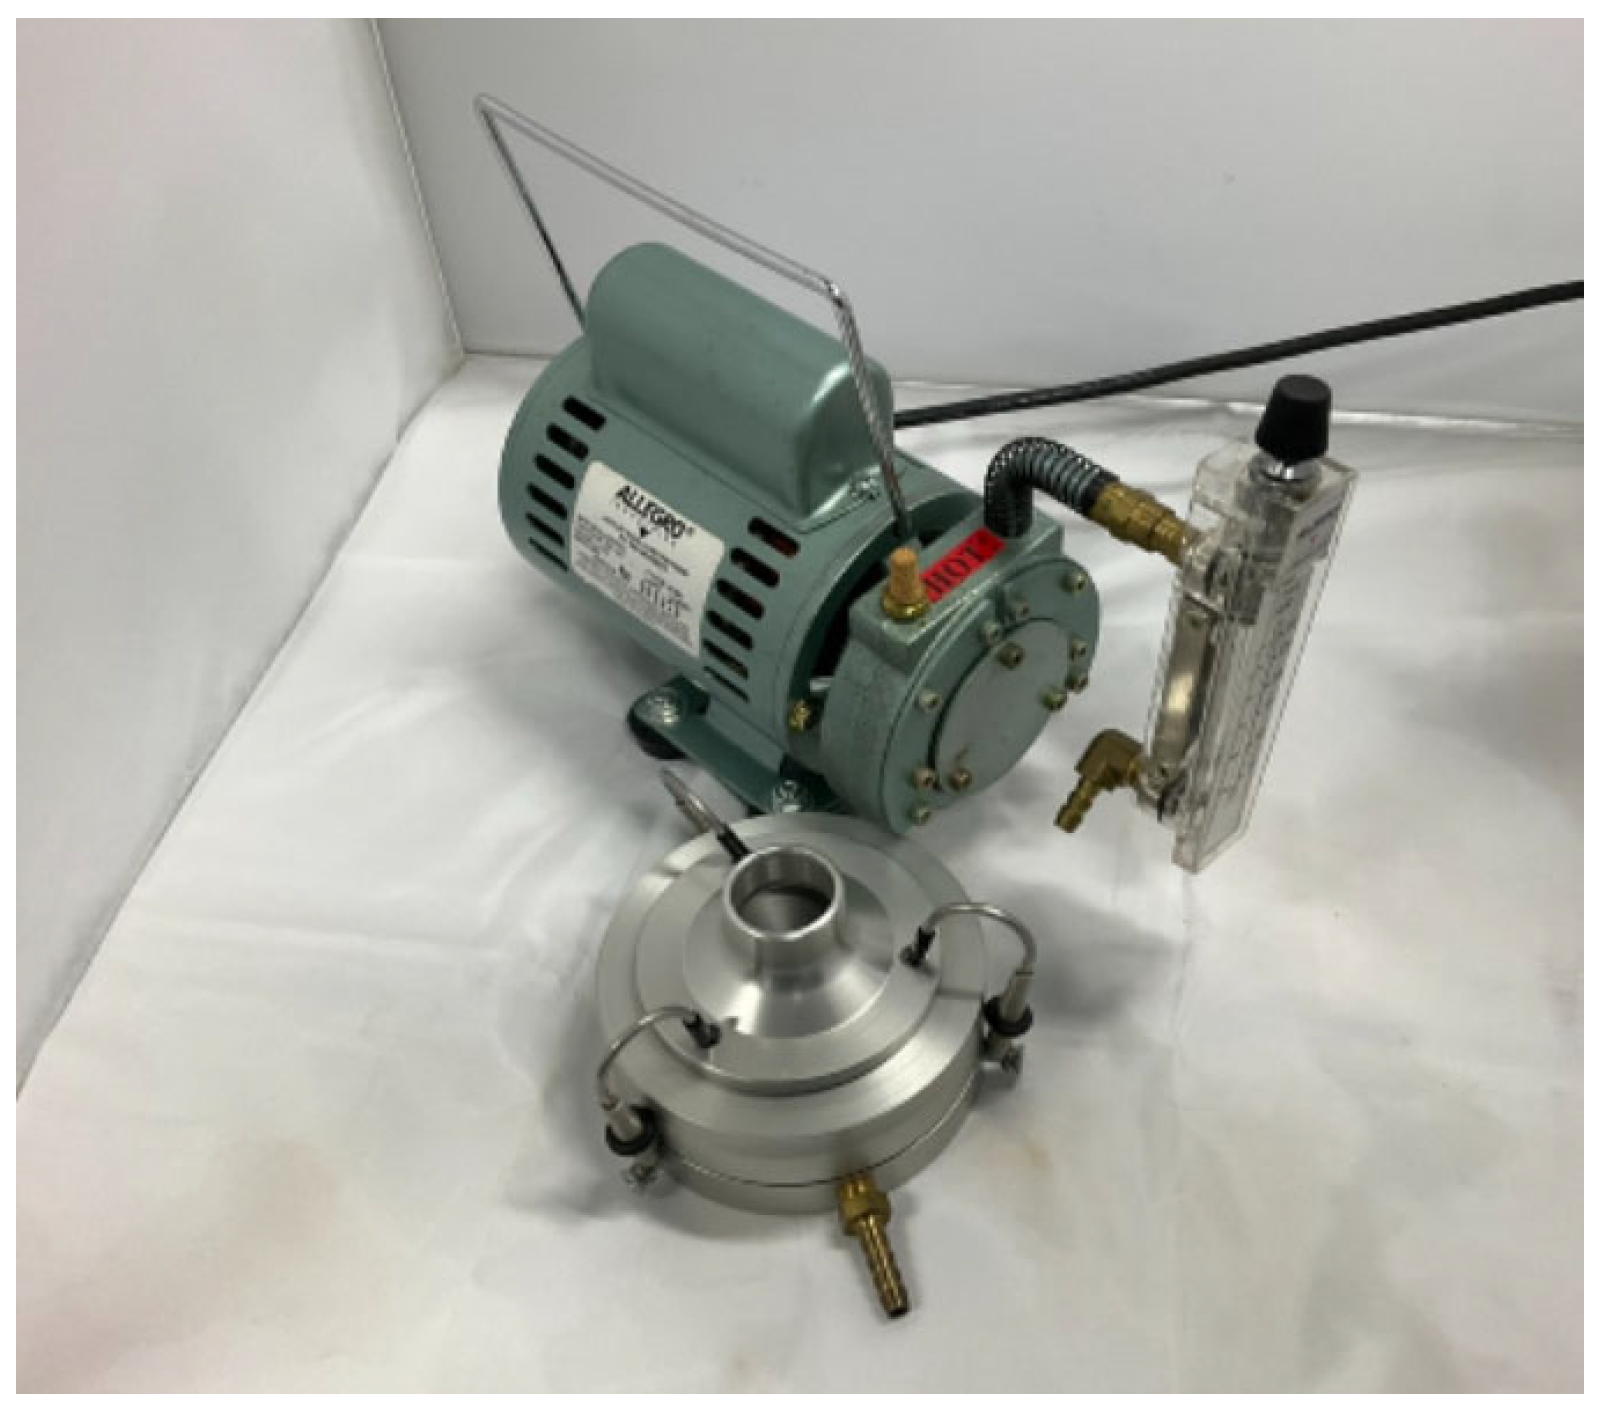
2.4. Single-Stage Viable Impactor Sampling System

A single-stage viable impactor sampling system (ZHV00-A6_KIT, Zefon Corporation, Ocala, FL, USA), as shown in Figure 4, was used for air sampling. The lower section comprises an inlet, an impaction plate, and a base, where a defined volume of air passes through and particles of specific sizes are impacted onto a Petri dish. The upper section features a high-flow sampling pump equipped with a side-mounted float flowmeter, with a range of 0.1–30 L per minute (LPM).
The sampling locations were distributed along the central aisle of the main experimental area and on both sides of the central cabinet, each at a distance of at least 0.5 m. The sampling height was set to match the average height of laboratory personnel, adjusted to 1.5 m using a tripod. Each sampling session lasted 5 min and was conducted in duplicate. The air pump flow rate was set to 28.3 LPM. For further information, please refer the cited reference [20].

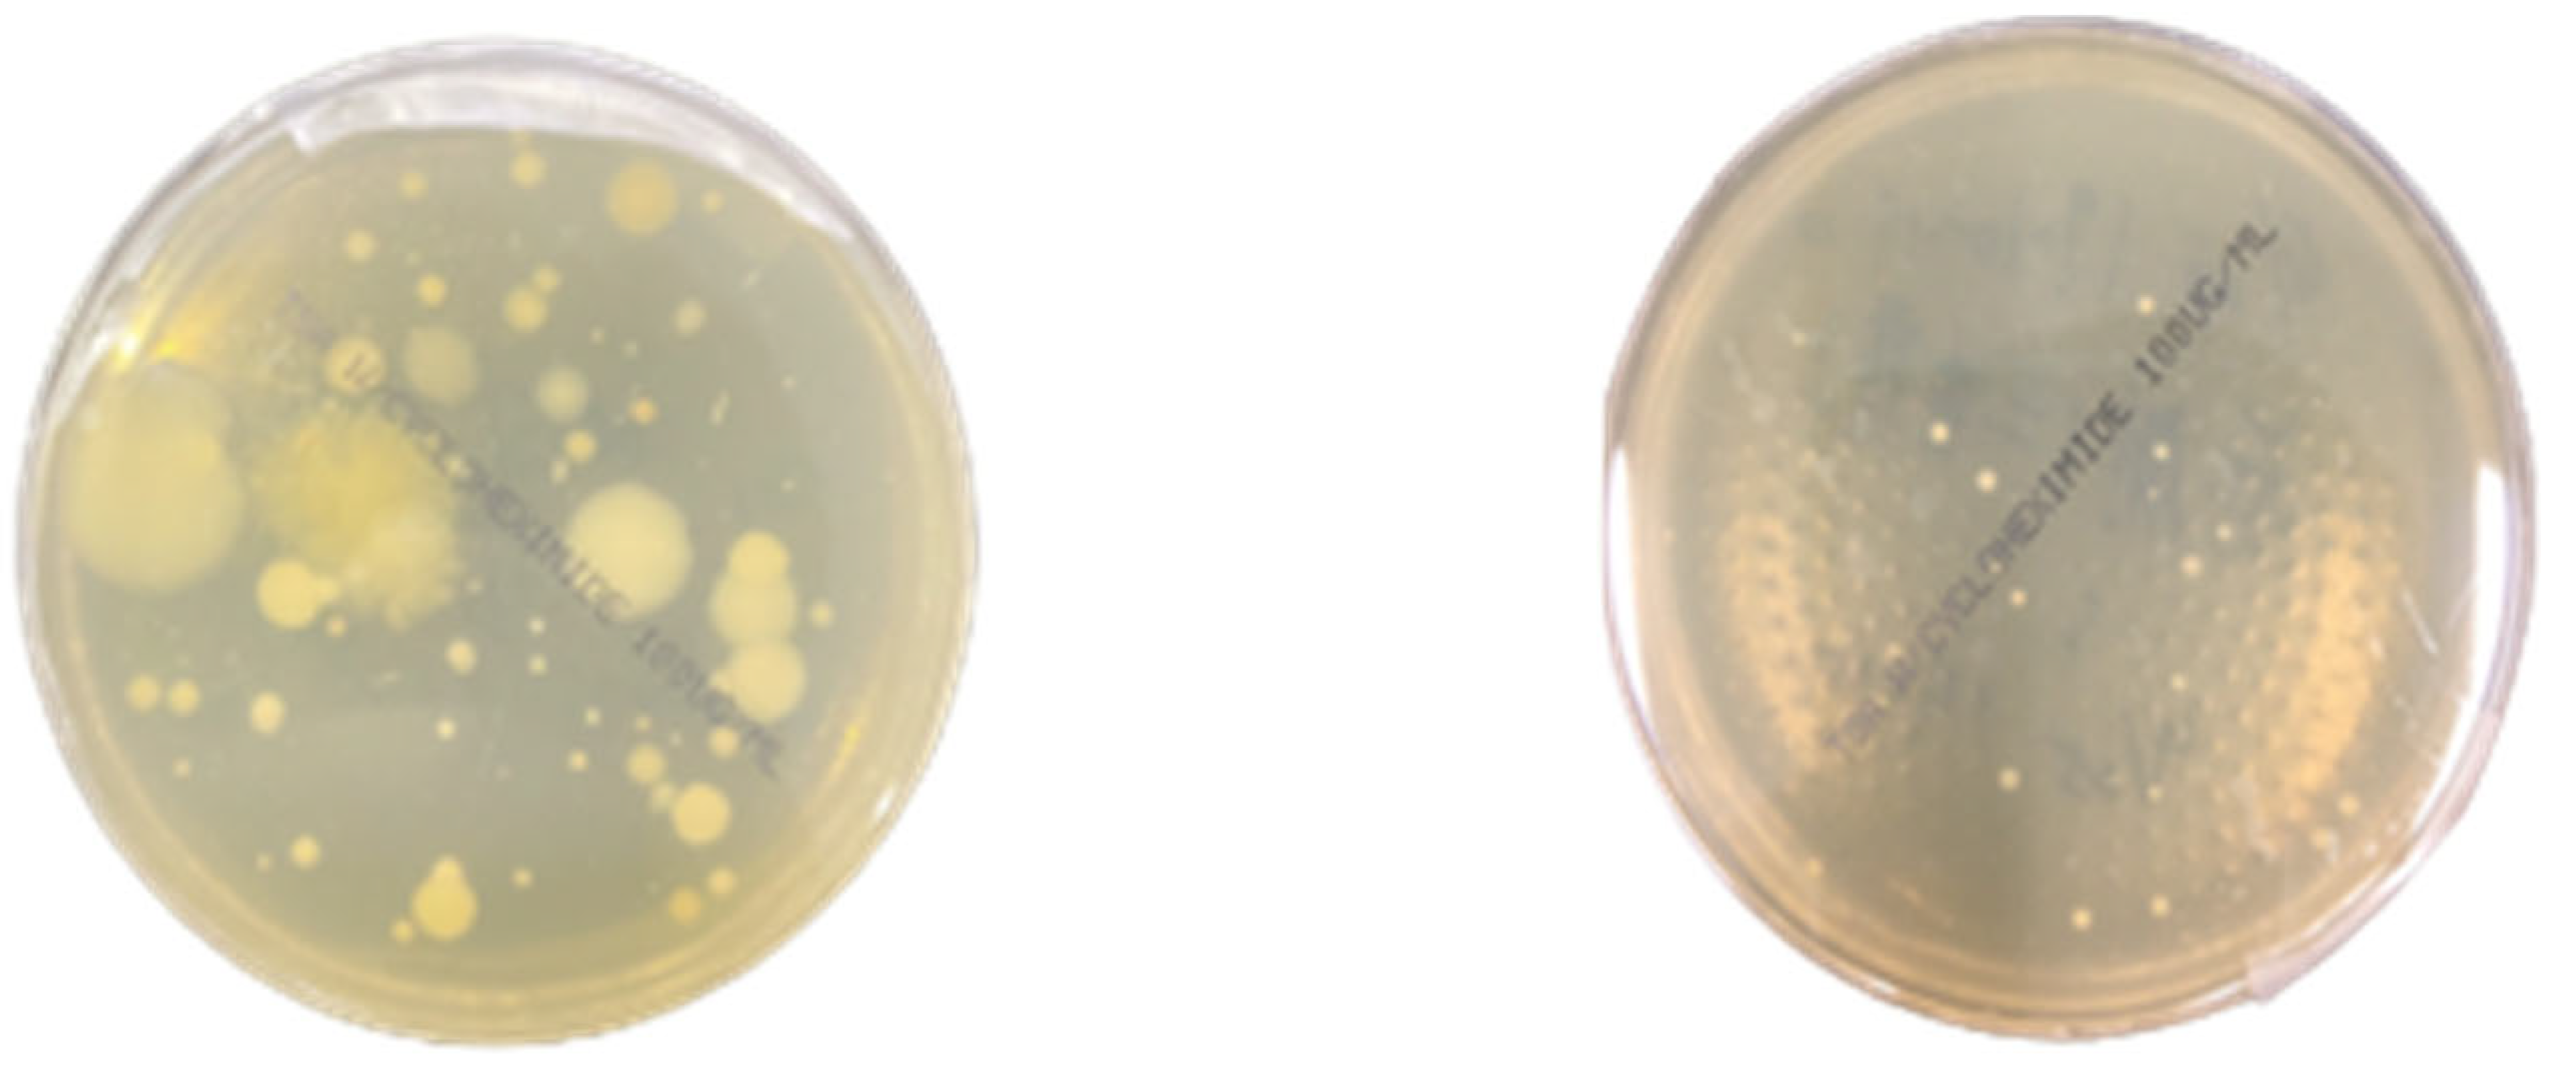
2.5. Investigating the Bacterial Concentrations in the Air

This experiment focused on investigating variations in bacterial concentrations in the air. Therefore, the sampling used Petri dishes containing Tryptic Soy Agar (TSA) with cycloheximide. Cycloheximide was included to reduce fungal contamination on the Petri dishes. The results are presented in Figure 5.
The sampling procedures and result processing were conducted in reference to the airborne bacterial concentration detection method proposed by the Environmental Protection Administration (EPA) of the Republic of China, with the method number NIEA E301.15C.
The samples were incubated at 30 ± 1 °C for 48 ± 2 h, after which CFUs on the medium were counted. The total bacterial concentration in the air was then calculated in terms of CFUs per cubic meter of air.

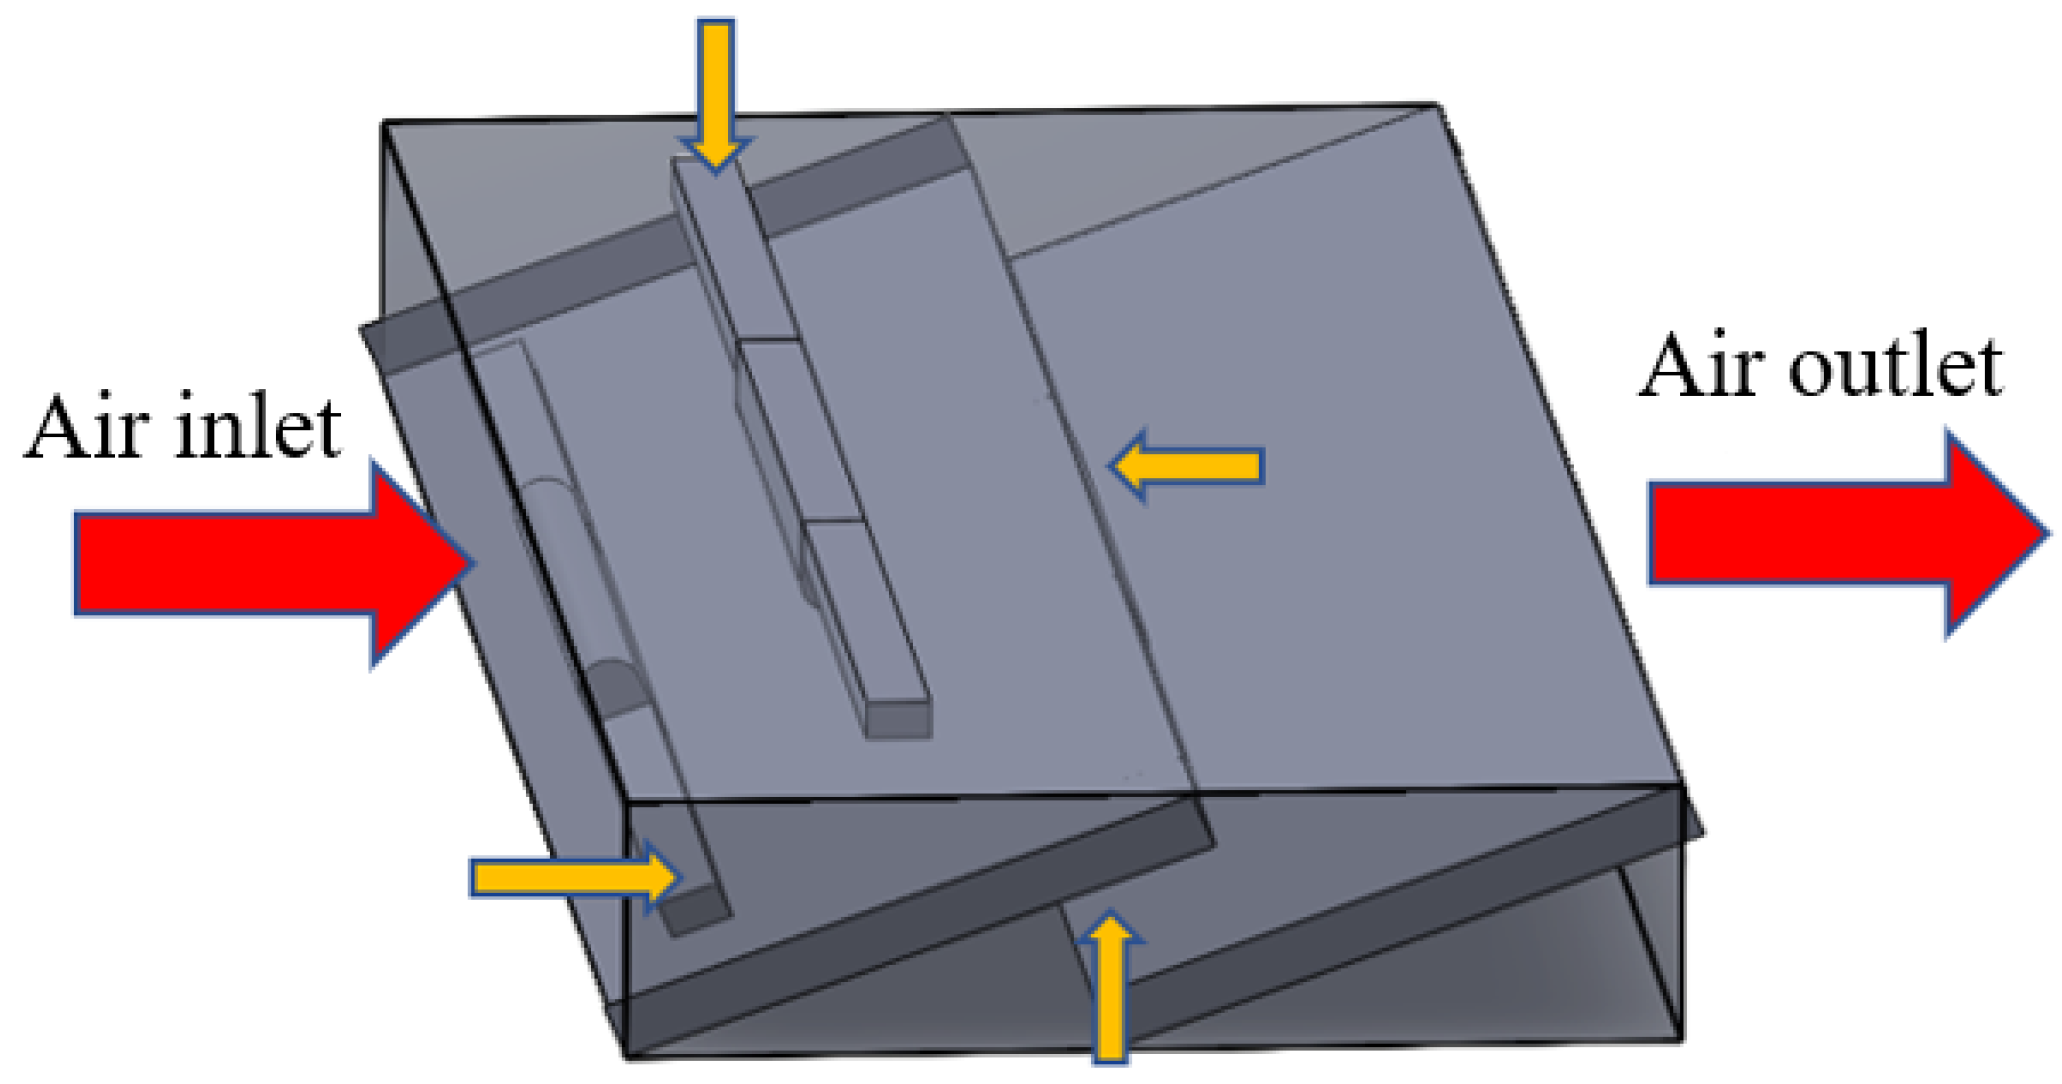
2.6. The Design of UV Air-Cleaning Device

Ultraviolet lamps (G10T8, SANKYO DENKI, Hiratsuka, Kanagawa, Japan) operating at 2.7 W and emitting UV at 253.7 nm were used [21]. A small-scale UV box (1.4 m × 0.5 m × 0.14 m) was mounted on the ceiling and attached to standard air conditioning vents, allowing air to pass through for microbial reduction. The box features dual partitions arranged in a maze-like structure to ensure thorough irradiation and prolonged exposure. A total of 12 UV lamps were planned, divided into four groups for on/off control, as shown in Figure 6.

2.7. Performance Testing

In order to assess the reduction efficiency of the UV air-cleaning device when operated independently, this study set the initial condition as turning off the ERV to avoid any misleading effects from the dilution of contaminated air in the space, which might affect the UV air-cleaning device’s ability to interpret its capabilities. Fan coil air velocity (high: 2.2 m/s, medium: 1.6 m/s, low: 1.0 m/s), the number of UV lamps (2 or 4 groups), and reduction times (30 or 60 min) were compared. A total of 12 condition groups were set for comparisons, as listed in Table 1.

2.8. K-M Model

The application of the K-M model (Kahn and Mariita, 2021) enhances HVAC system design for enclosed shared spaces by providing insights into virus inactivation and achieving eACH [18]. This approach helps prevent the transmission of viruses through HVAC systems and poorly ventilated shared environments. The defined variables and procedures are as follows:
The steady-state concentration (CSS) can be expressed as the release rate (Rr) divided by the clean air delivery rate (CADR).
C s s = R r C A D R
The CADR caused by the ACH provided by the ERV is the product of the recirculation efficiency (RE) and the total airflow rate (Q).
C A D R E R V = R E Q
The CADR caused by UV radiation is the product of the airflow rate (Q′) at the FCU outlet and the reduction rate (RED) affected by the material and reflectivity of the UV chamber’s inner walls.
C A D R U V = Q R E D
The CADR when both the ERV and the UV unit are activated (ERV + UV) is the sum of the CADR values of each individual component, resulting in an overall increase in the CADR.
C A D R t o t a l = C A D R E R V + C A D R U V
The CSS achieved solely by activating the total heat exchanger to provide ACH is as follows:
C s s = R r C A D R E R V
The CSS achieved by simultaneously activating both the ERV and the UV unit is as follows:
C s s = R r C A D R E R V + U V
After reaching the steady-state concentration, assuming Rr is set to 0 (infected individuals leave the indoor environment), a decay test is conducted with the decay standard set at 90% concentration. The time required to reduce the concentration by 90% in the overall environment through the above-mentioned equipment can be calculated.
D 90 C s s = ln ( 0.1 C s s E R V C s s E R V + U V ) A C H E R V 60   m i n

3. Results

3.1. Results with ERV Turned on Only

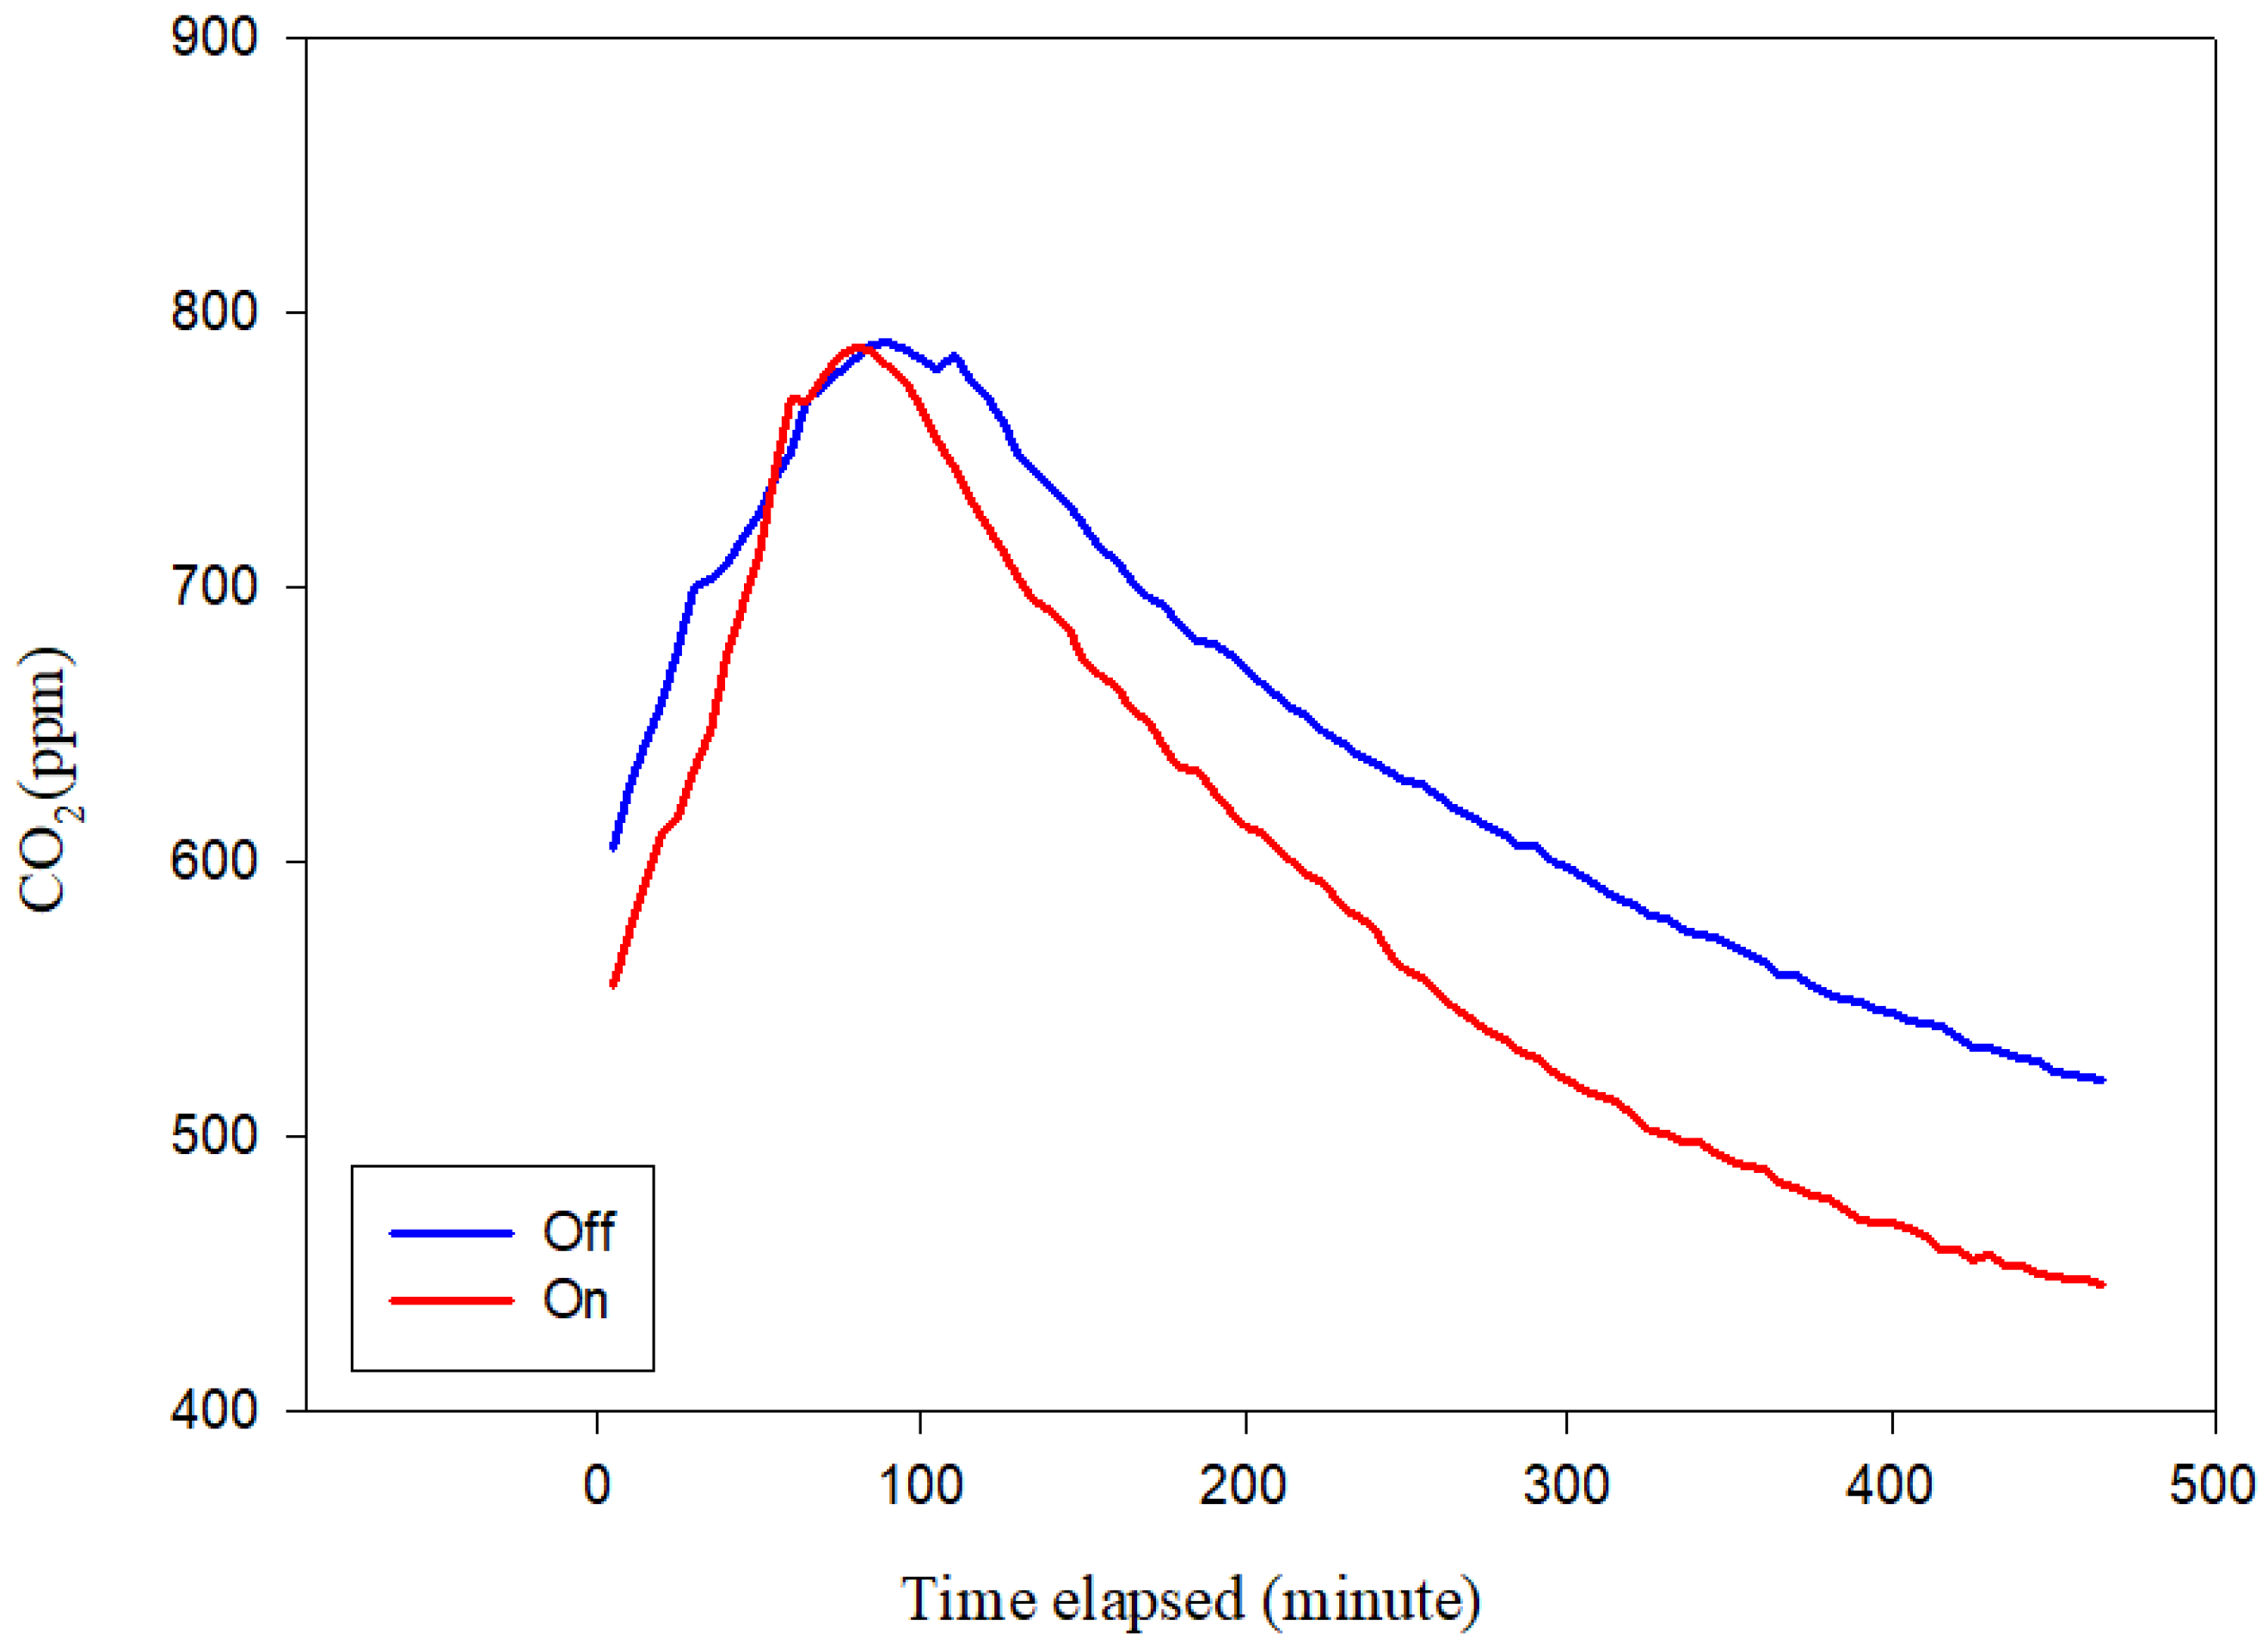
3.1.1. Sampling of CO2 and Airborne Particle Concentrations

Sampling was conducted between 9:00 AM and 5:00 PM, with the occupancy level generally stable at around 6–8 individuals. Under both full operation and shutdown of the energy recovery ventilator, air boxes were placed on the centrally located storage unit and in both the primary experimental section and workspace areas to collect data.

3.1.2. CO2 and PM2.5 Concentrations

CO2 levels (ppm) recorded using the MAPSV6 air box placed on the centrally located storage unit are plotted with time on the x-axis and concentration on the y-axis, as illustrated in Figure 7. The graph indicates that CO2 levels ranged from over 600 ppm to a peak of 800 ppm between morning and midday—levels potentially associated with discomfort and dizziness. A comparison of conditions shows that activation of the ERV reduced concentrations below the 600 ppm threshold approximately 100 min in advance of the ventilation-off scenario. Moreover, turning on the ERV ultimately led to reducing the CO2 concentration in the environment to 420 ppm.
Figure 8 illustrates the PM2.5 concentration profile, revealing a substantial decline under active ventilation. Levels dropped from a maximum of 15.0 μg/m3 to 6.2 μg/m3, corresponding to a 58.6% reduction. When the ventilation was inactive, PM2.5 concentrations stayed elevated, ranging from 14 to 16 μg/m3.
Results indicate that ERV operation effectively reduces CO2 and PM2.5 concentrations.

3.2. Results with Both ERV and UV

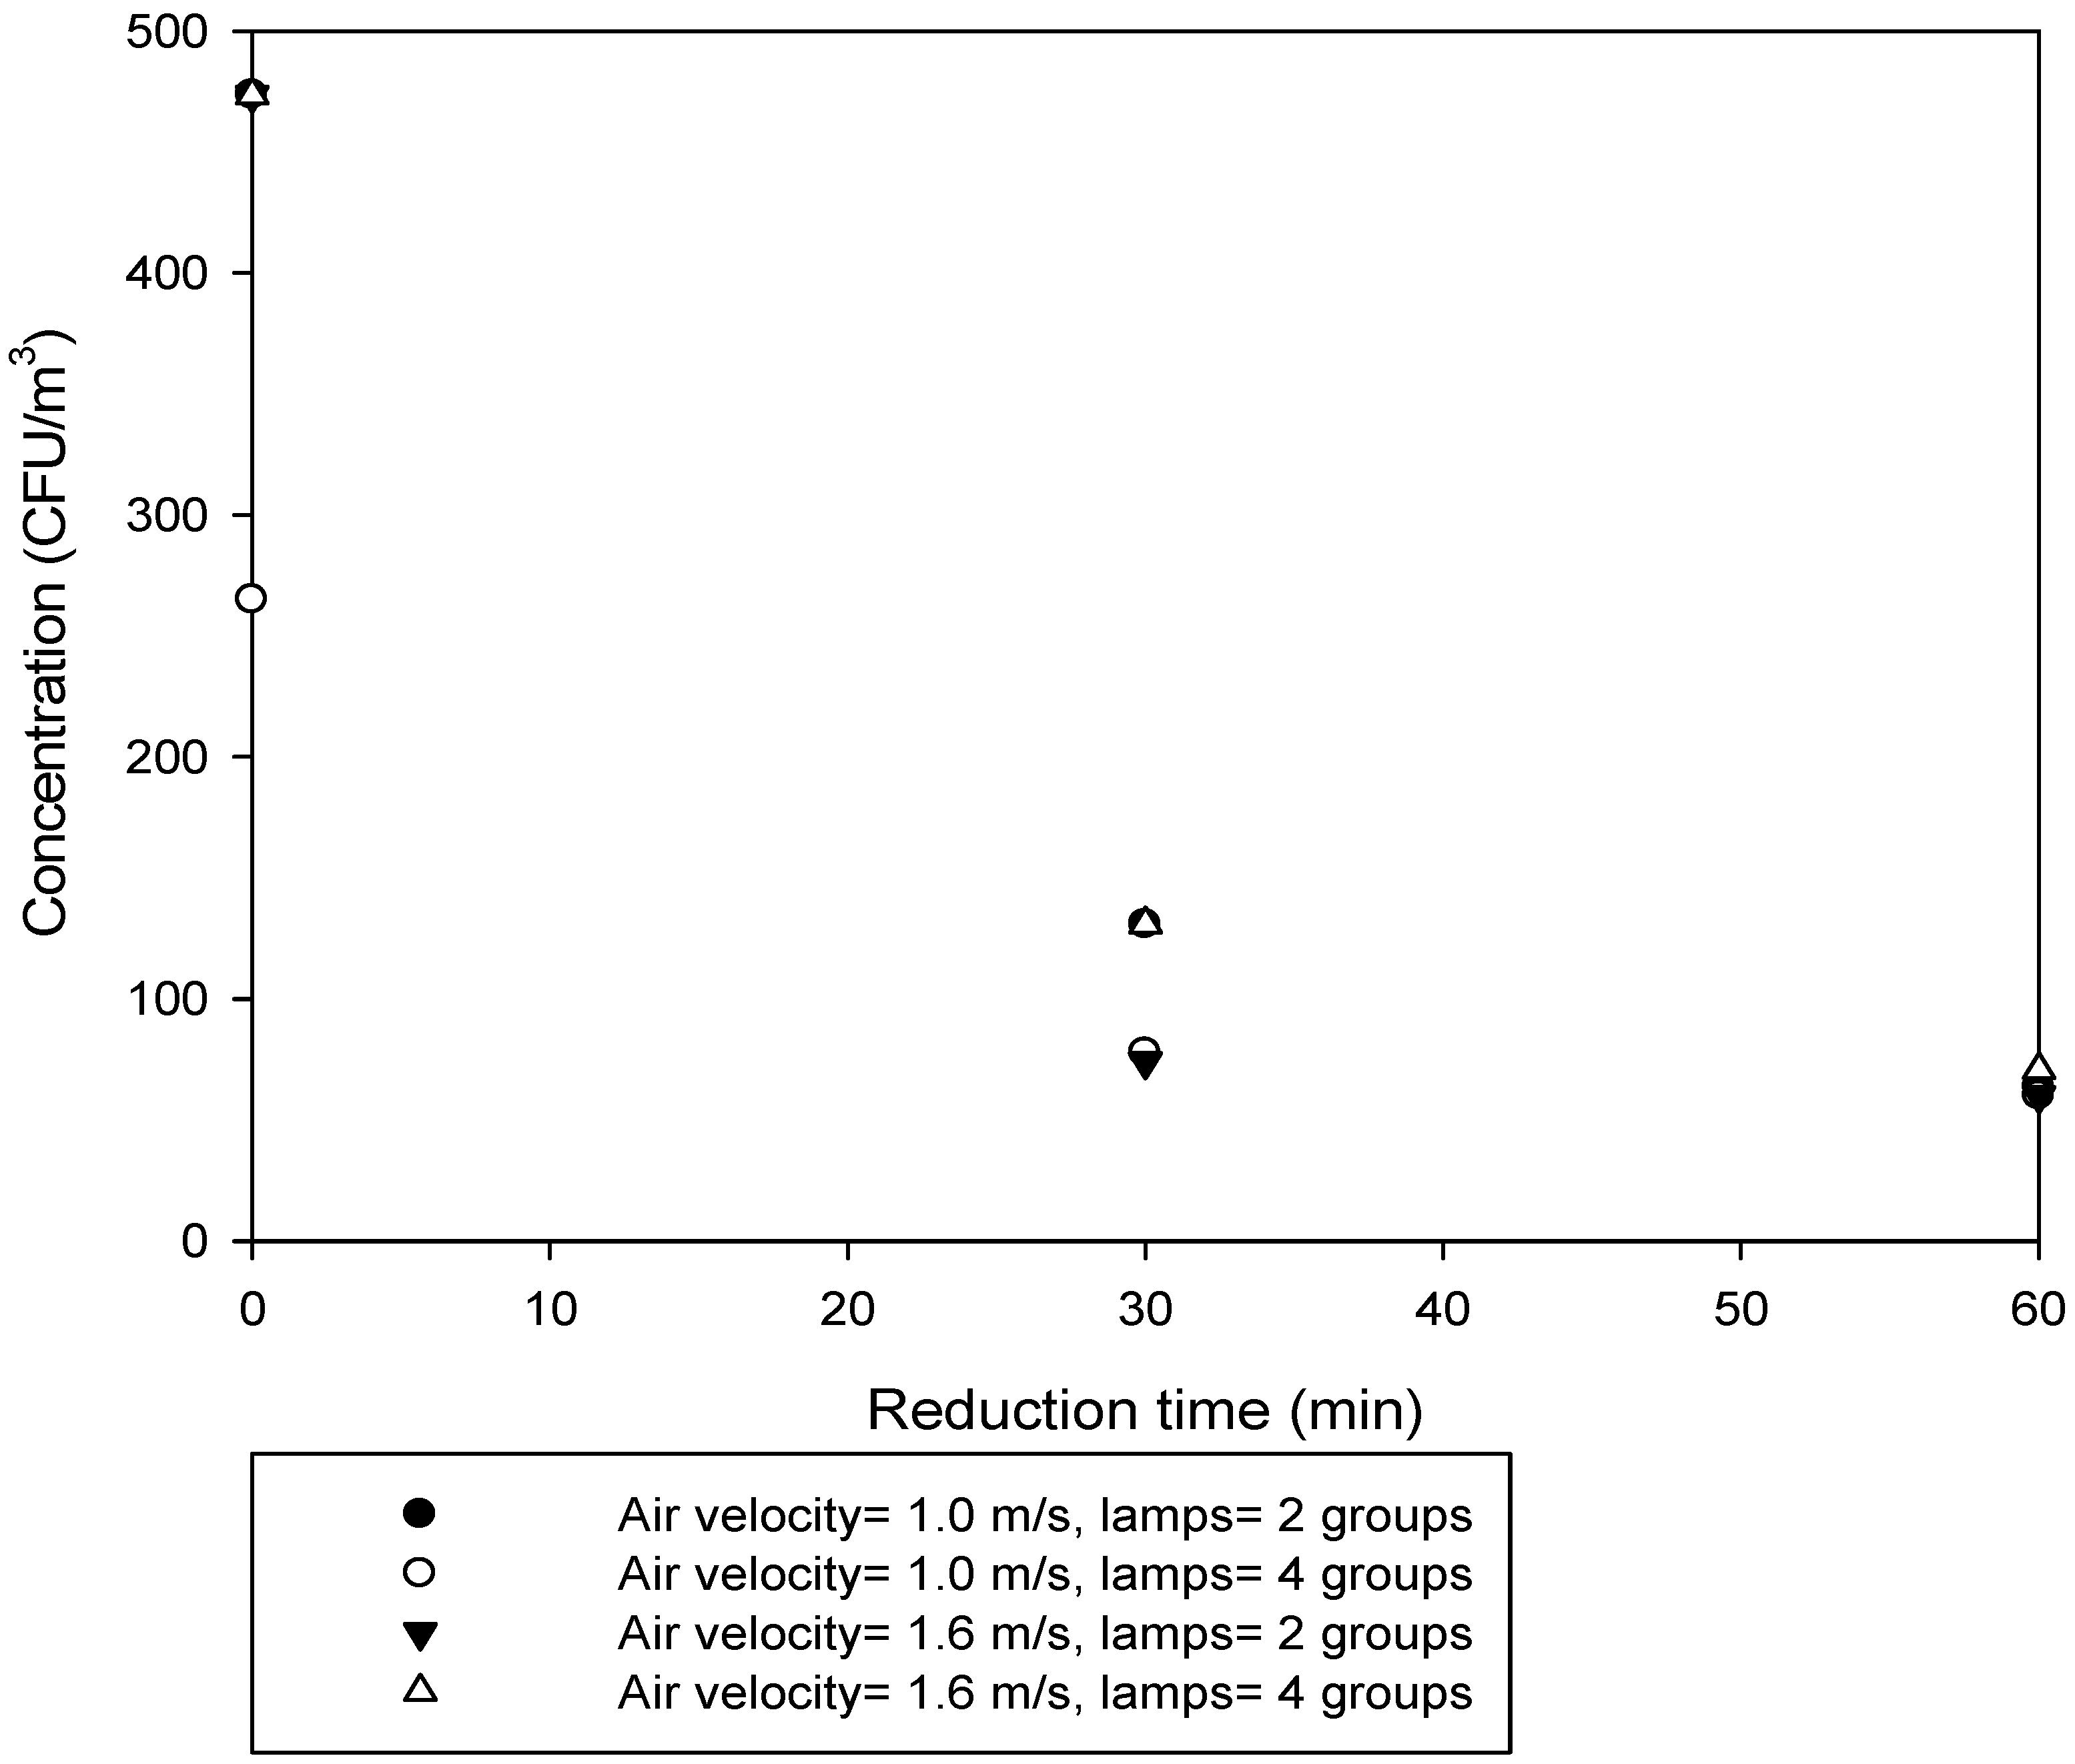
The CFU Reduction Performance

Under the configurations of two groups of UV lamps and four groups of UV lamps, the bacterial concentrations obtained after sampling at low, medium, and high fan speeds are summarized in Table 2. In one instance, under the four groups of UV lamp configuration with high fan speed, an anomaly was observed where the average CFU at the FCU outlet during background sampling was unusually low. This anomaly may have been influenced by environmental factors or experimental conditions, contributing to a reduced reduction rate for that scenario.
Using the results from Table 2, the reduction rates were calculated by subtracting the reduced bacterial concentration from the background bacterial concentration and then dividing by the background bacterial concentration. The results are shown in Table 3.
For ease of subsequent discussion, the reduction rate comparison of low, medium, and high fan velocities at the FCU outlet is organized in Table 4, and the CADR and CSS values calculated using the K-M model are compiled in Table 5.

4. Discussion

In this study, significant challenges in sampling and testing methods were encountered, particularly due to airflow interference in the experimental and office areas during sampling. Before the studies of the UV air-cleaning device, sampling was conducted to ensure the bacterial concentration in the environment returned to baseline levels as close as possible. However, some variations still existed.
Colony counts obtained after cultivation were manually interpreted, introducing potential variability and highlighting the need for automated counting systems to improve accuracy and reproducibility. In Figure 9, the bacterial concentration after 60 min converges to a range of 60.1–70.7%, suggesting a potential measurement limit at this position. This limit underscores the challenges of achieving precise measurements in dynamic environments and highlights areas for improvement in future studies, such as implementing real-time monitoring systems or refining experimental conditions.
The reduction rates ranged from a maximum of 90.8% to a minimum of 70.7%, demonstrating that the system possesses measurable reduction effectiveness at the FCU outlet. Moreover, the equipment was designed with inspiration from the upper-level UV system concept, placing the UV lamps inside a sealed chamber. As a result, it can be used at any time without concerns about human safety. By simply extending the reduction time, the same level of effectiveness can be achieved.
In the comparison of the number of UV lamp groups, there was no significant improvement in the reduction rate between the two groups (6 lamps) and four groups (12 lamps) configurations. Moreover, based on CFU counts sampled at the air outlet, regardless of low, medium, or high-speed settings, the CFU values showed lower and similar levels, suggesting that the reduction effectiveness of both configurations is comparable.
Regarding the comparison of different inlet air velocities, it can be observed that the low-speed setting did not yield higher reduction rates due to longer retention times. However, prolonging the reduction time improved the reduction rate, as shown in Table 4.

Application of K-M Model

Table 5 mentions the observation of the results when using the UV air-cleaning device alone and the ERV alone. Based on the clean air delivery rate, the UV air-cleaning device provides better results than the ERV, which provides 2.3 times of air change. Even for the mildest test group (condition index 1), the CADR for ERV alone is very close, meaning that the proposed UV air-cleaning device can be a substitute if the urban outdoor air is too polluted.
However, when considering the CSS, the best effectiveness is achieved by simultaneously activating both the ERV and the UV unit. Excluding the data from the high fan speed condition at the air outlet under the four-group UV lamp configuration, the worst performance is observed when using only the ERV. It is evident that the UV unit alone outperforms the ERV when used separately.
As predicted from the K-M model listed in Table 6, using the ERV only takes 25.3 to 49.6 min to reach 90% reduction, while the other configurations with UV lamps (ERV + UV) can achieve the D90 in as fast as 7.1 min at the FCU outlet. The D90 values calculated from the data measured at the FCU outlet are relatively unaffected by the surrounding flow conditions, resulting in shorter reduction times and showing better performance.

5. Conclusions

This study investigated the effectiveness of installing a UV air-cleaning device at the outlet of an existing air-conditioning system in a university laboratory. The evaluation involved measuring the CFU of airborne microorganisms before and after the implementation of the UV device. The results indicated a substantial reduction in CFU, confirming the device’s capability to enhance IAQ. Reduction rates at the FCU outlet ranged between 70.7% and 90.8%. Notably, no significant improvement was observed in reduction efficiency when comparing the two-lamp configuration (6 lamps) with the four-lamp configuration (12 lamps).
Additionally, a model from the literature was employed to calculate the time required to achieve a 90% reduction in pollutant concentration, providing a quantitative assessment of the device’s performance. Using the ERV alone required 25.3 to 49.6 min to achieve a 90% reduction, whereas configurations with UV lamps reduced this time to as little as 7.1 min.
These findings highlight the effectiveness and efficiency of UV air-cleaning devices and provide practical recommendations for their optimal use. The UV air-cleaning device is able to provide fresh air similar to opening windows. This study offers valuable insights for the future design and implementation of air purification systems in similar environments, emphasizing the potential for significant IAQ improvements in shared indoor spaces for most urban areas.

Author Contributions

Conceptualization, L.-H.H. and C.-K.H.; methodology, H.-Y.C.; software, H.-J.C.; validation, H.-Y.C., L.-H.H. and H.-J.C.; formal analysis, H.-Y.C.; investigation, L.-H.H.; resources, C.-K.H.; data curation, H.-Y.C.; writing—original draft preparation, H.-Y.C.; writing—review and editing, C.-K.H.; visualization, H.-J.C.; supervision, C.-K.H.; project administration, C.-K.H. All authors have read and agreed to the published version of the manuscript.

Funding

This research received no external funding.

Data Availability Statement

The raw data supporting the conclusions of this article will be made available by the authors on request.

Conflicts of Interest

The authors declare no conflicts of interest.

References

  1. Petrović, N.; Kocić, Ð. IoT for COVID-19 Indoor Spread Prevention: Cough Detection, Air Quality Control and Contact Tracing. In Proceedings of the 2021 IEEE 32nd International Conference on Microelectronics (MIEL), Nis, Serbia, 12–14 September 2021; pp. 297–300. [Google Scholar]
  2. Sung, W.-T.; Hsiao, S.-J. Building an indoor air quality monitoring system based on the architecture of the Internet of Things. EURASIP J. Wirel. Commun. Netw. 2021, 2021, 153. [Google Scholar] [CrossRef]
  3. Hudson, J.; Sharma, M.; Vimalanathan, S. Development of a Practical Method for Using Ozone Gas as a Virus Decontaminating Agent. Ozone Sci. Eng. 2009, 31, 216–223. [Google Scholar] [CrossRef]
  4. ANSI/ASHARE Standard 62.1; Ventilation and Acceptable Indoor Air Quality. ASHRAE: Washington, DC, USA, 2022; ISSN 1041-2336.
  5. Casini, B.; Tuvo, B.; Cristina, M.L.; Spagnolo, A.M.; Totaro, M.; Baggiani, A.; Privitera, G.P. Evaluation of an Ultraviolet C (UVC) Light-Emitting Device for Disinfection of High Touch Surfaces in Hospital Critical Areas. Int. J. Environ. Res. Public Health 2019, 16, 3572. [Google Scholar] [CrossRef] [PubMed]
  6. Kim, S.-H.; Chang, S.Y.; Sung, M.; Park, J.H.; Kim, H.B.; Lee, H.; Choi, J.-P.; Choi, W.S.; Min, J.-Y. Extensive Viable Middle East Respiratory Syndrome (MERS) Coronavirus Contamination in Air and Surrounding Environment in MERS Isolation Wards. Clin. Infect. Dis. 2016, 63, 363–369. [Google Scholar] [CrossRef] [PubMed]
  7. Shen, J.; Kong, M.; Dong, B.; Birnkrant, M.J.; Zhang, J. A systematic approach to estimating the effectiveness of multi-scale IAQ strategies for reducing the risk of airborne infection of SARS-CoV-2. Build. Environ. 2021, 200, 107926. [Google Scholar] [CrossRef] [PubMed]
  8. Nardell, E.A. Air Disinfection for Airborne Infection Control with a Focus on COVID-19: Why Germicidal UV is Essential†. Photochem. Photobiol. 2021, 97, 493–497. [Google Scholar] [CrossRef] [PubMed]
  9. Gardner, A.; Ghosh, S.; Dunowska, M.; Brightwell, G. Virucidal Efficacy of Blue LED and Far-UVC Light Disinfection against Feline Infectious Peritonitis Virus as a Model for SARS-CoV-2. Viruses 2021, 13, 1436. [Google Scholar] [CrossRef] [PubMed]
  10. Heilingloh, C.S.; Aufderhorst, U.W.; Schipper, L.; Dittmer, U.; Witzke, O.; Yang, D.; Zheng, X.; Sutter, K.; Trilling, M.; Alt, M.; et al. Susceptibility of SARS-CoV-2 to UV irradiation. Am. J. Infect. Control 2020, 48, 1273–1275. [Google Scholar] [CrossRef] [PubMed]
  11. Liang, J.-J.; Liao, C.-C.; Chang, C.-S.; Lee, C.-Y.; Chen, S.-Y.; Huang, S.-B.; Yeh, Y.-F.; Singh, K.J.; Kuo, H.-C.; Lin, Y.-L.; et al. The Effectiveness of Far-Ultraviolet (UVC) Light Prototype Devices with Different Wavelengths on Disinfecting SARS-CoV-2. Appl. Sci. 2021, 11, 10661. [Google Scholar] [CrossRef]
  12. Memarzadeh, F.; Xu, W. Role of air changes per hour (ACH) in possible transmission of airborne infections. Build. Simul. 2012, 5, 15–28. [Google Scholar] [CrossRef] [PubMed]
  13. Lelieveld, J.; Helleis, F.; Borrmann, S.; Cheng, Y.; Drewnick, F.; Haug, G.; Klimach, T.; Sciare, J.; Su, H.; Pöschl, U. Model Calculations of Aerosol Transmission and Infection Risk of COVID-19 in Indoor Environments. Int. J. Environ. Res. Public Health 2020, 17, 8114. [Google Scholar] [CrossRef] [PubMed]
  14. Buchan, A.G.; Yang, L.; Atkinson, K.D. Predicting airborne coronavirus inactivation by far-UVC in populated rooms using a high-fidelity coupled radiation-CFD model. Sci. Rep. 2020, 10, 19659. [Google Scholar] [CrossRef] [PubMed]
  15. Ciugudeanu, C.; Beu, D.; Buzdugan, M. SteriLightVent—Hybrid UV Lighting Decontamination Device. In Proceedings of the 2021 International Conference on Applied and Theoretical Electricity (ICATE), Craiova, Romania, 27–29 May 2021; pp. 1–5. [Google Scholar]
  16. Trivellin, N.; Buffolo, M.; Onelia, F.; Pizzolato, A.; Barbato, M.; Orlandi, V.T.; Del Vecchio, C.; Dughiero, F.; Zanoni, E.; Meneghesso, G.; et al. Inactivating SARS-CoV-2 Using 275 nm UV-C LEDs through a Spherical Irradiation Box: Design, Characterization and Validation. Materials 2021, 14, 2315. [Google Scholar] [CrossRef] [PubMed]
  17. Jensen, P.A. Critical Design Parameters in Design and Efficacy of Upper-Room UVC254 Luminaire Systems: Part I: Overview of Major Parameters and Relationships. Photochem. Photobiol. 2021, 97, 532–541. [Google Scholar] [CrossRef] [PubMed]
  18. Kahn, K.; Mariita, R.M. Quantifying the Impact of Ultraviolet Subtype C in Reducing Airborne Pathogen Transmission and Improving Energy Efficiency in Healthy Buildings: A Kahn–Mariita Equivalent Ventilation Model. Front. Built Environ. 2021, 7, 121. [Google Scholar] [CrossRef]
  19. MAPSV6-User Manual. Available online: https://maps6-user-guide.gitbook.io/maps6-manual-book-en (accessed on 23 December 2024).
  20. Hsu, L.-H. The Application of Flow Field Simulation and the Detachable Germicidal Air Unit to the Improvement of Indoor Air Quality. Master’s Thesis, National Taiwan University, Taipei, Taiwan, 2023; pp. 1–88. [Google Scholar]
  21. EN HOME Sankyo-Denki. Available online: https://www.sankyo-denki.co.jp/en-uv-c-lamps (accessed on 23 December 2024).
Figure 1. The experimental area comprises three zones arranged from left to right in the image: the primary experimental section (PE), a centrally located storage unit (CS), and a workspace area (WA). The room is equipped with an energy recovery ventilator and two fan coil units (FCUs) mounted near the ceiling.
Buildings 15 01893 g001
Figure 2. Photo of ERV tested.
Buildings 15 01893 g002
Figure 3. Air box for indoor air quality monitoring used.
Buildings 15 01893 g003
Figure 4. A single-stage viable impactor sampling system.
Buildings 15 01893 g004
Figure 5. The airborne bacterial colony counts before reduction (left) and after reduction in microbial concentrations (right).
Buildings 15 01893 g005
Figure 6. The design of UV air-cleaning device (the yellow arrows indicate the position where the ultraviolet lamps are installed).
Buildings 15 01893 g006
Figure 7. Temporal CO2 levels under active and inactive ventilation conditions.
Buildings 15 01893 g007
Figure 8. Temporal PM2.5 levels under active and inactive ventilation conditions.
Buildings 15 01893 g008
Figure 9. Reduction in microbial concentrations with both ERV and UV (FCU).
Buildings 15 01893 g009
Table 1. Testing groups to verify the effectiveness of the UV air-cleaning device.
Condition index123456789101112
Fan air speedLLLLMMMMHHHH
Group index224422442244
Reduction time306030603060306030603060
L: fan coil unit air velocity 1.0 m/s, M: fan coil unit air velocity 1.6 m/s, H: fan coil unit air velocity 2.2 m/s; 2: 2 groups (6 UV lamps), 4: 4 groups (12 UV lamps), 30: 30 min, and 60: 60 min.
Table 2. Bacterial concentration under 2 and 4 group UV lamps.
Two-Group UV LampsFour-Group UV Lamps
LocationFan Coil Air Velocity
(m/s)
Background Value
Concentration
(CFU/m3)
30 min
Concentration
(CFU/m3)
60 min
Concentration
(CFU/m3)
Background Value
Concentration
(CFU/m3)
30 min
Concentration
(CFU/m3)
60 min
Concentration
(CFU/m3)
FCU1.0473.5130.863.626577.860.1
1.6473.574.260.1473.5130.770.7
2.2346.356.631.988.474.267.2
experimental area1.0381.799.053.0540.799.053.0
1.6466.5176.7141.4466.5236.8159.0
2.2416.9250.9127.2328.6144.9120.1
office area1.0402.988.338.9378.288.356.6
1.6607.8222.6229.7607.8215.6148.4
2.2445.2176.6162.6282.795.477.7
Table 3. Reduction rates under 2 and 4 group UV lamps.
Two-Group UV LampsFour-Group UV Lamps
LocationFan Coil Air Velocity
(m/s)
30 min CFU Reduction Rates
(%)
60 min CFU Reduction Rates
(%)
30 min CFU Reduction Rates
(%)
60 min CFU Reduction Rates
(%)
FCU1.072.486.670.777.3
1.684.387.372.485.1
2.283.790.816.024.0
experimental area1.074.186.181.790.2
1.662.169.749.265.9
2.239.869.555.963.5
office area1.078.190.476.785.1
1.663.462.264.575.6
2.260.363.566.372.5
Table 4. The reduction rate comparison of low–medium–high fan velocity at the FCU outlet.
Reduction Rate
Group IndexReduction TimeLMH
23072.4% 84.3% 83.7%
26086.6%87.3% 90.8%
43070.7% 72.4% 16.0%
46077.3% 85.1% 24.0%
L: Fan coil unit air velocity 1.0 m/s. M: Fan coil unit air velocity 1.6 m/s. H: Fan coil unit air velocity 2.2 m/s.
Table 5. The performance of the CADR and CSS at the FCU outlet.
Condition IndexCADRERV (CFM)CADRUV (CFM)CADRERV+UV (CFM)
1294.3298.2592.5
2294.3356.7651.0
3294.3291.1585.4
4294.3318.6612.9
5294.3556.0850.3
6294.3575.6869.9
7294.3477.2771.5
8294.3560.8855.1
9294.3758.41052.7
10294.3823.01117.3
11294.3145.2439.5
12294.3217.5511.8
Condition IndexCSSERV (CFU/m3)CSSUV (CFU/m3)CSSERV+UV (CFU/m3)
169.868.934.7
269.857.6316
339.0839.519.7
439.0836.118.8
569.837.924.2
669.835.723.6
769.843.126.6
869.836.624.0
951.119.814.3
1051.118.313.4
1113.026.48.7
1213.017.67.5
Table 6. The time of decreasing 90% reduction rate at the FCU outlet.
Condition IndexD90 (min)
ERV only25.3–49.6
1 22.3
219.1
322.7
421.1
512.0
611.5
714.3
811.9
98.0
107.1
1135.6
1228.1
Disclaimer/Publisher’s Note: The statements, opinions and data contained in all publications are solely those of the individual author(s) and contributor(s) and not of MDPI and/or the editor(s). MDPI and/or the editor(s) disclaim responsibility for any injury to people or property resulting from any ideas, methods, instructions or products referred to in the content.

