Article

Research on Mechanical Properties of Steel Tube Concrete Columns Reinforced with Steel–Basalt Hybrid Fibers Based on Experiment and Machine Learning

1
College of Urban and Rural Construction, Hebei Agricultural University, Baoding 071001, China
2
Key Laboratory of Structural Safety and Low-Carbon Construction of Rural Buildings of Hebei Province, Baoding 071001, China
*
Author to whom correspondence should be addressed.
Buildings 2025, 15(11), 1859; https://doi.org/10.3390/buildings15111859
Submission received: 12 May 2025 / Revised: 24 May 2025 / Accepted: 26 May 2025 / Published: 28 May 2025
(This article belongs to the Section Building Structures)

Abstract

In this paper, a new type of combined column, square steel tube hybrid steel–basalt fiber reinforced concrete column (BSFCFST), is proposed for the first time, and a new hybrid machine learning model, NRBO-XGBoost, is proposed to predict the axial compressive load capacity of BSFCFST. Eleven specimens were designed and fabricated to investigate the axial mechanical properties of BSFCFST. The variables considered include basalt fiber volume content, steel fiber volume content, steel tube wall thickness and specimen length to slenderness ratio. The characteristics of damage modes, load-displacement curves and load-strain curves of the new combined columns were mainly investigated. The results showed that the hybrid fibers improved the ultimate load carrying capacity of the specimen, and the improvement of the ductility was obvious. On the basis of the experiments, a parametric expansion analysis of several structural parameters of the specimen was carried out by using ABAQUS finite element software, and a combined model NRBO-XGBoost, based on the Newton-Raphson optimization algorithm (NRBO), and the advanced machine learning model XGBoost was proposed for the prediction of the BSFCFST’s ultimate carrying capacity. The combined model NRBO-XGBoost was evaluated by comparing it with several prediction methods. The results show that the prediction accuracy of the NRBO-XGBoost model is significantly higher than that of other prediction methods, with R2 = 0.988, which is a good alternative to existing empirical models.

1. Introduction

The steel tube concrete structure has the advantages of high bearing capacity, good plasticity and toughness, excellent seismic performance, easy construction, etc., and plays an increasingly important role in the field of modern structural engineering [1]. These excellent mechanical properties of steel tube concrete come from the synergistic effect between steel tube and concrete, i.e., under the restraining effect of the steel tube, the core concrete is in a three-way compression state, which greatly improves the bearing capacity of the concrete, and the existence of the core concrete restricts the inward localized buckling of the steel tube [2,3]. The performance of both materials is greatly enhanced by their synergistic action.
Although steel tube concrete has many advantages, it is worth noting that the development of microcracks in the core concrete can seriously reduce the load carrying capacity and ductility of steel tube concrete columns during the work process of the members [4], and this property becomes more obvious the higher the strength of the concrete. Increasing the wall thickness of the steel tube is considered to be one of the better ways to solve this problem, but increasing the wall thickness of the steel tube will inevitably lead to the elevation of the steel used in the members, which will increase the cost of the project [5], and is not an economical solution.
Many studies have shown that the addition of fiber materials to concrete can enhance the ductility and crack resistance of concrete, and the presence of fiber materials can prevent or delay the generation and development of microcracks within concrete [6]. Common fiber materials can be classified as metal fibers, natural fibers and synthetic fibers [7]. In recent years steel tube concrete reinforced with steel fibers and steel tube basalt fiber reinforced concrete has received extensive attention from scholars in various countries. Steel fibers have high fatigue resistance, tensile strength, and flexural ultimate strength [8,9,10]. Lu, Z et al. found that steel fibers can significantly improve the deformation properties of steel tube concrete and are economical [5]. Basalt fiber is basalt stone crushed by a series of processes such as high-temperature melting and made of natural fibers, known as the 21st century new environmentally friendly fibers [11,12,13]. Yan et al. found that basalt fibers have the advantages of good crack resistance, high temperature resistance, good mechanical and physical properties, green environmental protection, etc., and a positive impact on the improvement of the ultimate bearing capacity of steel tube concrete [14].
With the increasing research on fiber reinforced concrete, many scholars have found that the incorporation of only one type of fiber only enhances or strengthens the one-sided properties of concrete [15], and in order to obtain a more comprehensive performance enhancement, researchers have begun to investigate fiber concrete blended with two or more types of fibers to make up for the deficiencies of the single fiber blends [16]. Ethan Chia et al. [17] investigated the mechanical properties of basalt-recycled poly-propylene (PP) fiber blends reinforced concrete at different volume fractions and demonstrated its effectiveness as a sustainable solution for enhancing the performance of concrete. PP fiber blend reinforced concrete at different volume fractions demonstrating the effectiveness of using basalt-recycled polypropylene fiber reinforcement and highlighting its potential as a sustainable solution for enhancing the performance of concrete [17]. Lu et al. investigated the effect of steel-polypropylene fiber blend on the axial compressive properties of steel tube concrete (CFST) columns, and found that the blend had a significant effect on the hybrid fiber and little effect on the failure mode and ultimate load capacity, but delayed the failure process and improved the energy dissipation capacity [18]. Although hybrid fiber-reinforced steel tube concrete columns have more superior mechanical properties, it is worth noting that the mechanism of various material interactions in steel tube hybrid fiber-reinforced concrete columns is very complex, and traditional empirical formulas are often unable to accurately predict their ultimate bearing capacity [19]. Finite element (FE) simulation has been considered as an effective method to solve this problem [20], but the development of a benchmark FE model is extremely cumbersome and requires high computational power, which makes it difficult to be applied in engineering practice and is not an efficient solution [21].
The use of machine learning models for predicting the load carrying capacity of complex members has become a common approach [22,23,24]. Celal Cakiroglu et al. [25] utilized seven gradient boosting-based machine learning methods to predict the axial compressive load carrying capacity of steel tube concrete columns with good results. Kunting Miao et al. [26] utilized three machine learning algorithms to predict the ultimate strength of a circular concrete Filled Fiber Reinforced Polymer (FRP)-Steel Composite Tube (CFSCT) columns and found that some of the algorithms outperformed the canonical formulas. Chen Wang et al. [27] established a prediction model for the ultimate load capacity of steel tube concrete under eccentric loads using algorithms such as support vector regression and the model predicted the load capacity with good performance. Machine learning modeling can break through the limitations of traditional methods by integrating a large amount of experimental and finite element data to construct a nonlinear mapping relationship between input parameters and bearing capacity [28,29,30,31]. However, it is worth noting that the hyperparameters of the machine learning algorithm have a great impact on the model performance [32], and most of the above studies adopt a simpler hyperparameter search method, which is not fine enough for model optimization.
Meta-heuristic algorithms are a class of efficient global optimization methods. Chubing Deng et al. [33] used particle swarm algorithm (PSO) to optimize the grouped data processing model (GMDH) in their study of predicting the axial compressive ultimate strength of rectangular steel tube concrete columns, which significantly improved the accuracy of the prediction. Thuy-Anh Nguyen et al. [34] optimized the gradient boosting regression using three meta-heuristics model to predict the axial compressive capacity of double-layered steel tube concrete (CFDST) columns, and the performance of the optimized model was significantly improved. Abidhan Bardhan et al. [35] optimized an artificial neural network model (ANN) using the algorithm of Gray Wolf Optimization (AGWO) to predict the axial compressive capacity of steel tube concrete columns with good results. When dealing with complex nonlinear problems, the meta-heuristic algorithm can transform the constrained optimization problem into an unconstrained optimization problem by introducing penalty functions, constraint handling mechanisms, etc., so as to find the optimal solution under the premise of satisfying the constraints [36]. During the training process, the meta-heuristic algorithm can dynamically adjust the hyperparameters according to the performance of the model to improve the convergence speed and prediction accuracy of the model, which is a good complement to the existing machine learning methods [37].
Synthesizing the above, it can be seen that the research of this paper is motivated by the problems existing in the engineering application of the following steel tube concrete structures: (1) Performance defects of traditional steel tube concrete. Although steel tube concrete structure has the advantages of high load carrying capacity and excellent seismic performance, its core concrete is prone to micro-cracks during the stressing process, which significantly reduces the ductility and load carrying capacity of the members. Existing solutions (such as increasing the wall thickness of steel pipes) can alleviate the problem, but significantly increase the amount of steel, the economy is poor. (2) Limitations of single fiber reinforcement. It has been shown that a single fiber (e.g., steel fiber or basalt fiber) can only unidirectionally improve the performance of concrete, and cannot achieve comprehensive performance enhancement. Steel–basalt hybrid fibers may break through this bottleneck through synergistic effects, but the mechanism of reinforcing steel tube concrete columns has not yet been studied. (3) Difficulties in the prediction of complex mechanical behavior. The multi-phase coupling mechanism of hybrid fibers and steel tube-concrete is complex, and the traditional empirical formulas are difficult to accurately predict their ultimate bearing capacity, while finite element modeling relies on high computational resources, which makes it difficult to meet the needs of rapid engineering design.
The objective of this research is to propose a new solution to the common problems existing in the current steel tube concrete engineering applications: (1) Design square steel tube steel–basalt hybrid fiber concrete columns (BSFCFST) to inhibit concrete cracking and improve the load carrying capacity and ductility of steel tube concrete through the fiber mixing effect. (2) Reveal the hybrid fiber reinforcement mechanism. Through axial compression test, quantify the synergistic effect of rigid reinforcement of steel fibers and flexible toughening of basalt fibers, and clarify the influence of fiber mixing amount, wall thickness of steel pipe, length-to-fineness ratio and other parameters on the mechanical properties. (3) Construct an efficient prediction model. Develop a machine learning model based on NRBO-optimized XGBoost to break through the accuracy and efficiency limitations of traditional methods and provide a reliable bearing capacity prediction tool for the engineering application of BSFCFST.

2. Methodology

The flowchart of the research methodology is shown in Figure 1. In this paper, the mechanical properties of square steel tube hybrid steel–basalt fiber reinforced concrete columns (BSFCFST) were investigated. Firstly, axial compression tests were carried out on 10 BSFCFSTs with different parameters and one ordinary steel tube concrete column to analyze the damage modes, load-displacement curves and the characteristics of load-strain curves of BSFCFST. Subsequently, the finite element model was established by using ABAQUS 2024 finite element software, parametric extension analysis was carried out, and the mixing effect coefficients were introduced to quantitatively analyze the mixing effect of the relevant strength and ductility coefficients. The ultimate load carrying capacity of BSFCFST was predicted by the proposed novel NRBO-XGBoost model, and the computational accuracy of NRBO-XGBoost was evaluated by comparing it with five classical machine learning models (BPNN, SVM, RF, Adaboost, and XGBoost) and the existing canonical formulations in the three national codes.

2.1. Specimens Design

The specimens in this study were designed according to the requirements outlined in the current “Chinese specification GB 50936” [38]. In order to meet the test requirements, the base concrete strength and square steel tube size of all specimens were set to C40 and 100 mm, respectively. In order to make the test more objective, a total of 11 steel tube concrete specimens, including 10 square steel tube hybrid fiber concrete columns and 1 square steel tube plain concrete column, were designed for axial compression test.

2.2. Material Properties

2.2.1. Square Steel Tube

The square steel tube used in this test is a Q235 seamless welded steel tubes, and the standard tensile test is conducted according to the “Chinese specification GB/T 228.1” [39]. The detailed parameters of the specimen are shown in Table 1, where fy and fu are the yield strength and ultimate strength of the square steel tube, respectively; ΔL/L denotes the elongation, ES denotes the elastic modulus, and μ denotes the Poisson’s ratio.

2.2.2. Fiber Material

The steel fibers were made of microfilament copperplated steel fibers produced by Tangshan Yian Metal Products Co., Ltd. (Tangshan, China); the basalt fibers were made of short-cut basalt fibers produced by Haining Anjie Composites Co. The specific parameters are shown in Table 2, where df denotes fiber diameter, lf denotes fiber length, ρ denotes fiber density, and ft denotes fiber tensile strength. The actual picture of the fiber material is shown in Figure 2.

2.2.3. Aggregate Gradation and Physical Properties

The fine aggregate used in this paper adopts medium sand, and the coarse aggregate adopts crushed stone with a grain size of 5–30 mm, which contains less than 1% of mud after cleaning, and both of them meet the provisions of the building code. According to the “Chinese specification GB/T 14685-2022” [40] and “JGJ 52-2006” [41] on the physical properties of course and fine aggregates were measured, the specific data are shown in Table 3. Grading curves are shown in Figure 3, which shows that the gradation of aggregates used in this test is continuous, and the actual effect is good.

2.2.4. Concrete Mix

Five concrete ratios were designed for this test, including one baseline plain concrete and four mixed fiber-reinforced concretes. The design of the fiber-reinforced concrete ratios was consistent with that of the baseline concrete except for the amount of fiber material and water reducer. Because the fiber material has water absorption, the water reducing agent mass fraction in the various concrete ratios was calculated to be slightly different in order for the concrete to meet the working performance. Fly ash was used as an auxiliary binder to increase the compactness of the concrete, reduce the heat of hydration of the cement, and prevent the concrete from cracking. Polycarboxylic acid, a highly efficient water reducing agent, was used to maintain good fluidity; the specific performance parameters of the water reducing agent are shown in Table 4. The mixing water was ordinary tap water.
The detailed information of the concrete mix is shown in Table 5, where B0.1-S0.6 indicates that the volume content of basalt fiber and steel fiber is 0.1% and 0.6%, respectively, VS and VB represent the volume content of steel fiber and the volume content of basalt fiber, respectively, M stands for the dosage of polycarboxylic acid high-efficiency water reducing agent as a percentage of the mass of cementitious materials (cement and fly ash), and D represents the slump expansion of the concrete mix. The actual concrete preparation is shown in Figure 4.
Three concrete cubic specimens with dimensions of 150 × 150 × 150 mm and three concrete prismatic specimens with dimensions of 150 × 150 × 300 mm were made for each mix of concrete blend. The actual photographs of the compressive test of the fiber mix concrete specimens are shown in Figure 5.

2.3. Sample Preparation

For comparison, the specimen cross-section side lengths B were 100 mm, the axes of the hollow steel tube were geometrically aligned and fully welded to the cover plate with cross-section dimensions of 200 mm × 200 mm × 10 mm, and the top cover plate was left with a hole of 40 mm diameter for pouring. After the inner wall of the mixing container was moistened with water, the raw materials were put into the mixer in the order of stone, sand, fiber material, fly ash and cement and mixed for 5 min. Then, the polycarboxylic acid high-efficiency water reducing agent was dissolved in water proportionally and slowly poured into the mixer for 5 min. The slump of the concrete mix was determined according to the “Chinese specification GB/T50080” [42], and after the slump met the specification requirements, the concrete mix was injected into the steel tube so that it was slightly higher than the top edge of the steel tube. The steel tube concrete specimens and standard concrete specimens were cured in a standard environment for 28 days according to the “Chinese specification GB/T50081” [43]. Finally, gray paint was sprayed on the surface of the specimens and white paint was used to delineate the grid to facilitate the observation of the damage pattern of the specimens after the test.
Specimen details are shown in Table 6, in which L6-t2-B0.1S0.6 indicates that the length of the specimen is 600 mm, the wall thickness of the steel tube is 2 mm, and the volume dosage of basalt fiber and steel fiber is 0.1% and 0.6%, respectively; the specimen parameters of L, B, t represent the length of the steel tube, the length of the outer edge, and the wall thickness, respectively; f c u and f c r are the measured values of the compressive strength of the concrete cube and prism, respectively; f y is the measured value of steel yield strength; λ is the specimen length and slenderness ratio, λ = 2√3L/B; ξ is the hoop coefficient, ξ = As f y /Ac f c r .

2.4. Test Scheme and Instrument

The loading equipment used in this test is the 5000 KN long column testing machine produced by Suzhou Chubang Measurement and Control Technology Co. (Suzhou, China). The test device is shown in Figure 6, the layout of the device is shown in Figure 7, and the cross-section of the specimen is shown in Figure 8. The loading process of the test includes preload and formal loading, the preload is used for eliminating the small gap between the ball hinge and the specimen and for geometric alignment, the formal loading adopts “force + displacement” grading loading system.
The formal loading of the test adopts the “force + displacement” grading loading system. Firstly, load control is adopted, each level of load is taken as 1/15 of the estimated ultimate load, and the holding time is 3 min, after the load is raised to the vicinity of 70% of the ultimate load, then displacement control is adopted, and the loading rate is 0.5mm/min. The test is discontinued when the test load is reduced to the vicinity of 75% of the ultimate load. The test was suspended when the load was lowered to nearly 75% of the ultimate load.

3. Test Results and Discussions

3.1. Experimental Phenomena and Damage Patterns

The damage process of each group of specimens in the test is basically the same, the specific damage mode is shown in Figure 9. At the beginning of the loading in the elastic stage, the axial shortening displacement grows linearly with the increase in the load, and there is no obvious change on the outer surface of the steel tube; when the load increases to 70~80% of the ultimate load to enter into the plastic stage, there are some micro-convexity on the surface of the steel tube, and the location of the convexity is mainly concentrated in the middle and upper part of the test specimen, and the growth of the axial displacement accelerates and no longer grows linearly with the load. The axial displacement increases faster and no longer grows linearly with the load.
Close to the ultimate load, the steel tube bulging deformation occurs in local buckling, which is caused by local concrete crushing; after reaching the limit state, the load decreases, the local deformation of the steel tube continues to intensify, and the buckling part around the column is connected with the circular buckling band; in the case of the load decreasing to the vicinity of 70% of the ultimate load, the buckling part of the steel tube reaches the limit, and the specimen is torn at the corners.
Although the addition of mixed fibers in concrete did not significantly change the damage mode of steel tube concrete columns, the presence of mixed fibers can significantly improve the specimen’s ductile damage ability, so that the decline in axial load is gentler, and it can be clearly seen that the mixed fibers are more significant than the role of a single fiber on the enhancement of the mechanical properties of steel tube concrete columns. According to previous studies, the wall thickness of steel tube and concrete strength are the main factors affecting the damage mode of steel tube concrete columns, compared to the effect of adding fiber materials on the damage mode is small. However, the presence of mixed fibers can greatly delay or prevent the generation and development of microcracks in concrete, effectively transferring loads and, thus, delaying damage.

3.2. Load-Displacement Behavior

The load-displacement curves of each specimen were divided into four groups according to the variation parameters, as shown in Figure 10.
The load-displacement curves of all the specimens can be divided into the following four stages: (1) The initial stage of loading is elastic, and has been loaded until near 70% of the ultimate load, the load-displacement curves of the specimens basically change linearly, and the higher the percentage of the volume of the steel fibers and the thicker the walls of the steel tube in this stage, the greater the initial stiffness of the specimen. This is because of the Poisson’s ratio of the steel tube in the early stage is greater than the Poisson’s ratio of the concrete, the steel tube has no constraint on the concrete, and the two are separately stressed, so the size of the stiffness of the specimen at the beginning of the loading stage is directly proportional to the material strength of the steel tube and concrete. (2) After entering the elastic-plastic stage, the slope of the curve gradually de-creases, the displacement grows faster, and the load grows relatively slowly and gradually approaches the ultimate load. (3) The curve enters a descending section after the peak point, in which the load shows an obvious decreasing trend with the development of deformation. (4) When the load decreases to the vicinity of 75% of the ultimate load, the specimen enters the strengthening section, and the load is slightly increased with the increase in axial displacement.
The effect of basalt fibers on the axial load-displacement behavior of steel tube concrete columns can be seen in Figure 10a. The specimen ultimate loads and corresponding displacements were improved by the addition of basalt fibers, where the ultimate loads were enhanced by 14.3% compared to the steel tube concrete columns. This was attributed to the presence of basalt fibers which impeded the crack development. The difference in the rate of decline between the two groups of specimens in the descending section is not significant, which indicates that the basalt fibers have less effect on the ductility of the steel tube concrete column specimens.
The effect of steel fiber admixture on the axial load-displacement behavior of steel tube concrete columns reinforced with hybrid fibers can be seen in Figure 10b. The steel fibers slightly increase the axial stiffness of steel tube concrete columns, while the ultimate loads of the specimens are further enhanced with the increase in steel fiber content, compared to the normal steel tube concrete columns, the ultimate loads of the specimens with the gradual enhancement of the steel fiber dosage from 0.6% to 1.6% at 0.1% basalt fiber dosage are enhanced by 16.0%, 30.0% and 33.8%, respectively.
The effect of steel tube wall thickness on the axial load-displacement behavior of steel tube hybrid fiber-reinforced concrete columns can be seen in Figure 10c. Increasing the steel tube wall thickness can enhance the axial stiffness of steel tube concrete columns. Meanwhile, the ultimate load is significantly increased with the increase in steel tube wall thickness, and the decreasing section of the curve is gentler with the increase in steel tube wall thickness. This indicates that enhancing the steel tube wall thickness is an effective way to enhance the ultimate load capacity and ductility of steel tube concrete columns, which is the same as the results of previous studies.
The effect of length-to-fineness ratio on the axial load-displacement behavior of steel tube hybrid fiber reinforced concrete columns can be seen in Figure 10d. The slope of the elastic section of the curve decreases with the increase in the length-finesse ratio, this is because the stability and local stresses of the specimen with a larger length-finesse ratio have a greater influence on it. At the same time, the corresponding axial displacement becomes larger when the specimen reaches the ultimate load capacity, and the curve decreases more steeply after the ultimate load capacity is reached for specimens with larger slenderness ratios.

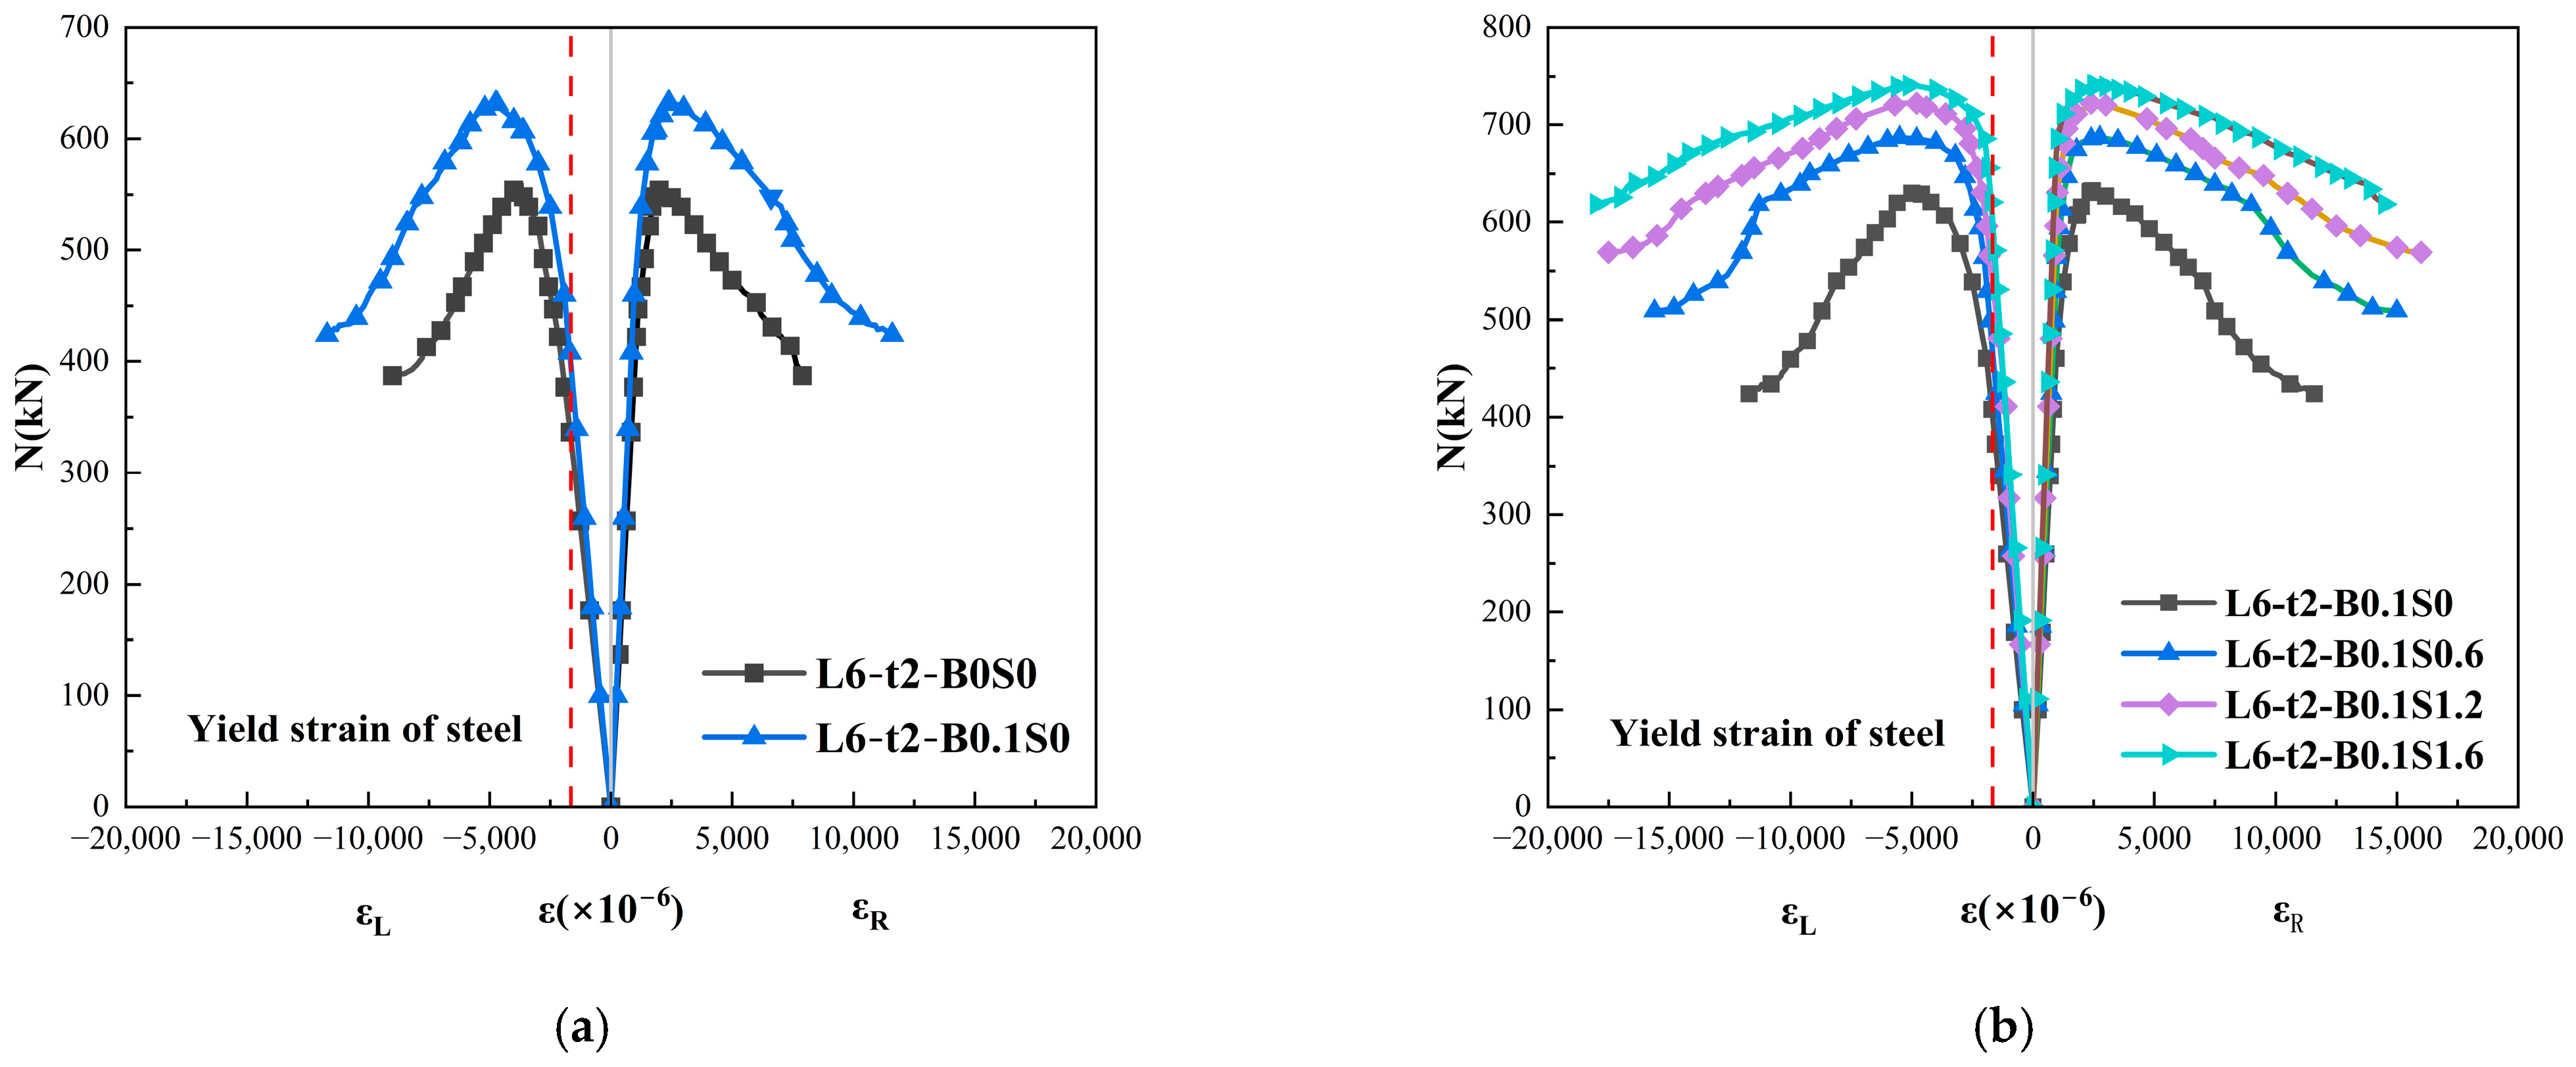
3.3. Load-Strain Curve

Through the strain gauges pasted in the middle cross-section of the specimen, the axial load-strain relationship curve of the specimen steel tube was obtained as shown in Figure 9. In the figure, the negative value represents the longitudinal strain, and the force state is compression; the positive value represents the circumferential strain, and the force state is tension; the horizontal coordinate of the dashed line represents the yield strain of steel.
As can be seen from Figure 11, the curve trend of each specimen is similar, and the shape of the curve is basically flared. At the initial elastic stage, the strain grows slowly and linearly with the load, but the longitudinal strain grows faster than the transverse strain, corresponding to the phenomenon that the longitudinal deformation of the specimen is earlier than the trans-verse deformation. With the continuous growth of load, gradually approaching the yield strength of steel, the specimen enters the elastic-plastic stage, at this time, the curve of the transverse and longitudinal strains shows a nonlinear growth trend, and the strain growth rate is accelerated, corresponding to the phenomenon that some regions of the specimen appeared in the local buckling. When the applied load exceeds the peak load of the specimen, the strain of the specimen increases rapidly, which is caused by the crushing of the local core concrete in the specimen.
In Figure 11a, it can be seen that the admixture of basalt fibers has little effect on the stiffness of the specimen, but the curve of the steel tube basalt concrete columns is obviously prolonged after entering the elastic-plastic stage, and the longitudinal strain corresponding to the peak load increases and the trans-verse strain decreases, which suggests that the basalt fibers act as a tensile bond within the concrete’s core. In Figure 11b, it can be seen that the slope of the elastic section of the curve slightly increases with the increase in steel fiber admixture, indicating that the admixture of steel fibers slightly improves the specimen stiffness. The increase in both longitudinal and transverse strains of the specimen slows down with the increase in steel fiber doping after the peak load, indicating that the hybrid fibers work in concert to limit the deformation of the specimen. In Figure 11c, it can be seen that the initial stiffness of the specimen is significantly enhanced, with the increase in steel content and the longitudinal strain of the specimen increases and the transverse strain decreases. After peak loading, the curve of the specimen with higher steel content is flatter. In Figure 11d, it can be seen that the slope of the curve decreases significantly with the increase in the specimen’s length and slenderness ratio, indicating that the increase in the length and slenderness ratio decreases the initial stiffness of the specimen, and the steeper descending section of the curve of the specimen with higher length and slenderness ratio, indicating that the increase in the length and slender-ness ratio decreases the deformation capacity of the specimen.

3.4. Mechanical Property Evaluation Index

3.4.1. Strength Indicators

To evaluate the combined enhancement effect of the BSFCFST ultimate bearing capacity of the new combined column, the strength factor SI is defined [5].
S I = N u A s f y + A c f c
where A s and A c are the cross-sectional areas of steel tube and core concrete, respectively. f c is the axial compressive strength of concrete, the value of which is calculated according to “Chinese specification GB50010” [44]:
f c = α 1 · α 2 · f c u
where α 1 is the ratio of axial compressive strength to cubic compressive strength and α 2 is the brittleness discount factor of concrete, both of which are obtained by statistical analysis of empirical data. The calculated results are shown in Table 7 and Figure 12, and the SI values are between 1.09~1.29, which indicate that there is a good composite effect between the steel tube and the hybrid fiber concrete.
Figure 12a utilizes some of the literature data as a control group for steel tube concrete columns with steel fibers. It can be seen that the two groups of specimens have similar trends in the change in strength indexes, and, in general, the SI values increase with the increase in the volume of steel fiber admixture, but the strength indexes of the specimens with the same volume content of steel fibers, the BSFCFST are higher than those of the specimens with steel fibers alone, which suggests that the enhancement of the strength of the specimens with the mixing of two types of fibers is better than that with the action of the two types of fibers alone, which is attributed to the fact that the mixing of fibers can improve the core concrete’s shrinkage properties and make the synergistic effect between core concrete and steel tube concrete stronger.
Figure 12b can be seen that with the increase in the wall thickness of the steel tube, the SI value is slightly improved, but the overall view of the change is not large, this is because after the wall thickness of the steel tube is increased to a certain degree, the marginal benefit of the role of the hoop decreases, while the synergistic effect between the steel tube and the concrete may have reached equilibrium, which leads to little change in the strength index.
Figure 12c shows that the SI value decreases significantly with the increase in the specimen length and slenderness ratio, because the low length and slenderness ratio steel tube concrete columns are dominated by the material strength damage, and with the increase in the specimen length and slenderness ratio, the instability damage is more likely to occur, which results in the reduction in the ultimate load carrying capacity, leading to the decrease in the value of the strength index.

3.4.2. Ductility Coefficient

In order to quantify the ductility capacity of the specimen more precisely, the ductility coefficient is used in this paper. Usually, the ductility coefficient is defined as the ratio of the strain at 0.85 N u to the strain at N u , and is calculated as:
D I = ε 85 ε u
where ε u is the longitudinal strain corresponding to N u and ε 85 is the longitudinal strain corresponding to 0.85 N u in the falling stage. The calculated results are shown in Table 7 and Figure 13, and the D I values are between 1.80~3.46, indicating that the ductility enhancement of steel tube concrete columns by hybrid fibers is more significant.
Figure 13a shows that, in general, the DI values of both groups of specimens gradually increase with the increase in steel fiber volume admixture, but it can be clearly seen that the DI values of BSFCFST are higher than that of steel tube concrete columns for the same steel fiber volume admixture, and in combination with the self-control of the ductility coefficients of BSFCFST, it can be concluded that the improvement of the ductility of specimens by the mixed fiber action is better than that by the fiber alone. This is because the gradient optimization of the load transfer path is achieved by the steel and basalt fibers through the variability of length, diameter and distribution, which transforms the brittle splitting damage of the traditional steel tube concrete columns into the ductile damage mode of progressive fiber pullout and steel tube buckling and improves the overall toughness of the structure.
It can be seen in Figure 13b that the DI value improves significantly with the increase in the wall thickness of the steel tube, which is due to the fact that the increase in the wall thickness of the steel tube improves the cross-sectional stiffness and flexural capacity of the steel tube, delays the occurrence of local buckling, and enables the steel tube to maintain the effective constraints on the steel tube concrete in a larger deformation range, which significantly prolongs the plastic deformation stage of the specimen.
It can be seen in Figure 13c that the DI value decreases significantly with the increase in the specimen length and slenderness ratio, which is due to the significant enhancement of the additional bending moment generated by the column under the coupling of axial compression and lateral displacement (P-Δ effect) caused by the increase in the length and slenderness ratio, which accelerates the stress redistribution in the core concrete and the steel tube, and promotes the material to enter into the plastic phase earlier, weakening the deformation capacity.

4. Finite Element Analysis

In this section, an equivalent finite element model has been developed for parametric expansion analysis using Abaqus finite element software.

4.1. Ontological Relationships and Finite Element Modeling

The constructed finite element model needs to consider the effect of mixed fibers on steel tube concrete columns. For steel fibers, this paper uses Python 3.12 to establish a random distribution model of steel fibers, and the steel fiber model is obtained by modifying the fiber length, number and other related data and imported into ABAQUS, and the random distribution model of steel fibers is shown in Figure 14. For basalt fibers, this paper corrects the parameters related to the peak stresses of the plastic damage model of concrete proposed by Han et al. [46]:
σ σ c = 2 ( ε ε c ) ( ε ε c ) 2   x 1 ε ε c   β 0 · ( ε ε c 1 ) η + ε ε c   ( x > 1 )  
where   σ and   ε are the real-time stress and strain of the core concrete, respectively, and σ c is to indicate the peak stress, which is calculated as follows:
σ c = 1 + 0.054 ξ 2 + 0.4 ξ · 24 f c 0.45 · f c
For basalt fiber reinforced concrete, the following modifications were made to the parameters related to the peak stress of the model:
σ c b = 1 + 0.054 ξ 2 + 0.4 ξ · 24 f c 0.45 + α V b l b d b · f c
where α V b l b d b This item in this paper draws on the parameter correction form of the fiber concrete constrained constitutive model in reference [47] to correct the basalt fiber concrete constitutive model. Since the analysis of the mechanical properties of BSFCFST in this paper have found that the admixture of basalt fibers does not significantly improve the ductility of the core concrete, but there is a more significant increase in its ultimate bearing capacity; therefore this paper is more for the characteristics of the basalt fiber concrete, the peak stress related to the constrained concrete eigen structures of the formula for the correction of the peak stresses, in which σ c b are the peak stresses of the basalt fiber-reinforced concrete, V b , l b and d b are the basalt fiber volumetric admixture, equivalent length and diameter of basalt fibers, respectively. Where α is the basalt fiber reinforcement coefficient, which was fitted and analyzed as α = 1.886.
The five-stage principal model used for square steel tubes is as follows [48]:
σ y = E s ε s   ε s ε e A ε s 2 + B ε s + C   ε e < ε s ε e 1 f y       ε e 1 < ε s ε e 2 f y 1 + 0.6 ε s ε e 2 / ε e 3 ε e 2     ε e 2 < ε s ε e 3 1.6 f y     ε s > ε e 3
where E s is the modulus of elasticity of steel; A = 0.2 f y   / ε e 1 ε e 2 ; B = 2 A ε e 1 ; C = 0.8 f y + A ε e 2 B ε e ;   ε e = 0.8 f y   / E s ; ε e 1 = 1.5 ε e ; ε e 2 = 10 ε e 1 ; ε e 3 = 100 ε e 1 .
The eight-node three-dimensional solid unit (C3D8R) was selected for core concrete, 4-node shell unit (S4R) was selected for square steel tube and end plate, and truss unit (T3D2) was selected for steel fiber. The contact relationship included normal hard contact model and tangential Coulomb friction model, in which the friction coefficient was taken as 0.6. Considering the calculation time and accuracy, the mesh size was set to 20 mm. The boundary conditions of the FE model were set to be solidified at both ends.

4.2. Comparative Analysis of Experimental and Simulation Results

Figure 15 and Figure 16 compare the damage patterns and load-displacement curves of the BSFCFST simulations and tests, respectively. Based on the above comparison of the simulation results with the test results, it can be seen that the model fits well and can be utilized for further parameter expansion analysis.

4.3. Fiber Mixing Effect Coefficient

In order to verify the validity of blended fibers, the blending effect was quantitatively analyzed, and the fiber blending effect coefficient was introduced [18]:
α = β b s β b   ·   β s
where α is the fiber mixing effect coefficient, β b s , β b , and β s are the fiber reinforcement coefficients of hybrid fiber, basalt fiber, and steel fiber reinforced steel tube concrete columns, respectively. When α is greater than 1.0, the mixing effect is positive, indicating that the reinforcing effect of hybrid fibers is better than the sum of the effects of each single fiber. If α is lower than 1.0, it indicates that the fiber mixing has a negative effect, which reduces the reinforcing effect of each fiber.

4.3.1. Influence of Fiber Mixing Effects on Ultimate Load Carrying Capacity

In order to assess the mixing effect of the BSFCFST ultimate bearing capacity, the fiber reinforcement factor can be calculated according to the following Equations:
α N u = β b s β b   ·   β s
β b s = N u , b s N u 0
β b = N u , b N u 0
β b = N u , s N u 0
where N u , b s , N u , b , and N u , s are the ultimate bearing capacities of BSFCFST, square tube basalt fiber concrete columns, and square steel tube concrete columns, respectively, and N u 0 is the ultimate bearing capacity of the corresponding plain steel tube concrete column.
The calculated coefficients of the mixing effect α N u are shown in Table 8 and Figure 17. α N u is less than 1.0 when the volume percentage of basalt fibers is less than 0.6%, which indicates that the mixing effect is negative, and in other cases α N u is slightly more than 1.0, the maximum value of α N u is 1.0146, which indicates that the mixing effect is positive. From the figure, it can be seen that α N u gradually increases with the increase in basalt fiber volume content and decreases with the increase in steel fiber volume content. Overall, the mixing effect has little influence on the ultimate bearing capacity of BSFCFST.

4.3.2. Fiber Mixing Effect Coefficient of Ductility

To evaluate the mixing effect of BSFCFST ductility, the fiber reinforcement factor can be calculated according to the following Equations:
α D I = β b s β b   ·   β s
β b s = D I B S D I u 0
β b s = D I B D I u 0
β b s = D I S D I u 0
where D I b s , D I b and D I s are the ductility coefficients of BSFCFST, square tube basalt fiber concrete columns and square tube steel fiber concrete columns, respectively, and D I u 0 is the ductility coefficient of the corresponding ordinary steel tube concrete columns.
The calculated mixing effect coefficients ( α D I ) are shown in Table 8 and Figure 18. When the volume contents of basalt and steel fibers are 0.1% and 1.6%, the mixing effect is slightly less than 1.0 and is negative, while in all other cases, α D I is significantly greater than 1.0, and the maximum value of α D I is 1.3125, the mixing effect is positive. From the figure, it can be seen that α D I decreases gradually with the increase in the volume content of both fibers, and the contribution of the mixing effect to the ductility of BSFCFST is obvious.

4.4. SEM Image Analysis

In order to deeply investigate the interaction between hybrid fibers and matrix, this paper cites the relevant literature on the study of steel–basalt hybrid fiber concrete materials [49], which has similar fiber types and configurations of hybrid fiber concrete to this paper, and utilizes the SEM images given therein. The SEM image is shown in Figure 19. It can be seen that the SEM images visualize the differentiated failure mechanisms and matrix micro-defects of the two types of fibers in the hybrid fiber concrete, in which the pullout of basalt fibers consumes energy to enhance the toughness of the concrete, and the steel fibers are not pulled out and carry the stress directly through the role of high-strength anchors. The combination of flexible basalt fibers and steel fibers with excellent ductility performance can achieve multi-scale toughening, basalt inhibits micro-crack expansion, steel fibers block crack macro-development, the two-fiber composite role in the formation of the “micro-macro” composite enhancement of the multi-stage anti-cracking system.

4.5. Ultimate Bearing Capacity Analysis

In this paper, the calculation results of European code EC-4 [50], Japanese code AIJ [51] and Chinese code GB 50936-2014 [38] are selected to compare with the simulation results and test results, and are listed in Table 9 and Figure 20. It can be seen in Figure 20 that the finite element calculation results have the highest accuracy, with the mean value of 0.99, and the European code has the lowest accuracy with the mean value of 0.74, while the Japanese code and Chinese code have the lowest accuracy with the mean value of 0.84 and 0.94, respectively. According to the above analysis results, it can be seen that the current various types of norms and formulas cannot accurately predict the ultimate load-carrying capacity of the new combination of components BSFCFST; while finite element simulations offer a more accurate prediction, they are limited by the complexity of the calculation and the higher arithmetic force requirements and, thus, are not applicable to the actual engineering.

5. Machine Learning Modeling

Machine learning models are capable of automatically learning complex nonlinear relationships from large amounts of data, capturing patterns that are difficult to detect by traditional theoretical methods, often with high accuracy [25]. In order to predict the ultimate bearing capacity of BSFCFST more accurately, this section proposes a new combined machine learning model based on the Newton–Raphson algorithm and XGBoost: the NRBO-XGBoost model.

5.1. Database Construction and Parameter Analysis

A dataset was constructed using the 102 BSFCFST ultimate bearing capacity data obtained from the finite element simulations in the previous section. Table 10 describes the statistical distributions of the basic parameters of BSFCFST in the dataset, where L, B, t, fcu, fy, VS, VB, Nu and Nu represent the specimen length, cross-section width, compressive strength of concrete cube, yield strength of steel, volumetric content of steel fibers, volumetric content of basalt fibers, and axial compressive capacity of the specimen, respectively. Pearson’s correlation coefficients for each structural parameter are plotted in Figure 21, where it is seen that B occupies the highest Pearson’s correlation, and the rest are fy, L, t, VS and VB in that order.

5.2. NRBO-XGBoost Modeling

5.2.1. XGBoost Algorithm

XGBoost is an integrated learning algorithm that belongs to an improved version of the Boosting method [52]. It gradually optimizes the prediction performance of the model by constructing multiple weak learners and combining these weak learners into one strong learner. The core idea of the algorithm is to gradually reduce the prediction error of the model by iteratively optimizing the objective function. It has been shown that the model can efficiently handle large-scale data, has a unique advantage in dealing with high-dimensional complex nonlinear problems, and performs well in a variety of machine learning tasks. The core formulations of the algorithm are presented in Equations (16)–(19):
y ^ = k = 1 k f k X i
L = i = 1 n l ( y i , y ^ i ) + k = 1 k Ω f k
L t i = 1 n [ g i f t X i + 1 2 h i f t 2 X i ] + Ω f t
G a i n = 1 2 i l L g i 2 i l L h i + λ + i l R g i 2 i l R h i + λ i l g i 2 i l h i + λ γ
where Equation (17) is the model structure, K is the total number of trees, and f k X i denotes the output of the Kth tree, each tree corresponds to a number structure and a leaf weight; Equation (18) is the objective function, which consists of the loss function l y i , y ^ i and the regularization term Ω f k ; Equation (19) is the Taylor second-order expansion approximation of the loss function to accelerate convergence, where g i is the first-order derivative and h i is the second-order derivative; Equation (20) is the split gain calculation, when the node splits, the optimal splitting point is selected by maximizing the gain (Gain), where l L and l R are the set of samples of the left and right child nodes after the splitting, and γ is the complexity penalty due to the splitting.

5.2.2. NRBO Algorithm

The Newton–Raphson-based optimizer (NRBO) is a novel meta-heuristic optimization algorithm proposed by Sowmya et al., 2024 [36]. Inspired by the classical Newton–Raphson method, the algorithm optimizes the whole system by introducing two key rules: the Newton–Raphson Search Rule (NRSR) and the Trap Avoidance Operator (TAO), and several sets of matrices to optimize the whole search process.
NRSR uses the Newton–Raphson method to update the search direction to improve exploration and accelerate convergence. Its mathematical expression is:
x n + 1 = x n f x n + Δ x f x n Δ x 2 Δ x × Δ x 2 f x n + Δ x + f x n Δ x 2 × f x n
To balance exploration and utilization, an adaptive coefficient δ is introduced:
δ = 1 2 × I T M a x I T 5
where I T is the current number of iterations and M a x I T is the maximum number of iterations. The final update formula is:
x n + 1 = x n r a n d n × X w X b × Δ x 2 × X w + X b 2 × x n × δ
where X w and X b are the worst and best positions, respectively, and r a n d n is a normally distributed random number with mean 0 and variance 1.
TAO is used to enhance the ability of NRBO to avoid local optima:
x I T + 1 , n = x I T , n T A O
Among others,
x I T , n T A O = x I T , n + θ 1 × μ 1 × X b μ 2 × x I T + 1 , n + θ 2 × δ × μ 1 × M e a n x I T μ 2 × x I T , n
where θ 1 and θ 2 are uniform random numbers and μ 1 and μ 2 are random numbers generated.

5.2.3. Application of NRBO-XGBoost to BSFCFST Ultimate Bearing Capacity Prediction

The specific computational flow of the NRBO-XGBoost model is shown in Figure 22. The role of NRBO in hyper-parameter optimization is to efficiently tune the hyper-parameters of a machine learning model by combining the mathematical principles of the Newton–Raphson method and meta-heuristic optimization strategies to enhance the model performance. NRBO utilizes the information of the second-order derivatives from the Newton method’s to quickly approximate the optimal solution of the objective function through iterations. This enables the algorithm to converge faster in continuous parameter space, which is especially suitable for high-dimensional complex optimization problems. Adaptive coefficients (δ) are introduced to dynamically balance exploration (global search) and exploitation (local search). As the number of iterations increases, the algorithm gradually shifts from extensive exploration, to fine tuning, to avoiding premature convergence. Through stochastic perturbation and global optimal solution guidance, NRBO can jump out of the local optimal trap and enhance the global search capability. This is especially important in hyperparameter optimization, because traditional methods (e.g., grid search) are prone to fall into suboptimal solutions. The loss function of XGBoost is based on the second-order Taylor expansion, while NRBO also optimizes the parameters using the second-order derivative information, which is highly compatible with the mathematical logic and improves the optimization efficiency.
Before the algorithm is ran, the training set and test set are randomly separated from the 102 experimental databases. In order to prevent the overfitting phenomenon, the sample ratio between the training set and the test set is fixed at 8:2. First, the initial XGBoost model is trained using the training dataset for model construction; meanwhile, the seven basic hyperparameters of the XGBoost model are selected after repeated experiments and the appropriate search range is selected based on the experience and other research, and then the model is further optimized using the NRBO algorithm. The final optimized hyperparameters are shown in Table 11.
In order to make the evaluation indexes obtained from the hybrid model training more objective, this paper adopts the ten-fold cross-validation technique, in which ten subsets of the training dataset are separated and used for tenfold cross-validation. One subset is used to validate the model at each iteration, while the other nine subsets are used to train the model. The evaluation metrics for the ten iterations show the overall performance of the model with the current set of hyperparameters, ensuring that the generalization of the combined model to unknown data can be improved.

5.3. NRBO-XGBoost Model Performance Evaluation

5.3.1. Evaluation Metrics

In order to quantitatively compare the prediction performance of different models, three evaluation indexes, namely, the coefficient of determination R2, the root mean square error RMSE and the mean absolute percentage error MAPE, were used, which were defined as follows:
R 2 = [   i = 1 n ( E i E ¯ ) ( P i P ¯ )   ] 2 i n E i E ¯ 2 i n P i P ¯ 2
R M S E =   i = 1 n P i E i 2 n
M A P E = 1 n i = 1 n P i E i × 100 % E i
where P i and E i are the predicted and tested values of the i th specimen, respectively; P ¯ is the average value of the predicted value; E ¯ is the average value of the tested value; and n is the number of specimens in the database. According to the definition of the above three evaluation indexes, the closer R2 is to 1, the smaller RMSE and MAPE are, which represents the higher prediction accuracy and smaller dispersion of the model.

5.3.2. Comparative Analysis with Existing Prediction Methods

In order to evaluate the computational accuracy of the NRBO-XGBoost model, the three canonical formulations and five classical machine learning models (BPNN, SVM, RF, Adaboost, XGBoost) mentioned above are comparatively analyzed, the specific implementation principles of the models are shown in the literature [53,54,55,56], the computational results are shown in Table 12, and the machine learning given in the table model evaluation metrics are all test set metrics.
As shown in Figure 23, the evaluation indexes of NRBO-XGBoost are significantly better than the canonical formulas and other traditional machine learning models, with R2 = 0.988, RMSE = 27.826, MAPE = 1.06% and the absolute value of the error of more than 95% of the results is within 100. In a wider range of parameter space, the computational accuracy of canonical formulas decreases, with the Chinese canonical GB 50936 performing the best with R2 = 0.822, the Japanese canonical AIJ following with R2 = 0.712, and the European canonical EC 4 being less effective with R2 = 0.654.
As shown in Figure 24, Figure 25, Figure 26, Figure 27 and Figure 28, the computational accuracy of the classical machine learning models is generally high, among which BPNN is the most effective with R2 = 0.944, followed by XGBoost, RF and AdaBoost in the order of XGBoost, and SVM has the lowest accuracy with R2 = 0.551. It can be seen clearly that after the optimization of the NRBO algorithm, the accuracy of the XGBoost model has been significantly improved. This is because the core algorithm of NRBO, Newton–Raphson Search Rule (NRSR), utilizes the second-order derivative information of the objective function, which is highly compatible with the optimization logic of XGBoost itself, based on the second-order Taylor expansion. This feature enables NRBO to quickly approach the global optimal solution and reduce the number of iterations when optimizing the XGBoost hyperparameters (e.g., learning rate, tree depth, etc.), and its algorithmic characteristics complement the second-order optimization mechanism of XGBoost, which ultimately achieves the double enhancement of the model accuracy and efficiency.
As can be seen from Table 12, the NRBO-XGBoost model performs well in terms of both arithmetic accuracy and consumed time cost, and the only model chosen is the BPNN model which is slightly faster than the NRBO-XGBoost model in arithmetic speed, but it can be seen that the evaluation indexes of the NRBO-XGBoost model are significantly better than the BPNN model. In summary, the NRBO-XGBoost model performs well in the balance of computing accuracy and consuming time cost.

6. Conclusions

The effect of hybrid fibers on the axial compressive properties of square steel tube concrete columns was investigated through axial compression tests on 11 square steel tube steel–basalt hybrid fiber reinforced concrete columns.
Innovative:
(1)
A new type of combined column, square steel tube hybrid steel–basalt fiber reinforced concrete column (BSFCFST) is proposed in this paper.
(2)
The axial mechanical properties of BSFCFST were experimentally investigated and the effects of different hybrid fiber admixtures on the mechanical properties of steel tube concrete columns were quantitatively analyzed using the finite element method.
(3)
A new combined machine learning model NRBO-XGBoost is proposed based on the Newton–Raphson algorithm and limit gradient boosting model, which can be used for the prediction of the axial compressive load capacity of BSFCFST, and the prediction effect is good.
Based on the above analysis, the following conclusions can be drawn:
(1)
It can be seen from the test that the steel–basalt hybrid fibers have little effect on the damage mode of the steel tube concrete columns, but there is a certain increase in the ultimate bearing capacity of the specimens, with the increase in the content of steel fibers in the hybrid fibers; the ultimate bearing capacity of the specimens was increased by 16.0%, 30.0%, and 33.8%, respectively. The presence of mixed fibers played a certain role in delaying the damage process of steel tube concrete columns, and the ductility coefficient increased significantly with the increase in the content of mixed fibers, which was due to the random distribution of short-cut basalt fibers in the matrix to form a micro-reinforcement network, and steel fibers to provide macroscopic skeleton support, which formed a “micro-macro” composite reinforcement system to optimize the stress distribution. The two form a “micro-macro” composite reinforcement system, which optimizes the stress distribution.
(2)
Based on Abaqus modeling analysis, it can be concluded that the coefficient of mixed fiber effect is around 1.0 for ultimate bearing capacity, and the coefficient for ductility is generally greater than 1.0, reaching a maximum of 1.3544, which indicates that the fiber mixing effect of steel–basalt mixed fiber does not contribute significantly to the ultimate bearing capacity of the specimen, but the fiber mixing effect obviously enhances the steel tube concrete column’s ductility, and the enhancement effect is better than the sum of the effects of each single fiber.
(3)
Based on the study of the mechanical properties of BSFCFST in this paper, a new machine learning model, NRBO-XGBoost, is proposed using the NRBO algorithm and the XGBoost model. By comparing the computational results of the five classical machine learning models, and the three canonical formulas of each country, the NRBO-XGBoost model has an excellent prediction accuracy and a good generalization performance, with R2 = 0.988. It is also found that the NRBO algorithm improves the computational accuracy of the XGBoost model significantly, which is due to the fact that the Newton–Raphson Search Rule (NRSR) utilizes the information of the second-order derivatives of the objective function, which is highly compatible with the optimization logic based on the second-order Taylor expansion of XGBoost itself. Taken together, the NRBO-XGBoost model has high prediction accuracy for the BSFCFST, which is a good alternative to the existing prediction methods and can provide a theoretical reference for the engineering application of the BSFCFST.

7. Foresight

Although this research has made significant progress in the mechanical properties and prediction models of square steel tube hybrid fiber concrete columns, the following pressing scientific issues still exist and deserve to be explored in depth in the future:
(1)
The axial mechanical properties of BSFCFST have been thoroughly investigated in this paper, and the degradation of BSFCFST under actual working conditions such as long-term loading, fatigue cycling, and corrosive environments will be further investigated in the future.
(2)
The actual engineering components are often in the compression, bending and shear composite stress state, the future will carry out tests and simulations under eccentric compression, torsion and impact loads, and develop an improved machine learning prediction framework applicable to multi-dimensional stress state.
(3)
The environmental and economic benefits of hybrid fibers have not yet been quantified, and future work will be carried out to optimize the fiber blending thresholds to balance performance enhancement and cost increase.
Future research will be carried out from the multi-dimensional aspects of complex environmental adaptability, structural response under multi-dimensional stress state, and sustainability assessment, so as to promote the hybrid fiber-reinforced steel tube concrete structures from the laboratory to engineering practice, and to provide theoretical support for the development of green and low-carbon buildings.

Author Contributions

Conceptualization, B.Z. and X.X.; methodology, W.H. and B.Z.; software, B.Z.; validation, B.Z.; writing—original draft preparation, B.Z.; writing—review and editing, W.H.; visualization, X.X.; supervision, X.X.; project administration, W.H.; funding acquisition, W.H. All authors have read and agreed to the published version of the manuscript.

Funding

This research was funded by the Hebei Agriculture Research System (HBCT2023100202) and the S&T Program of Hebei (21327209D) for financial support.

Data Availability Statement

The original contributions presented in the study are included in the article, further inquiries can be directed to the corresponding author.

Conflicts of Interest

The authors declare no conflict of interest.

References

  1. Hassam, M.; Guo, L.; Haq Ma, U.; Tahir, M. Strengthening schemes of special-shaped concrete-filled steel tubes: A review. Structures 2024, 63, 106417. [Google Scholar] [CrossRef]
  2. Wang, H.; Xuan, D.; Jiang, Q.; Huang, J.; Chong, X. Axial compression performance of concrete-filled-steel tube flat columns with a large steel ratio. Structures 2023, 59, 105710. [Google Scholar] [CrossRef]
  3. Xiamuxi, A.; Zheng, T.; Shao, J.; Tan, T. Impact of steel tube wall thickness on axial compression behavior of reinforced and recycled aggregate concrete-filled square steel tube short columns. Structures 2024, 69, 107382. [Google Scholar] [CrossRef]
  4. Tao, Z.; Uy, B.; Han, L.-H.; Wang, Z.-B. Analysis and design of concrete-filled stiffened in-walled steel tubular columns under axial compression. Thin-Walled Struct. 2009, 47, 15441556. [Google Scholar] [CrossRef]
  5. Liu, Z.; Huang, D.; Wu, H.; Lu, Y.; Luo, X. Axial compressive behavior of steel fiber reinforced concrete-filled square steel tube sb columns. J. Constr. Steel Res. 2023, 203, 107804. [Google Scholar] [CrossRef]
  6. Manso-Morato, J.; Hurtado-Alonso, N.; Revillauesta, V.; Skaf, M.; Ortega-López, V. Fiber-Reinforced concrete and its life cycle assessment: A systematic review. J. Build. Eng. 2024, 94, 110062. [Google Scholar] [CrossRef]
  7. Khodadadi, N.; Roghani, H.; Harati, E.; Mirdarsoltany, M.; De Caso, F.; Nanni, A. fiber-reinforced polymer (FRP) in concrete: A comprehensive survey. Constr. Build. Arter. 2024, 432, 136634. [Google Scholar] [CrossRef]
  8. Guo, Z.; Xu, Z.; Li, F.; Lu, L.; Geng, O. Flexural static and High-Cycle fatigue behavior of steel Fiber-Reinforced Ultra-High-Permeance concrete. J. Build. Eng. 2025, 105, 112550. [Google Scholar] [CrossRef]
  9. Bao, H.; Wang, T.; Yu, M.; Wang, R.; Saafi, M.; Ye, J. Experimental study and numerical modeling of supercritical carbonation steel fiber reinforced concrete. Constr. Build. Mater. 2025, 476, 141249. [Google Scholar] [CrossRef]
  10. Yuan, H.; Zhu, L.; Wang, X. Long-term performance of steel fiber reinforced recycled concrete: Creep calculation model based on recycled aggregate attached mortar and the interfacial transition zone of steel fiber. Constr. Build. Mater. 2025, 474, 141163. [Google Scholar] [CrossRef]
  11. Leporace-Guimil, B.; Conforti, A.; Plizzari, G.A. Evaluation of orientation factors influencing the shear and flexural behavior of elements in steel fiber reinforced concrete. Constr. Build. Mater. 2025, 474, 141054. [Google Scholar] [CrossRef]
  12. Krassowska, J. Fracture behavior and mechanical properties of basalt chopped fibers and minibars fiber-reinforced concrete. Structures 2025, 75, 108808. [Google Scholar] [CrossRef]
  13. Xiao, J.; Zhou, Y.; Deng, Z.; Yang, H.; Mei, J.; Jiang, J.; Wei, T. Investigation of biaxial compressive mechanical properties and strength criteria of basalt fiber-reinforced coral aggregate concrete. Constr. Build. Mater. 2025, 475, 141199. [Google Scholar] [CrossRef]
  14. Yang, Z.; Chen, M.; Ye, M. Mechanical property for eccentric loaded ultrahigh-strength basalt-fiber concrete-filled steel-tube. Build. Sci. 2021, 37, 144–150. (In Chinese) [Google Scholar]
  15. Ma, J.; Yuan, H.; Zhang, J.; Zhang, P. Enhancing concrete performance: A comprehensive review of hybrid fiber reinforced concrete. Structures 2024, 64, 106560. [Google Scholar] [CrossRef]
  16. Liang, L.; Wang, Q.; Shi, Q. Hybrid mechanism and tensile constitutive model of hybrid steel fiber reinforced ultra-high performance concrete. Constr. Build. Mater. 2025, 474, 141160. [Google Scholar] [CrossRef]
  17. Chia, E.; Nguyen, H.B.; Le, K.N.; Bi, K.; Pham, T.M. Performance of hybrid basalt-recycled polypropylene fiber reinforced concrete. Structures 2025, 75, 108711. [Google Scholar] [CrossRef]
  18. Lu, Y.; Liu, Z.; Li, S.; Hu, J. Axial compression behavior of hybrid fiber reinforced concrete filled steel tube stub column. Constr. Build. Mater. 2018, 174, 96–107. [Google Scholar] [CrossRef]
  19. Zhao, N.; Zhang, H.; Xie, P.; Chen, X.; Wang, X. Prediction of compressive strength of multiple types of fiber-reinforced concrete based on optimized machine learning models. Eng. Appl. Artif. Intell. 2025, 152, 110714. [Google Scholar] [CrossRef]
  20. Zheng, Y.; Lv, X.; Hu, S.; Zhuo, J.; Wan, C.; Liu, J. Mechanical properties and durability of steel fiber reinforced concrete: A review. J. Build. Eng. 2023, 82, 108025. [Google Scholar] [CrossRef]
  21. Yan, L.; Liu, L.; Liu, C. Bonding performances of polypropylene fiber reinforced concrete beam-type specimen at corrosion conditions: Experimental and simulation study. J. Build. Eng. 2025, 105, 112479. [Google Scholar] [CrossRef]
  22. Zhang, B.; Yu, Y.; Yi, S.; Ding, Z.; Yousefi, A.M.; Li, J.; Lyu, X. Machine learning methods for compression capacity prediction and sensitivity analysis of concrete-filled steel tubular columns: State-of-the-art review. Structures 2025, 72, 108259. [Google Scholar] [CrossRef]
  23. Tran, V.; Ahmed, M.; Gohery, S. Prediction of the ultimate axial load of circular concrete-filled stainless steel tubular columns using machine learning approaches. Struct. Concr. 2023, 24, 3908–3932. [Google Scholar] [CrossRef]
  24. Nguyen, T.; Nguyen, K.L.; Ly, H. Universal boosting ML approaches to predict the ultimate load capacity of CFST columns. Struct. Des. Tall Spec. Build. 2024, 33, e2071. [Google Scholar] [CrossRef]
  25. Cakiroglu, C.; Islam, K.; Bekdaş, G.; Isikdag, U.; Mangalathu, S. Explainable machine learning models for predicting the axial compression capacity of concrete filled steel tubular columns. Constr. Build. Mater. 2022, 356, 129227. [Google Scholar] [CrossRef]
  26. Miao, K.; Pan, Z.; Chen, A.; Wei, Y.; Zhang, Y. Machine learning-based model for the ultimate strength of circular concrete-filled fiber-reinforced polymer–steel composite tube columns. Constr. Build. Mater. 2023, 394, 132134. [Google Scholar] [CrossRef]
  27. Wang, C.; Chan, T. Machine learning (ML) based models for predicting the ultimate strength of rectangular concrete-filled steel tube (CFST) columns under eccentric loading. Eng. Struct. 2022, 276, 115392. [Google Scholar] [CrossRef]
  28. Lai, D.; Wei, J.; Contento, A.; Xue, J.; Briseghella, B.; Albanesi, T.; Demartino, C. Machine learning-based probabilistic predictions for Concrete Filled Steel Tube (CFST) column axial capacity. Structures 2024, 70, 107543. [Google Scholar] [CrossRef]
  29. Nguyen, T.; Trinh, S.H.; Nguyen, M.H.; Ly, H. Novel ensemble approach to predict the ultimate axial load of CFST columns with different cross-sections. Structures 2022, 47, 1–14. [Google Scholar] [CrossRef]
  30. Ren, Z.; Wang, D.; Kondo, G. Axial compressive capacity prediction and optimal design of circular UHPC-filled steel tube based on Hybrid Symbolic Regression—Neural Network model. Structures 2024, 68, 107084. [Google Scholar] [CrossRef]
  31. Song, Z.; Zhang, C.; Lu, Y. Prediction of ultimate bearing capacity for rubberized concrete filled steel tube columns based on Tabular Variational Autoencoder method and Stacking ensemble strategy. Structures 2024, 70, 107667. [Google Scholar] [CrossRef]
  32. Ma, L.; Zhou, C.; Lee, D.; Zhang, J. Prediction of axial compressive capacity of CFRP-confined concrete-filled steel tubular short columns based on XGBoost algorithm. Eng. Struct. 2022, 260, 114239. [Google Scholar] [CrossRef]
  33. Deng, C.; Xue, X. Hybrid particle swarm optimization and group method of data handling for the prediction of ultimate strength of concrete-filled steel tube columns. Adv. Eng. Softw. 2024, 195, 103708. [Google Scholar] [CrossRef]
  34. Nguyen, T.; Ly, H. Predicting axial compression capacity of CFDST columns and design optimization using advanced machine learning techniques. Structures 2023, 59, 105724. [Google Scholar] [CrossRef]
  35. Bardhan, A.; Biswas, R.; Kardani, N.; Iqbal, M.; Samui, P.; Singh, M.; Asteris, P.G. A novel integrated approach of augmented grey wolf optimizer and ANN for estimating axial load carrying-capacity of concrete-filled steel tube columns. Constr. Build. Mater. 2022, 337, 127454. [Google Scholar] [CrossRef]
  36. Sowmya, R.; Premkumar, M.; Jangir, P. Newton-Raphson-based optimizer: A new population-based metaheuristic algorithm for continuous optimization problems. Eng. Appl. Artif. Intell. 2023, 128, 107532. [Google Scholar] [CrossRef]
  37. Zhang, Y.L.; He, Y.Z.; Du, G.F.; Zhang, J. Axial Compressive Capacity Prediction of CFRST Columns Based on PSO-BP Neural Network. Ind. Constr. 2024, 54, 141–148. [Google Scholar] [CrossRef]
  38. GB 50936-2014; Technical Code for Concrete Filled Steel Tubular Structures. China Architecture & Building Press: Beijing, China, 2014. (In Chinese)
  39. GB/T228.1-2010; Metallic Materials—Tensile Testing—Part 1: Method of Test at Room Temperature. Standards Press of China: Beijing, China, 2010. (In Chinese)
  40. GB/T 14685-2022; Pebble and Crushed Stone for Construction. China Standards Press: Beijing, China, 2022.
  41. JGJ 52-2006; Standard for Technical Requirements and Test Method of Sand and Crushed Stone (or Gravel) for Ordinary Concrete. China Architecture & Building Press: Beijing, China, 2006.
  42. GB/T50080-2016; Standard for Test Method of Performance on Ordinary Fresh Concrete. China Architecture & Building Press: Beijing, China, 2016. (In Chinese)
  43. GB/T50081-2019; Standard for Test Method of Concrete Physical and Mechanical Properties. China Architecture & Building Press: Beijing, China, 2019. (In Chinese)
  44. GB 50010-2010; Specification for Design of Concrete Structures. China Architecture & Building Press: Beijing, China, 2010. (In Chinese)
  45. Jia, S.; Xu, X.; Yang, A.; Hao, W. Axial compression performance of square steel tube steel fiber concrete columns. Struct. Des. Tall Spec. Build. 2025, 34, e70001. [Google Scholar] [CrossRef]
  46. Han, L.; Feng, J. Constitutive Relationship Model of Concrete Its Application in Numerical Analysis of Concrete-filled Steel Tubes. J. Harbin Inst. Archit. 1995, 28, 26–32. (In Chinese) [Google Scholar]
  47. Padmarajaiah, S.K.; Ramaswamy, A. A finite element assessment of flexural strength of prestressed concrete beams with fiber reinforcement. Cem. Concr. Compos. 2002, 24, 229–241. [Google Scholar] [CrossRef]
  48. Pan, Y.; Zhong, S. Axial compression constitutive Relationship of Concrete-filled Steel tubes (Part I). J. Build. Struct. 1990, 10–20. (In Chinese) [Google Scholar]
  49. Cao, K.; Liu, G.; Li, H.; Huang, Z. Mechanical properties and microstructures of Steel-basalt hybrid fibers reinforced Cement-based composites exposed to high temperatures. Constr. Build. Mater. 2022, 341, 127730. [Google Scholar] [CrossRef]
  50. EN 1994-1-1; Eurocode 4—Design of Composite Steel and Concrete Structures, Part 1.1: General Rules and Rules for Buildings. European Committee for Standardization: Brussels, Belgium, 2005.
  51. Architectural Institute of Japan (AIJ). Recommendations for Design and Construction of Concrete Filled Steel Tubular Structures; Architectural Institute of Japan: Tokyo, Japan, 1997. [Google Scholar]
  52. Chen, T. Scalable and Intelligent Learning Systems (Order No. 22617033). (2312585181). 2019. Available online: https://www.proquest.com/dissertations-theses/scalable-intelligent-learning-systems/docview/2312585181/se-2 (accessed on 25 May 2025).
  53. Adesanya, E.; Aladejare, A.; Adediran, A.; Lawal, A.; Illikainen, M. Predicting shrinkage of alkali-activated blast furnace-fly ash mortars using artificial neural network (ANN). Cem. Coner. Compos. 2021, 124, 1104265. [Google Scholar] [CrossRef]
  54. Boser, B.E.; Guyon, I.M.; Vapnik, V.N.A. Training algorithm for optimal margin classifiers. In Proceedings of the Fifth Annual Workshop on Computational Learning Theory, Pittsburgh, PA, USA, 27–29 July 1992; pp. 144–152. [Google Scholar]
  55. Breiman, L. Random forests. Mach. Learn. 2001, 45, 5–32. [Google Scholar] [CrossRef]
  56. Freund, Y.; Schapire, R.E. A Decision-Theoretic Generalization of On-Line Learning an Application to Boosting. J. Comput. Syst. Sci. 1997, 55, 119–139. [Google Scholar] [CrossRef]
Figure 1. Research methodology flowchart.
Buildings 15 01859 g001
Figure 2. Fiber material actual picture. (a) Steel fiber. (b) Basalt fiber.
Buildings 15 01859 g002
Figure 3. Aggregate gradation curve.
Buildings 15 01859 g003
Figure 4. Actual photo of concrete preparation.
Buildings 15 01859 g004
Figure 5. Concrete specimen compression test.
Buildings 15 01859 g005
Figure 6. Actual photograph of the test setup.
Buildings 15 01859 g006
Figure 7. Layout of the test setup.
Buildings 15 01859 g007
Figure 8. Specimen cross-section.
Buildings 15 01859 g008
Figure 9. Diagram of damage pattern of specimen. (a) Typical damage patterns. (b) Overall damage pattern of the specimen.
Buildings 15 01859 g009
Figure 10. Load-displacement curve. (a) Basalt fiber content. (b) Steel fiber content. (c) Wall thickness of steel tube. (d) Slender proportion.
Buildings 15 01859 g010
Figure 11. Load-strain curve. (a) Basalt fiber content. (b) Steel fiber content. (c) Wall thickness of steel tube. (d) Slender proportion.
Buildings 15 01859 g011aBuildings 15 01859 g011b
Figure 12. Line graph of intensity indicators. (a) Steel fiber content. (b) Wall thickness of steel tube. (c) Slender proportion.
Buildings 15 01859 g012
Figure 13. Line graph of ductility factor. (a) Steel fiber content. (b) Wall thickness of steel tube. (c) Slender proportion.
Buildings 15 01859 g013
Figure 14. Random distribution model of steel fibers.
Buildings 15 01859 g014
Figure 15. Comparison of test and simulated damage patterns.
Buildings 15 01859 g015
Figure 16. Comparison of test and simulated load-displacement curves. (a) L6-t2-B0S0. (b) L6-t2-B0.1S0. (c) L6-t2-B0.1S0.6. (d) L6-t2-B0.1S1.2. (e) L6-t2-B0.1S1.6. (f) L6-t1.5-B0.1S1.2. (g) L6-t2.5-B0.1S1.2. (h) L6-t3-B0.1S1.2. (i) L4-t2-B0.1S1.2. (j) L8-t2-B0.1S1.2. (k) L10-t2-B0.1S1.2.
Buildings 15 01859 g016aBuildings 15 01859 g016b
Figure 17. Mixing effect coefficients α N u .
Buildings 15 01859 g017
Figure 18. Mixing effect coefficients α D I .
Buildings 15 01859 g018
Figure 19. SEM image.
Buildings 15 01859 g019
Figure 20. Comparison of test values with calculated values.
Buildings 15 01859 g020
Figure 21. Pearson’s correlation coefficient plot.
Buildings 15 01859 g021
Figure 22. Flowchart of NRBO-XGBoost model computation.
Buildings 15 01859 g022
Figure 23. NRBO-XGBoost model calculation results.
Buildings 15 01859 g023
Figure 24. BPNN model calculation results.
Buildings 15 01859 g024
Figure 25. SVM model calculation results.
Buildings 15 01859 g025
Figure 26. Results of RF modeling calculations.
Buildings 15 01859 g026
Figure 27. Results of AdaBoost model calculation.
Buildings 15 01859 g027
Figure 28. XGBoost model calculation results.
Buildings 15 01859 g028
Table 1. Mechanical properties of square steel tubes.
fy/MPafu/MPaΔL/L (%)ES/GPaμ
331411282060.3
Table 2. Fiber Material Properties.
Typedf/µmlf/mmρ/(kg/m2)ft/MPaES/GPa
Steel fiber20012–1478502850206
Basalt fiber7–151226403000–480091–110
Table 3. Physical Properties of Aggregates.
Aggregate TypeFineness ModuleMud Content/%Packing Density/(kg·m3)Apparent Density/(kg·m3)Moisture Content/%Maximum Particle Size/mm
medium sand2.581.6%149025801.24
gravel\0.9%15722655\30
Table 4. Water-reducing agent performance parameters.
Water Reduction RateSlump Loss 1 hSlump Loss 2 hGas Content28 d Shrinkage RateWater Secretion Rate
40%≤5%≤10%2–3%≤100%≤60%
Table 5. Concrete mix details.
GroupCementFlyGravelSandWater (kg⋅m3)VB (%)VS (%)M (%)D (mm)fcu (N/mm2)fcr (N/mm2)
B0-S0390170670820230002.0061840.737.5
B0.1-S03901706708202300.102.0259744.937.7
B0.1-S0.63901706708202300.10.62.0456649.039.6
B0.1-S1.23901706708202300.11.22.0552750.942.1
B0.1-S1.63901706708202300.11.62.0750251.043.9
Table 6. Specimen parameters.
Specimen IDL × B × t (mm)fy (N/mm2)fcr (N/mm2)λξVB (%)Vs (%)
L6-t2-B0S0600 × 100 × 233137.520.780.75100
L6-t2-B0.1S0600 × 100 × 233137.720.780.7470.10
L6-t2-B0.1S0.6600 × 100 × 233139.620.780.7110.10.6
L6-t2-B0.1S1.2600 × 100 × 233142.120.780.6690.11.2
L6-t2-B0.1S1.6600 × 100 × 233143.920.780.6410.11.6
L6-t1.5-B0.1S1.2600 × 100 × 1.533142.120.780.4940.11.2
L6-t2.5-B0.1S1.2600 × 100 × 2.533142.120.780.8490.11.2
L6-t3-B0.1S1.2600 × 100 × 333142.120.781.0360.11.2
L4-t2-B0.1S1.2400 × 100 × 233142.113.860.6690.11.2
L8-t2-B0.1S1.2800 × 100 × 233142.127.710.6690.11.2
L10-t2-B0.1S1.21000 × 100 × 233142.134.640.6690.11.2
Table 7. Detailed specimen indicators.
Specimen IDL × B × tfy (N/mm2)fCU (N/mm2)VB (%)Vs (%)SIDINU (KN)
Data of this testL6-t2-B0S0600 × 100 × 233140.7001.091.80554
L6-t2-B0.1S0600 × 100 × 233144.90.101.181.88633
L6-t2-B0.1S0.6600 × 100 × 233149.00.10.61.222.73687
L6-t2-B0.1S1.2600 × 100 × 233150.90.11.21.263.36722
L6-t2-B0.1S1.6600 × 100 × 233151.00.11.61.293.45741
L6-t1.5-B0.1S1.2600 × 100 × 1.533150.90.11.21.243.21638
L6-t2.5-B0.1S1.2600 × 100 × 2.533150.90.11.21.273.46797
L6-t3-B0.1S1.2600 × 100 × 333150.90.11.21.283.55868
L4-t2-B0.1S1.2400 × 100 × 233150.90.11.21.293.42739
L8-t2-B0.1S1.2800 × 100 × 233150.90.11.21.222.68700
L10-t2-B0.1S1.21000 × 100 × 233150.90.11.21.182.12674
Data of Document [45]L6-t2-S0600 × 100 × 233146.6001.121.83617
L6-t2-S0.6600 × 100 × 233147.000.61.202.08660
L6-t2-S0.9600 × 100 × 233149.000.91.212.62682
L6-t2-S1.2600 × 100 × 233151.501.21.213.12700
Table 8. Mixing-effect coefficient.
αeαNu of Ultimate CapacityαDI of Ductility
BF (%)BF (%)
0.020.040.060.100.020.040.060.10
SF (%)0.60.99721.00081.00631.01461.35231.35441.32171.3125
negativepositivepositivepositivepositivepositivepositivepositive
0.90.98850.99881.00321.01041.30121.26841.22131.2126
negativenegativepositivepositivepositivepositivepositivepositive
1.20.98220.99721.00121.00531.25651.21721.15541.0769
negativenegativepositivepositivepositivepositivepositivepositive
1.60.95240.98031.00041.00221.10561.07231.00550.9982
negativenegativepositivepositivepositivepositivepositivenegative
Table 9. Comparison of extreme load capacity.
Specimen IDNu (kN)EC-4AIJGB 50936-2014FE
NN/NuNN/NuNN/NuNN/Nu
L6-t2-B0S0554489.90.88553.31.00619.51.12552.01.01
L6-t2-B0.1S0633490.50.77554.80.88623.10.95630.11.01
L6-t2-B0.1S0.6687501.50.73569.70.83658.30.90679.80.99
L6-t2-B0.1S1.2722516.80.72589.30.82699.80.91719.21.01
L6-t2-B0.1S1.6741527.80.71603.40.81727.40.94745.01.03
L6-t1.5-B0.1S1.2638452.50.71532.30.83541.20.85632.50.97
L6-t2.5-B0.1S1.2797579.80.73645.70.81832.60.98800.91.02
L6-t3-B0.1S1.2868643.20.74701.50.81901.20.97871.71.01
L4-t2-B0.1S1.2739535.60.72598.30.81720.40.95735.00.99
L8-t2-B0.1S1.2700500.20.71586.70.84681.20.93705.81.03
L10-t2-B0.1S1.2674488.70.73572.80.85642.80.94678.21.01
Mean value 0.740.840.940.99
Standard deviation 0.0500.0560.0660.006
Table 10. Parameter statistics table.
ParameterUnitAvgMaxMinStdType
Lmm1050.93000.0400.0742.9Input
Bmm171.4250.0100.051.4Input
tmm3.35.01.51.0Input
fcuMpa42.155.030.08.6Input
fyMpa347.3500.0235.069.6Input
VS%1.102.000.20.57Input
VB%0.060.100.020.03Input
NuMpa1659.93890.2412.7847.6Output
Table 11. Optimized hyperparameters.
HyperparametersSearch RangeDefault ValueNRBO-XGBoost
n_estimators(50, 500)100437
learning_rate(0.01, 0.6)0.30.2564
max_depth(3, 10)63
min_child_weight(1, 3)11.2565
gamma(0, 1)00.4736
subsample(0.5, 1)10.5907
colsample_bytree(0.5, 1)11
Table 12. Calculation results of each model.
TypeModelR2RMSEMAPE/%T/h
The testNRBO-XGBoost0.98827.8261.060.58
Gauge formulaEC 40.654371.59628.07/
AIJ0.712318.42810.89/
GB 509360.822126.3756.76/
Classical machine learning modelBPNN0.944243.86810.580.52
SVM0.551688.88930.412.50
RF0.868374.25116.291.22
AdaBoost0.803456.41825.050.70
XGBoost0.920290.92012.470.63
Disclaimer/Publisher’s Note: The statements, opinions and data contained in all publications are solely those of the individual author(s) and contributor(s) and not of MDPI and/or the editor(s). MDPI and/or the editor(s) disclaim responsibility for any injury to people or property resulting from any ideas, methods, instructions or products referred to in the content.

