This section presents the analysis of the collected data and the corresponding inferences. The statistical analysis was conducted in three stages: demographic assessment, descriptive statistics, and hypothesis testing.
5.1. Demographic Assessment
Demographic factors, such as gender, age, work experience, marital status, job role, and the duration of time spent within hospital premises, can significantly shape employees’ perceptions, expectations, and overall satisfaction with the physical environment. These variables also influence the representativeness and generalizability of the research findings. Therefore, a detailed demographic analysis was conducted prior to the main descriptive and inferential analyses.
Among the total 450 respondents, 160 (35.6%) were female, whereas 290 (64.4%) were male. Although female staff, particularly nurses, play a crucial role in hospital services and care delivery, the majority of respondents were male. Notably, previous research has suggested that gender may influence preferences and expectations related to both social and physical workplace environments [
46,
47]. Thus, the distribution of respondents in this study supports the reliability and generalizability of the collected data.
The age distribution of the 450 respondents revealed that 13.6% (n = 61) were in the 18–25-years age group, whereas 14.7% (n = 66) fell within the 25–30-years range. Additionally, 14.2% (n = 64) were 30–35 years of age. A significant proportion (approximately 57.6%, n = 259) were aged 35 years and above. The predominance of respondents in the older age group suggests a higher level of professional and personal experience. Among the respondents, 299 (66.4%) were married, whereas the remaining 33.6% were unmarried.
The collected data reveal that a total of 169 respondents, accounting for 37.6%, were nontechnical staff involved in maintenance and upkeeping tasks. On the other hand, 19.1% of the respondents, 86 in number, were administrative staff, mainly involved in office work, managerial tasks, etc. On the other hand, 24.4% of the respondents, 110 in number, were nursing professionals who were proactively involved in treatment practices, patient monitoring, and allied services. In addition, 18.9% of the respondents were medical professionals. In this manner, the responses obtained from such diversity ensured cumulative responses and expectations. The quantification of perceived satisfaction from these different employee types provides broader details concerning the physical environment and its significance. It can help hospital management improve the corresponding physical environment, which can ultimately improve employee satisfaction across the hierarchy.
Considering the educational background of the respondents, almost 13.3% of the respondents were undergraduates and were involved mainly in maintenance, infrastructure upkeeping, and patient handling. On the other hand, a larger fraction, accounting for 47.6% of the respondents, was graduates. A total of 136 respondents (30.2%) were postgraduates and played the role of clinical staff. A total of 40 respondents, accounting for 8.9% of the sample size, were diploma holders who were involved in medical tests, nursing, and laboratory tasks. Almost 8.4% of the respondents had less than one year of experience, whereas 49 respondents had 1–3 years of experience (10.9%). On the other hand, a total of 148 respondents, accounting for 32.9%, had 3–5 years of experience. The collected responses revealed that 24.2% of the respondents (109 out of 450) had 5–10 years of experience, whereas the remaining 23.6% of the respondents had more than 10 years of experience.
5.2. Descriptive Analysis
This section presents descriptive statistics for the responses related to physical-environment features—ADF, IDF, and AF—as well as employee attitudes—AFF, COG, and BEH components and overall satisfaction (SAT). The data were collected using a structured, close-ended questionnaire with responses recorded on a 5-point Likert scale. The mean and standard deviation for each variable are reported and discussed below.
As shown in
Table 1, 85.6% of the private hospital employees stated that they prefer a well-organized spatial design and layout (M = 4.28, SD = 0.84), which provides them with flexibility to perform better. Similarly, approximately 93.2% of the hospital employees emphasized the need for adequate circulation space, highlighting its role in maintaining organizational flow and fostering a sense of openness within the workplace (M = 4.66, SD = 0.49). (M = 4.66, SD = 0.49). This factor is believed to have a direct effect on aeration and ventilation prospects while ensuring sufficient spatial deployment to accommodate proper movement, even during increased patient handling over emergency periods. Similarly, the employees also stated that they prefer to work in a workspace in which the spatial layout enables them to work without any distraction or disturbances (M = 4.44%, SD = 0.56). Interestingly, a total of 88.8% of the employees expected to have sufficient flexible spaces for ease of movement. Almost 89.6% of the employees expected to have personal space at the workplace (M = 4.48, SD = 0.71) that consequently could preserve privacy and support them in relaxing (M = 4.54, SD = 0.58).
The responses also revealed that almost 90.8% of the respondents expected to have a dedicated space for relaxation (M = 4.54, SD = 0.58). However, such expectations were very specific in conjunction with the type of role and active involvement in hospital duties. For example, the cross-examination of the response revealed that the doctors expected their dedicated space for relaxation and ergonomically designed furniture, which could help reduce fatigue. Interestingly, only 74.2% of the respondents stated that they expected to have access to a window view at the workplace (M = 3.71, SD = 1.20). However, 74% of the respondents expressed a preference for access to windows, potentially reflecting their need to alleviate fatigue during extended working hours under varying functional demands. Overall, the responses to the ADF factors indicate that most respondents value an optimally planned spatial layout, designated relaxation areas, and adequate personal space within the hospital environment.
With respect to the IDF constructs shown in
Table 2, the responses inferred that almost 91.8% of the respondents expected to have adequately comfortable seating arrangements at the hospital (M = 4.59, SD = 0.49). In the same manner, almost 83.2% of the respondents stated that the furniture and furnishings must be suitable enough to be adjusted per their own requirements (m = 4.16, SD = 0.64). Almost 65% of the respondents stated that they expected pleasant colors for their interiors (M = 3.25, SD = 0.71). However, the finding that 65% of the respondents preferred pleasant color schemes suggests that hospital management should consider aligning interior design choices with employee preferences to enhance the overall work environment. Almost 80% of the respondents stated that they like to have interior plants at work that can eventually provide soothing ambience and natural feelings under different working conditions (M = 4.00, SD = 0.54).
As indicated in
Table 3, 95% of the respondents stated that they expected to have comfortable temperatures in the work area (M = 4.75, SD = 0.49). The analysis indicated that employees expressed notable concern regarding ambient temperature, particularly in relation to varying seasonal conditions (winter and summer) and daily crowd levels. The relatively low standard deviation suggests a strong agreement among respondents regarding the need for an improved internal temperature setup in the hospital. Additionally, almost 93.2% of the respondents agreed that they preferred to work in a noise-free environment (M = 4.66, SD = 0.54). This study revealed that almost 94% of the employees preferred to have the desired health- and hygiene-specific air quality in the workplace (M = 4.70, SD = 0.52). A similar fraction of the employees stated that they preferred to have a good amount of daylight in the workspace (M = 4.70, SD = 0.51). Additionally, 92.8% of the respondents agreed that there must be sufficient artificial lights in the workspace (M = 4.64, SD = 0.52).
Although work conditions and the physical and psychological states of employees may vary during working hours, there is a general expectation for personalized control over artificial lighting within hospital premises (M = 3.97, SD = 0.95). While 79.4% of the employees supported this expectation, the relatively high standard deviation suggests notable variation in opinions. Further analysis revealed that the demand for individualized lighting control was role dependent. For example, nurses often need to adjust lighting on the basis of patient needs, whereas laboratory staff and technicians typically work under fixed ambient lighting conditions, limiting their need for personal control.
While assessing attitudinal constructs (
Table 4), particularly affective components, this study revealed that almost 90% of the respondents expected that the internal structure of the workspace should have optimally crafted spatial deployment, which could inculcate the sense of spaciousness (M = 4.50, SD = 0.60). Similarly, a total of 87% of the employees stated that visual access to nature from the workspace could improve overall mental and psychological well-being (M = 4.35, SD = 0.51). Like the ADF and IDF constructs, the affective components reflecting employee attitudes toward the environment indicated a preference for well-designed or ergonomically appropriate furniture that could enhance workplace comfort (M = 4.45, SD = 0.53). Overall, the responses indicated that employees in private hospitals expect ergonomically designed furniture to support both their physical comfort and their psychological well-being. Almost 75.2% of the respondents stated that an inappropriate color often impacts their mood in the workplace (M = 3.76, SD = 0.82). A total of 72% of the respondents stated that indoor plants promote a sense of relaxation in the workplace (M = 3.60, SD = 0.96). However, a higher standard deviation (SD = 0.96) indicates a disparity in opinion. This study also inferred that lighting quality and sufficiency impact the overall mood of the respondents (M = 4.11, SD = 0.59). This statement was backed up by almost 82% of the employees. The collected responses also revealed that almost 91.8% of the respondents agreed that excessive noise in the workplace disturbed them and were often stressed (M = 4.59, SD = 0.52). Additionally, 93.6% of the respondents agreed that the comfortable temperature significantly impacts their comfort (M = 4.68, SD = 0.50).
On the basis of the hypothesis that physical-environment parameters influence employee attitudes, this study examined respondents’ perceptions concerning behavioral components. Almost 78% of the employees agreed that a spacious layout enables them to personalize their workspace, contributing to greater comfort (M = 3.90, SD = 0.91). However, only 63% reported having the ability to adjust window openings to enhance external views. These findings reflect the nature of hospital environments, where employees often prioritize task-related functions over environmental personalization—unlike in conventional office settings. This is further supported by the relatively low mean (M = 3.15) and higher standard deviation (SD = 0.99), indicating a variability in responses regarding window-view preferences. Moreover, 79.2% of the respondents indicated that adjustable, ergonomic furniture contributed significantly to their comfort (M = 3.96, SD = 0.89). The personalization of workspace colors was supported by 74% of the respondents, who agreed that it helped create a more pleasant atmosphere (M = 3.70, SD = 0.99). In terms of the biophilic elements, 80% favored the inclusion of indoor plants to enhance psychological and emotional well-being (M = 4.05, SD = 0.75). Additionally, 82% of the employees agreed that having control over lighting conditions supported their ability to work comfortably (M = 4.10, SD = 0.52).
The responses further indicated that the provision of dedicated quiet workspaces effectively reduced unwanted noise (M = 4.62, SD = 0.54). Additionally, the ability to regulate the indoor temperature was viewed as essential for maintaining a comfortable and productive work environment (M = 4.25, SD = 0.75).
With respect to the cognitive dimension of employee attitudes, the findings suggest that 91% of the respondents believe that a well-designed spatial layout is supportive of work efficiency (M = 4.55, SD = 0.57). Additionally, 78% indicated that visual access to natural elements contributes to a more positive work environment (M = 3.90, SD = 0.69). Approximately 84.2% agreed that ergonomically designed furniture contributes to comfort, which may assist in sustaining productivity (M = 4.21, SD = 0.84). Similarly, 78% of the participants stated that inappropriate color schemes could affect attention thereby affecting satisfaction (M = 3.90, SD = 0.97). Approximately 80% of the respondents indicated that indoor plants in the workspace are helpful for managing stress (M = 4.00, SD = 0.90). Approximately 90% reported that lighting design influences their perceptions towards overall satisfaction (M = 4.50, SD = 0.79). A large portion of the respondents (97%) emphasized the importance of maintaining a quiet environment to support concentration (M = 4.85, SD = 0.37). Additionally, maintaining a comfortable indoor temperature was considered important for creating a conducive work setting (M = 4.80, SD = 0.52).
The quantification of workplace satisfaction among the employees (
Table 5) revealed that almost 82.6% of the respondents were satisfied with the workplace layout that facilitates interactions with their colleagues (M = 4.13, SD = 0.79). Similarly, a total of 85% of the respondents agreed that they were satisfied with workplace privacy (M = 4.25, SD = 0.67). On the other hand, almost 82.4% of the respondents agreed that they were satisfied with the workplace layout, which enabled them to work without distraction or any unexpected interruptions during work hours (M = 4.12, SD = 0.75). This helps them improve their quality of service and error-free services to patients. The statistical outcomes also infer that almost 83% of the respondents agree that they are satisfied with the amount of my allocated workspace (M = 4.15, SD = 0.64). Additionally, a total of 84.4% of the respondents agreed that they were satisfied with their connections to nature or the ability to connect and feel nature at the workplace (M = 4.22, SD = 0.65). Almost 85.2% of the respondents agreed that they were satisfied with the seating arrangement in the workplace (M = 4.26, SD = 0.65). The collected responses also indicated that almost 82.6% of the respondents agreed that they were satisfied with the ability to adjust furniture to meet their workplace needs (M = 4.13, SD = 0.72). Additionally, almost 80% of the respondents were satisfied with the colors used in their workplace (M = 4.02, SD = 0.83). This study revealed that almost 78% of the respondents were satisfied with interior plants in the workplace (M = 3.90, SD = 0.91). The responses also indicated that almost 80.2% of the employees were satisfied with the overall temperature condition at the hospital. The dissatisfaction of 20% of employees must be considered by private hospitals to make working more comfortable and productive. Interestingly, the collected responses revealed that almost 57% of the employees were satisfied only with the indoor temperature during the winter (M = 2.88, SD = 1.66). In contrast, 57.4% of the employees were satisfied with the internal temperature (building or hospital) during the summer (M = 2.89, SD = 0.86). However, higher standard deviation values signify differences in opinion among the respondents. This study revealed that almost 60% of the employees were satisfied with sound or noise resilience and privacy (M = 3.01, SD = 0.99). However, a higher standard deviation signifies a difference in opinion. Notably, the statistical results also reveal that almost 69.4% of the respondents were satisfied with the air quality. This clearly indicates that hospitals must focus on ventilation and aeration aspects to preserve the health and hygiene concerns of employees (9 M = 3.47, SD = 1.02). The statistical outputs inferred that almost 86% of the respondents agreed that they were satisfied with the daylight condition at the workplace (m = 4.30, SD = 0.67). On the other hand, almost 86% of the employees agreed that they were satisfied with the artificial lights at the workplace (M = 4.30, SD = 0.57). A total of 65% of the respondents agreed that they were satisfied with the level of personal control of artificial lighting in the work area (M = 3.25, SD = 0.99). Similarly, a total of 60% of the employees stated that they were satisfied with the level of personal control over the heating or cooling equipment at the workplace or dedicated area (M = 3.00, SD = 0.99). However, a higher standard deviation indicates a difference in opinion.
5.3. Hypothesis Assessment
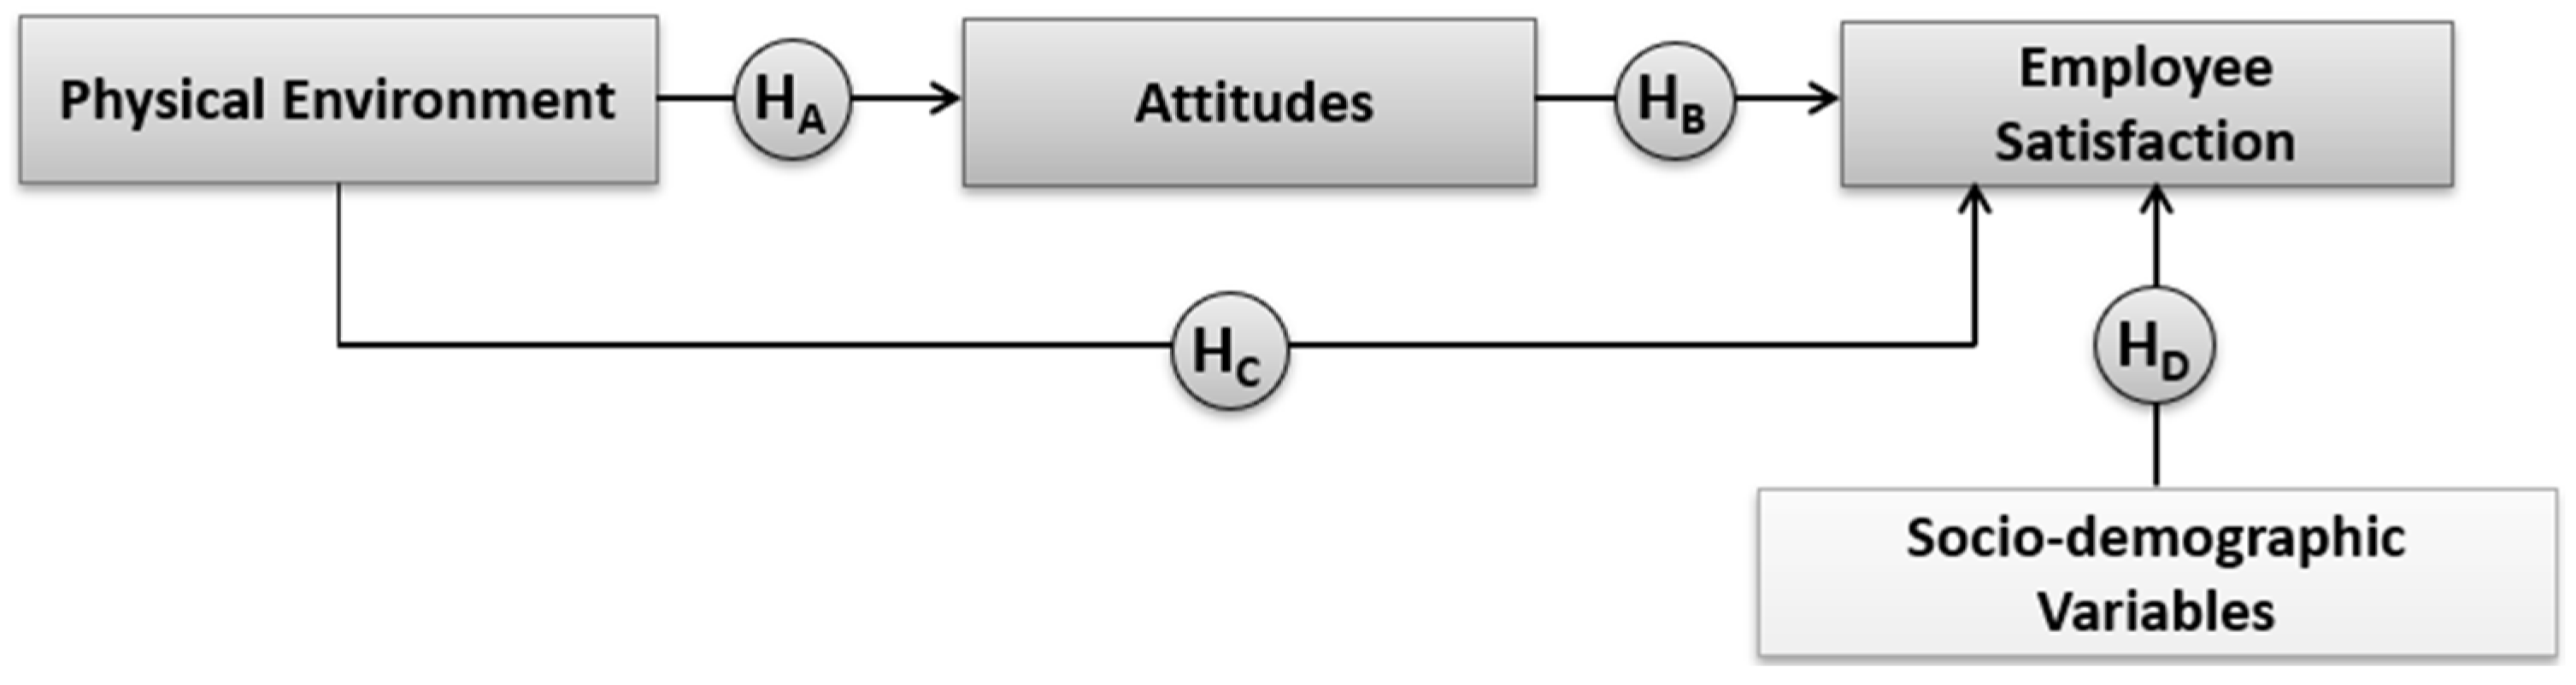
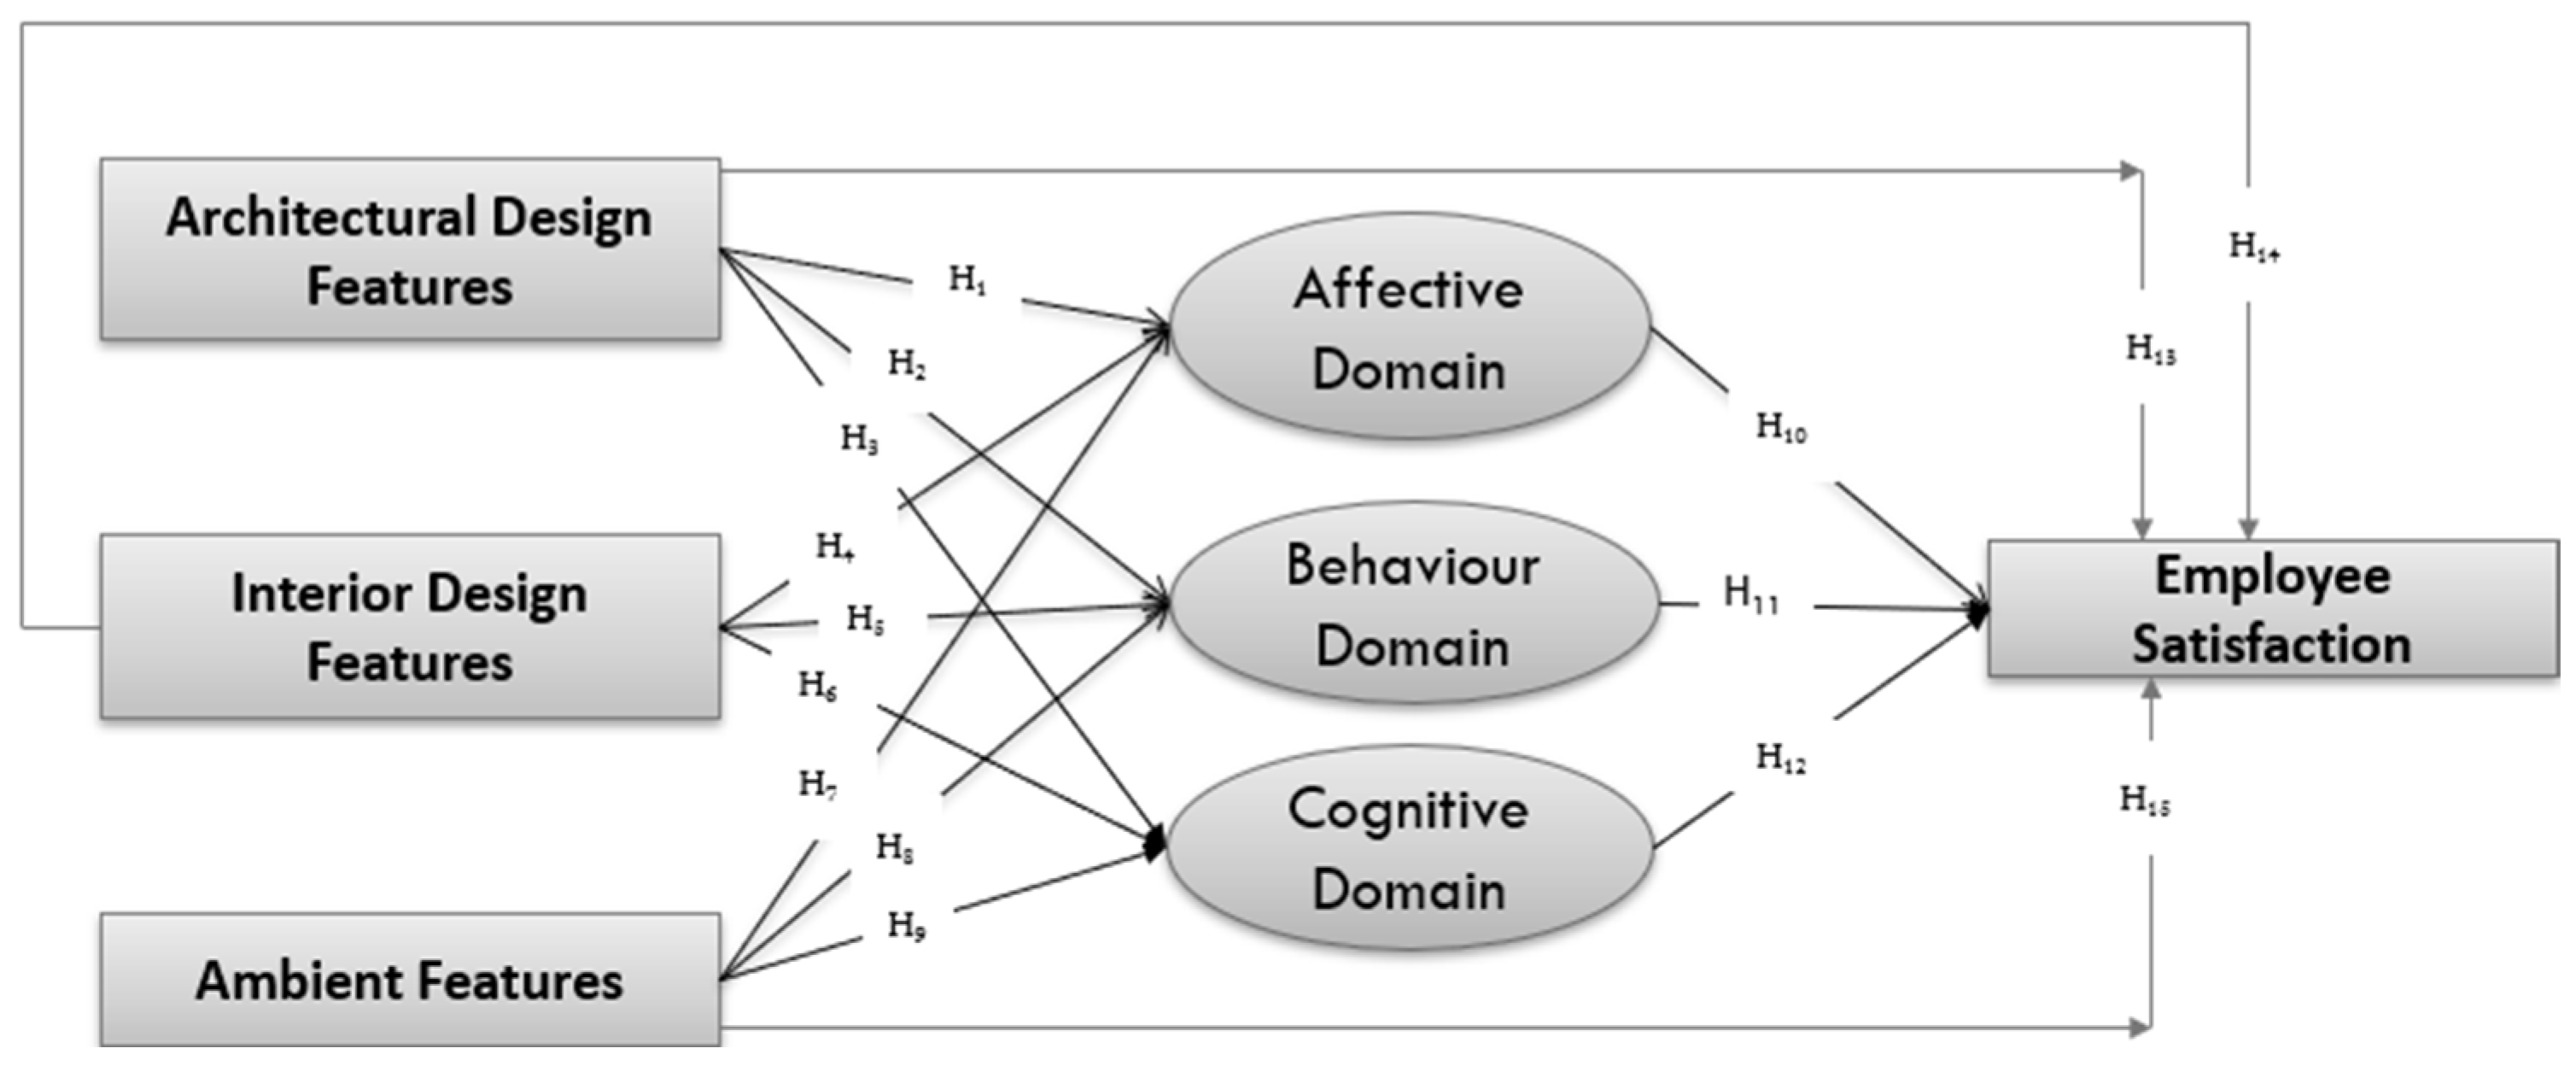
As discussed in the previous section, this study hypothesizes that the physical environment influences employees’ attitudes, which in turn affect their overall satisfaction (
Figure 1). To evaluate these relationships, bivariate correlation analyses were conducted between the relevant independent and dependent variables (
Figure 2). To examine the influence of the physical environment on employee attitudes, ADF, IDF, and AF were considered independent variables, whereas the attitudinal dimensions were treated as dependent variables. To assess the direct relationship between the physical environment and employee satisfaction, physical-environment parameters (ADF, IDF, and AF) were used as independent variables, with SAT as the dependent variable. Additionally, to test whether employees’ attitudes influence their satisfaction, the attitude constructs (AFF, BEH, and COG) were considered independent variables, and satisfaction (SAT) was the dependent variable. Pearson correlation coefficients were computed, and significance was evaluated at the 0.05 level. A
p value less than or equal to 0.05 was considered statistically significant, indicating support for the alternative hypothesis. The correlation coefficients and associated
p values are presented in the following tables.
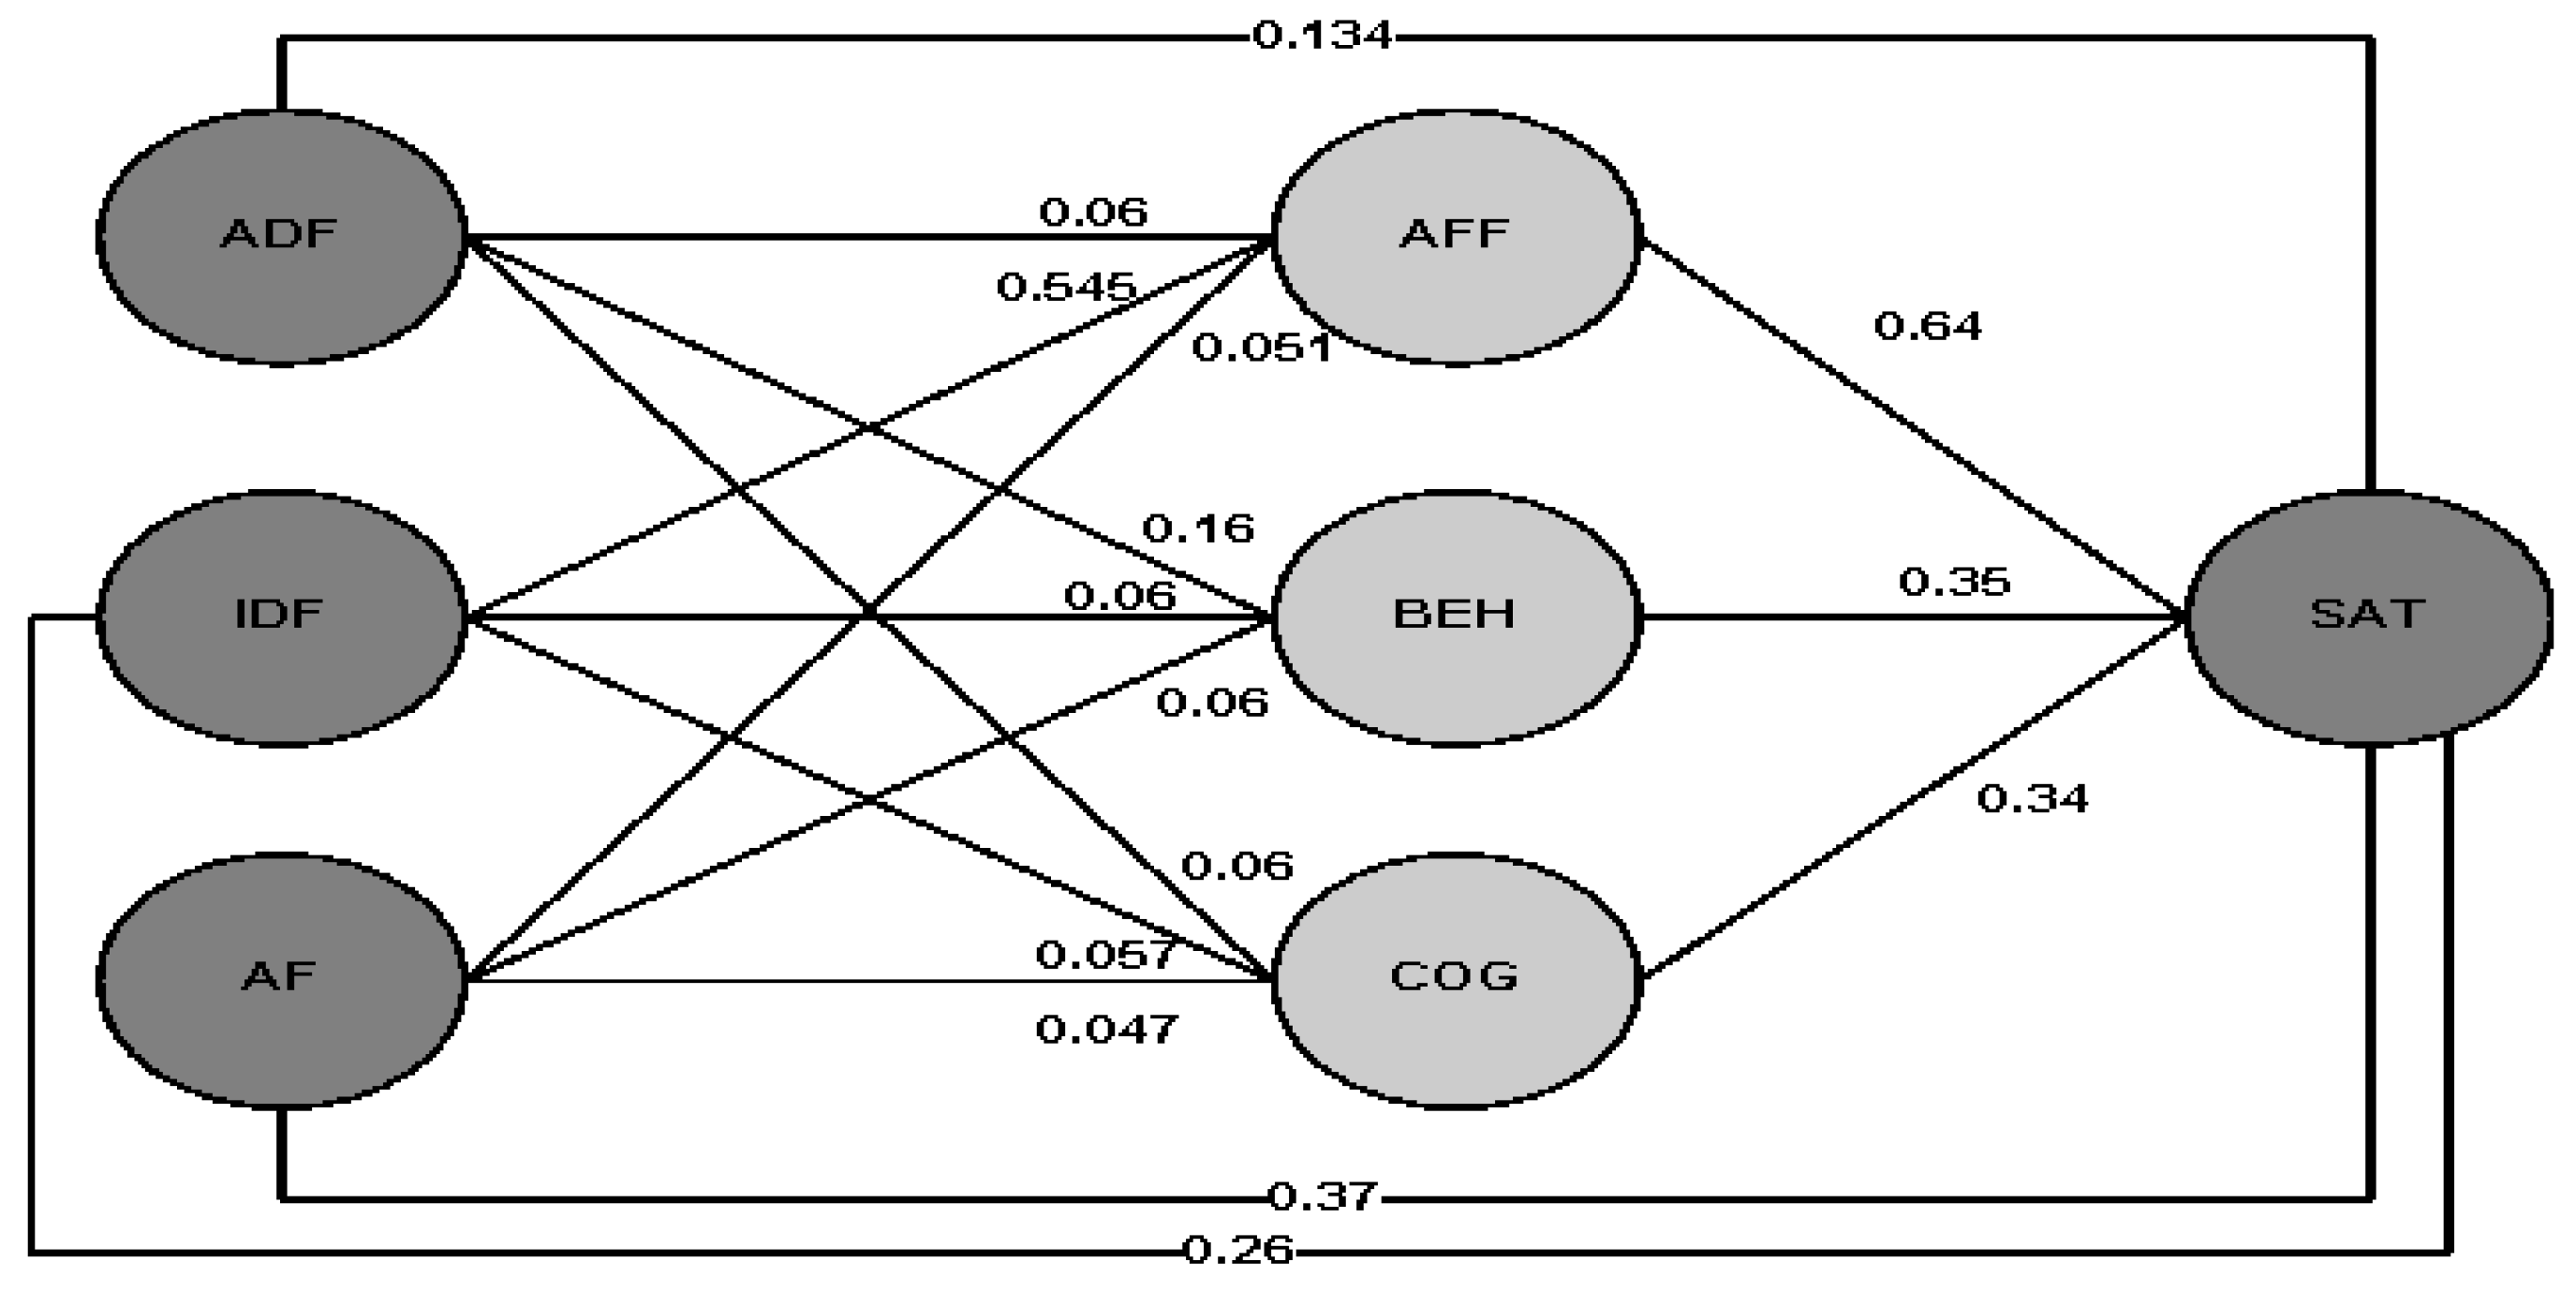
Table 6 presents the results of the Pearson correlation analysis between ADF and the components of employee attitudes. The analysis indicates that the
p value for the relationship between ADF and the affective component is 0.06, which exceeds the significance threshold of 0.05. Although not statistically significant, this finding suggests a potential significant association that may warrant further investigation.
The correlation between ADF and the behavioral component yields a coefficient of 0.1653, which is statistically significant, indicating a meaningful relationship between architectural features and employees’ behavioral attitudes. Similarly, the p value for the relationship between ADF and the cognitive component is also 0.06, which is slightly above the 0.05 threshold. While not significant, this again suggests a possible association.
In summary, the findings point to a noteworthy relationship between ADF and employees’ attitudinal dimensions, particularly behavioral responses. On the basis of these results, the null hypothesis can be rejected in favor of the alternative hypothesis that architectural design features are related to employee attitudes.
H1: There is a relationship between ADF and the affective domain.
H2: There is a relationship between ADF and behavior domains.
H3: There is a relationship between ADF and the cognitive domain.
Table 7 presents the Pearson correlation results between IDF and the employee attitude constructs. The correlation analysis revealed that the
p value for the relationship between IDF and AFF was 0.0545, whereas the
p values for IDF and BEH and IDF and COG were 0.06 and 0.057, respectively. Although the
p-values exceed the 0.05 threshold, indicating a lack of statistical significance, the results suggest weak positive associations between IDF and the corresponding attitudinal components. The findings imply that interior design features, such as personalized or manually adjustable furniture, may not have a significant effect on employees’ affective or cognitive responses. However, a relatively stronger relationship is observed between IDF and the behavioral component, indicating that interior elements might influence how employees act or respond within their work environment. Nonetheless, the results suggest that user-specific furniture design and adjustment do not significantly shape affective or cognitive decision-making processes. The results reject the null hypothesis and accept the following:
H4: There is a relationship between IDF and the affective domain.
H5: There is a relationship between the IDF and behavior domains.
H6: There is a relationship between IDF and the cognitive domain.
Table 8 presents the Pearson correlation results between ambient features (AFs) and employee attitude components, including affective (AFF), behavioral (BEH), and cognitive (COG) domains. The
p value for the correlation between AF and AFF was found to be 0.051, which is marginally above the conventional significance threshold (
p = 0.05). While this suggests a potential relationship, the association cannot be deemed strong or conclusive. Nonetheless, on the basis of the defined criteria, the null hypothesis is rejected, supporting the hypothesis that ambient features are related to the affective component of employee attitudes.
Similarly, the p value for the correlation between AF and BEH was 0.06, indicating a weak positive association that slightly exceeded the significance threshold. Although not statistically significant, the results provide partial support for a relationship between ambient features and the behavioral responses of employees. In contrast, the p value between AF and COG was less than 0.05, indicating a statistically significant result. However, this contradicts the hypothesized direction of the relationship. As a result, the null hypothesis is accepted, suggesting that ambient features do not exhibit a clear or consistent association with the cognitive components of employee attitudes. These findings collectively highlight the nuanced influence of ambient environmental features on different attitudinal domains. The results confirm the following hypotheses:
H7: There is a relationship between AF and the affective domain.
H8: There is a relationship between AF and behavior domains.
H9: There is no relationship between AF and the cognitive domain.
To assess whether employee attitudes are related to employee satisfaction, correlation coefficients were obtained between AFF, BEH, and COG, and SAT. Notably, AFF, BEH, and COG are considered the independent variables, whereas SAT is considered the dependent variable.
As shown in
Table 9, the Pearson correlation coefficient between the affective component and satisfaction was 0.64, which is significantly above the threshold for statistical significance (
p = 0.05). This finding indicates a significant relationship between affective attitudes and employee satisfaction. The two-tailed significance value further supports this association, confirming the hypothesis that affective components are significantly associated with satisfaction. Similarly, the correlation coefficient between the behavioral component and employee satisfaction was 0.35, exceeding the level of significance. The analysis revealed a statistically significant positive correlation between behavioral attitudes and employee satisfaction in the hospital setting. The cognitive component exhibited a statistically significant correlation coefficient of 0.34 with employee satisfaction, which exceeds the significance threshold. This suggests a positive, although moderate, relationship between cognitive attitudes and employee satisfaction among hospital employees.
On the basis of these results, the following hypotheses regarding the relationship between attitudinal components and employee satisfaction are supported.
H10: There is a relationship between the affective domain and employee satisfaction.
H11: There is a relationship between the behavior domain and employee satisfaction.
H12: There is a relationship between the cognitive domain and employee satisfaction.
The Pearson correlation coefficient between ADF and employee satisfaction was found to be 0.134, which exceeds the threshold for statistical significance (
p = 0.05). This result supports the rejection of the null hypothesis and confirms the existence of a statistically significant relationship between architectural design features and employee satisfaction. Similarly, the correlation between interior design features (IDFs) and satisfaction was measured at 0.26, which is also above the significance level. This outcome indicates a positive association between interior design features and employee satisfaction. These findings are further validated by the two-tailed significance values presented in
Table 10. The average Pearson correlation coefficient between ambient features (AFs) and employee satisfaction (SAT) was 0.37, which is above the defined level of significance (
p = 0.05), thereby supporting the rejection of the null hypothesis. This confirms the statistically significant relationship between ambient features and employee satisfaction. These statistical results support the following hypotheses:
H13: There is a relationship between ADF and employee satisfaction.
H14: There is a relationship between IDF and employee satisfaction.
H15: There is a relationship between AF and employee satisfaction.
The Pearson correlation results among the key parameters, namely, the physical environment, mediating attitudinal components, and employee satisfaction, are illustrated in
Figure 3. On the basis of these findings, it can be inferred that optimizing the physical environment in hospital settings has the potential to positively influence employee attitudes, which in turn influences overall satisfaction with the work environment. Such improvements may contribute to satisfaction, which results in reduced staff attrition, increased productivity, and better organizational performance.


 ,
, 
