
Optimization Analysis of Kitchen Cooking Environment for Air Conditioning Range Hood Based on Thermal Comfort and PM10 Concentration

Abstract
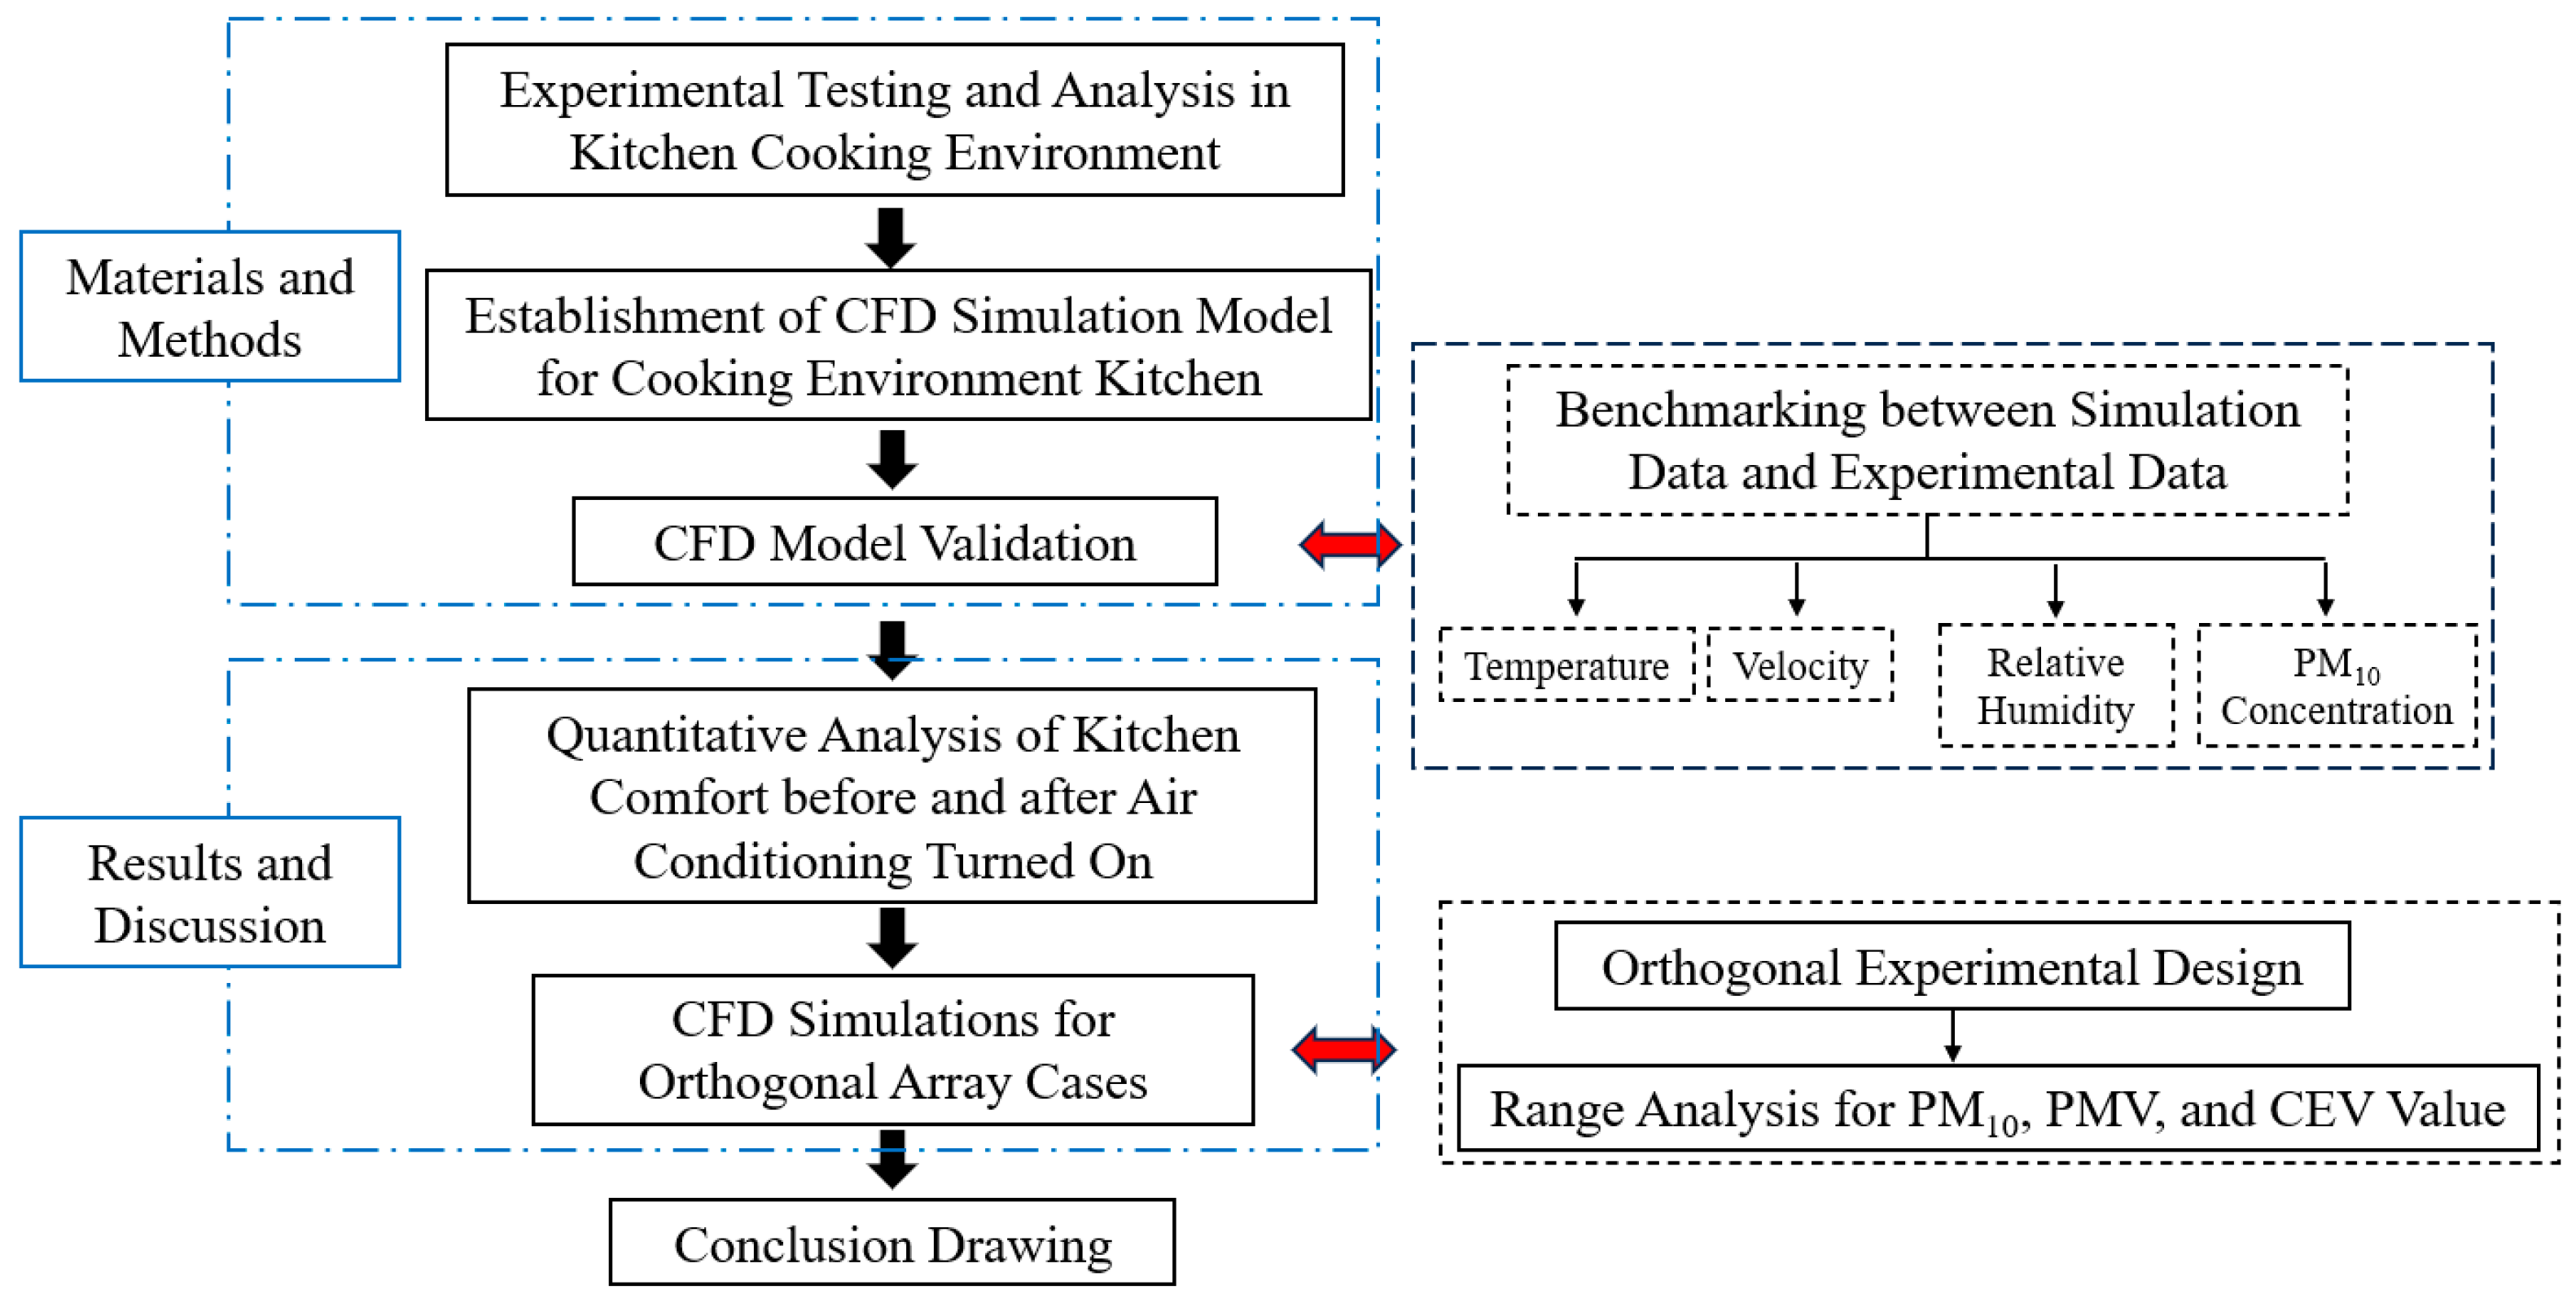
1. Introduction
2. Theoretical Analysis
2.1. Mathematical Model [23]
2.1.1. Continuity Equation
2.1.2. Conservation Equation of Momentum
2.1.3. Energy Conservation Equation
2.2. Particle Trajectory Model
2.3. PMV Index
3. Experimental Testing of Kitchen Cooking Environment
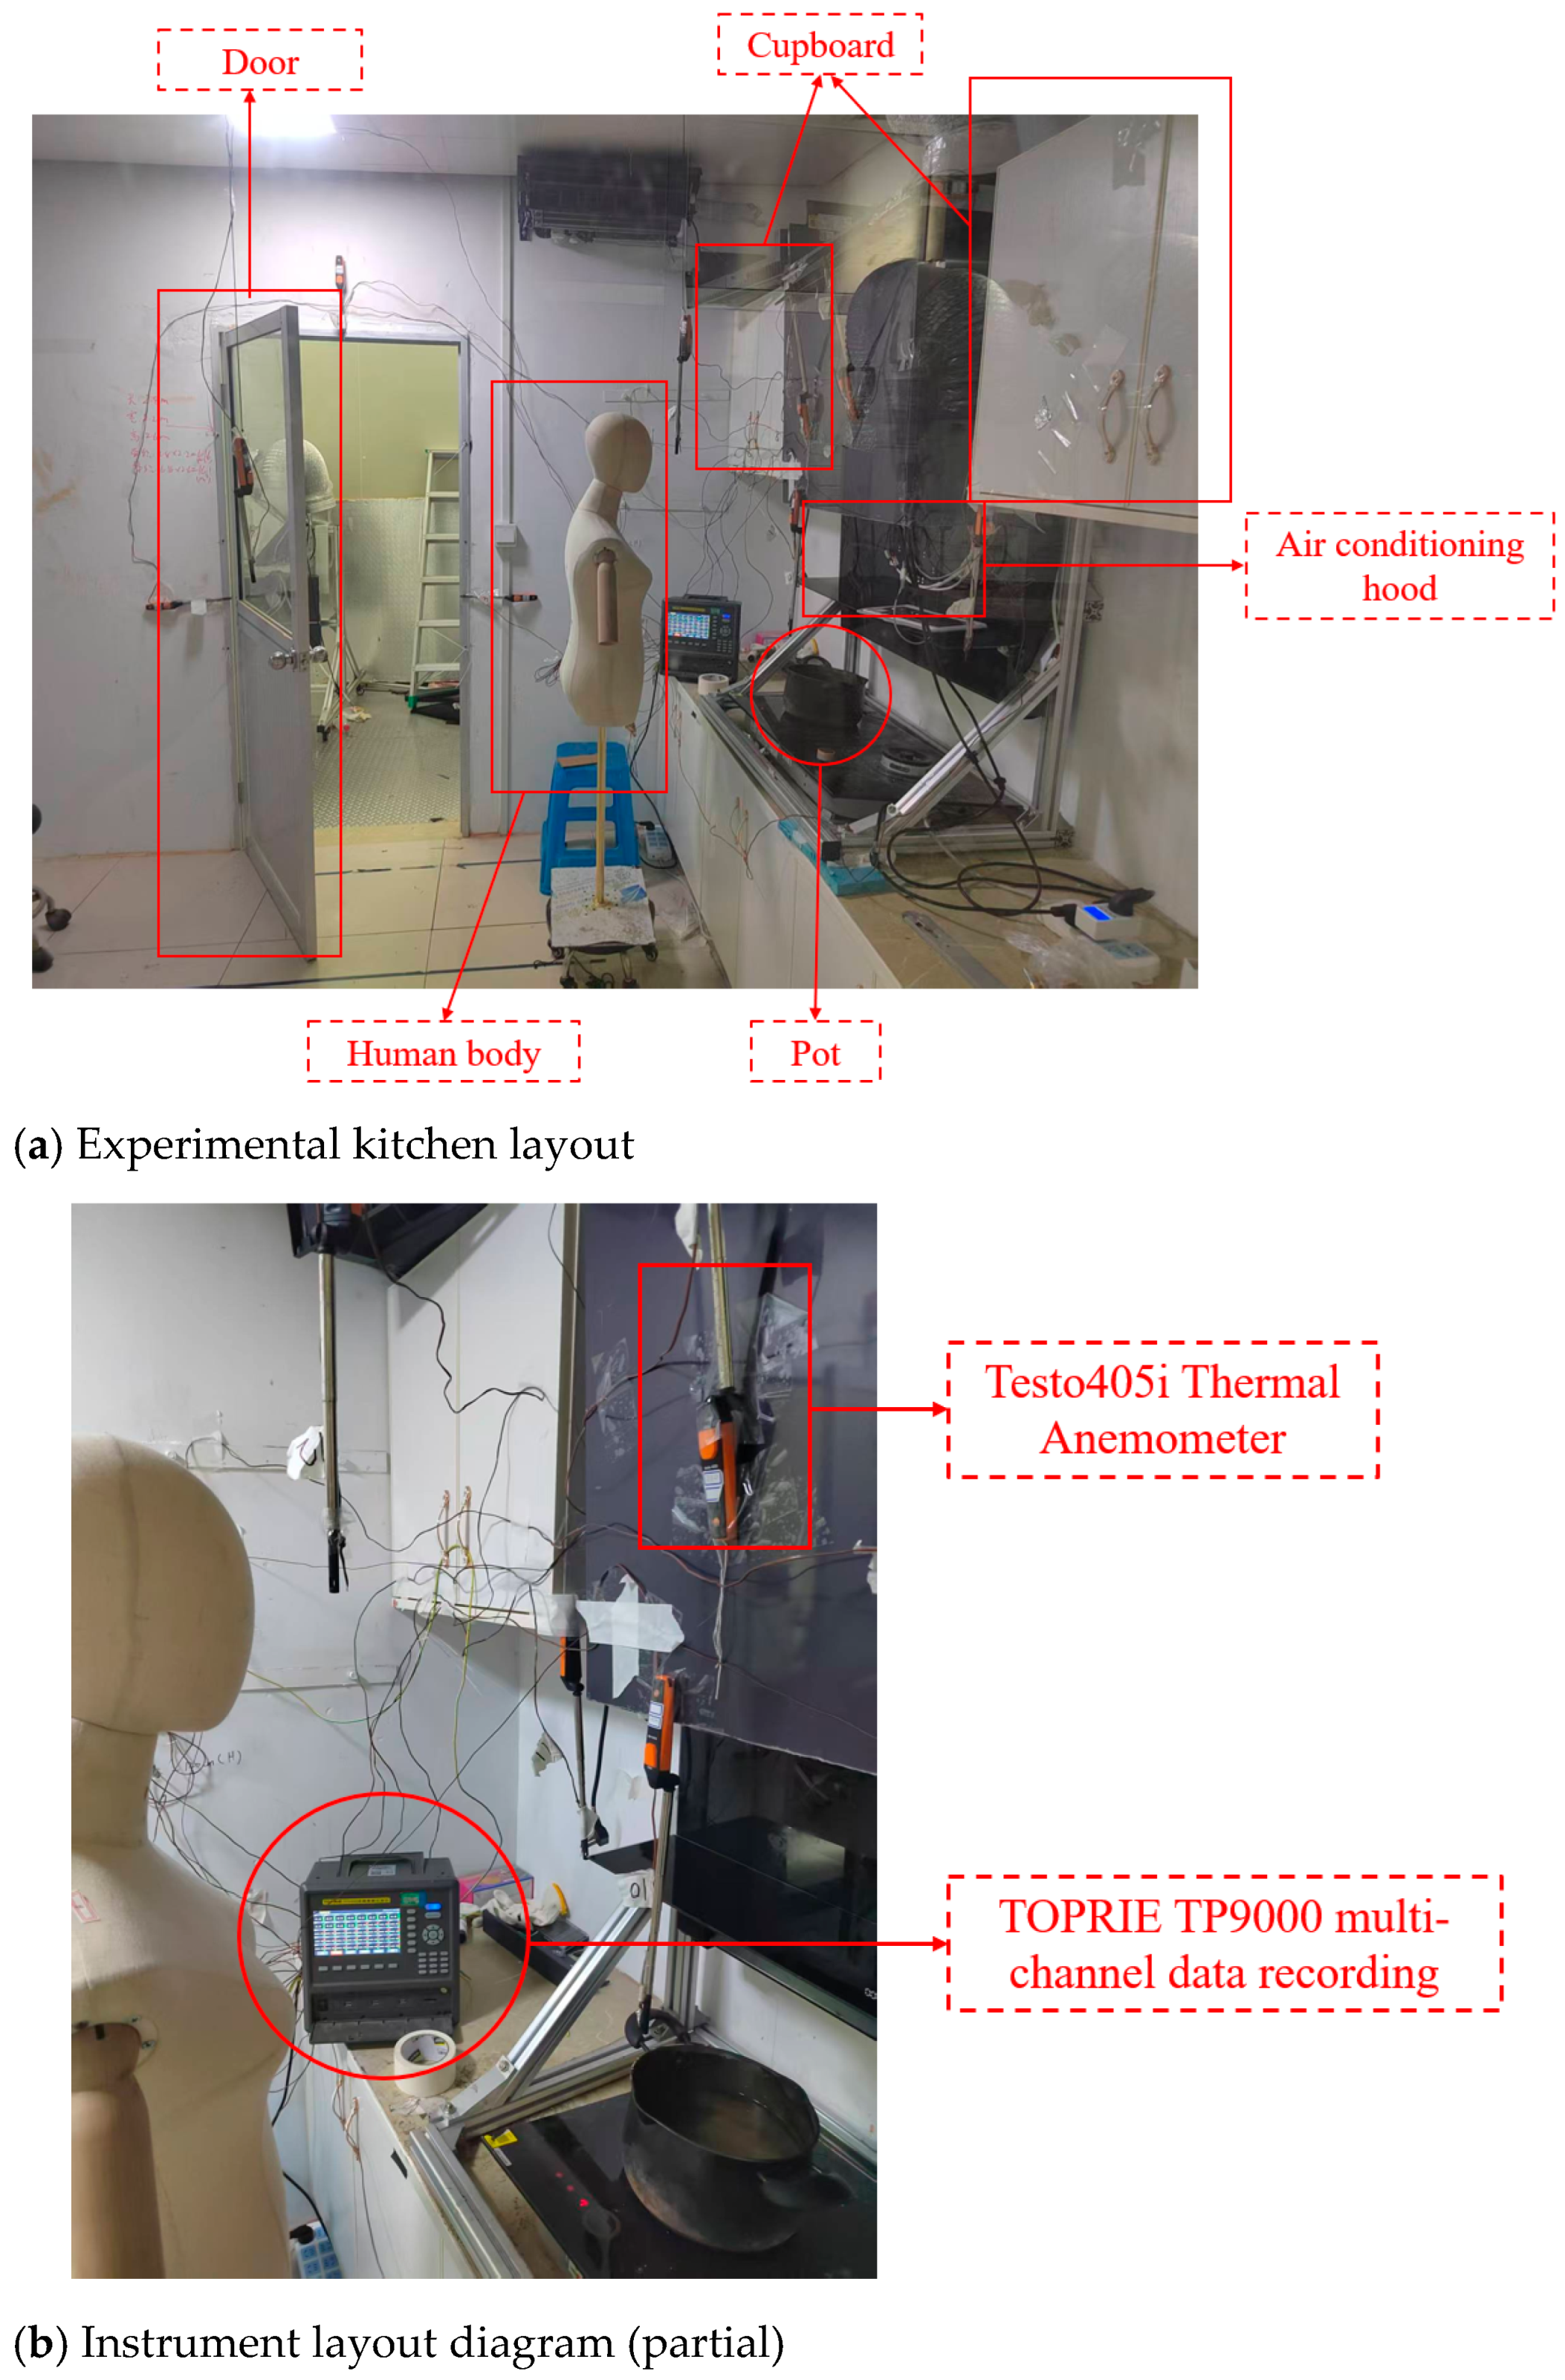
3.1. Establishment of Cooking Test Platform
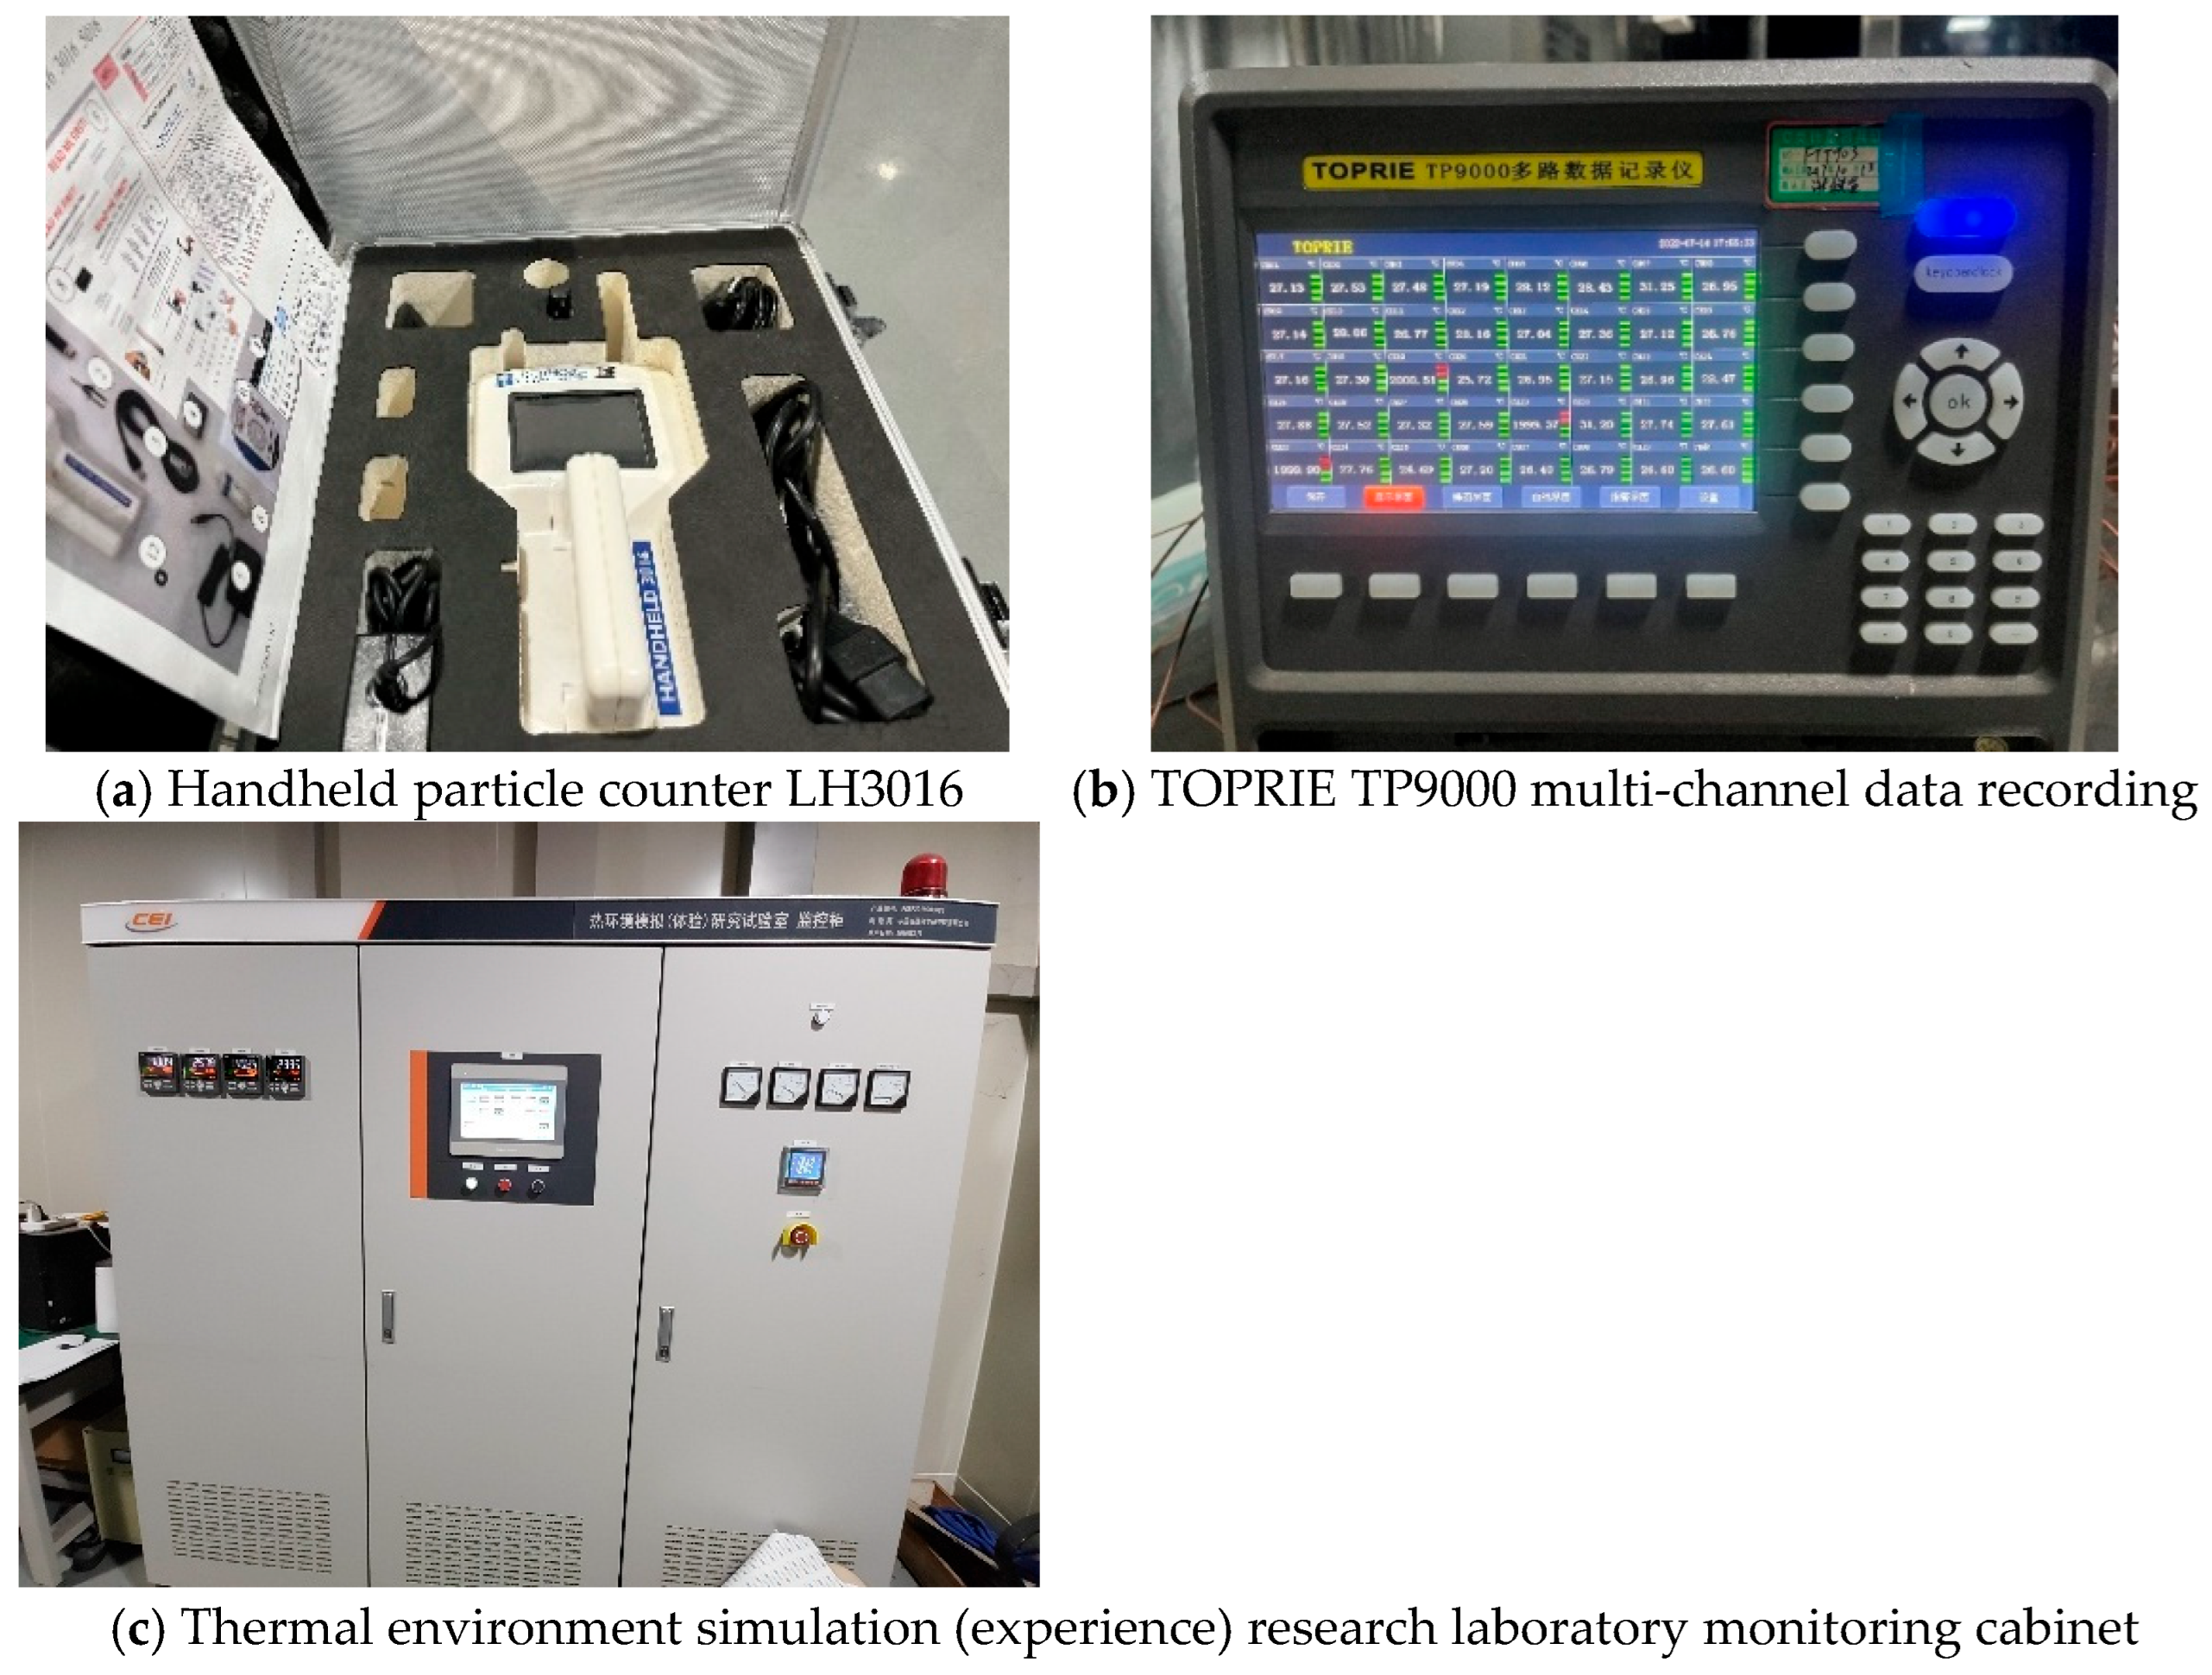
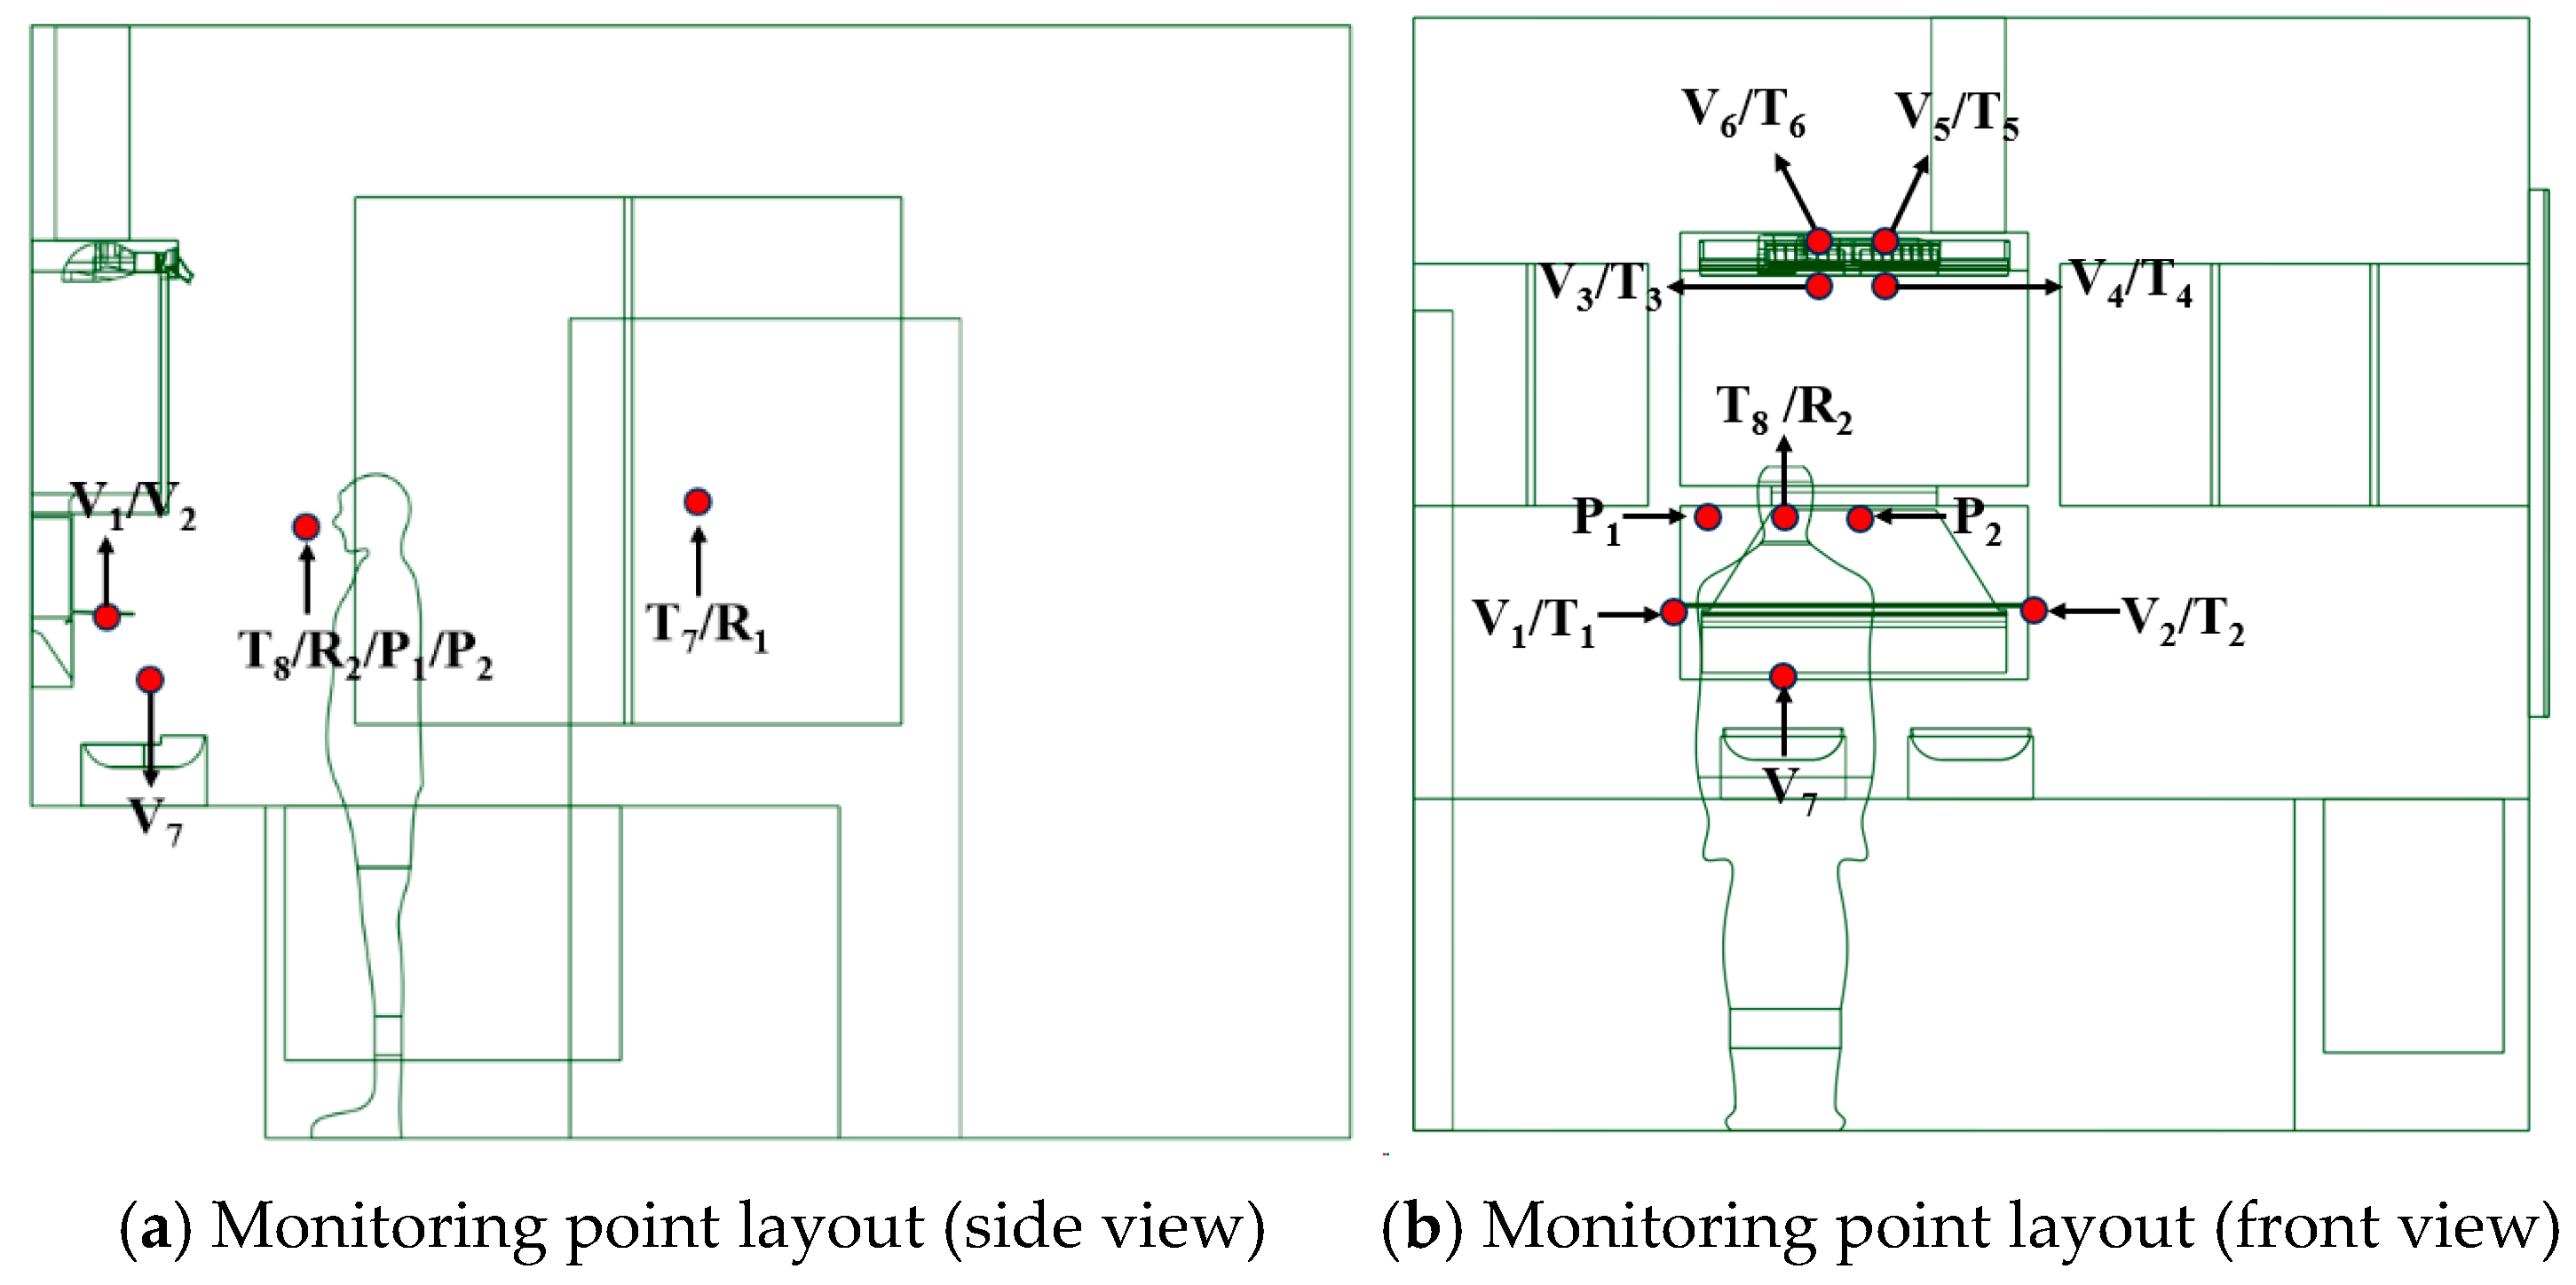
3.2. Instrument Selection and Measurement Point Layout
3.3. Kitchen Experimental Testing Procedure
4. Establishment of CFD Model for Kitchen Cooking Environment
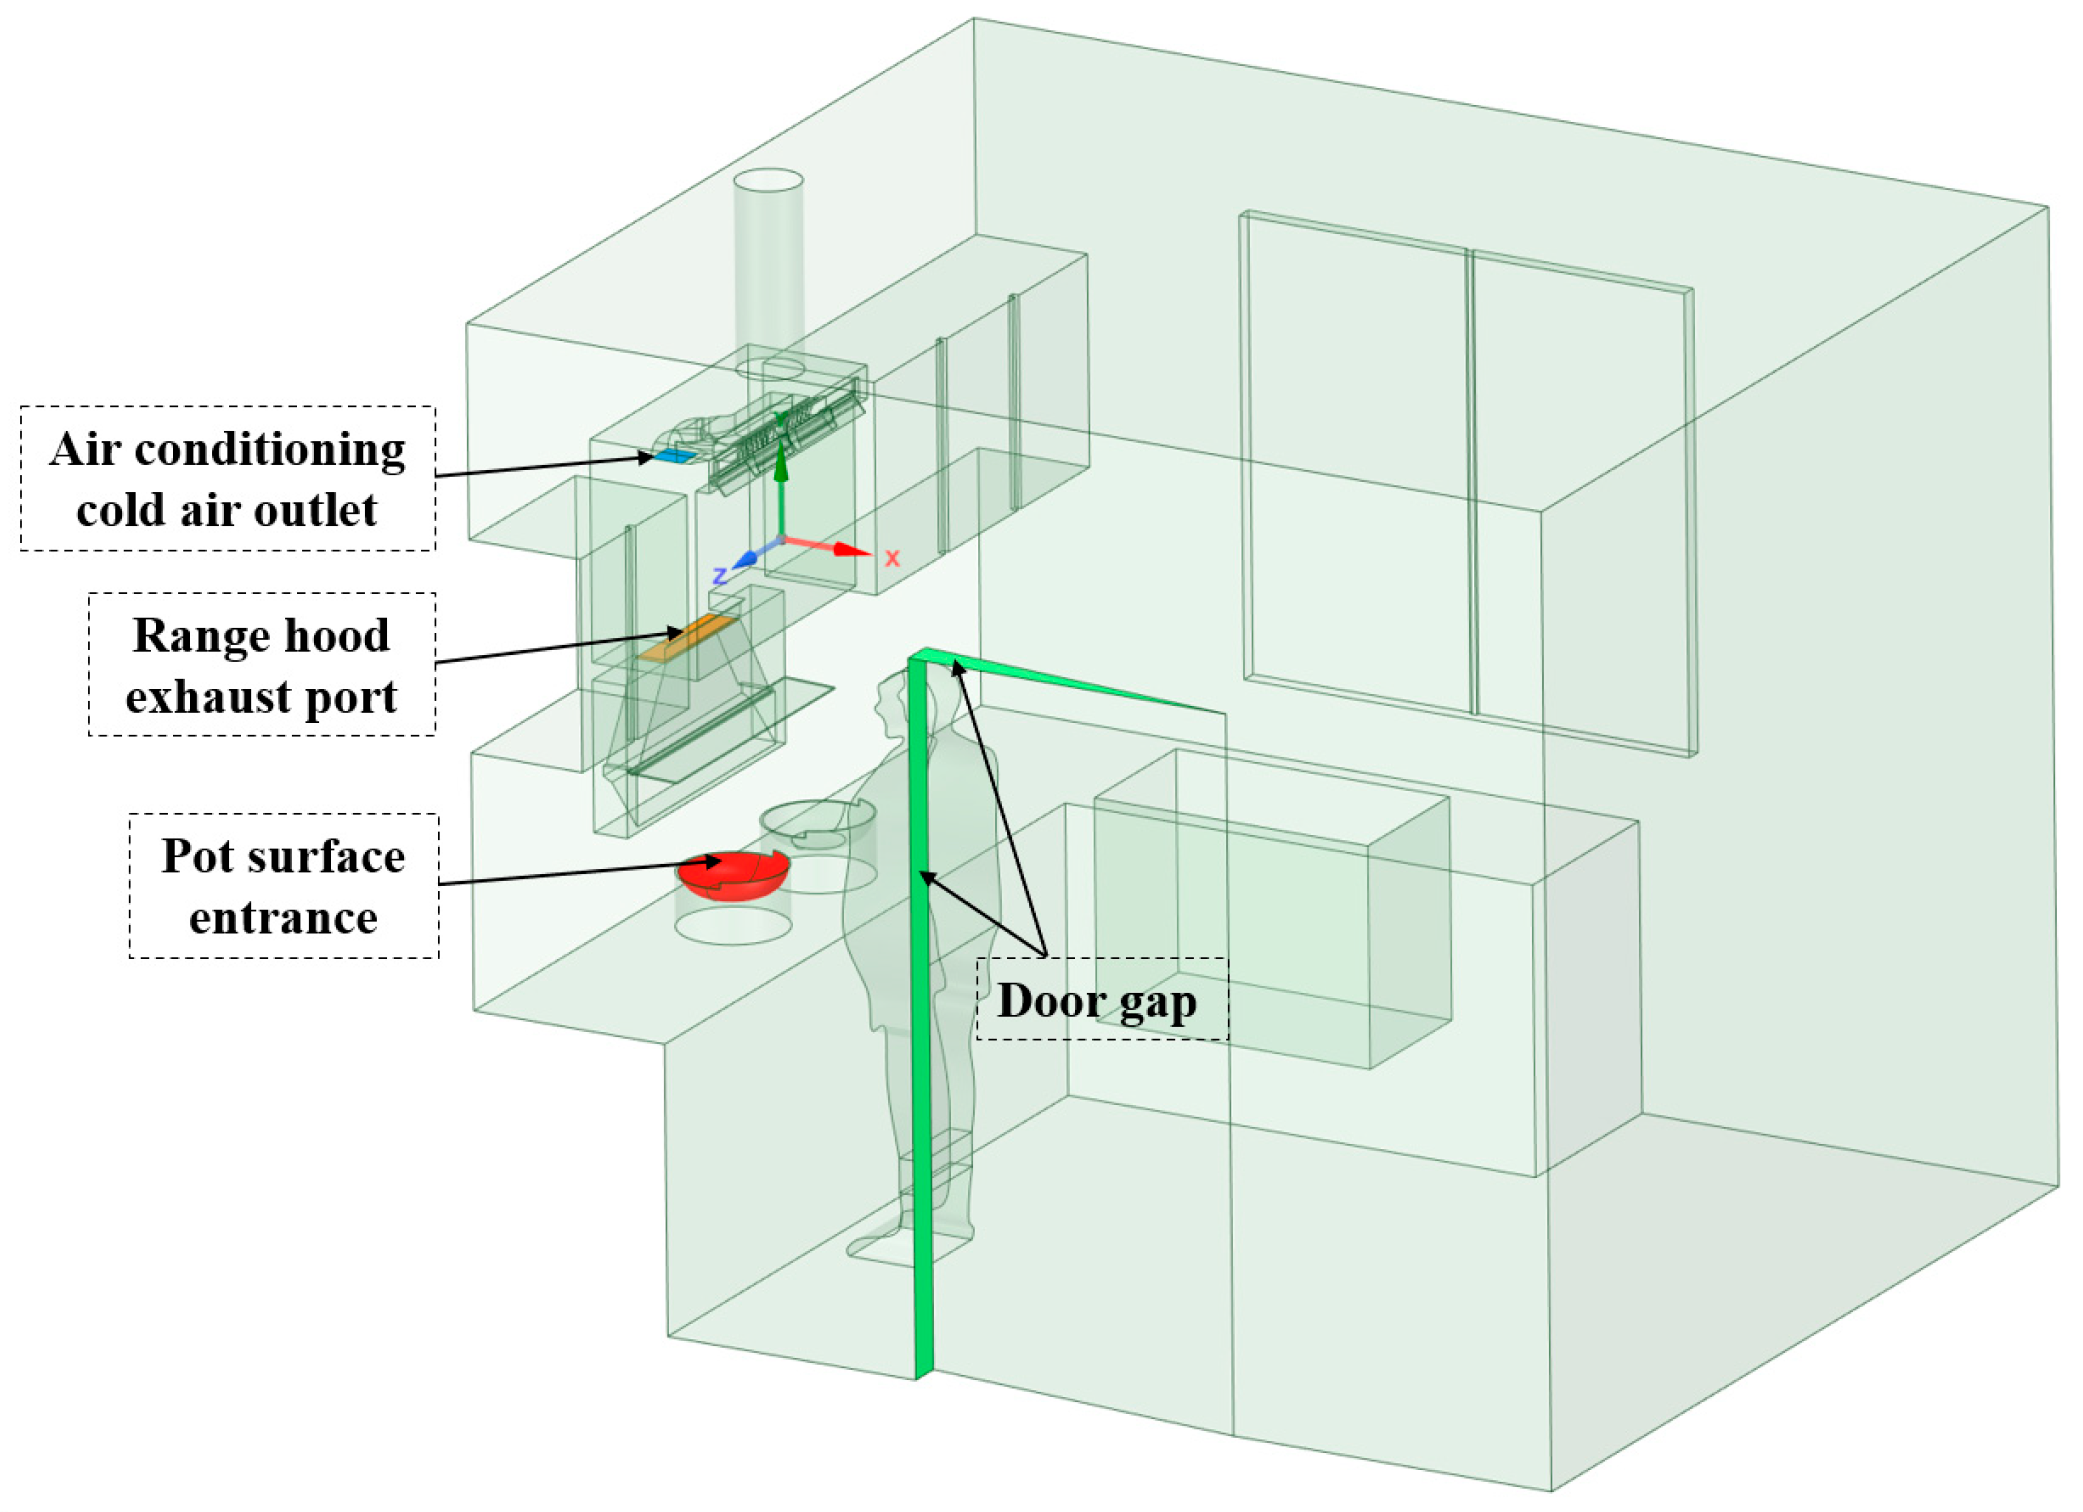
4.1. Geometric Model of Kitchen Cooking Environment
4.2. Physical Model and Boundary Conditions
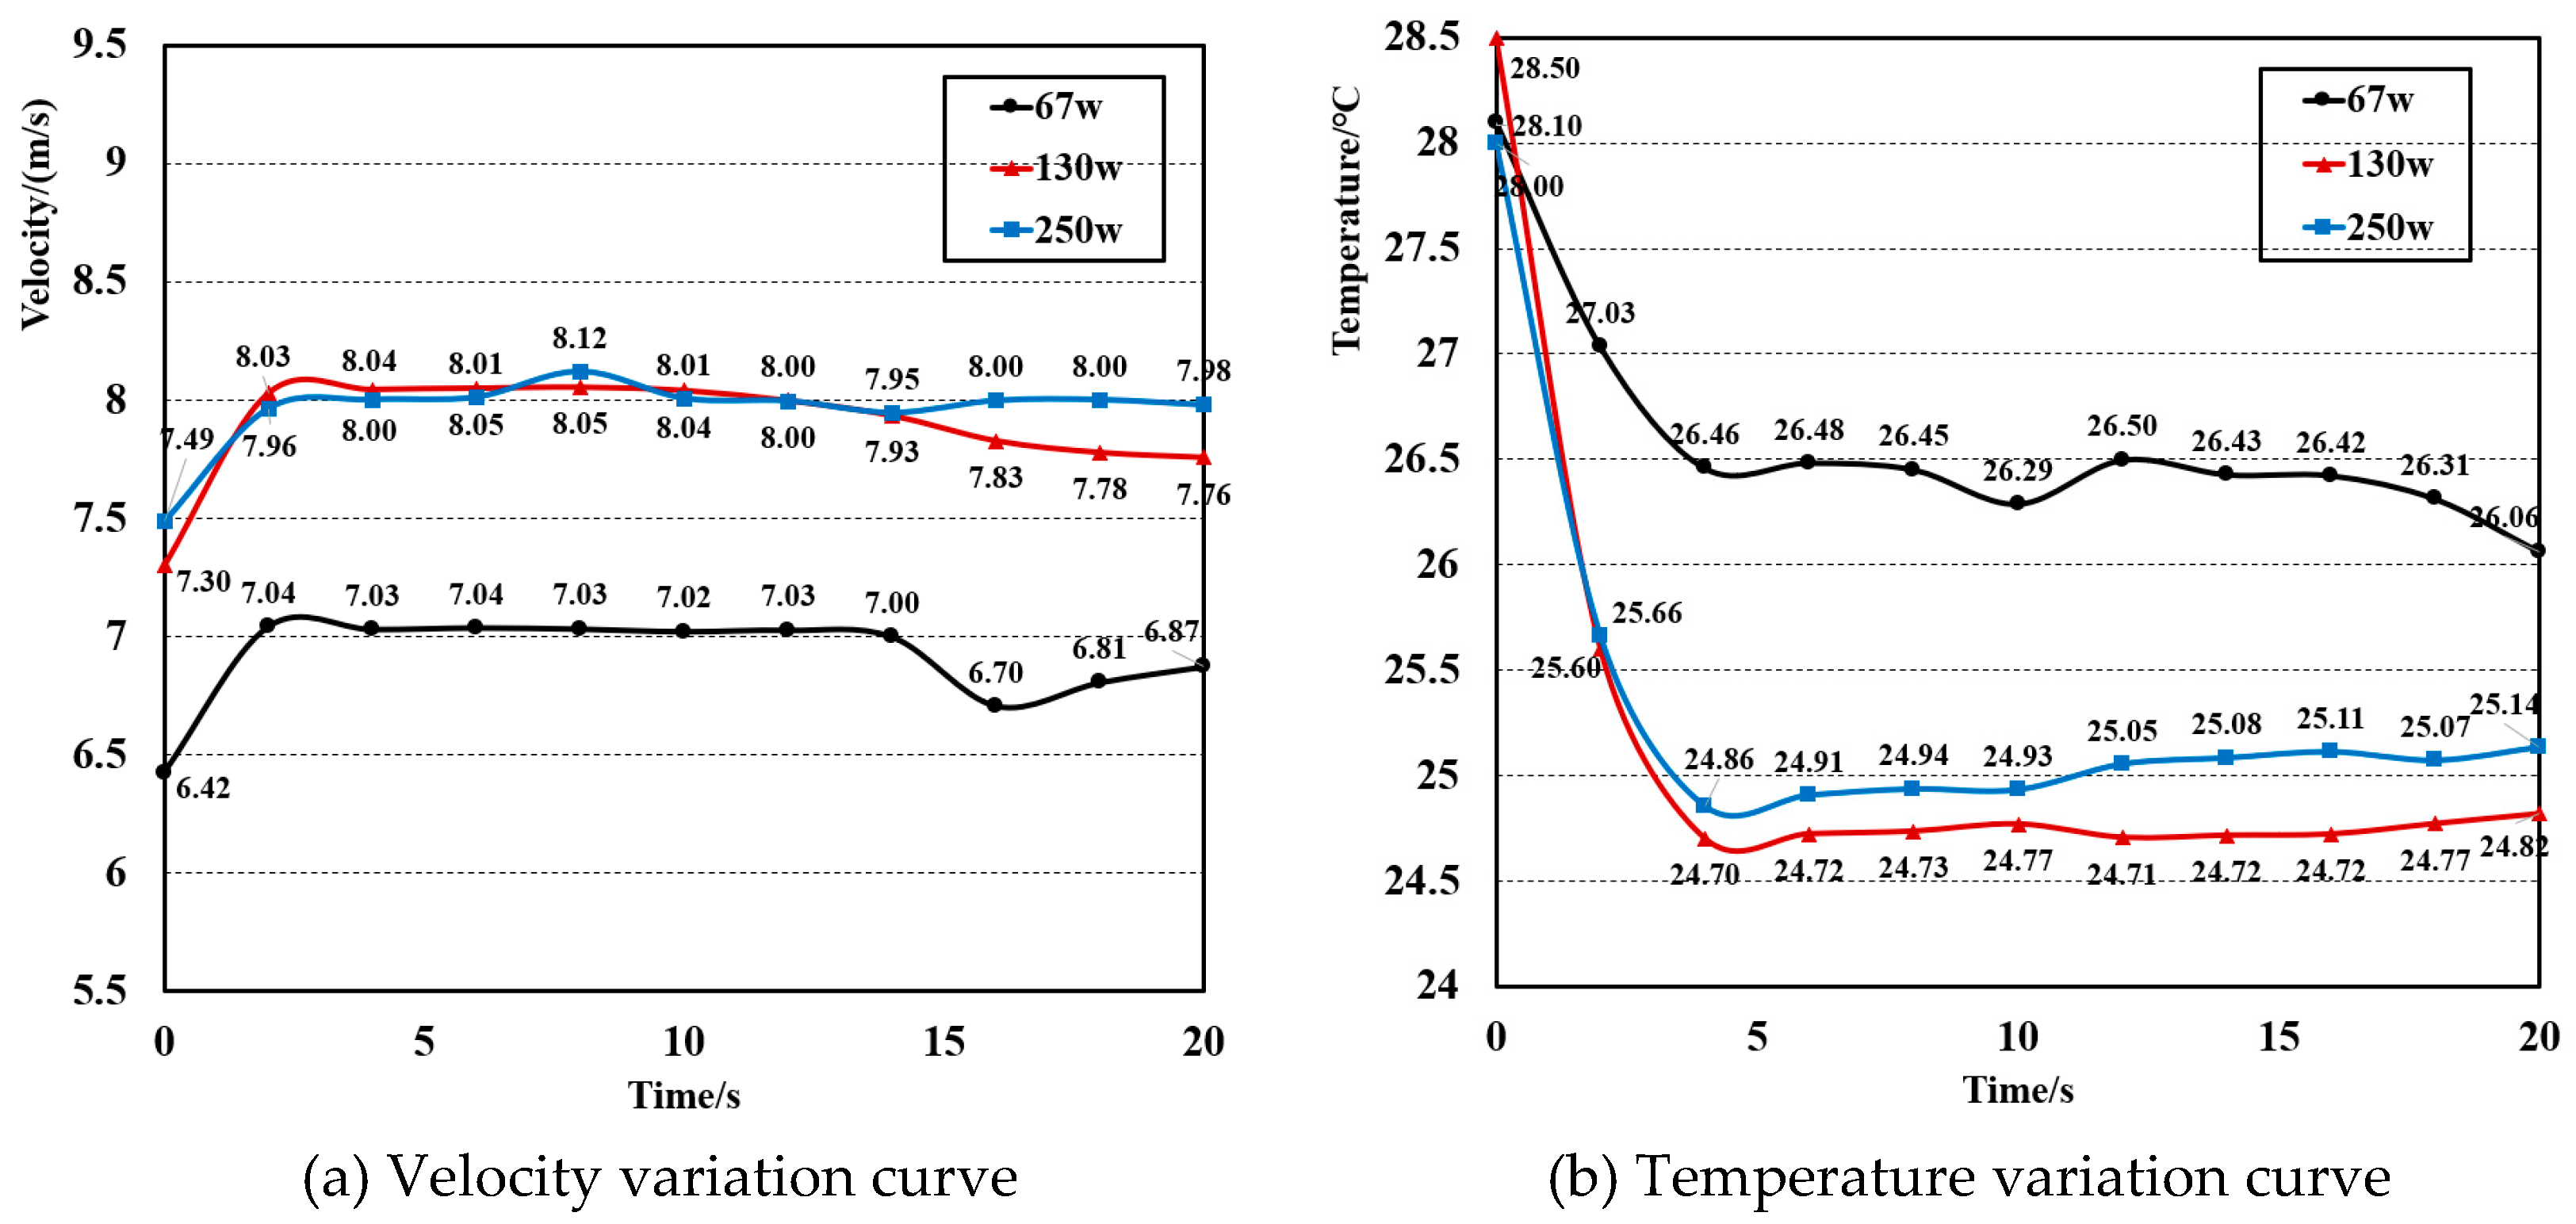
4.3. Mesh Generation and Convergence Analysis
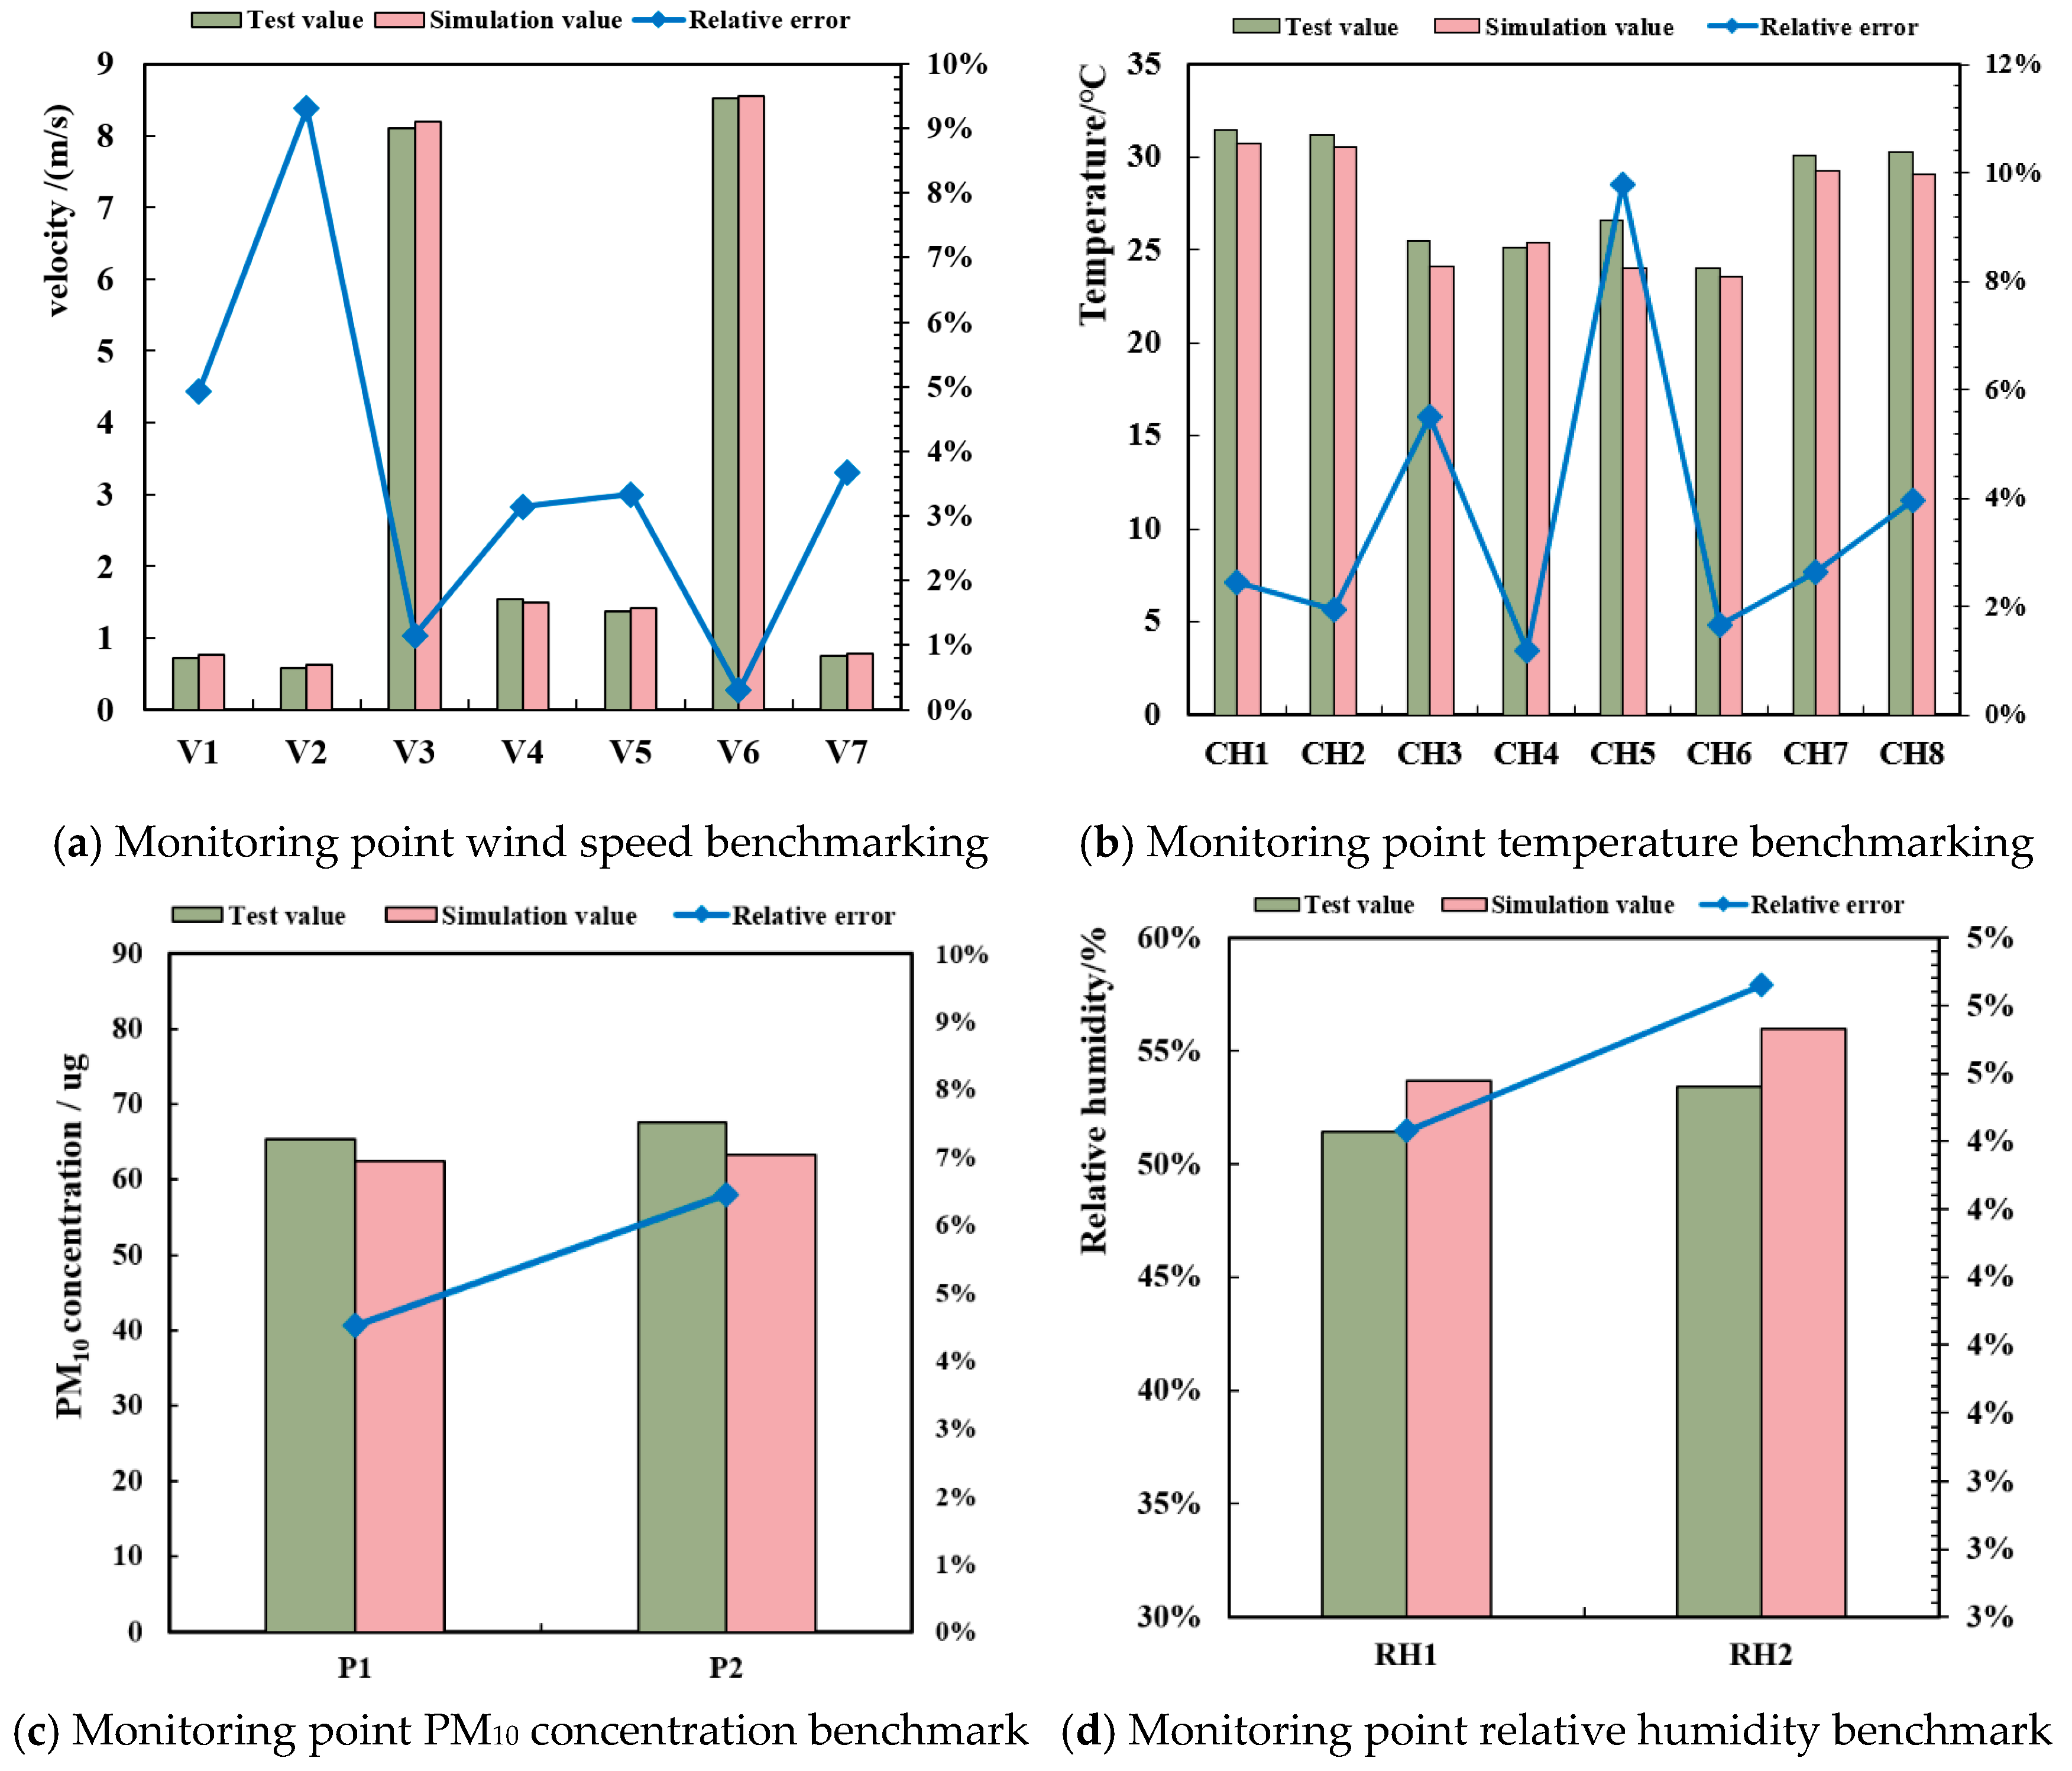
4.4. Verification of Numerical Simulation Results
5. Quantitative Analysis of Kitchen Comfort Before and After Air Conditioning Operation
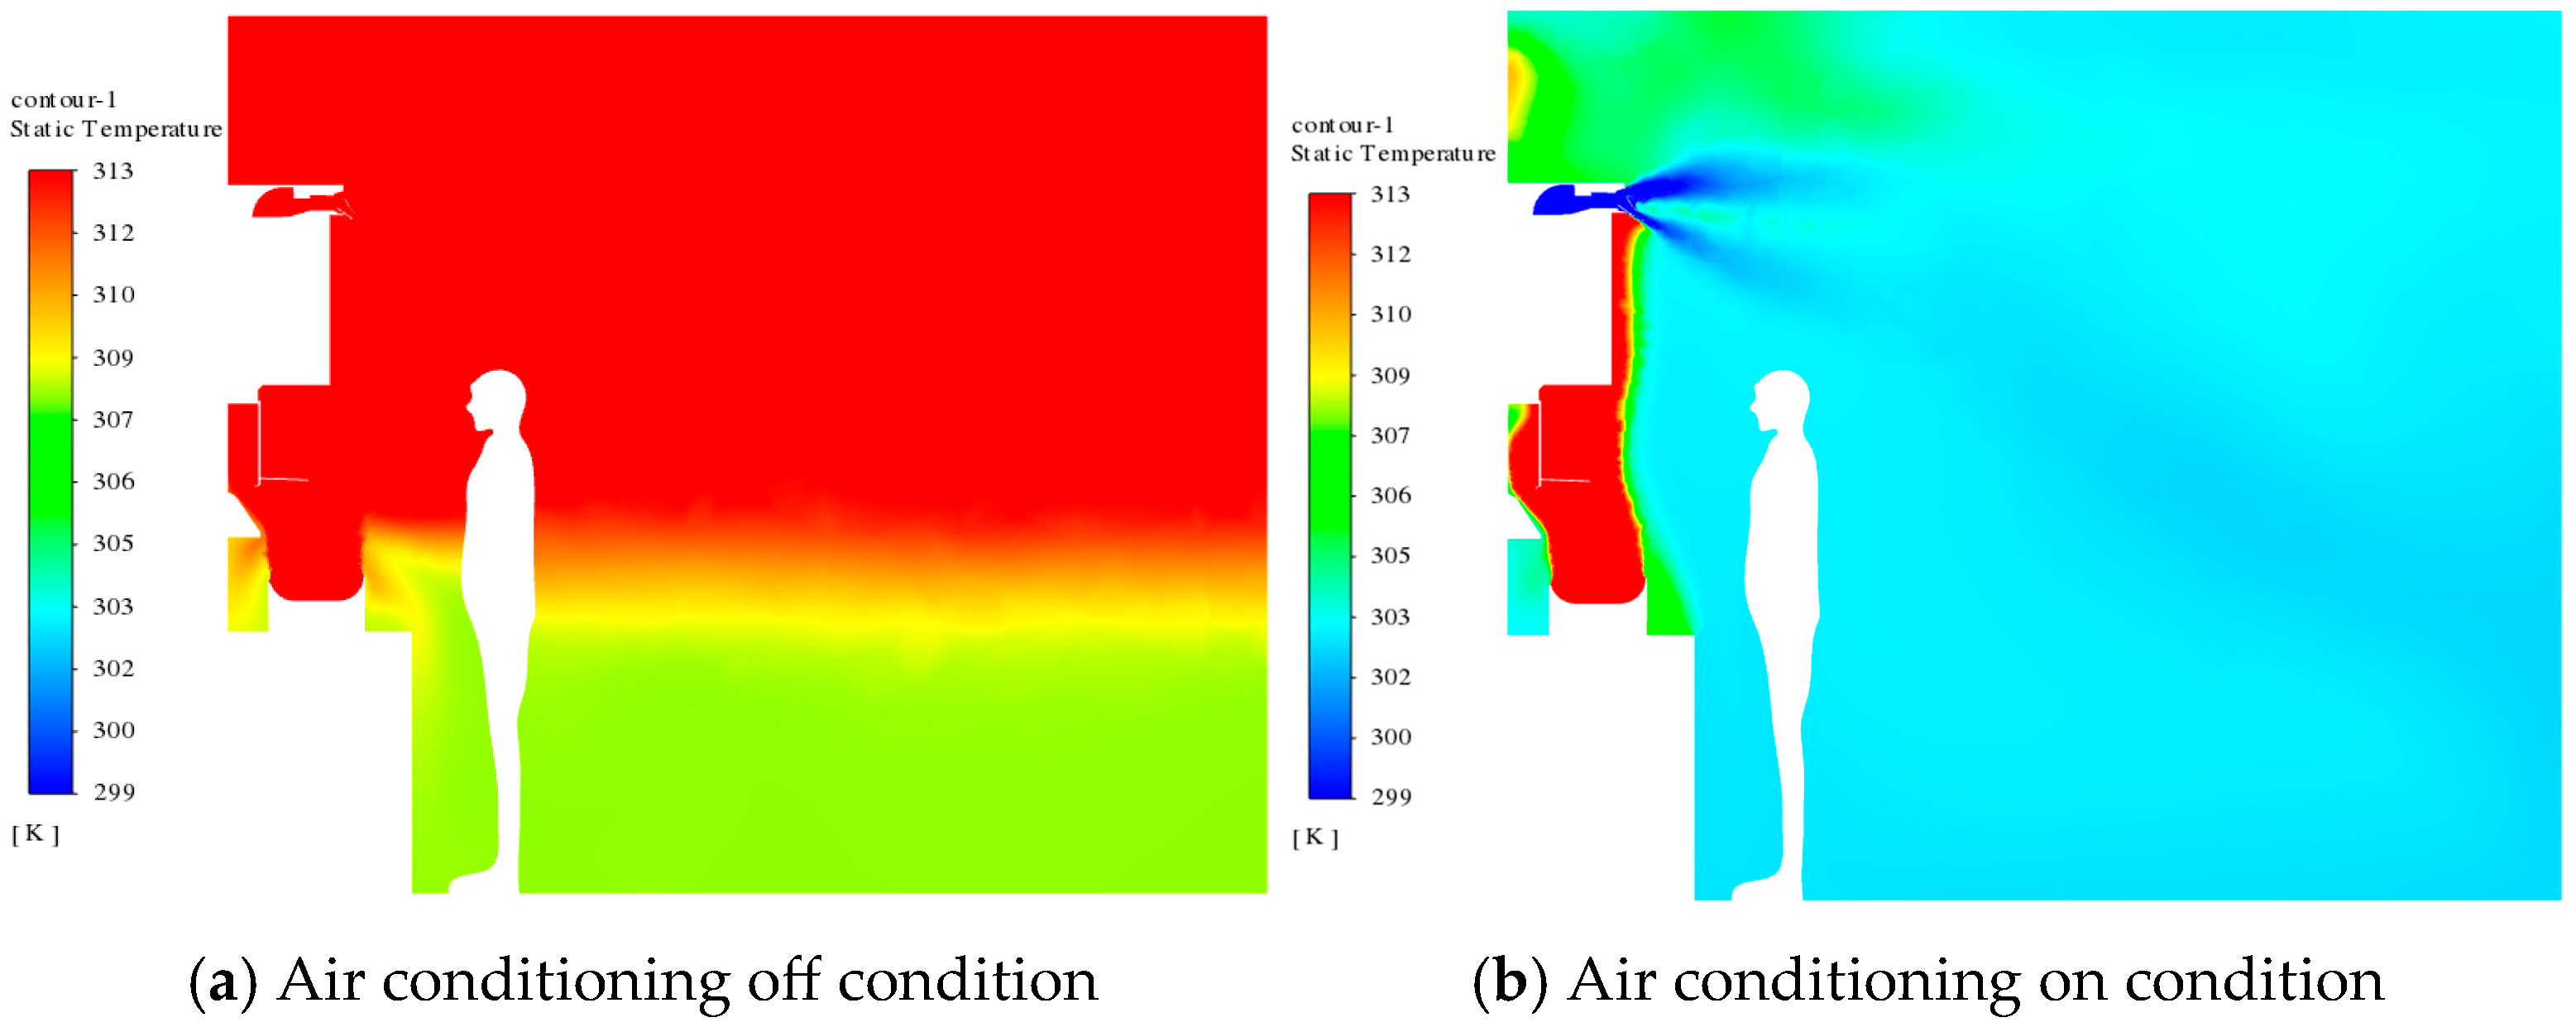
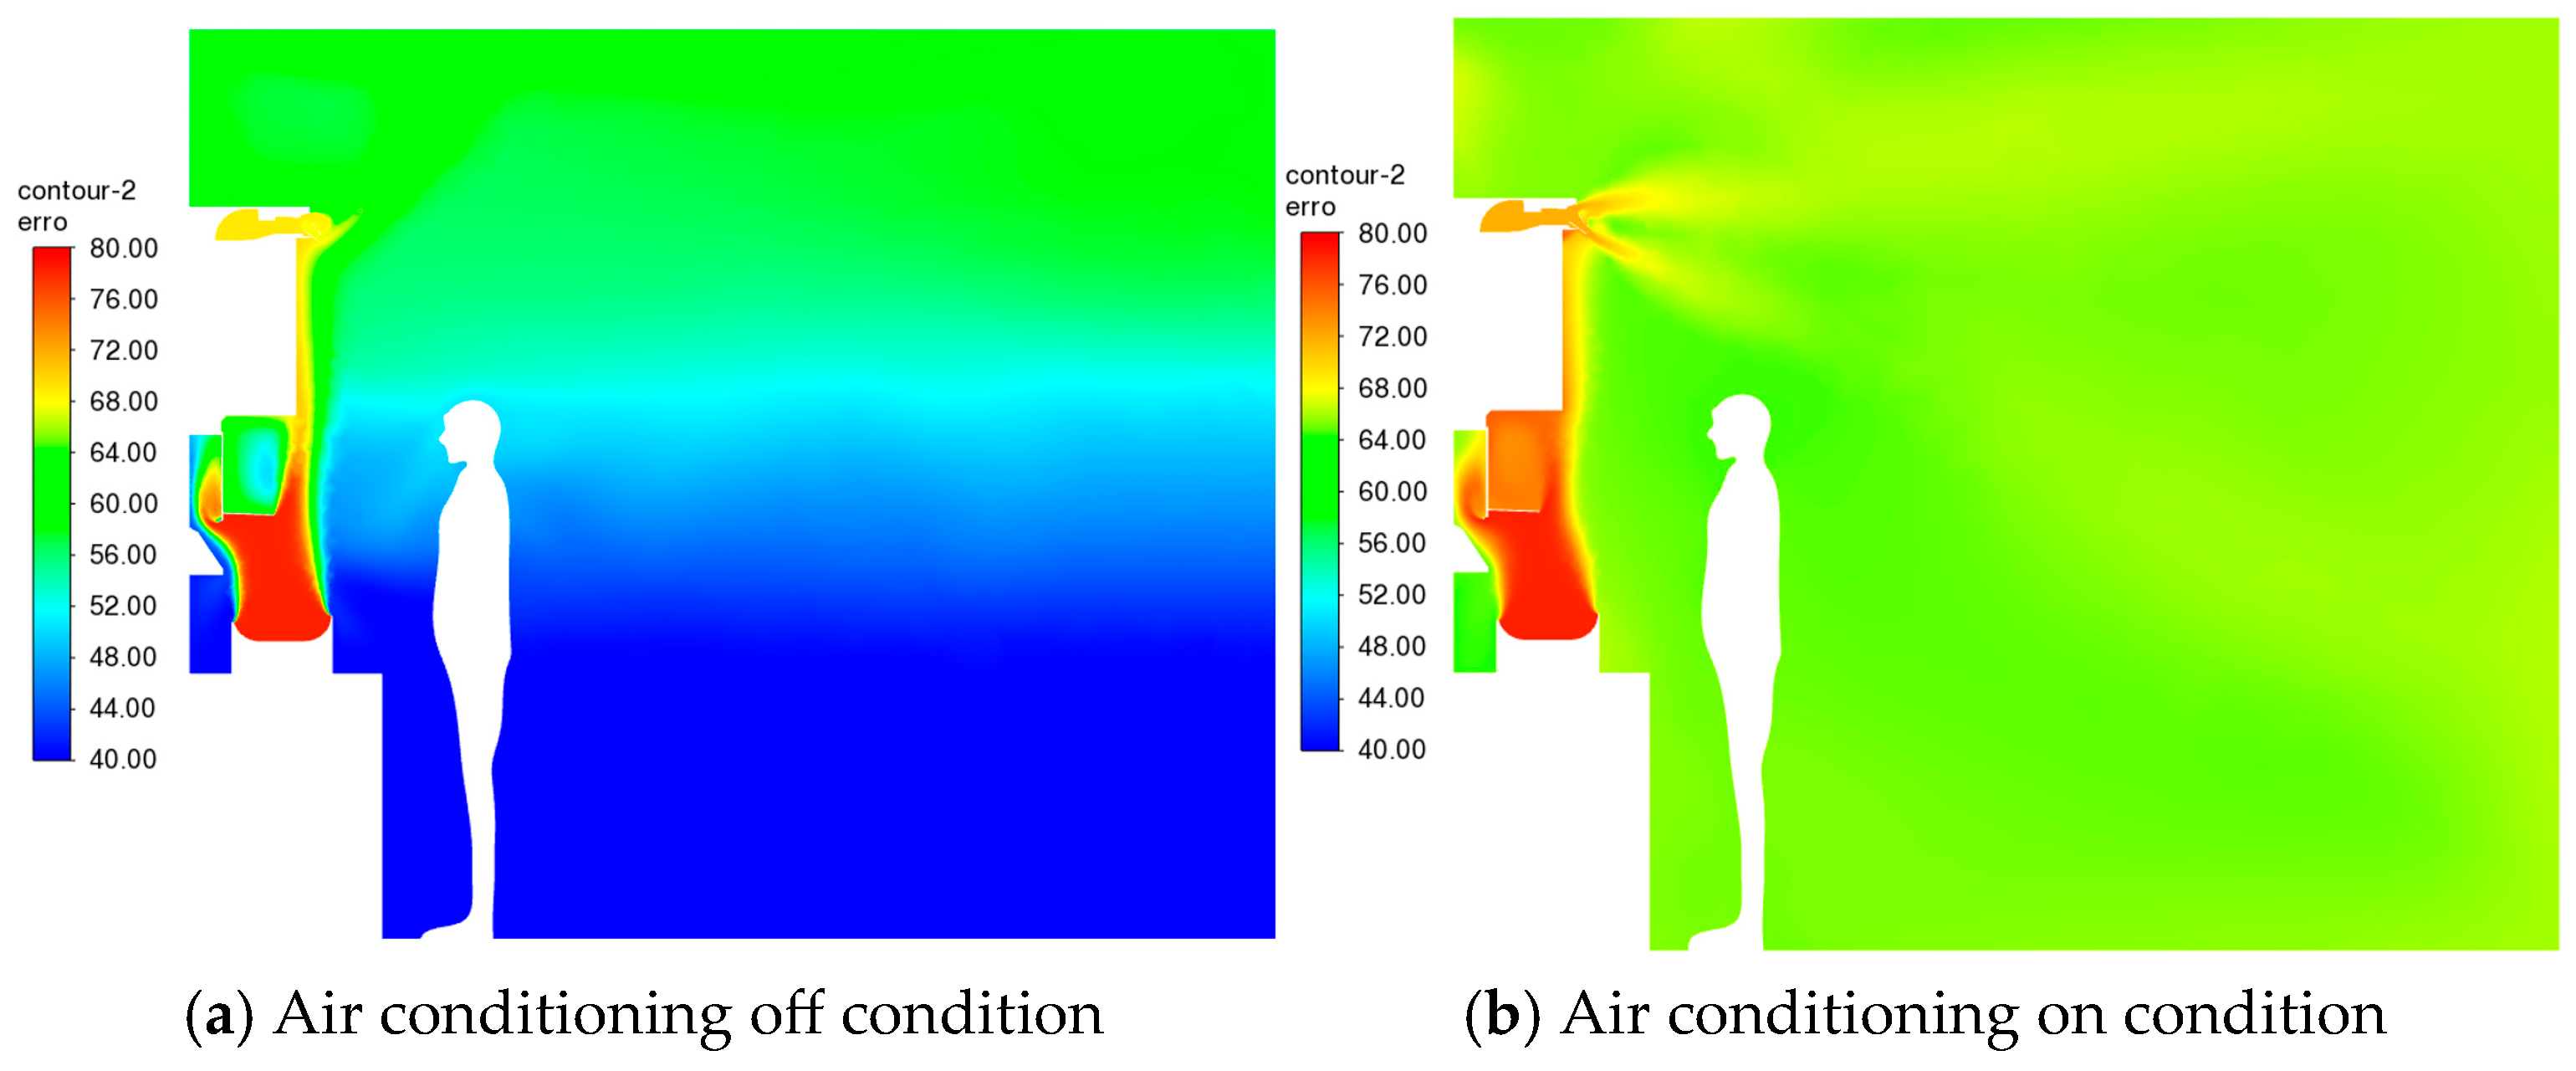
5.1. Temperature Field Analysis
5.2. Relative Humidity Analysis
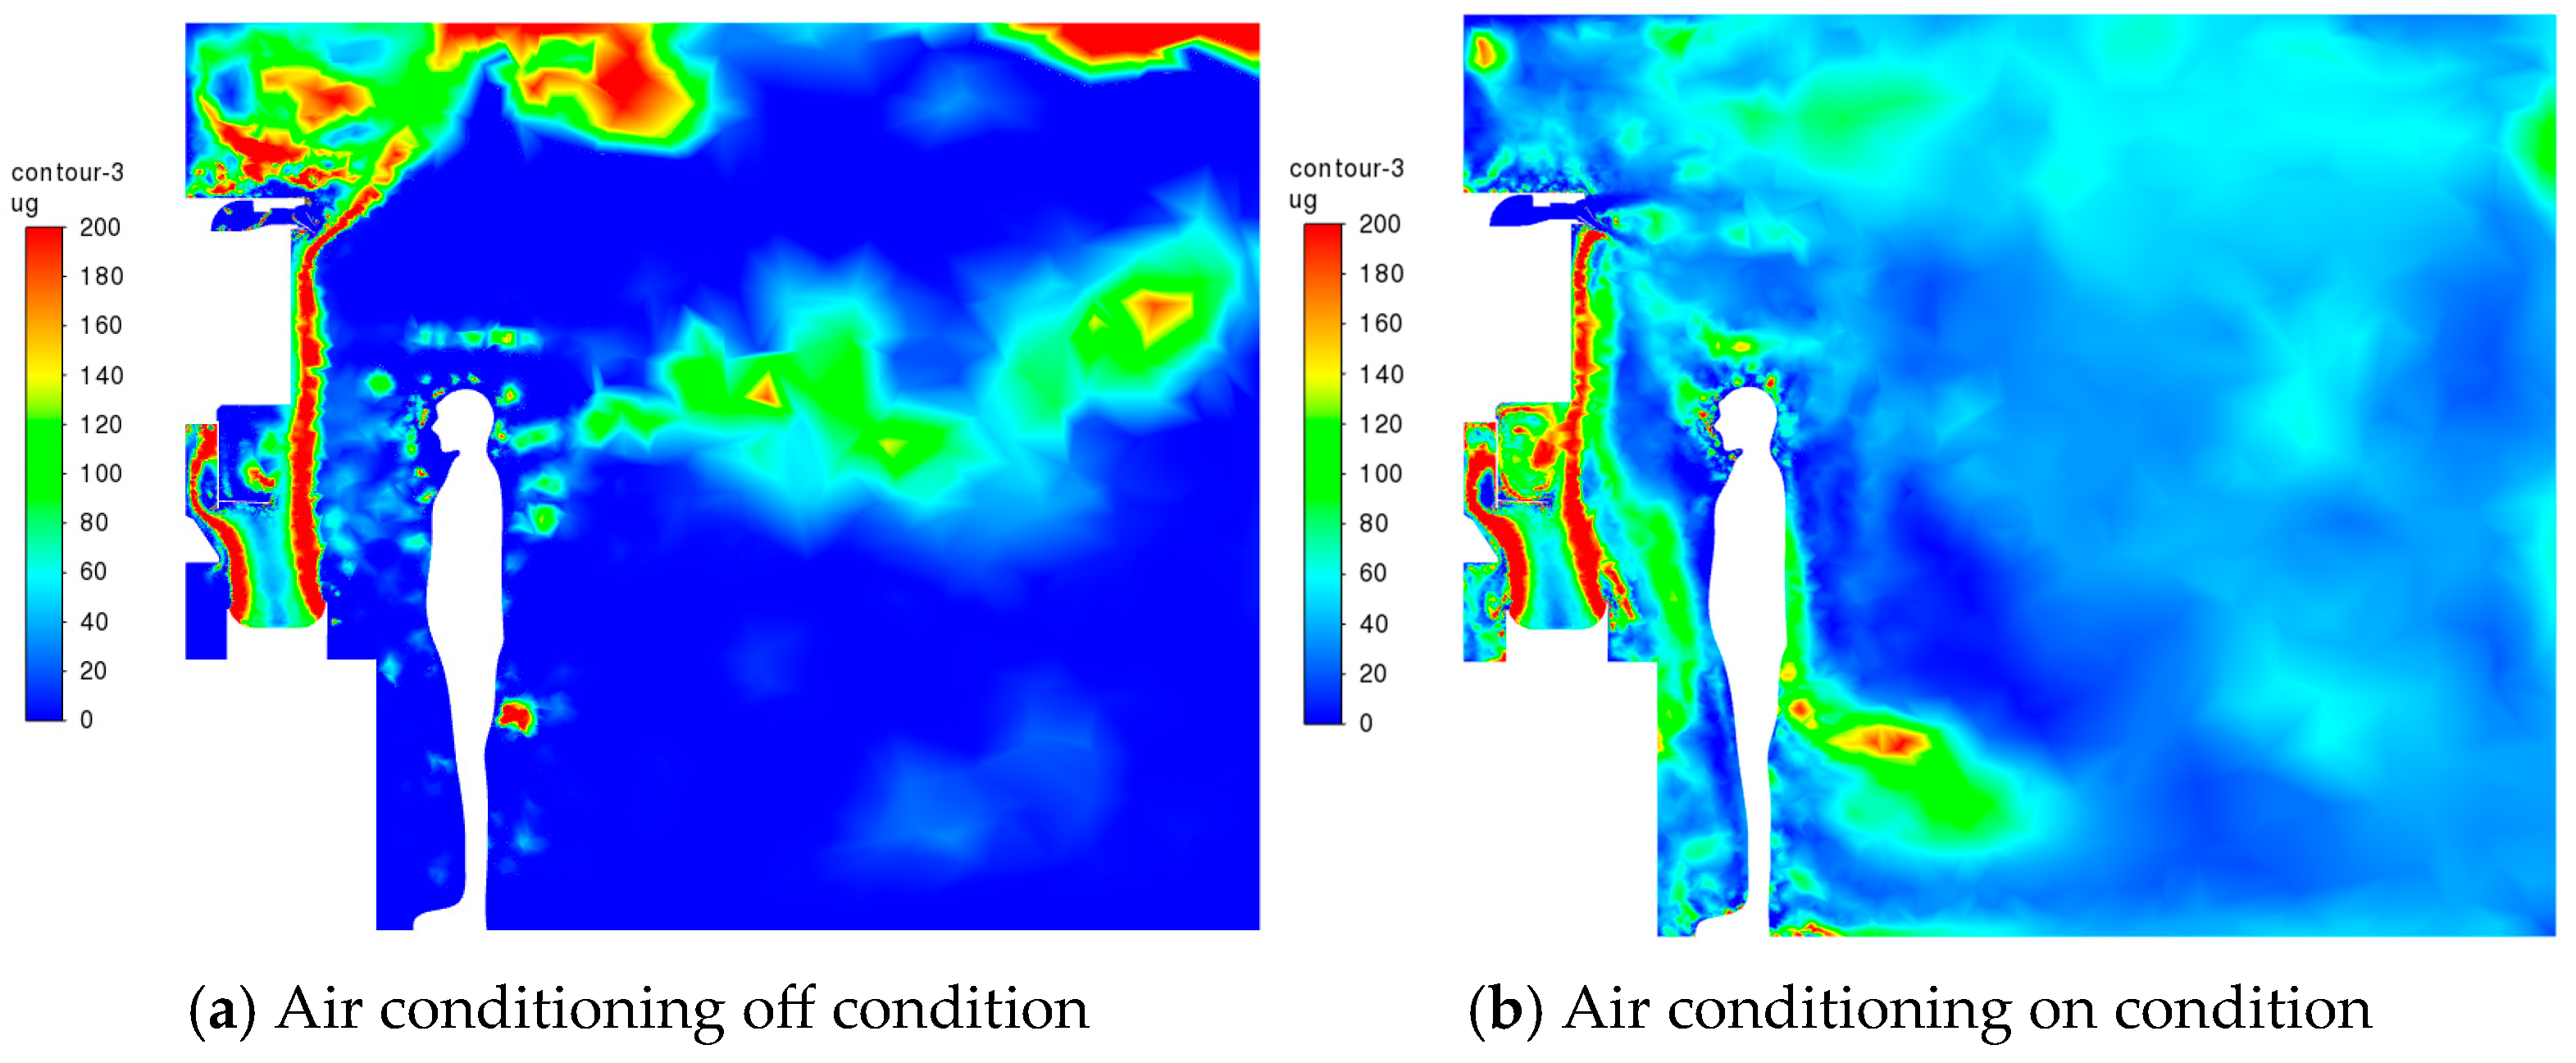
5.3. PM10 Particulate Matter Concentration Analysis
5.4. PMV Index Analysis
6. Optimization Analysis of Kitchen Cooking Environment Comfort
6.1. Orthogonal Optimization Design of Key Parameters for Air Conditioning Range Hood
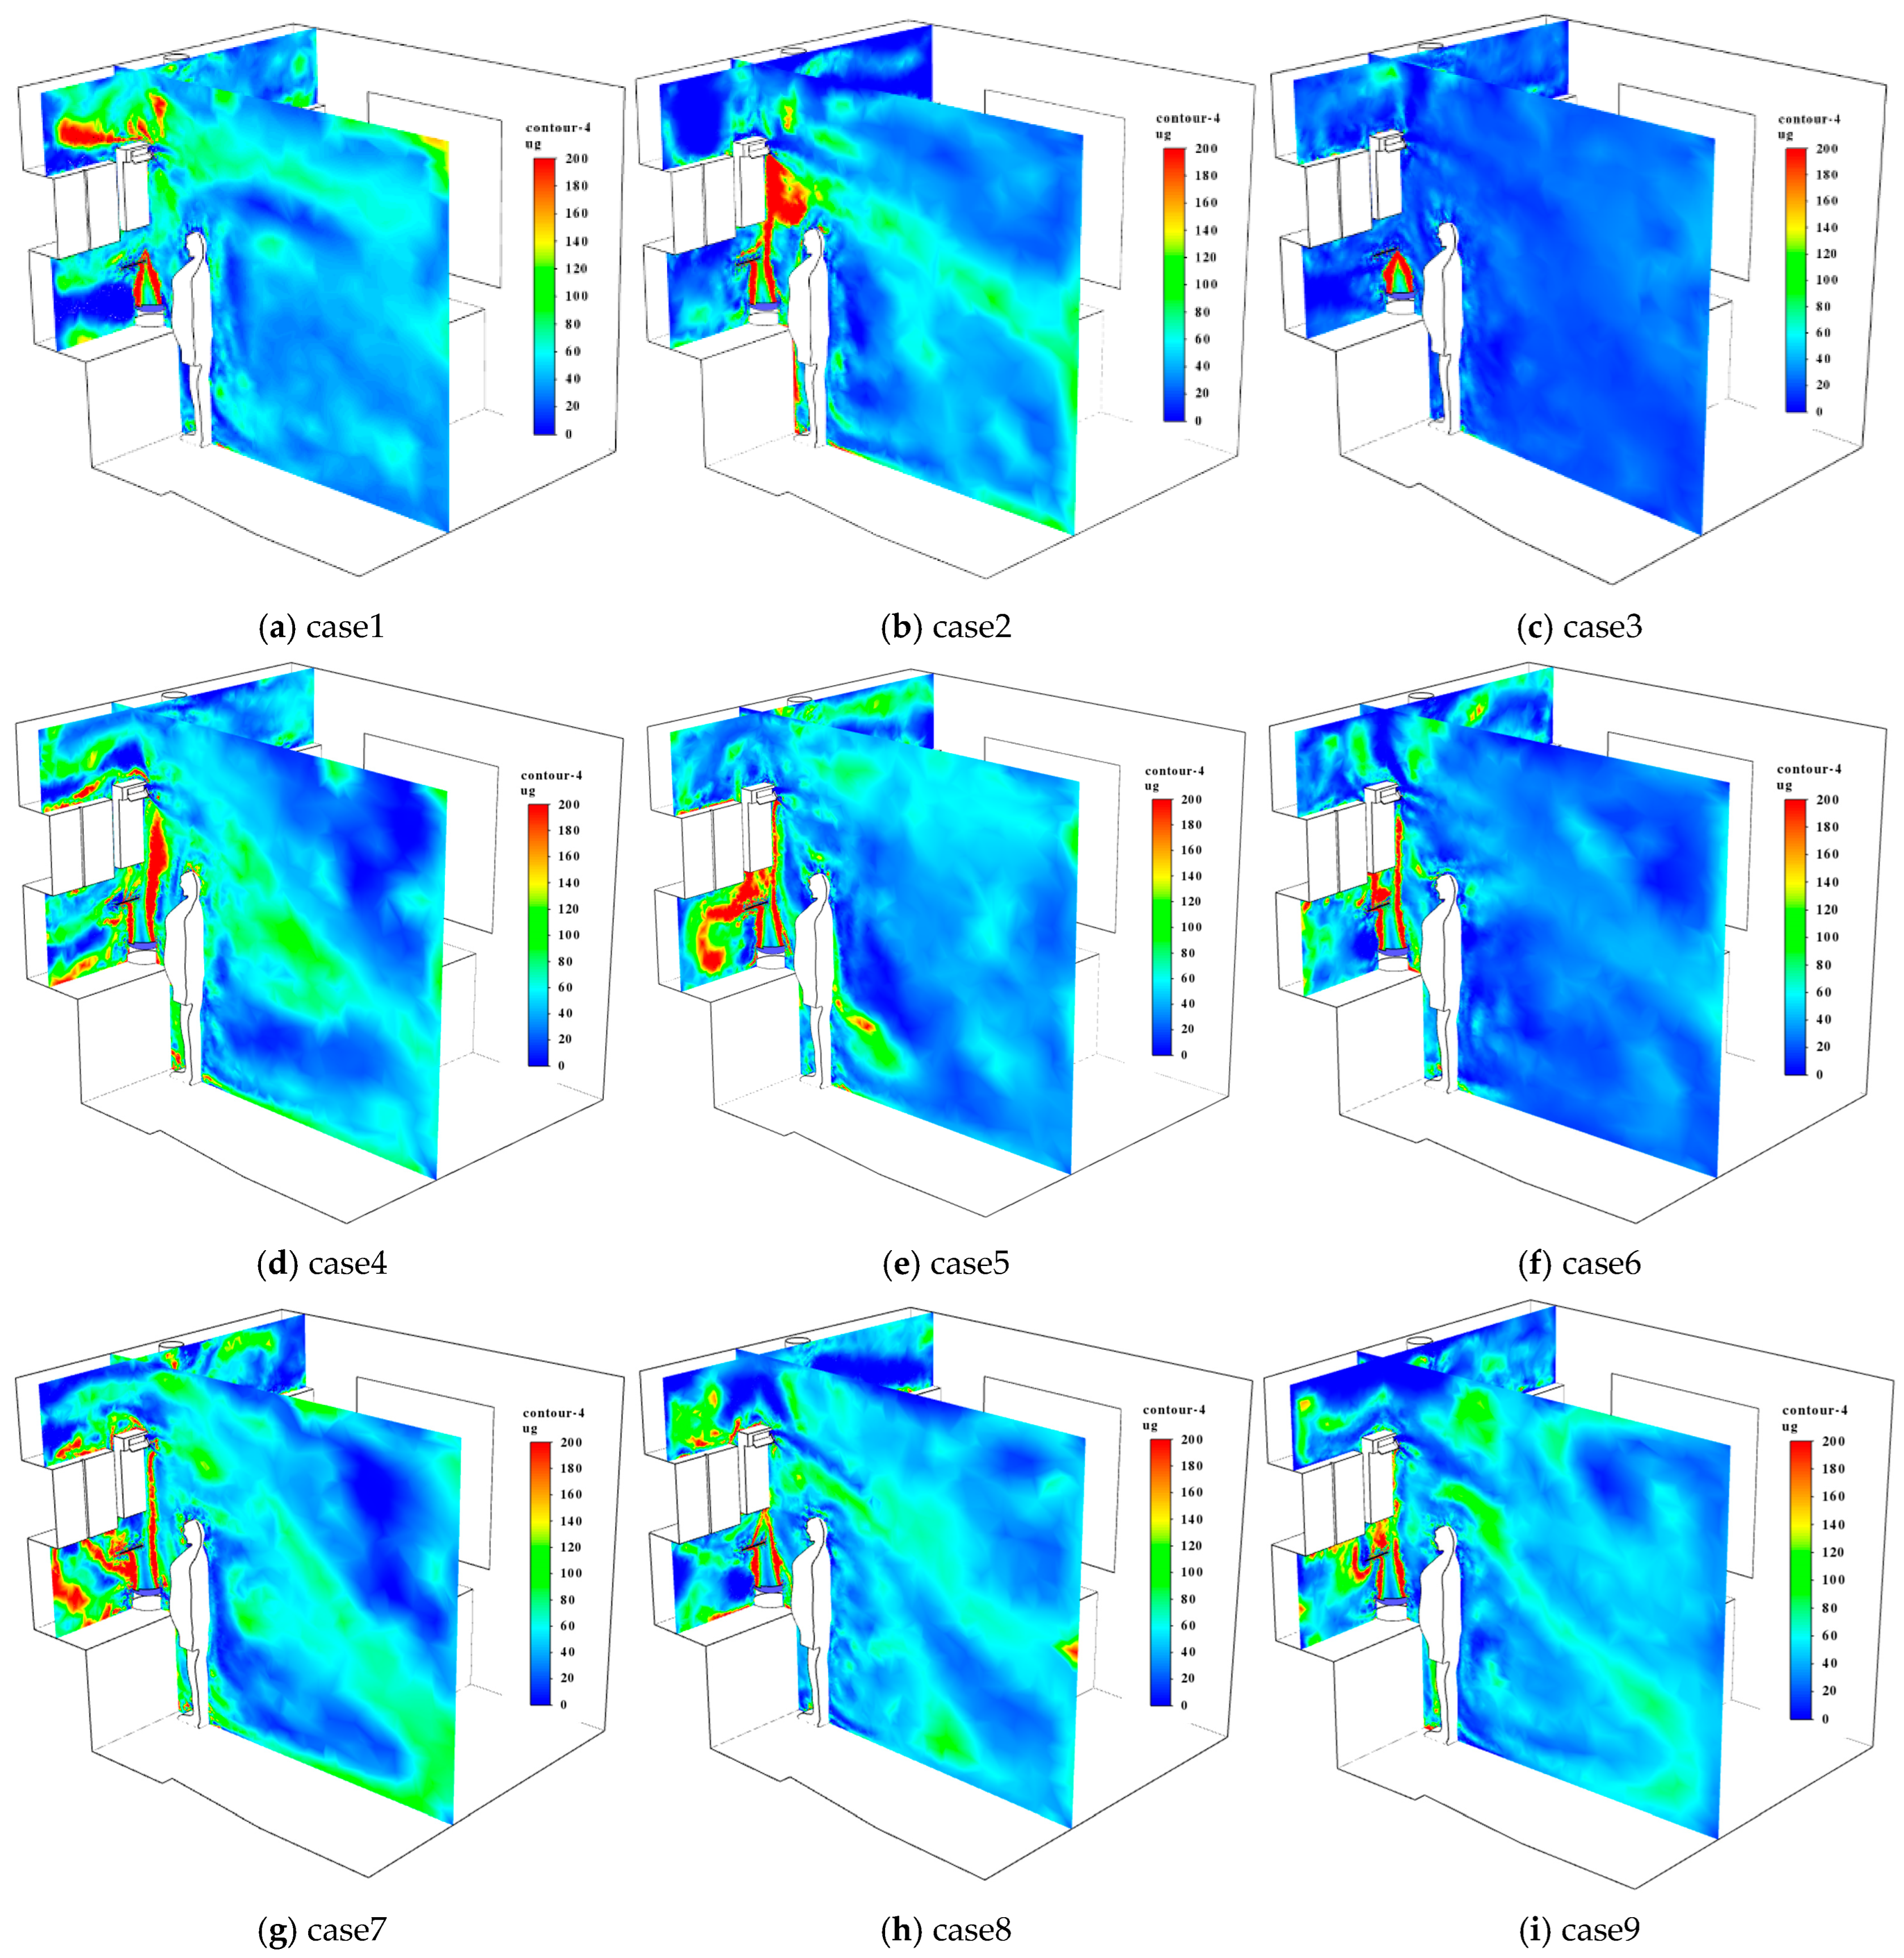
6.2. Comfort Optimization Based on PM10 Concentration Range Analysis
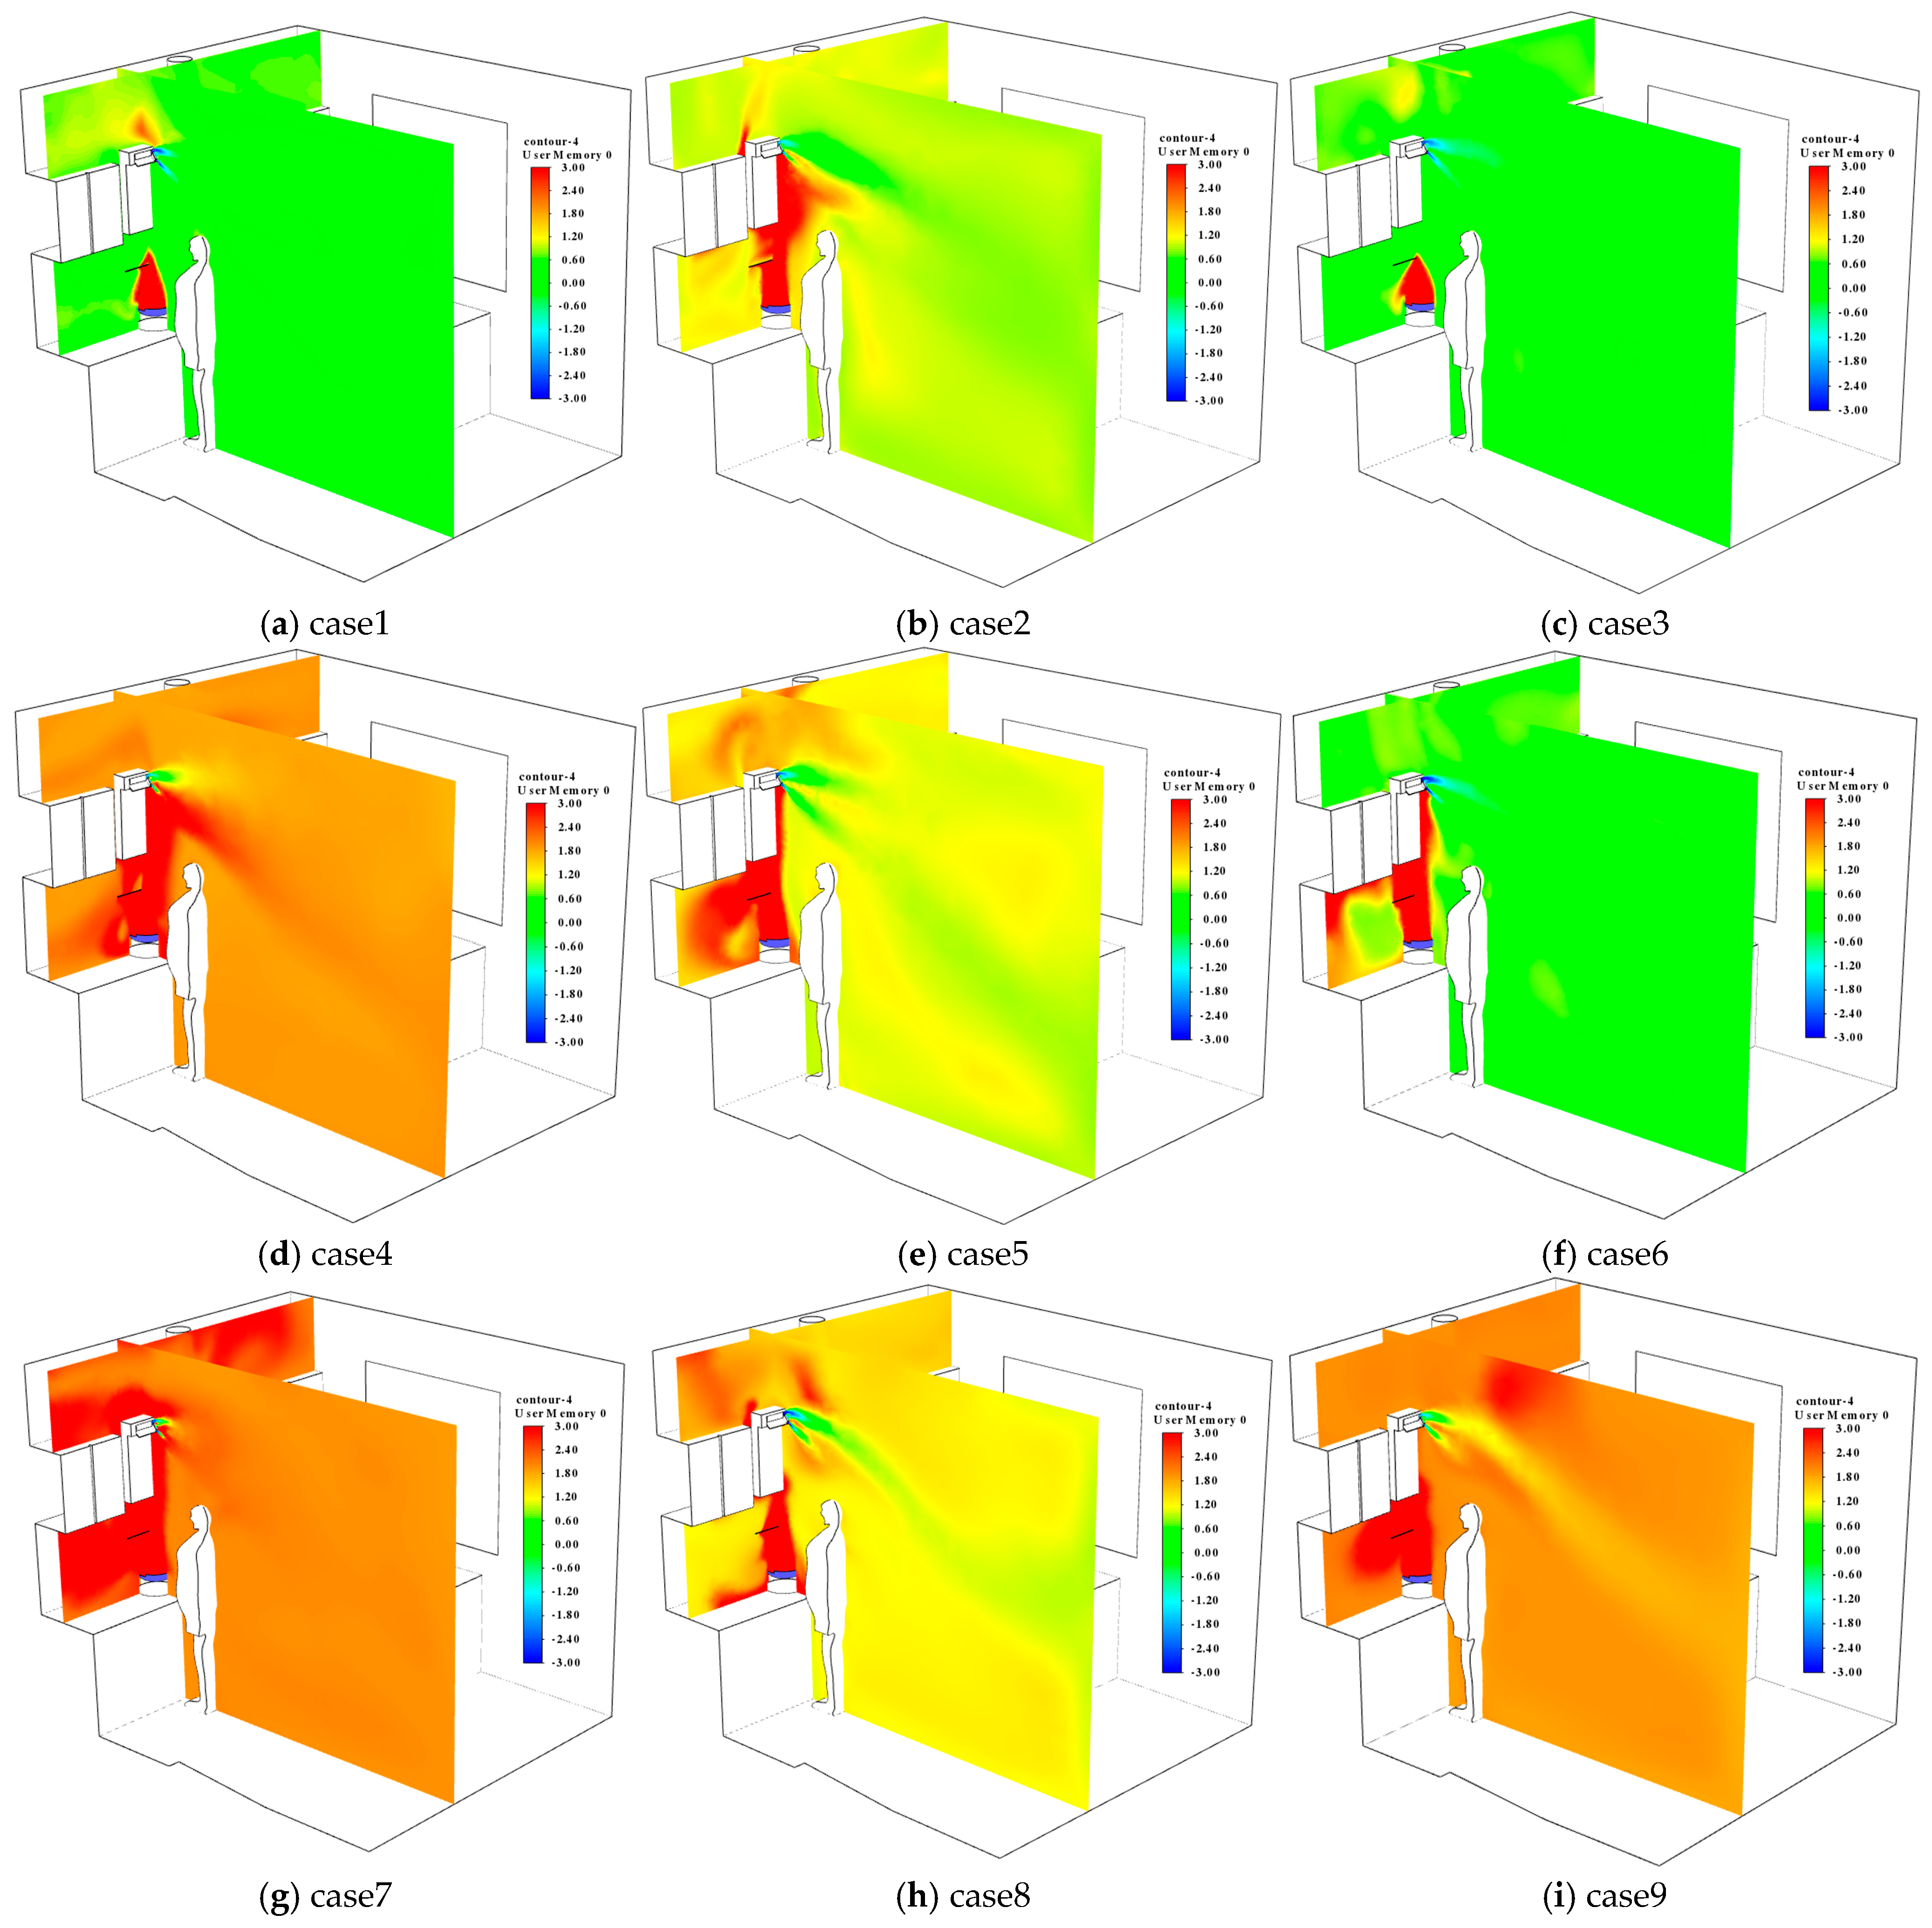
6.3. Comfort Optimization Based on PMV Index Range Analysis
6.4. Comfort Optimization Based on Range Analysis of Comprehensive Evaluation Values
7. Conclusions
Author Contributions
Funding
Data Availability Statement
Acknowledgments
Conflicts of Interest
References
- Chen, Z.; Xin, J.; Liu, P. Air quality and thermal comfort analysis of kitchen environment with CFD simulation and experimental calibration. Build. Environ. 2020, 172, 106691. [Google Scholar] [CrossRef]
- Luo, M.; Guo, J.; Feng, X.; Chen, W. Studying occupant’s heat exposure and thermal comfort in the kitchen through full-scale experiments and CFD simulations. Indoor Built Environ. 2023, 32, 928–943. [Google Scholar] [CrossRef]
- Rupp, R.F.; Vásquez, N.G.; Lamberts, R. A review of human thermal comfort in the built environment. Energy Build. 2015, 105, 178–205. [Google Scholar] [CrossRef]
- Anand, P.; Deb, C.; Alur, R. A simplified tool for building layout design based on thermal comfort simulations. Front. Archit. Res. 2017, 6, 218–230. [Google Scholar] [CrossRef]
- Alam, M.S.; Sharma, M.; Salve, U.R. Investigating thermal environment inside the kitchen of air-conditioned pantry car on Indian Railway using CFD. Hum. Factors Ergon. Manuf. Serv. Ind. 2022, 32, 359–372. [Google Scholar] [CrossRef]
- Ozarisoy, B.; Elsharkawy, H. Assessing overheating risk and thermal comfort in state-of-the-art prototype houses that combat exacerbated climate change in UK. Energy Build. 2019, 187, 201–217. [Google Scholar] [CrossRef]
- Wang, Y.; Kuckelkorn, J.; Zhao, F.-Y.; Liu, D.; Kirschbaum, A.; Zhang, J.-L. Evaluation on classroom thermal comfort and energy performance of passive school building by optimizing HVAC control systems. Build. Environ. 2015, 89, 86–106. [Google Scholar] [CrossRef]
- Zhang, S.; Huang, X.; Li, A.; Yu, B.; Jiang, Y.; Peng, L.; Chen, Z. Improving kitchen thermal comfort in summer based on optimization of airflow distribution. J. Build. Eng. 2024, 96, 110614. [Google Scholar] [CrossRef]
- Zhang, S.; Shen, Z.; Chen, Z. Optimization strategy for joint operation of kitchen air-conditioning and fan based on energy consumption and comfort. Build. Environ. 2025, 276, 112919. [Google Scholar] [CrossRef]
- Li, W.; Wang, H.; Li, C.; Yu, C.W. Control of temperature and fume generation by cooking in a residential kitchen by ceiling radiative cooling and fume hood extraction. Indoor Built Environ. 2021, 30, 1211–1225. [Google Scholar] [CrossRef]
- Liu, L.; Xin, J.; Liu, Z.; Zeng, W.; Li, Q.; Jin, L.; You, R.; Liu, M.; Liu, H. Are wearable local cooling devices effective in Chinese residential kitchens during hot summer? Build. Environ. 2024, 257, 111532. [Google Scholar] [CrossRef]
- Liu, S.; Cao, Q.; Zhao, X.; Lu, Z.; Deng, Z.; Dong, J.; Lin, X.; Qing, K.; Zhang, W.; Chen, Q. Improving indoor air quality and thermal comfort in residential kitchens with a new ventilation system. Build. Environ. 2020, 180, 107016. [Google Scholar] [CrossRef]
- Zhang, J.; Gao, J.; Wang, J.; Cao, C.; Xie, M.; Zeng, L.; Lv, L. The performance of different ventilation methods in residential kitchens with different spatial organizations: A literature review. Build. Environ. 2021, 201, 107990. [Google Scholar] [CrossRef]
- Andrey, L.; Derek, S.; Zeqiang, S. The effect of supply air systems on kitchen thermal environment. J. Am. Soc. Heat. 2005, 111, 2–9. [Google Scholar]
- Huang, X.; Shen, Z.; Zhang, S.; Tan, Y.; Li, A.; Yu, B.; Jiang, Y.; Peng, L.; Chen, Z. Flow Field Modeling Analysis on Kitchen Environment with Air Conditioning Range Hood. Atmosphere 2025, 16, 236. [Google Scholar] [CrossRef]
- Ma, Q.; Fukuda, H.; Lee, M.; Kobatake, T.; Kuma, Y.; Ozaki, A. Study on the utilization of heat in the mechanically ventilated Trombe wall in a house with a central air conditioning and air circulation system. Appl. Energy 2018, 222, 861–871. [Google Scholar] [CrossRef]
- Wu, Y.; Zhou, J.; Zhou, X.; Gao, J.; Cao, C.; Zeng, Y.; Li, J. Personalized kitchen air supply for reducing individual thermal discomfort and cooking pollution intake. Build. Environ. 2023, 245, 110921. [Google Scholar] [CrossRef]
- Liu, Y.; Dong, J.; Wang, Y.; Zheng, W.; Jiang, Y. Numerical investigation on the influence of natural make-up air in Chinese-style residential kitchen on indoor environment in a partitioned household. Sustain. Energy Technol. Assess. 2021, 46, 101244. [Google Scholar] [CrossRef]
- He, L.; Gao, J.; Chen, J.; Zeng, L.; Zhang, C.; Zhang, M.; Xu, Y.; Guo, H. Experimental studies of natural make-up air distribution in residential kitchen. J. Build. Eng. 2021, 44, 102911. [Google Scholar] [CrossRef]
- Al-Rikabi, I.J.; Karam, J.; Alsaad, H.; Ghali, K.; Ghaddar, N.; Voelker, C. The impact of mechanical and natural ventilation modes on the spread of indoor airborne contaminants: A review. J. Build. Eng. 2024, 85, 108715. [Google Scholar] [CrossRef]
- Yang, F.; Gao, J.; Cao, C.; Zeng, L.; Wang, L.; Liu, Z.; Zheng, Z. Novel kitchen ventilation system with the cabinet-bottom air supply. J. Build. Eng. 2022, 60, 105137. [Google Scholar] [CrossRef]
- Chu, G.; Liu, X.; Gao, Q.; Guo, X.; Shen, W. Influence of air supply parameters of building atrium on air conditioning effect in winter. Procedia Eng. 2017, 205, 1913–1919. [Google Scholar] [CrossRef]
- Ding, M.; Zhang, S.; Wang, J.; Ye, F.; Chen, Z. Study on spatial and temporal distribution characteristics of the cooking oil fume particulate and carbon dioxide based on CFD and experimental analyses. Atmosphere 2023, 14, 1522. [Google Scholar] [CrossRef]
- Chang, P.; Xu, G.; Zhou, F.; Mullins, B.; Abishek, S.; Chalmers, D. Minimizing DPM pollution in an underground mine by optimizing auxiliary ventilation systems using CFD. Tunn. Undergr. Space Technol. 2019, 87, 112–121. [Google Scholar] [CrossRef]
- Zhang, S.; Zhao, X.; Cheng, L.; Shen, Z.; Chen, Z. Multi-objective optimization of kitchen comfort based on arithmetic superposition index P. Case Stud. Therm. Eng. 2025, 66, 105745. [Google Scholar] [CrossRef]
- Omidvar, A.; Kim, J. Modification of sweat evaporative heat loss in the PMV/PPD model to improve thermal comfort prediction in warm climates. Build. Environ. 2020, 176, 106868. [Google Scholar] [CrossRef]
- Sirhan, N.; Golan, S. Efficient PMV computation for public environments with transient populations. Energy Build. 2021, 231, 110523. [Google Scholar] [CrossRef]
- Huang, Z.; Cheng, B.; Gou, Z.; Zhang, F. Outdoor thermal comfort and adaptive behaviors in a university campus in China’s hot summer-cold winter climate region. Build. Environ. 2019, 165, 106414. [Google Scholar] [CrossRef]
- Huang, Z.; Gou, Z.; Cheng, B. An investigation of outdoor thermal environments with different ground surfaces in the hot summer-cold winter climate region. J. Build. Eng. 2020, 27, 100994. [Google Scholar] [CrossRef]
- Hou, Y.; Zhu, Y.; Cui, X.; Wang, J.; Jia, X.; Cao, B. Relationship between indoor and outdoor temperatures in winter in the Hot Summer and Cold Winter Zone of China-Considering two sources of outdoor temperatures and different indoor heating methods. J. Build. Eng. 2024, 87, 109136. [Google Scholar] [CrossRef]
- Liu, W.; Zhang, Y.; Deng, Q. The effects of urban microclimate on outdoor thermal sensation and neutral temperature in hot-summer and cold-winter climate. Energy Build. 2016, 128, 190–197. [Google Scholar] [CrossRef]
- ISO 7730:2005; Ergonomics of the Thermal Environment-Analytical Determination and Interpretation of Thermal Comfort Using Calculation of the PMV and PPD Indices and Local Thermal Comfort Criteria. Technical Committee ISO/TC 159, Ergonomics, Subcommittee SC 5, Ergonomics: Bern, Switzerland, 2005.
- Xin, J.; Shi, X.; Ye, F.; Chen, Z.; Yin, P.; Ding, M.; Miao, B. Numerical evaluation of the air quality and thermal comfort in the cooking kitchen under exhausting effects of the range hood. Energy Build. 2024, 309, 114058. [Google Scholar] [CrossRef]
- Cheng, W.L.; Sadr, R. Induced flow field of randomly moving nanoparticles: A statistical perspective. Microfluid. Nanofluidics 2015, 18, 1317–1328. [Google Scholar] [CrossRef]
- Rashidi, S.; Esfahani, J.A.; Ellahi, R. Convective heat transfer and particle motion in an obstructed duct with two side by side obstacles by means of DPM model. Appl. Sci. 2017, 7, 431. [Google Scholar] [CrossRef]
- Aslam, A.; Ibrahim, M.; Shahid, I.; Mahmood, A.; Irshad, M.K.; Yamin, M.; Ghazala; Tariq, M.; Shamshiri, R.R. Pollution characteristics of particulate matter (PM2.5 and PM10) and constituent carbonaceous aerosols in a South Asian future megacity. Appl. Sci. 2020, 10, 8864. [Google Scholar] [CrossRef]
- Aslam, A.; Ibrahim, M.; Mahmood, A.; Mubashir, M.; Sipra, H.F.K.; Shahid, I.; Ramzan, S.; Latif, M.T.; Tahir, M.Y.; Show, P.L. Mitigation of particulate matters and integrated approach for carbon monoxide remediation in an urban environment. J. Environ. Chem. Eng. 2021, 9, 105546. [Google Scholar] [CrossRef]
- Zahra, S.I.; Iqbal, M.J.; Ashraf, S.; Aslam, A.; Ibrahim, M.; Yamin, M.; Vithanage, M. Comparison of ambient air quality among industrial and residential areas of a typical south Asian city. Atmosphere 2022, 13, 1168. [Google Scholar] [CrossRef]
- Ehsan, S.; Abbas, F.; Ibrahim, M.; Ahmad, B.; Farooque, A.A. Thermal discomfort levels, building design concepts, and some heat mitigation strategies in low-income communities of a South Asian city. Int. J. Environ. Res. Public Health 2021, 18, 2535. [Google Scholar] [CrossRef]
- Jabeen, F.; Adrees, M.; Ibrahim, M.; Waqas, M.; Mahmood, A.; Noreen, U.; Aslam, A. Characterization for optimizing the integrated management of solid waste for energy recovery and circular economy. Environ. Sci. Pollut. Res. 2023, 32, 12236–12247. [Google Scholar] [CrossRef]
- Zeb, B.; Alam, K.; Ditta, A.; Ullah, S.; Ali, H.M.; Ibrahim, M.; Salem, M.Z. Variation in coarse particulate matter (PM10) and its characterization at multiple locations in the Semiarid Region. Front. Environ. Sci. 2022, 10, 843582. [Google Scholar] [CrossRef]


| Instrument | Measurement Parameters | Measuring Range | Accuracy |
|---|---|---|---|
| Handheld particle counter LH3016 | PM0.5, PM1.0, PM2.5, PM5.0, PM10.0 | 0.3–10 μm | 0.3 μm |
| TOPRIE TP9000 multi-channel data Recording | Temperature | −200~1200 °C | ±0.05 °C |
| Testo405i thermal anemometer | Velocity | 0~30 m/s | 0.01 m/s |
| PM6508 digital temperature and humidity meter | Relative humidity | 10~90% | ±2.0% |
| Boundary | Parameters |
|---|---|
| Cooking Surface Temperature | Temperature: approx 70 °C; Relative humidity: 70% |
| Makeup Air Temperature | 35 °C |
| Supplement Air Humidity | 40% |
| Initial Kitchen Air Temperature | 35 °C |
| Initial Kitchen Air Humidity | 40% |
| Key Boundary Area | Boundary Condition Type | Parameter Settings |
|---|---|---|
| Pot surface inlet | Velocity–inlet | Speed: 1.5 m/s Temperature: 70 °C Relative humidity: 70% |
| Air conditioning cooling air inlet | Mass–flow–inlet | Flow rate: 5 m3/min Temperature: 23 °C Relative humidity: 70% |
| Exhaust outlet of range hood | Mass–flow–outlet | Flow rate: 13 m3/min |
| Door gap | Pressure–inlet | Static pressure: 0 Pa Temperature: 35 °C Relative humidity: 40% |
| Temperature | Velocity | Humidity | PM10 Concentration | |
|---|---|---|---|---|
| Average test value | 28.04 °C | 3.09 m/s | 52.40% | 66.48 μg |
| RMSE | 1.23 °C | 0.05 m/s | 2.45% | 3.72 μg |
| Number | The Initial Diffusion Velocity of Oil Fumes (m/s) | The Range Hood’s Exhaust Airflow Rate (m3/min) | Air Conditioning Supply Temperature (°C) |
|---|---|---|---|
| 1 | 0.6 | 11 | 20 |
| 2 | 0.6 | 13 | 24 |
| 3 | 0.6 | 15 | 22 |
| 4 | 0.8 | 11 | 24 |
| 5 | 0.8 | 13 | 22 |
| 6 | 0.8 | 15 | 20 |
| 7 | 1 | 11 | 22 |
| 8 | 1 | 13 | 20 |
| 9 | 1 | 15 | 24 |
| Number | The Initial Diffusion Velocity of Oil Fumes (m/s) | The Range Hood’s Exhaust Airflow Rate (m3/min) | Air Conditioning Supply Temperature (°C) | The Volume-Averaged PM10 Concentration (μg) |
|---|---|---|---|---|
| 1 | 0.6 | 11 | 20 | 61.13 |
| 2 | 0.6 | 13 | 24 | 53.74 |
| 3 | 0.6 | 15 | 22 | 40.31 |
| 4 | 0.8 | 11 | 24 | 71.35 |
| 5 | 0.8 | 13 | 22 | 62.71 |
| 6 | 0.8 | 15 | 20 | 53.31 |
| 7 | 1 | 11 | 22 | 72.52 |
| 8 | 1 | 13 | 20 | 64.75 |
| 9 | 1 | 15 | 24 | 62.36 |
| K (0.6) | 51.73 | - | - | - |
| K (0.8) | 62.46 | - | - | - |
| K (1.0) | 66.54 | - | - | - |
| K (11) | - | 68.33 | - | - |
| K (13) | - | 60.40 | - | - |
| K (15) | - | 51.99 | - | - |
| K (20) | - | - | 59.73 | - |
| K (22) | - | - | 58.51 | - |
| K (24) | - | - | 62.48 | - |
| R | 14.81 | 16.34 | 3.97 | - |
| Optimal level | 0.6 | 15 | 22 | - |
| Number | The Initial Diffusion Velocity of Oil Fumes (m/s) | The Range Hood’s Exhaust Airflow Rate (m3/min) | Air Conditioning Supply Temperature (°C) | The Volume-Averaged PMV |
|---|---|---|---|---|
| 1 | 0.6 | 11 | 20 | 0.43 |
| 2 | 0.6 | 13 | 24 | 1.03 |
| 3 | 0.6 | 15 | 22 | 0.40 |
| 4 | 0.8 | 11 | 24 | 1.89 |
| 5 | 0.8 | 13 | 22 | 1.18 |
| 6 | 0.8 | 15 | 20 | 0.51 |
| 7 | 1 | 11 | 22 | 2.07 |
| 8 | 1 | 13 | 20 | 1.36 |
| 9 | 1 | 15 | 24 | 1.99 |
| K (0.6) | 0.62 | - | - | - |
| K (0.8) | 1.19 | - | - | - |
| K (1.0) | 1.80 | - | - | - |
| K (11) | - | 1.46 | - | - |
| K (13) | - | 1.19 | - | - |
| K (15) | - | 0.97 | - | - |
| K (20) | - | - | 0.77 | - |
| K (22) | - | - | 1.22 | - |
| K (24) | - | - | 1.64 | - |
| R | 1.18 | 0.49 | 0.87 | - |
| Optimal level | 0.6 | 15 | 20 | - |
| Number | The Initial Diffusion Velocity of Oil Fumes (m/s) | The Range Hood’s Exhaust Airflow Rate (m3/min) | Air Conditioning Supply Temperature (°C) | CEV |
|---|---|---|---|---|
| 1 | 0.6 | 11 | 20 | 1.65 |
| 2 | 0.6 | 13 | 24 | 2.11 |
| 3 | 0.6 | 15 | 22 | 1.21 |
| 4 | 0.8 | 11 | 24 | 3.32 |
| 5 | 0.8 | 13 | 22 | 2.43 |
| 6 | 0.8 | 15 | 20 | 1.58 |
| 7 | 1 | 11 | 22 | 3.52 |
| 8 | 1 | 13 | 20 | 2.66 |
| 9 | 1 | 15 | 24 | 3.24 |
| K (0.6) | 1.6545 | - | - | - |
| K (0.8) | 2.4425 | - | - | - |
| K (1.0) | 3.1375 | - | - | - |
| K (11) | - | 2.83 | - | - |
| K (13) | - | 2.398 | - | - |
| K (15) | - | 2.0065 | - | - |
| K (20) | - | - | 1.961 | - |
| K (22) | - | - | 2.3869 | - |
| K (24) | - | - | 2.886 | - |
| R | 1.483 | 0.8235 | 0.925 | - |
| Optimal level | 0.6 | 15 | 20 | - |
Disclaimer/Publisher’s Note: The statements, opinions and data contained in all publications are solely those of the individual author(s) and contributor(s) and not of MDPI and/or the editor(s). MDPI and/or the editor(s) disclaim responsibility for any injury to people or property resulting from any ideas, methods, instructions or products referred to in the content. |
© 2025 by the authors. Licensee MDPI, Basel, Switzerland. This article is an open access article distributed under the terms and conditions of the Creative Commons Attribution (CC BY) license (https://creativecommons.org/licenses/by/4.0/).
Share and Cite
Zhang, S.; Huang, H.; Ye, F.; Wang, F.; Cheng, L.; Tan, Y.; Shen, Z.; Chen, Z. Optimization Analysis of Kitchen Cooking Environment for Air Conditioning Range Hood Based on Thermal Comfort and PM10 Concentration. Buildings 2025, 15, 1842. https://doi.org/10.3390/buildings15111842
Zhang S, Huang H, Ye F, Wang F, Cheng L, Tan Y, Shen Z, Chen Z. Optimization Analysis of Kitchen Cooking Environment for Air Conditioning Range Hood Based on Thermal Comfort and PM10 Concentration. Buildings. 2025; 15(11):1842. https://doi.org/10.3390/buildings15111842
Chicago/Turabian StyleZhang, Shunyu, Hai Huang, Feng Ye, Fayin Wang, Liangguo Cheng, Yongqiang Tan, Zhihang Shen, and Zhenlei Chen. 2025. "Optimization Analysis of Kitchen Cooking Environment for Air Conditioning Range Hood Based on Thermal Comfort and PM10 Concentration" Buildings 15, no. 11: 1842. https://doi.org/10.3390/buildings15111842
APA StyleZhang, S., Huang, H., Ye, F., Wang, F., Cheng, L., Tan, Y., Shen, Z., & Chen, Z. (2025). Optimization Analysis of Kitchen Cooking Environment for Air Conditioning Range Hood Based on Thermal Comfort and PM10 Concentration. Buildings, 15(11), 1842. https://doi.org/10.3390/buildings15111842