Article

Understanding the Causation Mechanism of Construction Workers’ Unsafe Behaviors in Railway Tunnel Engineering Based on 24model and Social Network Analysis

1
School of Civil Engineering, Central South University, Changsha 410083, China
2
School of Architecture and Built Environment, Queensland University of Technology, Brisbane, QLD 4001, Australia
3
Changsha Urban Development Group Co., Ltd., Changsha 410083, China
*
Author to whom correspondence should be addressed.
Buildings 2025, 15(11), 1841; https://doi.org/10.3390/buildings15111841
Submission received: 24 March 2025 / Revised: 16 May 2025 / Accepted: 21 May 2025 / Published: 27 May 2025
(This article belongs to the Special Issue Human-Centered Transformation in Modern Construction Management)

Abstract

Construction workers’ unsafe behaviors (CWUBs) are a primary cause of construction safety accidents in railway tunnel engineering (RTE). Understanding the causation mechanism between construction safety accidents, CWUBs, and their influencing factors is crucial for improving safety management. However, research in this area remains insufficient. This study systematically identifies 9 types of construction safety accidents, 11 types of CWUBs, and 35 influencing factors, covering three core dimensions: organizational management, individual safety capacity, and safety environment. Using the 24model, this study qualitatively elucidates the causation mechanism and identifies the primary and secondary causation relationships among 55 factors. On this basis, a network model of CWUBs in RTE is developed and quantitatively analyzed using social network analysis from the perspectives of the overall network, block network, and individual network, resulting in the identification of a critical network comprising 27 key factors. Based on the findings, nine targeted intervention measures are proposed, encompassing pre-emptive prevention, on-site control, and emergency management. This study innovatively integrates the 24model and social network analysis, systematically analyzing the causation mechanism of CWUBs in RTE from both qualitative and quantitative perspectives. This research not only provides a systematic and innovative analytical framework for CWUBs in RTE, addressing a critical gap in the study of unsafe behaviors and accident causation in complex systems, but also offers practical guidance for safety risk management. Additionally, it enriches the theoretical framework of unsafe behavior research, providing valuable insights for further studies in related fields.

1. Introduction

As one of the most environmentally sustainable modes of land transportation, railways play a critical role in addressing global climate change [1]. Globally, approximately 70,352 km of high-speed railways are either under construction or planned [2]. Railway tunnel engineering (RTE) is a core component of these projects, with tunnels accounting for over 80% of the construction in complex terrains [3]. However, railway tunnel construction involves various risks, particularly safety risks, which, if an accident occurs, can result in significant casualties and property loss [4]. Consequently, the effective management of safety risks in RTE has become an urgent challenge.
Construction workers’ unsafe behaviors (CWUBs) are considered a critical reason contributing to frequent construction safety accidents in RTE [5]. However, research focusing on CWUBs in RTE remains limited. Existing studies on CWUBs primarily concentrate on building construction or the construction industry, analyzing factors influencing CWUBs [6], causation mechanisms [7], and intervention measures [8]. The influencing factors are typically categorized into three levels: individual [9], organizational [10], and environmental [11]. Structural equation modeling [12], system dynamics [13], and agent-based modeling [14] are commonly employed to explore the causation mechanisms of CWUBs. Recent studies have increasingly focused on the influence of individual psychological and physiological states, as well as organizational factors such as safety culture, on CWUBs. Managerial safety practices and safety training are critical [15], and the application of emerging monitoring technologies [16] has offered new insights into the control of CWUBs.
While these studies provide valuable insights, they still fall short of addressing the causation mechanisms and key factors underlying CWUBs in RTE. The working environment in RTE is exceptionally complex, characterized by adverse geological conditions such as rock bursts and high ground temperatures, confined spaces, high noise levels, and elevated safety risks, making CWUBs particularly prominent in this setting. Additionally, RTE projects typically have construction periods spanning over a decade, during which workers are subjected to prolonged psychological and physiological stress. Managing multiple tasks and operating various types of machinery further increase the likelihood of CWUBs. These unique features distinguish RTE from conventional tunnel projects. Therefore, it is essential to understand the causation mechanism, identify key factors, and develop targeted interventions tailored for CWUBs in RTE to effectively manage these risks.
Therefore, this paper aims to (1) systematically identify construction safety accidents, CWUBs, and their influencing factors in RTE, (2) explore the causation mechanism based on these factors, (3) determine key factors, and (4) propose intervention measures. This study not only provides practical guidance for safety risk management in RTE but also enriches the theoretical knowledge framework of unsafe behavior research, offering valuable insights for related studies in other fields.

2. Literature Review

CWUBs are widely recognized as a critical cause of frequent construction safety accidents [5]. Understanding the causation mechanism of CWUBs in RTE and identifying the key factors are crucial for managers to effectively control tunnel safety risks, ensure project progress, and promote the sustainable development of railway engineering.
Research on tunnel safety risks often focuses on risk factor identification [12,15,17] and quantitative risk assessment [18,19], with comparatively limited attention to CWUBs. Previous studies on CWUBs have primarily focused on building construction or the entire construction industry, with an emphasis on influencing factors, causation mechanism, and intervention measures.
In terms of influencing factors, they are generally categorized into three levels: individual, organizational, and environmental. At the individual level, research commonly addresses physiological factors, psychological factors, personal characteristics, subjective norms, and risk perception [9,20,21,22,23,24]. Leung et al. [9] identified emotional stress as a significant predictor of injury incidents among construction workers, finding that factors such as work overload, poor workgroup relationships, and physical environment conditions contributed to stress levels. Similarly, Xiang et al. [23] empirically confirmed that failures in hazard perception—specifically attention, recognition, and risk perception failures—significantly increase the likelihood of unsafe behaviors, revealing the critical role played by cognitive processes. At the organizational level, research typically addresses factors such as safety culture, safety climate, group norms, safety leadership, and management systems [10,14,24,25]. Fang et al. [10] demonstrated that supervisory behaviors, particularly training and preventive actions, shape workers’ safety practices both directly and indirectly through enhancing the group-level safety climate. Dedobbeleer and Beland [25] further emphasized that management’s commitment to safety and workers’ active involvement are essential dimensions of safety climate that affect workplace safety outcomes. At the environmental level, research commonly considers factors such as the construction environment, machinery, and interpersonal relationships [6,11,26,27,28,29,30]. Chi et al. [6] identified strong correlations between unsafe acts and hazardous site conditions, highlighting the interplay between human behavior and environmental risks in determining accident types and injury severity. Kim and Park [29] explored the influence of macro-level economic factors, noting that insufficient investment in safety facilities is closely associated with an increase in occupational accidents.
Overall, the existing literature extensively explores CWUBs from the perspectives of individual psychology, organizational systems, and environmental conditions. However, there is relatively little attention paid to the operational processes themselves, particularly the role of construction methods as a direct environmental and procedural influence on workers’ behavior. This highlights a gap where the physical and procedural characteristics of construction activities, especially method selection and execution complexity, are insufficiently incorporated into behavioral safety models.
In the study of causation mechanisms for unsafe behaviors, classic causation models include Heinrich’s domino theory [31], Bird’s model [32], the Swiss model [33], and Stewart’s model [34]. Building on these foundations, some scholars have proposed models such as cognitive model-CWUB [35], the stress–cognition–safety model [21], and the 24model [36,37] to analyze the causation mechanism of unsafe behaviors. However, these models predominantly rely on qualitative analyses that trace the logical sequence of accident causes. While such approaches are valuable for constructing a narrative of causation, they often fall short in quantifying the interactions and establishing robust causal inferences. In contrast, quantitative methods such as structural equation modeling [12], system dynamics [13,38], agent-based modeling [14], directed-weighted complex networks [39], and physiological measurements [40] have been introduced to explore causal pathways and determine key influencing factors. These methods focus more on the interactions among influencing factors and emphasize quantitative analysis.
In terms of intervention measures, managerial safety practices and safety education are crucial [15]. Moreover, the application of emerging monitoring technologies provides new approaches to controlling unsafe behaviors. For example, the use of big data [41], digital twins [42], machine learning [43,44], computer vision [16,45], image-based parametric methods [46,47], natural language processing [48], and devices for monitoring workers’ spatial position changes in construction sites [49,50] offers new pathways for improving the effectiveness of safety management.
In summary, research on CWUBs is primarily based on the context of building construction and the broader construction industry, focusing on influencing factors, causation mechanisms, and intervention measures. While these studies provide valuable references for investigating CWUBs in RTE, there are several notable gaps: (1) few studies have specifically explored CWUBs within the context of RTE; (2) construction safety accidents, CWUBs, and their influencing factors in RTE have not been systematically identified, and the causation mechanism among these factors remains unclear; (3) the key factors contributing to CWUBs in RTE have yet to be clearly defined, and targeted intervention strategies are lacking.
To address these gaps, this study undertakes an in-depth investigation into CWUBs in RTE. Construction safety accidents, CWUBs, and their influencing factors are systematically identified, causation mechanisms are clarified, and key factors are determined. Based on these findings, targeted intervention strategies are proposed. This study provides insights for managing CWUBs in RTE, thereby contributing to the successful completion of projects and promoting the sustainable development of railway engineering.

3. Materials and Methods

3.1. Framework

Construction workers in RTE are individuals involved in specific tasks such as construction, installation, maintenance, and inspection within tunnel construction projects. This study employs content analysis and focus group meetings to identify construction safety accidents, CWUBs, and their influencing factors in RTE. Additionally, a 24model is constructed to qualitatively analyze the causation mechanism of CWUBs and extract the primary and secondary causation relationships of these factors, laying the foundation for social network analysis. Social network analysis is then applied to quantitatively analyze the CWUBs, identify key factors, and propose intervention strategies. The systematic research framework is shown in Figure 1. The specific research steps are as follows:
Step 1: The literature, standards and specifications, and risk assessment reports were collected as foundational data for identifying construction safety accidents, CWUBs, and their influencing factors in RTE. Content analysis [51] was used as a systematic and objective approach to analyze large volumes of textual data, enabling the transformation of qualitative information into quantifiable data suitable for further statistical analysis. Following this, focus group meetings were conducted to gain insights into experts’ shared understanding of the issues [52]. Through this process, 9 types of construction safety accidents, 11 types of CWUBs, and 35 influencing factors of CWUBs were identified. In total, 55 factors related to CWUBs in RTE were systematically identified.
Step 2: Based on the 55 identified factors, a 24model of accident causation for CWUBs in RTE was constructed, and the causation relationships were qualitatively analyzed. Primary and secondary causation relationships were determined through questionnaire surveys and analysis of the literature, providing a solid theoretical foundation for subsequent quantitative analysis.
Step 3: The UCINET 6.0 software was utilized to establish a visualized network model based on primary and secondary causation relationships. Social network analysis was then applied to quantitatively analyze network relationships, focusing on overall, block, and individual network analysis. Finally, the key network structure and factors of CWUBs in RTE were identified.
Step 4: Following the full-process management philosophy, specific intervention measures for CWUBs in RTE were proposed. These measures include pre-incident interventions for influencing factors, on-site control of CWUBs, and emergency response plans for construction safety accidents.

3.2. Methods

3.2.1. 24model

The 24model, based on accident models such as those of Heinrich, Bird and Loftus, Reason, Stewart, and HFACS, is a linear accident model as well as a systematic one [37,53,54]. The advantages of the 24model are its clear logic, more systematic and modern analysis of accident causes, and the relative independence of each cause module, which avoids the redundant analysis of accident causes [37].
In the 24model, the causes of an accident are divided into four stages: immediate causes, indirect causes, radical causes, and root causes. These causes are categorized into two levels: individual level and organizational level, which is the origin of the 24model’s name. Immediate causes refer to unsafe behaviors and unsafe conditions. Indirect causes include safety knowledge, safety awareness, safety habits, psychological state, and physiological state. Radical causes are organizational or managerial factors. Root causes refer to safety culture, which originates from the management level of the organization and gradually influences frontline workers, reducing unsafe behaviors and ultimately preventing accidents.
This study employs the 24model to qualitatively analyze the causal mechanism of CWUBs in RTE. Furthermore, based on the nonlinear interactions among model factors, the relationships between construction safety accidents, CWUBs, and their influencing factors were categorized into primary and secondary causation relationships. These relationships were identified through a combination of questionnaire surveys and an extensive literature review, providing a solid foundation for subsequent quantitative analysis using social network analysis.

3.2.2. Social Network Analysis

Social network analysis provides a visual representation of the relationships between elements in a complex system, allowing for the identification of influential nodes and key pathways within the network [55]. In risk management, social network analysis can visually present risk networks, identify key causation pathways, and reveal the interrelationships and interactions between various risk factors, aiding in the understanding of the systemic nature of risks [56]. Therefore, this study adopts the social network analysis to comprehensively analyze the complex relationships between factors associated with CWUBs in RTE, enabling a more precise understanding of the causation mechanism of CWUBs and potential accidents in tunnel construction.
Firstly, this study constructs a CWUBs network model in RTE based on primary and secondary causation relationships. Subsequently, quantitative analyses of the factors in the CWUBs network model were conducted from three dimensions: the overall network, block network, and individual network, leading to the identification of key network structure and critical factors.
(1) Analysis of overall network
Overall network density
Overall network density is used to measure the closeness of connections between nodes. The higher the network density, the closer the connections between nodes. The calculation formula is as follows:
D e n s i t y = M N ( N 1 )
M represents the number of actual edges, and N represents the number of nodes in the network.
Average shortest path
The average shortest path refers to the average of the shortest distances between all pairs of nodes in a network. The smaller the average shortest path, the better the connectivity of the network. The calculation formula is as follows:
A v g   D i s t a n c e = 1 N ( N 1 ) i j d i j
dij represents the shortest path from node ni to node nj, and N represents the number of nodes in the network.
Network connectivity
Network connectivity refers to the degree of interconnection between nodes in a network. The higher the connectivity, the greater the accessibility between nodes. The calculation formula is as follows:
C = 1 V N N 1 / 2
V represents the number of unreachable node pairs in the network, and N represents the number of nodes.
(2) Analysis of block network
Block network analysis classifies nodes with similar relational patterns into the same block, allowing for the effective clustering of numerous nodes in the network and simplifying complex network relationships. The specific steps are as follows:
CONCOR classification
The CONCOR method is used to classify network nodes. This method is based on the correlations between nodes and iteratively calculates classifications, grouping nodes into different categories until the classification converges to the optimal result.
Constructing the density matrix
The density matrix is formed by calculating the ratio of actual relationships to possible relationships within and between blocks.
Constructing the image matrix
Based on the α-density index, binary division of the blocks is performed. Blocks with densities higher than the α value are known as “1-block”, and those with densities lower than the α value are known as “0-block”. In general, the α value is taken from the overall network density.
Identifying the core block
Based on the relational characteristics of the blocks, the position of a block in the network can be categorized as either a “receiver” or “sender”, which can be further divided into four roles. Key figures are blocks that both send and receive relationships, with tightly connected internal links, and they are core nodes in the network with high influence. Brokers also both send and receive relationships but have looser internal links and are more active in the network. Mediators primarily send relationships with few receiving relationships, connecting key nodes to other nodes. Isolates neither send nor receive relationships, serving as marginal nodes in the network. In the network model of CWUBs in RTE, key figures are the core block and require particular attention.
(3) Analysis of individual network
The main purpose of individual network analysis is to identify key nodes within the network, typically using centrality as a core indicator. Centrality is divided into the following three types, each focusing on different network characteristics.
Degree centrality
A node directly connected to another node is called its neighbor. Degree centrality measures the number of neighboring nodes a particular node has and reflects the direct connections between nodes. In weighted networks, the calculation of degree centrality also considers the influence of weights. Based on the direction of connections, degree centrality can be divided into in-degree centrality (CD(ni-in)) and out-degree centrality (CD(ni-out)). In-degree centrality refers to the total number of neighboring nodes that directly point to a given node; the higher the in-degree centrality, the more likely that node is influenced by other nodes. Out-degree centrality refers to the total number of neighboring nodes that a particular node directly points to; the higher the out-degree centrality, the more important the node is, as it holds greater control over other nodes. The calculation formula is as follows:
C D ( n i ) = i j V i j V m a x N 1
Here, vij refers to the weight value of the connection from node ni to node nj, and vmax represents the maximum possible weight value.
Betweenness centrality
If two nodes are not directly connected, their connection must pass through other nodes acting as bridges. The nodes serving as bridges in these relationships exert control over the connection, and this control can be measured by betweenness centrality. Betweenness centrality (CB(ni)) represents the number of times a node acts as a bridge along the shortest path between two other nodes, reflecting its ability to control the relationships between other nodes. The calculation formula is as follows:
C B ( n i ) = j k g j k ( n i ) g j k
gjk represents the number of shortest paths between two unconnected nodes nj and nk, and gjk(ni) represents the number of shortest paths that pass through node ni.
Closeness centrality
Based on distance, this metric emphasizes the proximity of a node to all other nodes. In a network model, if the average shortest distance from one node to all other nodes is smaller, that node is closer to the center of the network and holds a more important position. This includes in-closeness centrality (CC(ni-in)) and out-closeness centrality (CC(ni-out)). In-closeness centrality reflects the ease with which other nodes can reach the target node; the higher the value, the closer the target node is to the center of the network, making it more likely to receive influence from other nodes. Out-closeness centrality reflects the ease with which the target node can influence other nodes; the higher the value, the more easily the node can affect other nodes in the network. The calculation formula is as follows:
C C ( n i ) = j = 1 N d ( n i , n j ) 1
Here, d(ni,nj) represents the number of edges in the shortest path connecting nodes ni and nj, and N represents the number of nodes.

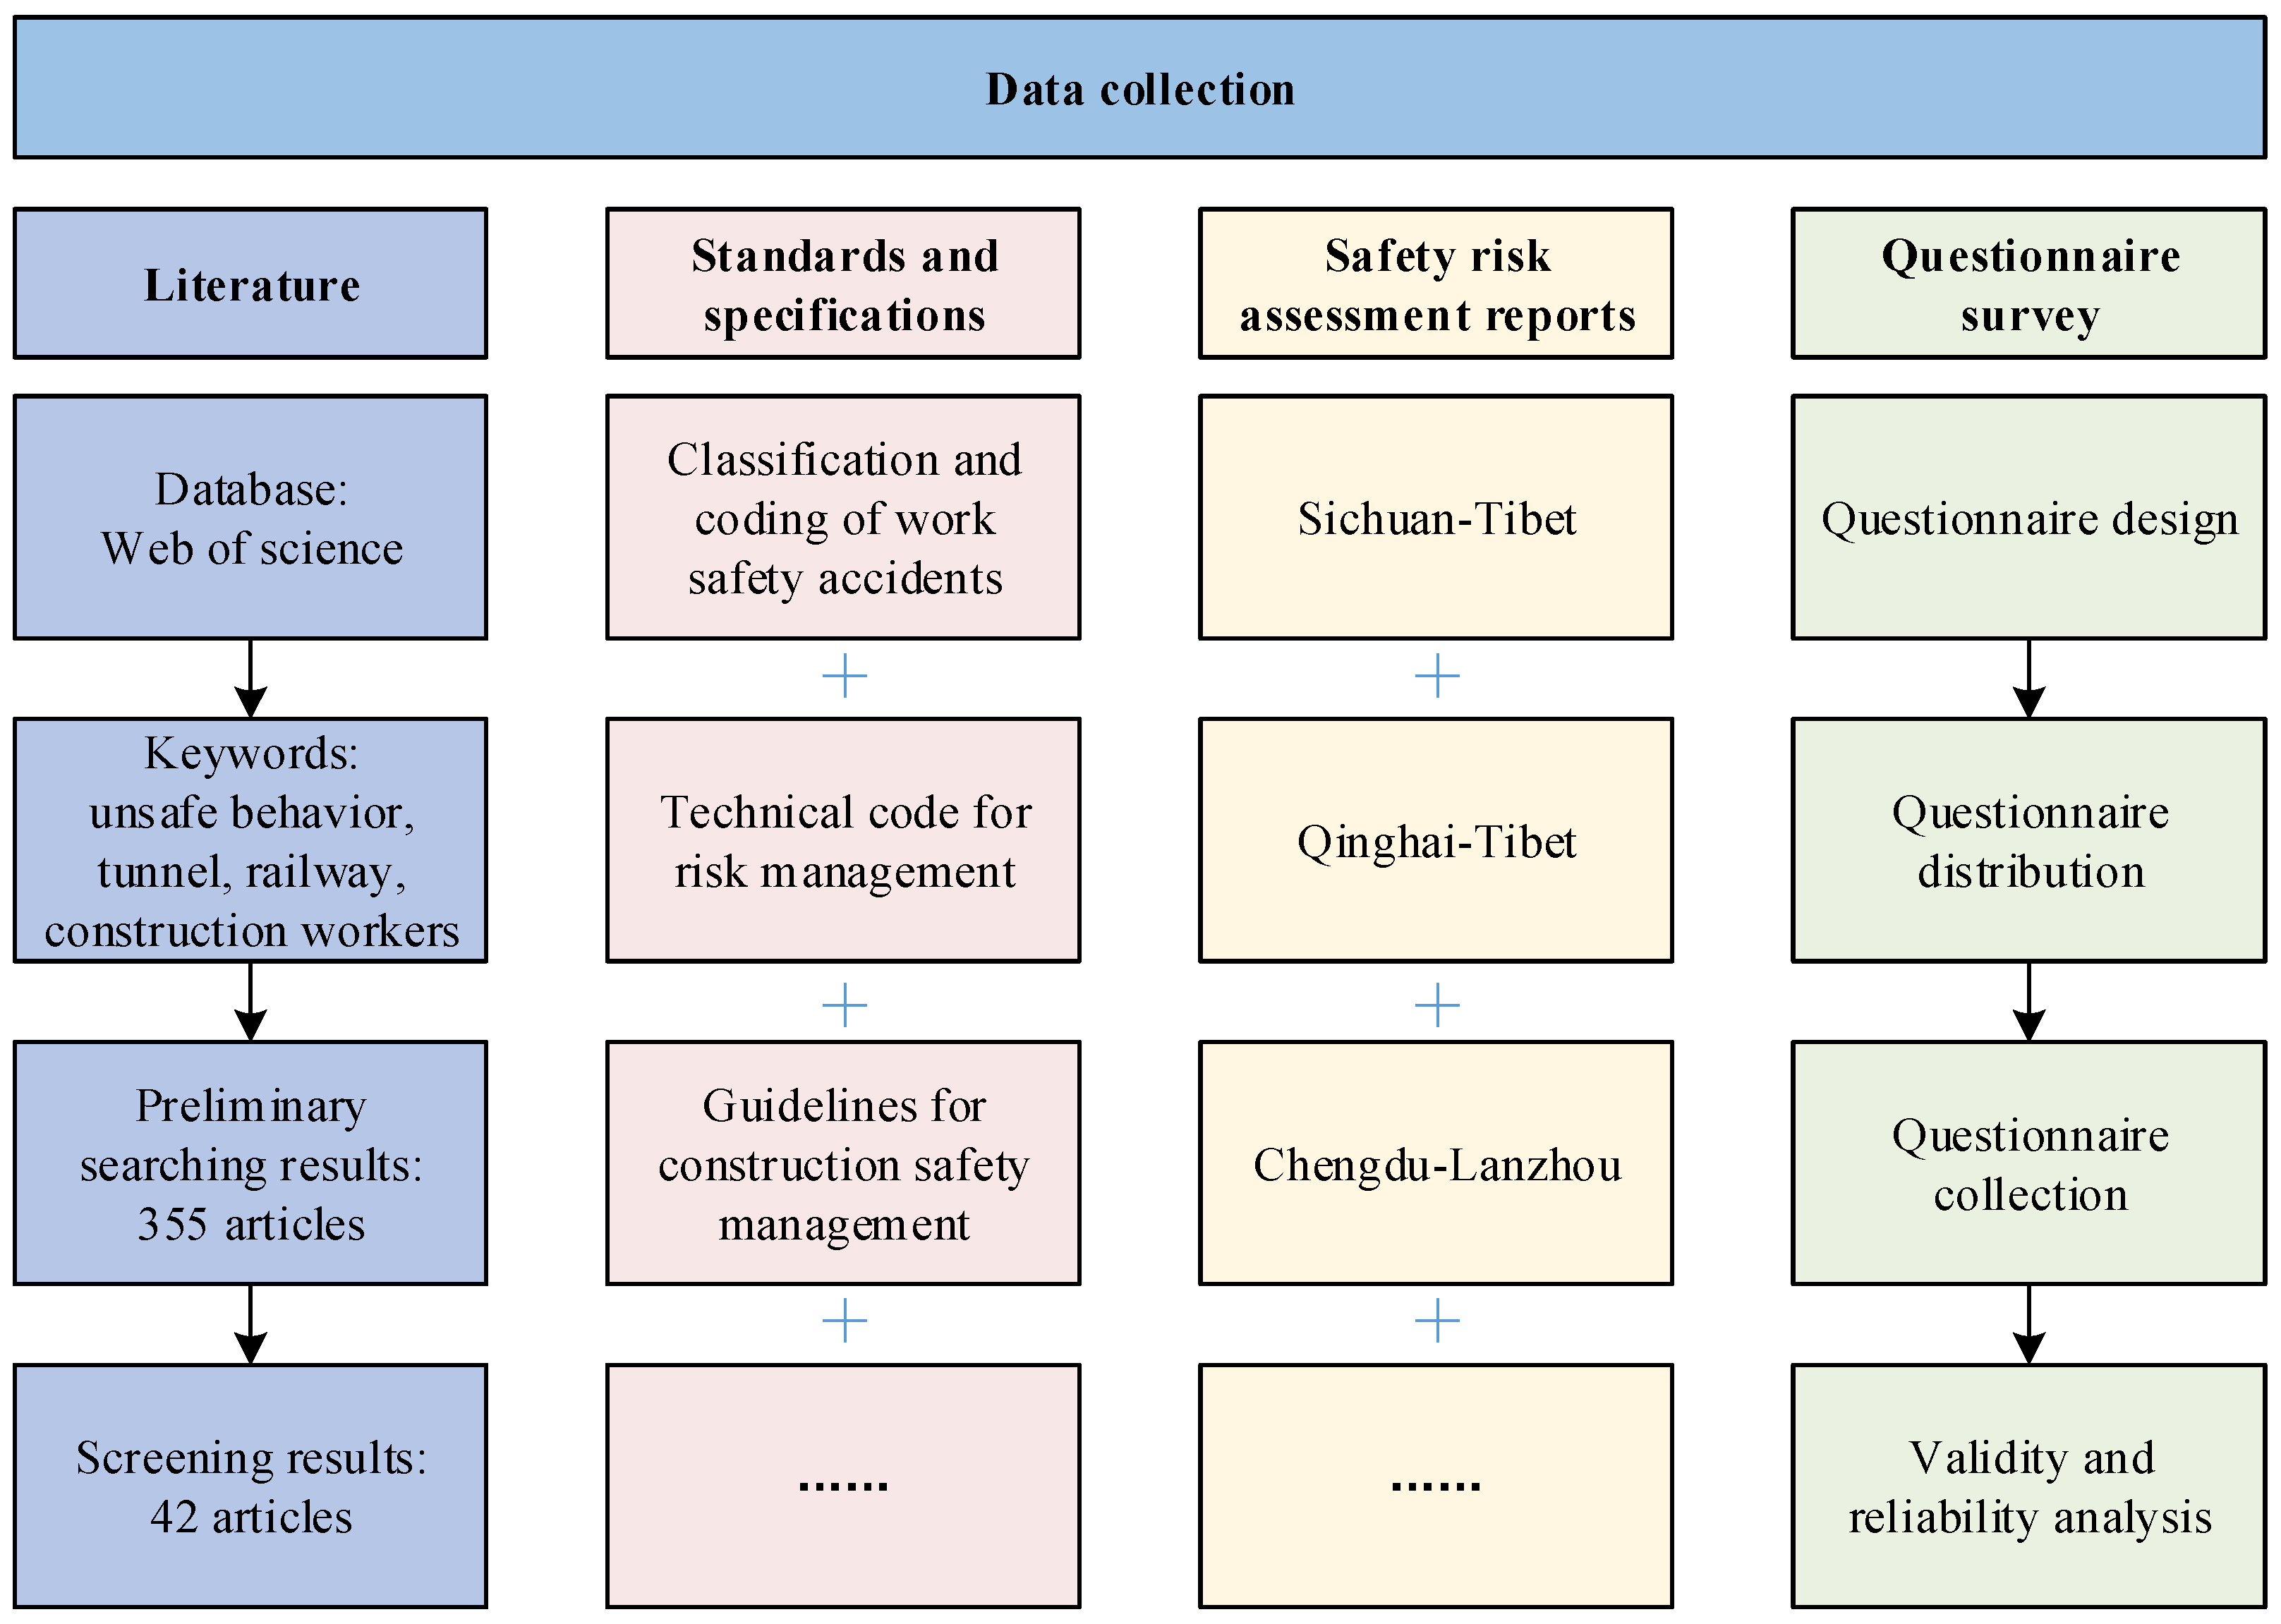
3.3. Data Collection

The data for this study were collected from a variety of sources, ensuring comprehensiveness and scientific rigor. These sources included the literature, standards and specifications, safety risk assessment reports, and questionnaire survey (Figure 2).
The literature, standards and specifications, and safety risk assessment reports were used to identify construction safety accidents, CWUBs, and their influencing factors. The literature data were obtained from Web of Science. An advanced search was conducted using keywords such as “unsafe behavior”, “tunnel”, “railway”, and “construction workers”, resulting in the retrieval of 355 articles. Following a rigorous screening process, including the review of titles, abstracts, and full texts, 42 high-quality papers that met the inclusion criteria were selected as the final data source.
For the standards and specifications related to safety risk in RTE, data were sourced from authoritative Chinese government documents, including the Work Safety Law of the People’s Republic of China [57], Classification and Coding of Work Safety Accidents [58], Technical Code for Risk Management of Railway Construction Engineering [59], Guidelines for Construction Safety Management of Railway Construction Projects [60], Technical Code for Risk Management of Railway Tunnel Projects [61], and Railway Safety Risk Classification Control and Hidden Danger Investigation and Treatment Management Measures [62].
This study obtained safety risk assessment reports through private channels, encompassing data from 117 railway tunnels across several representative projects in China, including the Sichuan–Tibet, Qinghai–Tibet, Chengdu–Lanzhou, Dali–Ruili, and Lijiang–Shangri-La railway projects. Although these cases exhibit a certain degree of regional concentration, they cover a wide range of geological, climatic, and engineering conditions. Therefore, we believe that these data provide a robust empirical foundation to support the objectives and conclusions of this study.
Additionally, the questionnaire survey was designed to collect data on the primary causation relationships of CWUBs in RTE. As determined through focus group meetings, the questionnaire consisted of two parts: the first part gathered basic information from the respondents, including their age, education level, type of employer, and years of work experience. The second part used a matrix scale to assess the degree of influence between the factors within the CWUBs network. The influence was rated on a scale of 0 to 5, with “0” indicating no influence and “5” indicating a very significant influence, following the methodology of Chen et al. [17]. Respondents were asked to score based on their personal knowledge and practical experience. The questionnaire was distributed through an online platform, targeting individuals who had previously participated or were currently involved in RTE, including those from contractors, designers, academies, owners, and engineers.

4. Results

4.1. Identification of Construction Safety Accidents, CWUBs, and Their Influencing Factors in RTE

4.1.1. Construction Safety Accidents in RTE

Common construction safety accidents in RTE are categorized into nine types: R1: collapses, R2: asphyxiation and poisoning, R3: fire and explosion, R4: rock burst, R5: water inrush and mud inflow, R6: mechanical injury, R7: electric shock, R8: lifting injuries, and R9: struck by objects.

4.1.2. CWUBs in RTE

This study systematically identified and classified the CWUBs in RTE, resulting in 11 distinct types: B1: violation of operating procedures, B2: operational error, B3: inadequate safety protection, B4: fatigue-related operations, B5: risk-taking behavior, B6: improper storage of objects, B7: improper use of tools and equipment, B8: distracted behavior, B9: unsafe attire, B10: neglect of management and passive operations, and B11: unauthorized entry into hazardous areas.

4.1.3. Influencing Factors of CWUBs in RTE

This study initially identified 30 influencing factors of CWUBs through content analysis of the literature. Further content analysis of safety risk assessment reports revealed that construction methods had been overlooked in the literature, and the specific characteristics of RTE were not adequately addressed. While construction methods do not directly affect CWUBs, they significantly influence the construction content, work intensity, and work environment, thereby indirectly affecting workers’ performance. As a result, this study categorized construction methods as one of the safety environment factors. Additionally, the factors identified in the literature were primarily based on the general construction or building industry, which, while broadly applicable, lacked specificity in relation to RTE. To enhance the relevance of this study to tunnel construction safety, the importance of geological and hydrological conditions was highlighted. Furthermore, the working environment was further subdivided into confined spaces, dark environment, construction noise, and polluted air, emphasizing the unique characteristics of CWUBs in RTE. In total, 35 influencing factors of CWUBs in RTE were identified and categorized into organizational management factors, individual safety capacity, and safety environment factors (Table 1). Each factor was assigned a corresponding code to facilitate better presentation.

4.2. Qualitative Analysis of Causation Mechanism and Causation Relationships’ Extraction for CWUBs in RTE

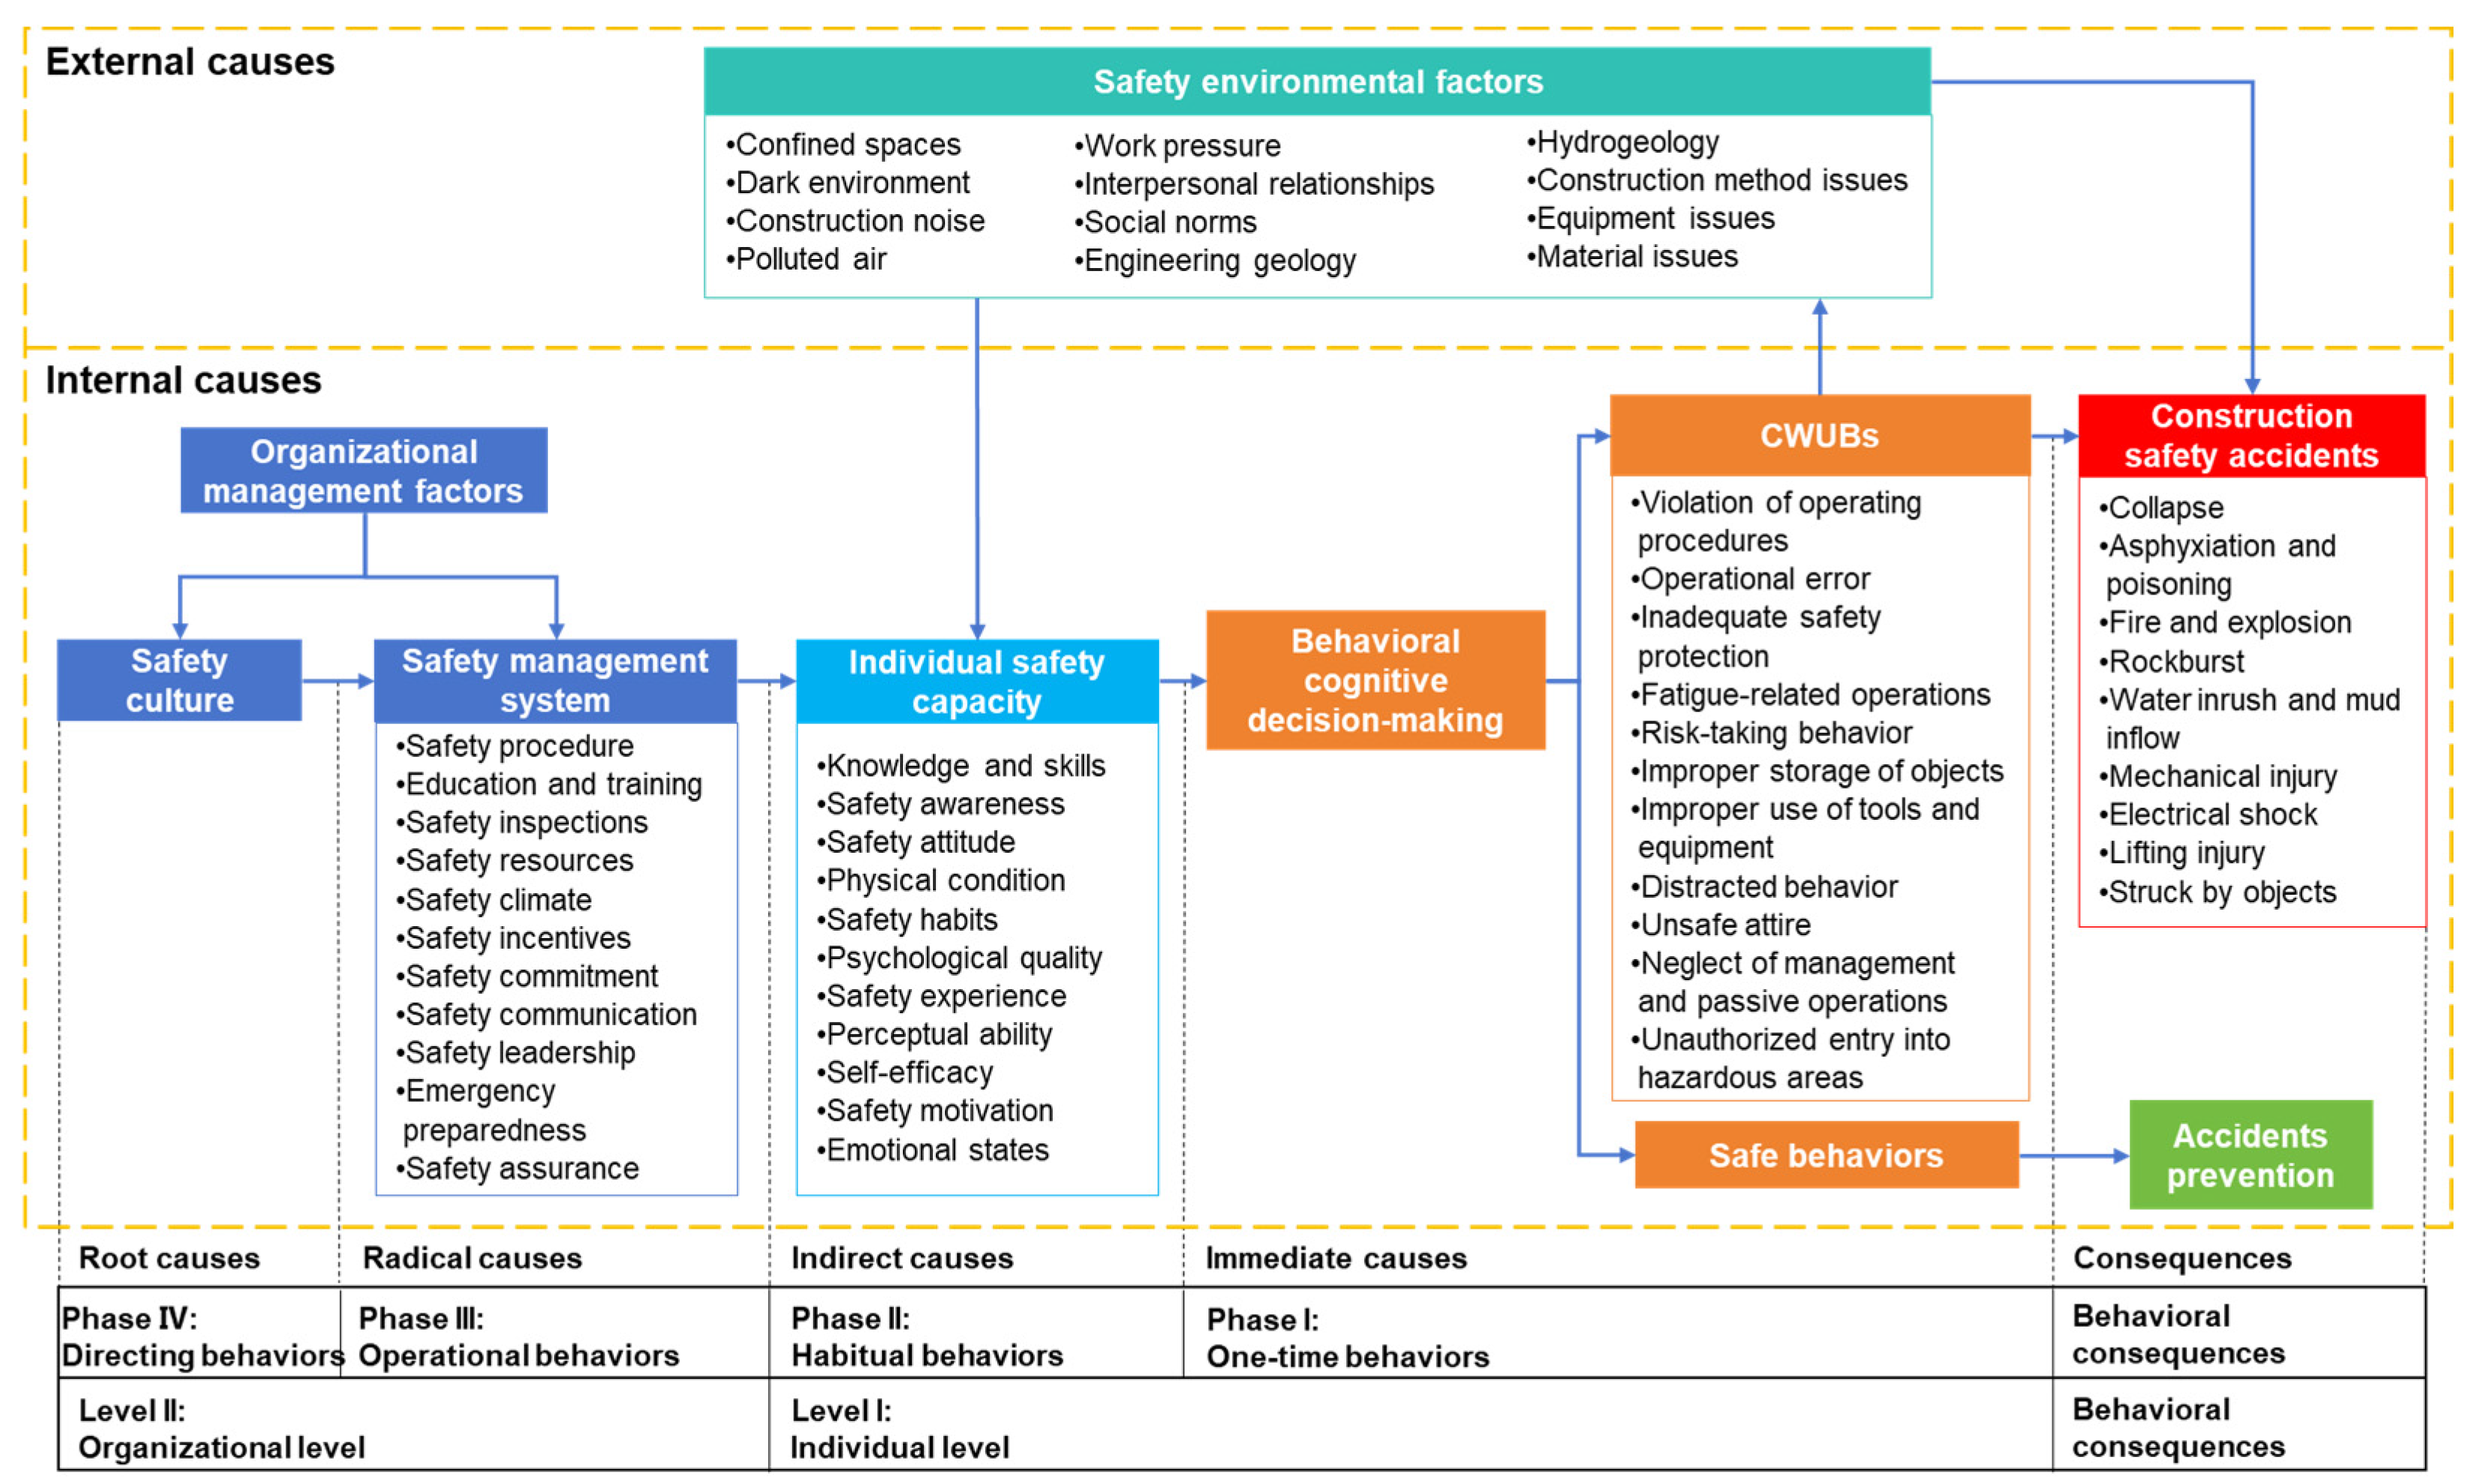
4.2.1. Construction of 24model for CWUBs in RTE

The 24model of CWUBs in RTE (Figure 3) categorizes the causes of accidents into two primary groups: internal causes and external causes. Internal causes are further divided into organizational behaviors and individual behaviors. The accident causation process is structured into four stages: directing behaviors, operational behaviors, habitual behaviors, and one-time behaviors, which correspond to root causes, radical causes, indirect causes, and immediate causes, respectively.
Organizational management factors include the management and guidance of safety operations, such as safety culture and management systems. Effective organizational management standardizes work behaviors, establishes a robust safety management system, and fosters a positive safety culture, thereby promoting and reinforcing safe behaviors. Individual safety capacity refers to the personal capabilities of tunnel construction workers related to safety, including knowledge, skills, safety awareness, and experience, serving as the internal drive for safe behavior. Safety environment factors comprise both physical and psychosocial dimensions. The physical environment includes elements such as natural conditions, equipment, and materials, while the psychosocial environment involves factors like interpersonal relationships and work-related stress.
Behavioral consequences (construction safety accidents) are directly determined by individual behaviors (unsafe and safe behaviors). The cognitive decision-making process of individual behavior is determined by individual safety capacity, which is influenced by organizational-level factors such as safety culture, safety management systems, as well as the safety environment. For example, the lack of a strong safety culture and environment leads to poor safety awareness among tunnel construction workers. This diminished safety awareness results in deviations in behavioral decision-making, which ultimately leads to construction safety accidents. The factors in this model are interconnected, progressively influencing each other, enabling a comprehensive analysis of the process and causes of construction safety accidents.

4.2.2. Determination of Primary and Second Causation Relationships

(1) Causation relationships’ extraction
Based on the logic of nonlinear interactions among factors in the 24model and the constructed 24model of CWUBs in RTE, the network relationships among construction safety accidents, CWUBs, and their influencing factors are presented in a matrix format. In Figure 4, primary causation relationships refer to the dominant causal linkages between factors, which are highlighted with colored markings, while secondary causation relationships denote indirect or supportive linkages and are presented without color highlighting. Subsequently, the strength of these relationships was determined and analyzed.
(2) Determination of primary causation relationships
The primary causation relationships were identified through a questionnaire survey. A total of 287 questionnaires were distributed, with 262 returned, yielding a response rate of 91.29%. Of these, 243 were deemed valid, corresponding to an effective response rate of 92.75%. The distribution of the questionnaire sources is presented in Figure 5. To ensure the diversity and representativeness of the sample, the questionnaires were collected from various project stakeholders, all of whom possessed substantial experience in RTE. Among the respondents, 52 frontline construction workers from contracting firms—those currently or previously directly involved in railway tunnel construction—were included, accounting for 21.4% of the valid sample. Their extensive firsthand experience enables them to accurately reflect on the challenges and risks encountered on construction sites. Overall, 68.7% of the respondents held a bachelor’s degree or higher, and 70.8% had more than ten years of work experience, indicating a highly experienced and knowledgeable sample. A consistency test was conducted on the 243 valid questionnaires, with the ratio of the largest eigenvalue to the second largest being 3.65 (greater than 3), indicating good reliability and internal consistency of the questionnaire data. Additionally, Cronbach’s alpha coefficient was 0.882, which confirms a high level of internal consistency among the questionnaire items. An exploratory factor analysis was also conducted, supporting the construct validity of the questionnaire and ensuring the robustness of the identified primary causation relationships.
The relationship data collected from the questionnaires were summed, averaged, and rounded to form a 55 × 55 data matrix. The numerical values represent the degree to which the “column” factor is influenced by the “row” factor. This process resulted in the primary causation relationship matrix for CWUBs in RTE, as shown in the colored section of Figure 4. It can be observed that the influence of safety culture (M1) on safety procedures (M2), education and training (M3), and safety inspection (M4) is rated at level 5, indicating a very strong influence. In contrast, its influence on physical condition (P4) and emotional state (P11) is rated at level 1, indicating a minimal influence.
(3) Determination of secondary causation relationships
Through a combination of a literature review and relevant theoretical knowledge, this study examined the secondary causation relationships of CWUBs in RTE. “0” indicates the absence of influence between factors, while “1” represents the presence of an influence. The corresponding results are displayed in the uncolored section of Figure 4.
(4) Matrix merging
By integrating the results from the steps mentioned above, the relationship data for both primary and secondary causation relationships in the 24model of CWUBs in RTE were obtained. These relationship matrices were merged to form the final relationship matrix of CWUBs in RTE (Figure 4).

4.3. Quantitative Analysis of Causation Mechanism for CWUBs in RTE

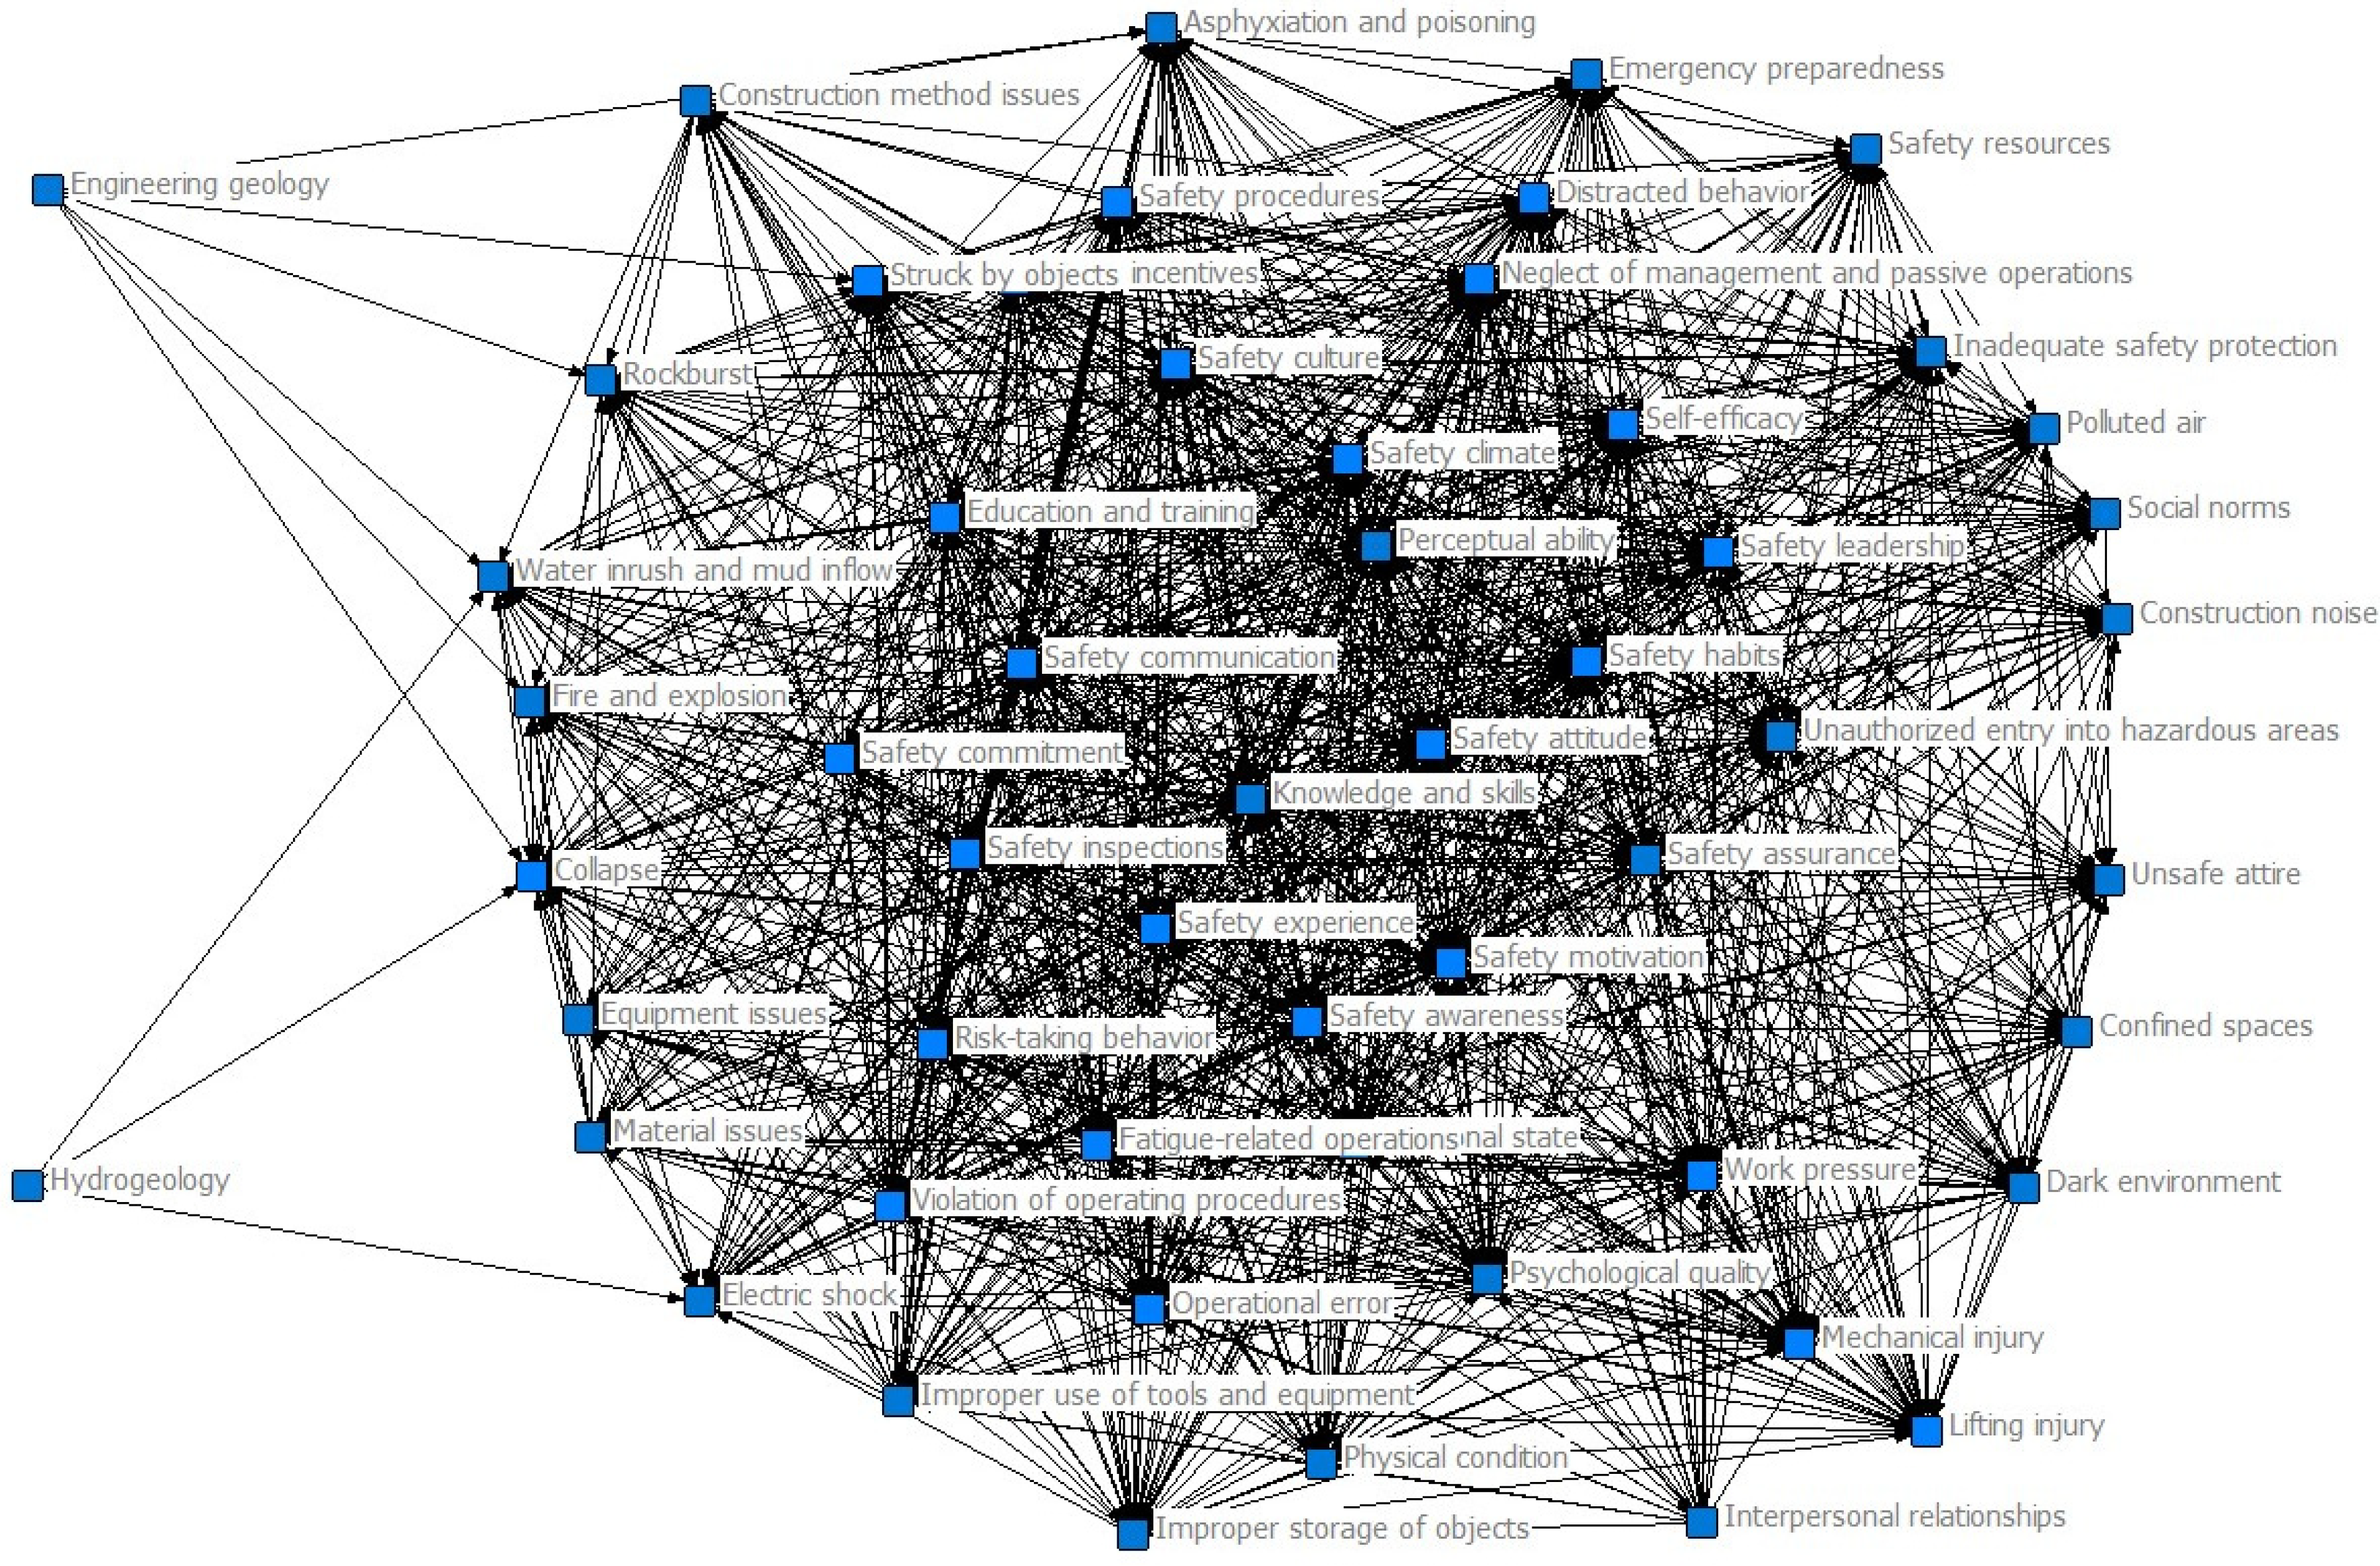
4.3.1. Construction of the Network Model for CWUBs in RTE

The relationship matrix of CWUBs in RTE (Figure 4), constructed above, was imported into UCINET 6.0 software. Using the NetDraw plugin, a visualized network model was generated (Figure 6). This network model consists of 55 nodes, corresponding to the 55 factors associated with CWUBs in RTE.

4.3.2. Overall, Block, and Individual Network Analysis of CWUBs in RTE

(1) Analysis of overall network
Network density
As shown in Table 2, the overall network density of the network model for CWUBs in RTE is 0.442, with a total of 1314 connections among the 55 network nodes. On average, each influencing factor is connected to 23.89 other factors. These results indicate the complexity and tight interconnections between the influencing factors of CWUBs in RTE. Any change in a single factor could trigger fluctuations across the entire system, indicating the potential for a chain reaction of safety risks throughout the network.
Average shortest path
As shown in Table 3, the network diameter of the CWUBs model for RTE is 3, with an average shortest path length of 1.218, indicating that any two nodes can be connected within three steps. This short average distance reflects a high degree of clustering, where interconnected factors form a cohesive structure. Consequently, changes in a single factor can quickly propagate through the network, increasing systemic risk and accelerating the spread of safety risks in RTE.
Network connectivity
As shown in Table 4, the network connectivity of the CWUBs model for RTE is 0.600, indicating high accessibility between nodes and tightly interconnected relationships, which reflects the complexity of the overall network. Additionally, the network’s reciprocity is only 0.160, suggesting that most connections between nodes are unidirectional, which is consistent with the 24model and also aligns with the “behavior→accident” causal chain in accident causation theory.
(2) Block network analysis
By performing block analysis on the network model of CWUBs in RTE, the fit indices for different block numbers are presented in Table 5. Typically, a fit index greater than 0.7 is considered sufficient for good fit, and based on this criterion, the network can be divided into 16 blocks.
Secondly, the density of different blocks is calculated, resulting in the block density matrix for the CWUBs network model in RTE. Based on the previous calculation, the overall network density of the CWUBs network model is 0.442. Using the α-density standard, values greater than 0.442 are assigned 1, while values less than 0.442 are assigned 0, producing the block image matrix. The number of sending and receiving relationships for each block is then counted, as shown in Table 6.
Through the above operations, the clustering and positional identification of the network model of CWUBs in RTE were completed. K13 (B1: violation of operating procedures, B2: operational errors, B5: risk-taking behaviors) and K14 (B4: fatigue-related operations, B8: distracted behavior, B10: neglect of management and passive operations): These blocks receive numerous relationships but send fewer, while maintaining strong internal connections, classifying them as key figures. In the network, these blocks typically occupy core positions and exert significant control over other factors. On the one hand, the influencing factors for these CWUBs are numerous, particularly in the challenging tunnel environments, leading to a relatively high frequency of unsafe behaviors in K13 and K14. On the other hand, the close interrelationships between these unsafe behaviors suggest a tendency toward co-occurrence, making them more likely to trigger multiple construction safety accidents within the network.
(3) Analysis of individual network
Degree centrality
The degree centrality of the CWUBs network model for RTE was calculated. Nodes with higher out-degree and in-degree values were identified as key factors. The top 10 factors ranked by out-degree and in-degree centrality were selected as the primary focus of this study, as shown in Table 7.
As shown in the table, the top 10 factors ranked by in-degree centrality are related to individual safety capabilities and construction safety accidents. Since workers are the central agents in construction activities, their safety capabilities are influenced by organizational management, environmental, and personal factors. Additionally, construction accidents are the result of the transmission of risk factors, making them more susceptible to fluctuations caused by other factors within the network.
On the other hand, the top 10 factors ranked by out-degree centrality in the network model of CWUBs in RTE are primarily related to organizational management and individual safety capabilities. This is because these factors are positioned upstream in construction management, giving them strong control and influence over both unsafe behaviors and potential construction safety accidents.
Betweenness centrality
The betweenness centrality of various factors is shown in Table 8, listing the top 10 factors.
These factors are located on the shortest paths between various interacting factors, serving as bridges between node pairs that do not have direct connections. As key mediators, these factors play a pivotal role in the transmission of risks within the network of CWUBs in RTE, exerting significant control over risk propagation.
Closeness Centrality
Nodes with high in-closeness and out-closeness centrality are considered key factors. The top 10 ranked factors for both in-closeness and out-closeness centrality are selected as the main research subjects, as shown in Table 9.
According to the table, the factors ranked in the top ten for in-closeness centrality in the network model of CWUBs in RTE are primarily related to construction safety accidents. Among these, lifting injury has the highest in-closeness centrality at 0.720, followed by struck by objects and mechanical injury. These three types of accidents are most closely related to other risk factors in RTE, with the shortest causation chains, making them sudden and unpredictable risks that require heightened prevention in safety management.
On the other hand, the top ten factors for out-closeness centrality in the network are all organizational management factors. Safety climate holds the highest out-closeness centrality at 0.871, followed by safety culture and education and training. These factors have the shortest total distance to other nodes in the CWUBs network, meaning that they can quickly influence other nodes, and the transmission of risk fluctuations from these factors happens the fastest.

4.3.3. Identification of Key Network Structure and Factors

Through a comprehensive analysis of the overall network, block network, and individual network of CWUBs in RTE, key network structure and factors were systematically identified. In the overall and block network analyses, blocks K13 and K14 demonstrated significant dominance within the network. The high-density connections and synergistic effects among internal factors positioned these blocks as the network’s core. Critical factors within these core blocks, such as safety commitment and safety habits, were identified as priority management targets due to their substantial influence on the stability and functionality of the overall network.
In the individual network analysis, centrality metrics—including degree centrality, betweenness centrality, and closeness centrality—were employed to identify key factors from multiple perspectives. Factors that appeared in at least two of these analyses, along with those situated within the core blocks, were prioritized for targeted intervention and management strategies. This multi-layered analysis distinctly elucidates the key network structure and critical factors, highlighting the three-tier accident causation mechanism: “influencing factors—CWUBs—construction safety accidents”. The results systematically reflect the strength and pathways of the relationships among factors (Figure 7).
The critical accident causation pathways within the network originate from safety culture, traverse intermediate nodes such as safety commitment and safety habits, and ultimately lead to specific accident consequences (e.g., mechanical injury or collapse). These pathways underscore the interconnected and synergistic nature of accident causation, wherein construction safety accidents are typically the result of the combined effects of multiple factors. The hierarchical and complex characteristics of these pathways emphasize the necessity of implementing systematic interventions, particularly focusing on the precise management of core factors to mitigate risks effectively.

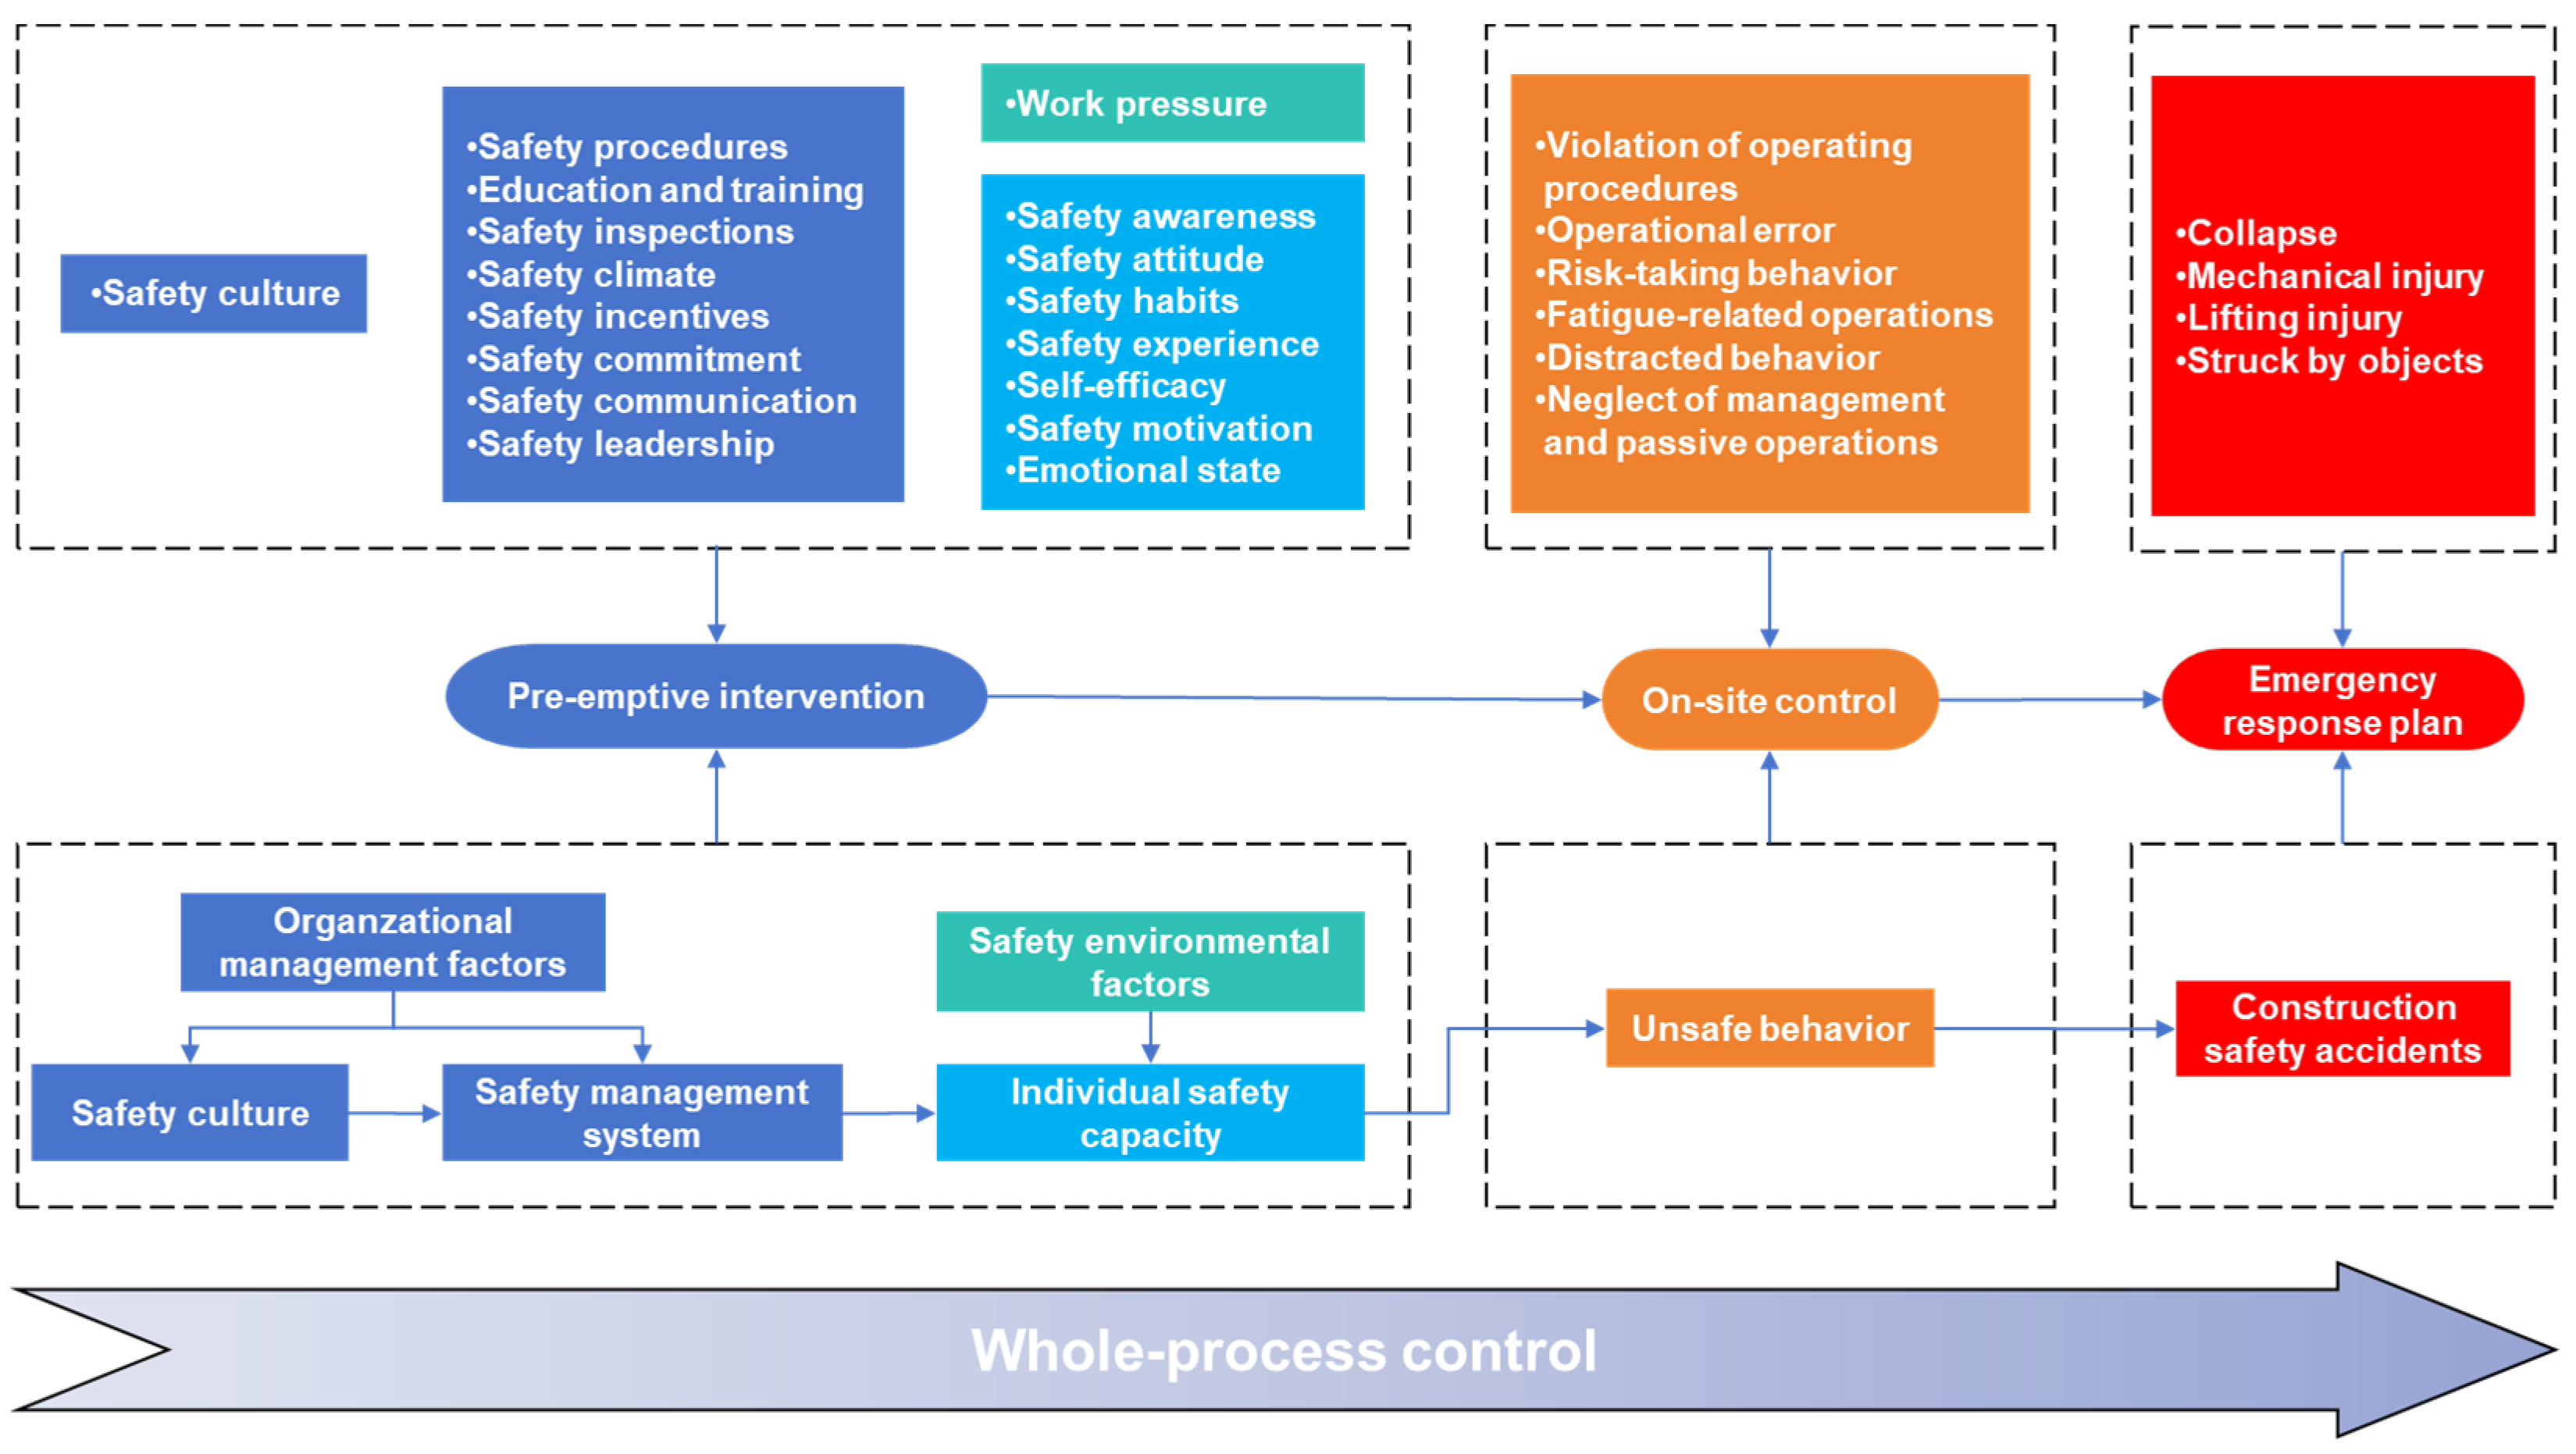
4.4. Intervention Strategies for CWUBs in RTE

The implementation of intervention strategies follows the concept of whole-process control, which emphasizes pre-emptive prevention, on-site control, and emergency management to comprehensively manage CWUBs in RTE. This strategy aims to prevent accidents at their source, ensure safety during the construction process through effective control measures, and establish emergency response mechanisms to minimize the impact of accidents, ensuring the safety of workers and the smooth progress of the project. The framework of intervention strategies for CWUBs in RTE is shown in Figure 8. By adopting a multi-dimensional and tiered approach, the intervention measures comprehensively address the governance of CWUBs and risk control for RTE.
Building upon the identified key network structure and 27 critical factors, this study proposes targeted intervention measures spanning three stages: pre-emptive intervention of influencing factors, on-site control of CWUBs, and emergency response plan for construction safety accidents.

4.4.1. Pre-Emptive Intervention of CWUBs’ Influencing Factors

The goal of pre-emptive intervention is to prevent CWUBs in RTE by implementing proactive measures to reduce risks. Specific measures include the following:
Cultivating a positive safety culture: Strengthening safety awareness and improving the overall safety climate.
Establishing and enforcing safety procedures: Implementing standardized safety procedures and inspections to ensure operational compliance.
Enhancing safety incentives: Improving workers’ safety motivation and self-efficacy through incentives and clear safety communication channels.
Strengthening safety leadership: Fulfilling safety commitments, setting strong examples, and guiding workers toward correct safety attitudes and behaviors.
Providing education and training: Enhancing individual safety capacity and awareness while paying attention to both the physical and psychological conditions of workers to prevent unsafe behaviors.

4.4.2. On-Site Control of CWUBs

On-site control strategies focus on effectively preventing unsafe behaviors during the construction process. Specific measures include the following:
Clarifying operational standards: Strictly preventing violations of operating procedures.
Reducing operational errors: Enhancing professionalism through training, eliminating risk-taking behaviors.
Preventing fatigue-related operations: Enforcing strict shift schedules and maintaining vigilance to prevent distracted behaviors.
Strengthening responsibility awareness: Preventing passive or negligent behaviors to reduce the occurrence of unsafe behaviors on-site, ensuring that workers’ safety awareness and actions meet safety requirements, and stabilizing both the construction environment and progress.

4.4.3. Emergency Response Plan of Safety Accidents

The emergency response plan includes on-site response and post-event recovery. Specific measures include the following:
On-site response: Establishing emergency response procedures to ensure rapid action during accidents, including emergency notifications, on-site safety measures, personnel evacuation, rescue coordination, and collaboration with professional rescue teams.
Post-event recovery: Implementing accident site clean-up, investigations, accountability measures, improvement suggestions, information disclosure, and public opinion management, ensuring the effective execution of post-accident recovery efforts. The plan also emphasizes the importance of emergency preparedness, including communication systems, rescue team and equipment readiness, technical support, and regular emergency training and drills to enhance overall emergency response capabilities.

5. Discussion

This study presents a comprehensive analysis of CWUBs in RTE, integrating an innovative approach combining the 24model with social network analysis. It identifies the causation mechanism, highlights 27 key factors, and proposes targeted intervention strategies. Unlike previous studies that primarily focused on building construction and the broader construction industry, this research emphasizes the unique safety environmental factors in RTE, including construction methods, engineering geology, hydrogeology, and specific factors influencing worker behavior, such as confined spaces, dark environment, and polluted air—elements often overlooked in prior research.
In qualitatively analyzing the causation mechanism of CWUBs in RTE, this study refines the traditional 24model by reclassifying equipment issues, interpersonal relationships, and work pressures as environmental factors, thus clarifying their causative relationships. The findings indicate that organizational factors (e.g., safety culture, safety management system) and individual safety capabilities (e.g., safety knowledge) significantly influence worker behavior, while safety environmental factors further increase accident likelihood. This not only supports previous findings on organizational influence but also underscores the importance of environmental factors. Furthermore, this study identifies 55 causation relationships among factors, categorizing them into primary and secondary causation relationships. Primary causation relationships were identified through questionnaire surveys, while secondary relationships were determined through a literature review. Based on these findings, the social network model was constructed. Compared to approaches that solely rely on questionnaires [17], this mixed-method approach not only comprehensively considers all factors but also simplifies the process of determining causation relationships.
Through social network analysis at the overall, block, and individual network levels, this study further quantitatively identifies key network structures and factors. The critical accident causation pathways within the network originate from safety culture, traverse intermediate nodes such as safety commitment and safety habits, and ultimately lead to specific accident consequences (e.g., mechanical injury or collapse). This causal chain is strongly supported by established safety culture frameworks, consistent with the findings of [24], which emphasize the role of organizational safety culture in shaping workers’ safety behaviors and attitudes. The pathways highlight the interconnected and synergistic nature of accident causation, where construction safety accidents are often the result of a combination of factors operating at the organizational, individual, and environmental levels. Additionally, unlike previous studies that focus on unidirectional factor transmission [12], this research considers complex network relationships, proposing specific intervention measures based on key factors and an integrated risk management approach, emphasizing pre-emptive prevention, on-site control, and emergency management with a multi-dimensional safety management strategy.
This study systematically identifies the causation mechanisms of CWUBs in the RTE context, emphasizing the multi-level interactions among organizational, individual, and environmental factors. By doing so, it expands existing theoretical frameworks and provides new insights into understanding the formation of unsafe behaviors. Additionally, through the identification of 27 key factors, this study offers a structured, priority-based risk mitigation guideline for safety managers and policymakers, optimizing safety management strategies and enhancing construction site safety. Furthermore, this study proposes a multi-dimensional safety management strategy, emphasizing the integration of preventive measures, on-site control, and emergency management. Rather than implementing these measures in isolation, this research advocates for their systematic integration into a unified safety management framework, ensuring a comprehensive and proactive approach to risk prevention and mitigation.
However, this study has certain limitations. It primarily considers the direct influence of organizational, individual, and safety environmental factors on CWUBs in RTE, while the indirect impact of design factors has not been fully addressed. In the analysis of causation mechanisms, the inherent non-directionality of social network analysis poses challenges in addressing the causation mechanism underlying CWUBs in RTE. To mitigate this issue, we integrated the 24model with social network analysis to construct a directed network. Nevertheless, the analysis of causation mechanism did not consider the dynamic characteristics of risk networks. Future research should explore dynamic models, such as agent-based modeling and the combination of social network analysis, to capture the evolution of the risk network. Additionally, targeted intervention measures for key factors have not been validated through case studies. Future studies should conduct empirical analyses with practical case studies, emphasizing the integration of strategies and leveraging technologies such as big data and artificial intelligence to address CWUBs and enable real-time, data-driven safety management.

6. Conclusions

This study innovatively integrates the 24model and social network analysis to systematically examine the causation mechanism of CWUBs in RTE. For the first time, it explores inter-factor relationships from a network perspective, identifies key factors, and proposes targeted intervention strategies. The main conclusions are as follows:
(1) Identification of 55 factors related to CWUBs in RTE
Through comprehensive content analysis and focus group meetings, this study identifies 55 factors associated with CWUBs in RTE, including 9 types of construction safety accidents, 11 types of CWUBs, and 35 influencing factors. The influencing factors were categorized into three dimensions: organizational management, individual safety capacity, and safety environment.
(2) Qualitative analysis of causation mechanism for CWUBs in RTE
The traditional 24model was refined by categorizing internal and external organizational factors and analyzing behavioral stages to qualitatively examine the interactions among 55 factors in RTE. The results indicate that construction safety accidents are directly influenced by individual behaviors, with cognitive decision-making driven by individual safety capacity, which, in turn, is shaped by organizational factors. Additionally, the primary and secondary causation relationships among factors were identified through questionnaire surveys and literature analysis. This approach comprehensively considered all factors while simplifying the process of determining causation relationships.
(3) Quantitative analysis of network relationships and key factors for CWUBs in RTE
A CWUBs network model in RTE was developed. Through the analysis of the overall network (network density, average shortest path, network connectivity), block network, and individual network (degree centrality, betweenness centrality, closeness centrality), the relationships among 55 factors were revealed from a network perspective, leading to the identification of key network structure and 27 critical factors.
(4) Proposal of intervention strategies for CWUBs in RTE
Based on a “pre-emptive prevention, on-site control, and emergency management” approach, nine specific intervention measures and a comprehensive emergency response plan were proposed to proactively prevent and address CWUBs and associated construction accidents.
This study provides a systematic and innovative analytical perspective on CWUBs in RTE, addressing a significant gap in the research on the causation of unsafe behaviors and accidents in complex systems. The proposed “prevention–control–emergency management” interventions are directly applicable to tunnel construction safety management practices, aiding in improving on-site safety levels, reducing accident rates, and supporting the sustainable development of railway engineering. However, this study has certain limitations. The data used in this research, particularly the engineering case studies from China, may limit the generalizability of the findings to other regions with different contextual factors. Additionally, the causative relationships among the 55 identified factors have not been empirically validated, and the 27 key factors identified through centrality metrics still lack real-world validation, such as through case studies. To address this, it is recommended that pilot applications of the proposed intervention measures be conducted in actual RTE projects to assess their practical effectiveness. Additionally, the dynamic characteristics of risk networks were not considered in this analysis. Future research should focus on incorporating dynamic models to capture the evolving nature of risk networks and evaluate the combined effectiveness of intervention strategies over time to improve overall safety management outcomes.

Author Contributions

Conceptualization, X.H. and B.X.; methodology, X.H. and Q.C.; data curation, Y.Y.; writing—original draft preparation, X.H. and Q.C.; writing—review and editing, B.X. and H.C.; supervision, H.C.; funding acquisition, H.C. All authors have read and agreed to the published version of the manuscript.

Funding

This research was supported by the National Natural Science Foundation of China (Grant No. 72171237), the Natural Science Foundation of Hunan Province (Grant No. 2025JJ60464), and the Science and Technology Progress and Innovation Project of the Hunan Provincial Department of Transportation (Grant No. 202133).

Data Availability Statement

The raw data supporting the conclusions of this article will be made available by the authors on request.

Conflicts of Interest

Author Qintao Cheng was employed by the company Changsha Urban Development Group Co., Ltd. The remaining authors declare that the research was conducted in the absence of any commercial or financial relationships that could be construed as a potential conflict of interest.

Abbreviations

The following abbreviations are used in this manuscript:
CWUBsConstruction workers’ unsafe behaviors
RTERailway tunnel engineering

References

  1. Lin, Y.; Qin, Y.; Wu, J.; Xu, M. Impact of high-speed rail on road traffic and greenhouse gas emissions. Nat. Clim. Change 2021, 11, 952–957. [Google Scholar] [CrossRef]
  2. High Speed Lines in the World. Available online: https://uic.org/IMG/pdf/20231001_high_speed_lines_in_the_world.pdf (accessed on 29 April 2025).
  3. Zhang, D.L.; Sun, Z.Y.; Fang, Q. Scientific problems and research proposals for Sichuan-Tibet railway tunnel construction. Undergr. Space 2022, 7, 419–439. [Google Scholar] [CrossRef]
  4. Zhang, L.M.; Wu, X.G.; Qin, Y.W.; Skibniewski, M.J.; Liu, W.L. Towards a fuzzy bayesian network based approach for safety risk analysis of tunnel-induced pipeline damage. Risk Anal. 2016, 36, 278–301. [Google Scholar] [CrossRef] [PubMed]
  5. Pooladvand, S.; Hasanzadeh, S. Impacts of stress on workers’ risk-taking behaviors: Cognitive tunneling and impaired selective attention. J. Constr. Eng. Manag. 2023, 149, 04023060. [Google Scholar] [CrossRef]
  6. Chi, S.; Han, S.; Kim, D.Y. Relationship between unsafe working conditions and workers’ behavior and impact of working conditions on injury severity in us construction industry. J. Constr. Eng. Manag. 2013, 139, 826–838. [Google Scholar] [CrossRef]
  7. Goh, Y.M.; Sa’adon, N.F.B. Cognitive factors influencing safety behavior at height: A multimethod exploratory study. J. Constr. Eng. Manag. 2015, 141, 04015003. [Google Scholar] [CrossRef]
  8. Ai Lin Teo, E.; Yean Yng Ling, F.; Sern Yau Ong, D. Fostering safe work behaviour in workers at construction sites. Eng. Constr. Archit. Manag. 2005, 12, 410–422. [Google Scholar] [CrossRef]
  9. Leung, M.Y.; Chan, Y.S.; Yuen, K.W. Impacts of stressors and stress on the injury incidents of construction workers in Hong Kong. J. Constr. Eng. Manag. 2010, 136, 1093–1103. [Google Scholar] [CrossRef]
  10. Fang, D.P.; Wu, C.L.; Wu, H.J. Impact of the supervisor on worker safety behavior in construction projects. J. Manag. Eng. 2015, 31, 04015001. [Google Scholar] [CrossRef]
  11. Prayogo, A.; Teophilea, H.S.; Nugraha, P.; Sunindijo, R.Y.; Maharani, C.F.; Yang, K.J. Noise disturbance increases negative emotions and unsafe behaviour among construction workers. Int. J. Constr. Manag. 2024, 1–8. [Google Scholar] [CrossRef]
  12. Liu, W.; Zhao, T.S.; Zhou, W.; Tang, J.J. Safety risk factors of metro tunnel construction in China: An integrated study with EFA and SEM. Saf. Sci. 2018, 105, 98–113. [Google Scholar] [CrossRef]
  13. Shin, M.; Lee, H.-S.; Park, M.; Moon, M.; Han, S. A system dynamics approach for modeling construction workers’ safety attitudes and behaviors. Accid. Anal. Prev. 2014, 68, 95–105. [Google Scholar] [CrossRef] [PubMed]
  14. Ye, G.; Yue, H.Z.; Yang, J.J.; Li, H.Y.; Xiang, Q.T.; Fu, Y.; Cui, C. Understanding the sociocognitive process of construction workers’ unsafe behaviors: An agent-based modeling approach. Int. J. Environ. Res. Public Health 2020, 17, 1588. [Google Scholar] [CrossRef]
  15. Zaira, M.M.; Hadikusumo, B.H.W. Structural equation model of integrated safety intervention practices affecting the safety behaviour of workers in the construction industry. Saf. Sci. 2017, 98, 124–135. [Google Scholar] [CrossRef]
  16. Kong, T.; Fang, W.L.; Love, P.E.D.; Luo, H.B.; Xu, S.J.; Li, H. Computer vision and long short-term memory: Learning to predict unsafe behaviour in construction. Adv. Eng. Inf. 2021, 50, 101400. [Google Scholar] [CrossRef]
  17. Chen, W.Q.; Deng, J.J.; Niu, L.C. Identification of core risk factors and risk diffusion effect of urban underground engineering in China: A social network analysis. Saf. Sci. 2022, 147, 105591. [Google Scholar] [CrossRef]
  18. Chen, H.Y.; Shen, G.Q.; Feng, Z.B.; Yang, S. Safety risk assessment of shield tunneling under existing tunnels: A hybrid trapezoidal cloud model and Bayesian network approach. Tunn. Undergr. Space Technol. 2024, 152, 105936. [Google Scholar] [CrossRef]
  19. Zhou, H.; Gao, B.W.; Zhao, X.B.; Peng, L.Y.; Bai, S.C. Developing a cloud evidence method for dynamic early warning of tunnel construction safety risk in undersea environment. Dev. Built Environ. 2023, 16, 100225. [Google Scholar] [CrossRef]
  20. Yang, J.J.; Ye, G.; Xiang, Q.T.; Kim, M.; Liu, Q.J.; Yue, H.Z. Insights into the mechanism of construction workers’ unsafe behaviors from an individual perspective. Saf. Sci. 2021, 133, 105004. [Google Scholar] [CrossRef]
  21. Liang, Q.; Zhou, Z.Y.; Ye, G.; Shen, L.Y. Unveiling the mechanism of construction workers’ unsafe behaviors from an occupational stress perspective: A qualitative and quantitative examination of a stress-cognition-safety model. Saf. Sci. 2022, 145, 105486. [Google Scholar] [CrossRef]
  22. Hu, Z.; Chan, W.T.; Hu, H.; Xu, F. Cognitive factors underlying unsafe behaviors of construction workers as a tool in safety management: A review. J. Constr. Eng. Manag. 2023, 149, 03123001. [Google Scholar] [CrossRef]
  23. Xiang, Q.T.; Liu, Y.; Goh, Y.M.; Ye, G.; Safiena, S. Investigating the impact of hazard perception failure on construction workers’ unsafe behavior: An eye-tracking and thinking-aloud approach. J. Constr. Eng. Manag. 2024, 150, 04024066. [Google Scholar] [CrossRef]
  24. Ni, G.D.; Zhang, Q.; Fang, Y.Q.; Zhang, Z.Y.; Qiao, Y.N.; Wang, W.S.; Deng, Y.L. How resilient safety culture correct unsafe behavior of new generation of construction workers: The mediating effects of job crafting and perceived work meaningfulness. Eng. Constr. Archit. Manag. 2023, 30, 4821–4845. [Google Scholar] [CrossRef]
  25. Dedobbeleer, N.; Beland, F. A safety climate measure for construction sites. J. Saf. Res. 1991, 22, 97–103. [Google Scholar] [CrossRef]
  26. Sommovigo, V.; Setti, I.; Maiolo, M.E.; Argentero, P. Tunnel construction workers’ well-being: The role of job control and supervisor support. Int. J. Constr. Manag. 2021, 21, 945–957. [Google Scholar] [CrossRef]
  27. Choudhry, R.M.; Fang, D.P. Why operatives engage in unsafe work behavior: Investigating factors on construction sites. Saf. Sci. 2008, 46, 566–584. [Google Scholar] [CrossRef]
  28. Hu, Y.P.; Wang, M.N.; Wang, Q.L.; Liu, D.G.; Tong, J.J. Field test of thermal environment and thermal adaptation of workers in high geothermal tunnel. Build. Environ. 2019, 160, 106174. [Google Scholar] [CrossRef]
  29. Kim, D.K.; Park, S. Business cycle and occupational accidents in Korea. Saf. Health Work 2020, 11, 314–321. [Google Scholar] [CrossRef] [PubMed]
  30. Guo, S.Y.; Zhao, Y.J.; Luoren, Y.Q.; Liang, K.Z.; Tang, B. Knowledge discovery of correlations between unsafe behaviors within construction accidents. Eng. Constr. Archit. Manag. 2022, 29, 1797–1816. [Google Scholar] [CrossRef]
  31. Heinrich, H.W. Industrial Accident Prevention; A Scientific Approach; McGraw-Hill: New York, NY, USA, 1931; p. 366. [Google Scholar]
  32. Bird, F.E.; Germain, G.L. Damage Control: A New Horizon in Accident Prevention and Cost Improvement; American Management Association: New York, NY, USA, 1966. [Google Scholar]
  33. Reason, J. Human Error; Cambridge University Press: Cambridge, UK, 1990. [Google Scholar]
  34. Stewart, J.M. The turnaround in safety at the Kenora pulp & paper mill. Prof. Saf. 2001, 46, 34–44. [Google Scholar]
  35. Fang, D.P.; Zhao, C.; Zhang, M.C. A cognitive model of construction workers’ unsafe behaviors. J. Constr. Eng. Manag. 2016, 142, 04016039. [Google Scholar] [CrossRef]
  36. Fu, G.; Zhao, Z.Q.; Hao, C.B.; Wu, Q. The accident path of coal mine gas explosion based on 24model: A case study of the ruizhiyuan gas explosion accident. Processes 2019, 7, 73. [Google Scholar] [CrossRef]
  37. Wu, Y.L.; Fu, G.; Wu, Z.R.; Wang, Y.X.; Xie, X.C.; Han, M.; Lyu, Q. A popular systemic accident model in China: Theory and applications of 24Model. Saf. Sci. 2023, 159, 106013. [Google Scholar] [CrossRef]
  38. Jiang, Z.M.; Fang, D.P.; Zhang, M.C. Understanding the causation of construction workers’ unsafe behaviors based on system dynamics modeling. J. Manag. Eng. 2015, 31, 04014099. [Google Scholar] [CrossRef]
  39. Tang, B.; Guo, S.Y.; Li, J.C.; Lu, W. Exploring the risk transmission characteristics among unsafe behaviors within urban railway construction accidents. J. Civ. Eng. Manag. 2022, 28, 443–456. [Google Scholar] [CrossRef]
  40. Zhang, Z.T.; Xiang, T.; Guo, H.L.; Ma, L.; Guan, Z.Y.; Fang, Y.H. Impact of physical and mental fatigue on construction workers’ unsafe behavior based on physiological measurement. J. Saf. Res. 2023, 85, 457–468. [Google Scholar] [CrossRef]
  41. Fang, Q.; Castro-Lacouture, D.; Li, C.Q. Smart safety: Big data-enabled system for analysis and management of unsafe behavior by construction workers. J. Manag. Eng. 2024, 40, 04023053. [Google Scholar] [CrossRef]
  42. Fang, Q.; Chen, X.C.; Castro-Lacouture, D.; Li, C.Q. Intervention and management of construction workers’ unsafe behavior: A simulation digital twin model. Adv. Eng. Inf. 2023, 58, 102182. [Google Scholar] [CrossRef]
  43. Wu, H.; Han, Y.; Zhang, M.; Abebe, B.D.; Legesse, M.B.; Jin, R.Y. Identifying unsafe behavior of construction workers: A dynamic approach combining skeleton information and spatiotemporal features. J. Constr. Eng. Manag. 2023, 149, 04023115. [Google Scholar] [CrossRef]
  44. Ding, C.; Liu, Q.L.; Guo, X.W.; Xue, T.T.; Wang, Z.H. Identifying unsafe behaviors of construction workers through an unsupervised multi-anomaly GAN approach. Autom. Constr. 2024, 165, 105509. [Google Scholar] [CrossRef]
  45. Mohajeri, M.; Ardeshir, A.; Banki, M.T.; Malekitabar, H. Discovering causality patterns of unsafe behavior leading to fall hazards on construction sites. Int. J. Constr. Manag. 2022, 22, 3034–3044. [Google Scholar] [CrossRef]
  46. Yu, Y.T.; Guo, H.L.; Ding, Q.H.; Li, H.; Skitmore, M. An experimental study of real-time identification of construction workers’ unsafe behaviors. Autom. Constr. 2017, 82, 193–206. [Google Scholar] [CrossRef]
  47. Guo, H.L.; Yu, Y.T.; Ding, Q.H.; Skitmore, M. Image-and-skeleton-based parameterized approach to real-time identification of construction workers unsafe behaviors. J. Constr. Eng. Manag. 2018, 144, 04018042. [Google Scholar] [CrossRef]
  48. Eker, H. Natural language processing risk assessment application developed for marble quarries. Appl. Sci. 2024, 14, 9045. [Google Scholar] [CrossRef]
  49. Jeelani, I.; Asadi, K.; Ramshankar, H.; Han, K.; Albert, A. Real-time vision-based worker localization & hazard detection for construction. Autom. Constr. 2021, 121, 103448. [Google Scholar] [CrossRef]
  50. Arslan, M.; Cruz, C.; Ginhac, D. Visualizing intrusions in dynamic building environments for worker safety. Saf. Sci. 2019, 120, 428–446. [Google Scholar] [CrossRef]
  51. Krippendorff, K. Content Analysis: An Introduction to Its Methodology; Sage Publications: Thousand Oaks, CA, USA, 2018. [Google Scholar]
  52. Kitzinger, J. Qualitative research: Introducing focus groups. Brit. Med. J. 1995, 311, 299–302. [Google Scholar] [CrossRef]
  53. Fu, G.; Cao, J.L.; Zhou, L.; Xiang, Y.C. Comparative study of HFACS and the 24Model accident causation models. Pet. Sci. 2017, 14, 570–578. [Google Scholar] [CrossRef]
  54. Fu, G.; Xie, X.C.; Jia, Q.S.; Li, Z.H.; Chen, P.; Ge, Y. The development history of accident causation models in the past 100 years: 24Model, a more modern accident causation model. Process Saf. Environ. Prot. 2020, 134, 47–82. [Google Scholar] [CrossRef]
  55. Wasserman, S.; Faust, K. Social Network Analysis: Methods and Applications; Cambridge University Press: Cambridge, UK, 1994. [Google Scholar]
  56. Li, C.Z.; Hong, J.K.; Xue, F.; Shen, G.Q.; Xu, X.X.; Mok, M.K. Schedule risks in prefabrication housing production in Hong Kong: A social network analysis. J. Clean. Prod. 2016, 134, 482–494. [Google Scholar] [CrossRef]
  57. Work Safety Law of the Peoples Republic of China. Available online: https://www.mem.gov.cn/fw/flfgbz/fg/202107/t20210716_416558.shtml (accessed on 29 April 2025).
  58. Classification and Coding of Work Safety Accidents. Available online: https://www.mem.gov.cn/gk/zfxxgkpt/fdzdgknr/202504/W020250516592549873622.pdf (accessed on 29 April 2025).
  59. Q/CR 9006-2014; Technical Code for Risk Management of Railway Construction Engineering. China Railway: Beijing, China, 2014.
  60. Guidelines for Construction Safety Management of Railway Construction Projects; China Railway: Beijing, China, 2023.
  61. Technical Code for Risk Management of Railway Tunnel Projects; China Railway: Beijing, China, 2016.
  62. Railway Safety Risk Classification Control and Hidden Danger Investigation and Treatment Management Measures. Available online: https://www.nra.gov.cn/xxgk/gkml/ztjg/gfzd/gfxw/zuti/jgzf/202303/t20230320_340029.shtml (accessed on 29 April 2025).
Figure 1. Research framework for understanding the causation mechanism of CWUBs in RTE.
Buildings 15 01841 g001
Figure 2. Data sources and collection process.
Buildings 15 01841 g002
Figure 3. 24model of CWUBs in RTE.
Buildings 15 01841 g003
Figure 4. Final relationship matrix of CWUBs in RTE.
Buildings 15 01841 g004
Figure 5. Source of questionnaire data.
Buildings 15 01841 g005
Figure 6. Network model for CWUBs in RTE.
Buildings 15 01841 g006
Figure 7. Key network structure and critical factors for CWUBs in RTE. Influencing factors are represented by green nodes, CWUBs by yellow nodes, and construction safety accidents by red nodes.
Buildings 15 01841 g007
Figure 8. Framework of intervention strategies for CWUBs in RTE.
Buildings 15 01841 g008
Table 1. Influencing factors of CWUBs in RTE.
Organizational Management FactorsIndividual Safety CapacitySafety Environmental Factors
Safety culture (M1)Knowledge and skills (P1)Confined spaces (E1)
Safety procedures (M2)Safety awareness (P2)Dark environment (E2)
Education and training (M3)Safety attitude (P3)Construction noise (E3)
Safety inspections (M4)Physical condition (P4)Polluted air (E4)
Safety resources (M5)Safety habits (P5)Work pressure (E5)
Safety climate (M6)Psychological quality (P6)Interpersonal relationships (E6)
Safety incentives (M7)Safety experience (P7)Social norms (E7)
Safety commitment (M8)Perceptual ability (P8)Engineering geology (E8)
Safety communication (M9)Self-efficacy (P9)Hydrogeology (E9)
Safety leadership (M10)Safety motivation (P10)Construction method issues (E10)
Emergency preparedness (M11)Emotional state (P11)Equipment issues (E11)
Safety assurance (M12) Material issues (E12)
Table 2. Network density.
Number of NodesNumber of ConnectionsDensity
5513140.442
Table 3. Average shortest path.
Network DiameterAverage Shortest Path
31.218
Table 4. Network connectivity.
Network ConnectivityNetwork Reciprocity
0.6000.165
Table 5. The fit indices under different block divisions.
Number of Blocks222324
Fit index0.4930.6120.788
Table 6. Block image matrix of CWUBs network model for RTE.
K1K2K3K4K5K6K7K8K9K10K11K12K13K14K15K16SendingReceiving
K11 1111 11111111121
K2 1 10
K3 1111 1 11180
K4 111 1 1 11 70
K5 11111 11111111121
K6 111 11111111101
K7 111 111161
K8 111 111170
K9 1 10
K10 11 20
K11 00
K12 00
K13 1111 1151
K14 1111111 61
K15 1 10
K16 111 30
Sending00136660479106797
Receiving1000111000001100
Table 7. Key factors of degree centrality.
RankFactorsCD(ni-in) FactorsCD(ni-out)
1Safety attitude106Safety climate114
2Safety habits103Safety culture112
3Safety awareness102Education and training109
4Perceptual ability96Safety leadership109
5Safety motivation95Safety procedures108
6Self-efficacy90Safety attitude107
7Knowledge and skills86Safety habits104
8Struck by objects82Safety inspections103
9Mechanical injury79Safety awareness102
10Lifting injury77Safety incentives101
Table 8. Key factors of betweenness centrality.
RankFactorsCB(ni)
1Safety climate53.046
2Safety culture41.844
3Collapse25.833
4Safety awareness25.632
5Safety attitude25.632
6Emotional state25.427
7Safety communication24.676
8Safety experience22.694
9Safety motivation21.32
10Safety habits19.174
Table 9. Key factors of closeness centrality.
RankFactorsCC(ni-in)FactorsCC(ni-out)
1Lifting injury0.720Safety climate0.871
2Struck by objects0.711Safety culture0.857
3Mechanical injury0.692Education and training0.857
4Electric shock0.684Safety inspections0.844
5Asphyxiation and poisoning0.651Safety commitment0.844
6Collapse0.643Safety communication0.844
7Fire and explosion0.614Safety incentives0.831
8Water inrush and mud inflow0.614Safety procedures0.818
9Rock burst0.545Safety leadership0.818
10Unauthorized entry into hazardous areas0.509Safety assurance0.818
Disclaimer/Publisher’s Note: The statements, opinions and data contained in all publications are solely those of the individual author(s) and contributor(s) and not of MDPI and/or the editor(s). MDPI and/or the editor(s) disclaim responsibility for any injury to people or property resulting from any ideas, methods, instructions or products referred to in the content.

