
Back-Silting Characteristics of Foundation Trench Excavation in an Ultra-Wide Inland Immersed Tunnel and Its Impacts on Slope Stability: A Case Study of the Tanzhou Waterway in Shunde

Abstract
1. Introduction
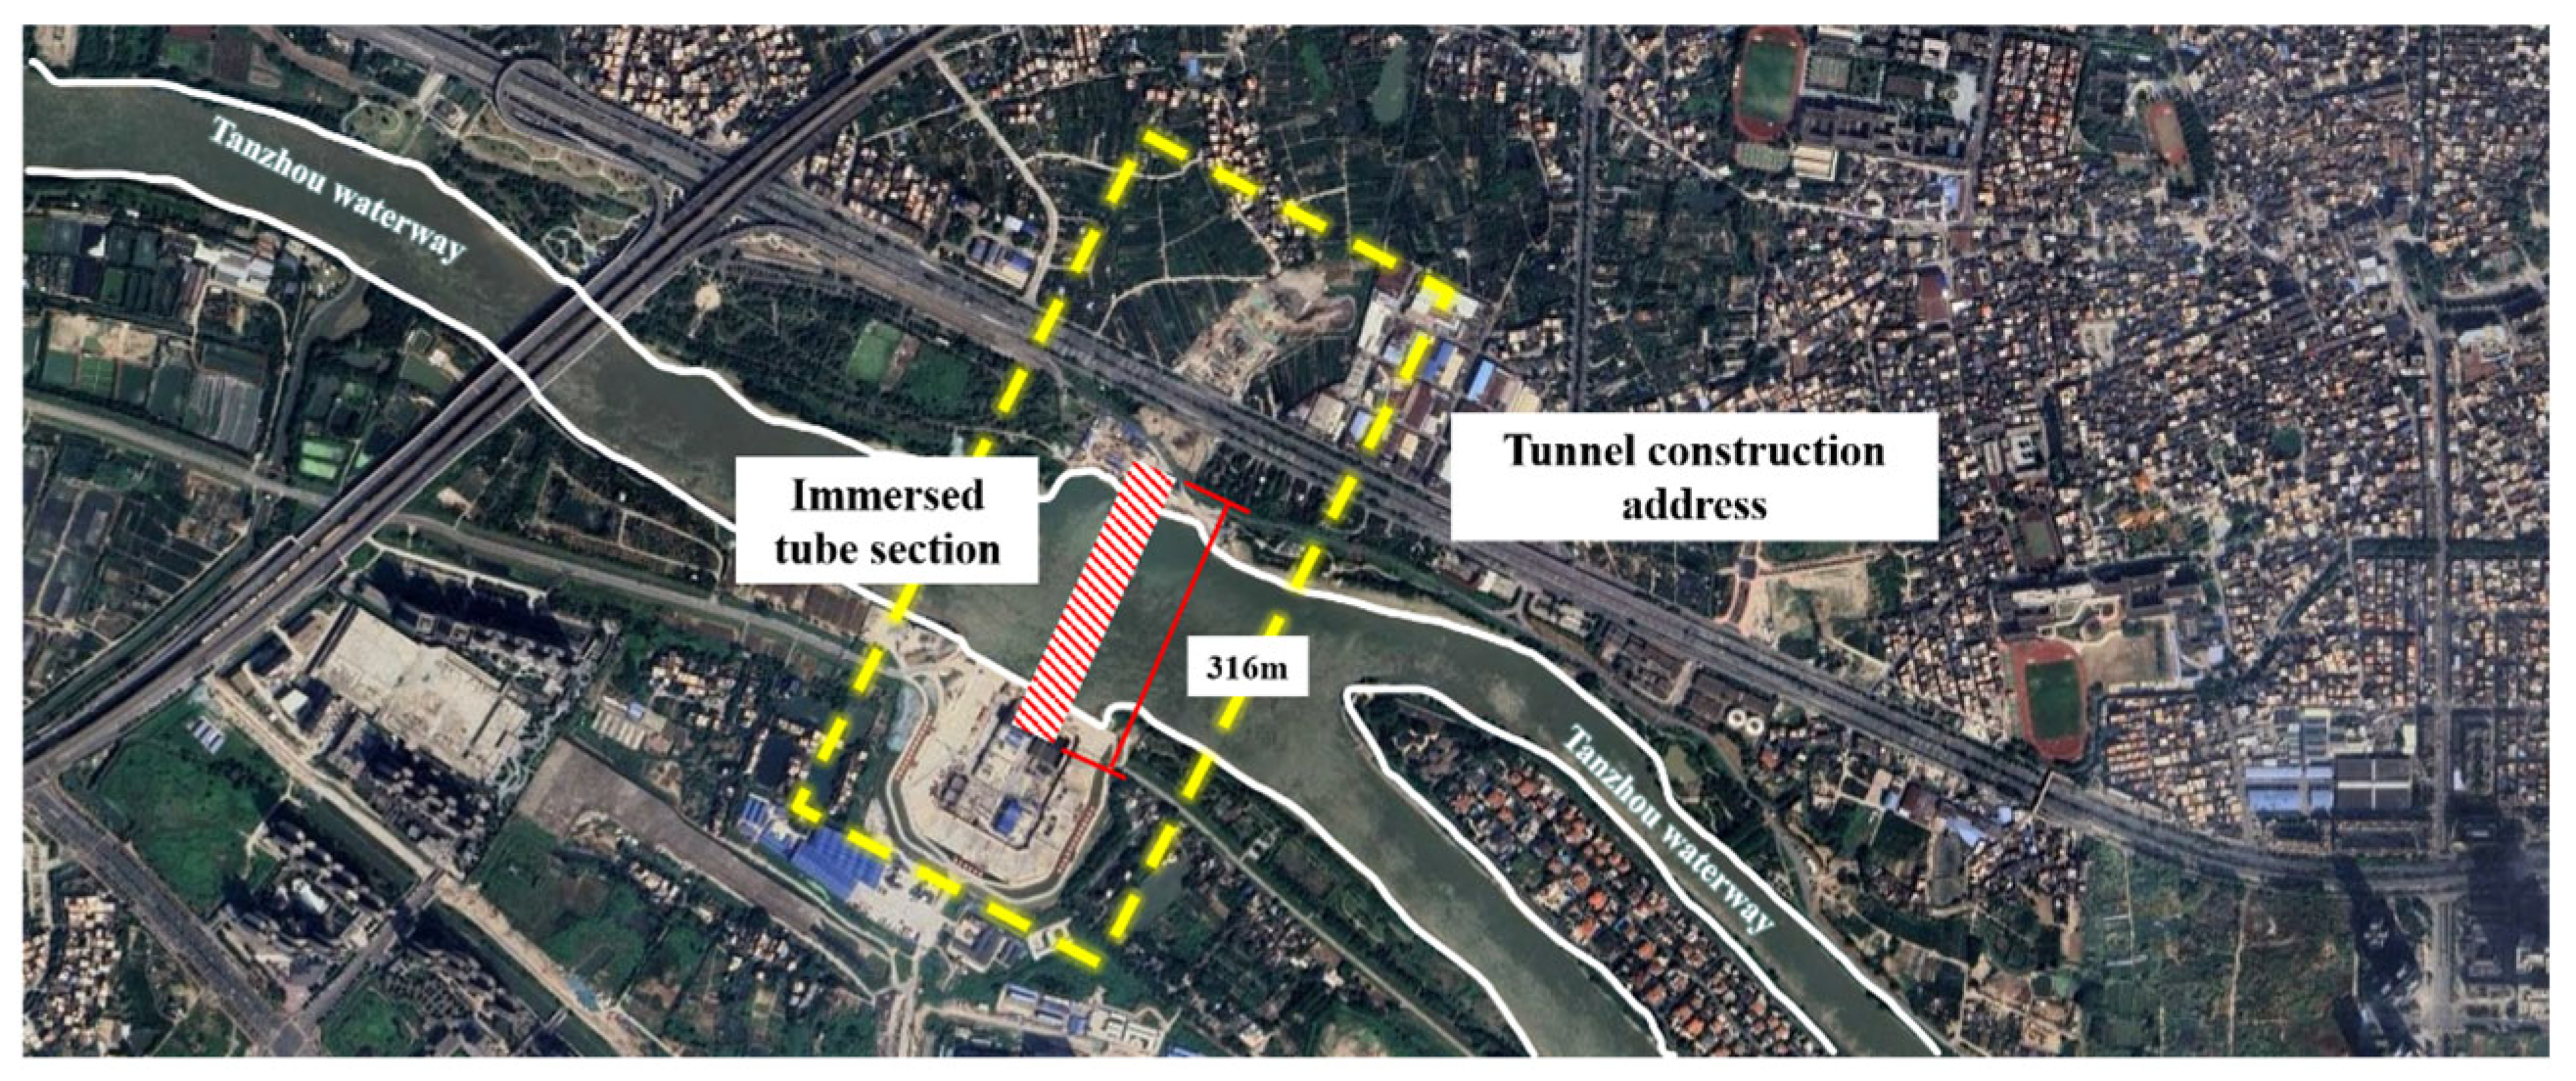
2. Project Overview
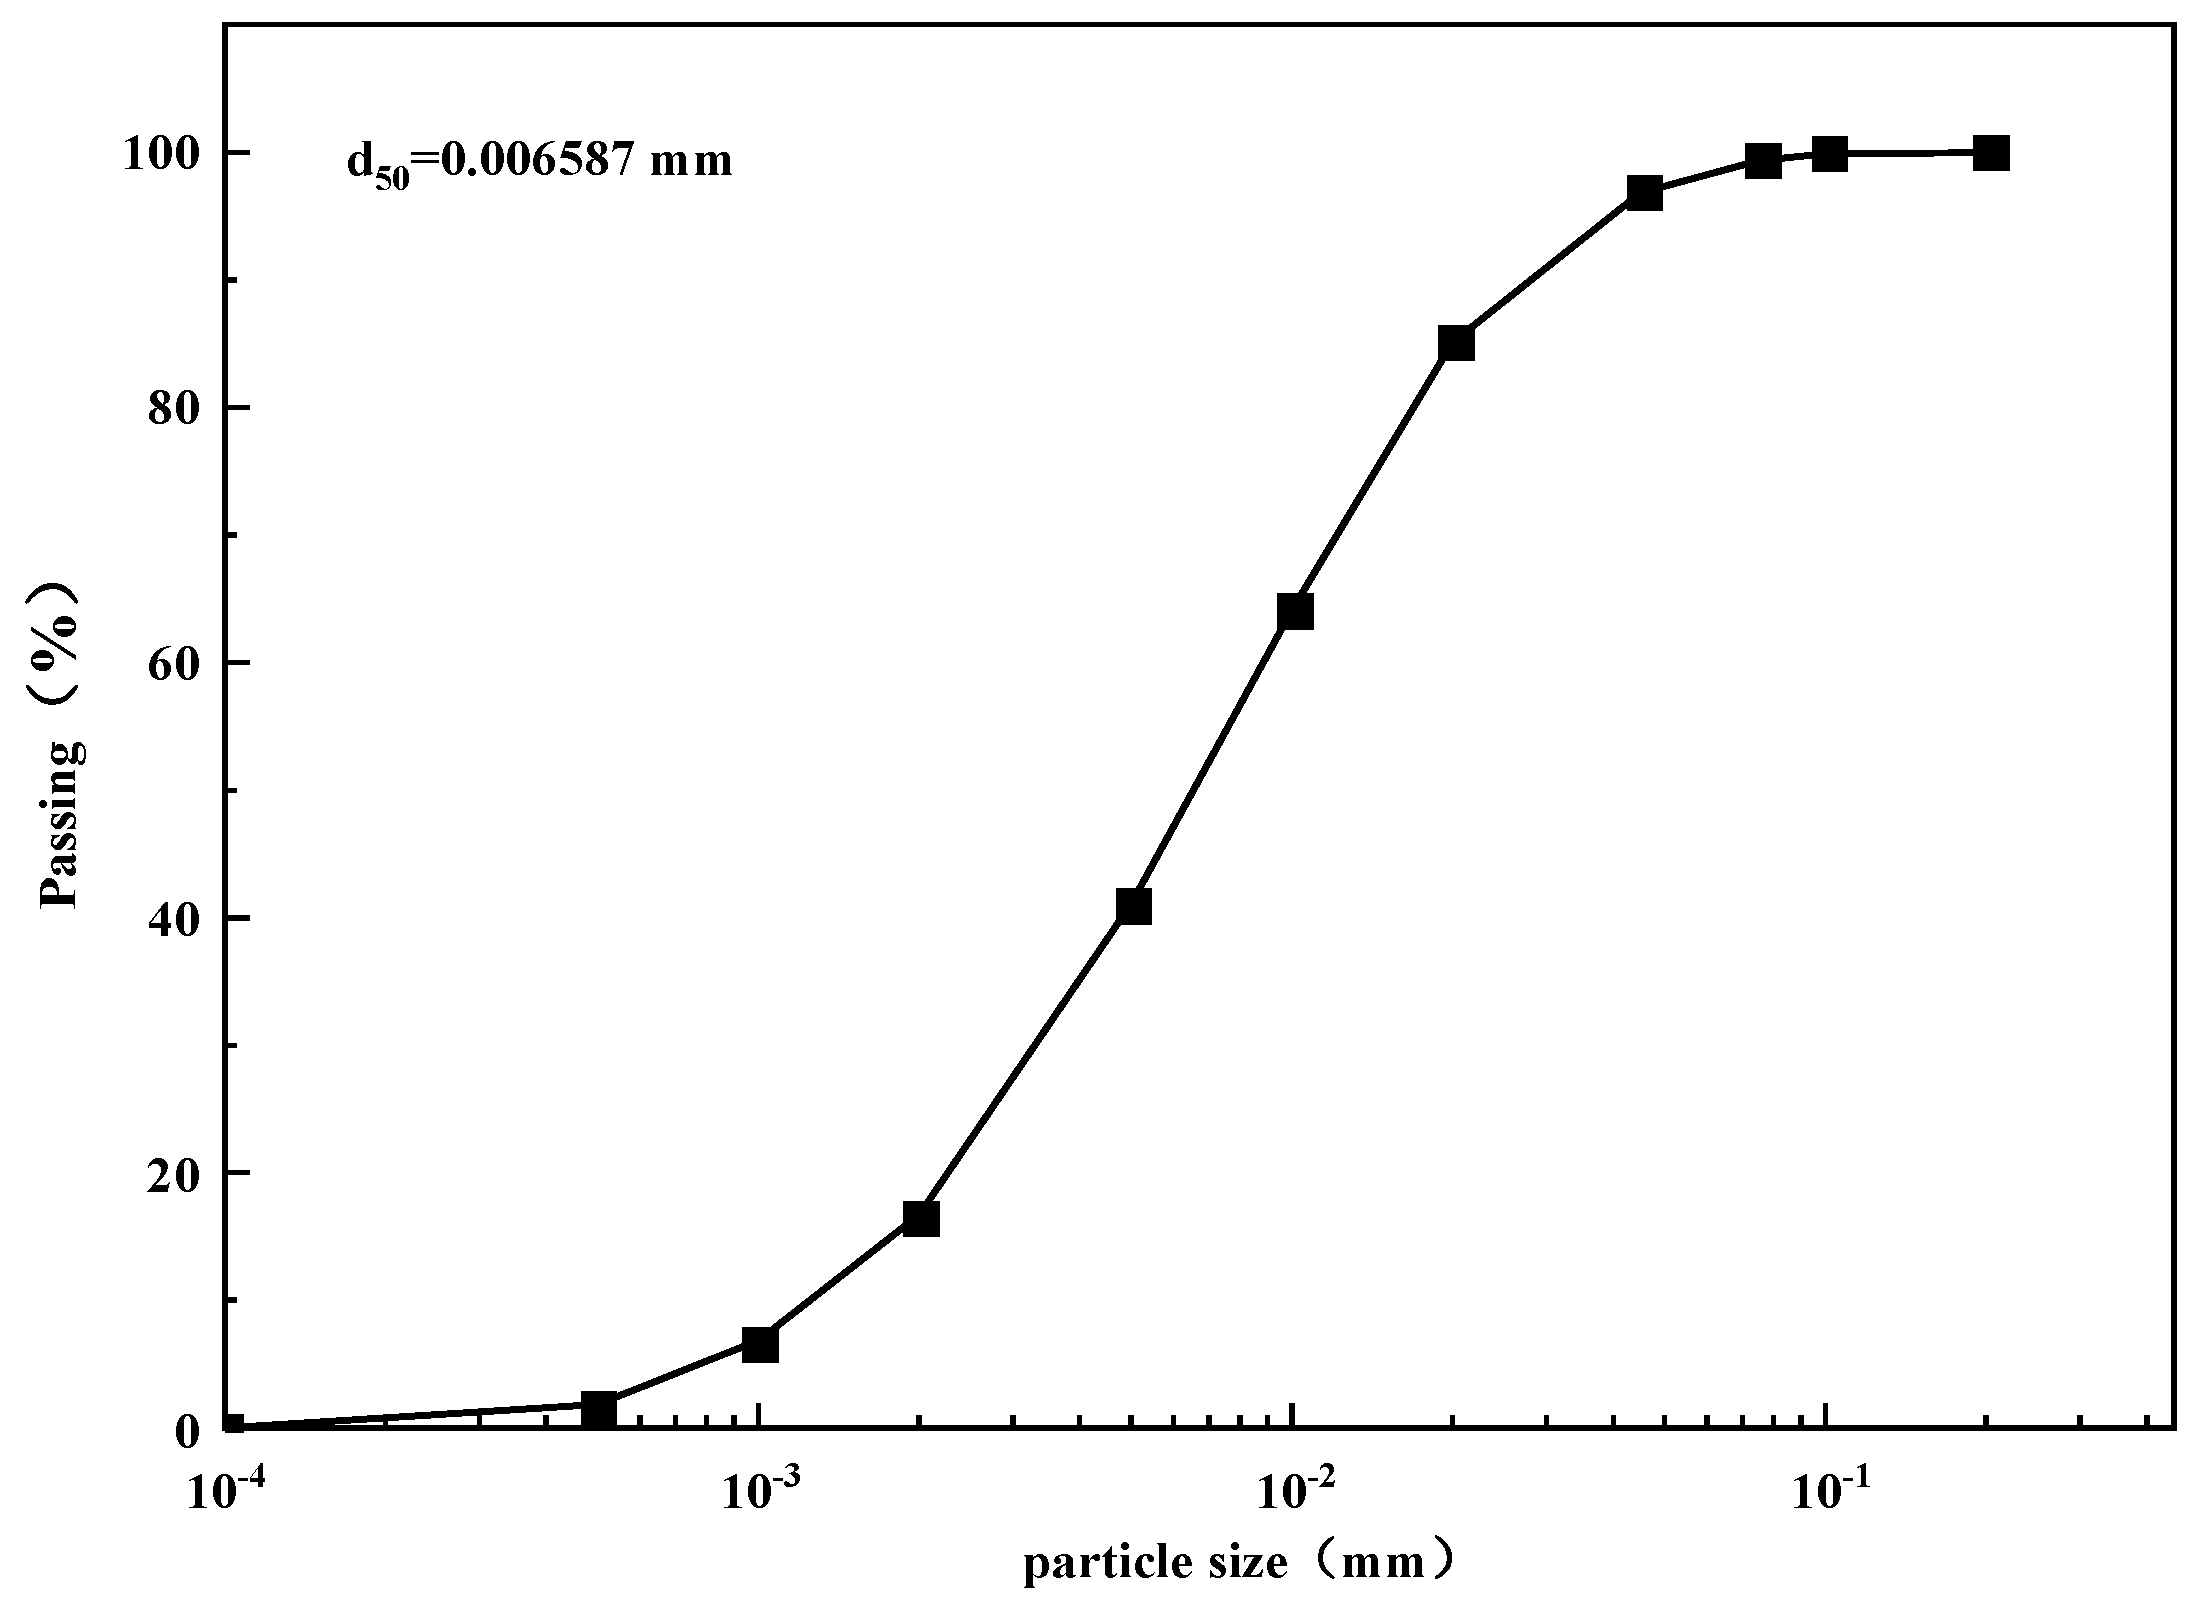
2.1. Engineering Geological Conditions
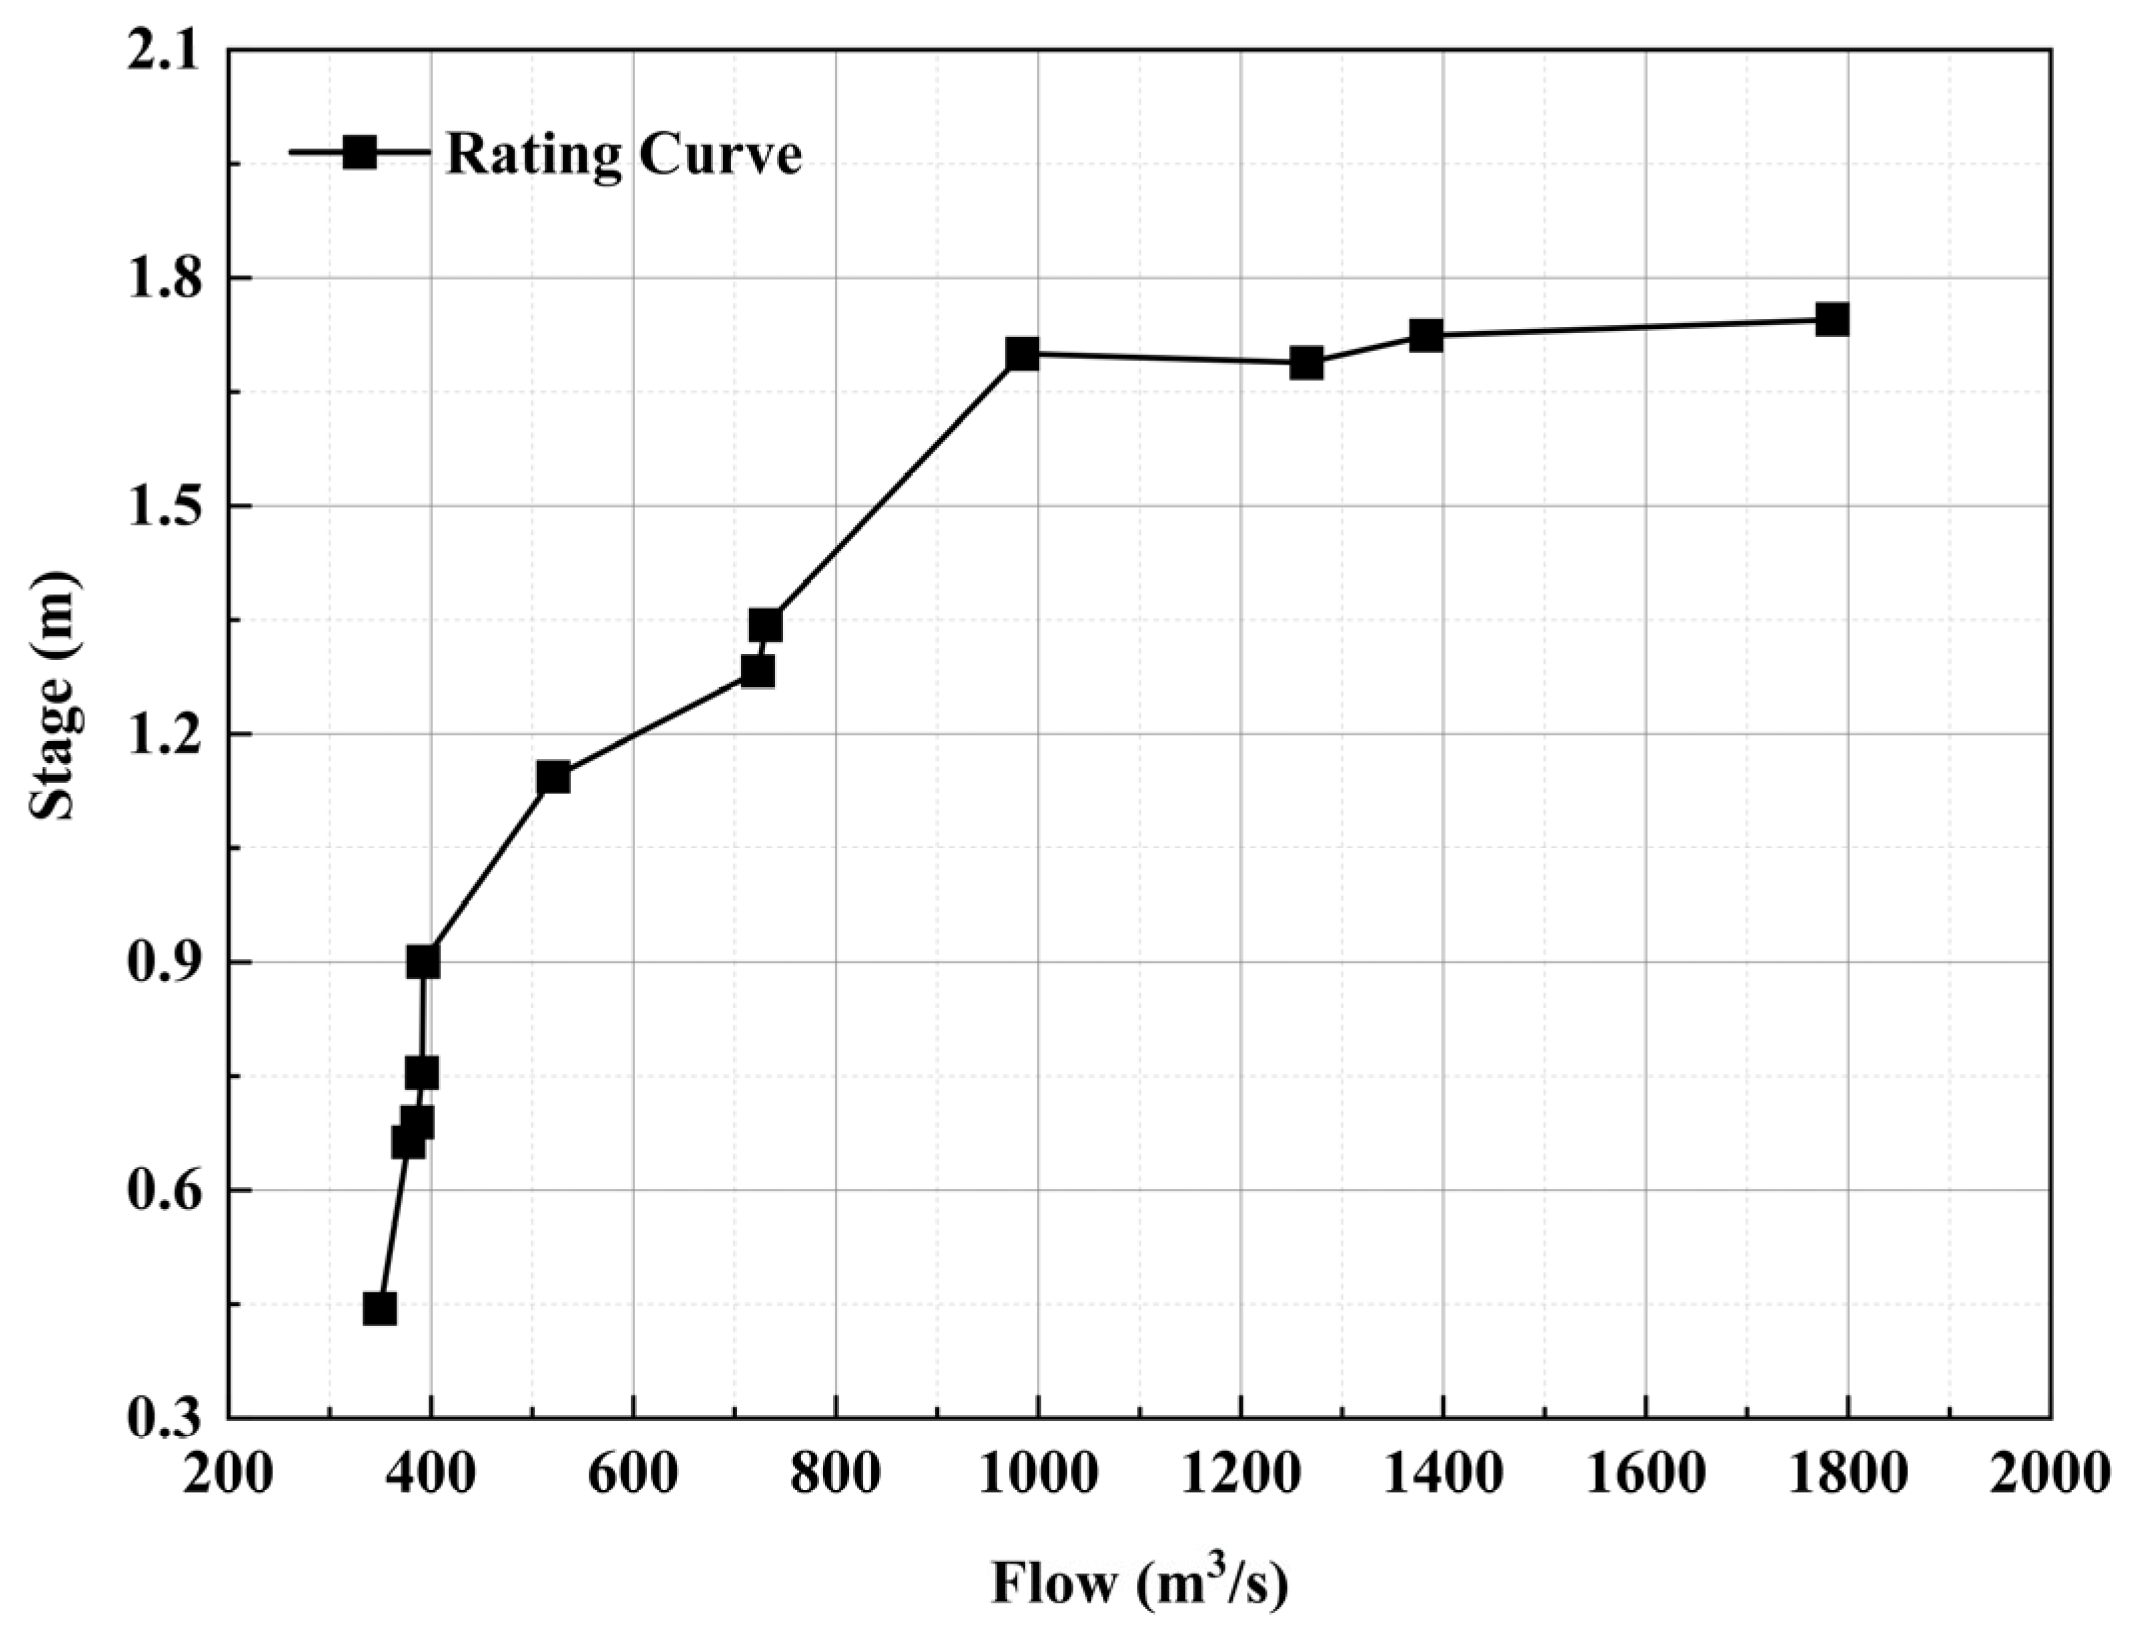
2.2. Hydrological Conditions
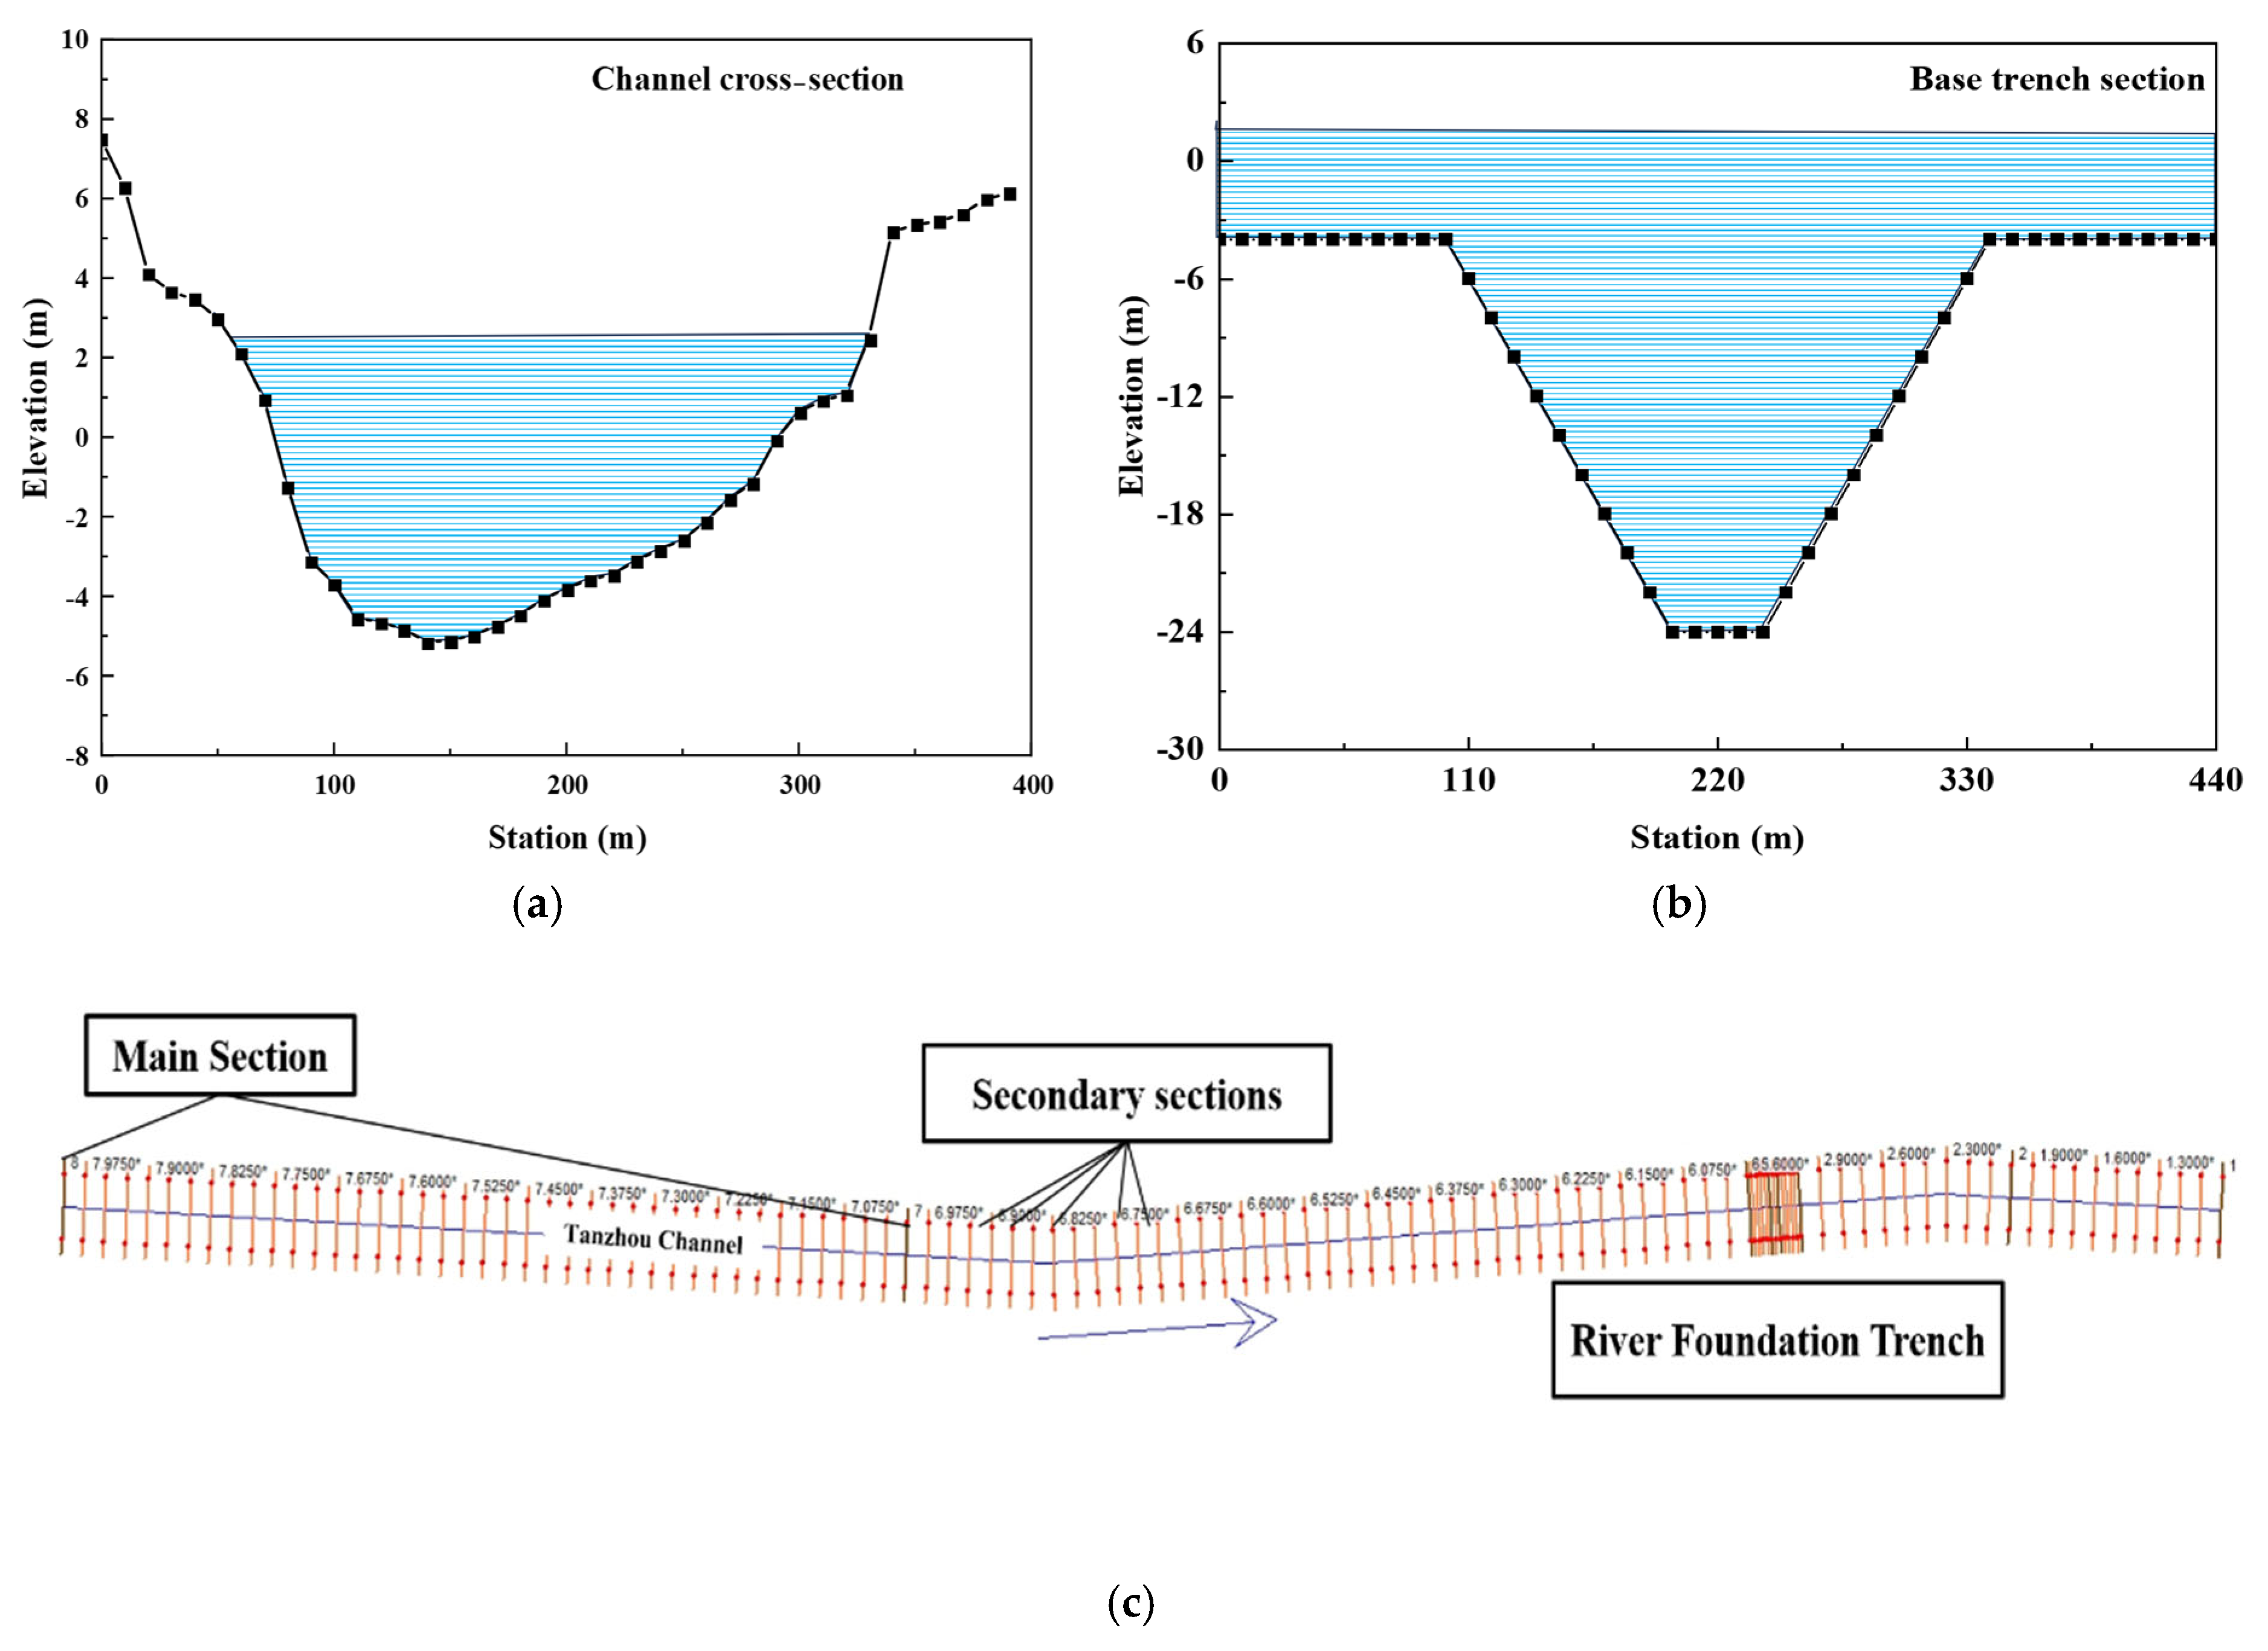
3. Study on the Siltation Pattern of Underwater Foundation Trench
3.1. Modeling Methodology
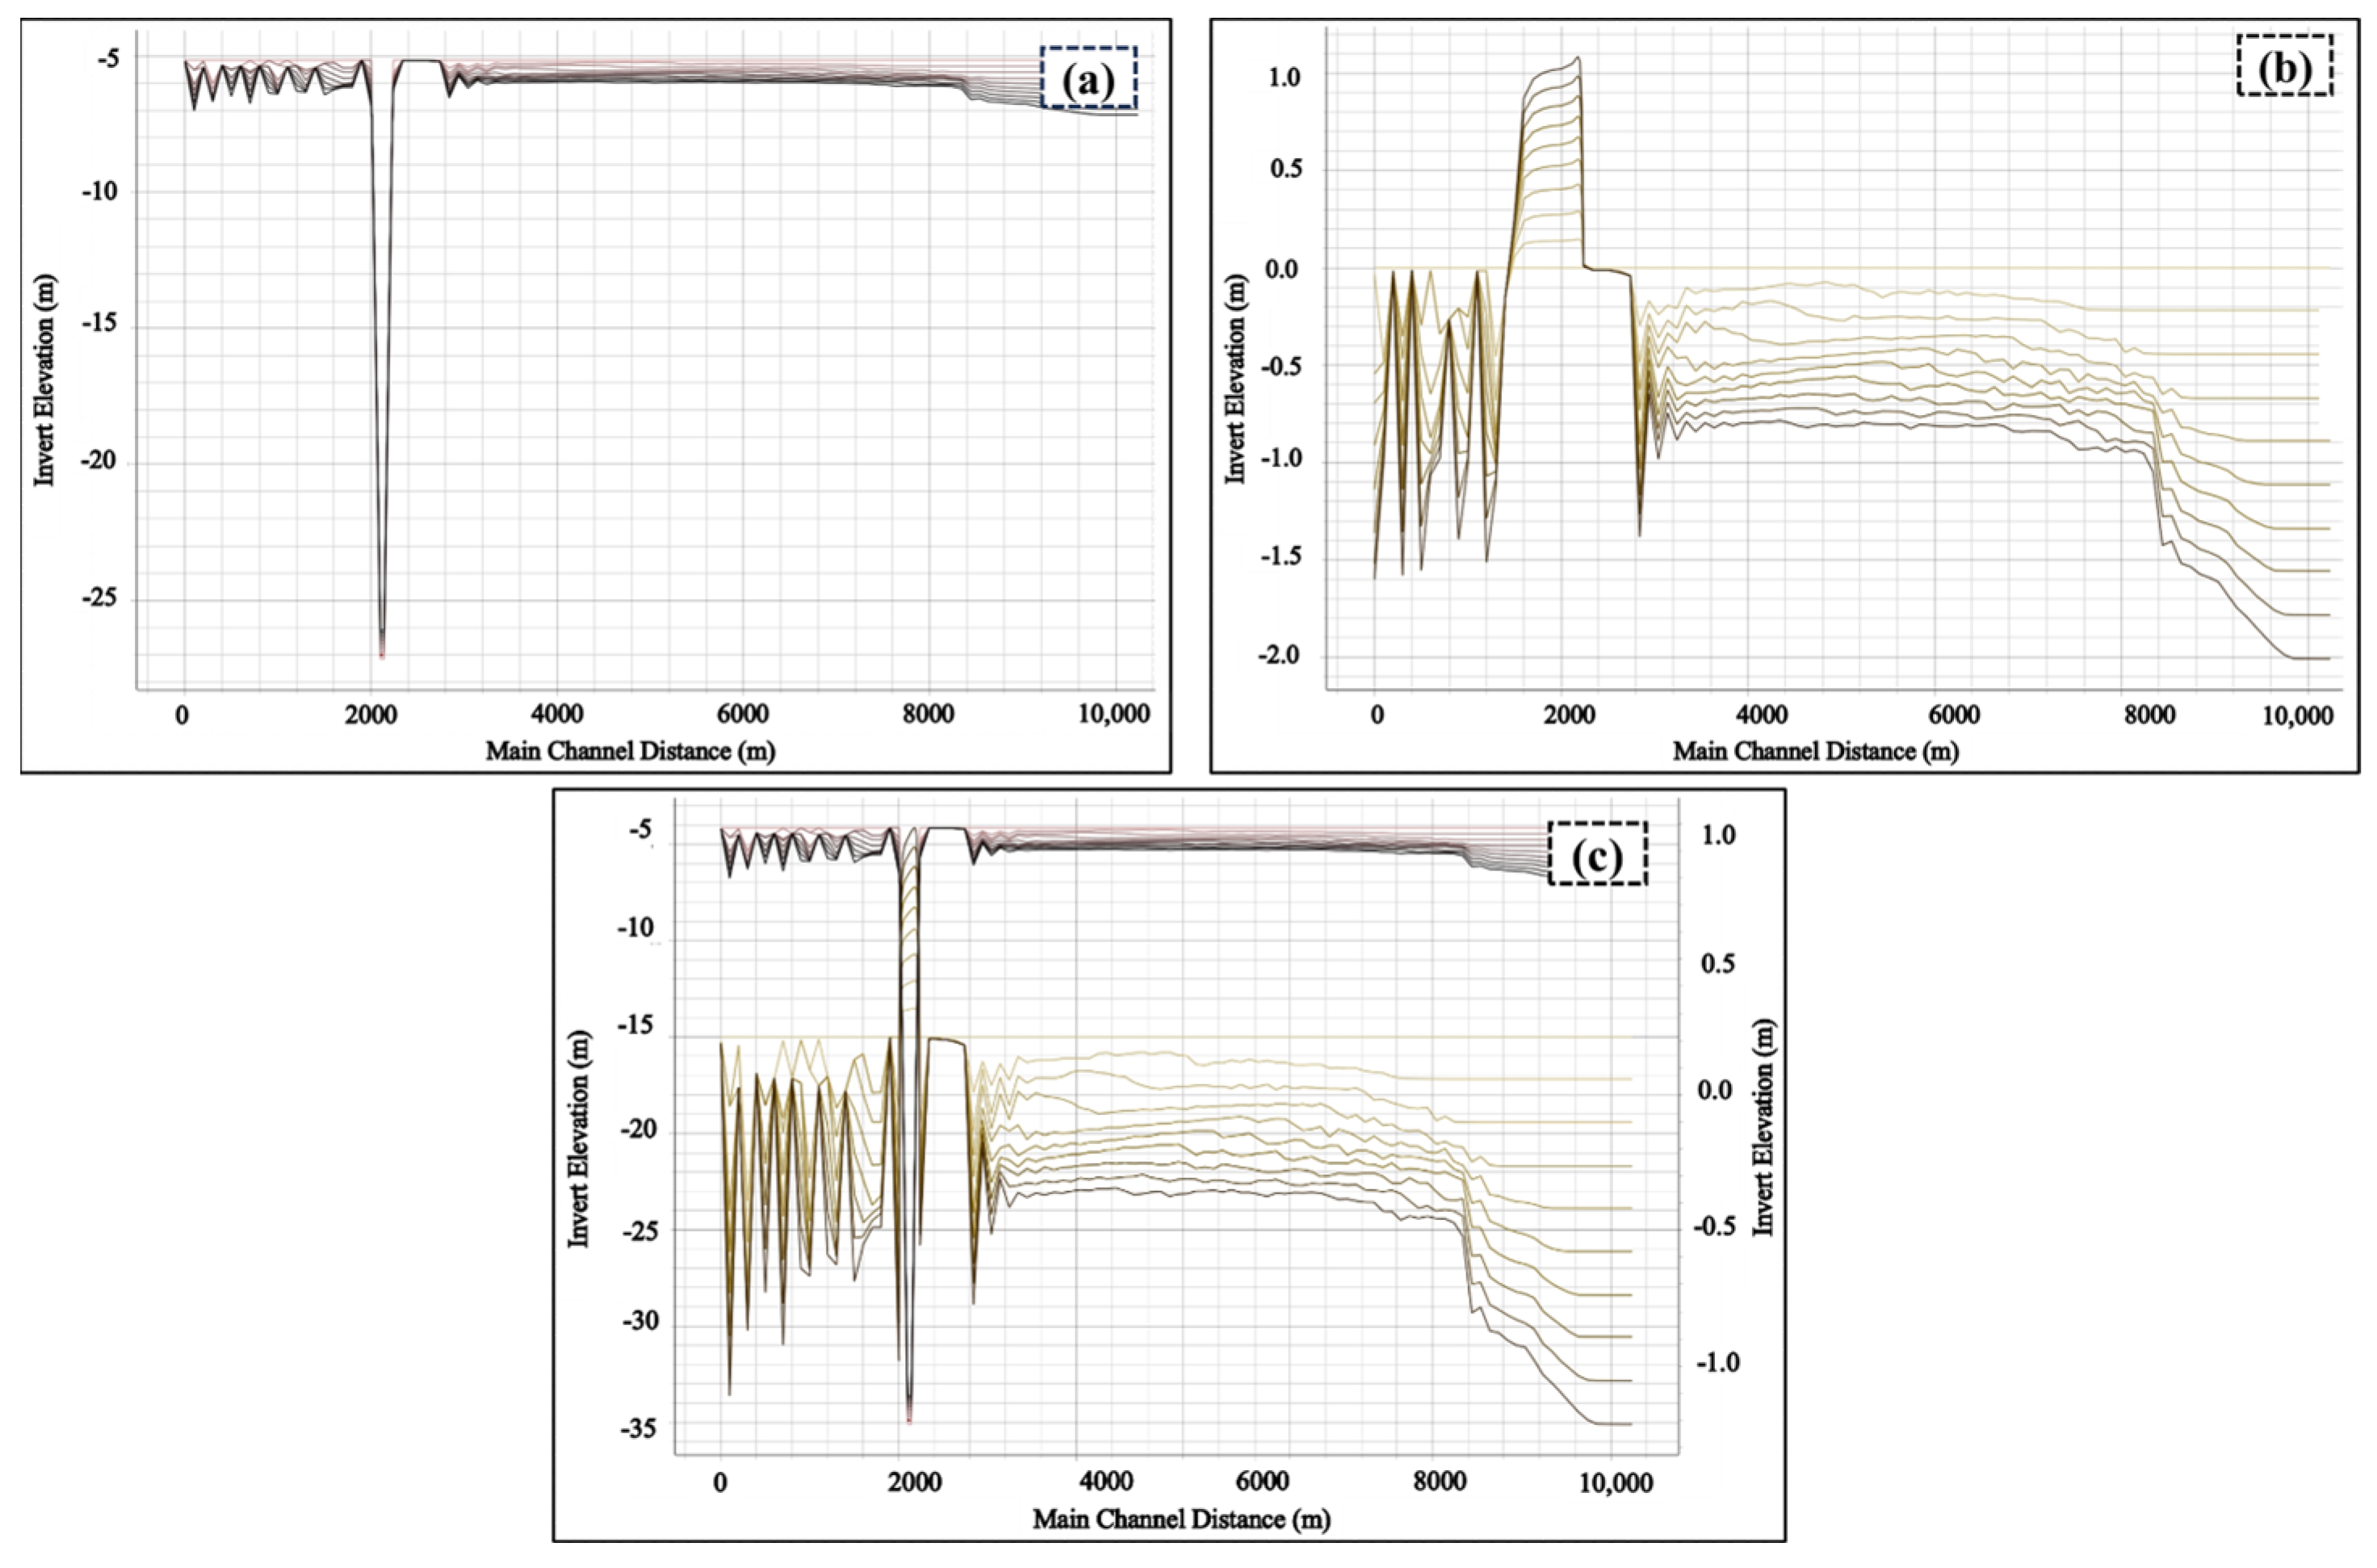
3.2. Analysis of Base Trench Dredging Results
4. The Impact of Back-Silting on Slope Stability
4.1. Modeling Methodology
4.2. Influence of Back-Silting Depth on Subaqueous Slope Stability
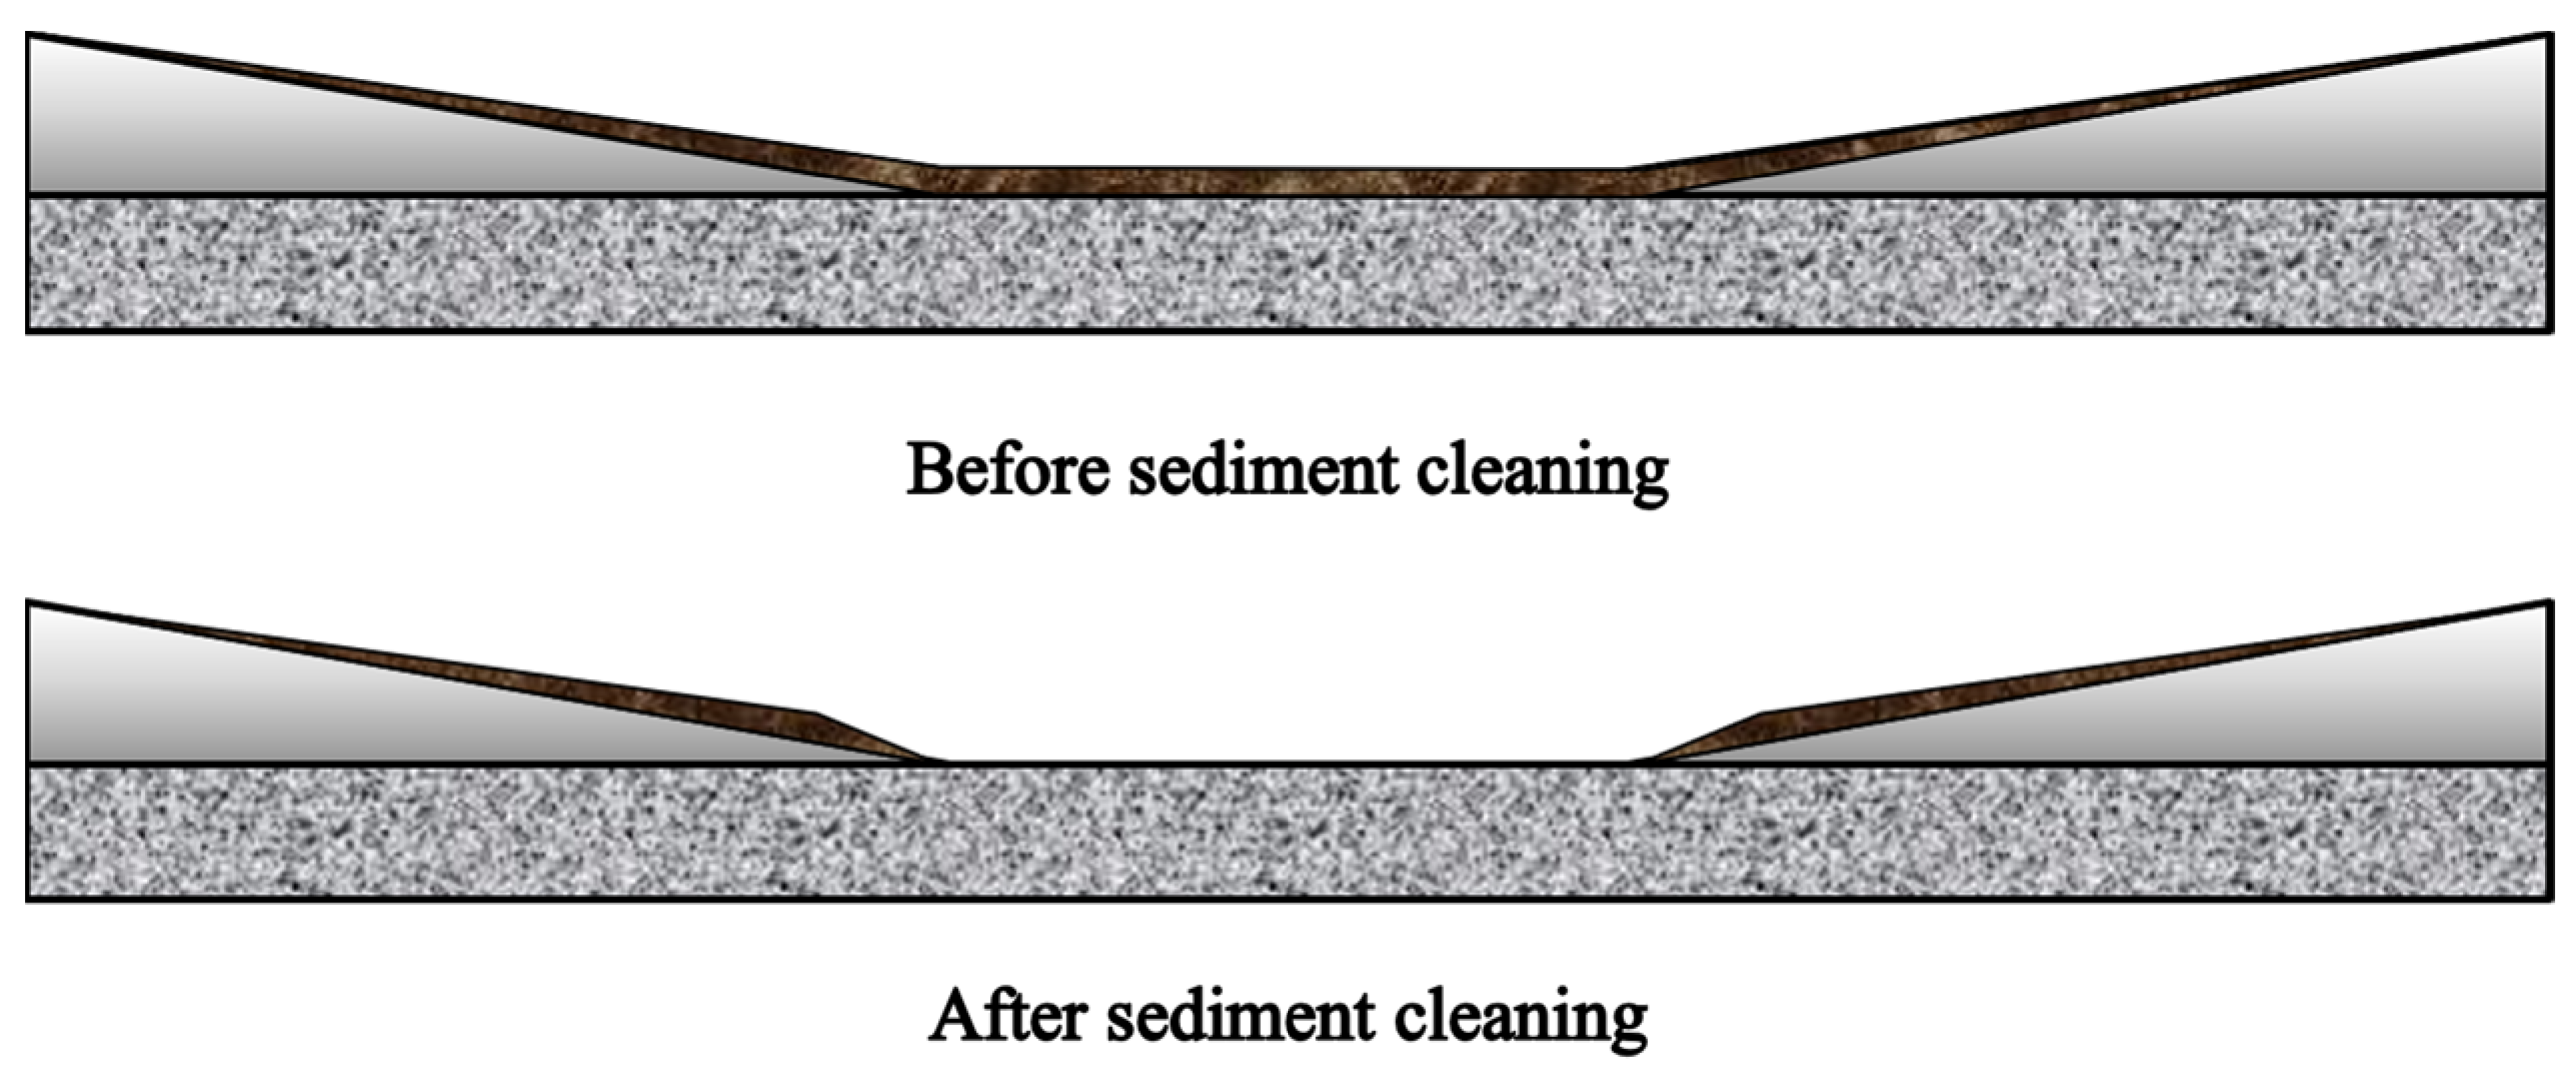
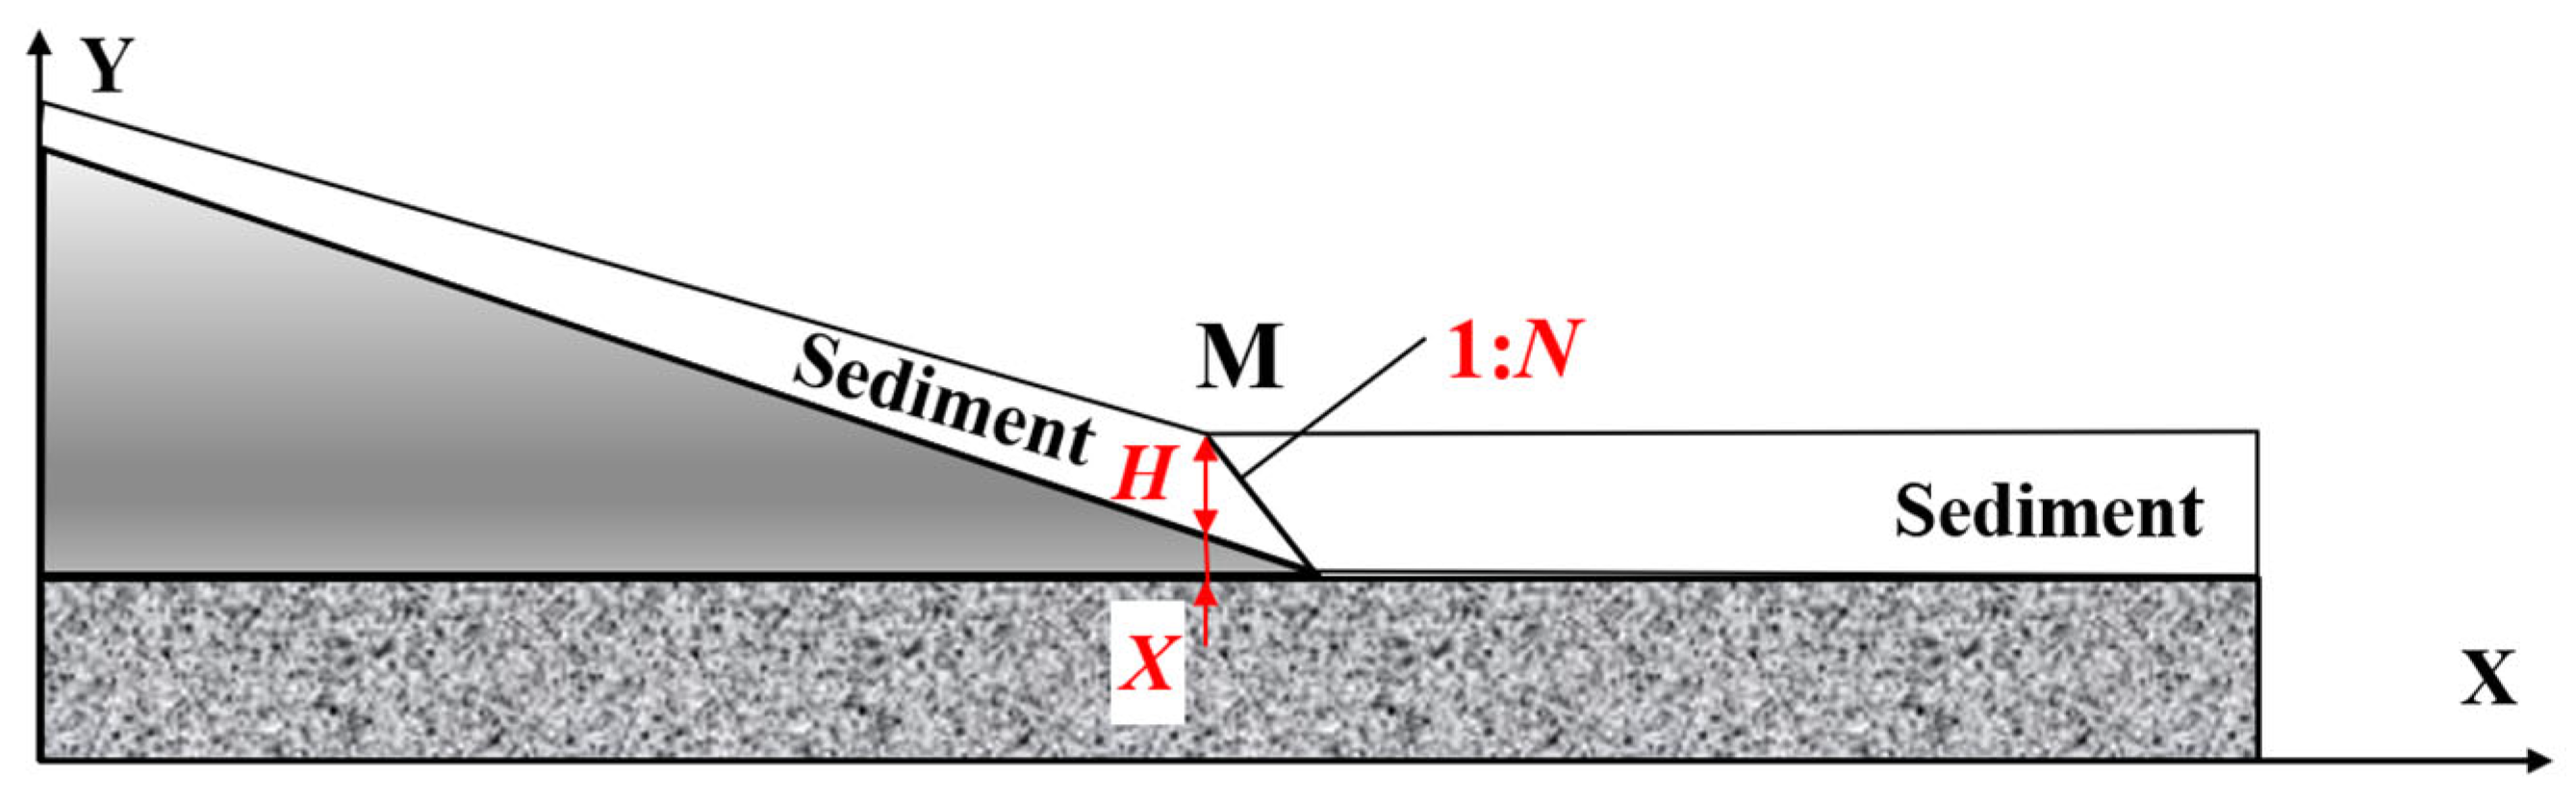
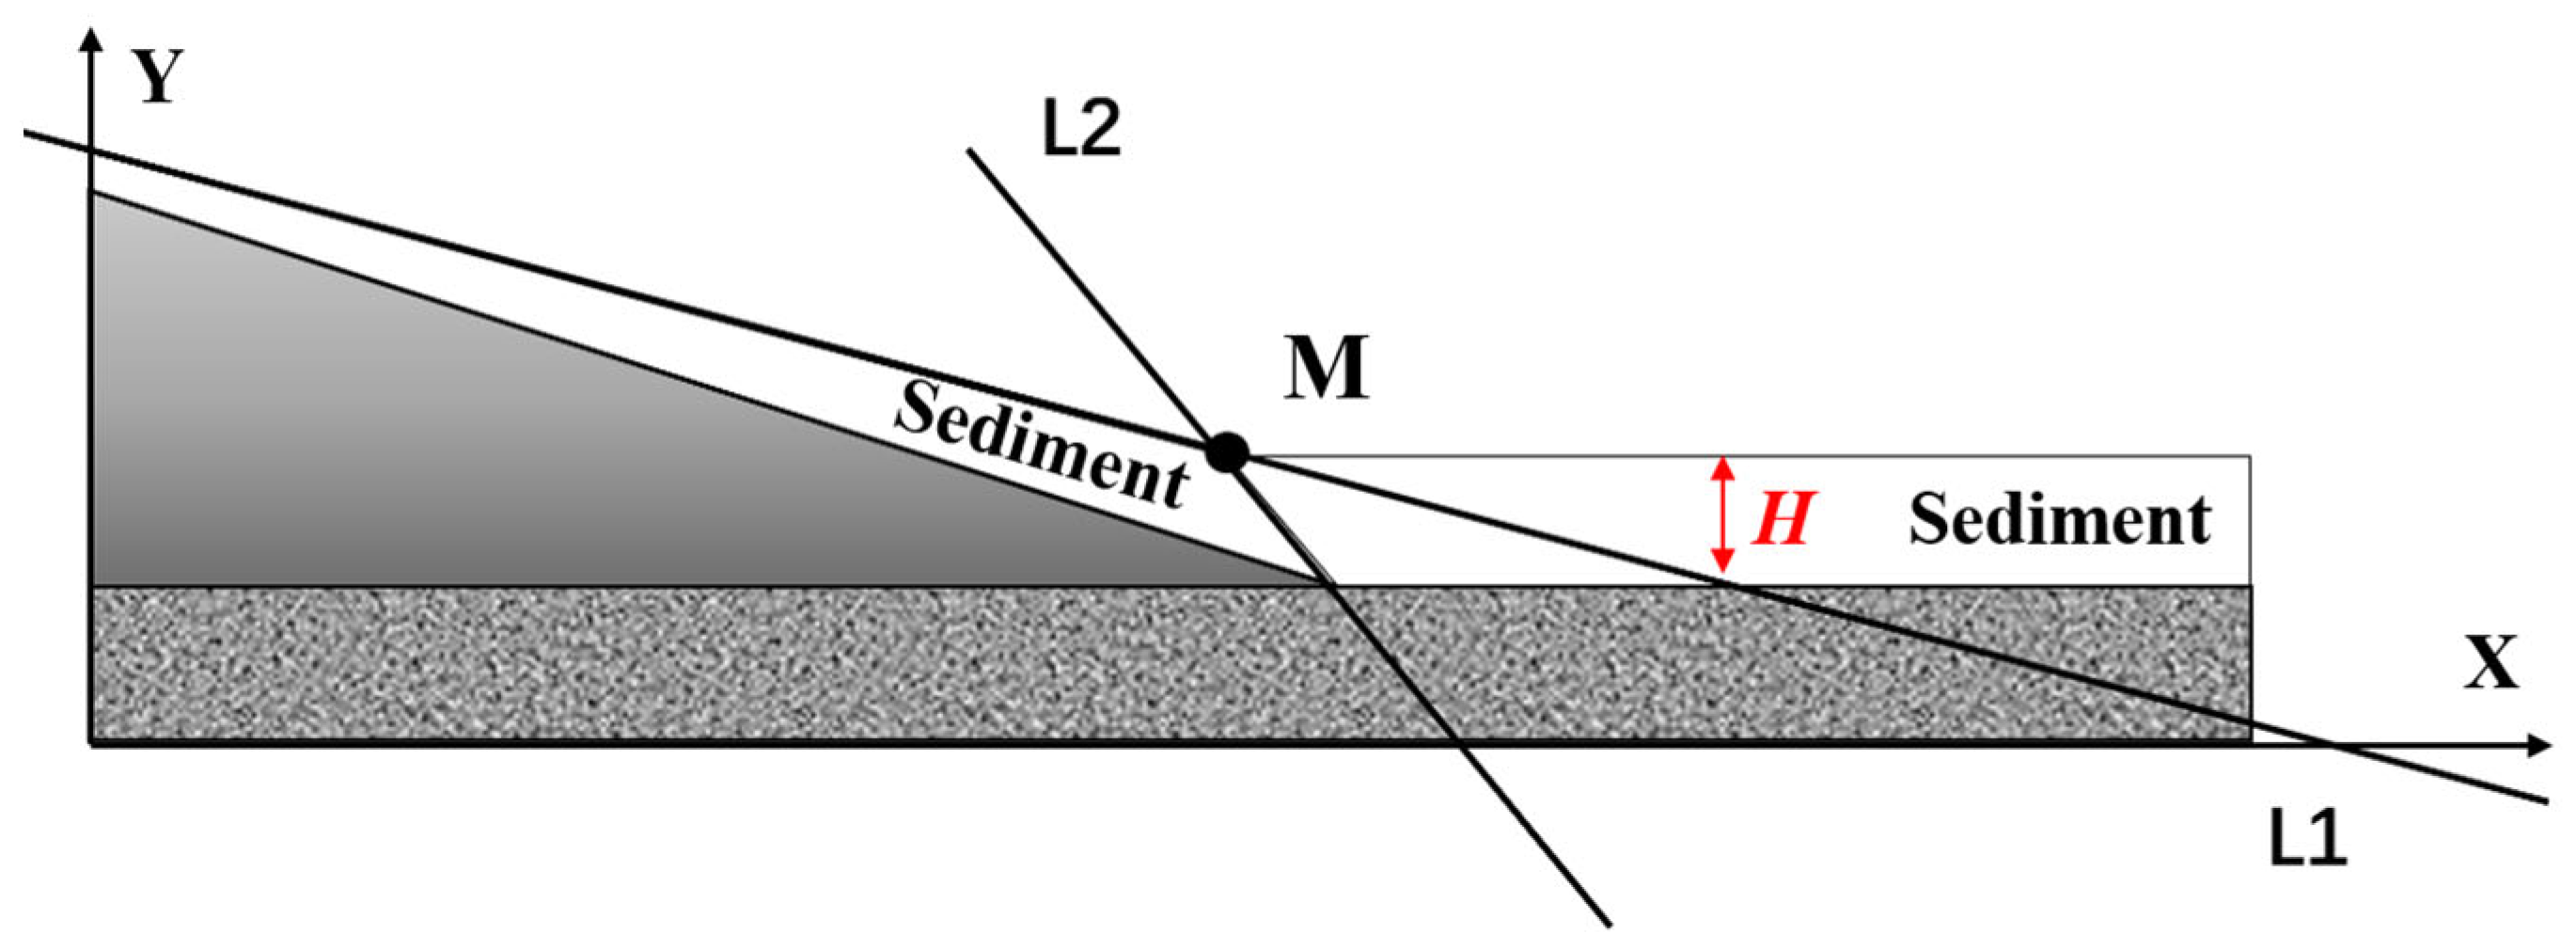
4.3. Dredging Method
4.4. Slope Stability in Dredged Trenches: Effects of Siltation and Gradient
5. Conclusions
- (1)
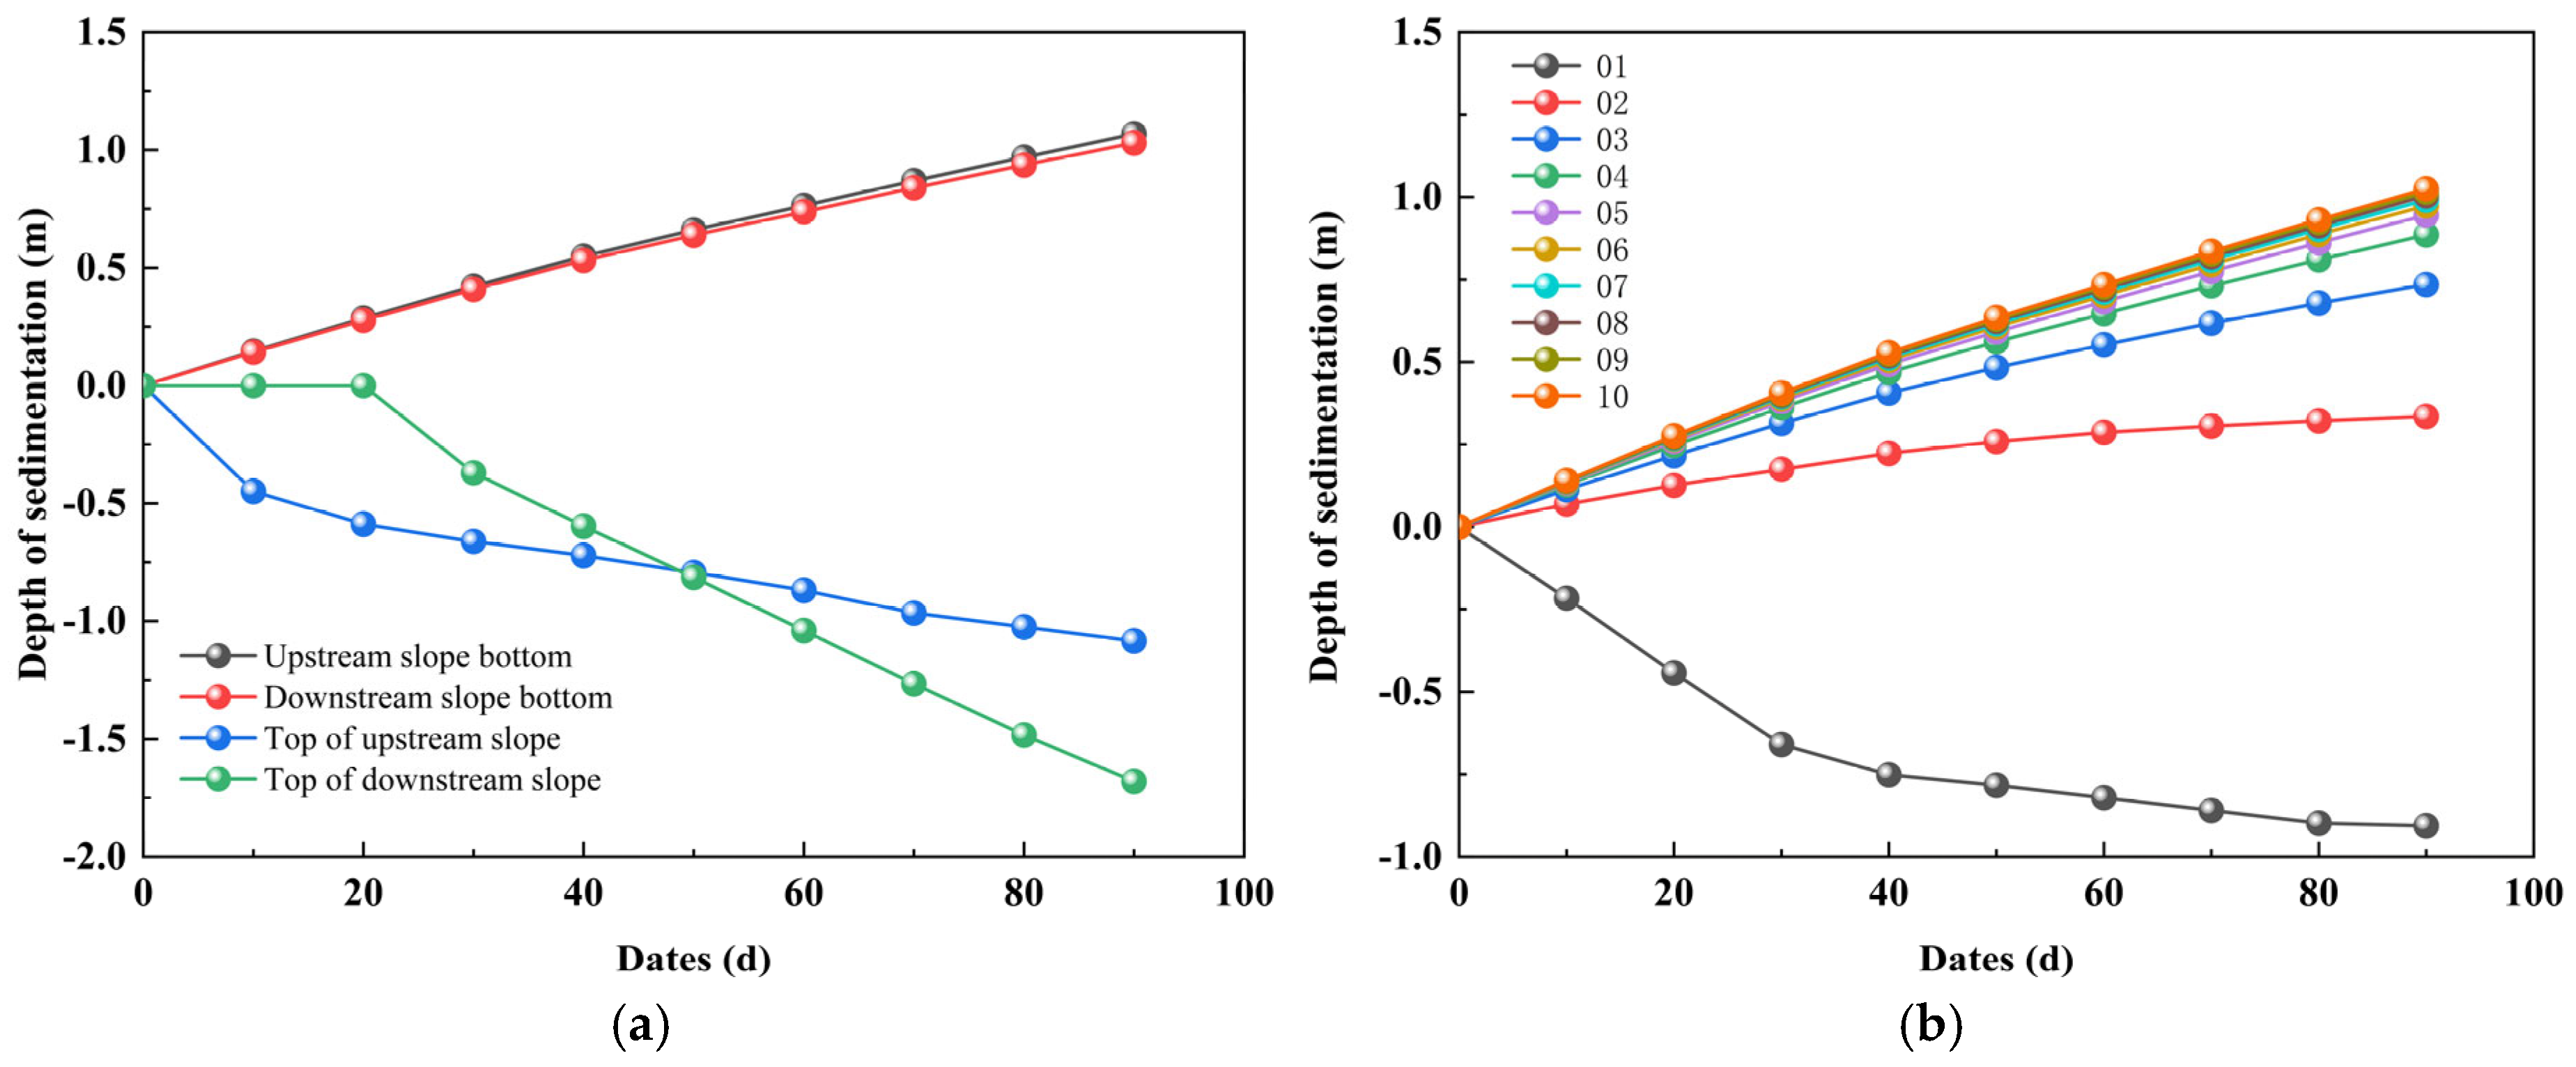
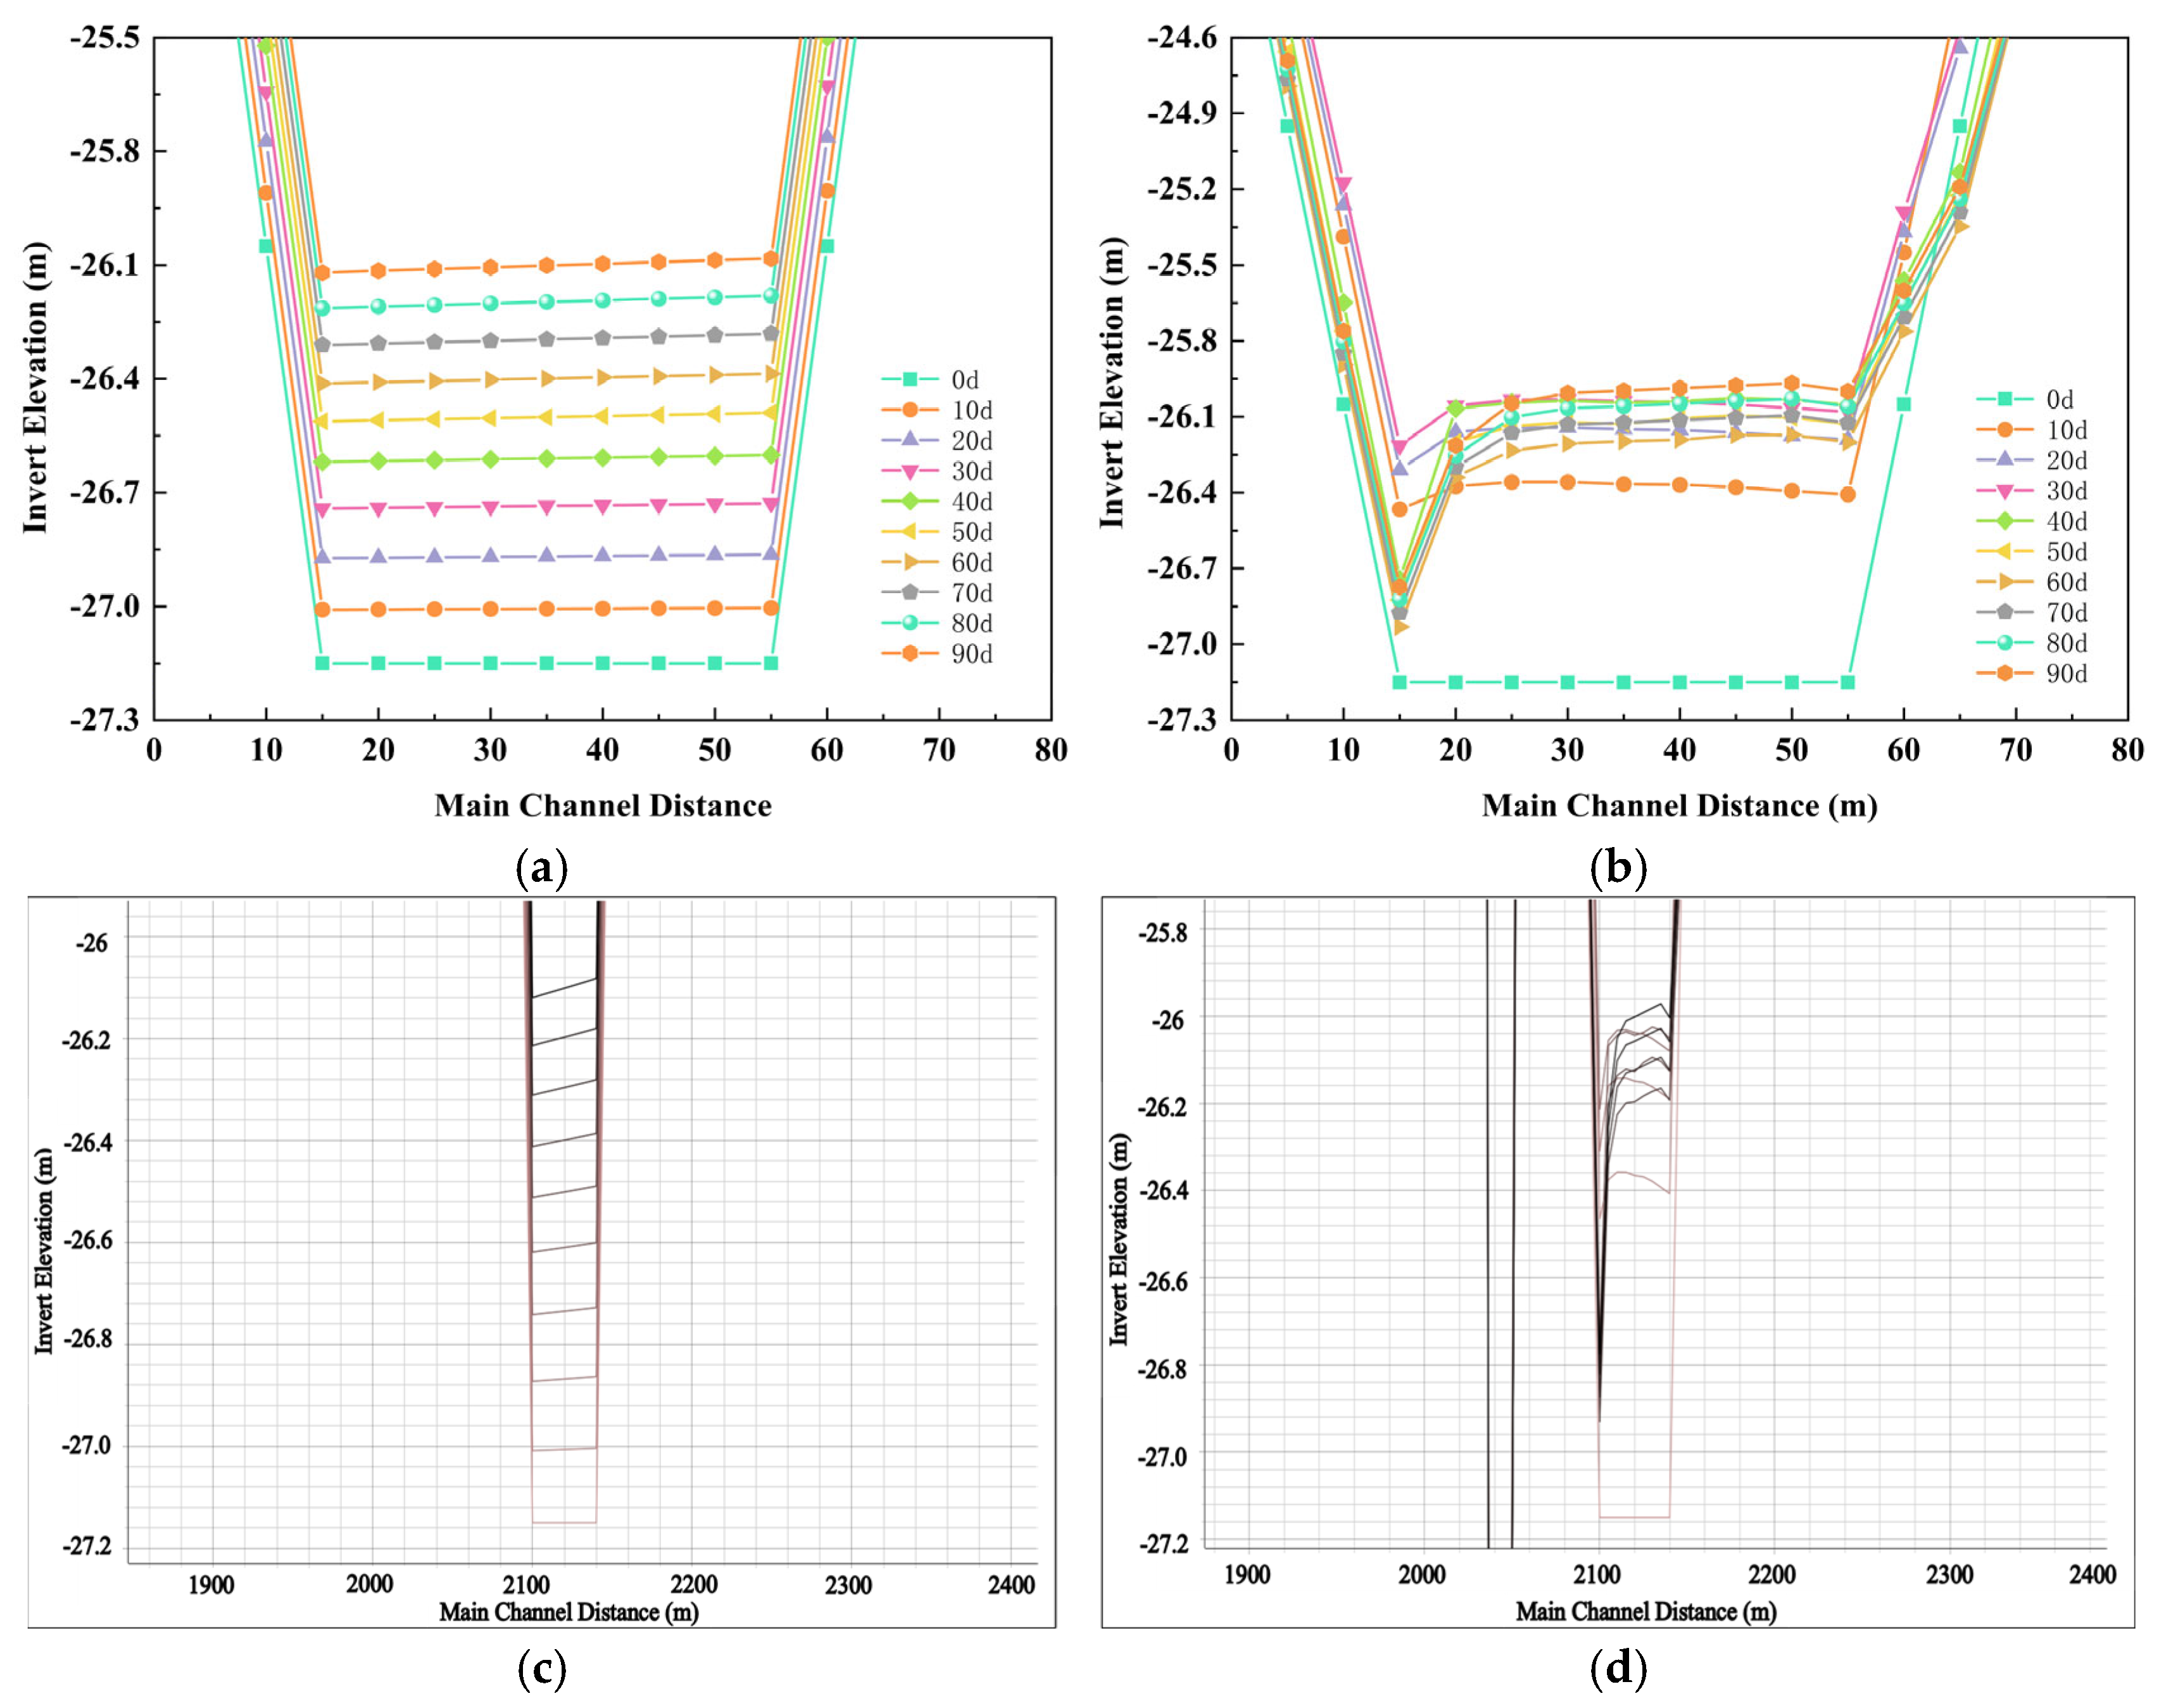
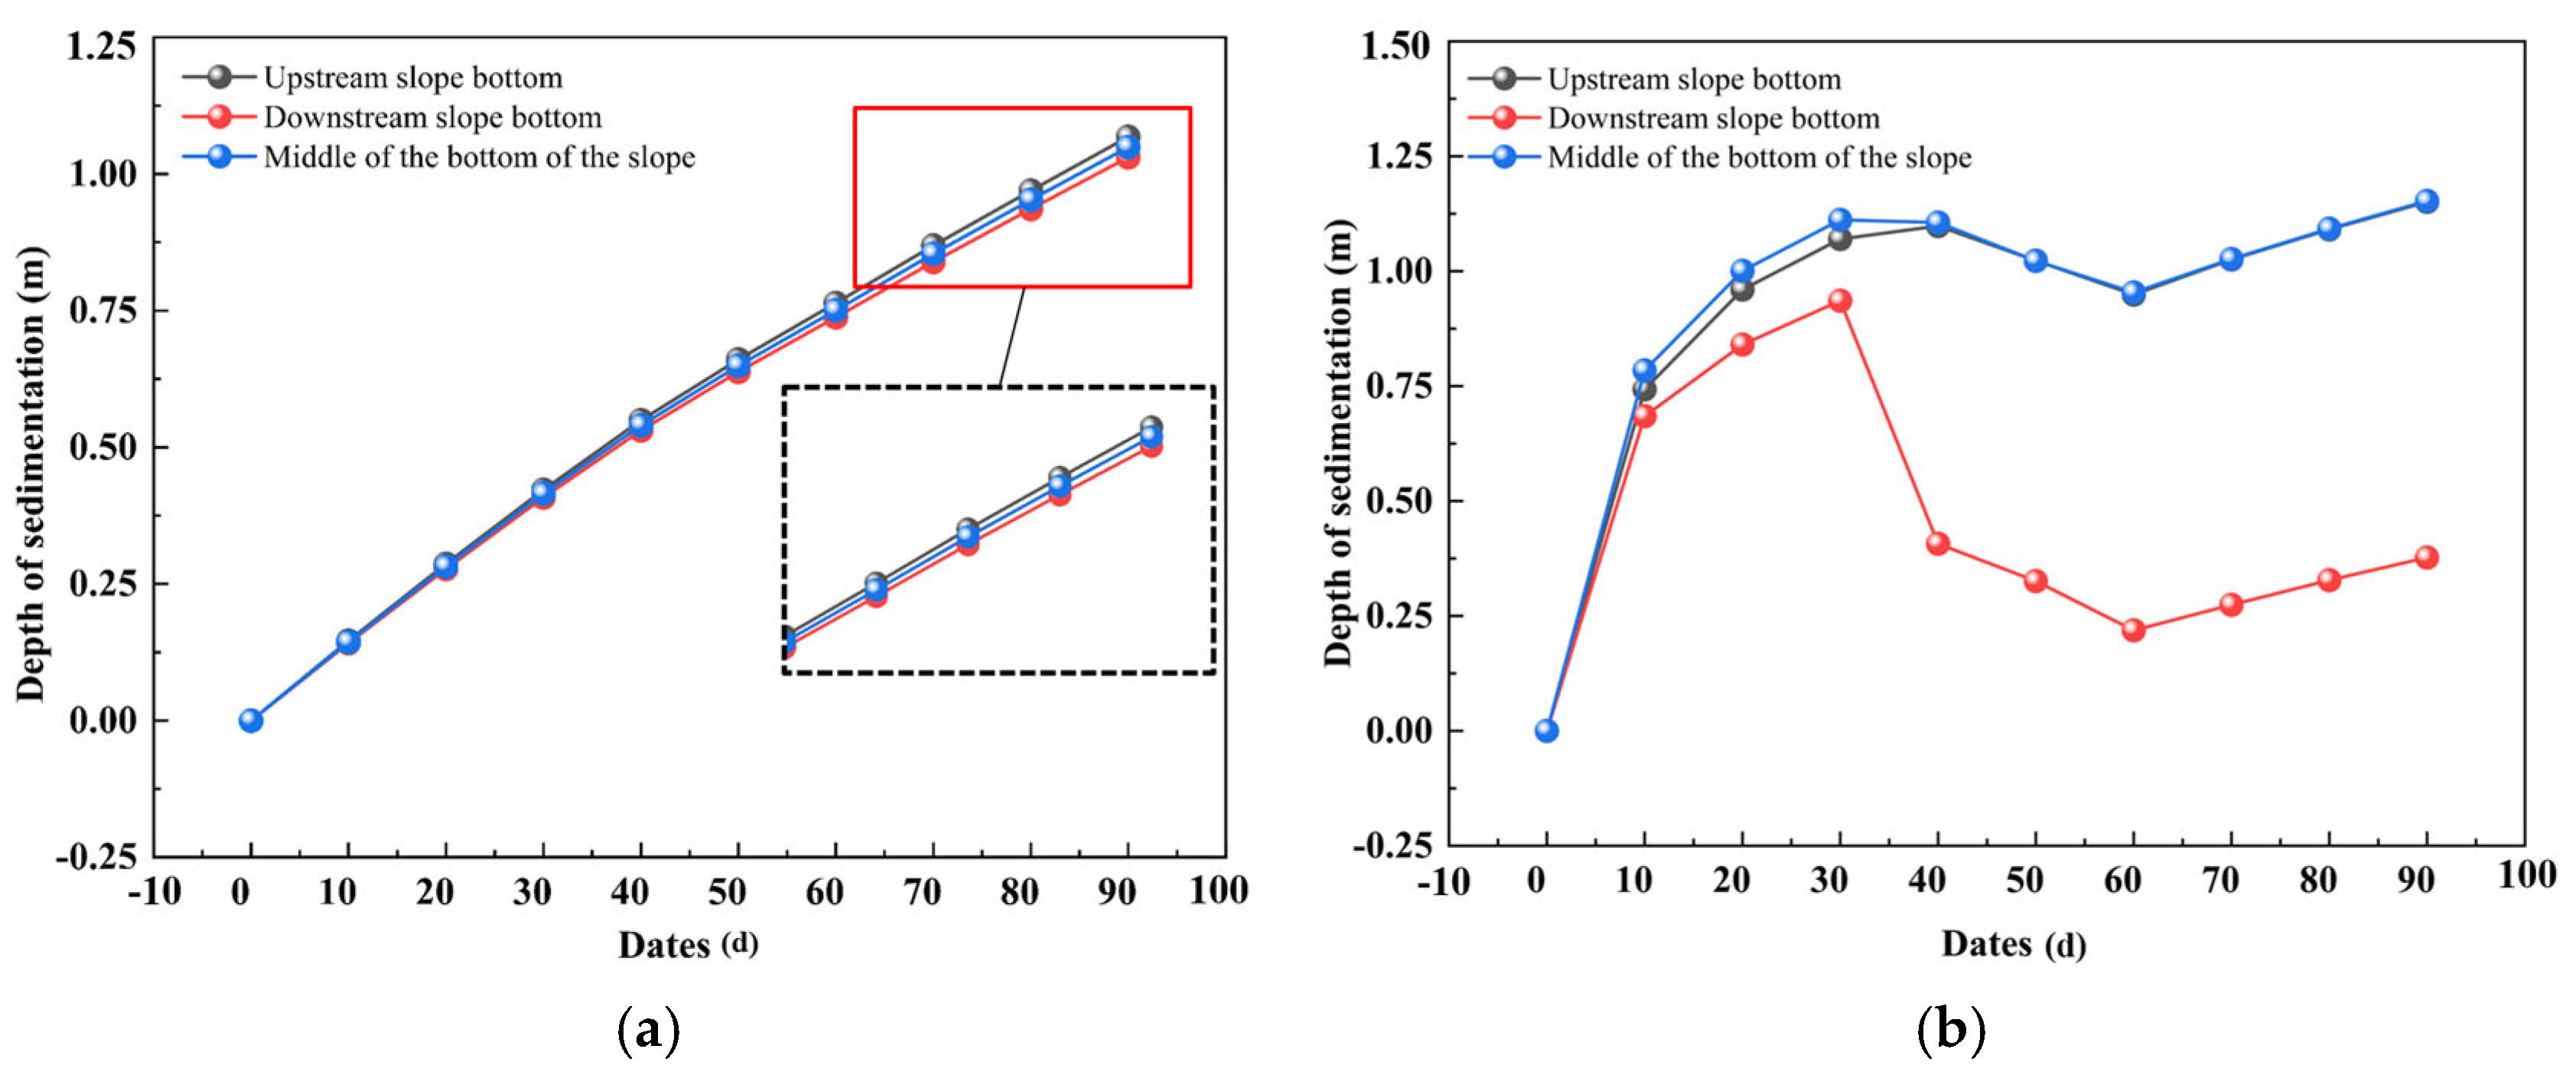
- The river back-silting process exhibits distinct spatial heterogeneity. Sediment deposition primarily occurs at the foundation trench bottom, and the back-silting thickness follows an approximately linear trend from the slope toe to the slope crest. The slope crest area is predominantly influenced by fluvial hydrodynamic erosion, forming a well-defined erosion–deposition interface. The back-silting height at the upstream section of the trench bottom is slightly greater than that at the downstream section.
- (2)
- Hydroperiod variations significantly influence the spatiotemporal distribution of back-silting. During the dry season, the sedimentation process demonstrates stable hydrodynamic conditions with smooth sediment surfaces, and the deposition thickness increases almost linearly over time following a steady-state sedimentation pattern. In contrast, the flood season exhibits greater overall sedimentation intensity but with highly dynamic variations, characterized by alternating “deposition–erosion–redeposition” cycles that correlate strongly with hydrodynamic fluctuations (e.g., flow velocity and sediment concentration). From an engineering practice perspective, it is suggested that the optimal timing for immersed tube trench excavation should prioritize dry season operations.
- (3)
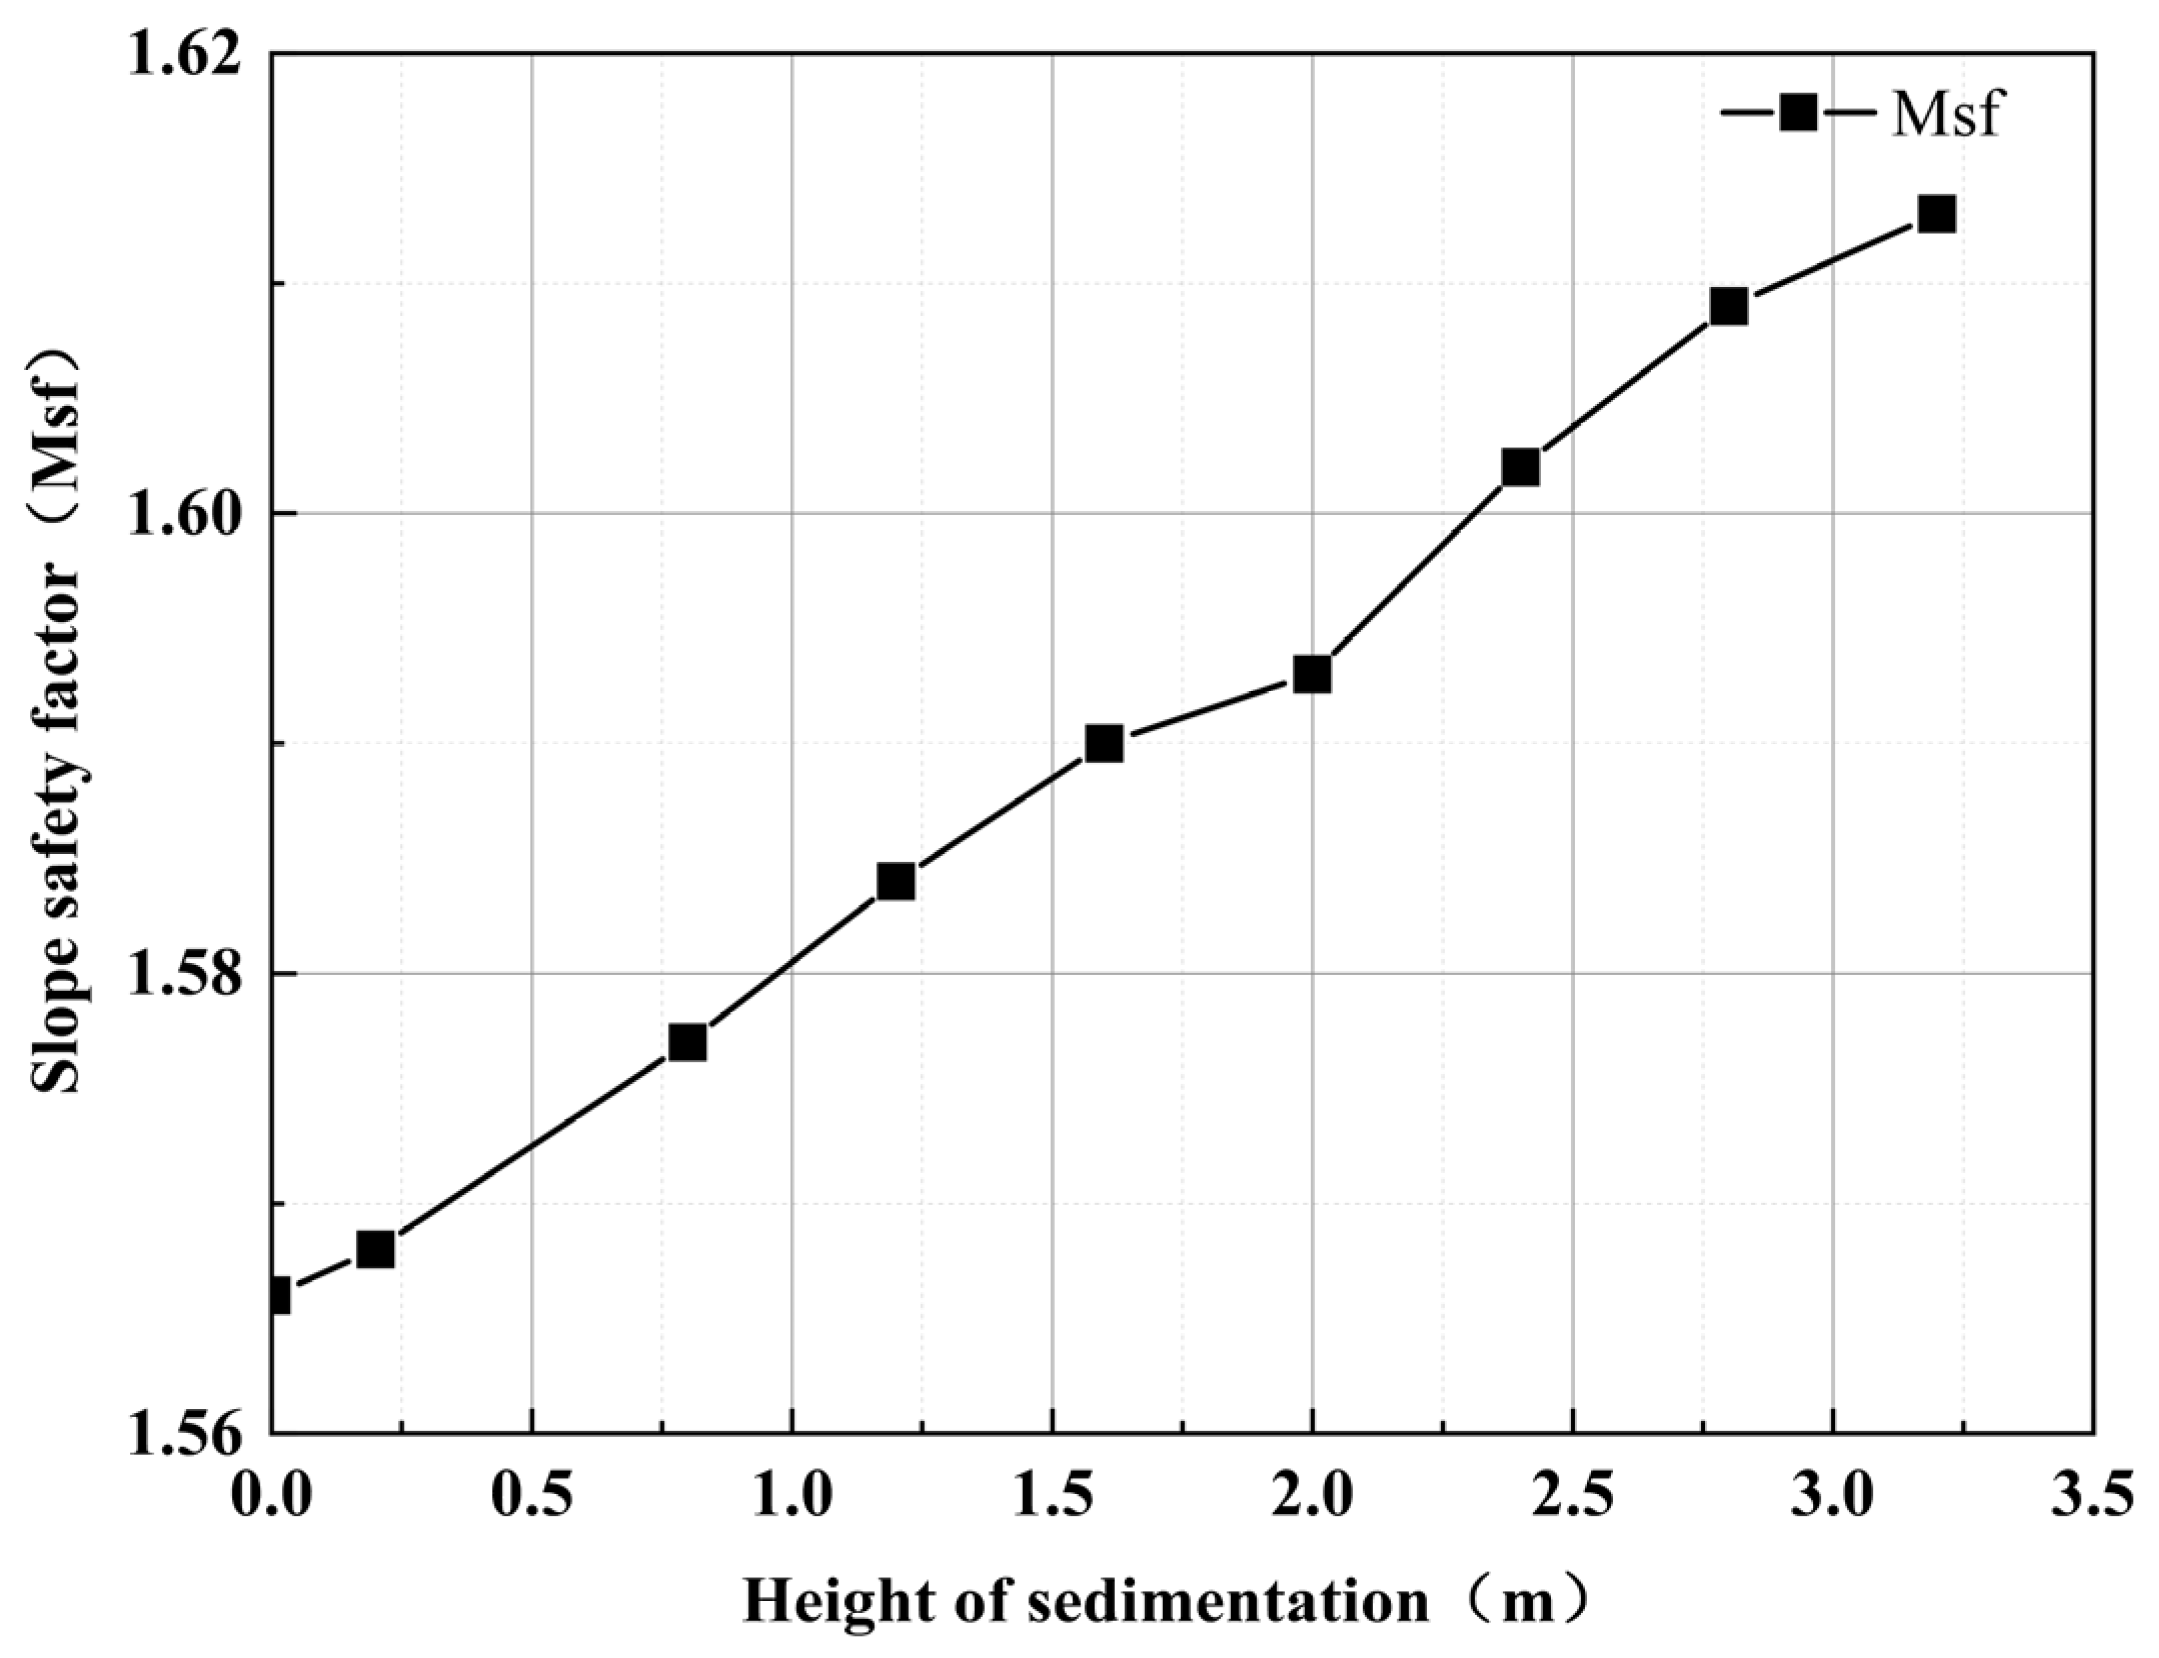
- The back-silting process within the foundation trench exhibits a marginally positive influence on slope stability. The overall safety factor of trench slopes shows a slightly increasing trend with progressive back-silting thickness accumulation. Quantitative evaluation reveals that for every 3.2 m of sediment deposition, the safety factor experiences a nominal enhancement of approximately 0.05. This minimal variation suggests that back-silting deposition exerts negligible impact on the inherent stability of the slopes themselves.
- (4)
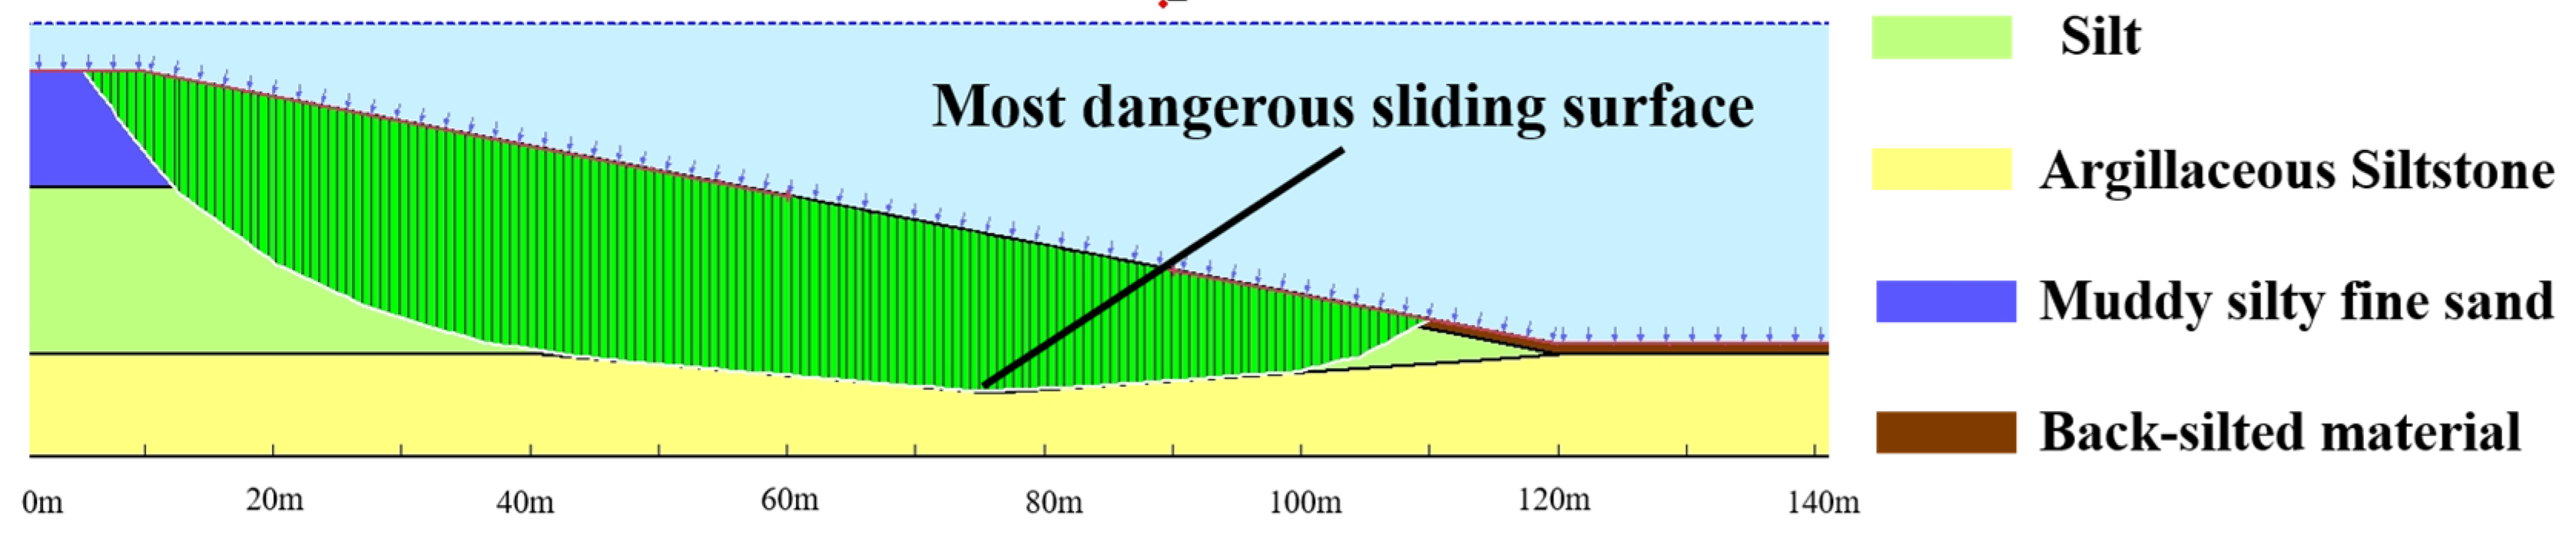
- The dredging simulation results reveal a progressive outward migration of the critical failure surface from the interior slope body to the newly deposited sediment layer with increasing back-silting thickness. Notably, steeper dredging gradients lead to a systematic reduction in the spatial distribution of critical slip surfaces, which progressively localize near the slope toe. This phenomenon substantiates the synergistic control mechanism between back-silting thickness and dredging gradient on slope failure patterns, providing a theoretical foundation for stability assessment in immersed tube foundation trench engineering.
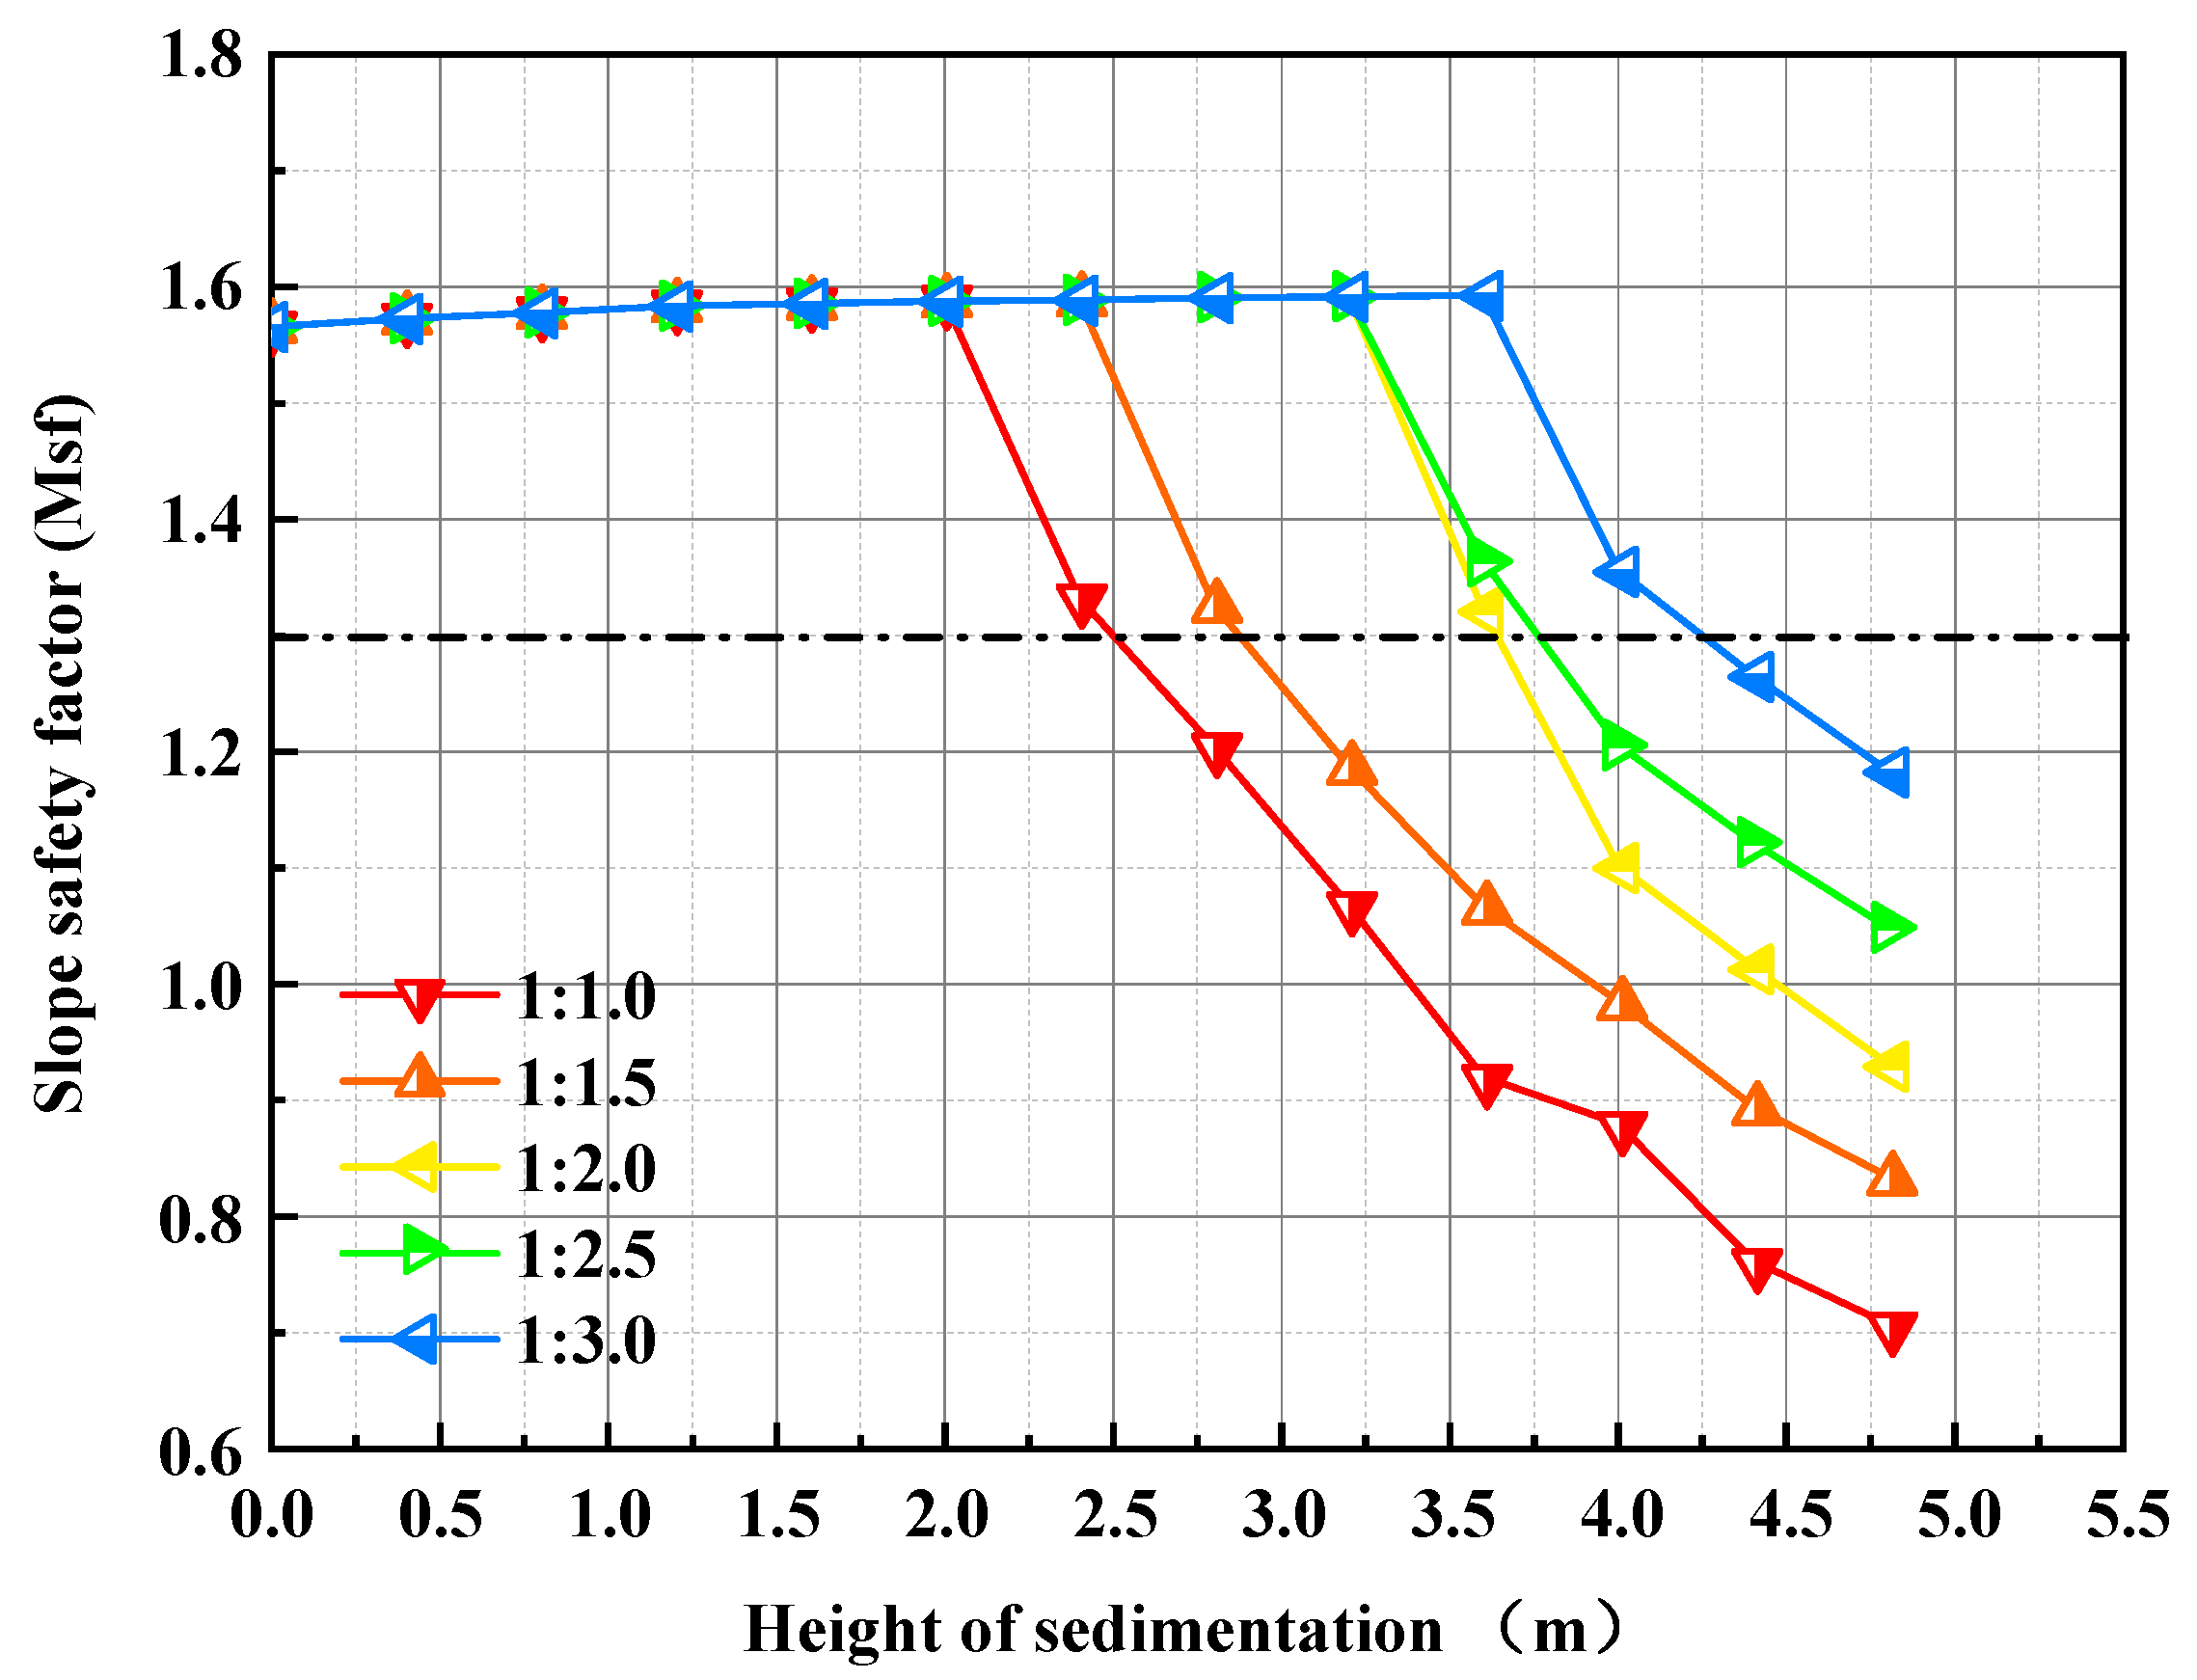
- (5)
- For the proposed dredging method in this study, under identical foundation trench slope height and gradient, a greater back-silting height necessitates a gentler dredging slope gradient. Specifically, when the dredging slope ratio is 1:1, the back-siltation height should be controlled within 2.4 m. Correspondingly, for dredging slope ratios of 1:1.5, 1:2, 1:2.5, and 1:3, the allowable back-siltation heights should be limited to 2.8 m, 3.6 m, 3.6 m, and 4.0 m, respectively.
Author Contributions
Funding
Data Availability Statement
Conflicts of Interest
References
- He, W.; Zhou, H.; Cao, W.; Hu, B. Latest development and prospect of underwater tunnels in China. Mod. Tunn. Technol. 2024, 61, 105–123. [Google Scholar]
- Zheng, W. Back silting monitoring and analysis of deep foundation trench in the Hongkong-Zhuhai-Macao Bridge immersed tunnel project. China Port Harb. Eng. 2015, 35, 25–28. [Google Scholar]
- Liu, B.; Zeng, C. Countermeasures against siltation of No.1 harbor basin of Tongzhou Bay port area. Port Waterw. Eng. 2022, 76–82. [Google Scholar]
- Lee, G.; Shin, H.; Kim, Y.T.; Dellapenna, T.M.; Kim, K.J.; Williams, J.; Kim, S.; Figueroa, S.M. Field investigation of siltation at a tidal harbor: North Port of Incheon, Korea. Ocean Dyn. 2019, 69, 1101–1120. [Google Scholar] [CrossRef]
- Restrepo, J.C.; Orejarena-Rondón, A.; Consuegra, C.; Pérez, J.; Llinas, H.; Otero, L.; Álvarez, O. Siltation on a highly regulated estuarine system: The Magdalena River mouth case (Northwestern South America). Estuar. Coast. Shelf Sci. 2020, 245, 107020. [Google Scholar] [CrossRef]
- Chen, W.; Huang, L.; Wang, D.; Liu, C.; Xu, L.; Ding, Z. Effects of siltation and desiltation on the wave-induced stability of foundation trench of immersed tunnel. Soil Dyn. Earthq. Eng. 2022, 160, 107360. [Google Scholar] [CrossRef]
- Wang, H.; Dhian, B.A. Hydrodynamics- and remote sensing-based model for estimating the effects of cohesive sediment transport on lagoon siltation in Southwestern Taiwan. Sci. Total Environ. 2024, 955, 176853. [Google Scholar] [CrossRef]
- Nguyen, V.; Zheng, J.; Zhang, J. Mechanism of back siltation in navigation channel in Dinh An Estuary, Vietnam. Water Sci. Eng. 2013, 6, 178–188. [Google Scholar]
- He, J.; Xin, W. Analysis and numerical simulation of abnormal siltation in foundation trench of immersed tube tunnel of Hongkong-Zhuhai-Macao Bridge. Adv. Water Resour. 2019, 30, 823–833. [Google Scholar]
- Santos-Ferreira, A.; Santos, C.; Cabral, M. Local Hydrodynamics and the Siltation of Vila Praia de Âncora Harbor. Procedia Eng. 2015, 116, 932–938. [Google Scholar] [CrossRef]
- Gomes, M.N.; Rápalo, L.M.C.; Oliveira, P.T.S.; Giacomoni, M.H.; Lago, C.A.F.D.; Mendiondo, E.M. Modeling unsteady and steady 1D hydrodynamics under different hydraulic conceptualizations: Model/Software development and case studies. Environ. Modell. Softw. 2023, 167, 105733. [Google Scholar] [CrossRef]
- Xu, Y.; Fan, S.; Liu, Y.; Zhou, X.; Liu, X.; Yang, Z.; Liu, L.; Liu, J. Analysis of silt interaction with water in an estuary. J. Nat. Gas Sci. Eng. 2016, 35, 1270–1276. [Google Scholar] [CrossRef]
- Li, X. Calculation of River Water Surface Profiles Based on Mike 21 and HEC-RAS. Water Sci. Eng. Technol. 2024, 29–31. [Google Scholar]
- Shu, Y.; Hu, T.; Wang, T. Analysis of sediment transport characteristics in Wutongshan River basin based on HEC-RAS. Water Resour. Dev. Manag. 2021, 13–19. [Google Scholar]
- Rahman, S.A.; Chakrabarty, D. Sediment transport modelling in an alluvial river with artificial neural network. J. Hydrol. 2020, 588, 125056. [Google Scholar] [CrossRef]
- Li, L.; Sabokruhie, P.; Lindenschmidt, K.; Gutwin, C. Assessing the possible influence of human activities on sediment transport in the Saskatchewan River and its delta. J. Environ. Manag. 2024, 368, 122240. [Google Scholar] [CrossRef]
- Pratama, F.; Wulandari, S.; Rohmat, F.I.W. Modeling sediment accumulation in Pare Reservoir using HEC-RAS 2D: Assessing storage capacity over a 10-year period. Results Eng. 2025, 25, 104333. [Google Scholar] [CrossRef]
- Tadesse, A.; Dai, W. Prediction of sedimentation in reservoirs by combining catchment based model and stream based model with limited data. Int. J. Sediment Res. 2019, 34, 27–37. [Google Scholar] [CrossRef]
- Wang, Y.; Qiao, C.; Sun, C. Design and stability analysis of submerged trench slope for deep buried immerse tunnel in external sea. J. Beijing Jiaotong Univ. 2013, 37, 57–61. [Google Scholar]
- Xiao, M. Research on Stability and Suitable Slope Ratio of Subwater Trench for Immersed Tunnel Crossing the Yantze River. Mod. Tunn. Technol. 2001, 42–46. [Google Scholar]
- Lin, F.; Tao, L.; Zhu, H. Research on stability of submerged slope. Chin. J. Rock Mech. Eng. 2003, 22, 2149–2153. [Google Scholar]
- Li, L.; Liu, Y.; Chen, H.; Wu, H. The Stability Analysis of Underwater Slopes Based on Strength Reduction Method. Adv. Mater. Res. 2011, 243–249, 2690–2693. [Google Scholar] [CrossRef]
- Fang, L.; Chen, J.; Cao, H.; Mo, H.; Liu, S.; Zhou, X.J. Study on Stability of Underwater Trench of Immersed Tunnel of Hongkong-Zhuhai-Macau Bridge. Appl. Mech. Mater. 2011, 90, 2212–2220. [Google Scholar] [CrossRef]
- Lv, J.; Zhao, H.; Yang, S.; Zhao, J.; Sun, H. Slope stability of underwater fill embankment in mountainous area. J. Shenzhen Univ. Sci. Eng. 2021, 38, 151–156. [Google Scholar]
- Luo, H.; Wei, L.; Zhao, T.; Ding, W.; Zhou, A.; Tao, J.; Gu, X.; Hu, L. Stability Analysis of an Immersed Tube Tunnel Foundation Trench Slope. In Proceedings of the GeoShanghai 2018 International Conference: Fundamentals of Soil Behaviours, Shanghai, China, 27–30 May 2018; Springer: Singapore, 2018; pp. 736–744. [Google Scholar]
- Li, X.; Ye, S.; Qiu, M.; Ye, W.; Li, J. Stability Analysis of Horizontal Layered Multi-Stage Fill Slope Based on Limit Equilibrium Method. Buildings 2025, 15, 1105. [Google Scholar] [CrossRef]
- Ye, M.; Tang, H. Calculating the Bearing Capacity of Foundations near Slopes Based on the Limit Equilibrium and Limit Analysis Methods. Buildings 2025, 15, 1106. [Google Scholar] [CrossRef]
- Wu, Y.; Zhang, R.; Le, Q.; Lu, L.; Zhu, S. Based on the Fuzzy Mathematics and Geo-Studio Comprehensive Evaluation of the Stability of the Landslide. Sci. Technol. Eng. 2017, 17, 168–173. [Google Scholar]
- Yu, H.; Xia, Y.; Wang, Z.; Peng, Q. Numerical Simulation Study on Effect of Different Longitudinal Profile Dimensions of Sandpit on Riverbed Evolution of Pebble Channel—A Case of Shuangsheng Section of Shiting River. J. Eng. Sci. Technol. 2017, 49, 83–91. [Google Scholar]
- Li, P.; Li, Q.; Feng, Q.; Huang, Z.; Gan, X.; Ding, H.; Xu, C. Multi-Source Monitoring and Numerical Simulation Deformation on Highway Steep Slopes Under Rainfall Effects. Buildings 2024, 14, 3473. [Google Scholar] [CrossRef]
- Cao, Y.; Li, X.; Yang, Y. Back silting and slope stability of foundation trench in Shenzhen-Zhongshan immersed tunnel project. Chin. J. Geotech. Eng. 2020, 42, 1350–1358. [Google Scholar]
- Zhou, S.; Liu, J.; Li, Y. Analysis of the Stability of Underwater Slope. J. Southwest Jiaotong Univ. 2002, 180–185. [Google Scholar]
- GB 50330-2013; Technical Code for Building Slope Engineering. National Standards of the People’s Republic of China: Beijing, China, 2013.


| Stratum | Types of Soil | Roof Elevation (m) | Floor Elevation (m) | Soil Thickness (m) |
|---|---|---|---|---|
| Filling layer | Artificial fill | 0.91~6.24 | −2.89~4.64 | 0.50~5.00 |
| Quaternary Holocene interbedded marine and terrestrial deposits (Q4mc) | Silt | −20.43~4.64 | −26.23~0.62 | 1.00~18.30 |
| Silty clay | −20.43~1.90 | −23.23~0.42 | 0.90~3.80 | |
| Siltstone fine sand | −9.39~0.77 | −13.47~−2.93 | 1.90~10.70 | |
| Fine sand | −20.11~0.87 | −23.36~−5.53 | 1.00~18.40 | |
| Alumina | −21.72~−7.67 | −24.52~−13.19 | 1.10~9.50 | |
| Bedrock | Strongly weathered muddy siltstone | −26.23~−9.89 | −55.70~−12.99 | 0.50~40.20 |
| Moderately weathered muddy siltstone | −55.44~−12.99 | −83.51~−23.46 | 2.20~59.90 |
| Typology | Tide Level (m) |
|---|---|
| Multi-year mean tide level | 1.294 |
| Multi-year average high tide level | 1.724 |
| Multi-year mean low tide level | 0.864 |
| Mean tide level in low water | 0.934 |
| Average high tide level during dry periods | 1.414 |
| Mean low water level during dry season | 0.444 |
| Soil Type | Cohesion/kPa | Friction Angle |
|---|---|---|
| Silt | 12.8 | 7° |
| Muddy silty fine sand | 10.8 | 24° |
| Argillaceous Siltstone | 45 | 30° |
| Back-silted material | 1.62 | 0.4° |
| Soil Type | Silt | Muddy Silty Fine Sand | Argillaceous Siltstone | Back-Silted Material |
|---|---|---|---|---|
| Unit weight kN/m3 | 19.2 | 18.5 | 24.4 | 12.348 |
Disclaimer/Publisher’s Note: The statements, opinions and data contained in all publications are solely those of the individual author(s) and contributor(s) and not of MDPI and/or the editor(s). MDPI and/or the editor(s) disclaim responsibility for any injury to people or property resulting from any ideas, methods, instructions or products referred to in the content. |
© 2025 by the authors. Licensee MDPI, Basel, Switzerland. This article is an open access article distributed under the terms and conditions of the Creative Commons Attribution (CC BY) license (https://creativecommons.org/licenses/by/4.0/).
Share and Cite
Wu, Q.; Tang, M.; Chang, D.; Liu, J.; Lu, X. Back-Silting Characteristics of Foundation Trench Excavation in an Ultra-Wide Inland Immersed Tunnel and Its Impacts on Slope Stability: A Case Study of the Tanzhou Waterway in Shunde. Buildings 2025, 15, 1810. https://doi.org/10.3390/buildings15111810
Wu Q, Tang M, Chang D, Liu J, Lu X. Back-Silting Characteristics of Foundation Trench Excavation in an Ultra-Wide Inland Immersed Tunnel and Its Impacts on Slope Stability: A Case Study of the Tanzhou Waterway in Shunde. Buildings. 2025; 15(11):1810. https://doi.org/10.3390/buildings15111810
Chicago/Turabian StyleWu, Qixian, Maojie Tang, Dan Chang, Jiankun Liu, and Xingbang Lu. 2025. "Back-Silting Characteristics of Foundation Trench Excavation in an Ultra-Wide Inland Immersed Tunnel and Its Impacts on Slope Stability: A Case Study of the Tanzhou Waterway in Shunde" Buildings 15, no. 11: 1810. https://doi.org/10.3390/buildings15111810
APA StyleWu, Q., Tang, M., Chang, D., Liu, J., & Lu, X. (2025). Back-Silting Characteristics of Foundation Trench Excavation in an Ultra-Wide Inland Immersed Tunnel and Its Impacts on Slope Stability: A Case Study of the Tanzhou Waterway in Shunde. Buildings, 15(11), 1810. https://doi.org/10.3390/buildings15111810