
The Influence of Freeze-Thaw Cycles on the Mechanical Properties of Loess Under Temperature Variations

Abstract
1. Introduction
2. Soil Materials and Test Methods
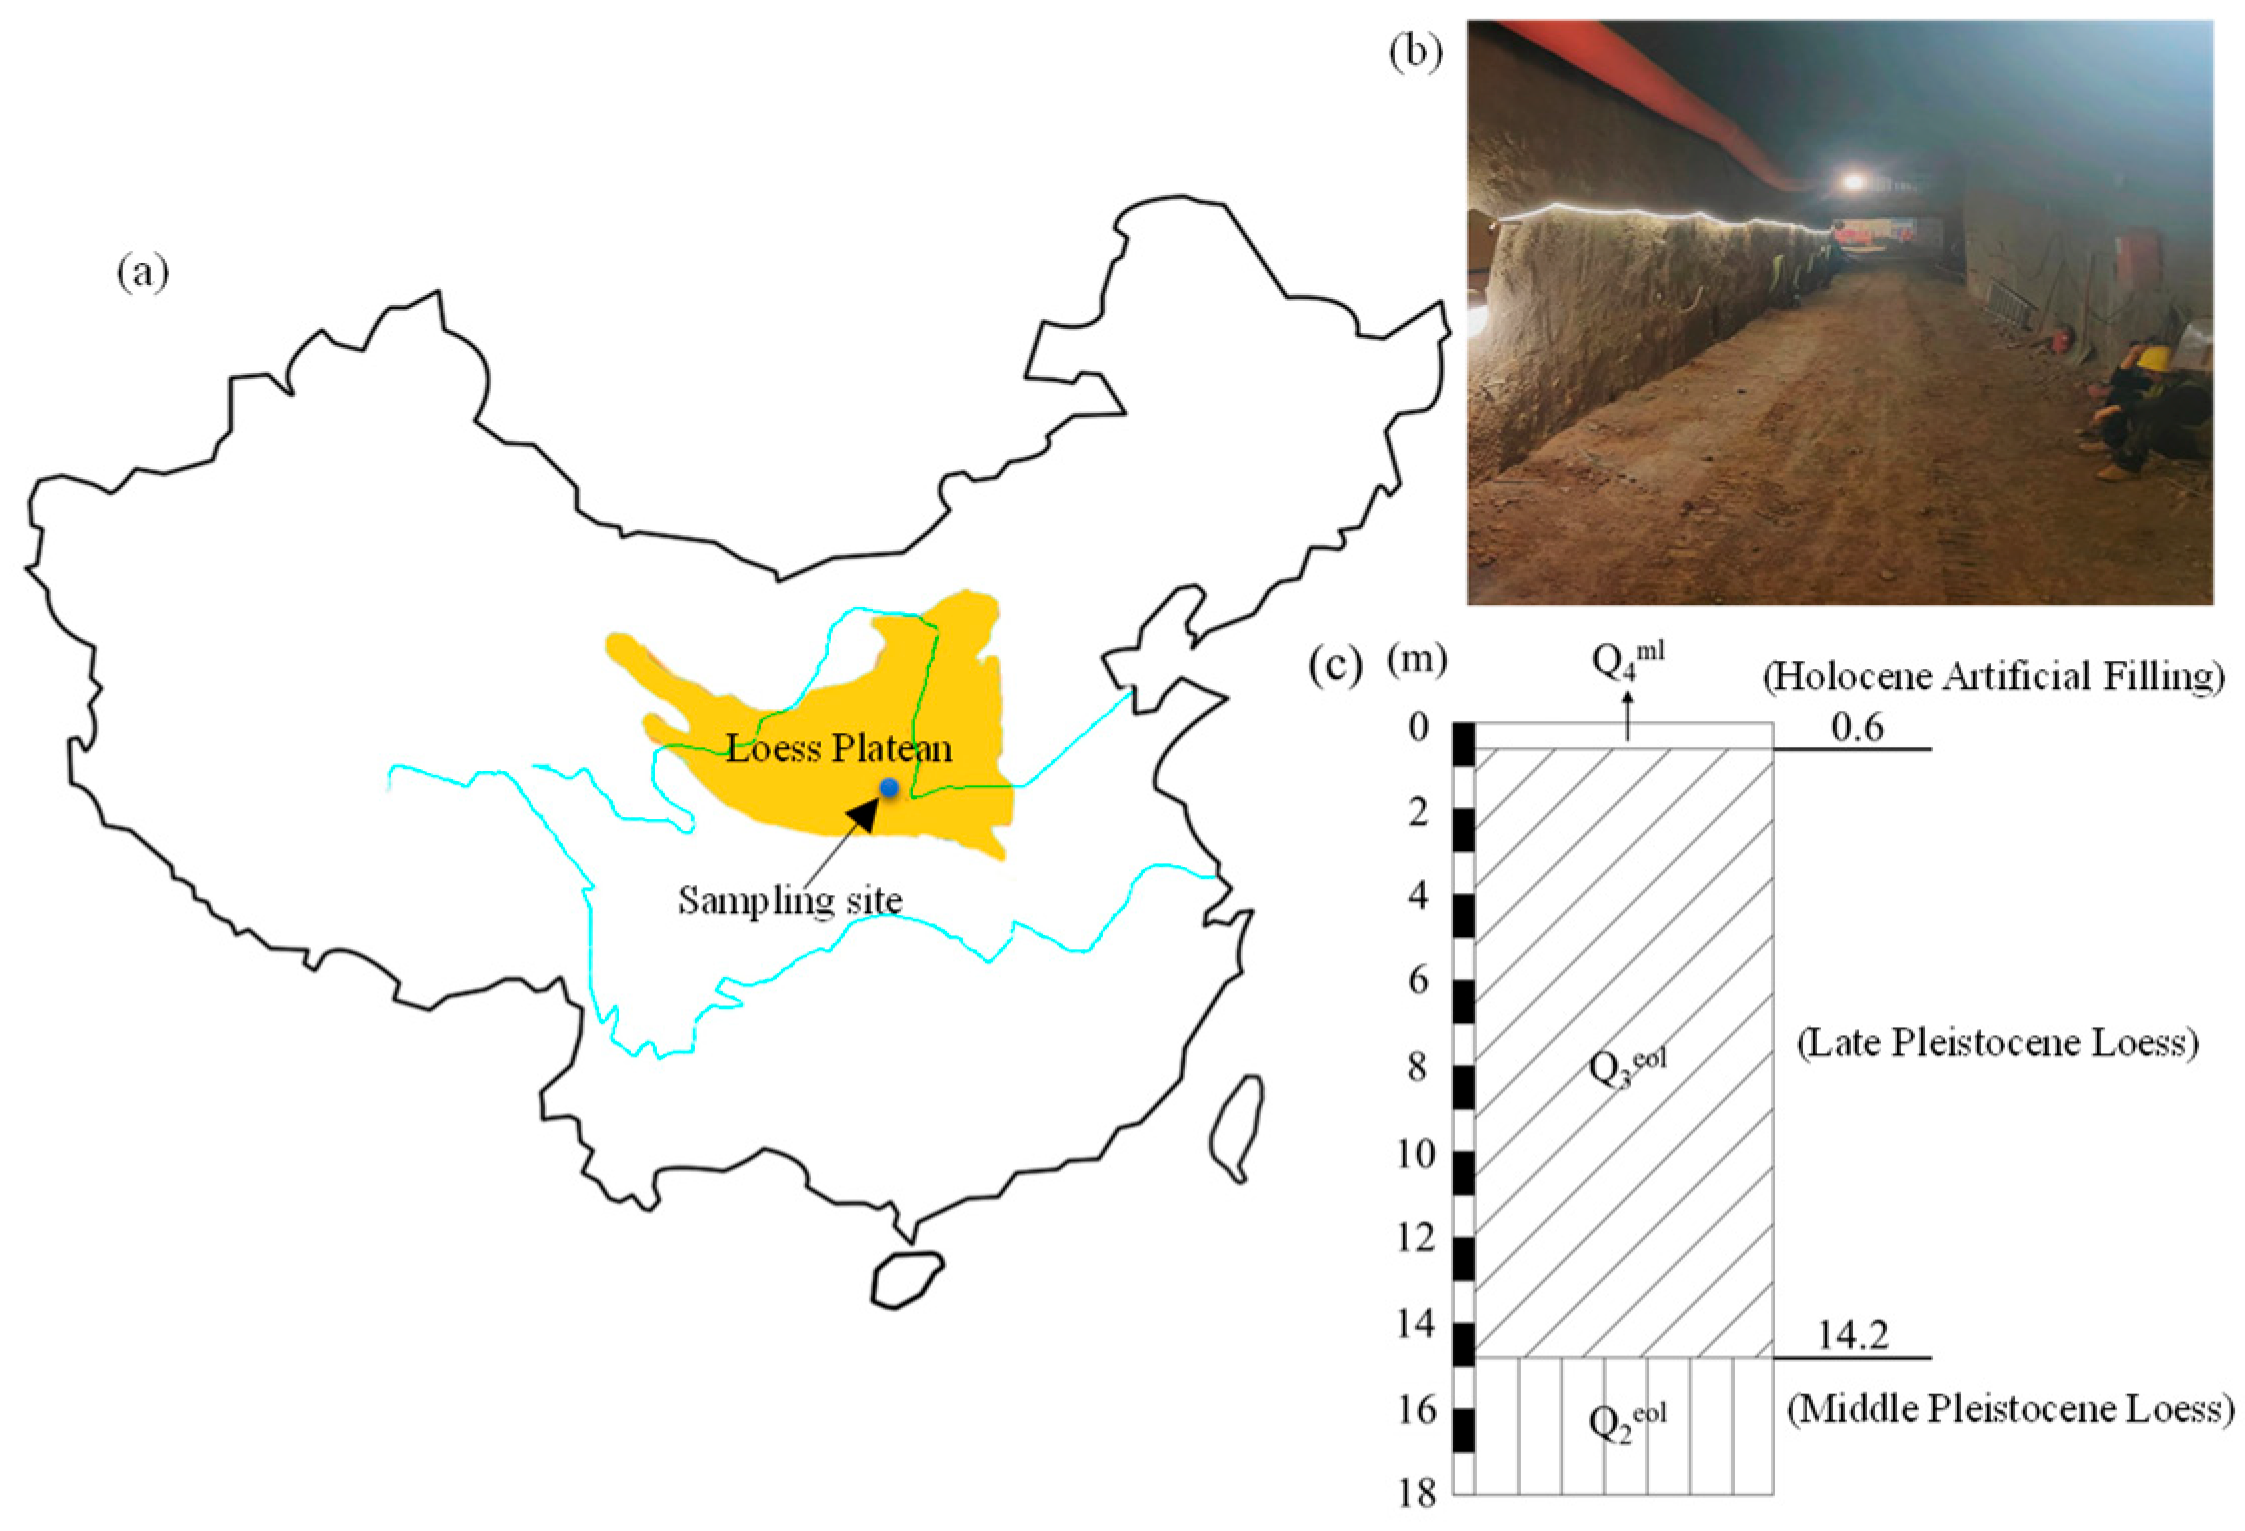
2.1. Preparation of Test Materials and Soil Samples
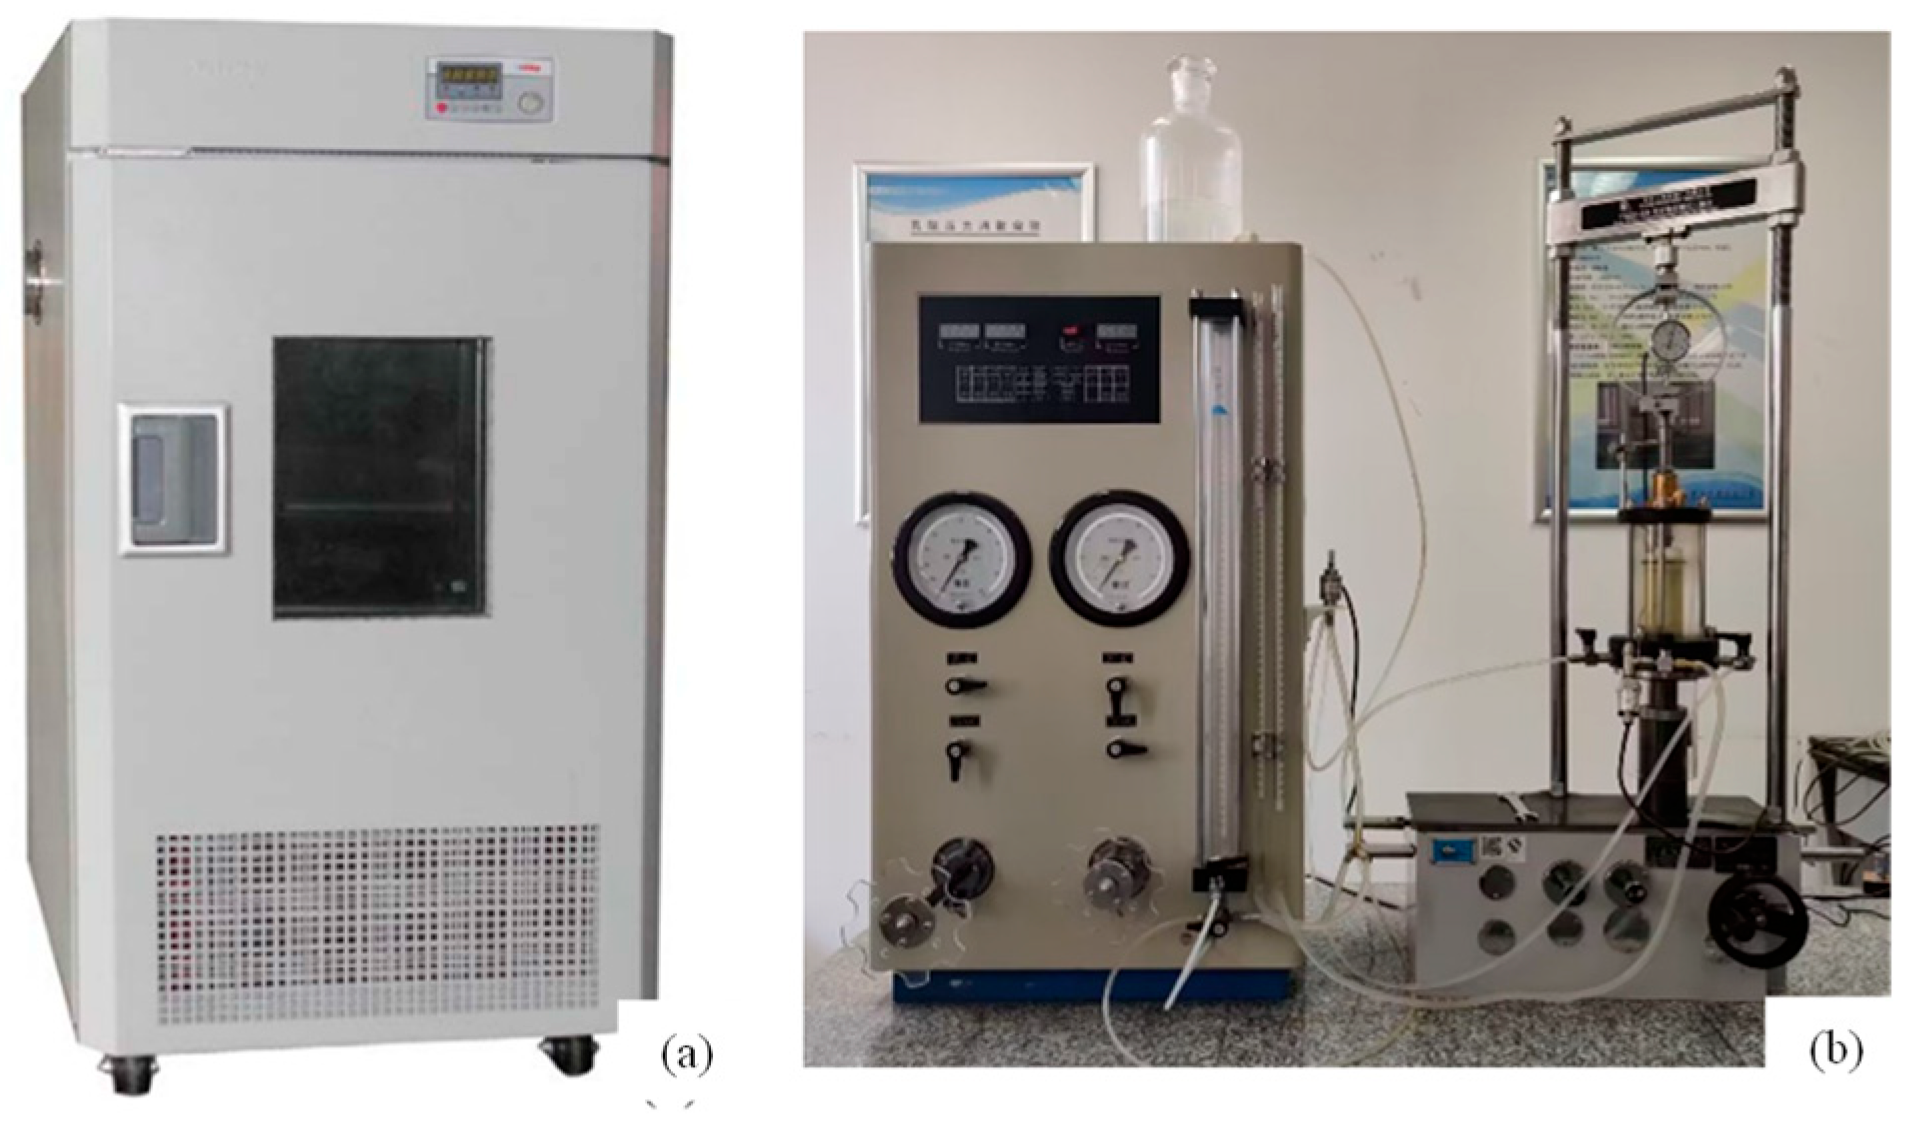
2.2. Test Equipment
2.3. Test Scheme
3. Experimental Results
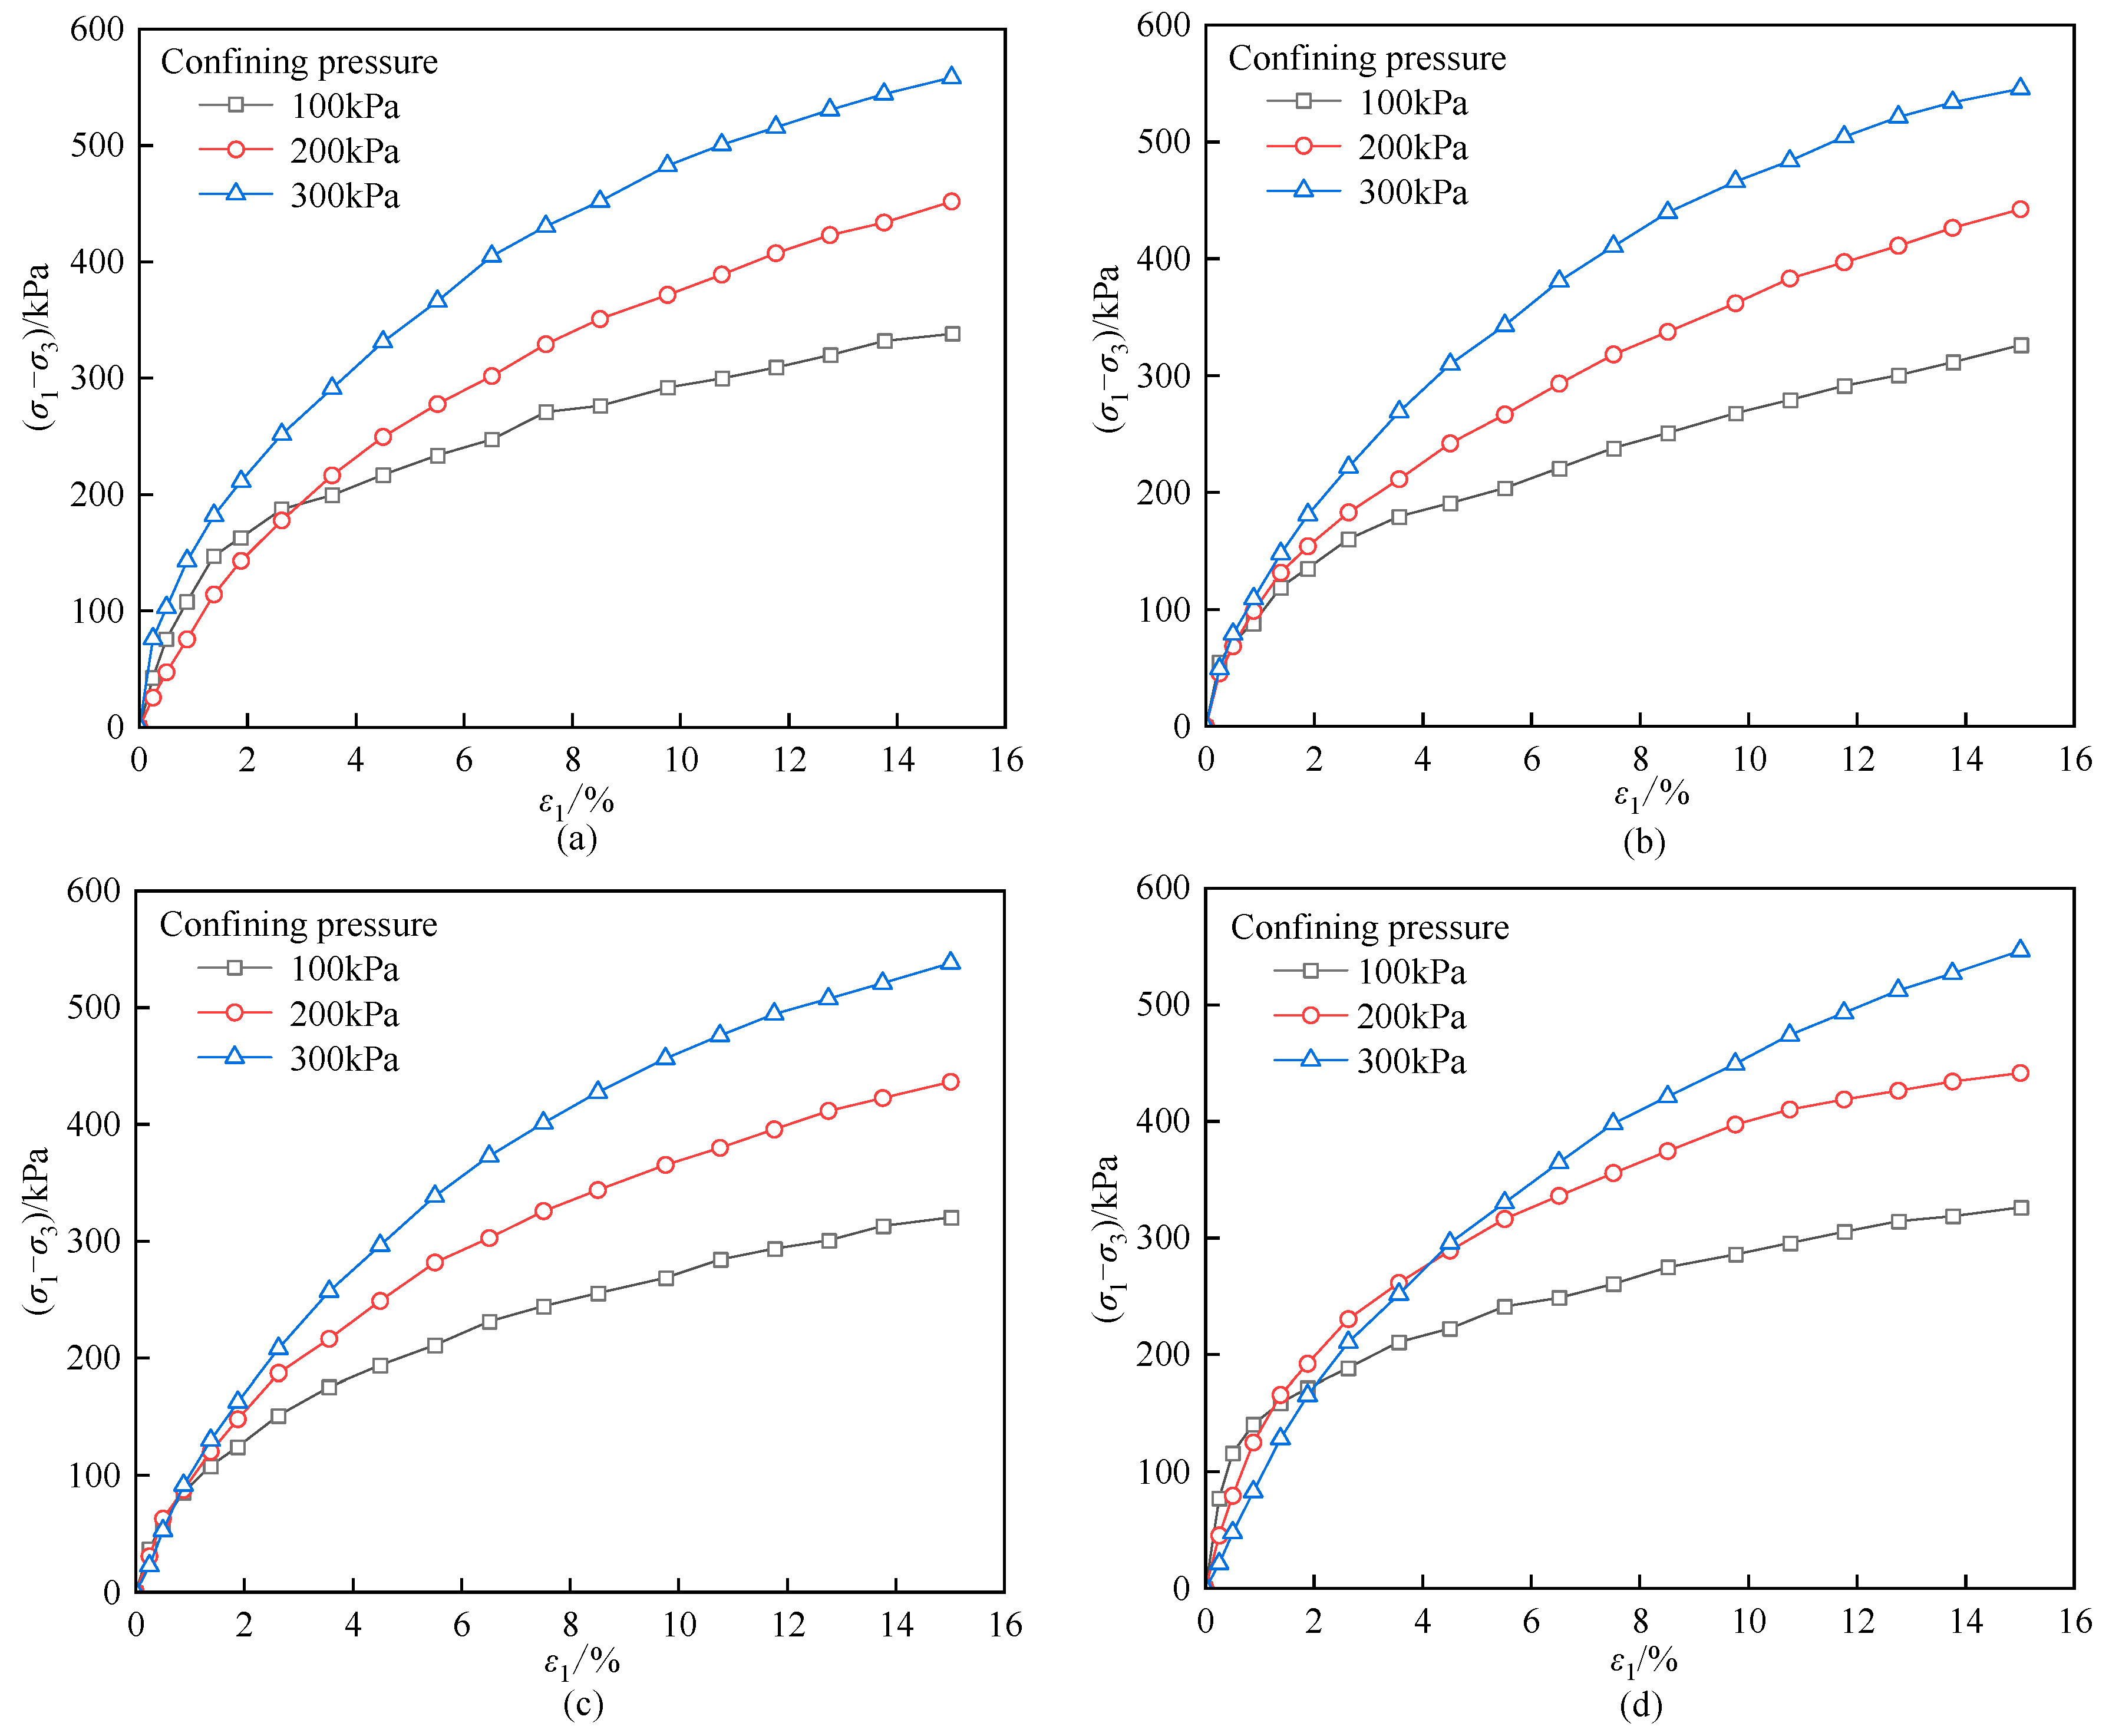
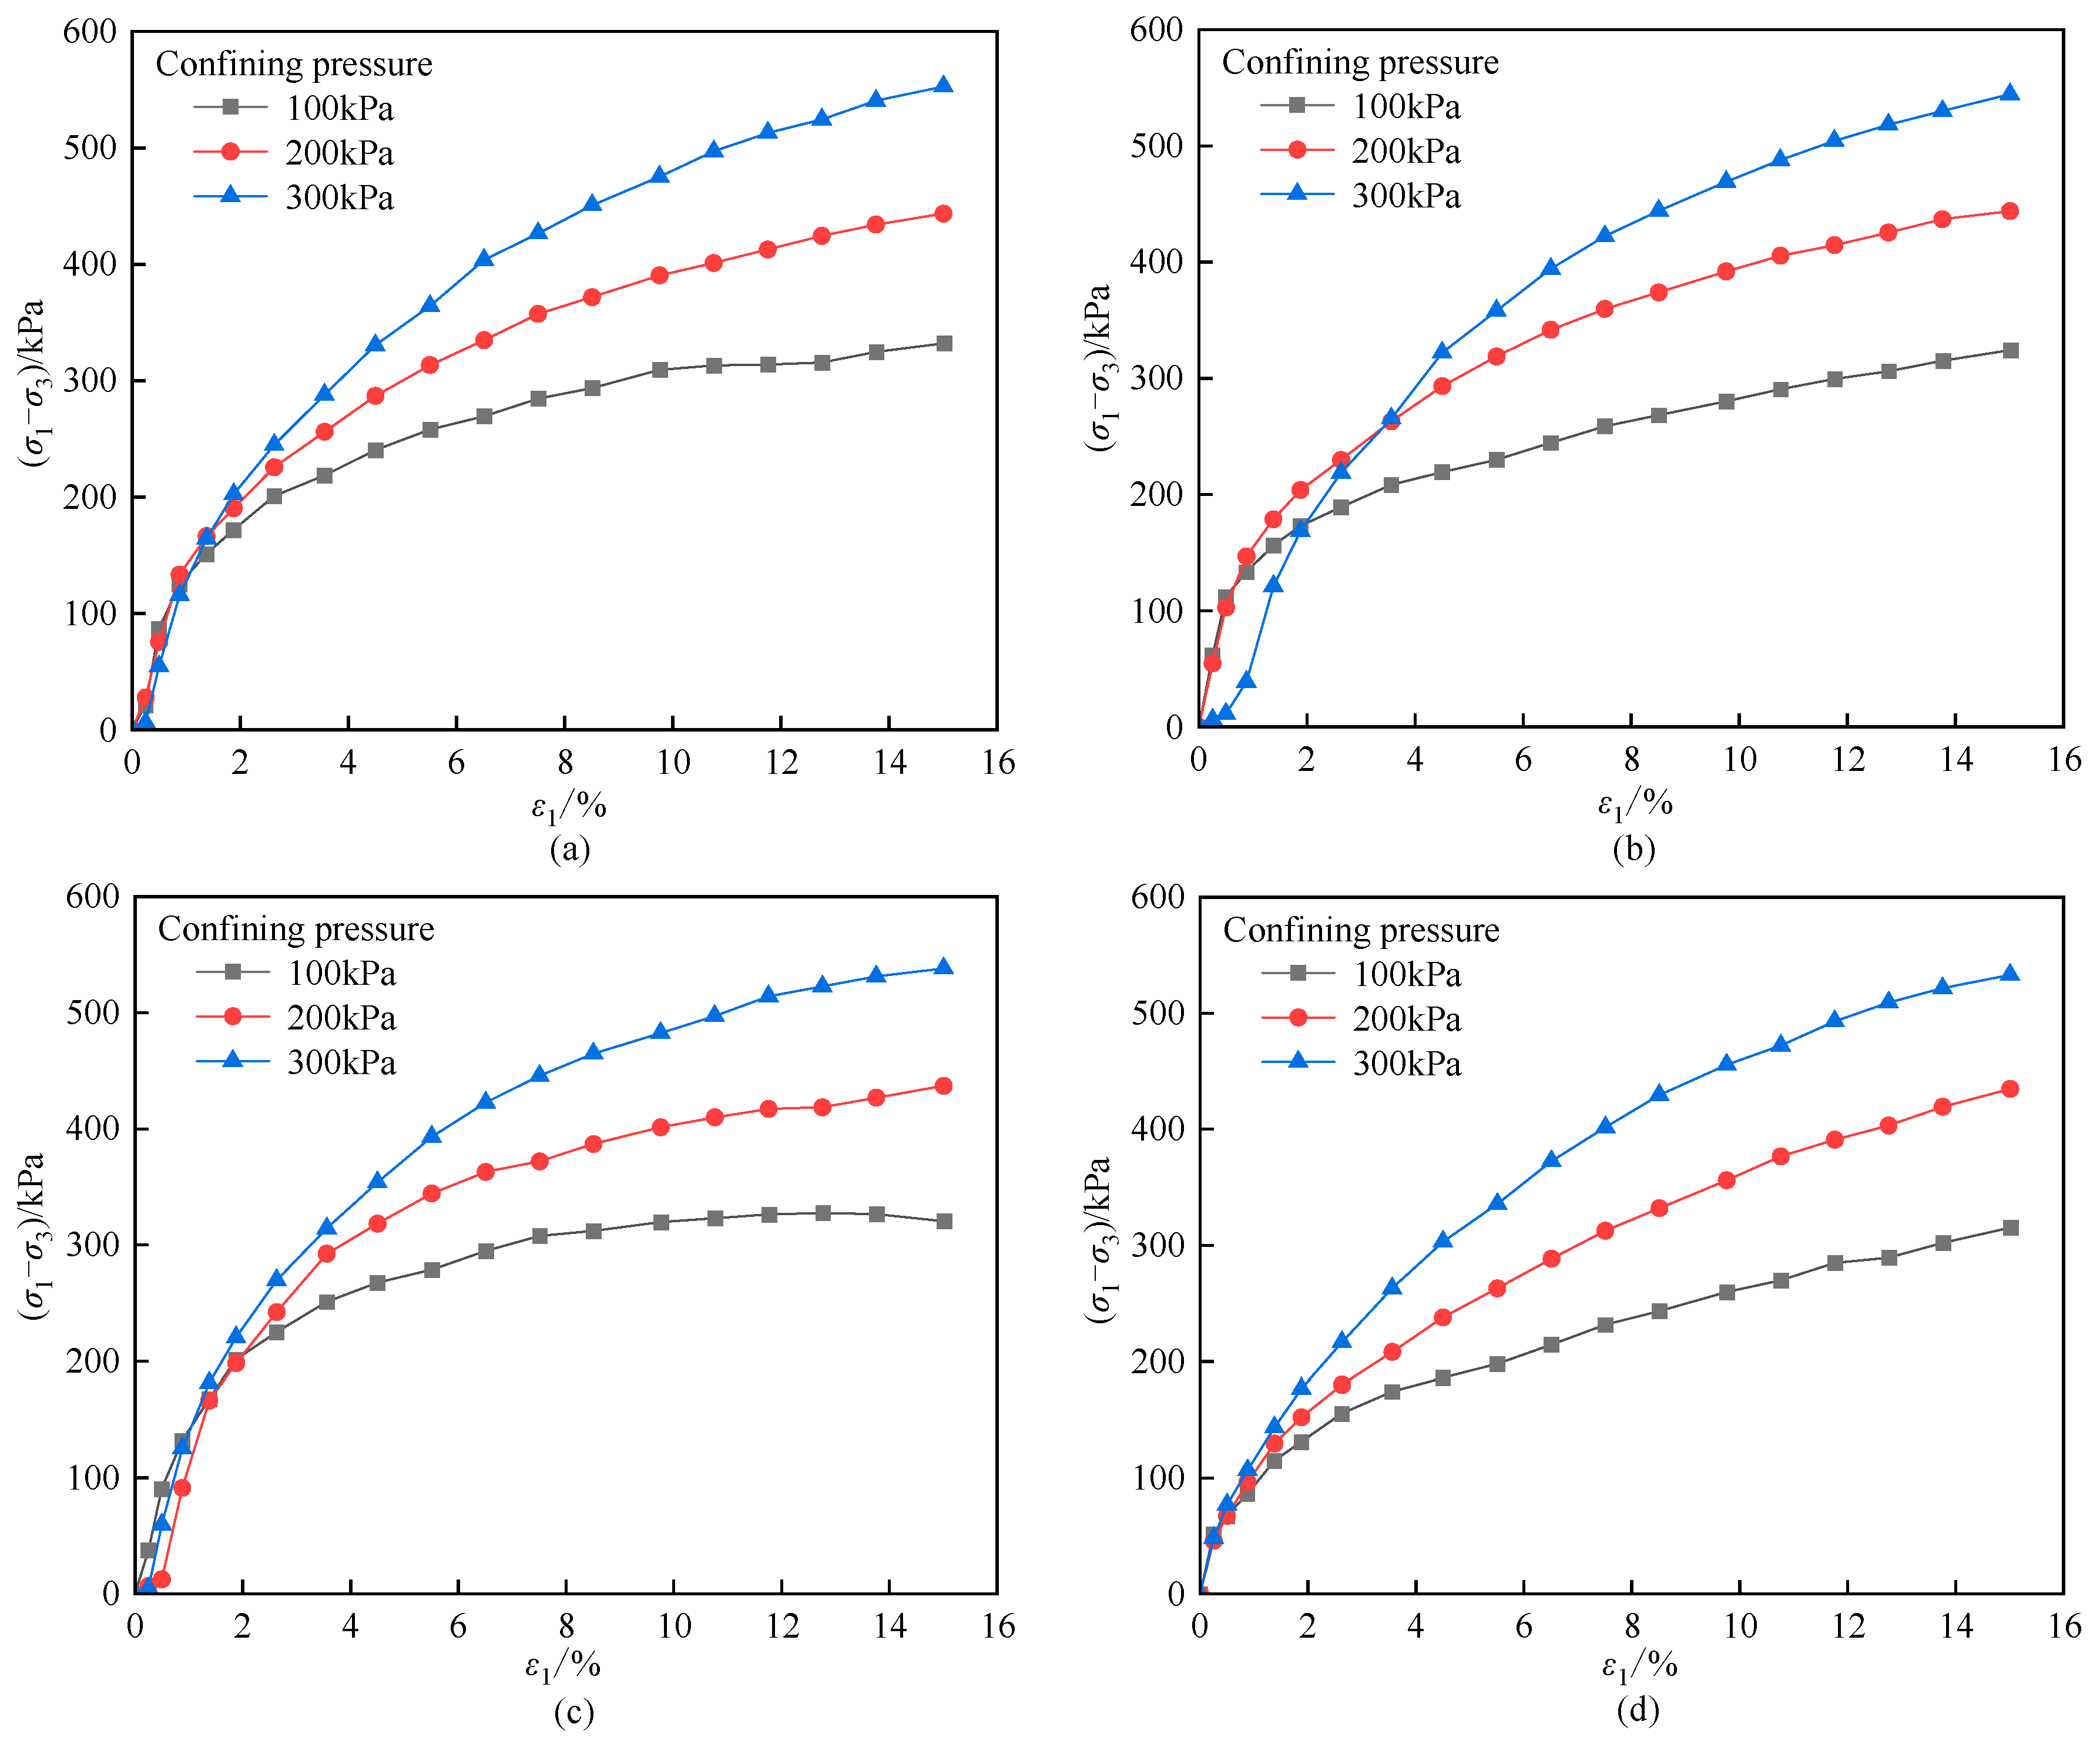
3.1. Stress–Strain Characteristics
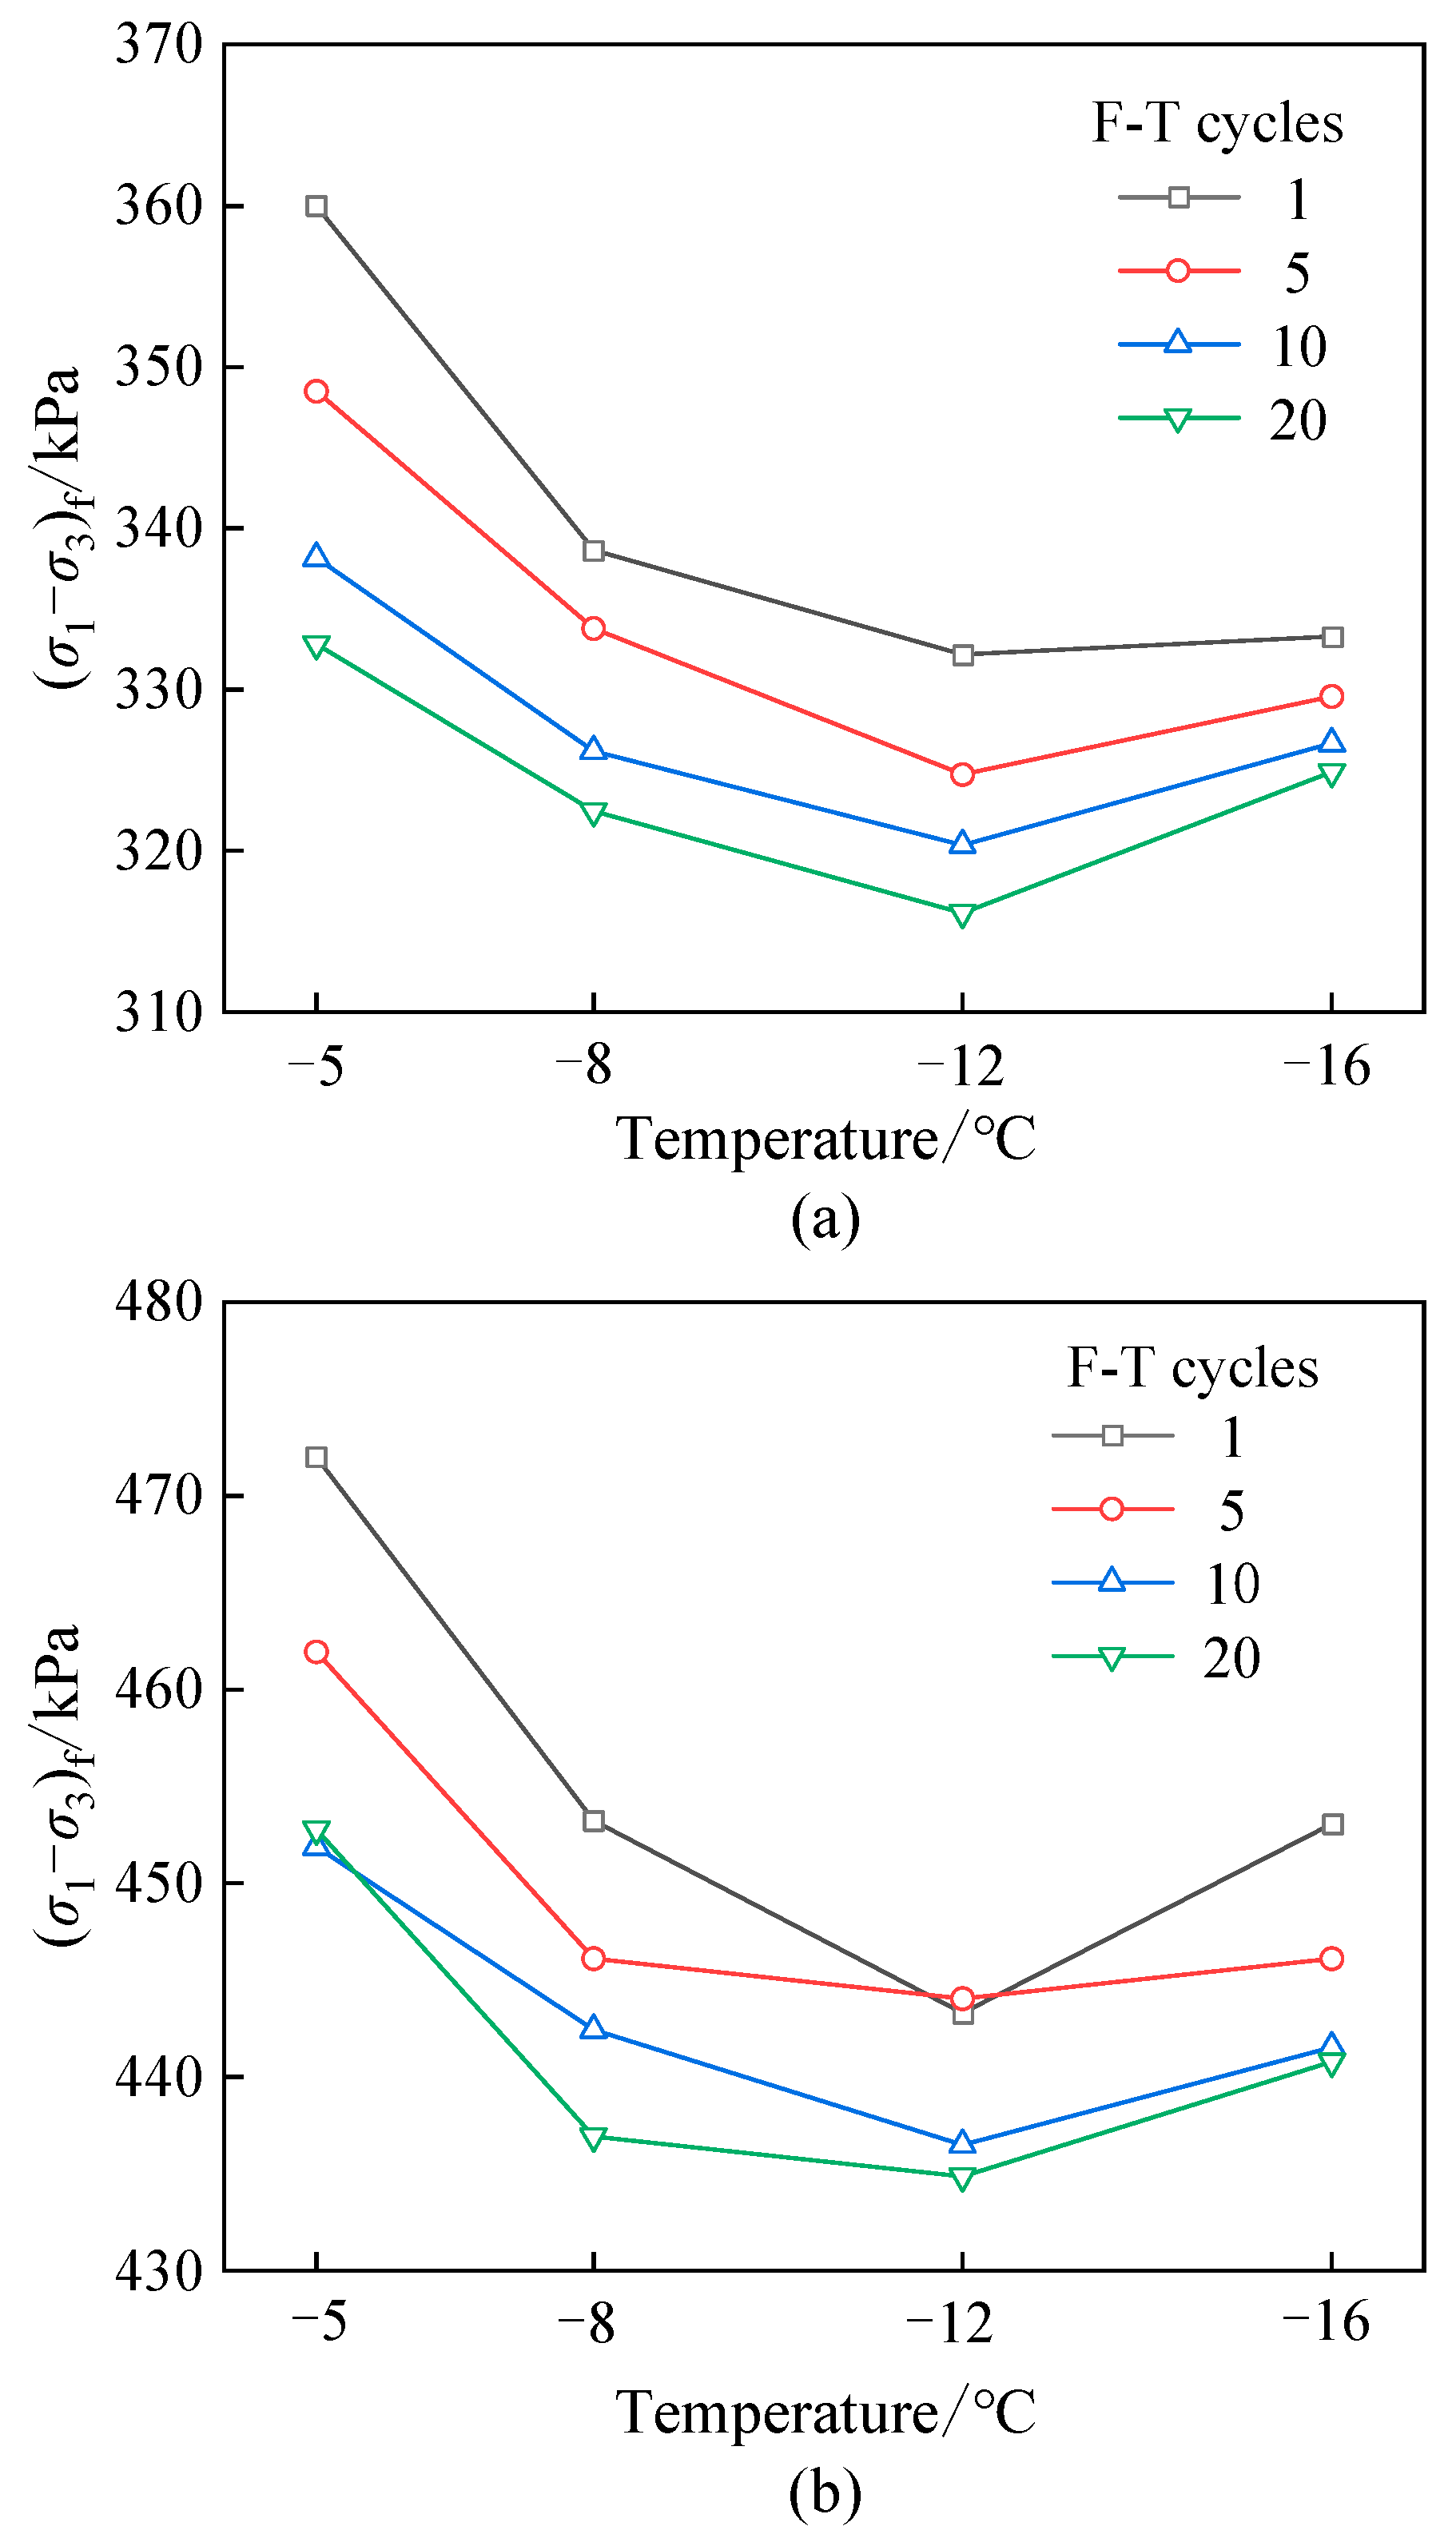
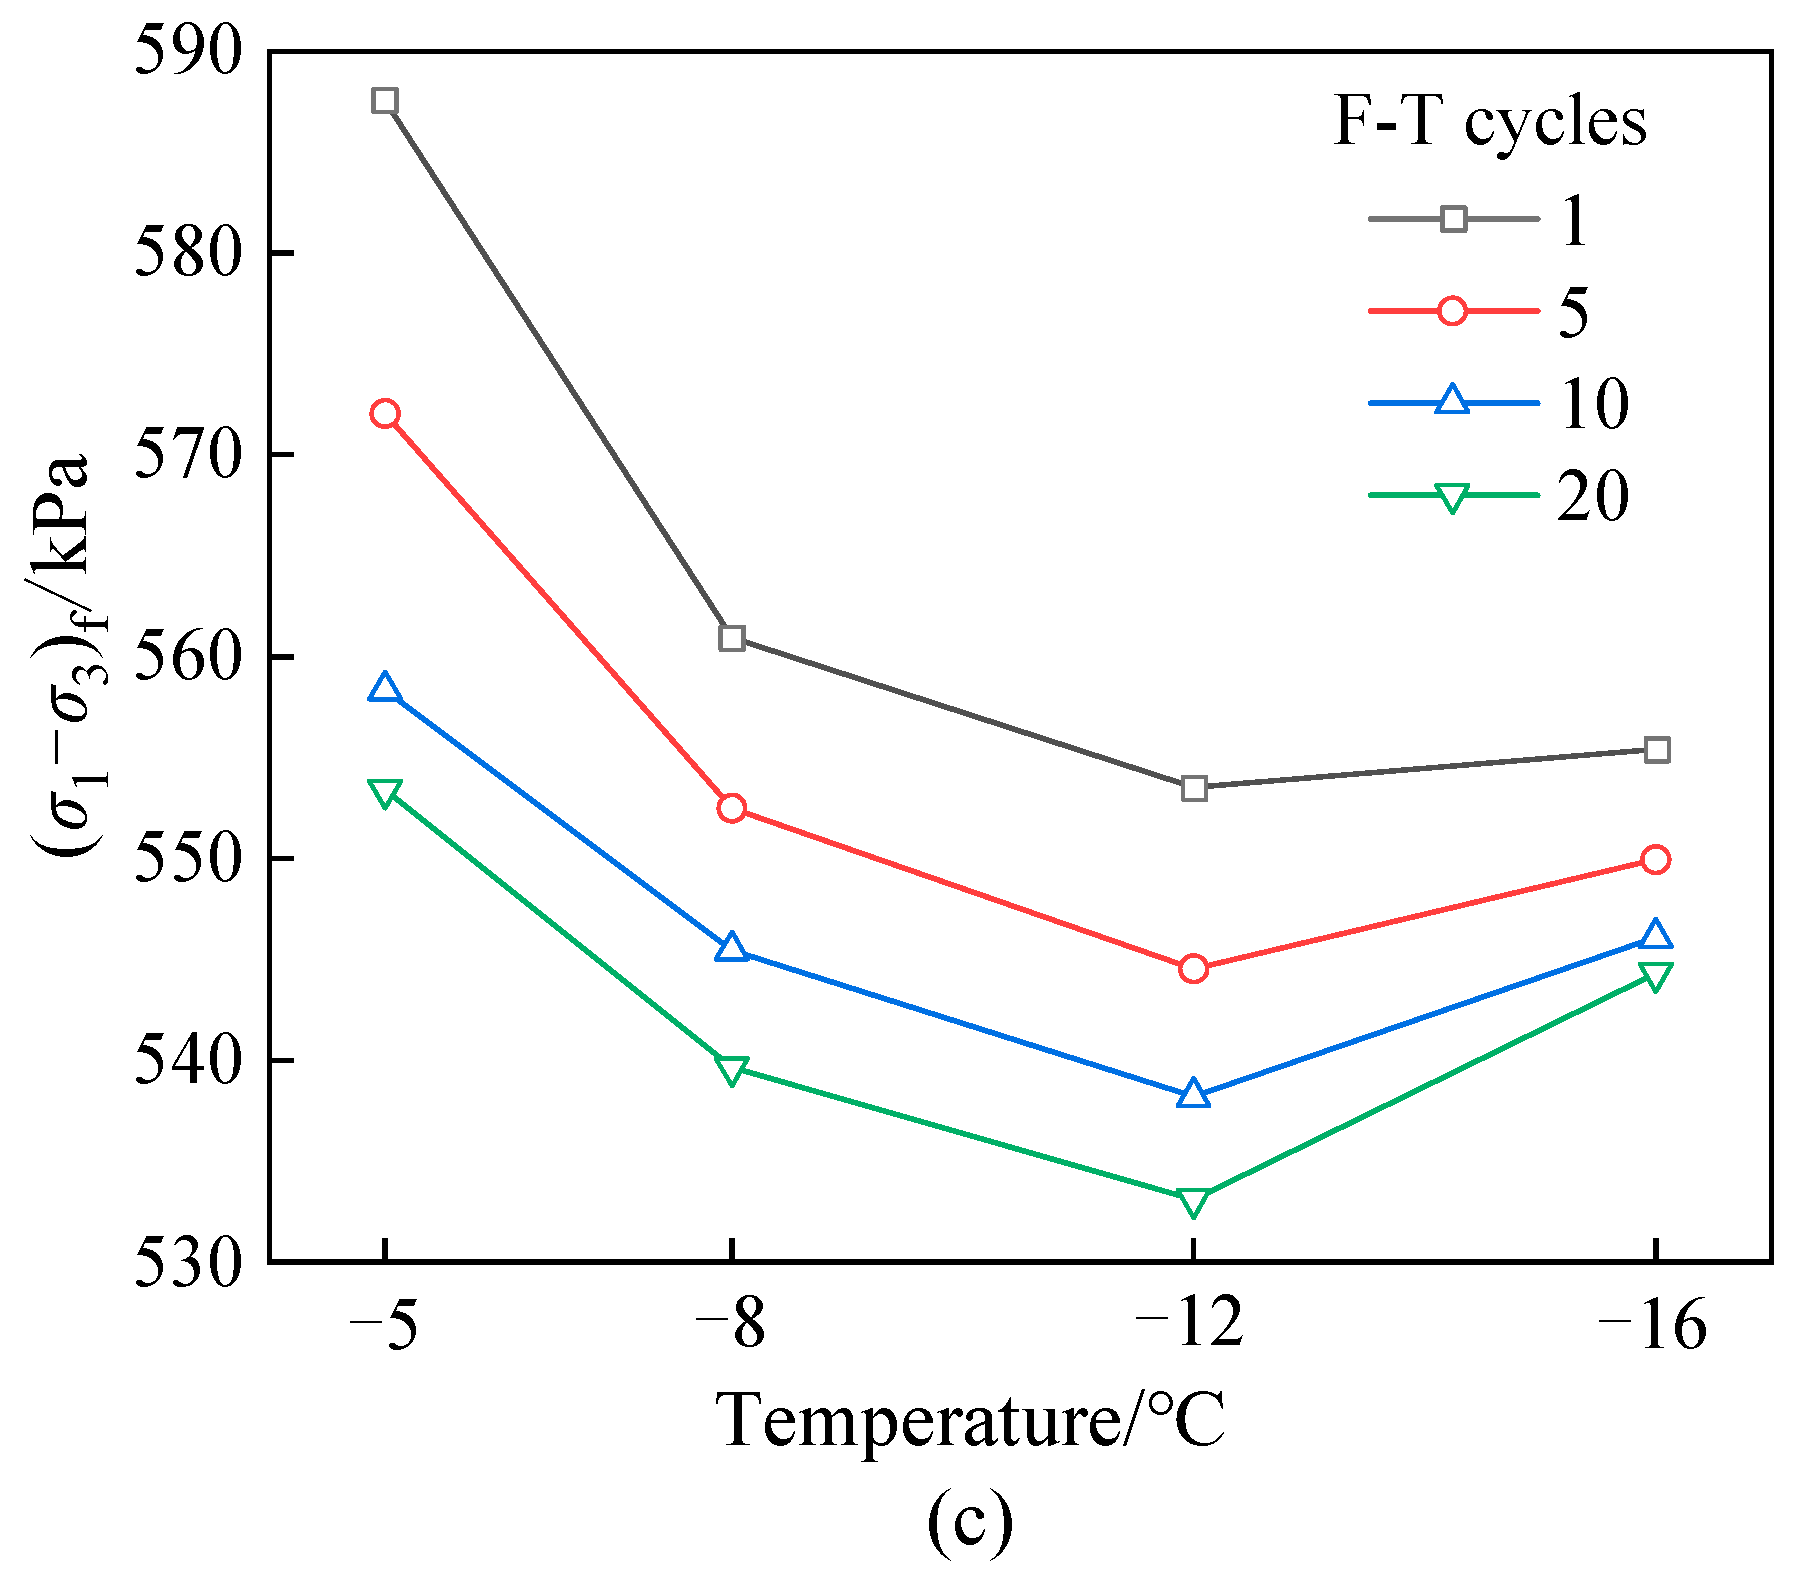
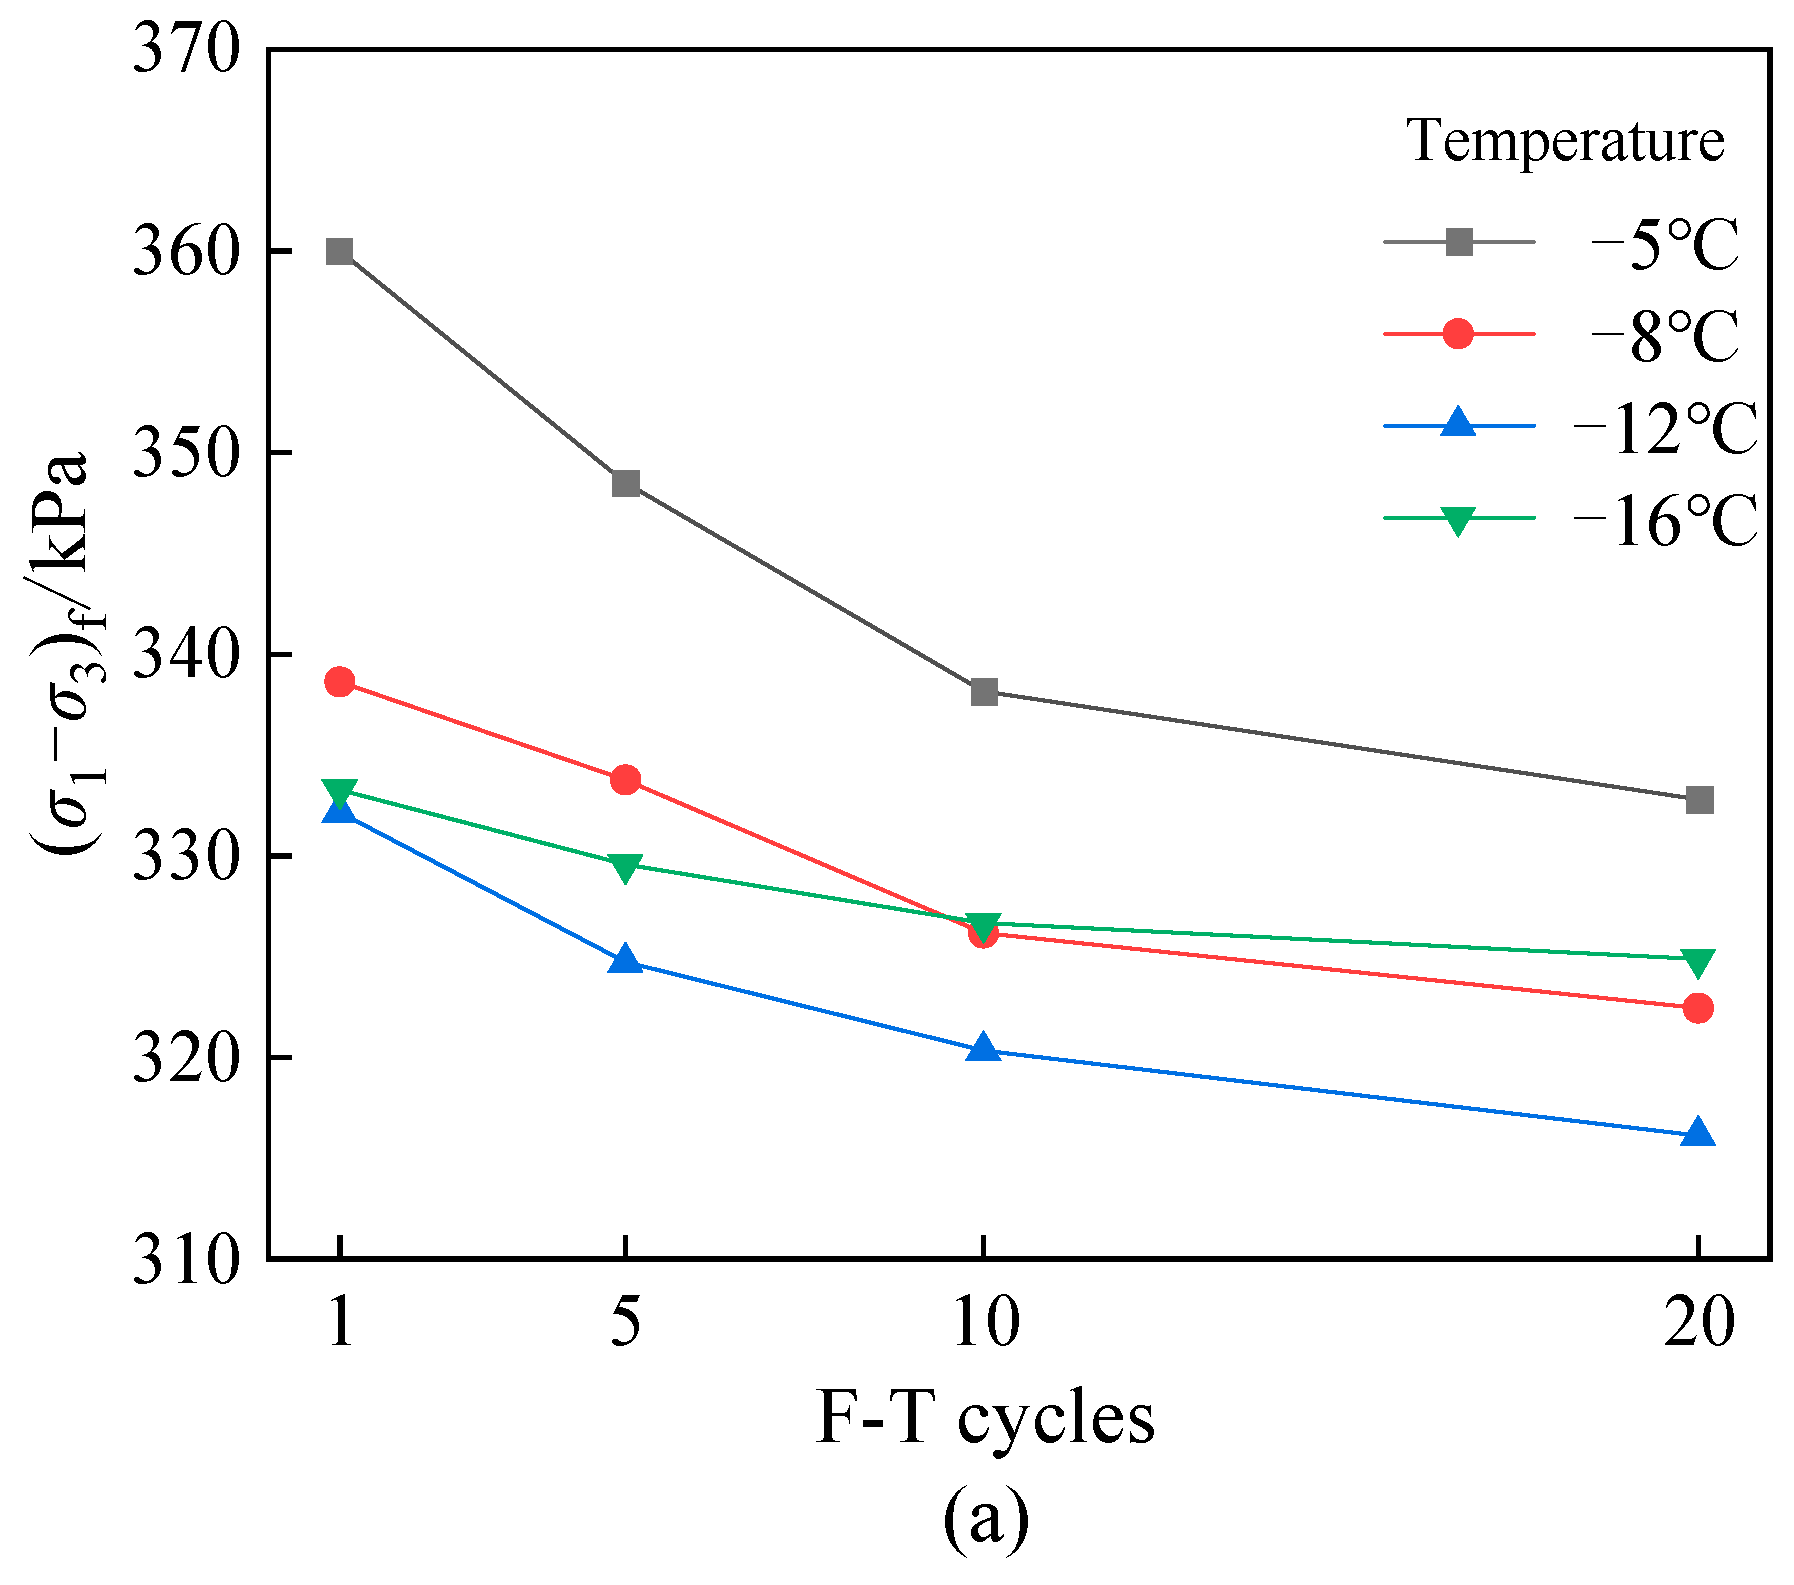
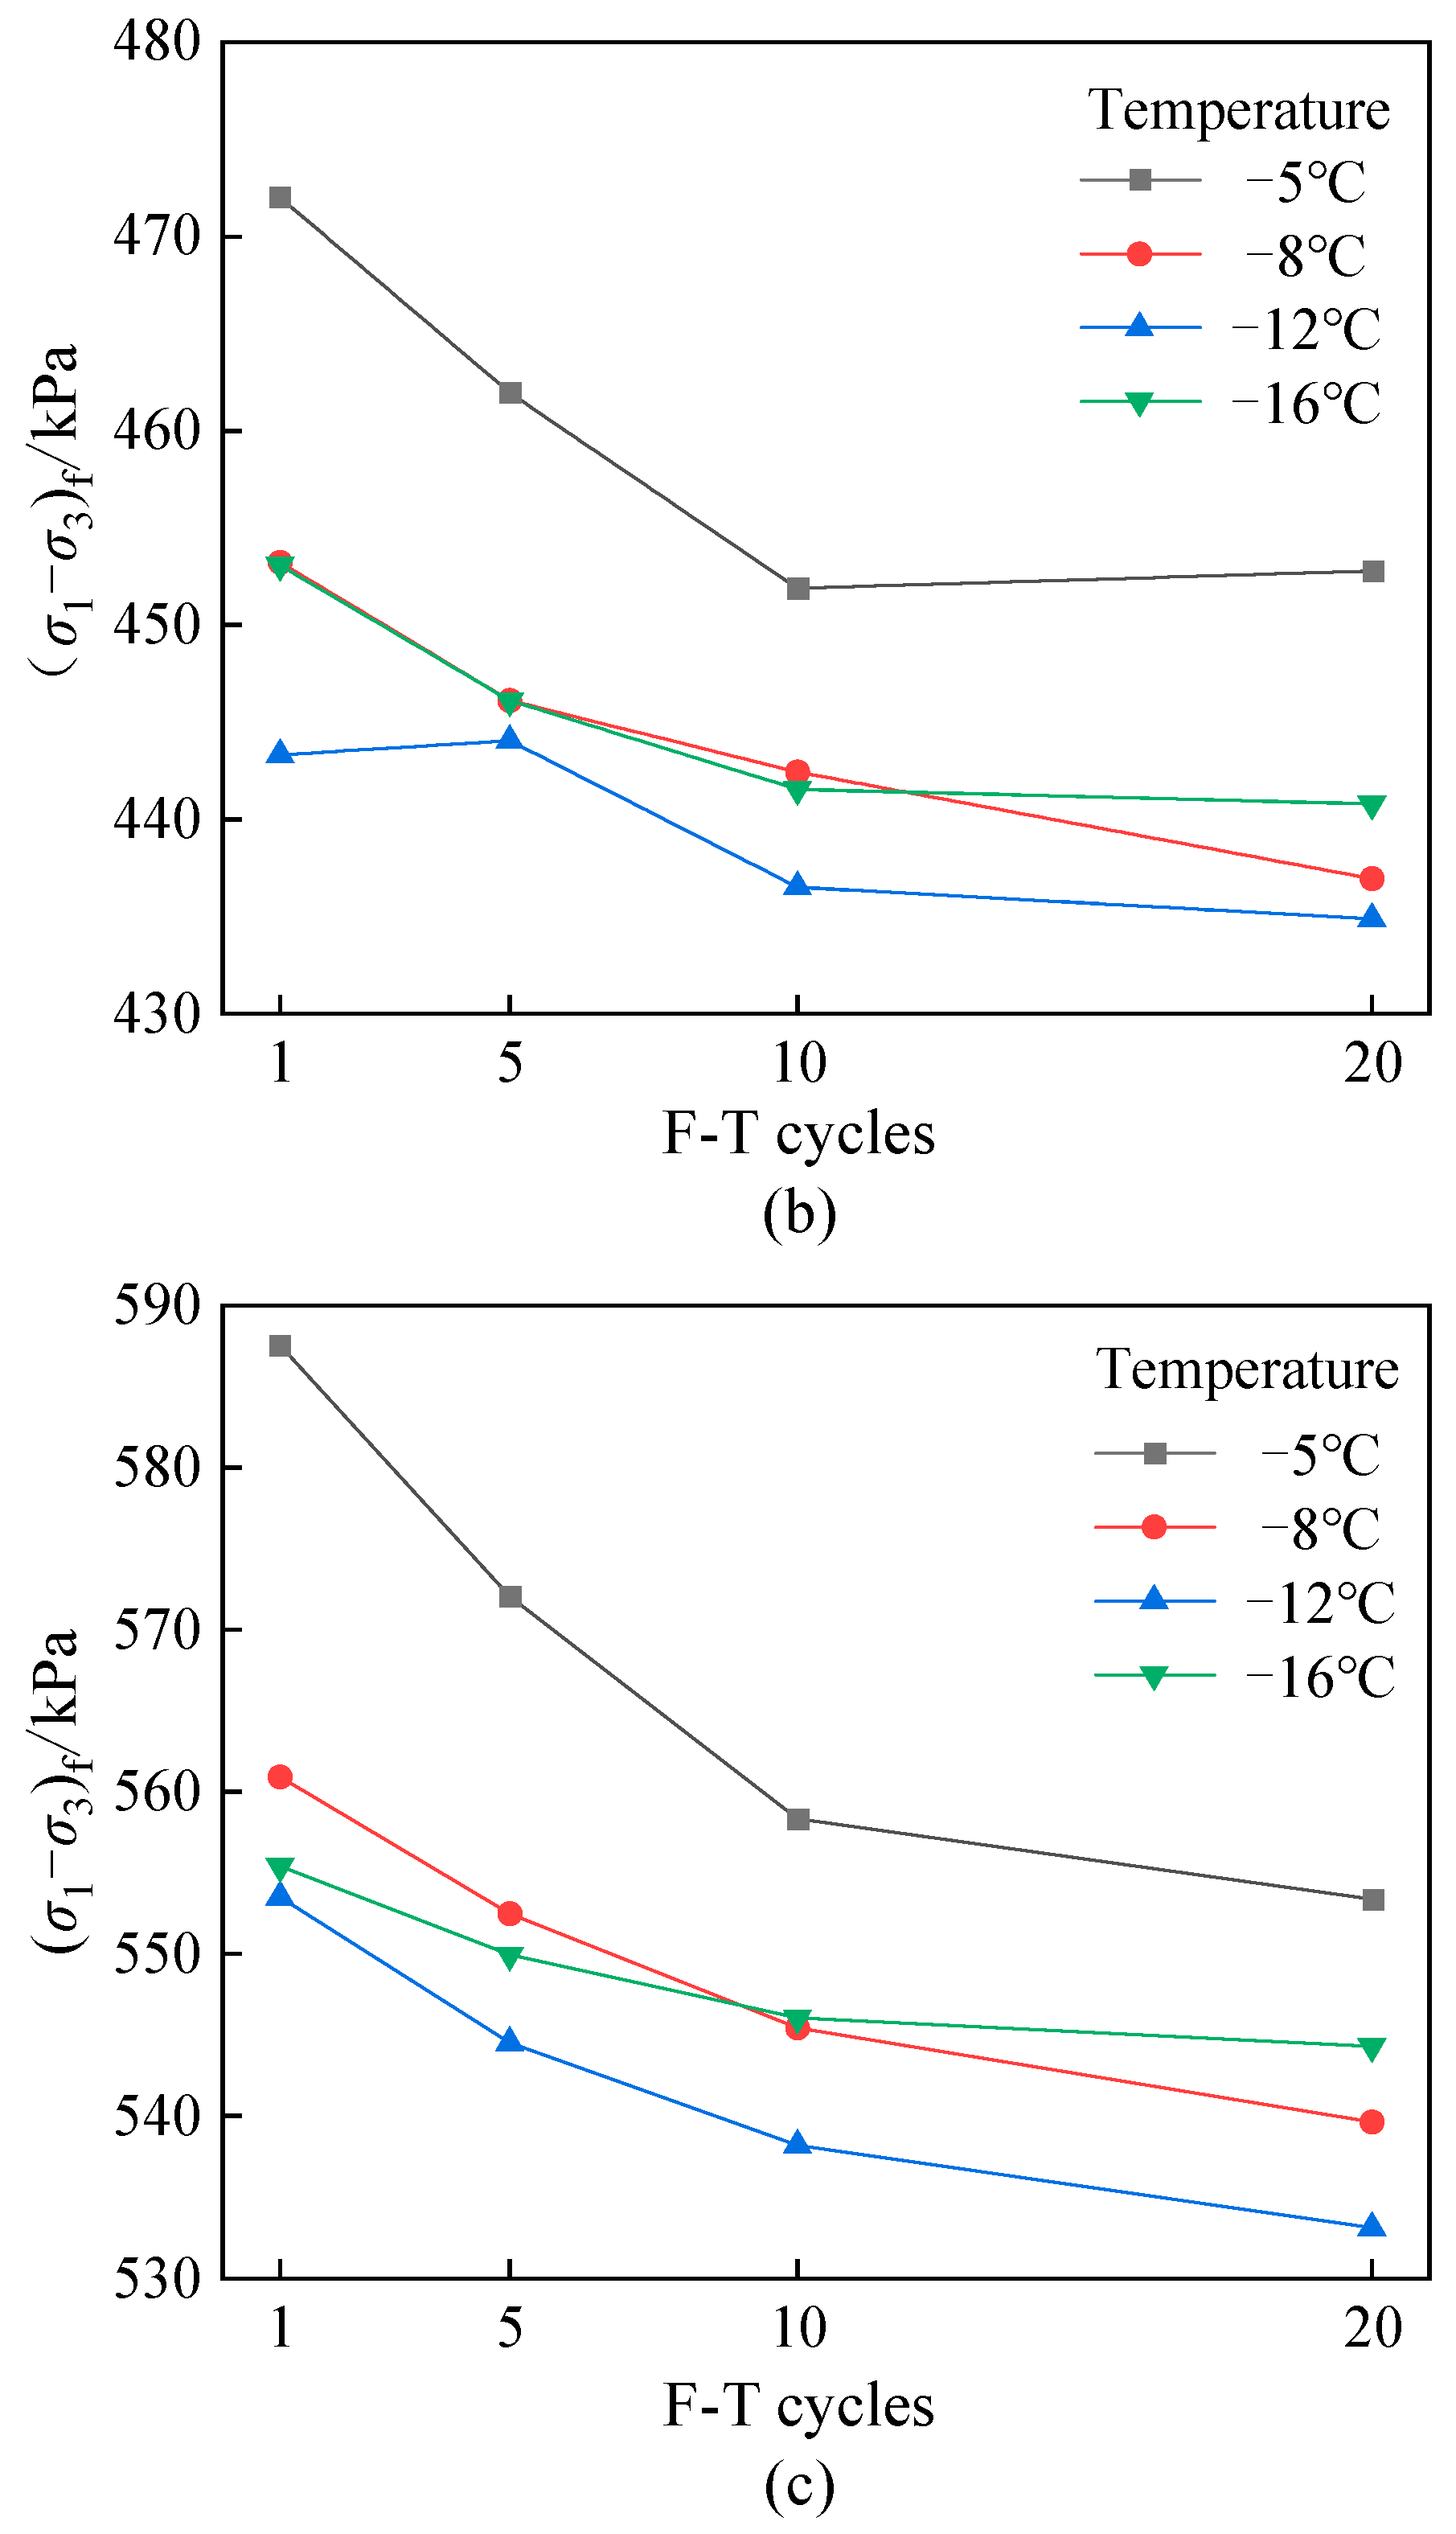
3.2. Failure Deviatoric Stress
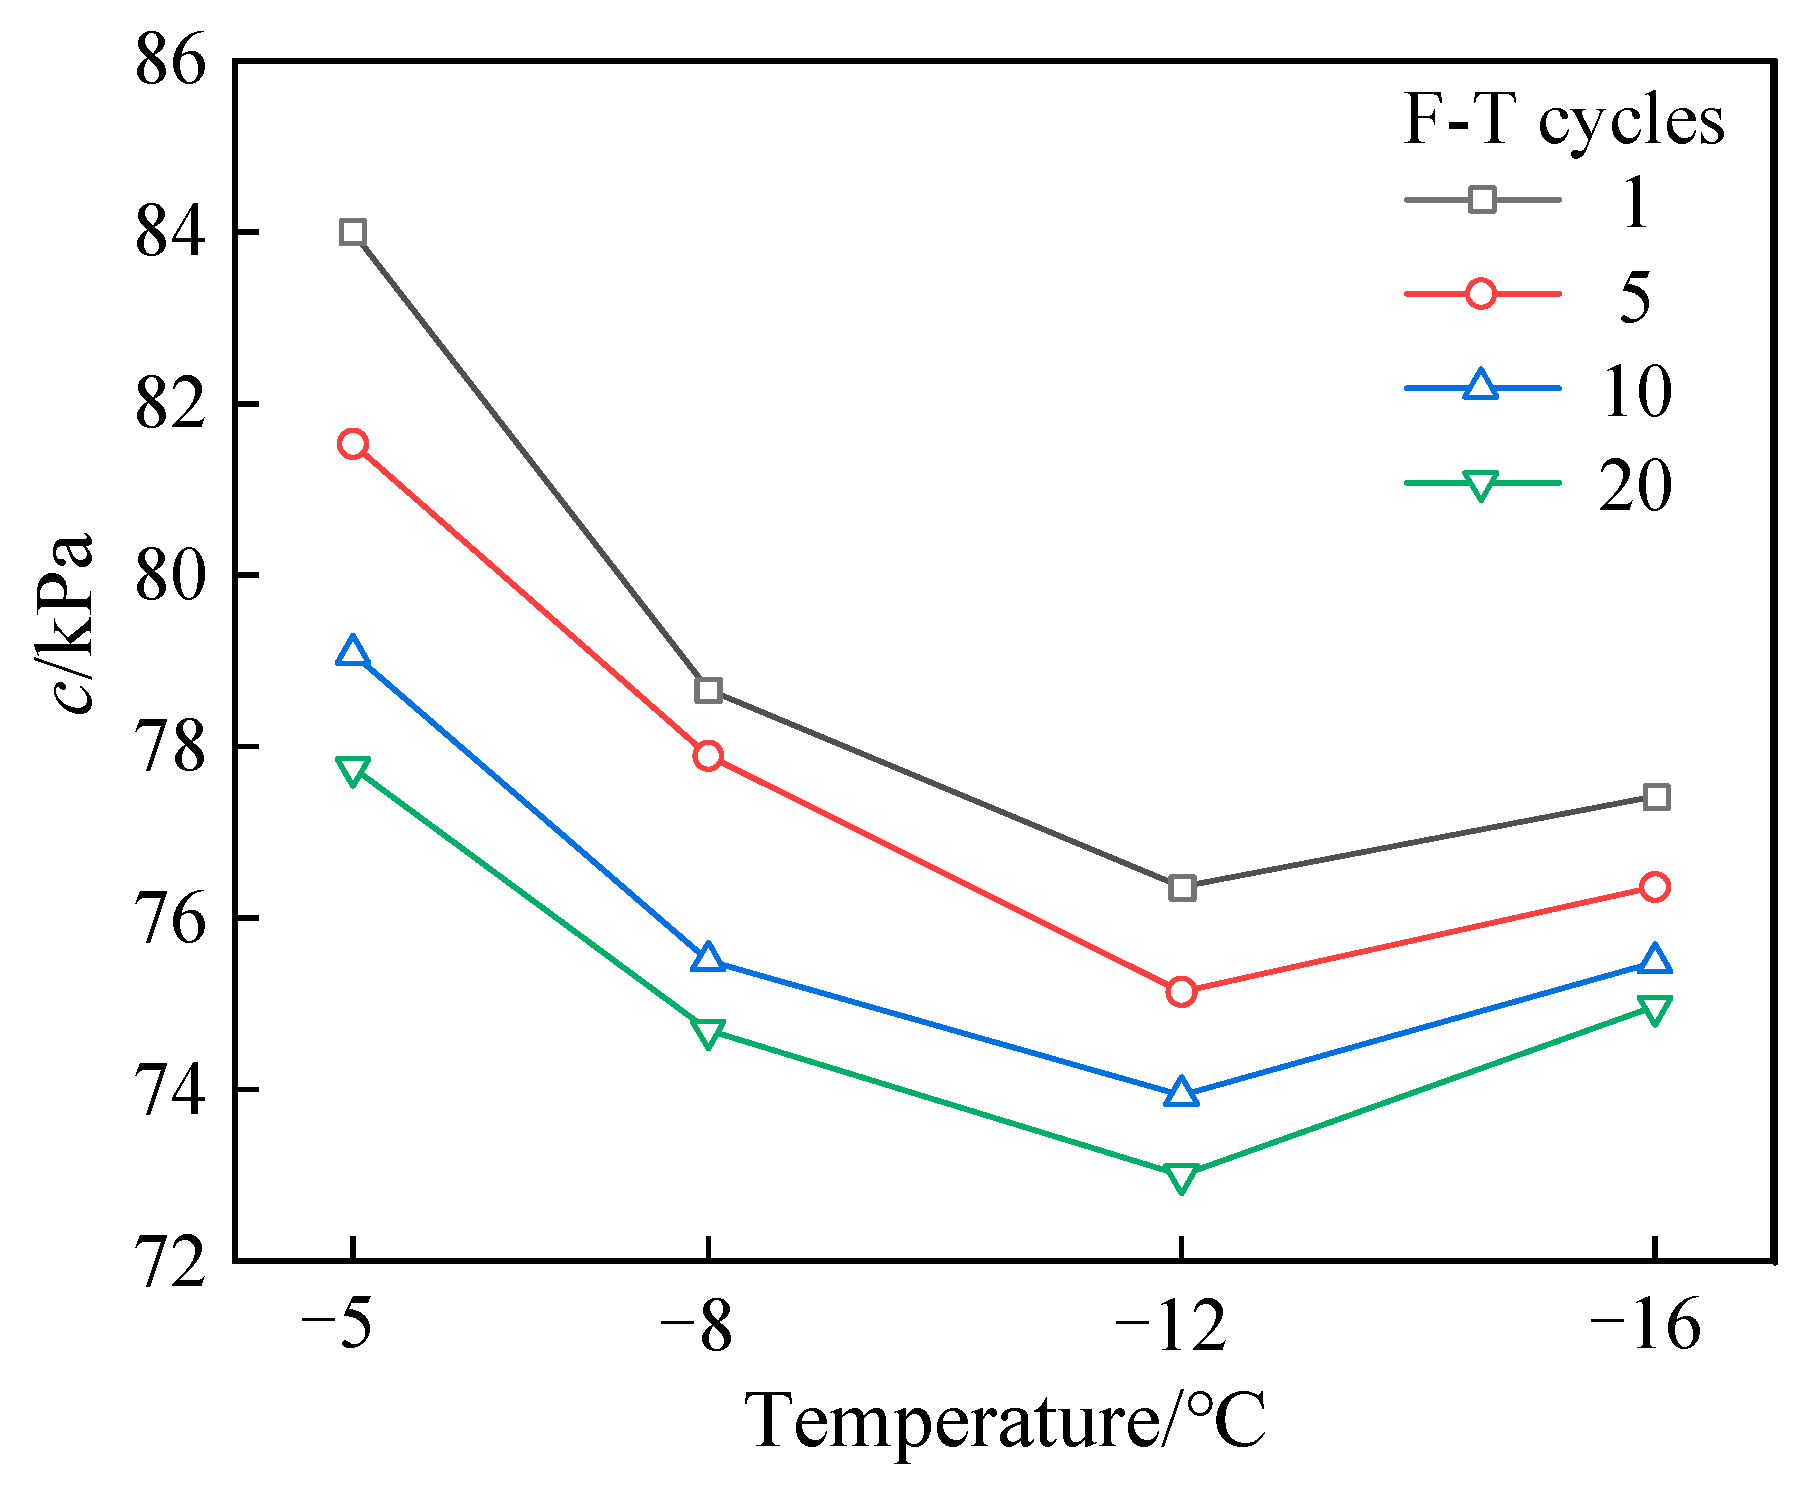
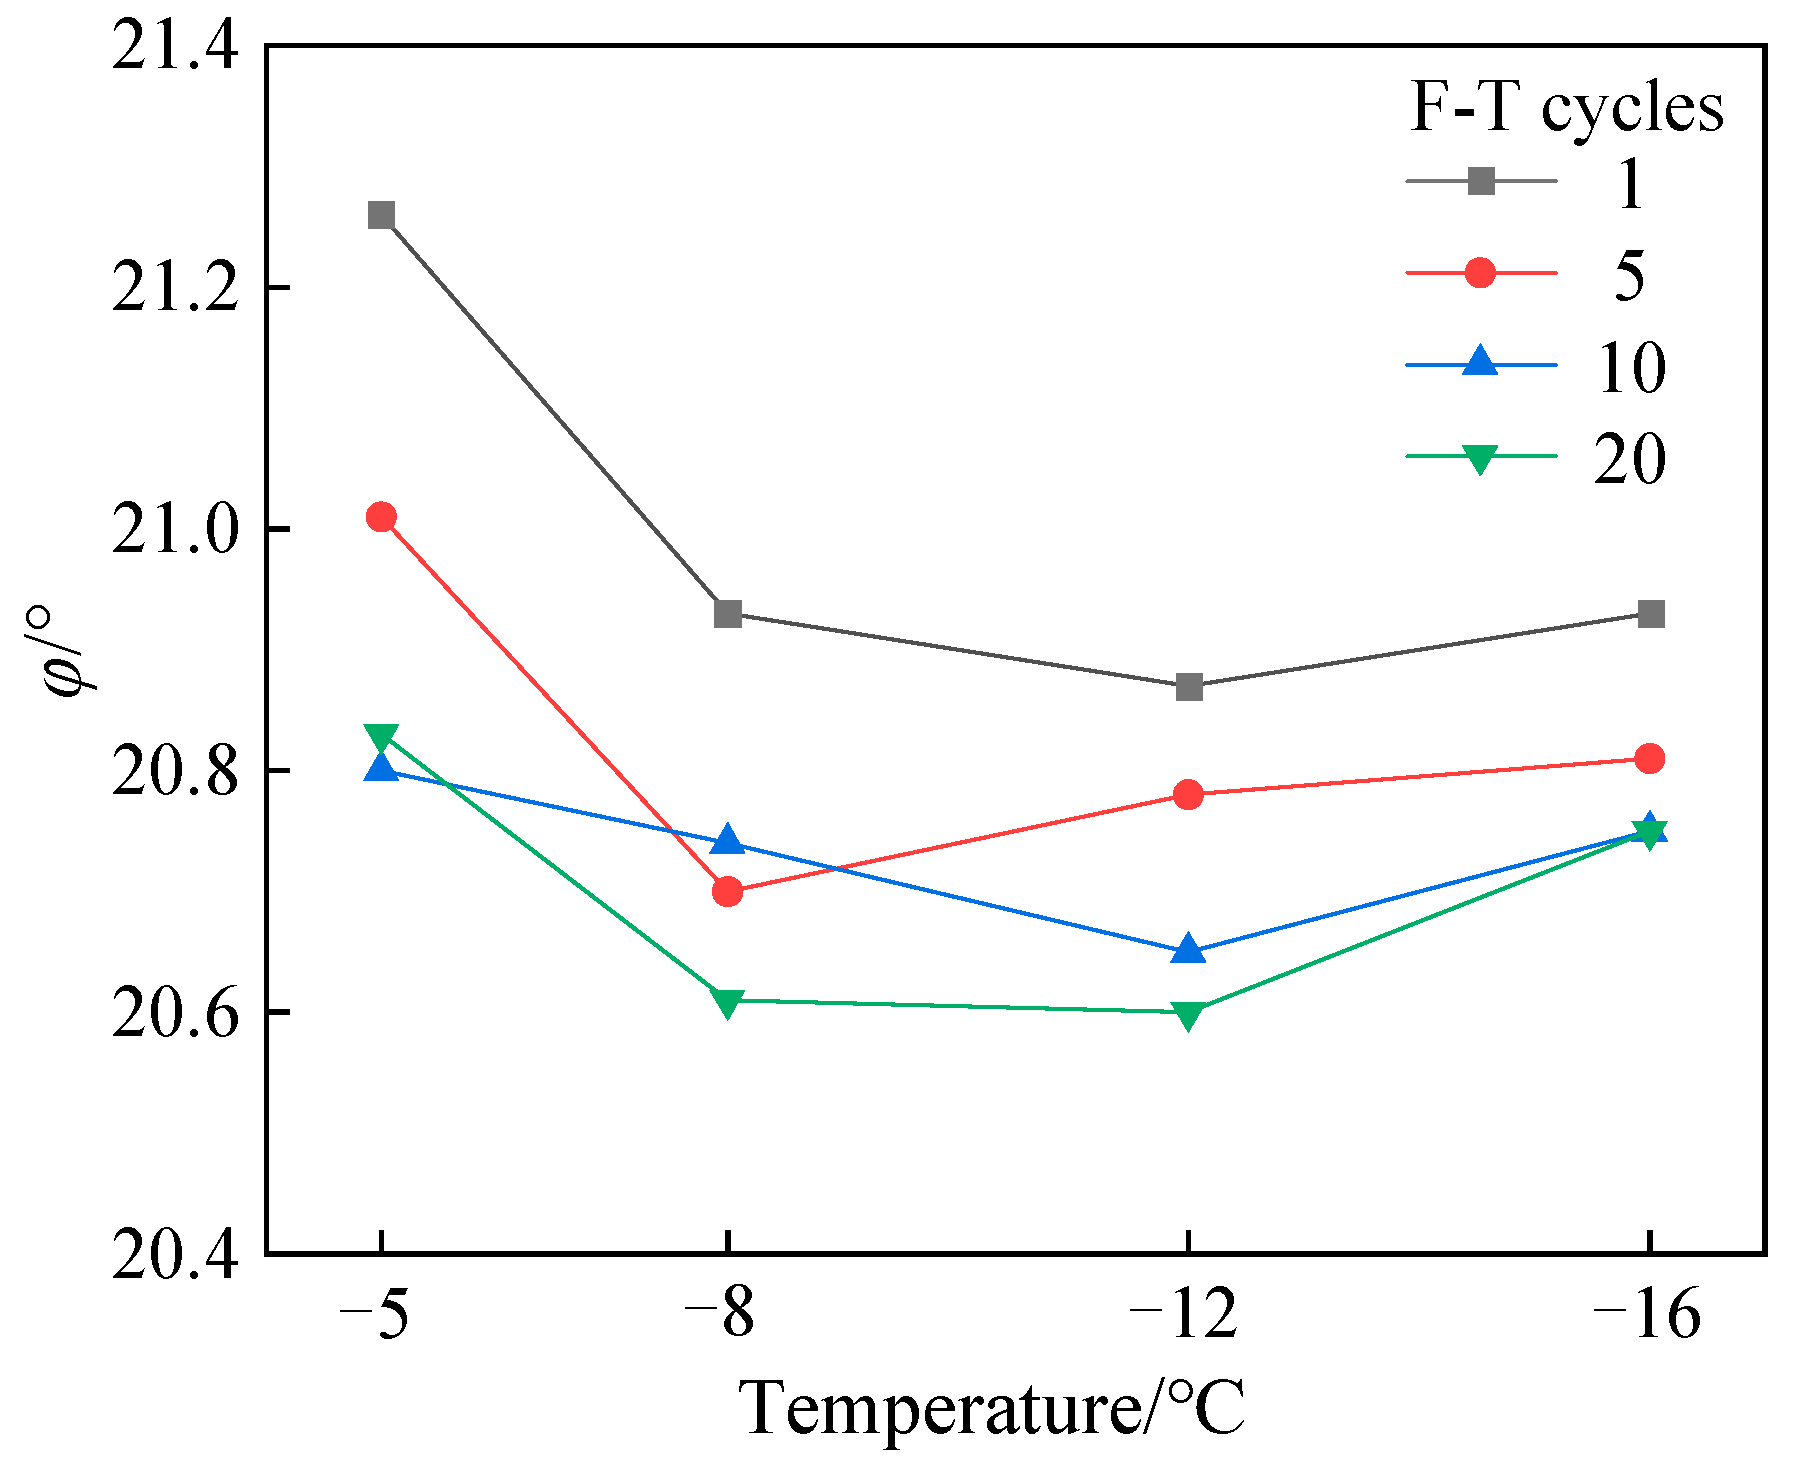
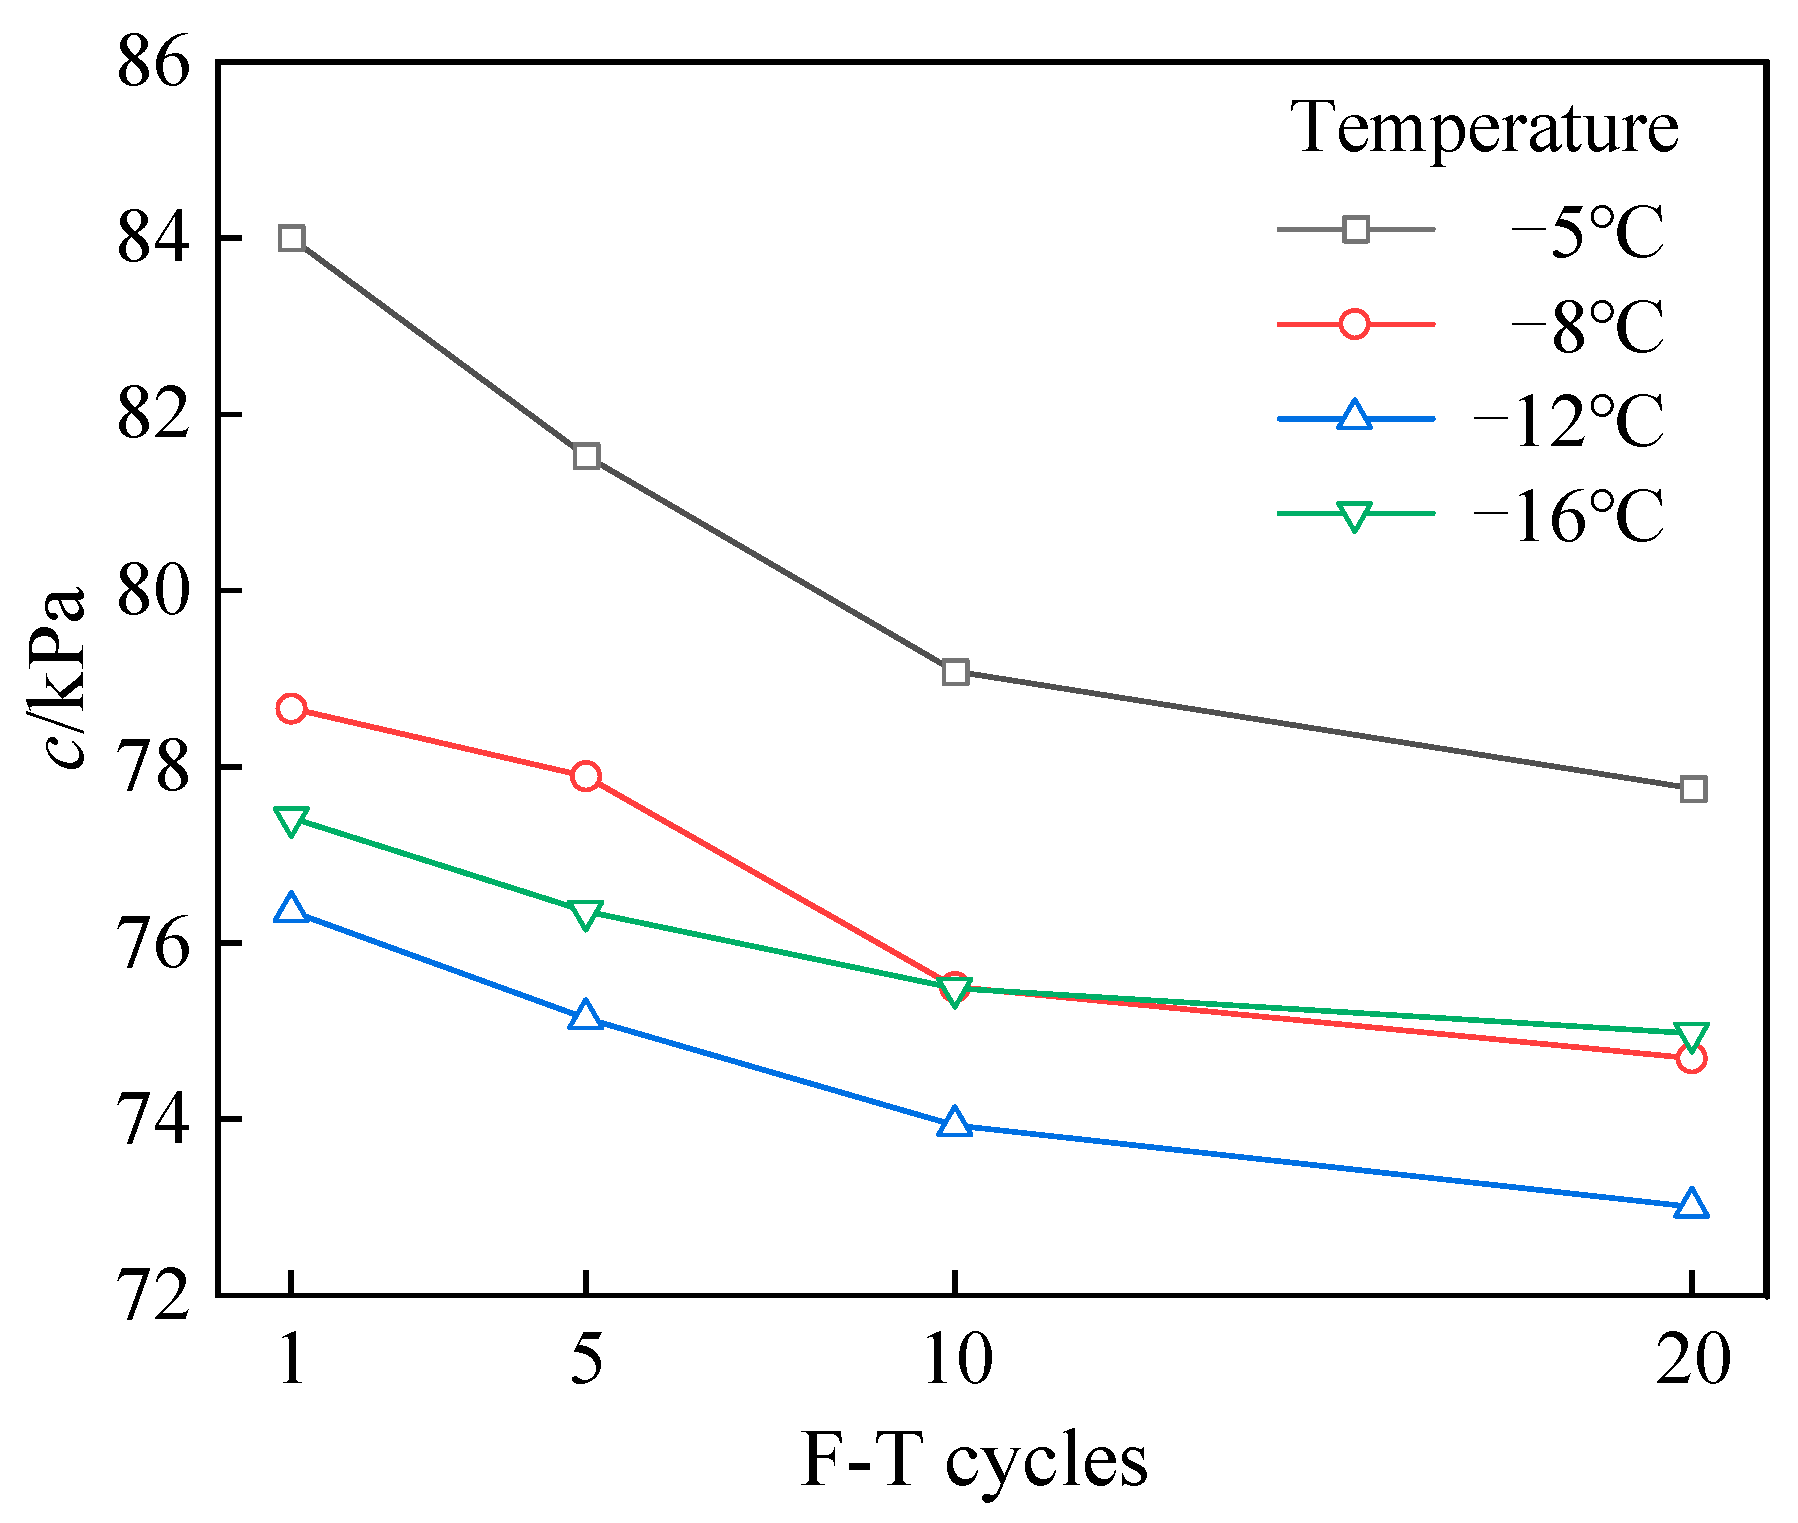
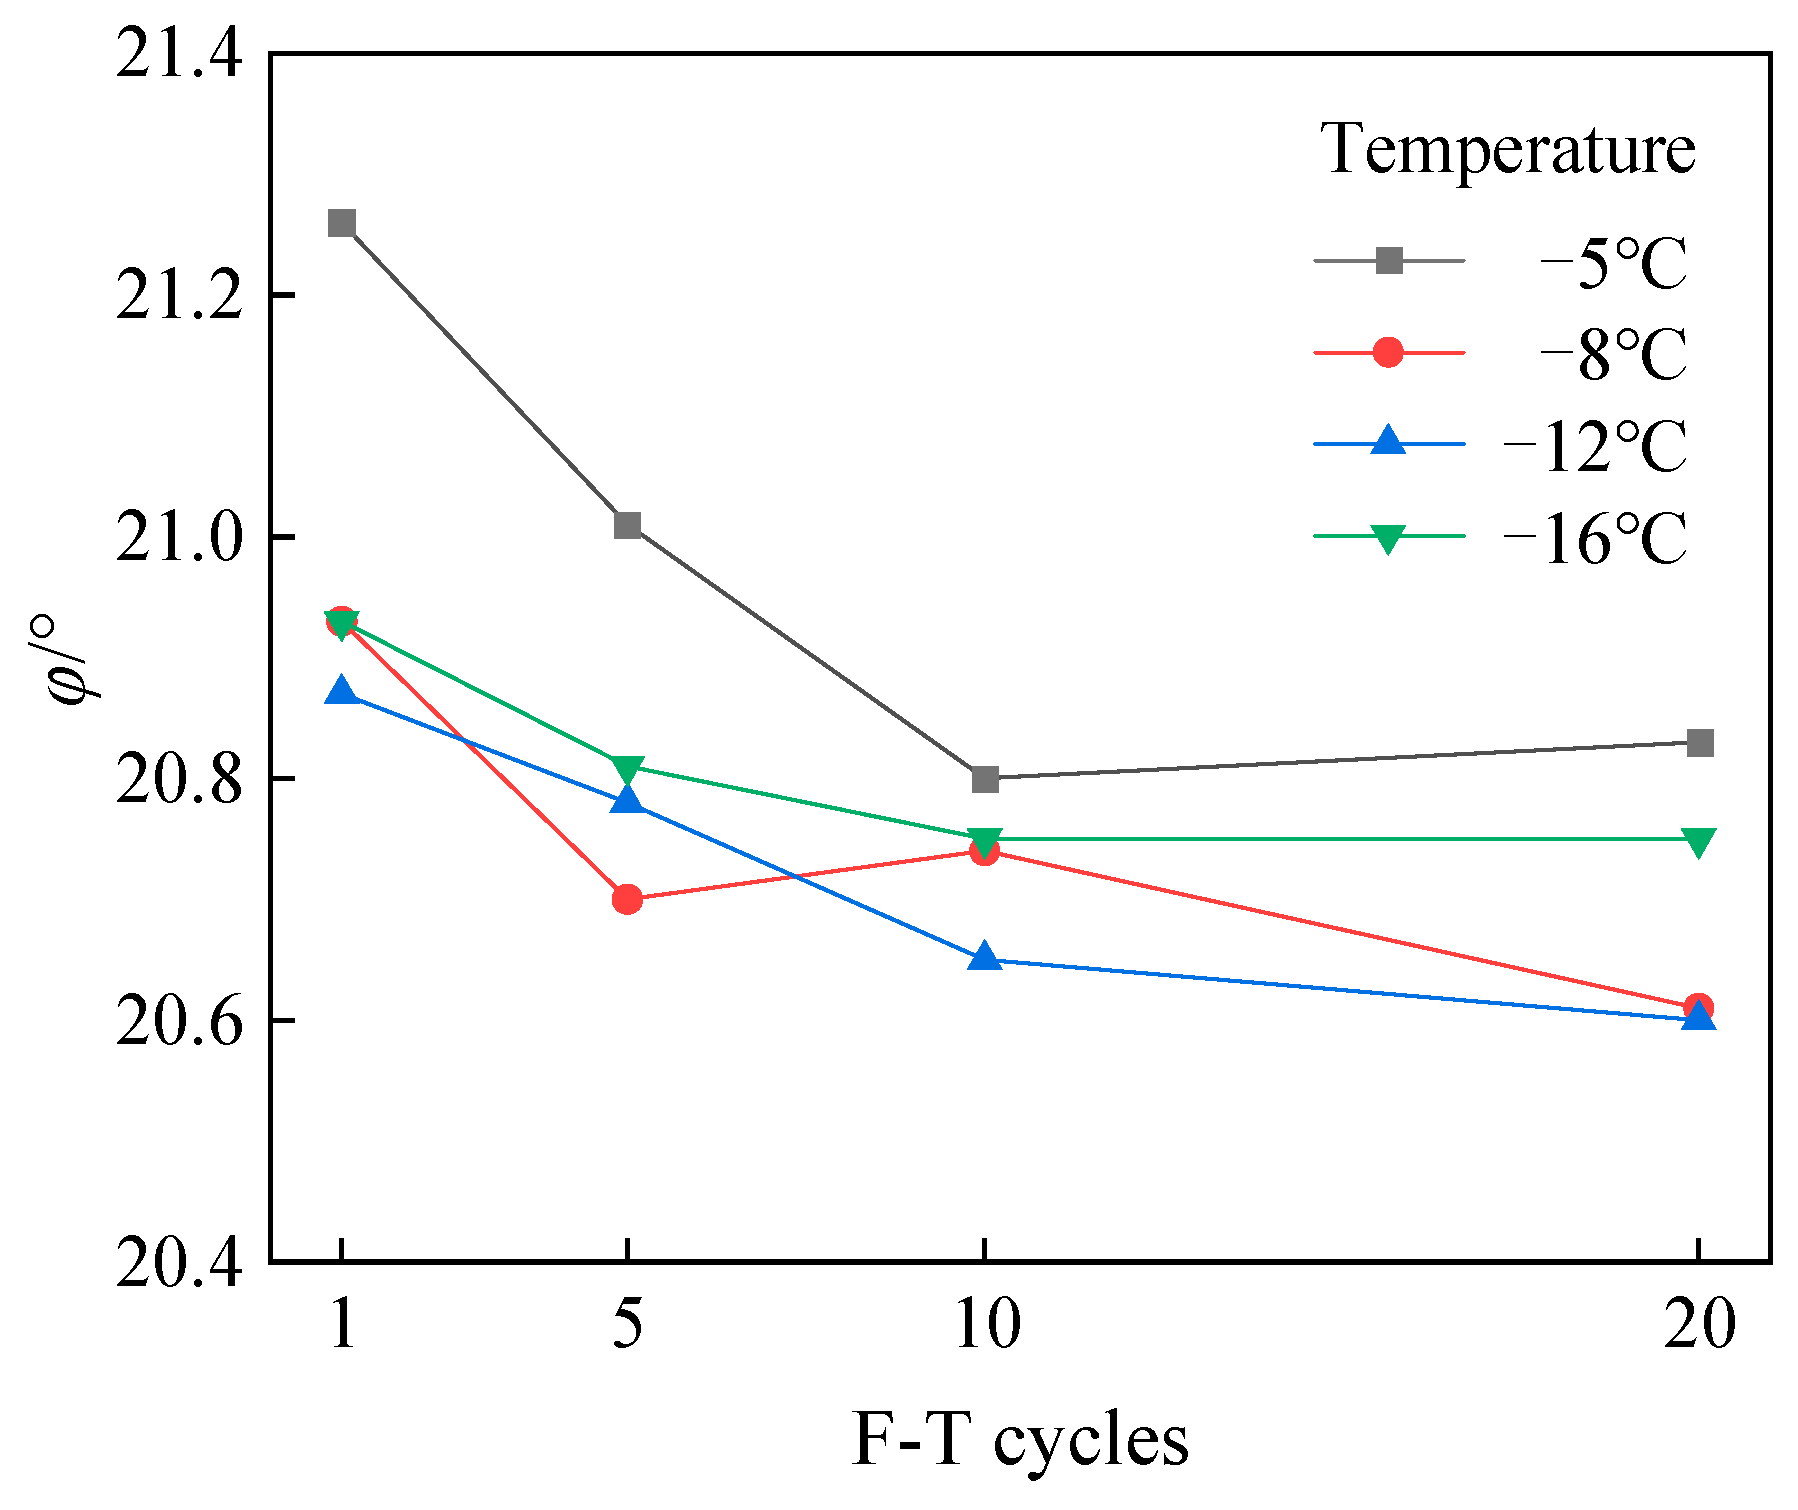
3.3. Shear Strength Index
4. Quantitative Analysis
4.1. Effect of Quantitative Analysis on Failure Stress
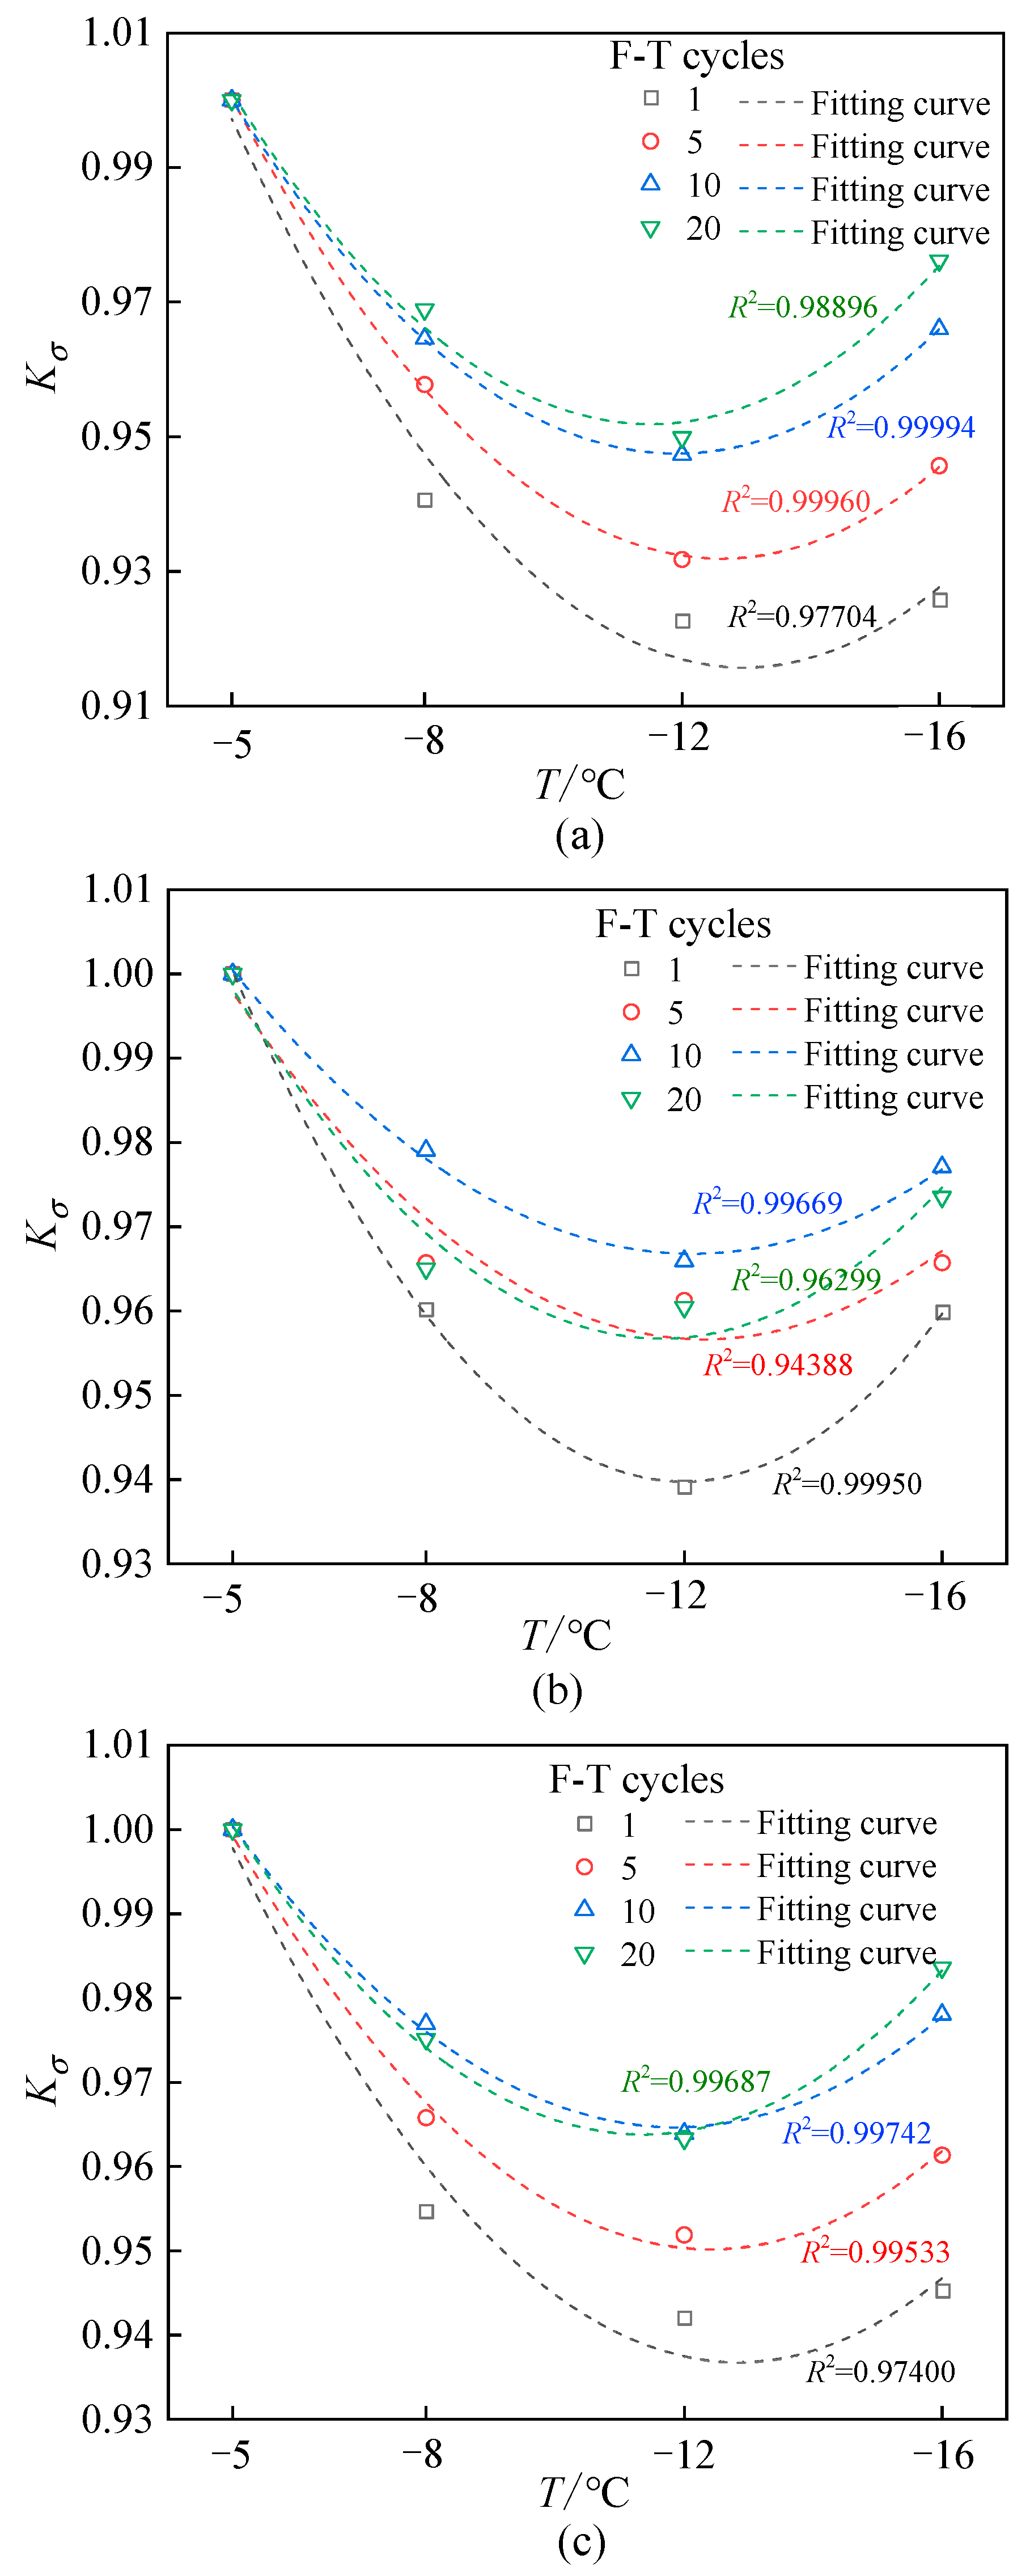
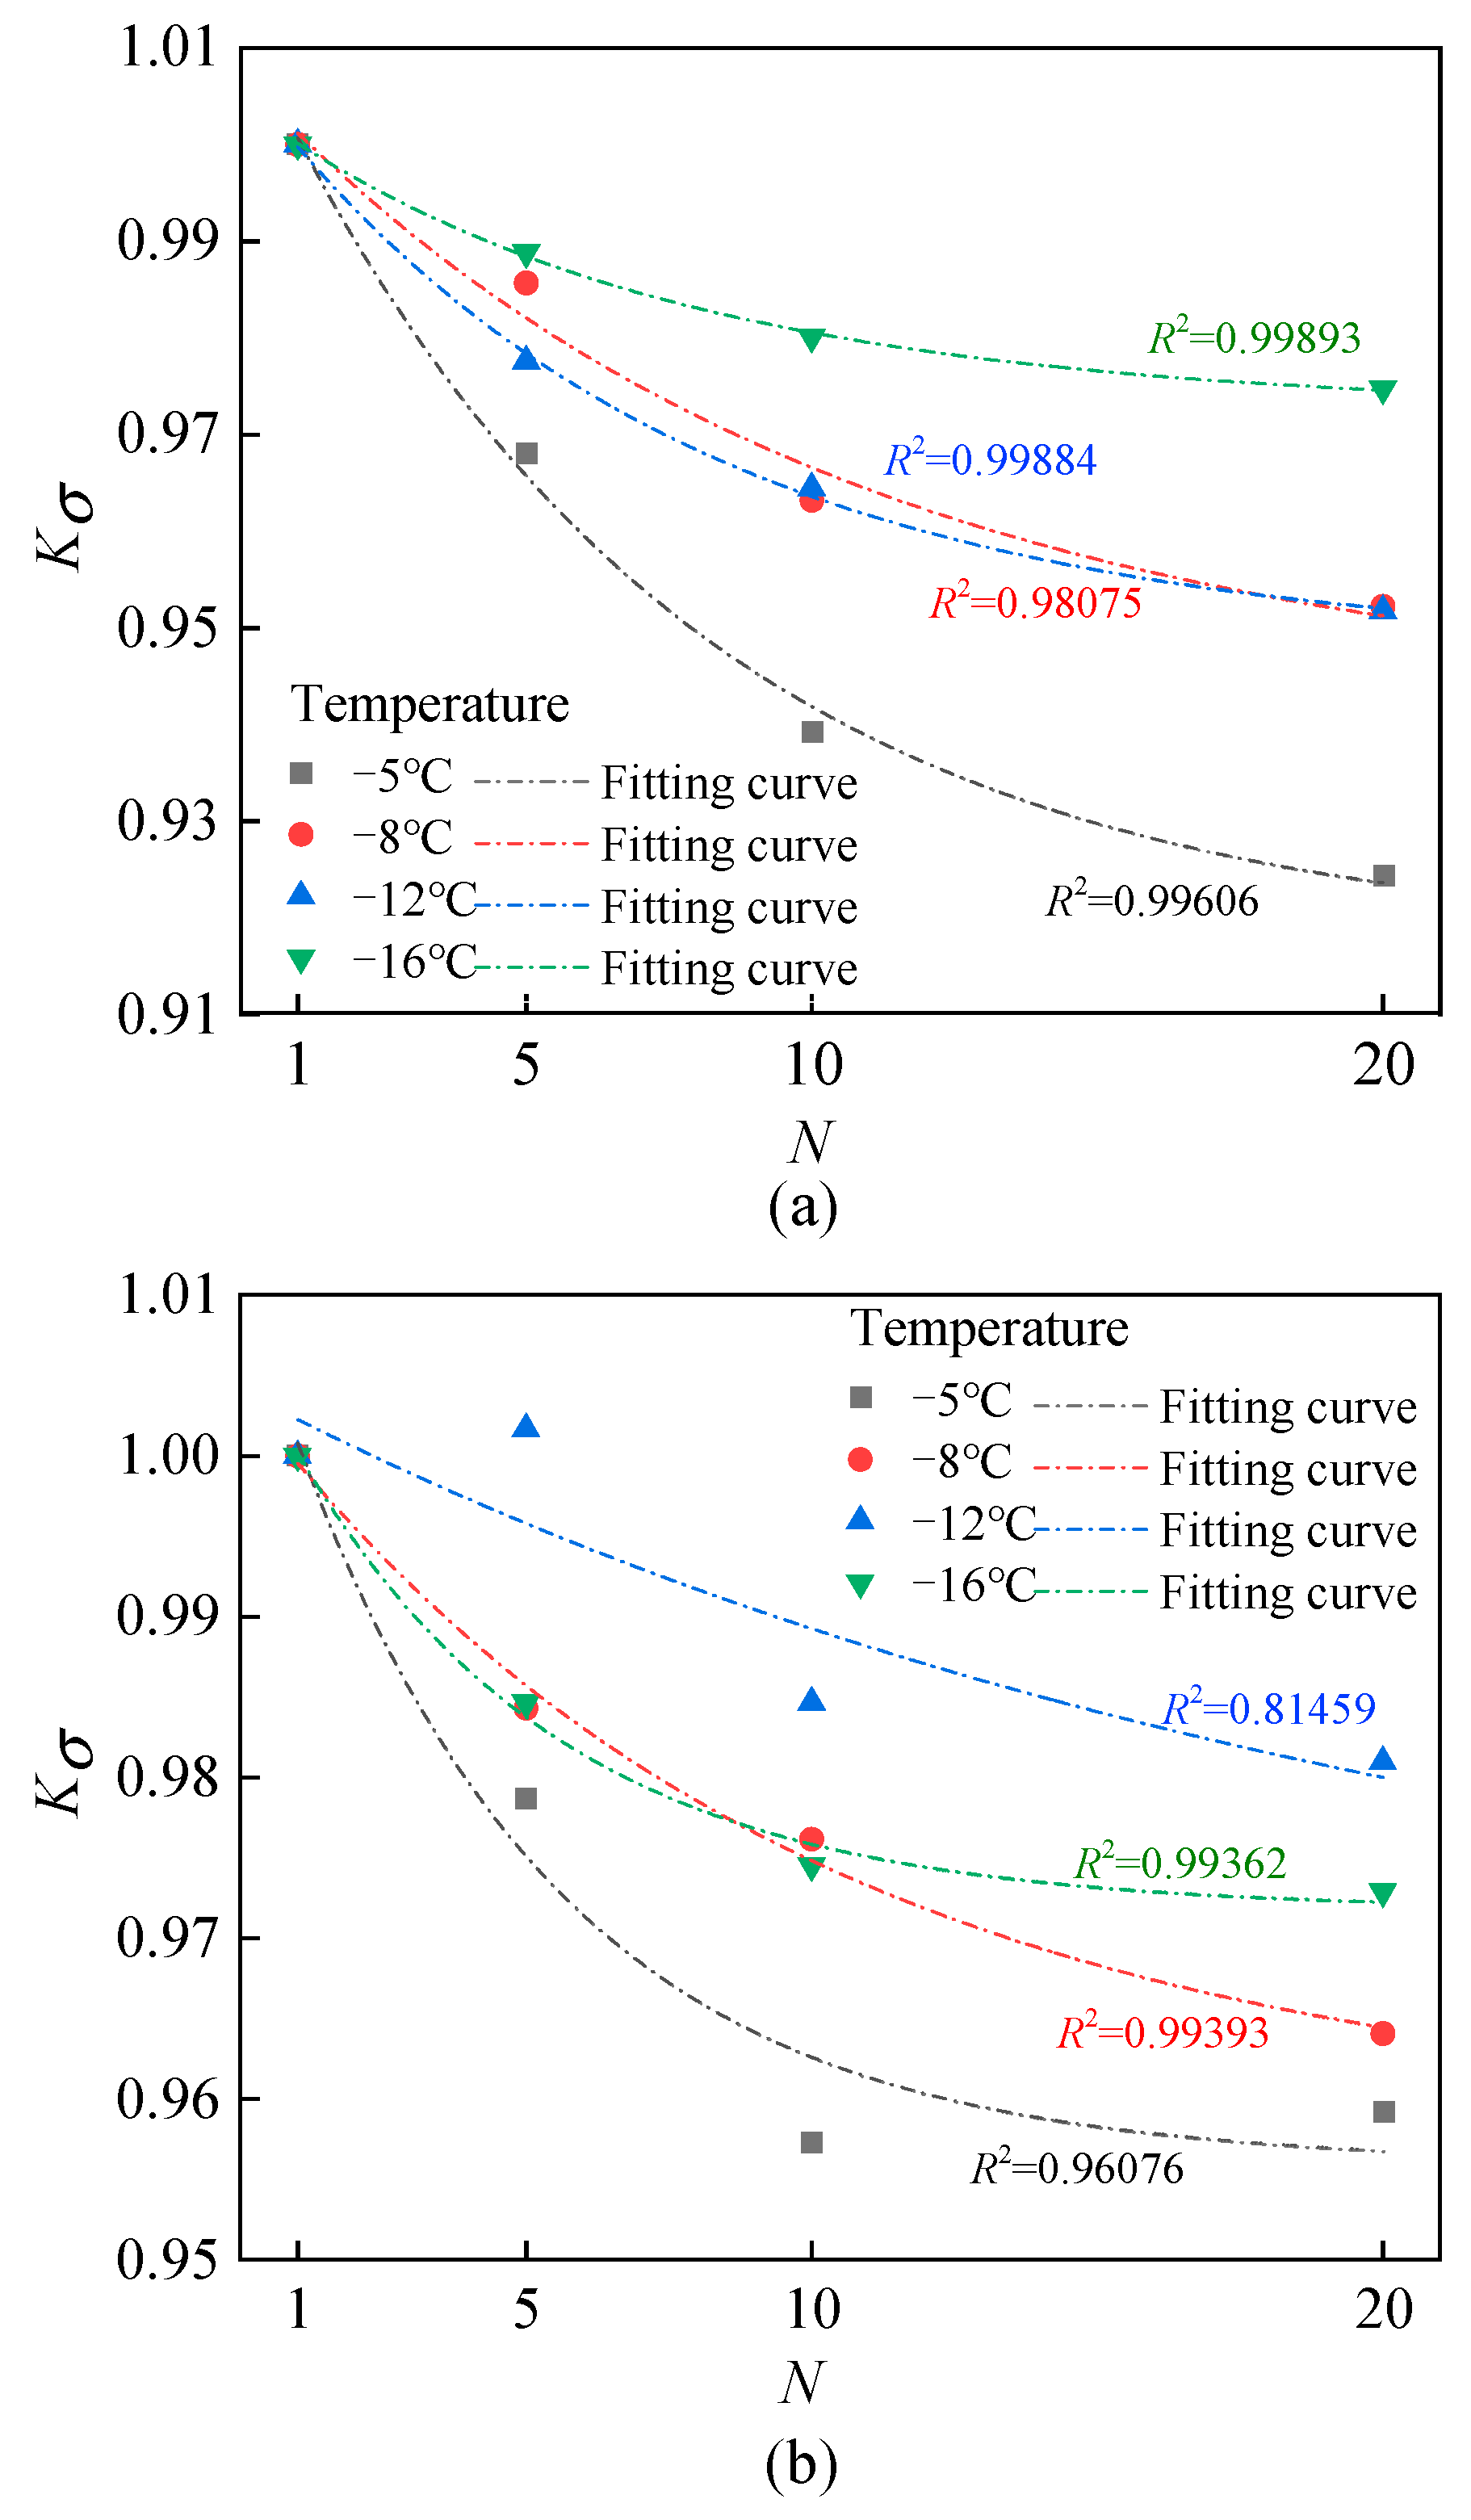
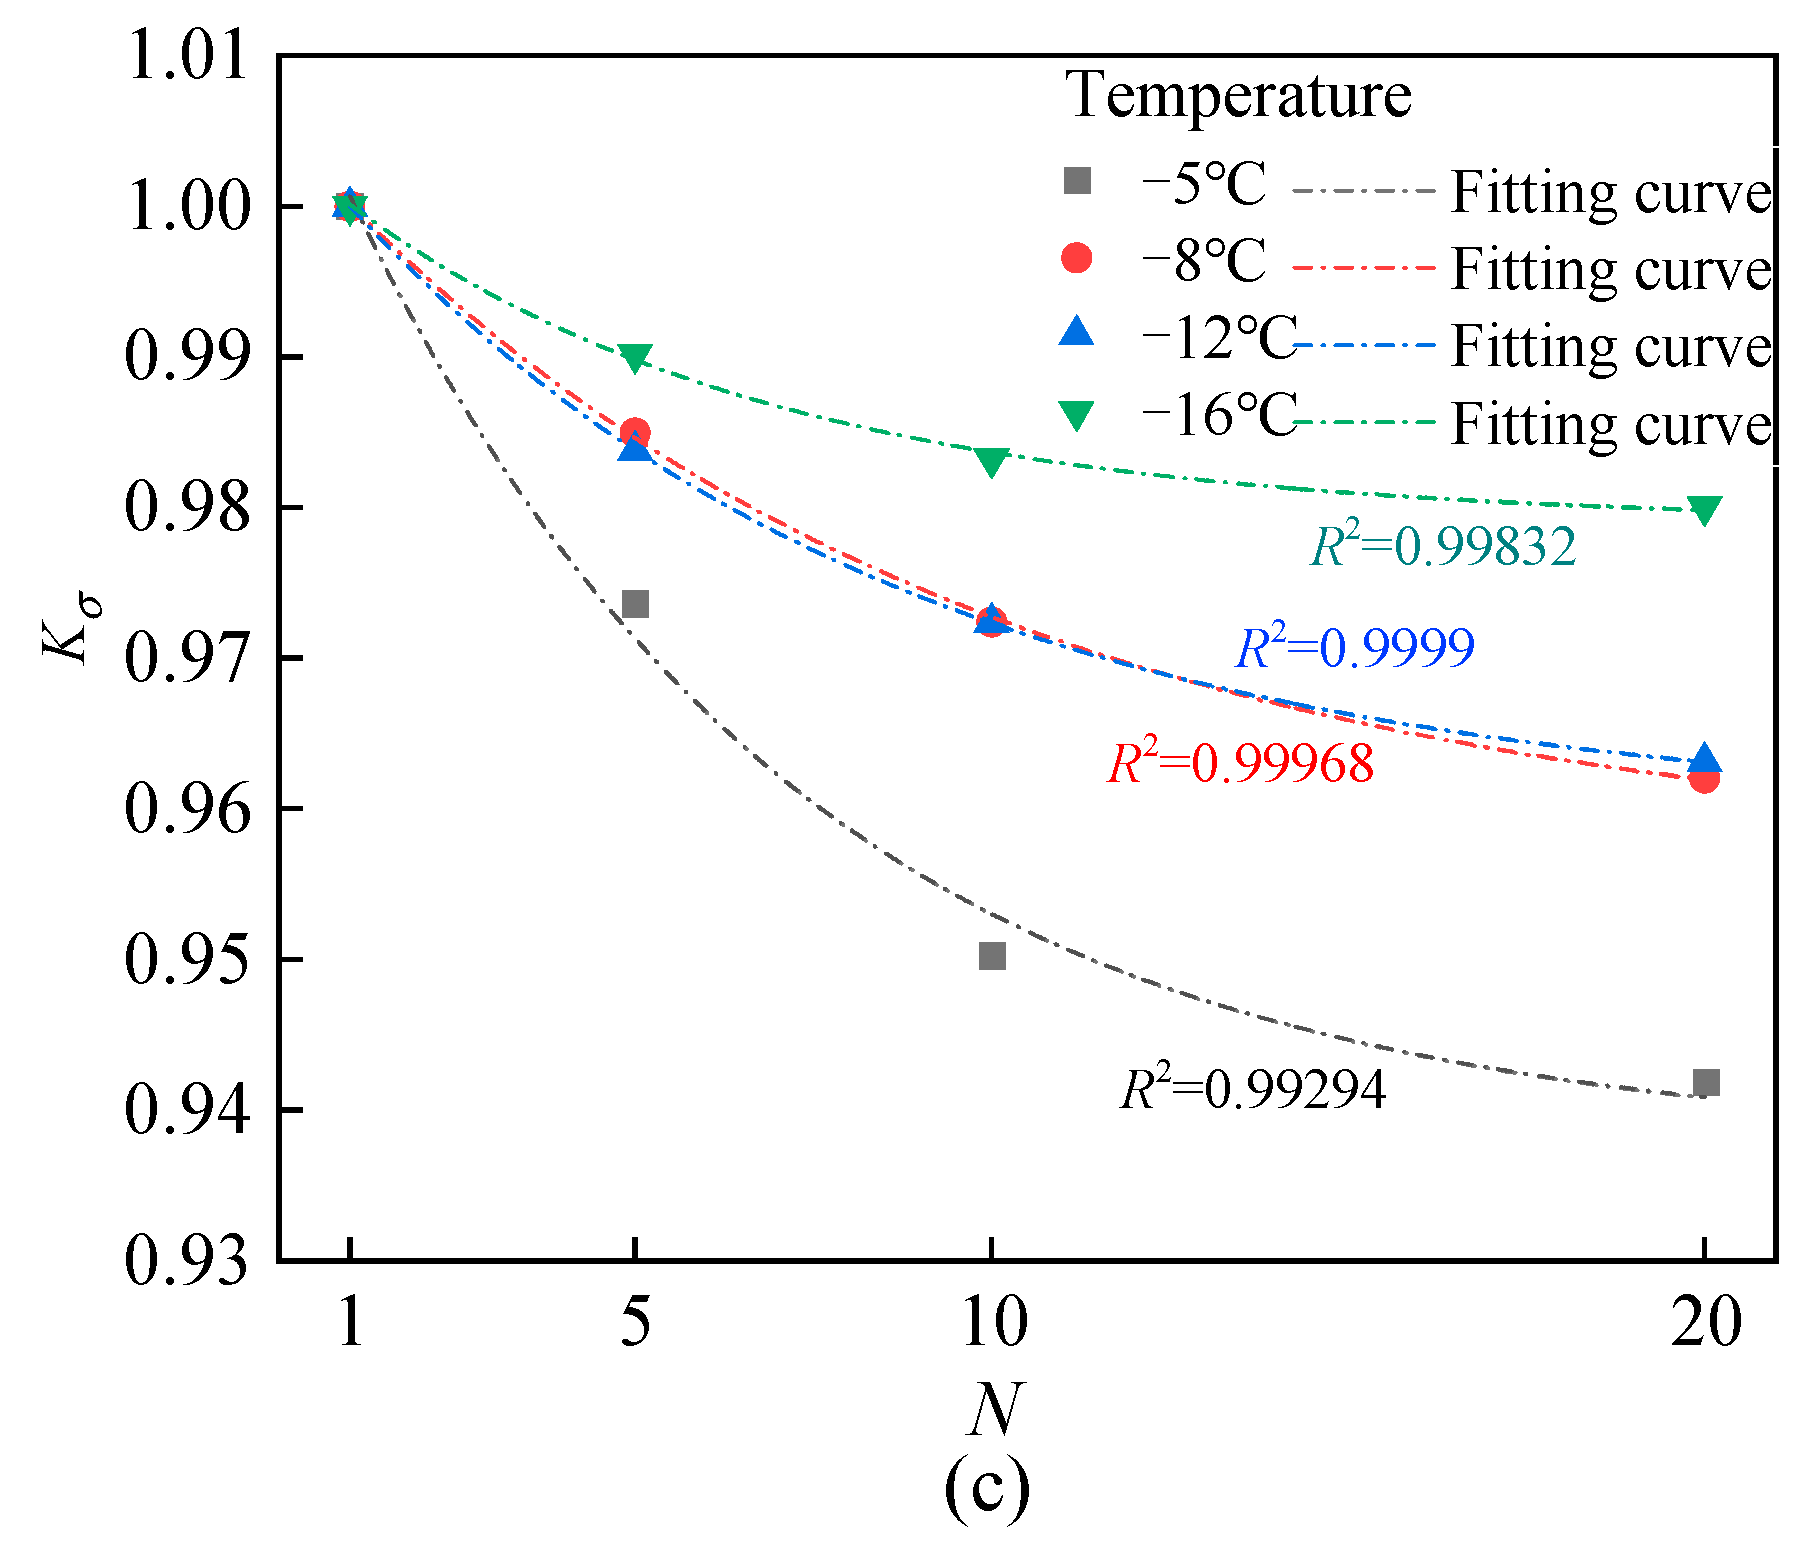
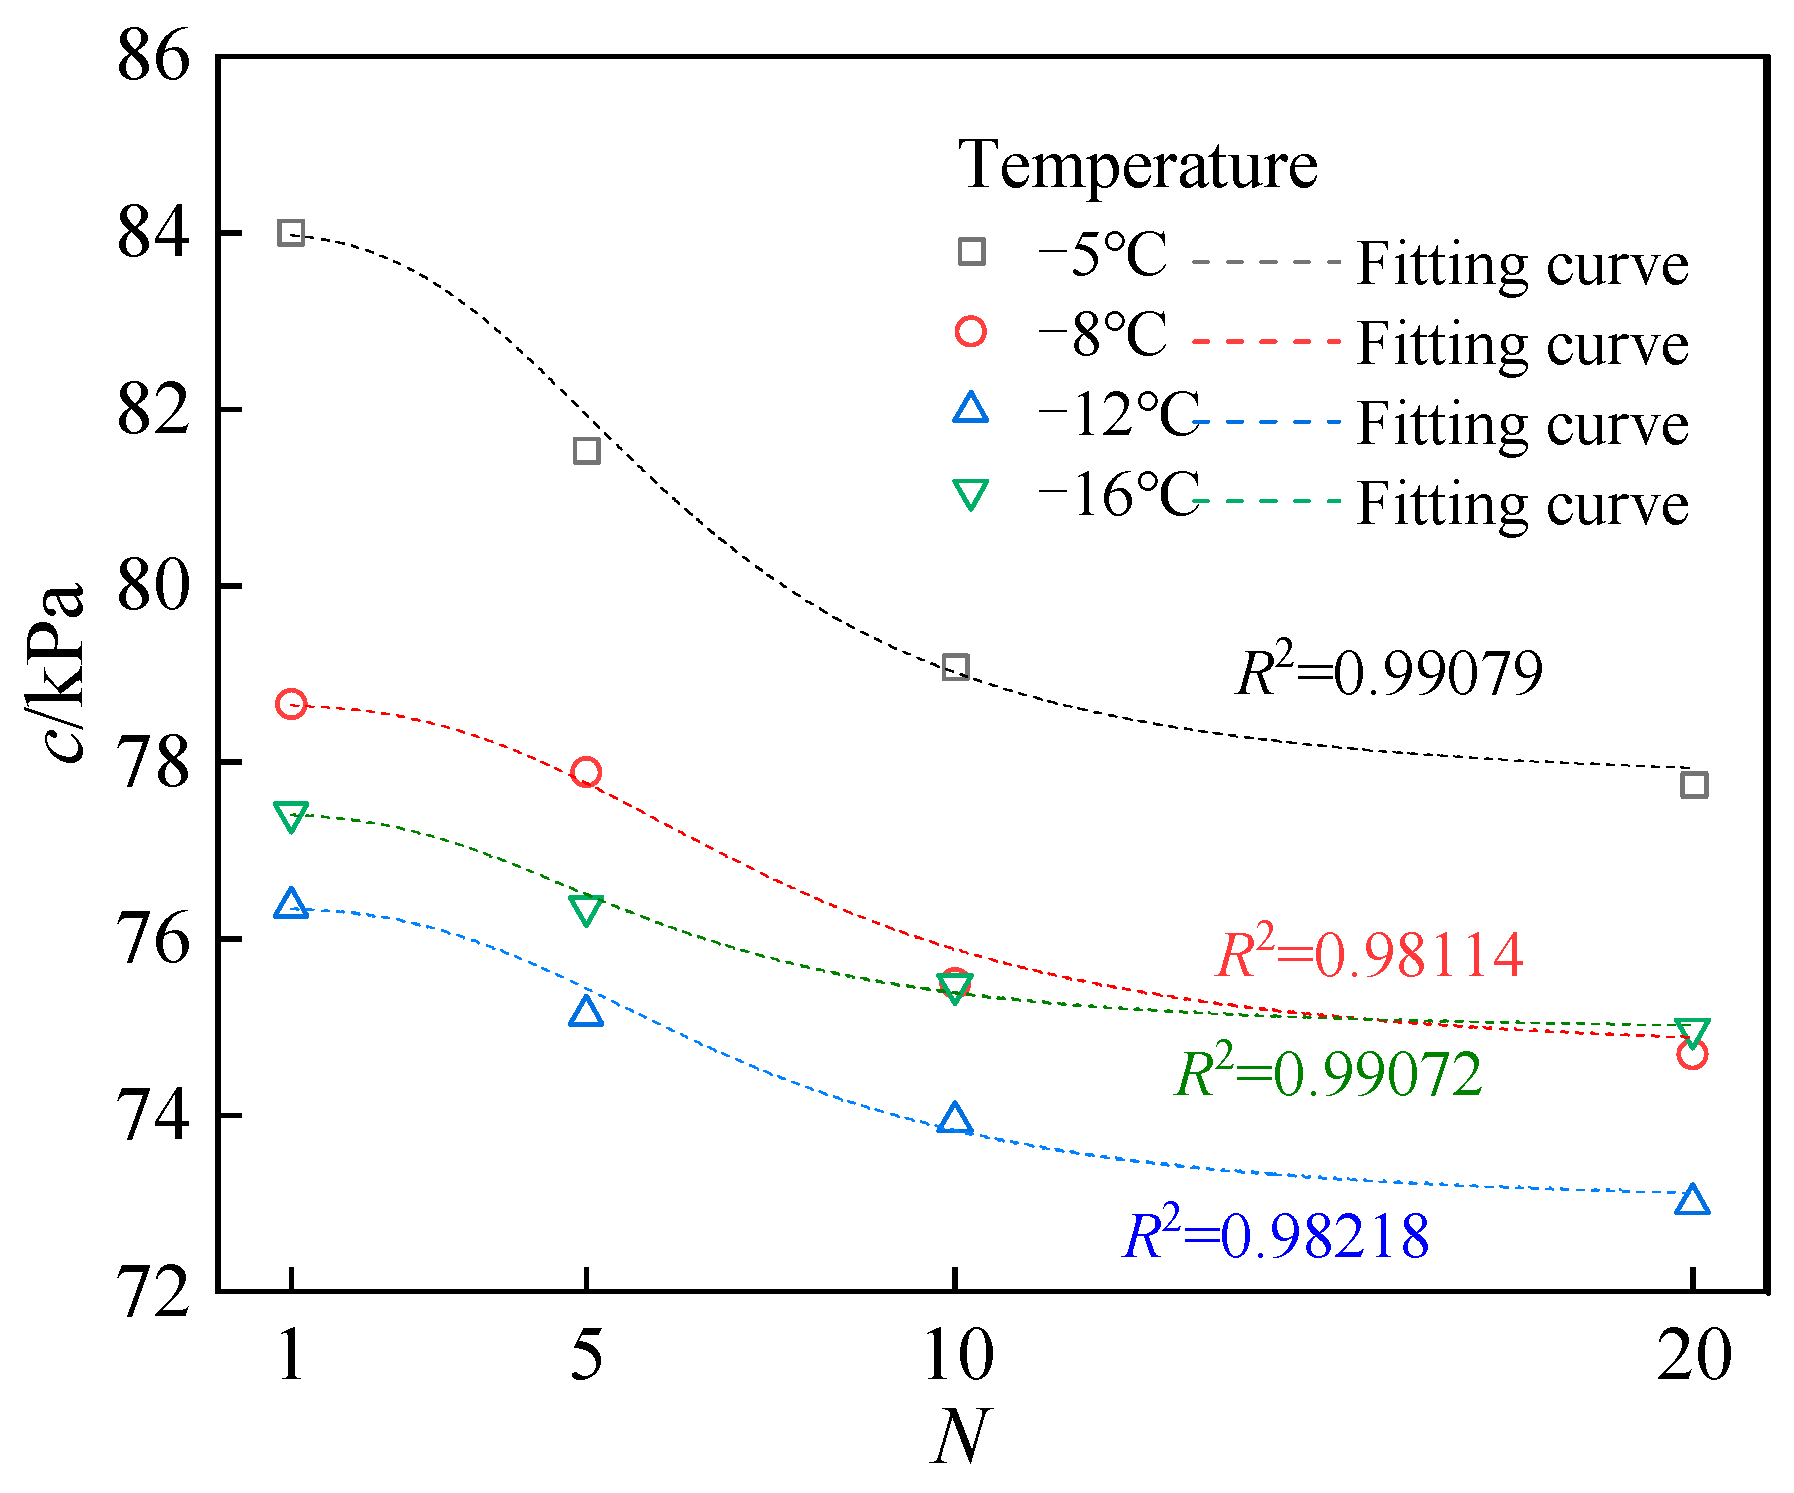
4.2. Effect of Quantitative Analysis on Shear Strength Index
5. Conclusions and Prospects
5.1. Conclusions
5.2. Prospects
Author Contributions
Funding
Data Availability Statement
Conflicts of Interest
References
- Liu, J.; Yue, Z.Q. On clay contents of loess deposits at eight regions in Loess Plateau and Ili area, China. J. Rock Mech. Geotech. Eng. 2025; in press. [Google Scholar] [CrossRef]
- Gao, X.; Xie, W.; Yuan, K.; Liu, Q. Mechanical properties and microstructural evolution of Malan loess with depth: Insights from multivariate statistical models. Soil Till. Res. 2025, 251, 106548. [Google Scholar] [CrossRef]
- Li, P.; Pan, Z.; Xiao, T.; Wang, J. Effects of molding water content and compaction degree on the microstructure and permeability of compacted loess. Acta Geotech. 2022, 18, 921–936. [Google Scholar] [CrossRef]
- Zhang, Y.; Song, Z.; Lai, J.; Li, Y. Spatial-temporal distribution of 3D temperature field of highway tunnel in seasonal frozen soil region. J. Highw. Transp. Res. Dev. 2020, 37, 96–103. [Google Scholar] [CrossRef]
- Xu, J.; Wang, Z.; Ren, J.; Wang, S.; Jin, L. Mechanism of slope failure in loess terrains during spring thawing. J. Mt. Sci. 2018, 15, 845–858. [Google Scholar] [CrossRef]
- Li, J.; Zhou, K.; Liu, J.; Zhang, Y. Analysis of the effect of freeze–thaw cycles on the degradation of mechanical parameters and slope stability. Bull. Eng. Geol. Environ. 2018, 77, 573–580. [Google Scholar] [CrossRef]
- Bo, X.; Liu, E.; Yang, L. Influences of freezing–thawing actions on mechanical properties of soils and stress and deformation of soil slope in cold regions. Sci. Rep. 2022, 12, 5387. [Google Scholar] [CrossRef]
- Li, G.; Ma, W.; Mu, Y.; Wang, F.; Fan, S.; Wu, Y. Effects of freeze-thaw cycle on engineering properties of loess used as road fills in seasonally frozen ground regions, North China. J. Mt. Sci. 2017, 14, 356–368. [Google Scholar] [CrossRef]
- Zhang, W.; Guo, A.; Lin, C. Effects of cyclic freeze and thaw on engineering properties of compacted loess and lime-stabilized loess. J. Mater. Civil. Eng. 2019, 31, 04019205. [Google Scholar] [CrossRef]
- Li, Z.; Yang, G.; Liu, H. The Influence of Regional Freeze–Thaw Cycles on Loess Landslides: Analysis of Strength Deterioration of Loess with Changes in Pore Structure. Water 2020, 12, 3047. [Google Scholar] [CrossRef]
- Jing, J.; Wu, Z.; Yan, W.; Ma, W.; Liang, C.; Lu, Y.; Chen, D. Experimental study on progressive deformation and failure mode of loess fill slopes under freeze-thaw cycles and earthquakes. Eng. Geol. 2022, 310, 106896. [Google Scholar] [CrossRef]
- Zhao, L.; Peng, J.; Ma, P.; Leng, Y.; Ma, Z. Microstructure response to shear strength deterioration in loess after freeze-thaw cycles. Eng. Geol. 2023, 323, 107229. [Google Scholar] [CrossRef]
- Zhang, Q.; Zhang, Y.; Zhang, Z.; Zhu, J.; Chen, W. Deterioration characteristics of Ili loess properties under freeze-thaw cycles and their influence on landslide stability. J. Eng. Geol. 2023, 31, 1319–1332. [Google Scholar] [CrossRef]
- Yang, S.; Chou, Y.; Wang, L.; Zhang, P. Experimental study on mechanical behavior deterioration of undisturbed loess considering freeze-thaw action. Soils Rocks 2023, 47, e2024005822. [Google Scholar] [CrossRef]
- Ghazavi, M.; Roustaie, M. The influence of freeze–thaw cycles on the unconfined compressive strength of fiber-reinforced clay. Cold Reg. Sci. Technol. 2010, 61, 125–131. [Google Scholar] [CrossRef]
- Tang, L.; Cong, S.; Geng, L.; Ling, X.; Gan, F. The effect of freeze-thaw cycling on the mechanical properties of expansive soils. Cold Reg. Sci. Technol. 2018, 145, 197–207. [Google Scholar] [CrossRef]
- Wang, S.; Ding, J.; Xu, J.; Ren, J.; Yang, Y. Shear strength behavior of coarse-grained saline soils after freeze-thaw. KSCE J. Civ. Eng. 2019, 23, 2437–2452. [Google Scholar] [CrossRef]
- Chu, C.; Yang, L.; Cheng, W.; Wang, J.; Wang, X. Triaxial mechanical behaviours of Ili loess after freeze–thaw. Front. Earth Sci. 2024, 12, 1454629. [Google Scholar] [CrossRef]
- Guo, Z.; Song, J.; Bai, Y.; Zhou, Z. Research on the multiscale mechanical properties of paleosols based on the freeze–thaw cycle. J. Mech. 2025, 41, 30–45. [Google Scholar] [CrossRef]
- Leuther, F.; Schlueter, S. Impact of freeze–thaw cycles on soil structure and soil hydraulic properties. Soil 2021, 7, 179–191. [Google Scholar] [CrossRef]
- Wang, T.; Wang, P.; Yin, Z.Y.; Zhang, F.; Xu, C. DEM-DFM modeling suffusion of granular soils under triaxial compression. Int. J. Geomech. 2025, 25, 04024352. [Google Scholar] [CrossRef]
- Xie, Q.; Cao, Z.; Tian, R.; Sun, W.; Fumagalli, A.; Peng, H.; Fu, X.; Luo, H. Complex sliding characteristics of landslides and evaluation of the reinforcement with arched anti-slide piles based on 3D discrete element method: A case study. Nat. Hazards 2024, 120, 8983–9007. [Google Scholar] [CrossRef]
- Han, Y.; Wang, Q.; Wang, N.; Wang, J.; Zhang, X.; Cheng, S.; Kong, Y. Effect of freeze-thaw cycles on shear strength of saline soil. Cold Reg. Sci. Technol. 2018, 154, 42–53. [Google Scholar] [CrossRef]
- Song, S.; Wang, P.; Yin, Z.; Cheng, Y.P. Micromechanical modeling of hollow cylinder torsional shear test on sand using discrete element method. J. Rock Mech. Geotech. Eng. 2024, 16, 5193–5208. [Google Scholar] [CrossRef]
- Chang, D.; Liu, J. Review of the influence of freeze-thaw cycles on the physical and mechanical properties of soil. Sci. Cold Arid Reg. 2013, 5, 457–0460. [Google Scholar] [CrossRef]
- Zhi, B.; Wang, S. Mechanical properties and damage mechanism of loess under dry-wet freeze-thaw cycle. Rock Soil Mech. 2024, 45, 1092–1102. [Google Scholar] [CrossRef]
- Yang, Z.; Lv, J.; Shi, W.; Jia, C.; Wang, C.; Hong, Y.; Ling, X. Experimental study of the freeze thaw characteristics of expansive soil slope models with different initial moisture contents. Sci. Rep. 2021, 11, 23177. [Google Scholar] [CrossRef]
- Xie, B.; Zhang, W.; Sun, X.; Huang, Y.; Liu, L. Experimental study on the effects of freeze–thaw cycles on strength and microstructure of Xining region loess in China. Buildings 2022, 12, 795. [Google Scholar] [CrossRef]
- Huang, S.; Wang, P.; Lai, Z.; Yin, Z.Y.; Huang, L.C.; Xu, C.J. Machine-learning-enabled discrete element method: The extension to three dimensions and computational issues. The extension to three dimensions and computational issues. Comput. Methods Appl. Mech. Eng. 2024, 432, 117445. [Google Scholar] [CrossRef]
- Xu, J.; Ren, Z.; Ren, J.; Yuan, J. Mechanism of shear strength deterioration of loess during freeze-thaw cycling. Geomech. Eng. 2018, 14, 307–314. [Google Scholar] [CrossRef]
- Wang, Q.; Li, Y.; Li, P.; Qi, Y. Using cement and calcium lignosulfonate to improve the mechanical properties and microstructure of loess in a seasonal freezing zone. Buildings 2024, 14, 1495. [Google Scholar] [CrossRef]
- Wang, T.; Wang, P.; Yin, Z.Y.; Laouafa, F.; Hicher, P.Y. Hydro-mechanical analysis of particle migration in fractures with CFD-DEM. Eng. Geol. 2024, 335, 107557. [Google Scholar] [CrossRef]
- Zheng, F.; Li, W.; Song, Z.; Wang, J.; Zhang, Y.; Wang, J. Experimental study on the damage properties of mechanical properties of saline soil under different influencing factors. Buildings 2025, 15, 324. [Google Scholar] [CrossRef]
- Gao, Z.; Zhong, X.; Wang, Q.; Su, Y.; Wang, J. The influence of freeze-thaw cycles on unconfined compressive strength of lignin fiber-reinforced loess. J. Renew. Mater. 2022, 10, 1063–1080. [Google Scholar] [CrossRef]
- Ye, W.; Zhou, Z.; Bai, Y.; Guo, Z. Multiscale study of the strength deterioration and microstructure changes in loess during dry–wet and freeze–thaw cycles. J. Chin. Inst. Eng. 2023, 47, 283–292. [Google Scholar] [CrossRef]
- GB/T 50123-2019; Standard for Geotechnical Testing Method. China Planning Press: Beijing, China, 2019. Available online: https://d.wanfangdata.com.cn/standard/GB/T%2050123-2019 (accessed on 29 April 2025).
- Zhang, L.H.; Ma, W.; Yang, C.S.; Dong, S. A review and prospect of the thermodynamics of soils subjected to freezing and thawing. J. Glaciol. Geocryol. 2013, 36, 1505–1518. [Google Scholar] [CrossRef]
- Zhang, L.H.; Ma, W.; Yang, C.S. Pore water pressure measurement for soil subjected to freeze-thaw cycles. Rock Soil Mech. 2015, 36, 1856–1864. [Google Scholar] [CrossRef]
- Wang, Q.Z.; Qi, J.L.; Wang, S.H.; Xu, J.; Yang, Y.G. Effect of freeze-thaw on freezing point of a saline loess. Cold Reg. Sci. Technol. 2020, 170, 102922. [Google Scholar] [CrossRef]
- Cai, X.L.; Yu, L. Experimental research on the effect of the sample preparation methods on the strength change of the unsaturated compacted loess. China Earthq. Eng. J. 2019, 41, 86–93. [Google Scholar] [CrossRef]
- Zhang, J.; Ma, C.; Lang, R.; Sun, L.; Yan, S. Experimental study on mechanical properties and microstructure of muddy soil under different freeze-thaw modes. Chin. J. Rock Mech. Eng. 2023, 42, 3801–3811. [Google Scholar] [CrossRef]


| Specific Gravity of Soil Grain | Moisture Content (%) | Dry Density (g∙cm−3) | Limit of Plastic (%) | Liquid Limit (%) | Index of Plasticity |
|---|---|---|---|---|---|
| 2.71 | 22.9 | 1.5 | 18.4 | 35.0 | 16.6 |
| Test Number | Low Temperature (°C) | High Temperature (℃) | Number of F-T Cycles | Confining Pressure (kPa) |
|---|---|---|---|---|
| 1-1 | −5 | 25 | 1 | 100, 200, 300 |
| 1-5 | 5 | 100, 200, 300 | ||
| 1-10 | 10 | 100, 200, 300 | ||
| 1-20 | 20 | 100, 200, 300 | ||
| 2-1 | −8 | 25 | 1 | 100, 200, 300 |
| 2-5 | 5 | 100, 200, 300 | ||
| 2-10 | 10 | 100, 200, 300 | ||
| 2-20 | 20 | 100, 200, 300 | ||
| 3-1 | −12 | 25 | 1 | 100, 200, 300 |
| 3-5 | 5 | 100, 200, 300 | ||
| 3-10 | 10 | 100, 200, 300 | ||
| 3-10 | 20 | 100, 200, 300 | ||
| 4-1 | −16 | 25 | 1 | 100, 200, 300 |
| 4-5 | 5 | 100, 200, 300 | ||
| 4-10 | 10 | 100, 200, 300 | ||
| 4-20 | 20 | 100, 200, 300 |
| Confining Pressure | F-T Cycles | A1 | A2 | A3 | R2 |
|---|---|---|---|---|---|
| 100 kPa | 1 | 1.13171 | 0.03333 | 0.00129 | 0.97704 |
| 5 | 1.11959 | 0.02976 | 0.00118 | 0.99960 | |
| 10 | 1.10368 | 0.02622 | 0.00110 | 0.99994 | |
| 20 | 1.10584 | 0.02676 | 0.00116 | 0.98896 | |
| 200 kPa | 1 | 1.11778 | 0.02969 | 0.00124 | 0.99950 |
| 5 | 1.07335 | 0.01896 | 0.00077 | 0.94388 | |
| 10 | 1.06422 | 0.01608 | 0.00066 | 0.99669 | |
| 20 | 1.08434 | 0.02193 | 0.00094 | 0.96299 | |
| 300 kPa | 1 | 1.10042 | 0.02549 | 0.00099 | 0.97400 |
| 5 | 1.08792 | 0.02221 | 0.00090 | 0.99533 | |
| 10 | 1.07143 | 0.01801 | 0.00076 | 0.99742 | |
| 20 | 1.08054 | 0.02054 | 0.00090 | 0.99687 |
| Confining Pressure | Temperature | B1 | B2 | B3 | R2 | RSS |
|---|---|---|---|---|---|---|
| 100 kPa | −5 °C | 0.91733 | 0.09549 | 7.35857 | 0.99606 | 1.32 × 10⁻⁵ |
| −8 °C | 0.94200 | 0.06526 | 10.24322 | 0.98075 | 2.69 × 10⁻⁵ | |
| −12 °C | 0.94789 | 0.05924 | 7.53427 | 0.99884 | 1.48 × 10⁻⁶ | |
| −16 °C | 0.97263 | 0.03156 | 7.22874 | 0.99893 | 3.90 × 10⁻⁷ | |
| 200 kPa | −5 °C | 0.95603 | 0.0554 | 4.69084 | 0.96076 | 4.68 × 10⁻⁵ |
| −8 °C | 0.95877 | 0.04522 | 9.65966 | 0.99393 | 4.14 × 10⁻⁶ | |
| −12 °C | 0.96465 | 0.03942 | 21.20856 | 0.81459 | 6.17 × 10⁻⁵ | |
| −16 °C | 0.97181 | 0.03525 | 4.61872 | 0.99362 | 2.97 × 10⁻⁶ | |
| 300 kPa | −5 °C | 0.93767 | 0.07366 | 6.37583 | 0.99294 | 1.44 × 10⁻⁵ |
| −8 °C | 0.95655 | 0.04862 | 9.09249 | 0.99968 | 2.56 × 10⁻⁷ | |
| −12 °C | 0.95960 | 0.04593 | 7.79612 | 0.9999 | 1.07 × 10⁻¹⁰ | |
| −16 °C | 0.97897 | 0.02497 | 5.97741 | 0.99832 | 3.95 × 10⁻⁷ |
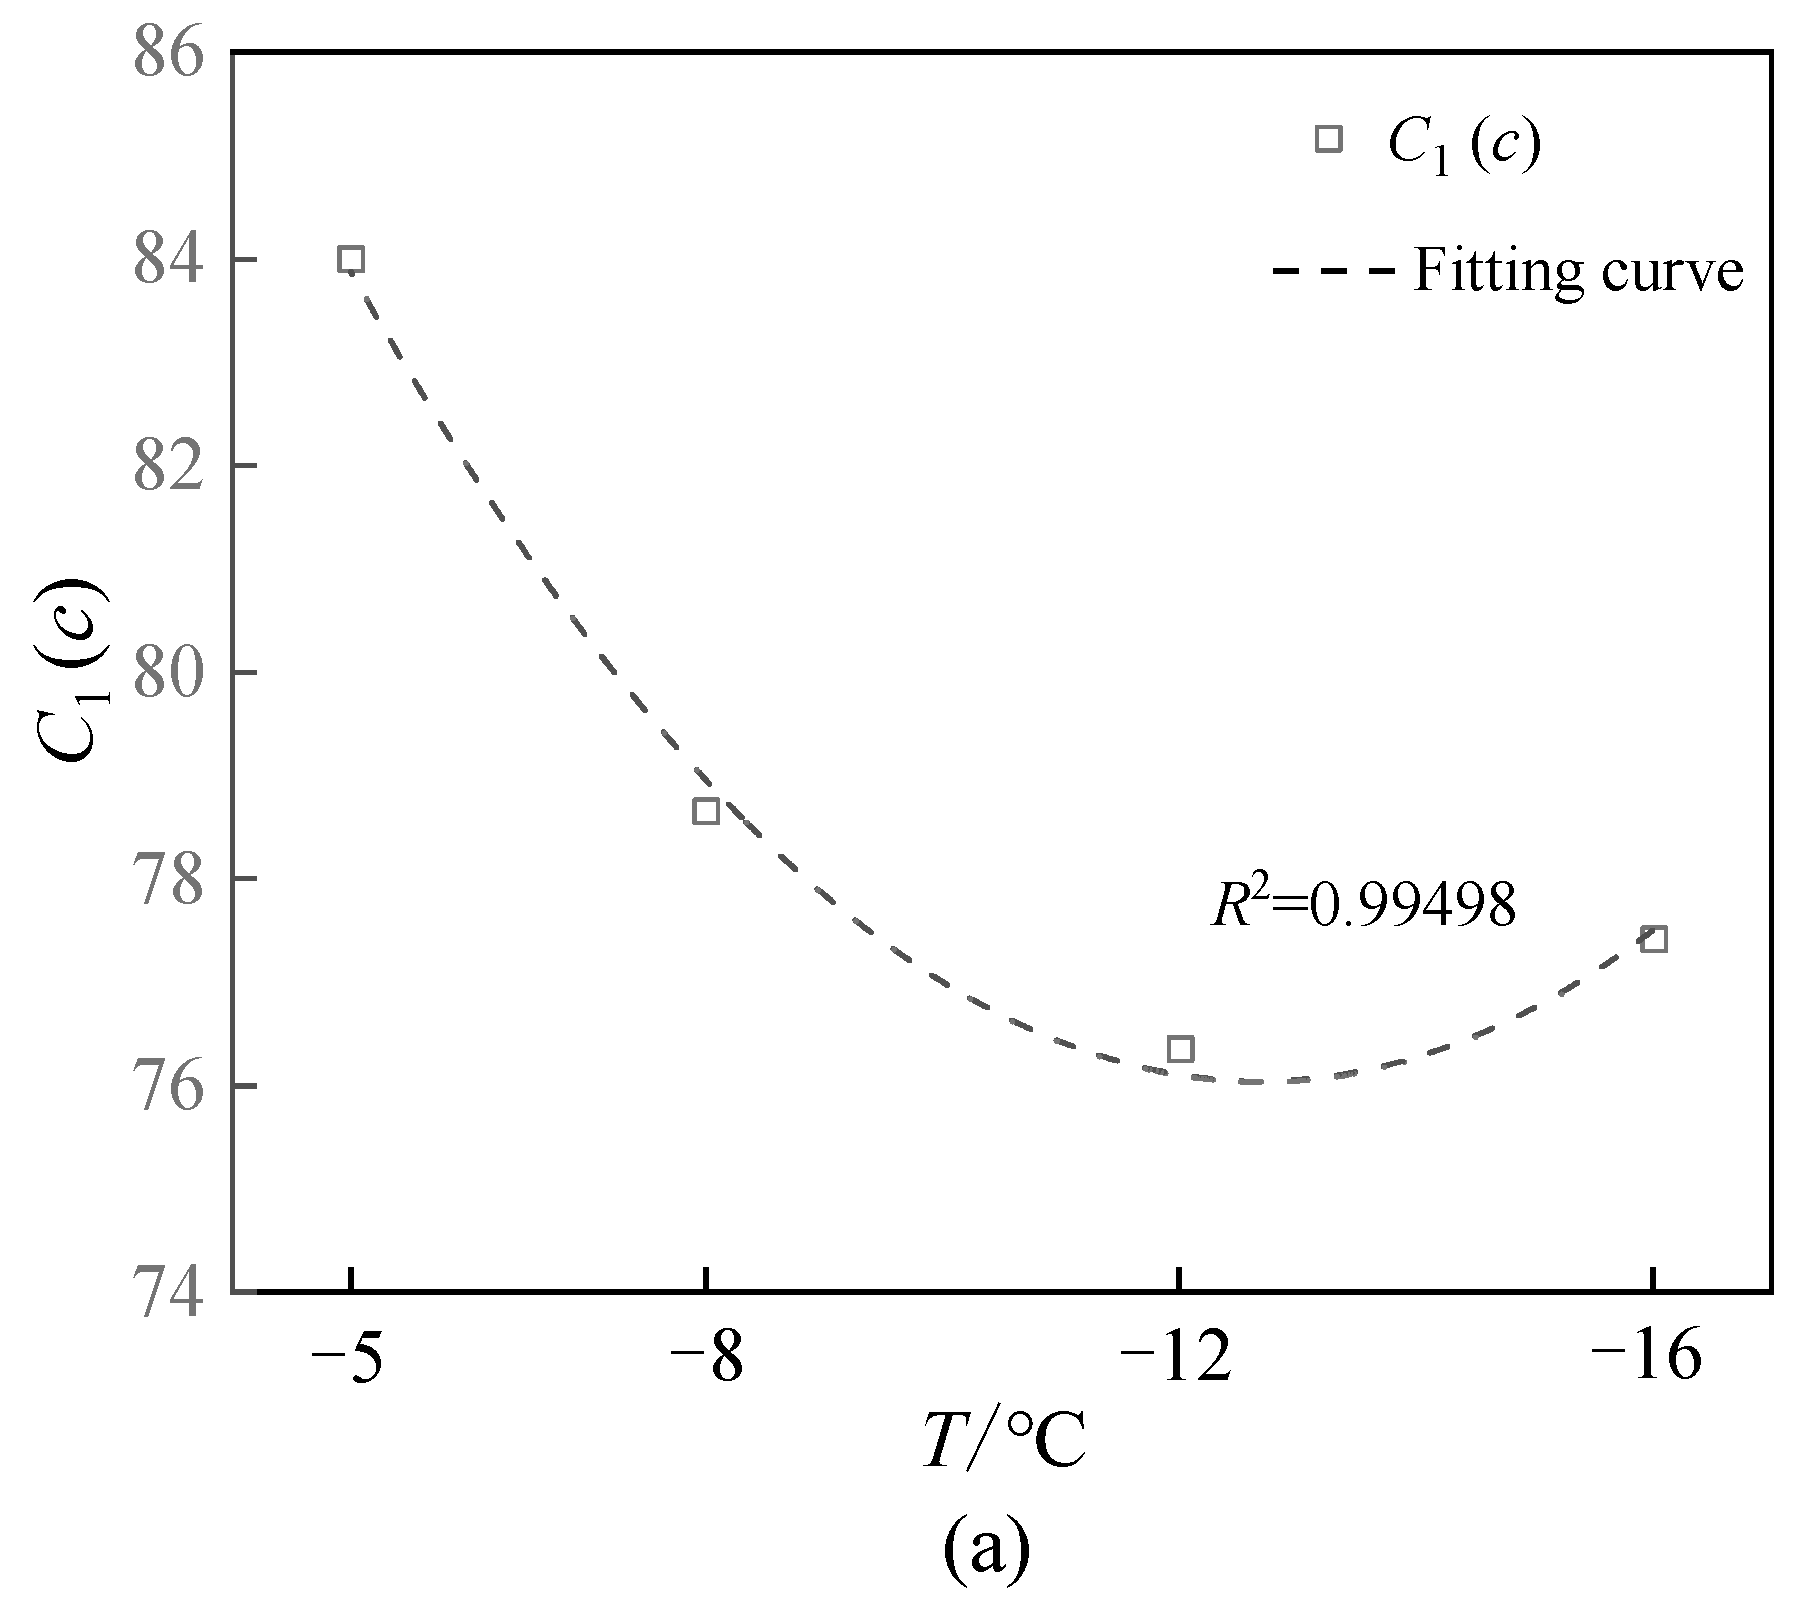
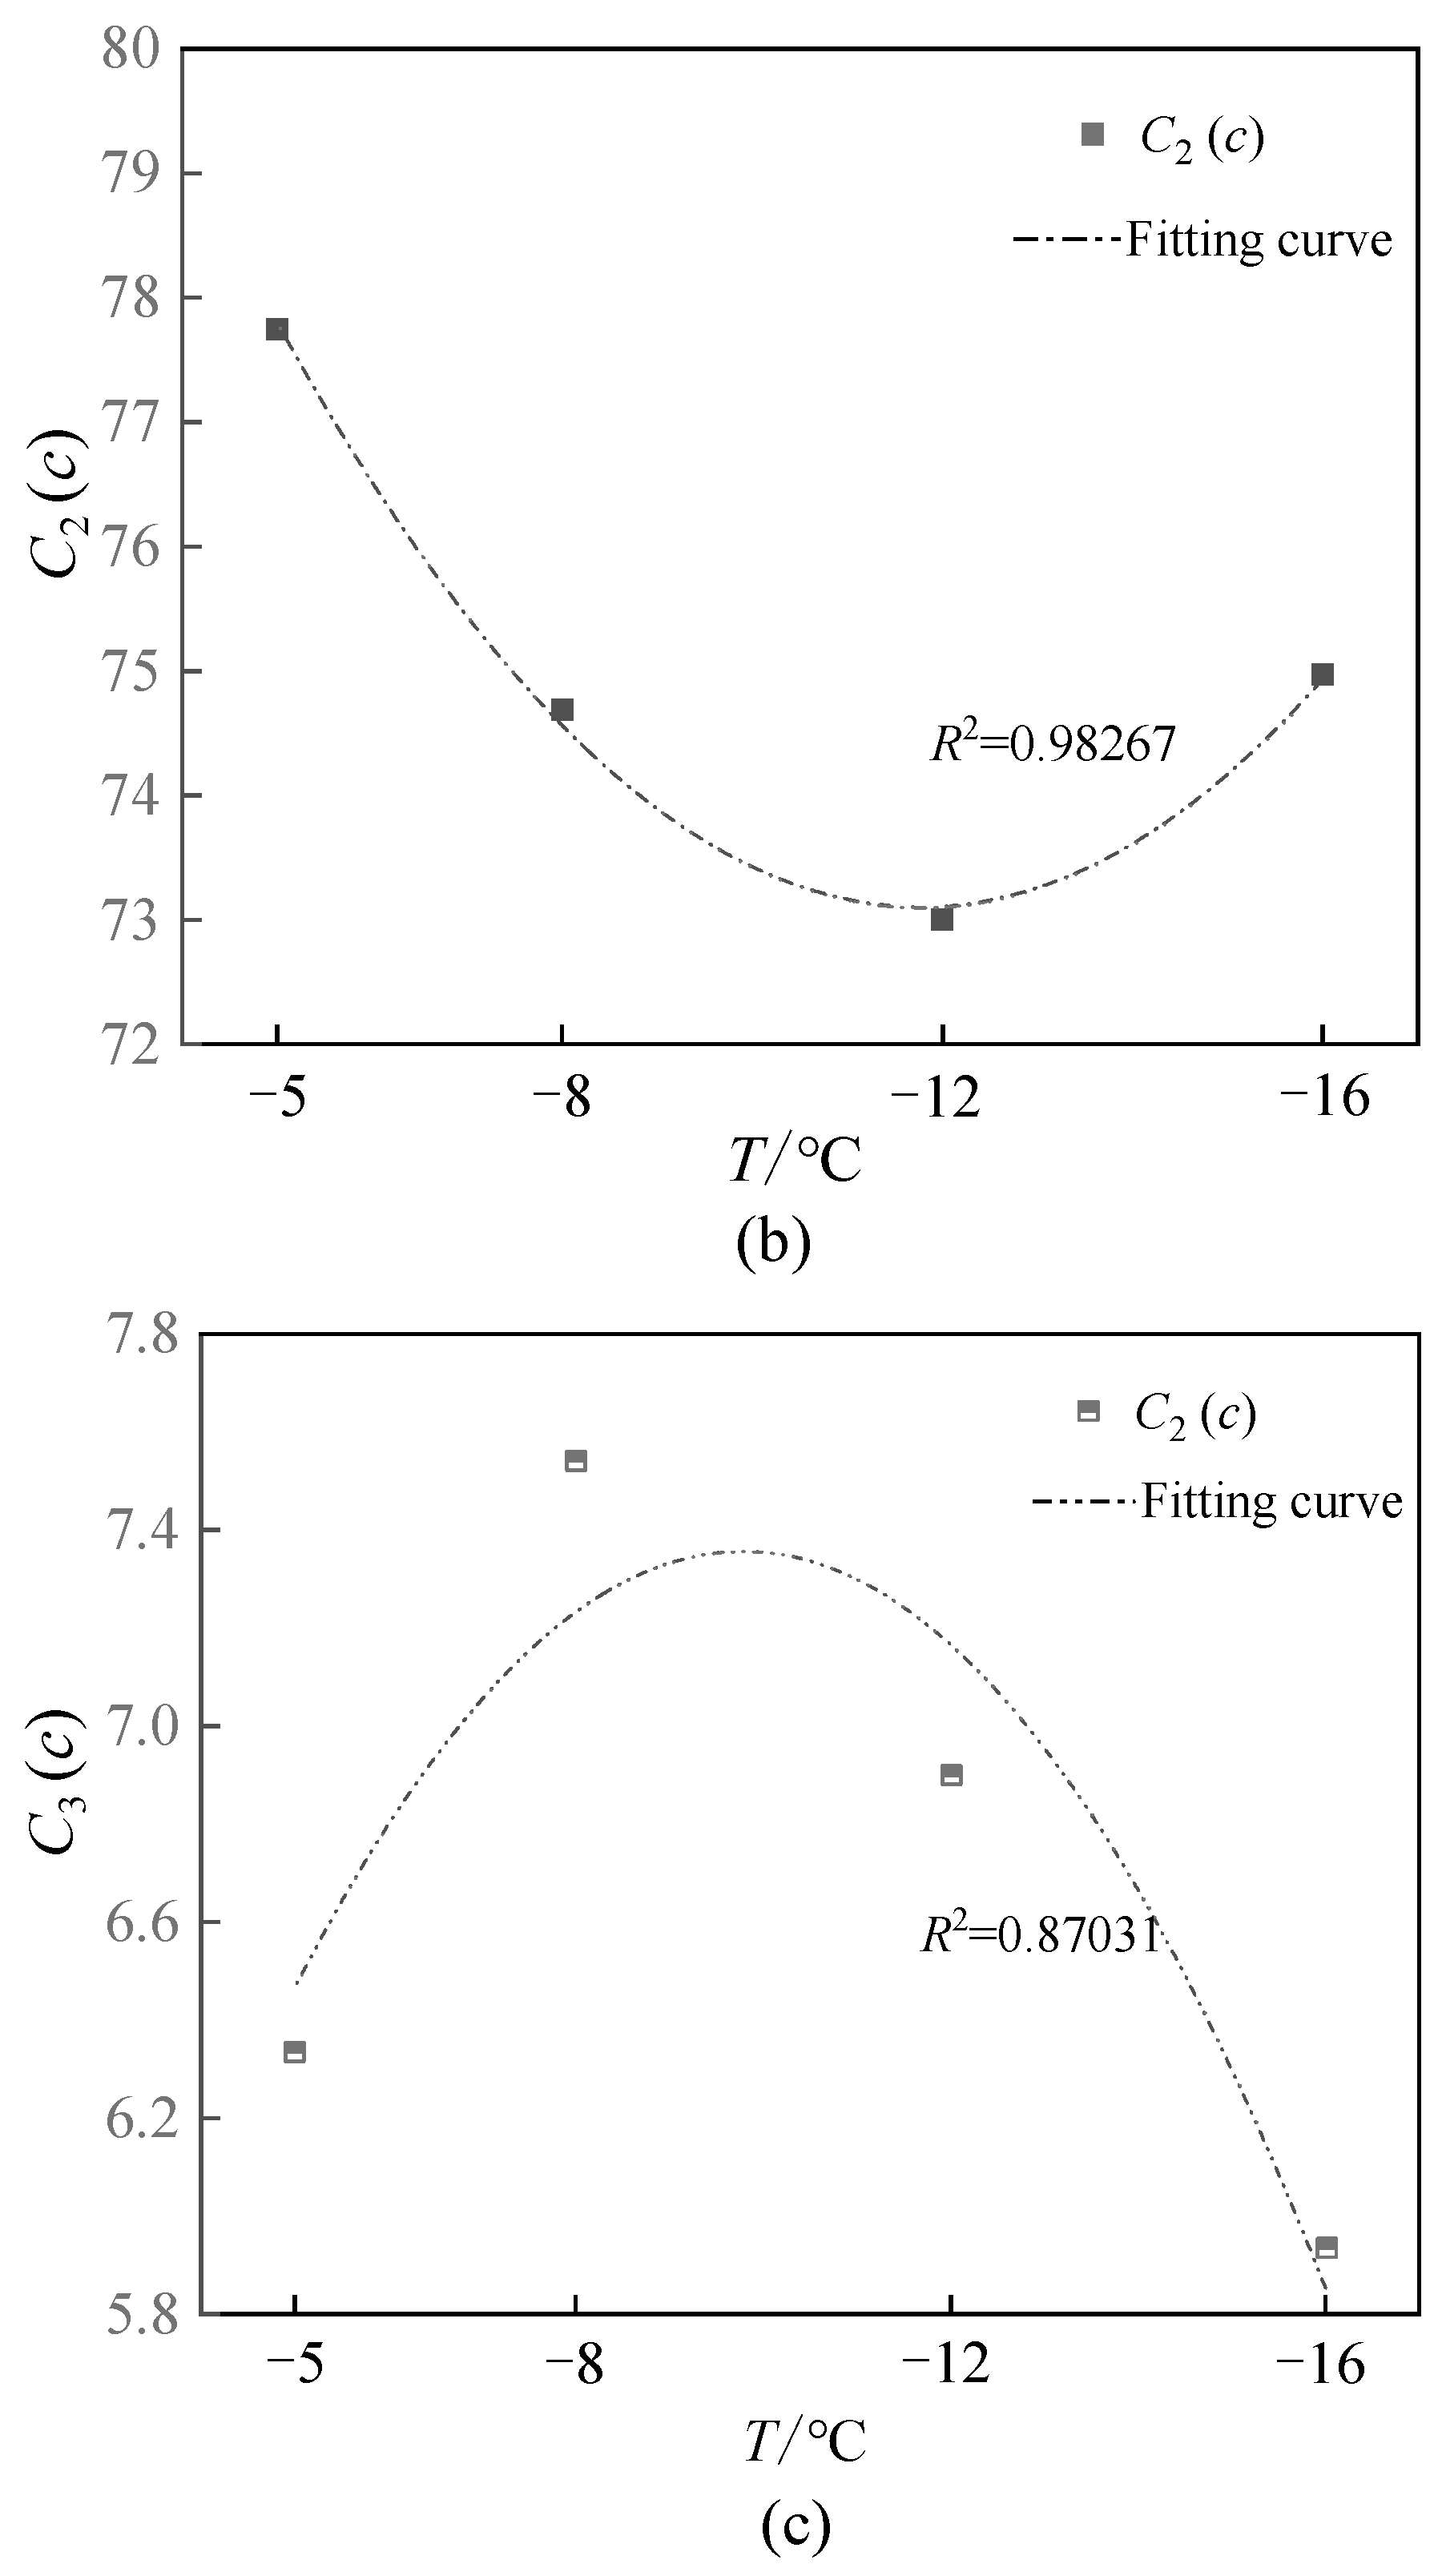
| Temperature (°C) | C1 | C2 | C3 | m | R2 |
|---|---|---|---|---|---|
| −5 | 84.00 | 77.75 | 6.33673 | 3 | 0.99079 |
| −8 | 78.66 | 74.69 | 7.54184 | 3 | 0.98114 |
| −12 | 76.36 | 73.00 | 6.90083 | 3 | 0.98218 |
| −16 | 77.42 | 74.97 | 5.93750 | 3 | 0.99072 |
Disclaimer/Publisher’s Note: The statements, opinions and data contained in all publications are solely those of the individual author(s) and contributor(s) and not of MDPI and/or the editor(s). MDPI and/or the editor(s) disclaim responsibility for any injury to people or property resulting from any ideas, methods, instructions or products referred to in the content. |
© 2025 by the authors. Licensee MDPI, Basel, Switzerland. This article is an open access article distributed under the terms and conditions of the Creative Commons Attribution (CC BY) license (https://creativecommons.org/licenses/by/4.0/).
Share and Cite
Zheng, F.; Xue, X.; Song, Z.; Zhang, Y.; Liu, H. The Influence of Freeze-Thaw Cycles on the Mechanical Properties of Loess Under Temperature Variations. Buildings 2025, 15, 1806. https://doi.org/10.3390/buildings15111806
Zheng F, Xue X, Song Z, Zhang Y, Liu H. The Influence of Freeze-Thaw Cycles on the Mechanical Properties of Loess Under Temperature Variations. Buildings. 2025; 15(11):1806. https://doi.org/10.3390/buildings15111806
Chicago/Turabian StyleZheng, Fang, Xinle Xue, Zhanping Song, Yuwei Zhang, and Hongke Liu. 2025. "The Influence of Freeze-Thaw Cycles on the Mechanical Properties of Loess Under Temperature Variations" Buildings 15, no. 11: 1806. https://doi.org/10.3390/buildings15111806
APA StyleZheng, F., Xue, X., Song, Z., Zhang, Y., & Liu, H. (2025). The Influence of Freeze-Thaw Cycles on the Mechanical Properties of Loess Under Temperature Variations. Buildings, 15(11), 1806. https://doi.org/10.3390/buildings15111806