Machine Learning-Based Cost Estimation Models for Office Buildings
Abstract
1. Introduction
2. Literature Review
3. Research Methods
3.1. Back-Propagation Neural Network (BPNN)
- (1)
- Network Initialization
- (2)
- Calculation of hidden layer output
- (3)
- Calculation of output layer value
- (4)
- Error Calculation
- (5)
- Weight Update
- (6)
- Threshold Update
- (7)
- Check for Termination
3.2. Support Vector Machine (SVM)
3.3. Optimization Algorithm
3.4. Hyperparameter Settings
4. Determination of Indicators and Data Processing
4.1. Determination and Assignment of Indicators
4.2. Data Collection
4.3. Dimensionality Reduction of Indicators
4.3.1. PCA for Dimensionality Reduction
4.3.2. GRA for Dimensionality Reduction
5. Estimation Model Prediction and Comparison
5.1. Estimation Model Prediction
5.1.1. BPNN Prediction Model
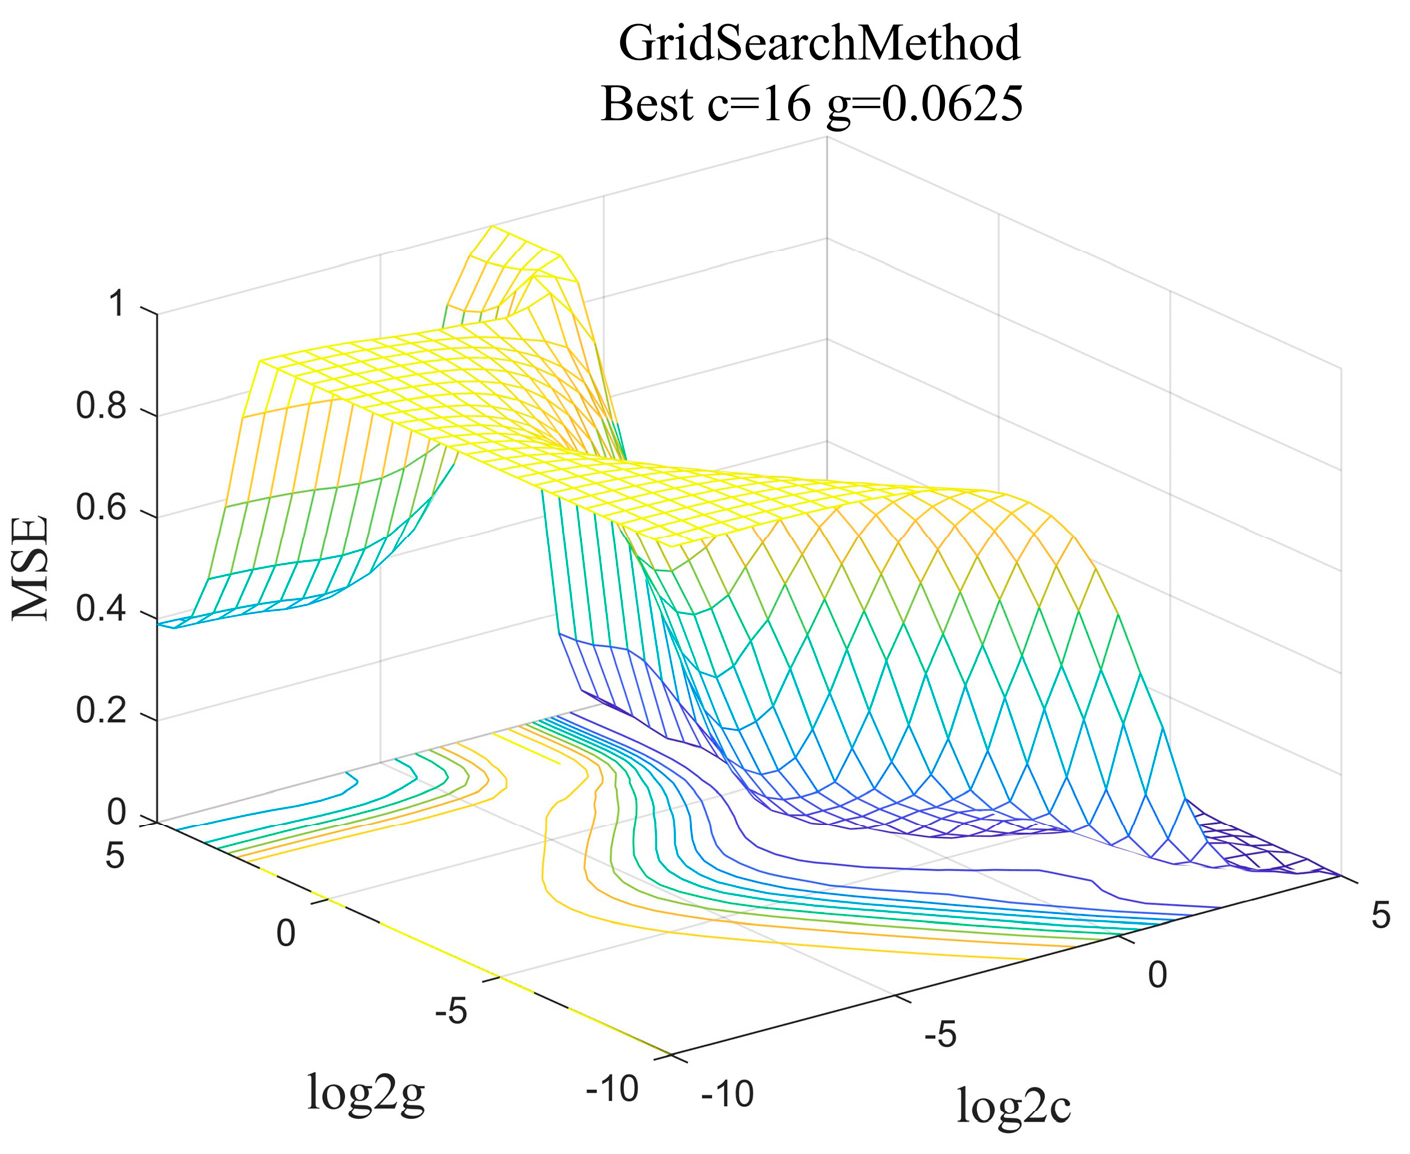
5.1.2. SVM Prediction Model
5.2. Comparison Analysis of Prediction Results
- (1)
- After structural optimization and parameter tuning, all six prediction models—BPNN, GA-BPNN, PSO-BPNN, GA-SVM, PSO-SVM, and GSA-SVM—achieved strong predictive performance. The original BPNN also performed well in this study. All models maintained MAPE below 8% and mean squared correlation coefficients above 0.8.
- (2)
- In terms of algorithm optimization, GA and PSO optimization significantly improved the predictive performance of the BPNN model, demonstrating the value of algorithm optimization in machine learning. The optimization effects varied across models: GA outperformed PSO in BPNN, while PSO showed better results than GA in SVM. The optimal machine learning model varies for different research problems. When selecting optimization algorithms, one should consider both data characteristics and model structure. Comparative analysis may help identify the most suitable optimization approach.
- (3)
- In terms of dimensionality reduction methods, PCA dimensionality reduction improved the predictive performance of all six models. However, GRA dimensionality reduction had mixed effects. It slightly improved performance in BPNN, GA-BPNN, and PSO-BPNN, but worsened the performance in GA-SVM, PSO-SVM, and GSA-SVM models. This may be due to GRA’s loss of some information during dimensionality reduction, which certain models are sensitive to. Therefore, selecting the right dimensionality reduction method is crucial in machine learning. Conducting comparative studies can help determine the best approach.
- (4)
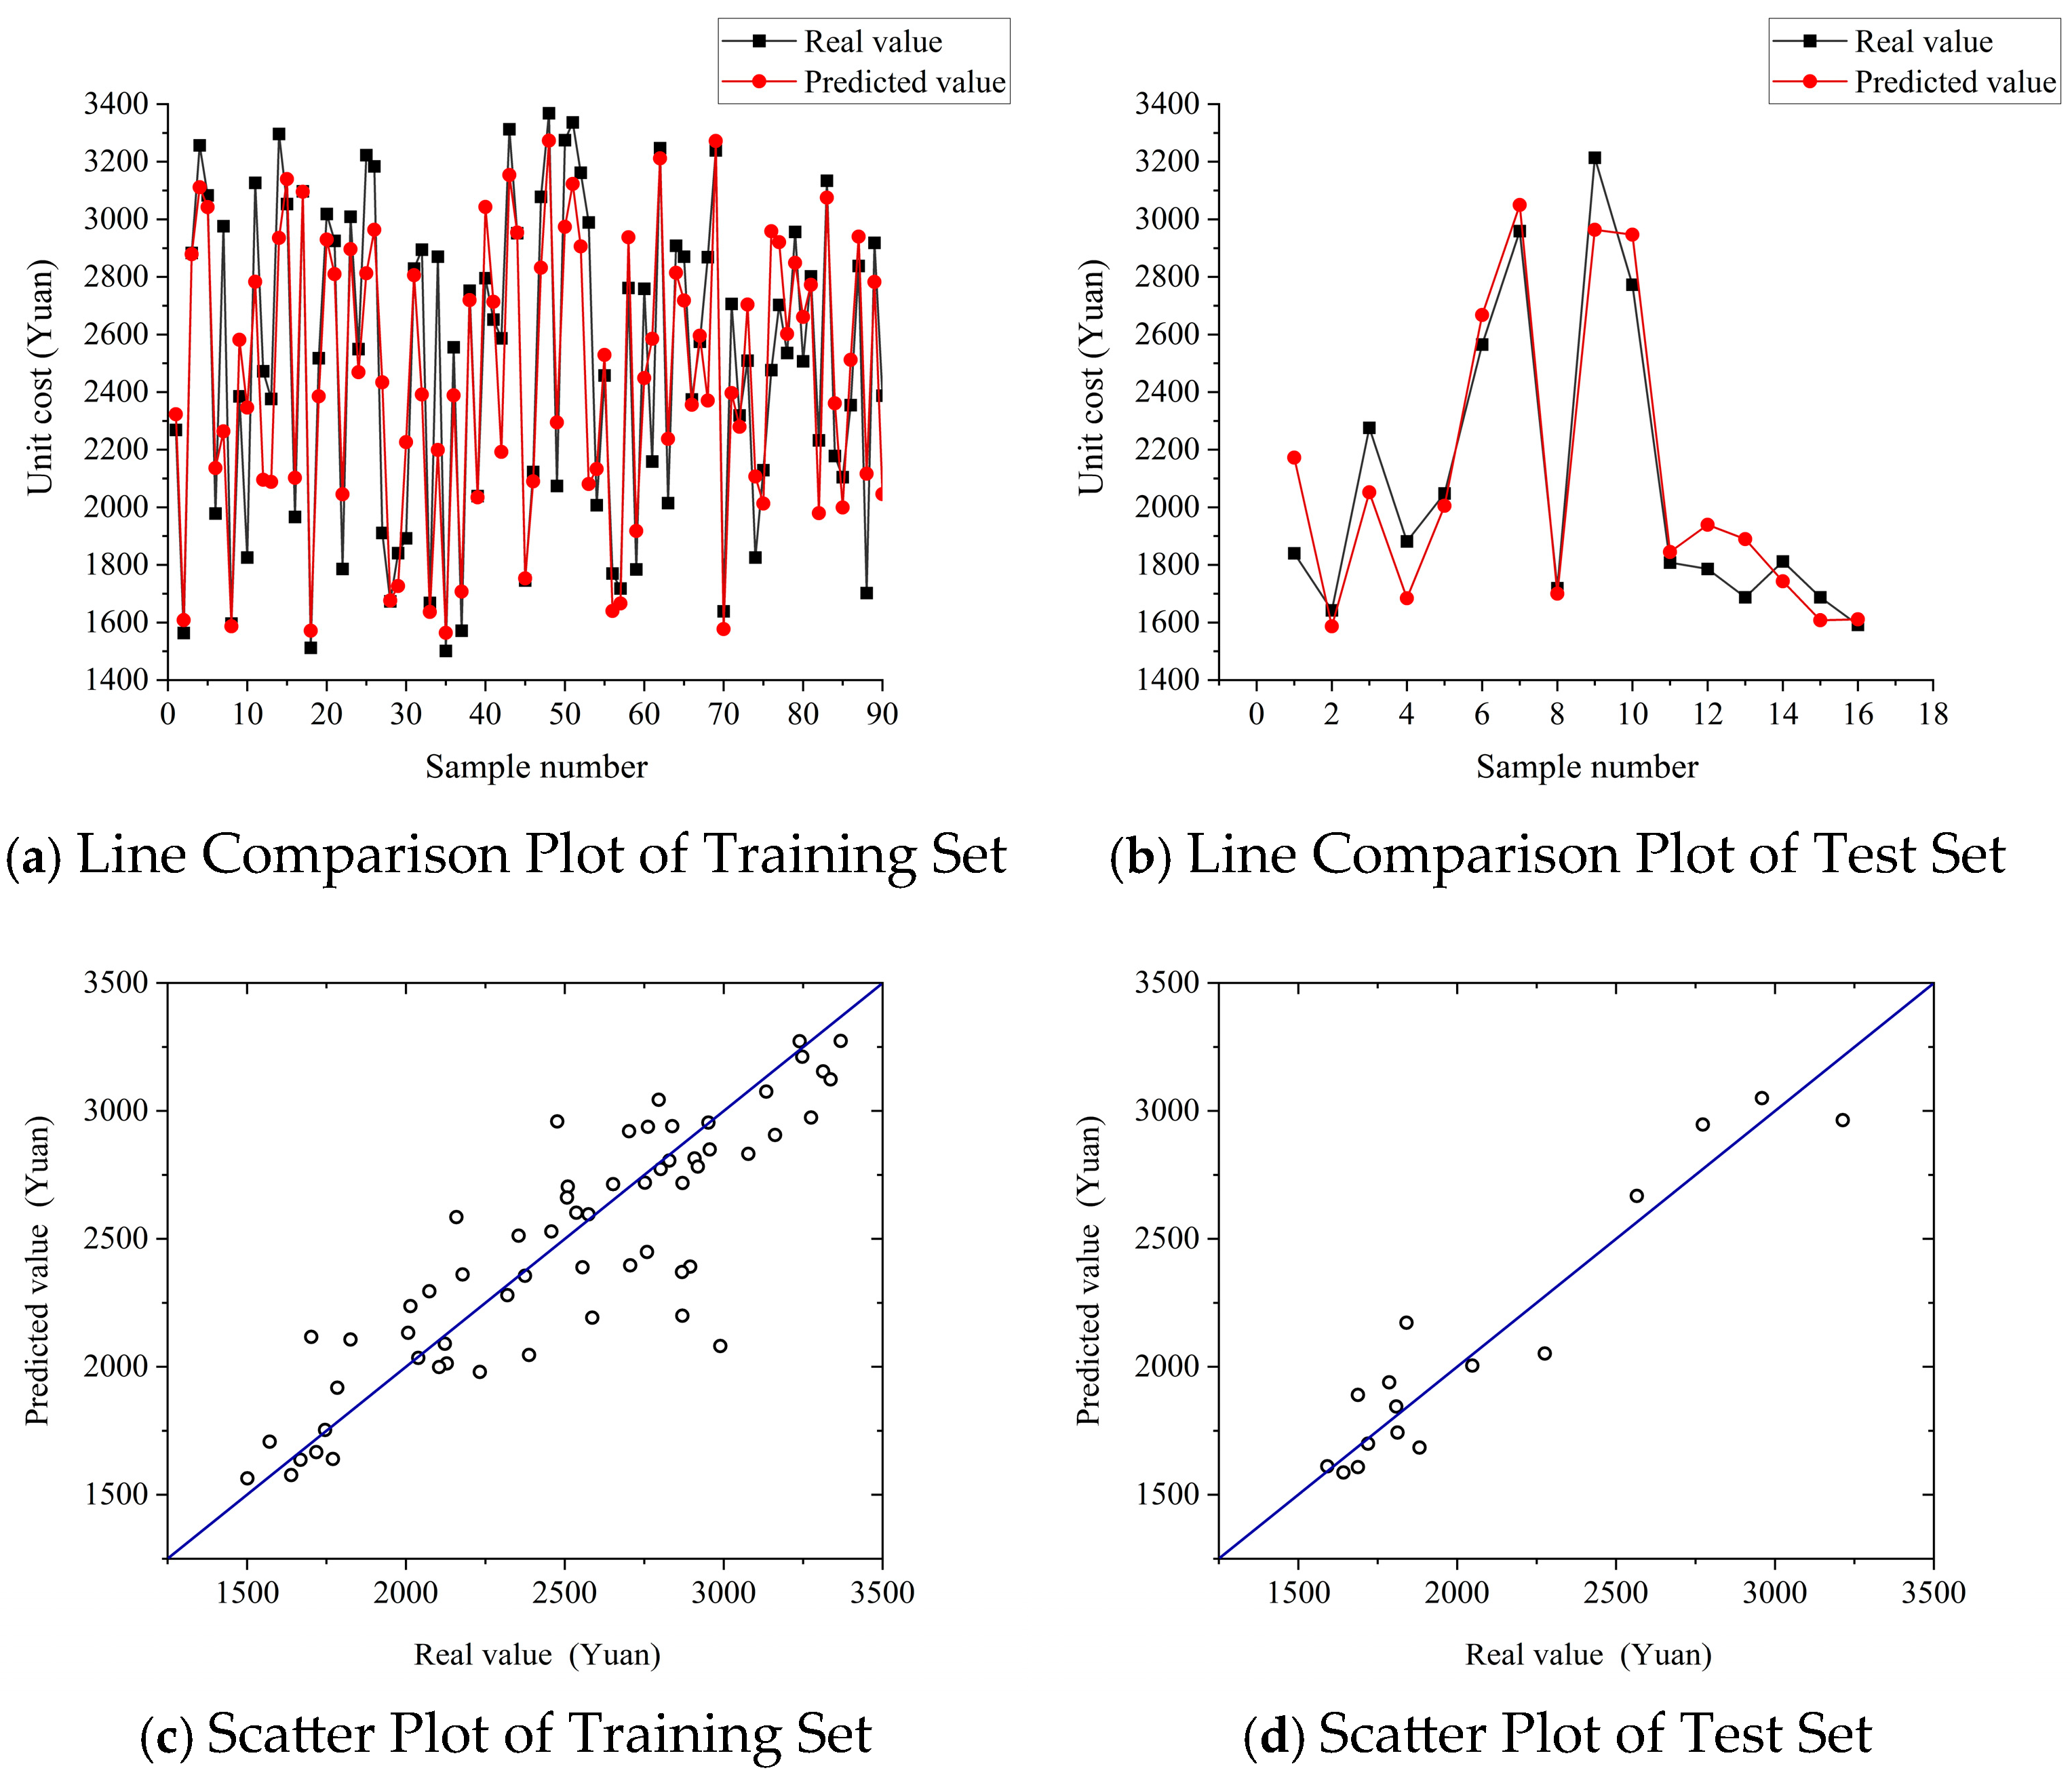
- In terms of model selection, the PCA-GSA-SVM model exhibits the best predictive performance among all established models, with an R2 of 0.927 and MAPE of 5.52%. The predictive accuracy has reached a relatively ideal level.
5.3. Prediction Model Comprehensive Comparison and Selection
5.3.1. Accuracy Comparison
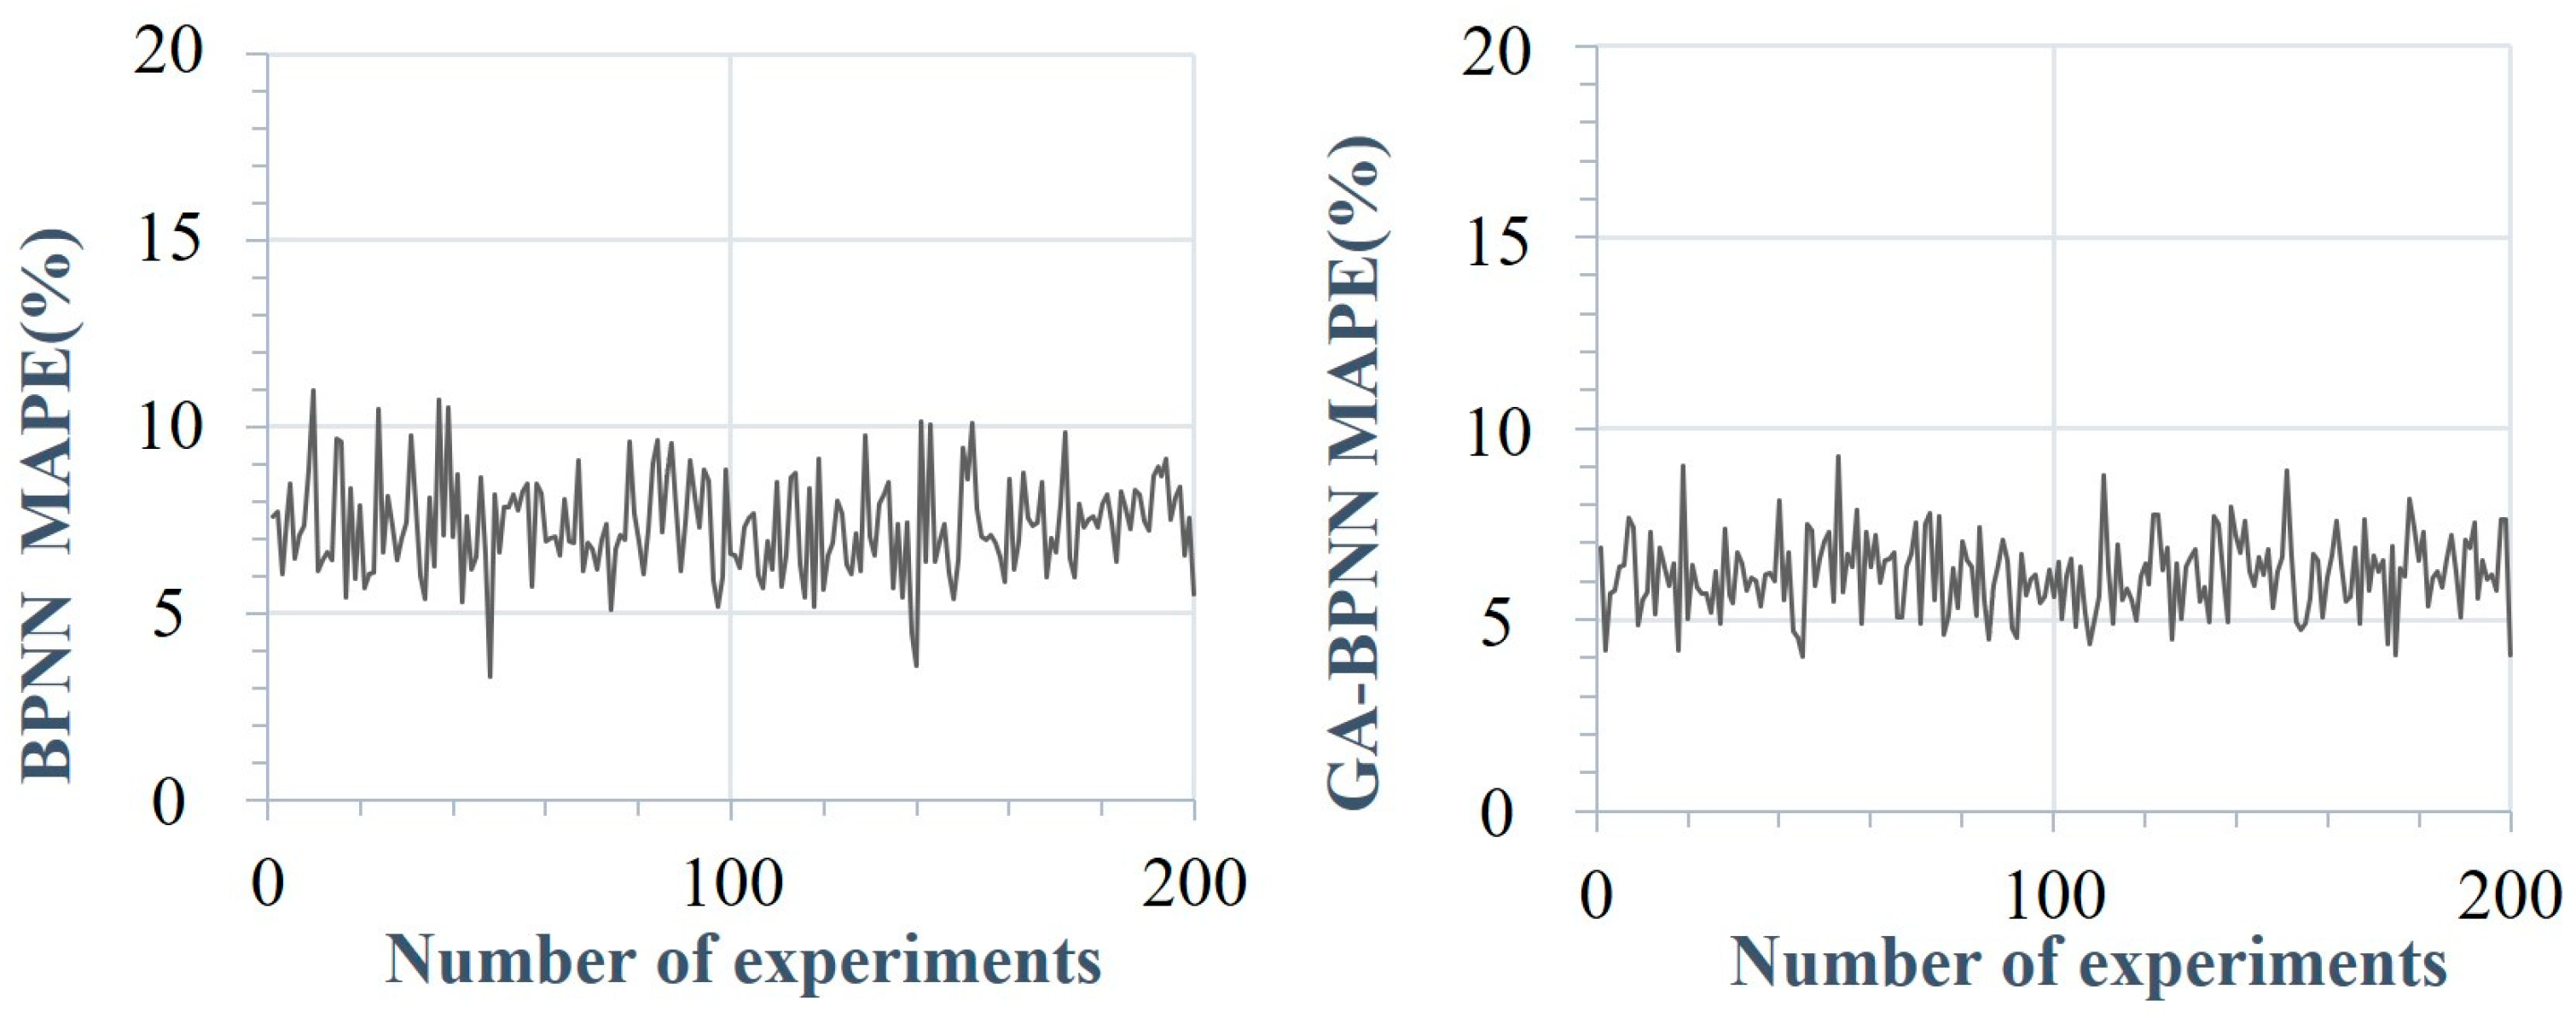
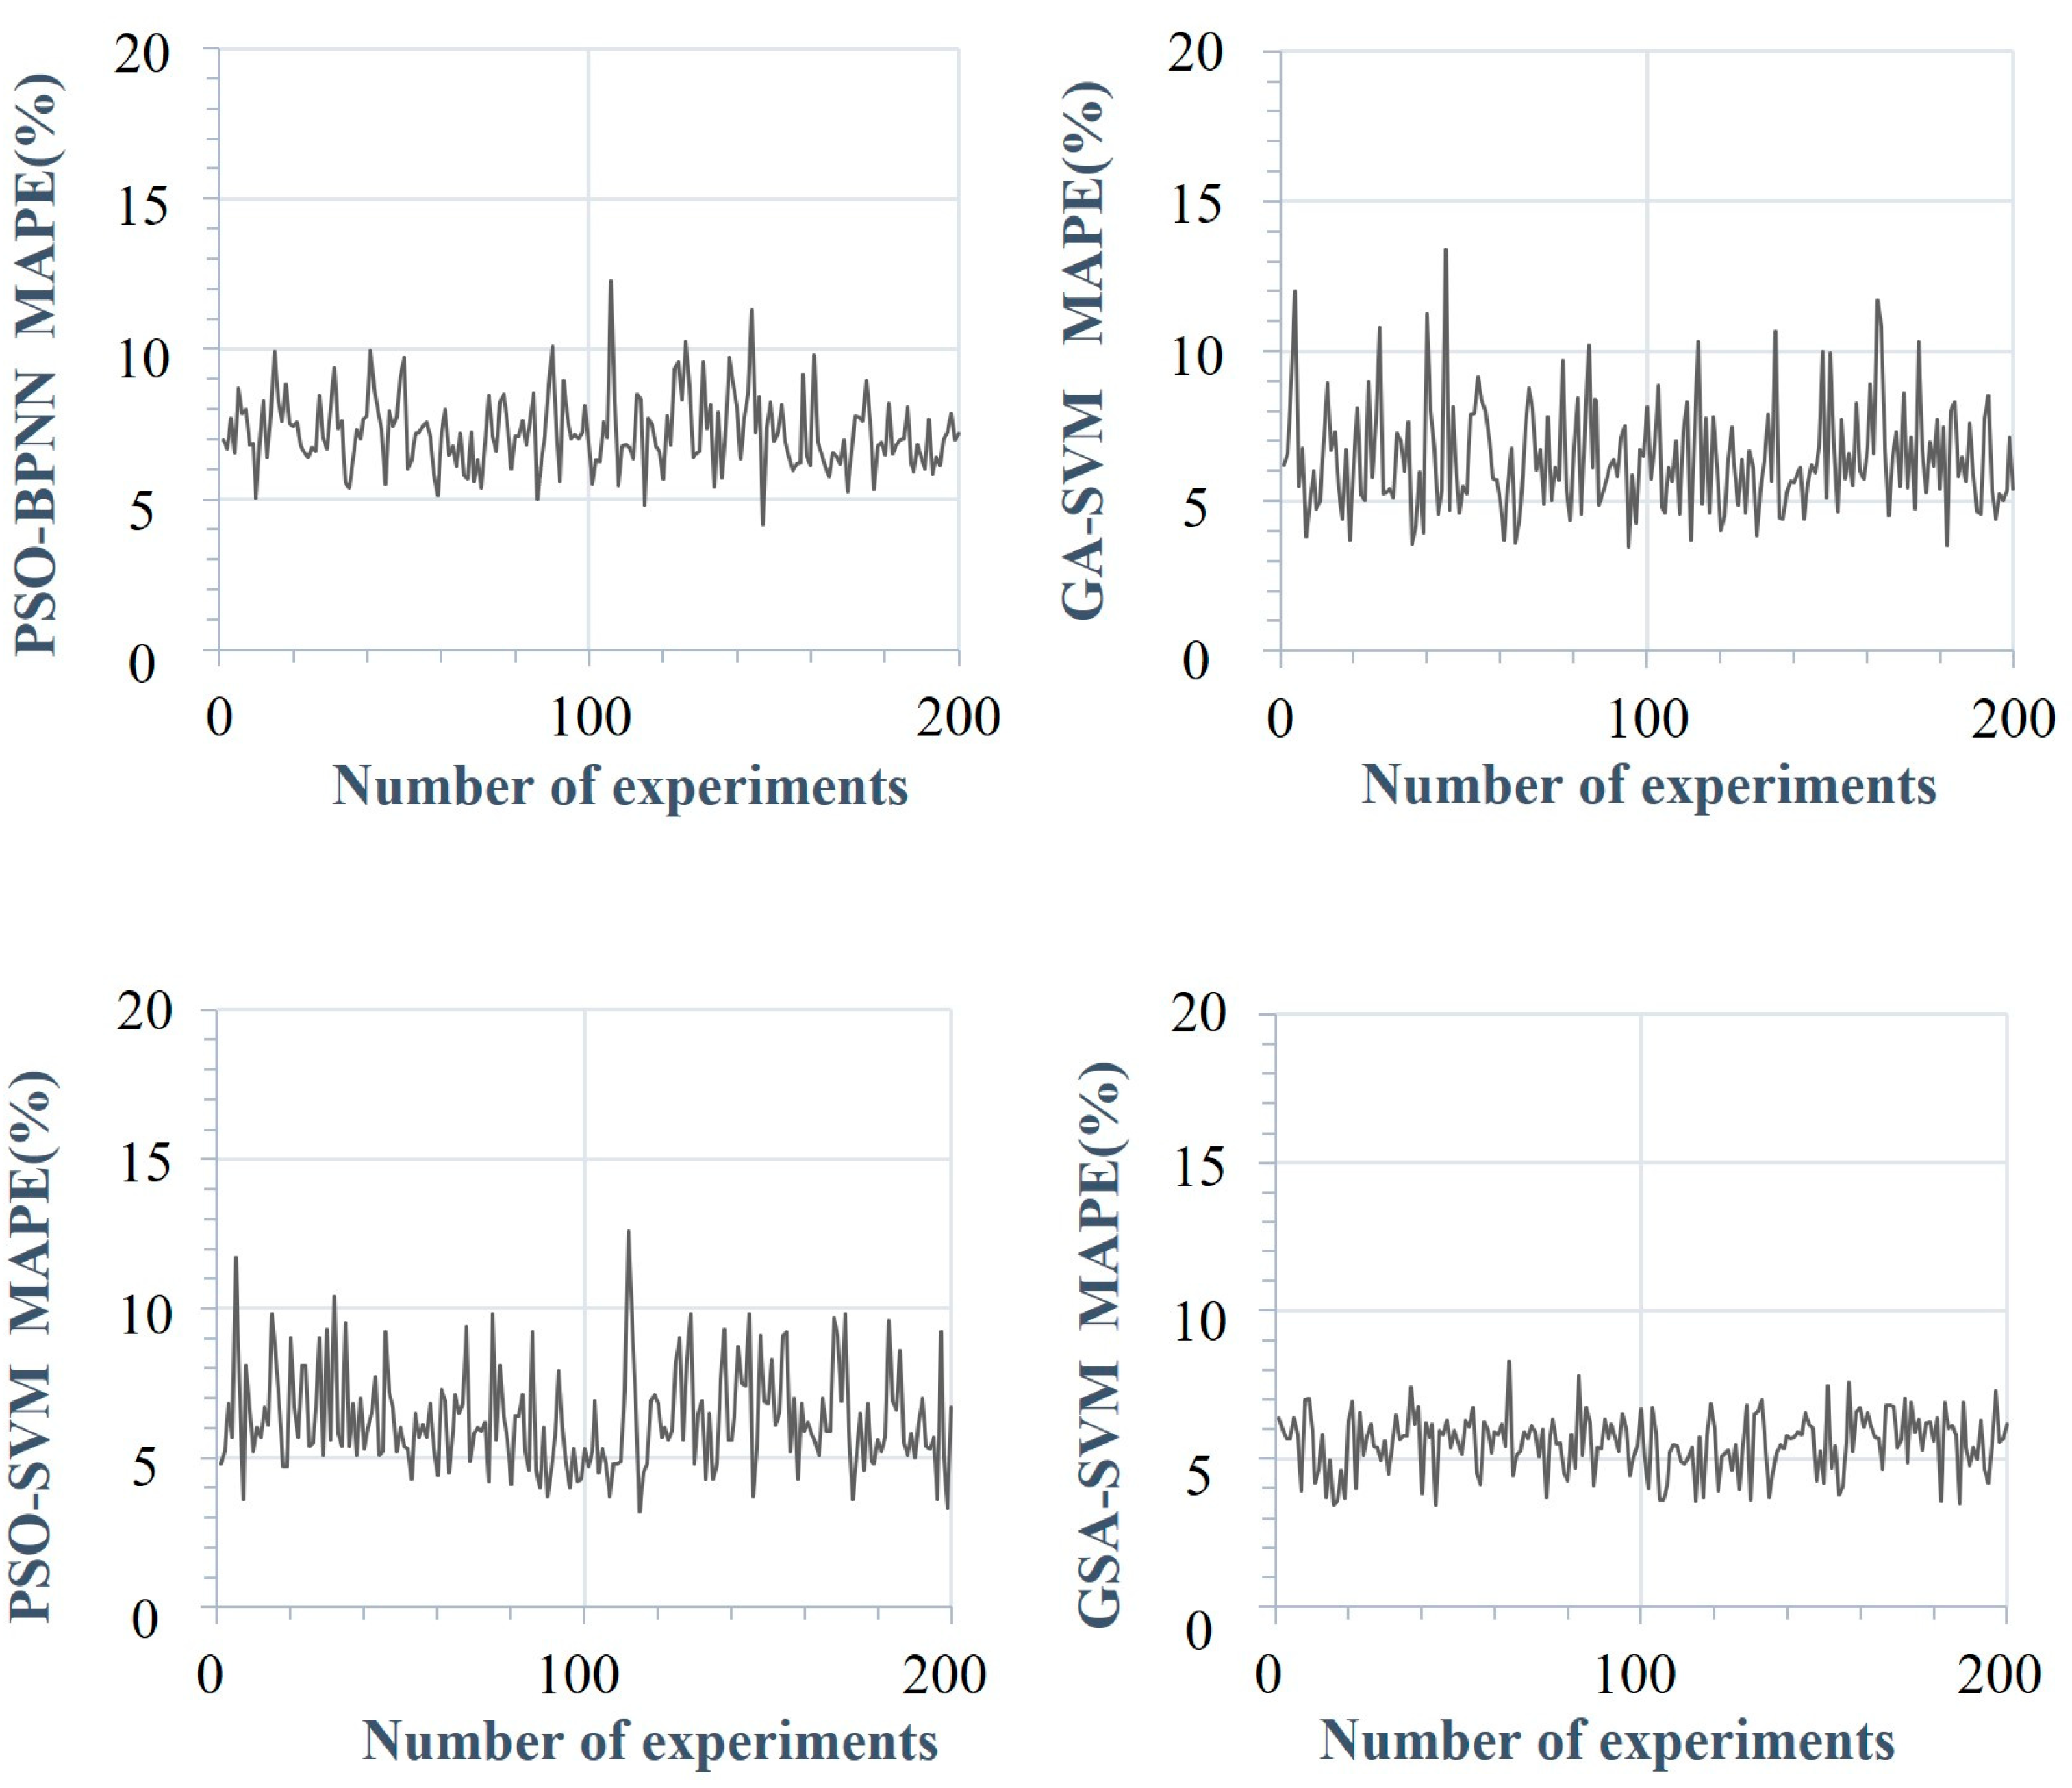
5.3.2. Stability Comparison
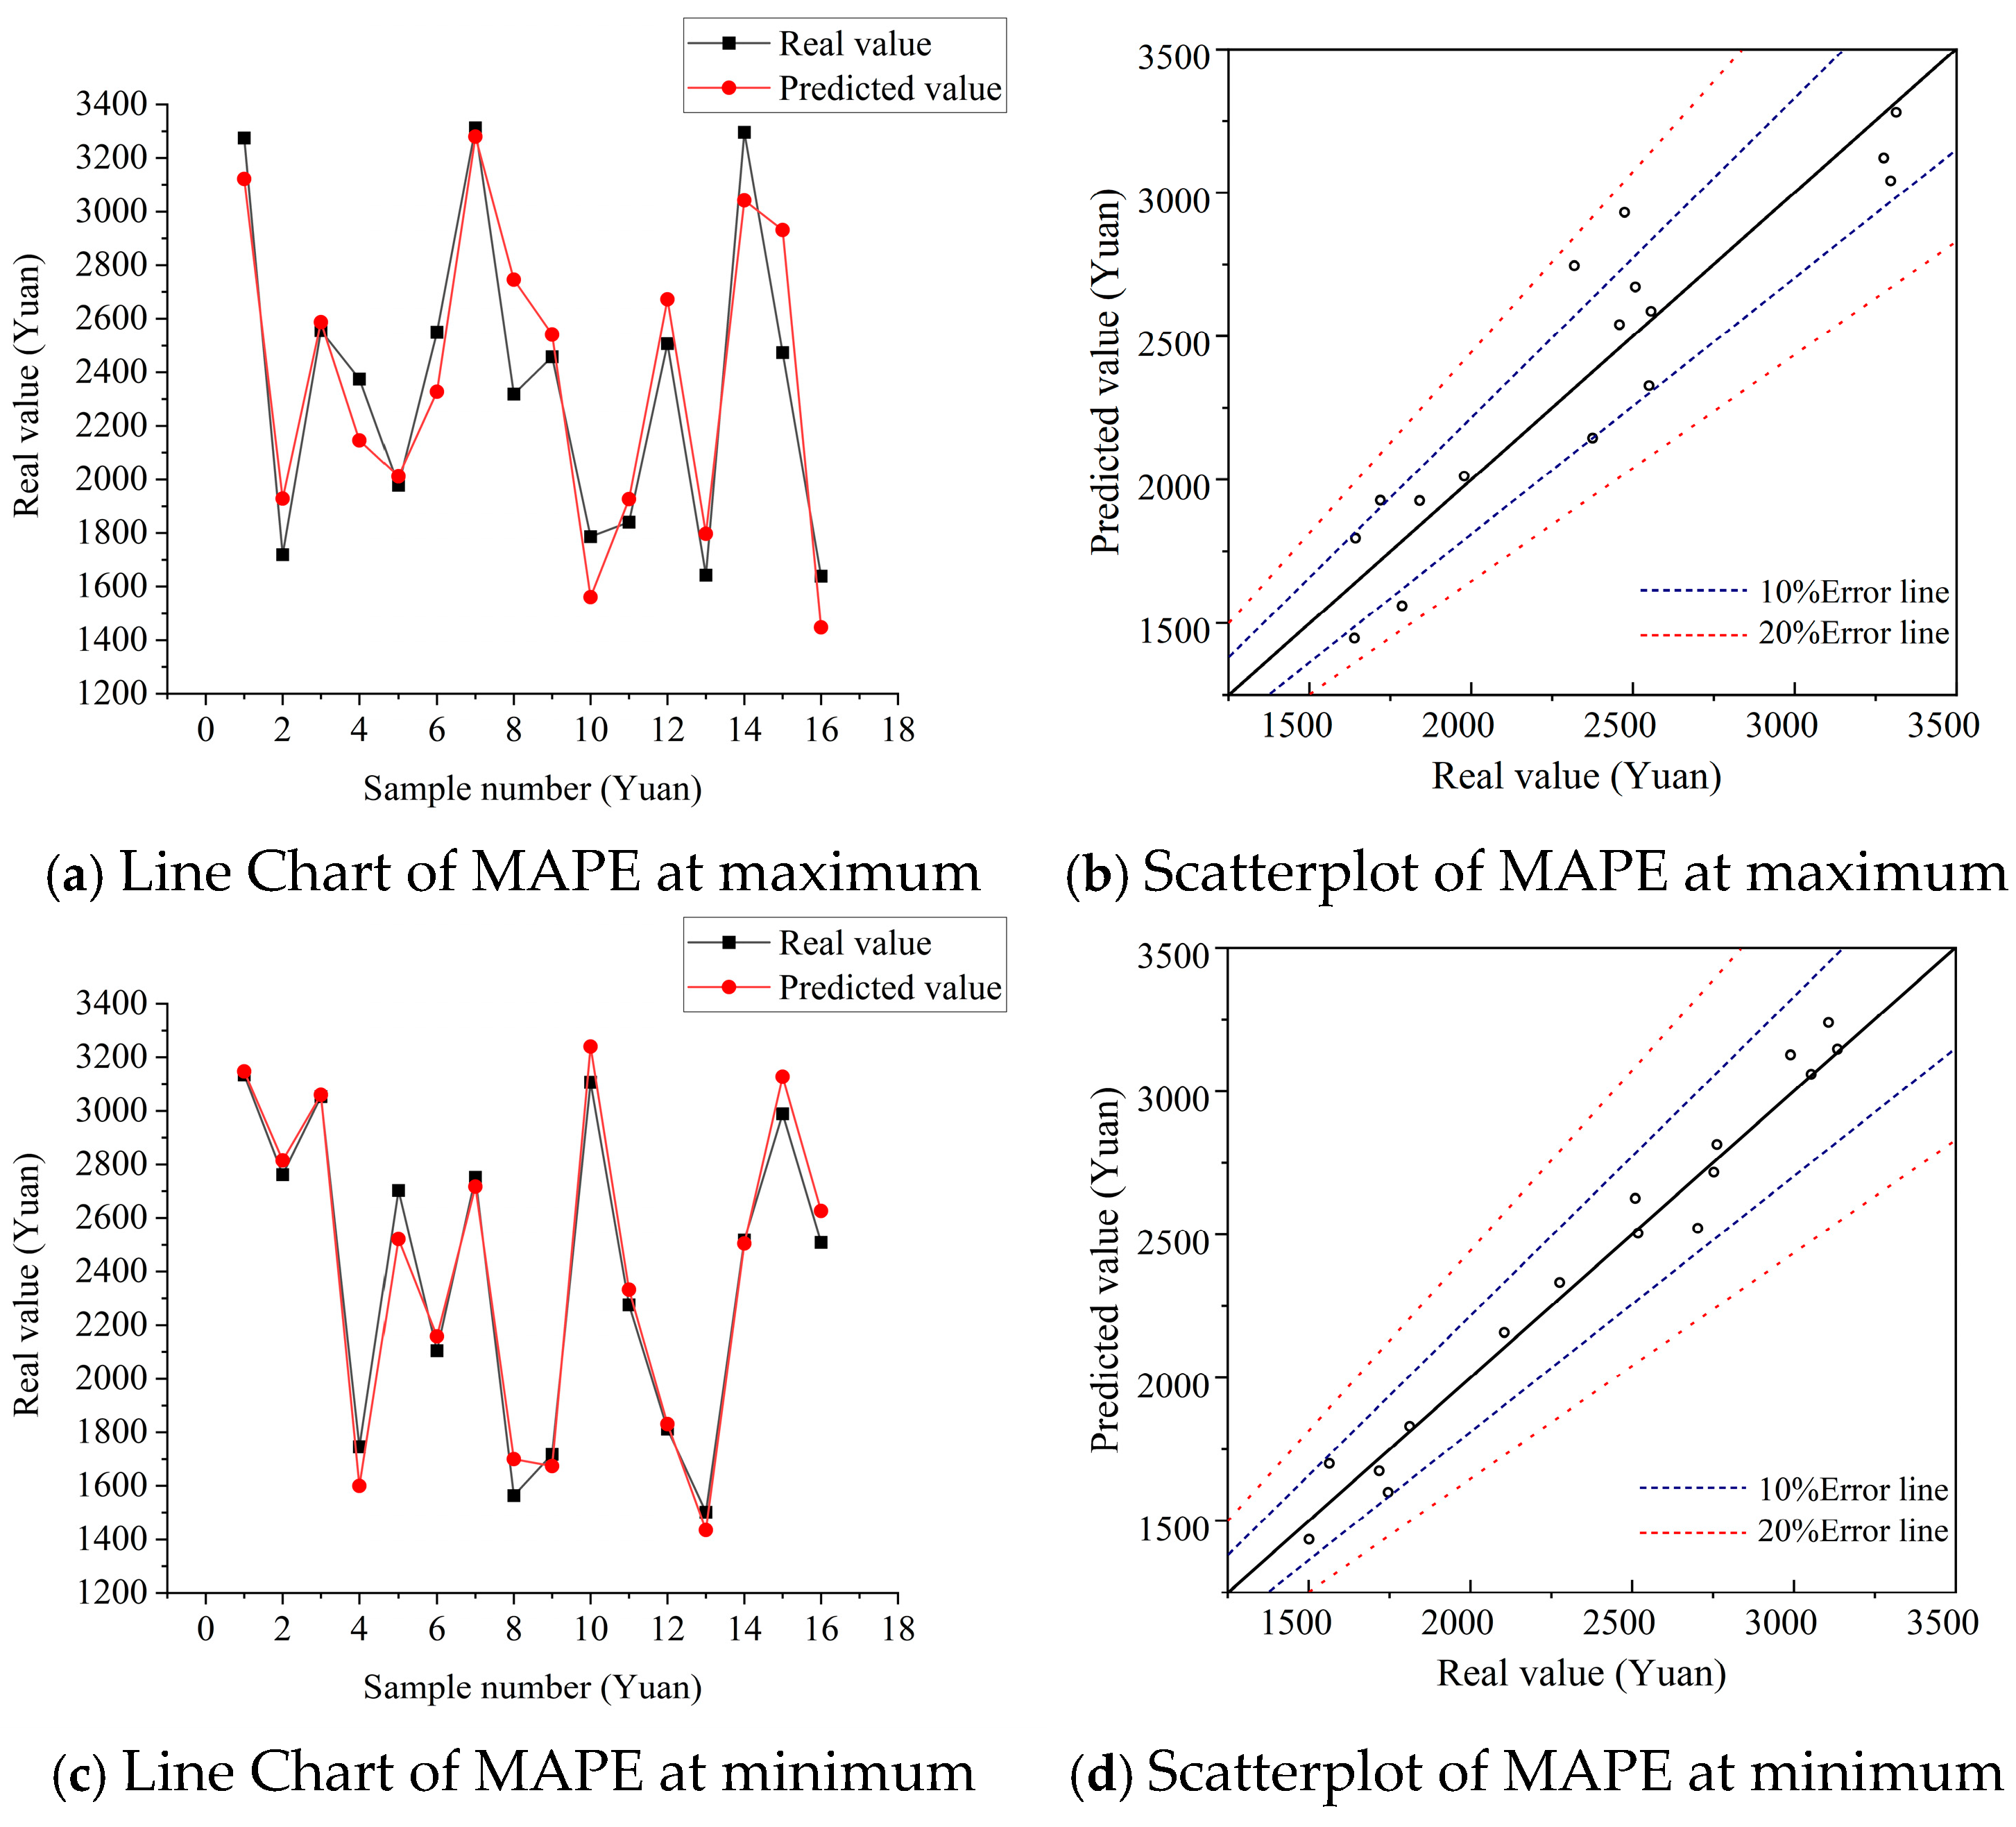
5.3.3. Comparison of Fixed Test Set Results
5.3.4. Time Comparison
6. Conclusions and Prospect
6.1. Conclusions
- (1)
- We constructed a cost estimation indicator system for office buildings and identified key influencing factors for unit costs. Through literature analysis, questionnaire surveys, and other methods, 17 cost estimation indices for office buildings were ultimately identified.
- (2)
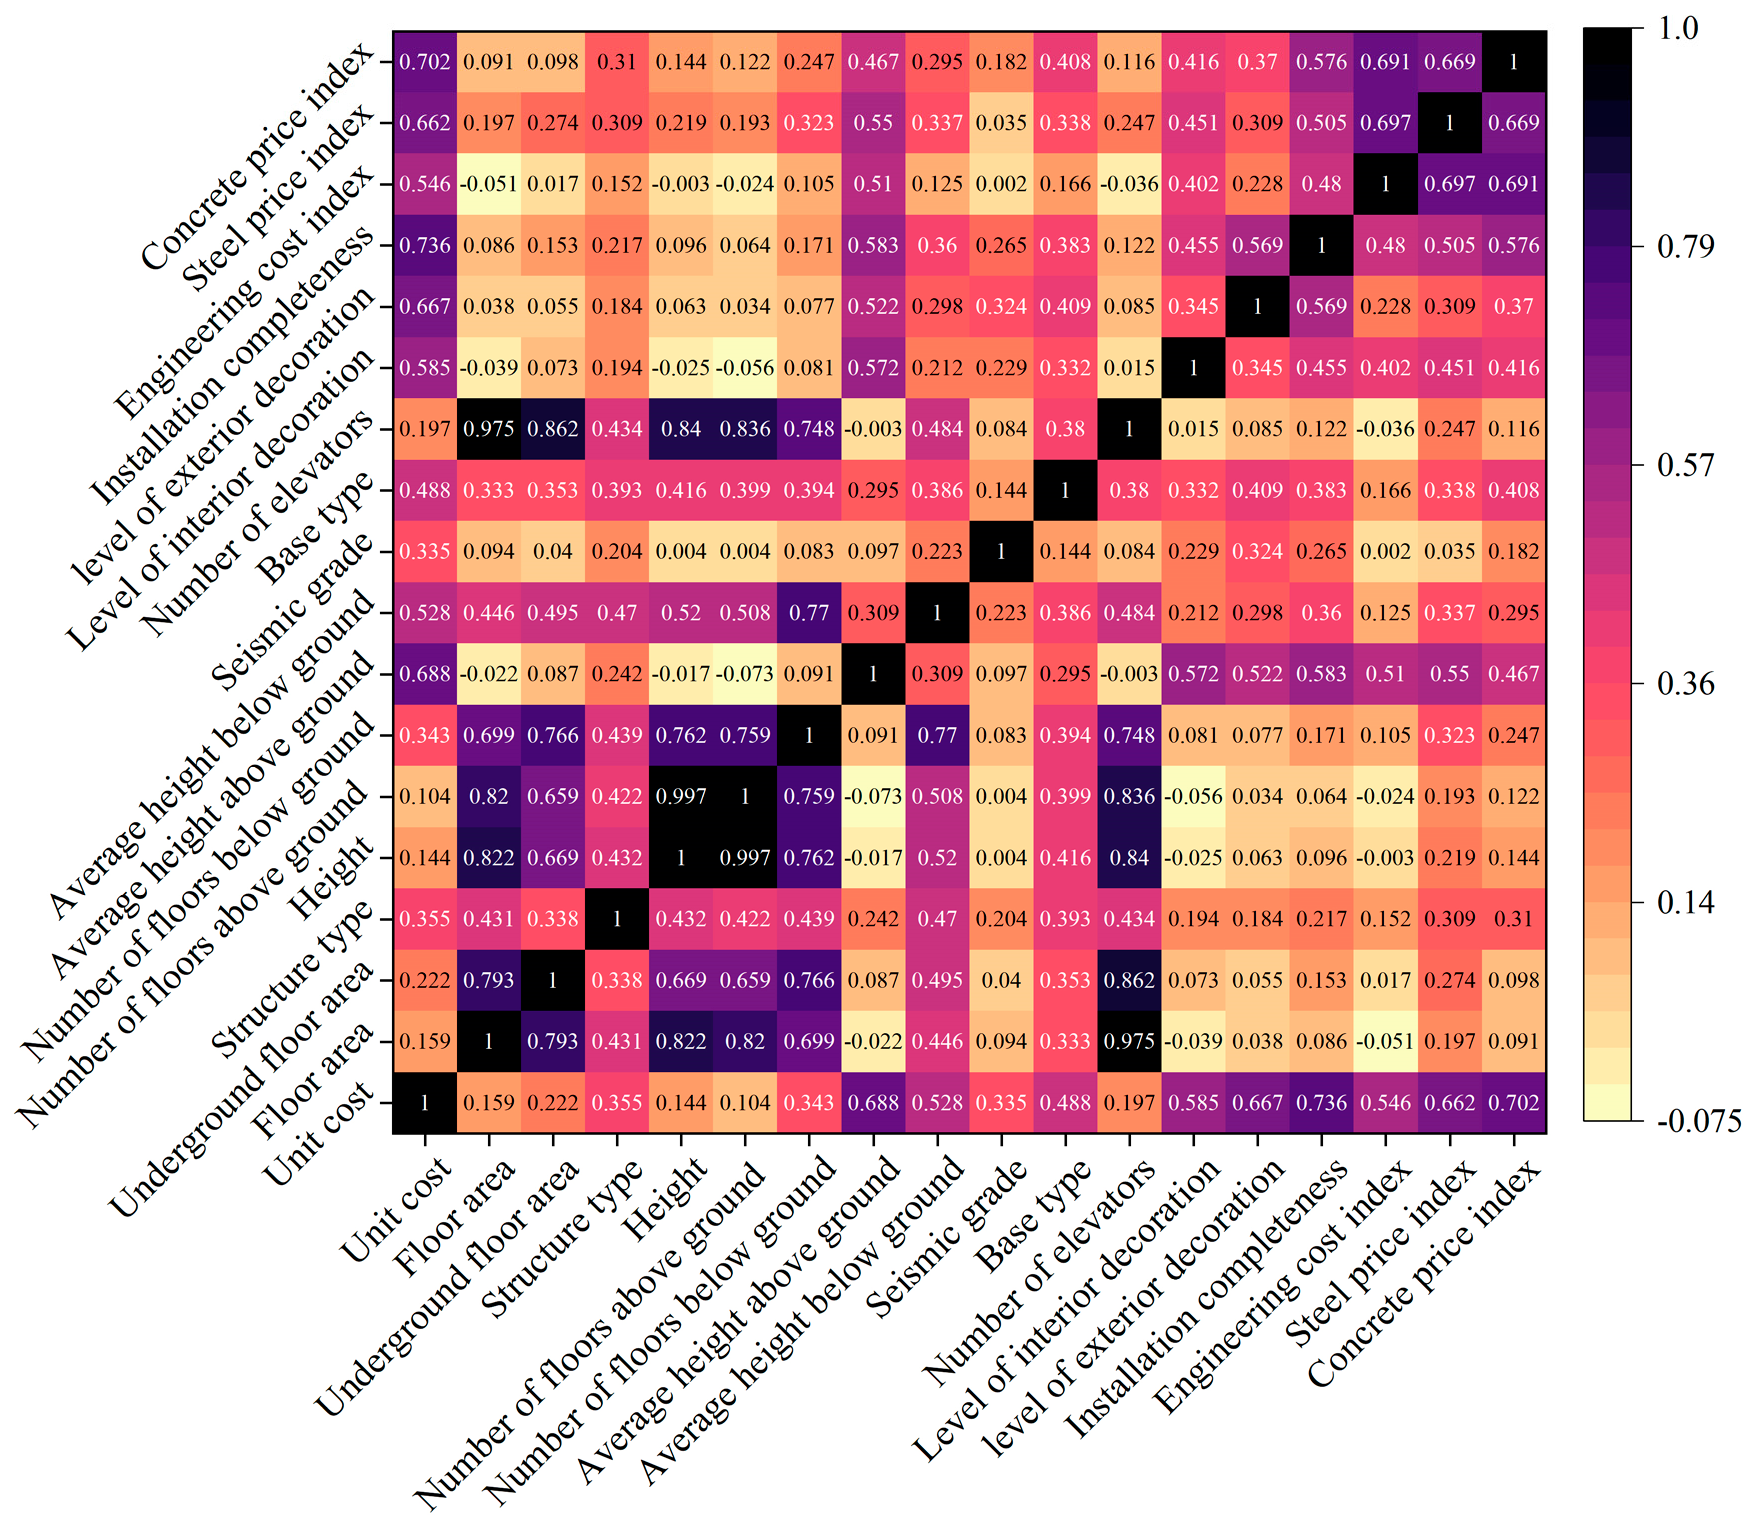
- Through comprehensive analysis of the relevant coefficients and the gray correlation coefficients, it was found that the seven key influencing factors of the unit cost of office building construction are: internal decoration level, external decoration level, installation completeness, average height above ground, engineering cost index, steel price index, and concrete price index.
- (3)
- The utilization of PCA and optimization algorithms enhanced the predictive performance of the construction cost estimation model. When selecting data dimensionality reduction methods in machine learning, caution is required. In the field of construction cost estimation, PCA dimensionality reduction could be prioritized.
- (4)
- An optimized office building cost estimation model based on machine learning was identified in this study. The PCA-GSA-SVM predictive model yielded an average mean squared error of 0.024, a squared correlation coefficient of 0.927, and an average percentage error of 5.52% in experimental trials. Compared to traditional engineering cost estimation methods, this model demonstrates faster speed, higher accuracy, and stronger stability, addressing the limitations of conventional approaches. As a result, the model proposed in this paper provides significant theoretical and practical value for cost estimation during the decision-making stage of office building projects and can serve as a useful reference for other types of buildings as well.
6.2. Limitations and Further Studies
Author Contributions
Funding
Data Availability Statement
Conflicts of Interest
References
- Jin, H.Y.; Shen, L.Y.; Wang, Z. Mapping the Influence of Project Management on Project Cost. Ksce. J. Civ. Eng. 2018, 22, 3183–3195. [Google Scholar] [CrossRef]
- Giel, B.K.; Issa, R.R.A. Return on Investment Analysis of Using Building Information Modeling in Construction. J. Comput. Civil. Eng. 2013, 27, 511–521. [Google Scholar] [CrossRef]
- Yan, X.L.; Zhou, Y.X.; Li, T.; Zhu, F.F. What Drives the Intelligent Construction Development in China? Buildings 2022, 12, 1250. [Google Scholar] [CrossRef]
- Zhao, J.Y.; Cao, Y.Z.; Xiang, Y.Z. Pose estimation method for construction machine based on improved AlphaPose model. Eng. Constr. Archit. Manag. 2024, 31, 976–996. [Google Scholar] [CrossRef]
- Li, Z.J.; Peng, S.H.; Cai, W.G.; Cao, S.P.; Wang, X.; Li, R.; Ma, X.R. Impacts of Building Microenvironment on Energy Consumption in Office Buildings: Empirical Evidence from the Government Office Buildings in Guangdong Province, China. Buildings 2023, 13, 481. [Google Scholar] [CrossRef]
- Jiang, Y.Z.; Guo, S.; Xia, J.; Wei, Q.; Zheng, W.; Zhang, Y.; Yin, S.; Fang, H.; Deng, J. 2020 Annual Report on China Building Energy Efficiency; China Architecture & Building Press: Beijing, China, 2020. [Google Scholar]
- Zuo, J.; Xia, B.; Chen, Q.; Pullen, S.; Skitmore, M. Green building rating for office buildings–Lessons learned. J. Green. Build. 2016, 11, 131–146. [Google Scholar] [CrossRef]
- Kouskoulas, V.; Abutouq, G. An influence matrix for project expediting. Eur. J. Oper. Res. 1989, 43, 284–291. [Google Scholar] [CrossRef]
- Wall, D.M. Distributions and correlations in Monte Carlo simulation. Constr. Manag. Econ. 1997, 15, 241–258. [Google Scholar] [CrossRef]
- Wei, L. Design of Sustainable Construction Cost Estimation System Based on Grey Theory—BP Model. J. Inf. Knowl. Manag. 2024, 23, 2450011. [Google Scholar] [CrossRef]
- Hwang, S. Time series models for forecasting construction costs using time series indexes. J. Constr. Eng. Manag. 2011, 137, 656–662. [Google Scholar] [CrossRef]
- Zhao, L.; Mbachu, J.; Zhang, H. Forecasting residential building costs in New Zealand using a univariate approach. Int. J. Eng. Bus. Manag. 2019, 11, 1847979019880061. [Google Scholar] [CrossRef]
- Alshamrani, O.S. Initial cost forecasting model of mid-rise green office buildings. J. Asian Archit. Build. Eng. 2020, 19, 613–625. [Google Scholar] [CrossRef]
- Dobrucali, E.; Demir, I.H. A simple formulation for early-stage cost estimation of building construction projects. Gradevinar 2021, 73, 819–832. [Google Scholar] [CrossRef]
- Kasmire, J.; Zhao, A.R. Discovering the Arrow of Time in Machine Learning. Information 2021, 12, 439. [Google Scholar] [CrossRef]
- Gurmu, A.; Miri, M.P. Machine learning regression for estimating the cost range of building projects. Constr. Innov. 2025, 25, 577–593. [Google Scholar] [CrossRef]
- Pham, T.Q.D.; Le-Hong, T.; Tran, X.V. Efficient estimation and optimization of building costs using machine learning. Int. J. Constr. Manag. 2023, 23, 909–921. [Google Scholar] [CrossRef]
- Devyatkin, D.; Otmakhova, Y. Methods for Mid-Term Forecasting of Crop Export and Production. Appl. Sci. 2021, 11, 10973. [Google Scholar] [CrossRef]
- Szoplik, J. Forecasting of natural gas consumption with artificial neural networks. Energy 2015, 85, 208–220. [Google Scholar] [CrossRef]
- Xiong, Y.; Ming, Y.; Liao, X.H.; Xiong, C.Y.; Wen, W.; Xiong, Z.W.; Li, L.; Sun, L.P.; Zhou, Q.P.; Zou, Y.X.; et al. Cost prediction on fabricated substation considering support vector machine via optimized quantum particle swarm optimization. Therm. Sci. 2020, 24, 2773–2780. [Google Scholar] [CrossRef]
- Zhang, S.H.; Wang, C.; Liao, P.; Xiao, L.; Fu, T.L. Wind speed forecasting based on model selection, fuzzy cluster, and multi-objective algorithm and wind energy simulation by Betz’s theory. Expert. Syst. Appl. 2022, 193, 116509. [Google Scholar] [CrossRef]
- Chen, C.C.; Zhang, Q.; Kashani, M.H.; Jun, C.; Bateni, S.M.; Band, S.S.; Dash, S.S.; Chau, K.W. Forecast of rainfall distribution based on fixed sliding window long short-term memory. Eng. Appl. Comp. Fluid. 2022, 16, 248–261. [Google Scholar] [CrossRef]
- Stulajter, F. Predictions in time series using multivariate regression models. J. Time. Ser. Anal. 2001, 22, 365–373. [Google Scholar] [CrossRef]
- Dursun, O.; Stoy, C. Conceptual Estimation of Construction Costs Using the Multistep Ahead Approach. J. Constr. Eng. Manag. 2016, 142, 04016038. [Google Scholar] [CrossRef]
- Leśniak, A.; Górka, M. Pre-design cost modeling of facade systems using the GAM method. Arch. Civ. Eng. 2021, 67, 123–138. [Google Scholar] [CrossRef]
- Jin, R.; Cho, K.; Hyun, C.; Son, M. MRA-based revised CBR model for cost prediction in the early stage of construction projects. Expert. Syst. Appl. 2012, 39, 5214–5222. [Google Scholar] [CrossRef]
- Juszczyk, M.; Lesniak, A. Modelling Construction Site Cost Index Based on Neural Network Ensembles. Symmetry 2019, 11, 411. [Google Scholar] [CrossRef]
- Dong, J.C.; Chen, Y.; Guan, G. Cost Index Predictions for Construction Engineering Based on LSTM Neural Networks. Adv. Civ. Eng. 2020, 2020, 1–14. [Google Scholar] [CrossRef]
- Pessoa, A.; Sousa, G.; Furtado Maués, L.M.; Campos Alvarenga, F.; Santos, D.d.G. Cost Forecasting of Public Construction Projects Using Multilayer Perceptron Artificial Neural Networks: A Case Study. Ing. E Investig. 2021, 41, 3. [Google Scholar] [CrossRef]
- Sitthikankun, S.; Rinchumphu, D.; Buachart, C.; Pacharawongsakda, E. Construction cost estimation for government building using Artificial Neural Network. Int. Trans. J. Eng. Manag. 2021, 12, 1–12. [Google Scholar] [CrossRef]
- Zhang, Y.; Fang, S.T. RSVRs based on Feature Extraction: A Novel Method for Prediction of Construction Projects’ Costs. Ksce. J. Civ. Eng. 2019, 23, 1436–1441. [Google Scholar] [CrossRef]
- Fan, M.; Sharma, A. Design and implementation of construction cost prediction model based on svm and lssvm in industries 4.0. Int. J. Intell. Comput. 2021, 14, 145–157. [Google Scholar] [CrossRef]
- Khalaf, T.Z.; Caglar, H.; Caglar, A.; Hanoon, A.N. Particle Swarm Optimization Based Approach for Estimation of Costs and Duration of Construction Projects. Civ. Eng. J. 2020, 6, 384–401. [Google Scholar] [CrossRef]
- Shin, Y. Application of Boosting Regression Trees to Preliminary Cost Estimation in Building Construction Projects. Comput. Intel. Neurosc. 2015, 2015, 149702. [Google Scholar] [CrossRef] [PubMed]
- Son, H.; Kim, C. Early prediction of the performance of green building projects using pre-project planning variables: Data mining approaches. J. Clean. Prod. 2015, 109, 144–151. [Google Scholar] [CrossRef]
- Vapnik, V. Estimation of Dependences Based on Empirical Data; Springer Science & Business Media: Berlin, Germany, 2006. [Google Scholar]
- Huang, W.; Liu, H.; Zhang, Y.; Mi, R.; Tong, C.; Xiao, W.; Shuai, B. Railway dangerous goods transportation system risk identification: Comparisons among SVM, PSO-SVM, GA-SVM and GS-SVM. Appl. Soft. Comput. 2021, 109, 107541. [Google Scholar] [CrossRef]
- Kavitha, M.; Nirmala, P. Analysis and Comparison of SVM-RBF Algorithms for Colorectal Cancer Detection over Convolutional Neural Networks with Improved Accuracy. J. Pharm. Negat. Result 2022, 13, 94–103. [Google Scholar] [CrossRef]
- Yang, S.; Tong, C. Cognitive spectrum sensing algorithm based on an RBF neural network and machine learning. Neural. Comput. Appl. 2023, 35, 25045–25055. [Google Scholar] [CrossRef]
- Yu, R.; Abdel-Aty, M. Utilizing support vector machine in real-time crash risk evaluation. Accident. Anal. Prev. 2013, 51, 252–259. [Google Scholar] [CrossRef]
- Cheng, P.; Chen, D.; Wang, J. Research on underwear pressure prediction based on improved GA-BP algorithm. Int. J. Cloth. Sci. Technol. 2021, 33, 619–642. [Google Scholar] [CrossRef]
- Li, X.; Wang, C.; Li, C.; Yong, C.; Luo, Y.; Jiang, S.J.A.o. Mining Technology Evaluation for Steep Coal Seams Based on a GA-BP Neural Network. ACS Omega 2024, 9, 25309–25321. [Google Scholar] [CrossRef]
- Ozcan, E.; Mohan, C.K. Particle swarm optimization: Surfing the waves. In Proceedings of the 1999 Congress on Evolutionary Computation-CEC99 (Cat. No. 99TH8406), Washington, DC, USA, 6–9 July 1999; pp. 1939–1944. [Google Scholar] [CrossRef]
- Shi, Y.; Eberhart, R.C. Empirical study of particle swarm optimization. In Proceedings of the 1999 Congress on Evolutionary Computation-CEC99 (Cat. No. 99TH8406), Washington, DC, USA, 6–9 July 1999; pp. 1945–1950. [Google Scholar] [CrossRef]
- Lin, Z.; Fan, Y.; Tan, J.; Li, Z.; Yang, P.; Wang, H.; Duan, W.J.S.R. Tool wear prediction based on XGBoost feature selection combined with PSO-BP network. Sci. Rep. 2025, 15, 3096. [Google Scholar] [CrossRef] [PubMed]
- Zhang, P.; Shu, S.; Zhou, M. An online fault detection model and strategies based on SVM-grid in clouds. IEEE/CAA J. Autom. Sin. 2018, 5, 445–456. [Google Scholar] [CrossRef]
- Li, C.S.; An, X.L.; Li, R.H. A chaos embedded GSA-SVM hybrid system for classification. Neural Comput. Appl. 2015, 26, 713–721. [Google Scholar] [CrossRef]
- Markovic, L.; Atanaskovic, P.; Markovic, L.M.; Sajfert, D.; Stankovic, M. Investment decision management: Prediction of the cost and period of commercial building construction using artificial neural network. Tech. Technol. Educ. Manag. 2011, 6, 1301–1312. [Google Scholar] [CrossRef]
- Wang, X.-j. Forecasting construction project cost based on BP neural network. In Proceedings of the 2018 10th International Conference on Measuring Technology and Mechatronics Automation (ICMTMA), Changsha, China, 10–11 February 2018; pp. 420–423. [Google Scholar] [CrossRef]
- Fang, S.; Zhao, T.; Zhang, Y. Prediction of construction projects’ costs based on fusion method. Eng. Comput. 2017, 34, 2396–2408. [Google Scholar] [CrossRef]
- Alshamrani, O.S. Construction cost prediction model for conventional and sustainable college buildings in North America. J. Taibah. Univ. Sci. 2017, 11, 315–323. [Google Scholar] [CrossRef]
- Yan, H.Y.; He, Z.; Gao, C.; Xie, M.J.; Sheng, H.Y.; Chen, H.H. Investment estimation of prefabricated concrete buildings based on XGBoost machine learning algorithm. Adv. Eng. Inform. 2022, 54, 101789. [Google Scholar] [CrossRef]
- Zhou, Z.-H. Machine Learning; Springer Nature: Berlin, Germany, 2021. [Google Scholar]
- LeCun, Y.; Bengio, Y.; Hinton, G. Deep learning. Nature 2015, 521, 436–444. [Google Scholar] [CrossRef]

| Serial Number | Indicator | Unit | Serial Number | Indicator | Unit |
|---|---|---|---|---|---|
| X1 | Floor area | m2 | X10 | Base type | - |
| X2 | Underground floor area | m2 | X11 | Number of elevators | set |
| X3 | Structure type | - | X12 | Internal decoration Level | - |
| X4 | Height | m | X13 | External decoration level | - |
| X5 | Number of floors above ground | floor | X14 | Installation completeness | - |
| X6 | Number of floors below ground | floor | X15 | Engineering cost index | - |
| X7 | Average height above ground | m | X16 | Steel price index | - |
| X8 | Average height below ground | m | X17 | Concrete price index | - |
| X9 | Seismic grade | grade |
| Serial Number | Indicator | Correlation Coefficient | Serial Number | Indicator | Correlation Coefficient |
|---|---|---|---|---|---|
| X17 | Concrete price index | 0.890 | X3 | Structure type | 0.836 |
| X14 | Installation completeness | 0.883 | X8 | Average height below ground | 0.661 |
| X16 | Steel price index | 0.881 | X4 | Height | 0.656 |
| X7 | Average height above ground | 0.862 | X5 | Number of floors above ground | 0.653 |
| X12 | Internal decoration Level | 0.855 | X6 | Number of floors below ground | 0.629 |
| X15 | Engineering cost index | 0.855 | X11 | Number of elevators | 0.606 |
| X10 | Base type | 0.850 | X1 | Floor area | 0.600 |
| X9 | Seismic grade | 0.847 | X2 | Underground floor area | 0.561 |
| X13 | External decoration level | 0.838 |
| Prediction Model | Raw Data | PCA | GRA | |||
|---|---|---|---|---|---|---|
| R2 | MAPE | R2 | MAPE | R2 | MAPE | |
| BPNN | 0.846 | 7.73% | 0.855 | 7.35% | 0.836 | 7.67% |
| GA-BPNN | 0.874 | 6.65% | 0.899 | 6.19% | 0.877 | 6.57% |
| PSO-BPNN | 0.853 | 7.71% | 0.861 | 7.23% | 0.833 | 7.63% |
| GA-SVM | 0.885 | 6.75% | 0.888 | 6.42% | 0.867 | 6.99% |
| PSO-SVM | 0.882 | 6.57% | 0.892 | 6.29% | 0.847 | 6.82% |
| GSA-SVM | 0.902 | 5.94% | 0.927 | 5.52% | 0.893 | 6.23% |
| Prediction Model | Range of MAPE Fluctuations |
|---|---|
| BPNN | [3.32%, 10.98%] |
| GA-BPNN | [4.02%, 9.28%] |
| PSO-BPNN | [4.16%, 12.27%] |
| GA-SVM | [3.47%, 13.38%] |
| PSO-SVM | [3.19%, 12.63%] |
| GSA-SVM | [3.42%, 8.26%] |
| Sample Number | Prediction Error Mean at Highest (MAPE = 8.26%) | Prediction Error Mean at Lowest (MAPE = 3.42%) | ||||
|---|---|---|---|---|---|---|
| Real Value | Predicted Value | Error Rate | Real Value | Predicted Value | Error Rate | |
| 1 | 3274.99 | 3121.76 | −4.68% | 3133.99 | 3147.48 | 0.43% |
| 2 | 1719.34 | 1928.21 | 12.15% | 2761.87 | 2814.62 | 1.91% |
| 3 | 2555.61 | 2587.22 | 1.24% | 3053.02 | 3059.97 | 0.23% |
| 4 | 2374.80 | 2145.73 | −9.65% | 1745.66 | 1599.38 | −8.38% |
| 5 | 1978.45 | 2012.05 | 1.70% | 2702.58 | 2521.83 | −6.69% |
| 6 | 2549.52 | 2327.57 | −8.71% | 2104.47 | 2157.80 | 2.53% |
| 7 | 3313.10 | 3280.04 | −1.00% | 2752.24 | 2717.08 | −1.28% |
| 8 | 2318.60 | 2745.94 | 18.43% | 1563.76 | 1700.06 | 8.72% |
| 9 | 2457.91 | 2541.17 | 3.39% | 1718.03 | 1673.89 | −2.57% |
| 10 | 1786.14 | 1560.63 | −12.63% | 3106.52 | 3239.94 | 4.29% |
| 11 | 1840.65 | 1926.69 | 4.67% | 2275.81 | 2332.46 | 2.49% |
| 12 | 2507.18 | 2672.30 | 6.59% | 1812.13 | 1830.36 | 1.01% |
| 13 | 1642.32 | 1796.69 | 9.40% | 1501.20 | 1435.32 | −4.39% |
| 14 | 3296.30 | 3041.86 | −7.72% | 2517.75 | 2504.51 | −0.53% |
| 15 | 2473.80 | 2931.32 | 18.49% | 2989.15 | 3127.56 | 4.63% |
| 16 | 1638.89 | 1447.54 | −11.68% | 2509.37 | 2626.13 | 4.65% |
| BPNN | GA-BPNN | PSO-BPNN | GA-SVM | PSO-SVM | GSA-SVM | |
|---|---|---|---|---|---|---|
| Single Prediction Time | 2.036 s | 114.756 s | 154.427 s | 2.072 s | 3.331 s | 16.861 s |
Disclaimer/Publisher’s Note: The statements, opinions and data contained in all publications are solely those of the individual author(s) and contributor(s) and not of MDPI and/or the editor(s). MDPI and/or the editor(s) disclaim responsibility for any injury to people or property resulting from any ideas, methods, instructions or products referred to in the content. |
© 2025 by the authors. Licensee MDPI, Basel, Switzerland. This article is an open access article distributed under the terms and conditions of the Creative Commons Attribution (CC BY) license (https://creativecommons.org/licenses/by/4.0/).
Share and Cite
Chen, G.; Zheng, S.; He, X.; Liang, X.; Liao, X. Machine Learning-Based Cost Estimation Models for Office Buildings. Buildings 2025, 15, 1802. https://doi.org/10.3390/buildings15111802
Chen G, Zheng S, He X, Liang X, Liao X. Machine Learning-Based Cost Estimation Models for Office Buildings. Buildings. 2025; 15(11):1802. https://doi.org/10.3390/buildings15111802
Chicago/Turabian StyleChen, Guolong, Simin Zheng, Xiaorui He, Xian Liang, and Xiaohui Liao. 2025. "Machine Learning-Based Cost Estimation Models for Office Buildings" Buildings 15, no. 11: 1802. https://doi.org/10.3390/buildings15111802
APA StyleChen, G., Zheng, S., He, X., Liang, X., & Liao, X. (2025). Machine Learning-Based Cost Estimation Models for Office Buildings. Buildings, 15(11), 1802. https://doi.org/10.3390/buildings15111802


