1. Introduction
The conflict between pollutant control and ventilation energy consumption in industrial buildings is particularly acute in cold regions, where industrial equipment and personnel generate large quantities of pollutants during their work. An experimental study by Nina Szczepanik-Scislo et al. [
1] monitored the effects of radioactive radon gas (Rn-222), carbon dioxide (CO₂), and thermal comfort parameters in a typical office environment (temperature and humidity), revealing the significant effect of indoor personnel activities on the accumulation of pollutants. Indoor air purifiers have been emphasized as a method that can improve indoor air quality, especially in more polluted buildings, such as industrial buildings. Still, for industrial buildings, which are larger and have more complex pollutants, the efficiency of air purifiers is substandard and produces ozone gas problems [
2]. Although the use of natural ventilation in the case of good outdoor air quality can provide relatively good air quality, in the winter, for buildings such as industrial plants, which require heating, it causes high energy consumption. Therefore, the method of mechanical ventilation, on the other hand, is currently the main method used to maintain indoor air quality and thermal comfort in most buildings located in cold regions.
Although the use of mechanical ventilation can significantly improve indoor air quality, industrial buildings have a higher demand for fresh air supply for HVAC systems due to their large space volume and the characteristics of internal pollution sources. In cold regions with persistent low temperatures in the winter, the heat exchanger of the air-conditioning system is very susceptible to freezing. The same problem is prevalent in hospitals, laboratories, and other places that require a large amount of fresh air exchange, which may result in significant economic losses. Current research mainly focuses on CFD simulation and theoretical analysis of heat exchanger tube freezing mechanisms, and the representative results include the following: M. Sugawara et al. [
3] used PHOENICS code for numerical analysis and found that the beginning of freezing depends largely on the airflow temperature, velocity, and initial temperature of the water, but the rate of freezing after the beginning of freezing depends on the temperature and velocity of the airflow and is not sensitive to the water’s initial temperature. M. Tago et al. [
4] investigated the effect of adiabatic insulation on pipe freezing. Wang et al. [
5] proposed an air-cooled heat exchange anti-freezing prediction model, based on which the effects of the ambient temperature, airflow velocity, inlet temperature, and airflow pattern on the freezing characteristics were analyzed. However, these studies are often based on idealized assumptions and fail to fully consider the actual operating variables, such as equipment aging and environmental fluctuations, resulting in significant deviations between simulation results and actual performance.
The optimization of anti-freezing measures requires synergistic improvement of heat exchanger design and system operating parameters. There are many heat exchanger anti-freezing measures available worldwide, such as preheating outdoor air to prevent internal freezing of the heat exchanger, preventing internal freezing of the heat exchanger by using a bypass air circuit, and using an air-conditioning system defrosting mode to prevent defrosting of the heat exchanger surface. For the problem of internal heat exchanger freezing, Marek Jaszczur et al. [
6] applied different ratios of fresh air to exhaust air using warm air to heat the surface of the heat exchanger. The analyzed system showed a significant decrease in system efficiency under unfavorable winter conditions. The results indicated that this type of solution should not be applied. Chen et al. [
7] analyzed the operating conditions and problems of air-conditioning systems in established public buildings in cold and severe winter areas and introduced a heat exchange method to recycle the exhaust air and solve the problem of low air temperatures. Wang et al. [
8] utilized a macroscopic heat exchanger model based on the balance of heat loads of the recirculating water and the ambient air. Deng et al. [
9] used a deflector to mitigate the risk of freezing in a side-stream power plant, and Yan et al. [
10] explored engineering solutions such as auxiliary heat exchanger configuration with forced water circulation. Andrzej Jedlikowski et al. [
11] confirmed that a completely open bypass technique does not provide complete freeze protection at sub-zero outdoor air temperatures. It is worth noting that most of the existing anti-freeze strategies focus on a single technology path and lack a comprehensive assessment of scenario suitability, energy efficiency, and process compatibility.
The use of mechanical ventilation can significantly improve indoor air quality, but at the same time, it also increases the fresh air load, thus increasing the energy consumption of air-conditioning system operation. Modern industrial production processes have high requirements for the air environment, and creating a production environment with good air quality usually requires a large amount of fresh air. How to reduce the energy consumption of air-conditioning systems in industrial plants is a major challenge in the study of energy efficiency in industrial buildings. The optimization of HVAC system energy efficiency and control accuracy has been prompted to become a key research direction. Scholars have used multi-objective optimization algorithms to balance energy efficiency and comfort needs, such as Wei et al. [
12], who introduced a particle swarm optimization (PSO) method to solve the multi-objective optimization problem of HVAC systems in typical office facilities. Nasruddin [
13] used artificial neural networks combined with a multi-objective genetic algorithm (MOGA) to propose a combined HVAC system that includes VAVs and radiant systems simultaneously. The optimization of a dual-cooler combination HVAC system working with PPD and annual building energy consumption was selected as the objective function, and the decision variables included several parameters, such as thermostat settings, passive solar design, and cooler operation control. Li [
14] et al. comprehensively analyzed the composition, working principle, and characteristics of the central air-conditioning, air-handling system and established the minimum total energy consumption of the air-handling system and the PPD values in the minimum-value multi-objective optimization model. The NSGA-II algorithm was used to optimize the established multi-objective function to obtain the optimal set of solutions that satisfy the two conditions. Sofia Yfanti et al. (2020) [
15] proposed an “event-driven” framework that aims to improve building energy efficiency by monitoring and intervening in user behavior. The framework defines user behaviors as discrete “events” (e.g., inappropriate use of equipment) that are tracked, intervened, and fed back to achieve energy efficiency goals. Li [
16] et al. created a back-propagation neural network (BPNN) model to quickly predict the concentration of air pollution and the degree of thermal comfort, and if these predictions using the BPNN model do not satisfy the setup requirements, then the adaptive multi-objective Particle Swarm Optimizer–Gray Wolf Optimization (AMOPSO-GWO) algorithm is used to determine the best strategy for maximizing indoor air quality, thermal comfort, and energy savings. The BPNN-based AMOPSO-GWO algorithm has high prediction accuracy (>90%). The average reduction in air pollution concentration, improvement in thermal comfort, and average energy savings were 31%, 45%, and 35%, respectively. However, most of the established studies are for residential buildings, and industrial applications require additional consideration of process flow interference and frost protection constraints, which limit the applicability of the existing models.
Current research leaves some questions about freeze protection solutions for HVAC systems in cold regions. First, existing approaches lack a comprehensive evaluation of their regional adaptability and lifecycle performance, limiting their practical implementation potential. Second, while optimization models have been well developed for civil buildings, they remain inadequate for industrial applications due to insufficient consideration of process flow impacts in retrofit designs. Most critically, current control strategies for fresh air systems during winter operations predominantly rely on oversimplified single-variable optimization approaches, while the development of multi-objective coordinated optimization methods tailored for industrial scenarios lags significantly behind actual engineering needs. These limitations collectively hinder the advancement of effective anti-freezing solutions for industrial HVAC systems in extreme cold environments.
Through in-depth analysis of an industrial building in a severely cold region and its architectural characteristics, this study innovatively constructs a comprehensive retrofit assessment framework that includes anti-freeze performance, process compatibility, and energy efficiency indicators and, for the first time, proposes an innovative electric heating–bypass duct coupling control system for anti-freeze retrofit of air-conditioning systems. At the same time, considering the thermal comfort and energy consumption of industrial buildings, a dual-objective optimization model of energy consumption and thermal comfort is established to optimize the system operating parameters. TRNSYS is also used for comparative performance simulation to quantitatively evaluate the effect of anti-freezing efficiency enhancement, which provides a theoretical basis and technical reference for anti-freezing of air-conditioning systems in buildings under extreme environments around the world.
2. Research on Anti-Freeze Retrofit Program
The project is located in Shenyang, where the winter temperature can drop to as low as −24.8 °C, and the outdoor relative humidity can reach up to 100%. Between October 1 and April 1 of the following year, there are 1075 h when the outdoor temperature is below −10 °C and 3009 h when the outdoor relative humidity exceeds 80%. Therefore, to heat the fresh air to the supply air temperature, the fresh air handling unit needs to have strong heating capabilities. Additionally, preheating should be applied to the fresh air intake to prevent water from freezing inside the heat exchanger tubes. The common fresh air treatment technologies currently available may encounter certain problems when applied in the extreme meteorological conditions of cold regions, as shown in
Table 1.
It can be concluded that directly using electric heating is inefficient and costly; when an air-source heat pump directly heats the fresh air, the air temperatures on the condenser and evaporator sides are the same, preventing the heat pump system from starting. Therefore, it cannot be used directly as a heat source for heating the fresh air, and additional preheating equipment is required. The choice of heat recovery technology should be based on the specific conditions.
2.1. Propose a Program
Considering factors such as production processes, site limitations, energy structure, and policy regulations, the following four renovation schemes are proposed:
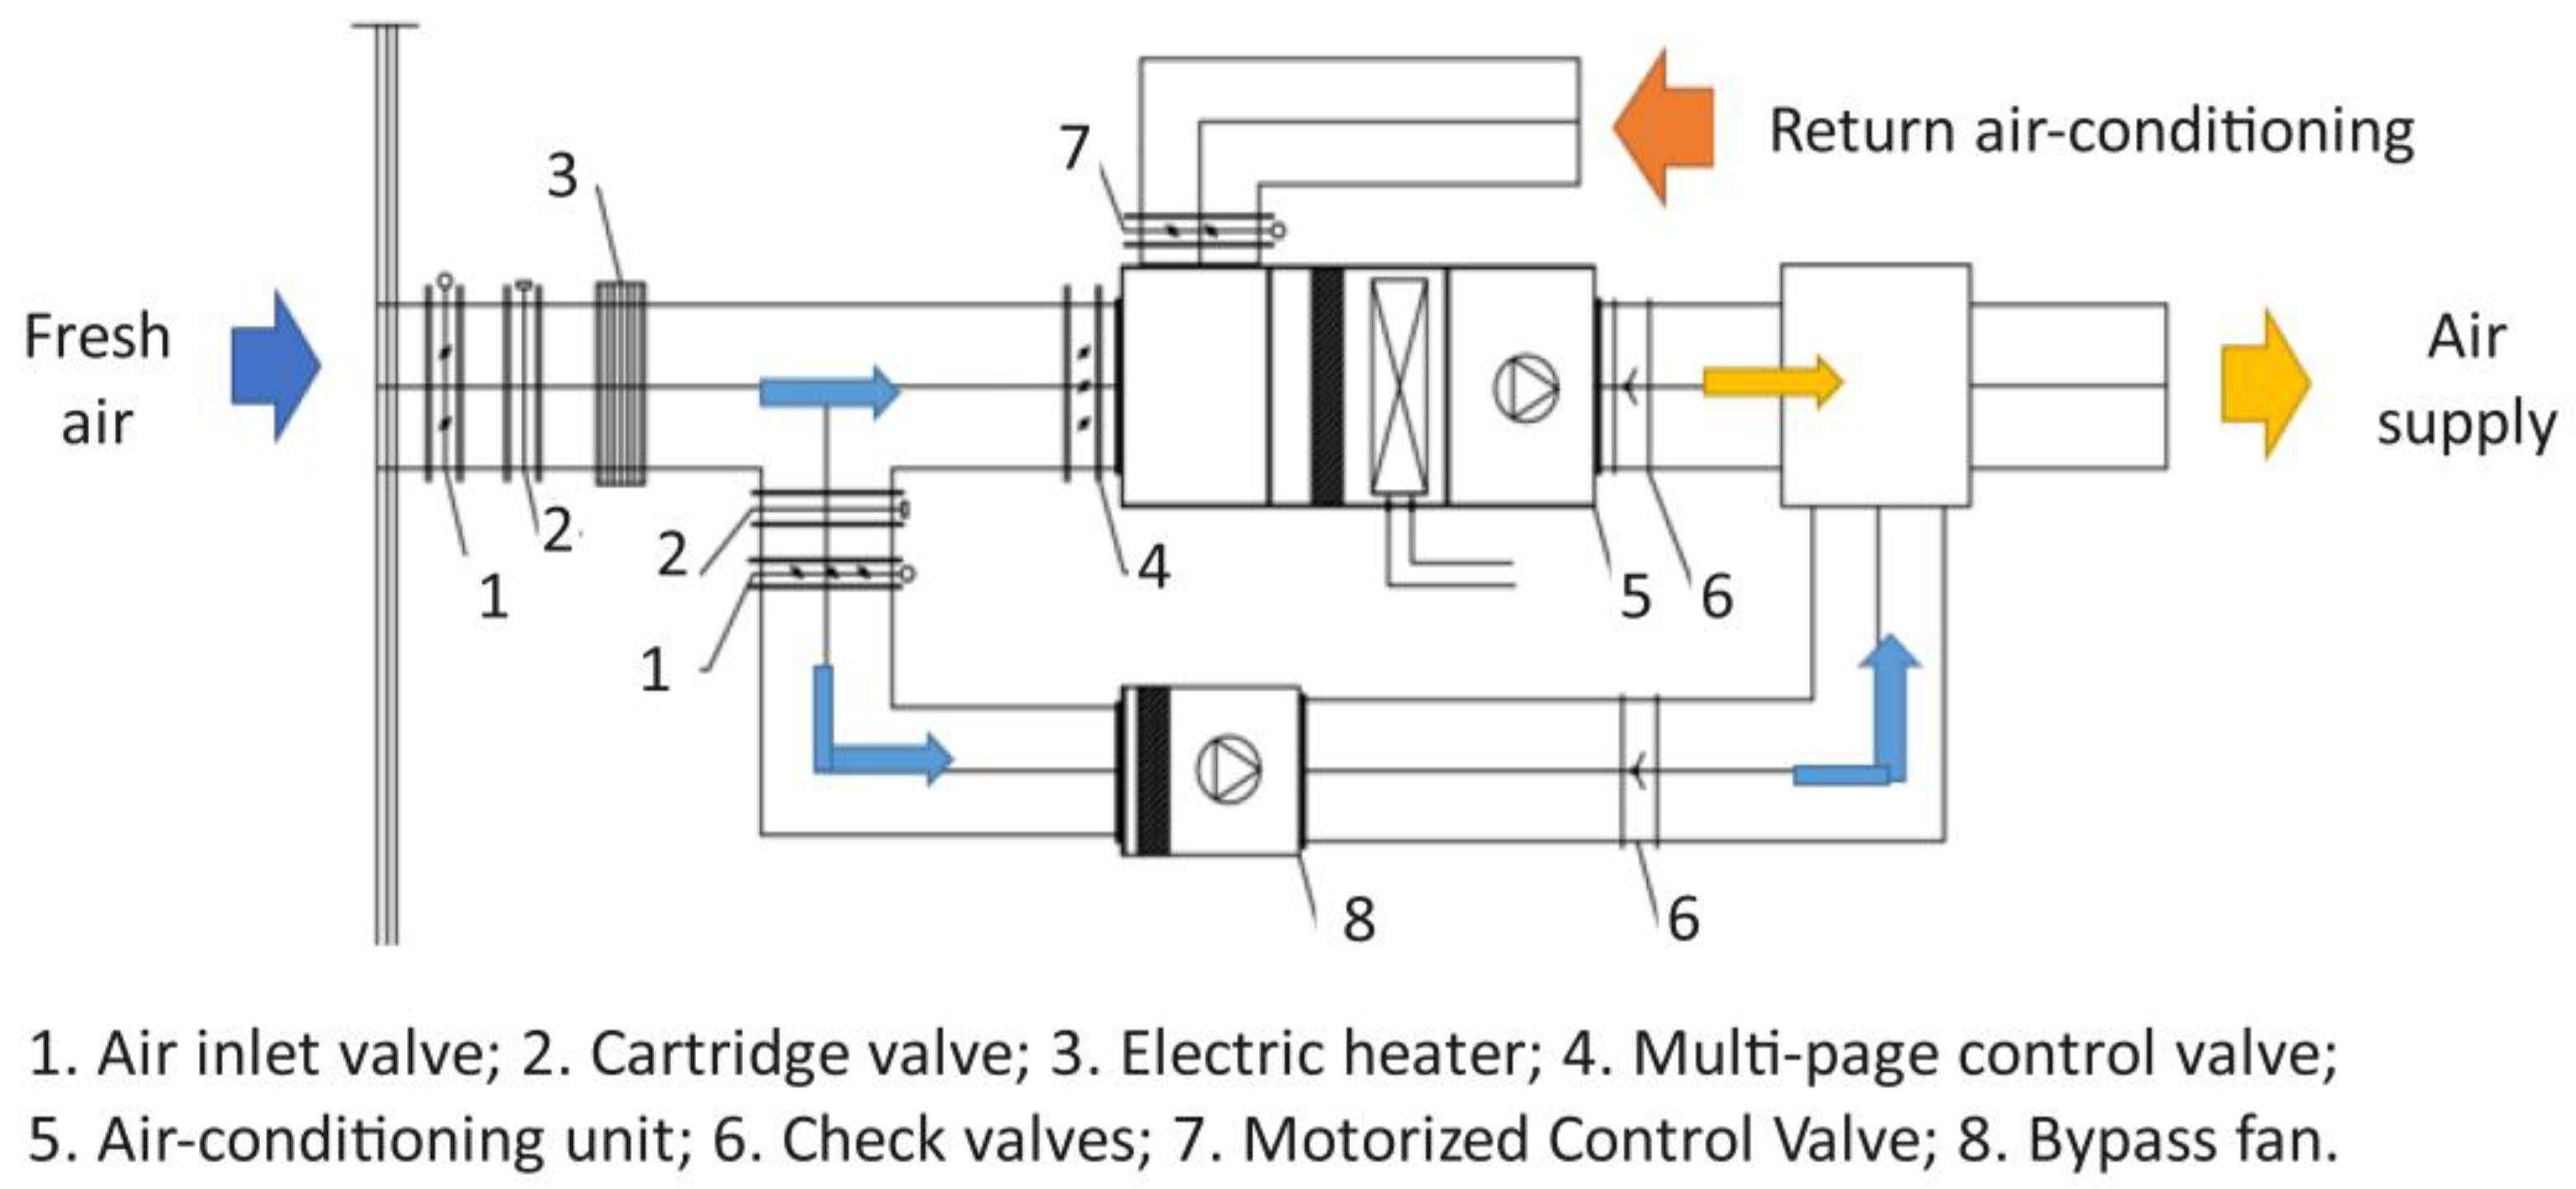
Scheme A (Original Scheme): bypass duct- and electric heating-linked control for anti-freezing protection (
Figure 1): This scheme combines the electric heater preheating method and the bypass method, with both controlled in tandem by a control system. An electric auxiliary heater is installed behind the electric insulation valve at the air-conditioning system inlet. When the outdoor temperature is too low in the winter, the electric heater preheats the fresh air to 0 °C~5 °C. Additionally, a fresh air bypass is used as a double safeguard against freezing. A bypass duct is connected between the duct with the electric insulation valve and the auxiliary electric heater, with an electric regulating valve at the bypass duct inlet. When the fresh air unit detects low hot water flow through the heat exchanger, the valve on the bypass duct is opened, and the induced fan increases the bypass air volume to avoid a large amount of cold air directly contacting the heat exchanger in the air-conditioning system. The remaining fresh air is heated by the heat exchanger and then mixed with the bypassed fresh air to the supply air temperature point before being sent indoors.
Scheme B (Comparison Scheme): installing a natural gas heater for fresh air preheating: The equipment setup includes a GHP (Gas Heat Pump) gas-driven module, two water pumps (flow rate 16 m3/h, head 18 m), an electric air volume regulating valve, an anti-freezing system unit, an indoor air-conditioning box, air ducts, water pipes, and a natural gas pipeline.
Scheme C (Comparison Scheme): replacement with an electric-driven low-temperature air source heat pump with anti-freezing solution and electric preheating: The equipment setup includes two air-source heat pumps (GN-R155ML and GN-R78ML), an electric heater, two water pumps (flow rate 40 m3/h, head 18 m), an electric air volume regulating valve, an anti-freezing system unit, an anti-freezing solution (ethylene glycol + ion-softened water + anti-corrosion and anti-rust additives + anti-foaming agent + dye + stabilizer), an indoor air-conditioning box, air ducts, and water pipes.
Scheme D (Comparison Scheme): installing an air-to-air heat exchanger using flue gas waste heat for fresh air preheating. The equipment setup includes an air-to-air heat exchanger, a fan, an electric air volume regulating valve, an anti-freezing system unit, an indoor air-conditioning box, air ducts, and water pipes.
Based on the samples provided by the equipment manufacturers, the quantitative values for each scheme are shown in
Table 2.
2.2. Methodology of the Assessment
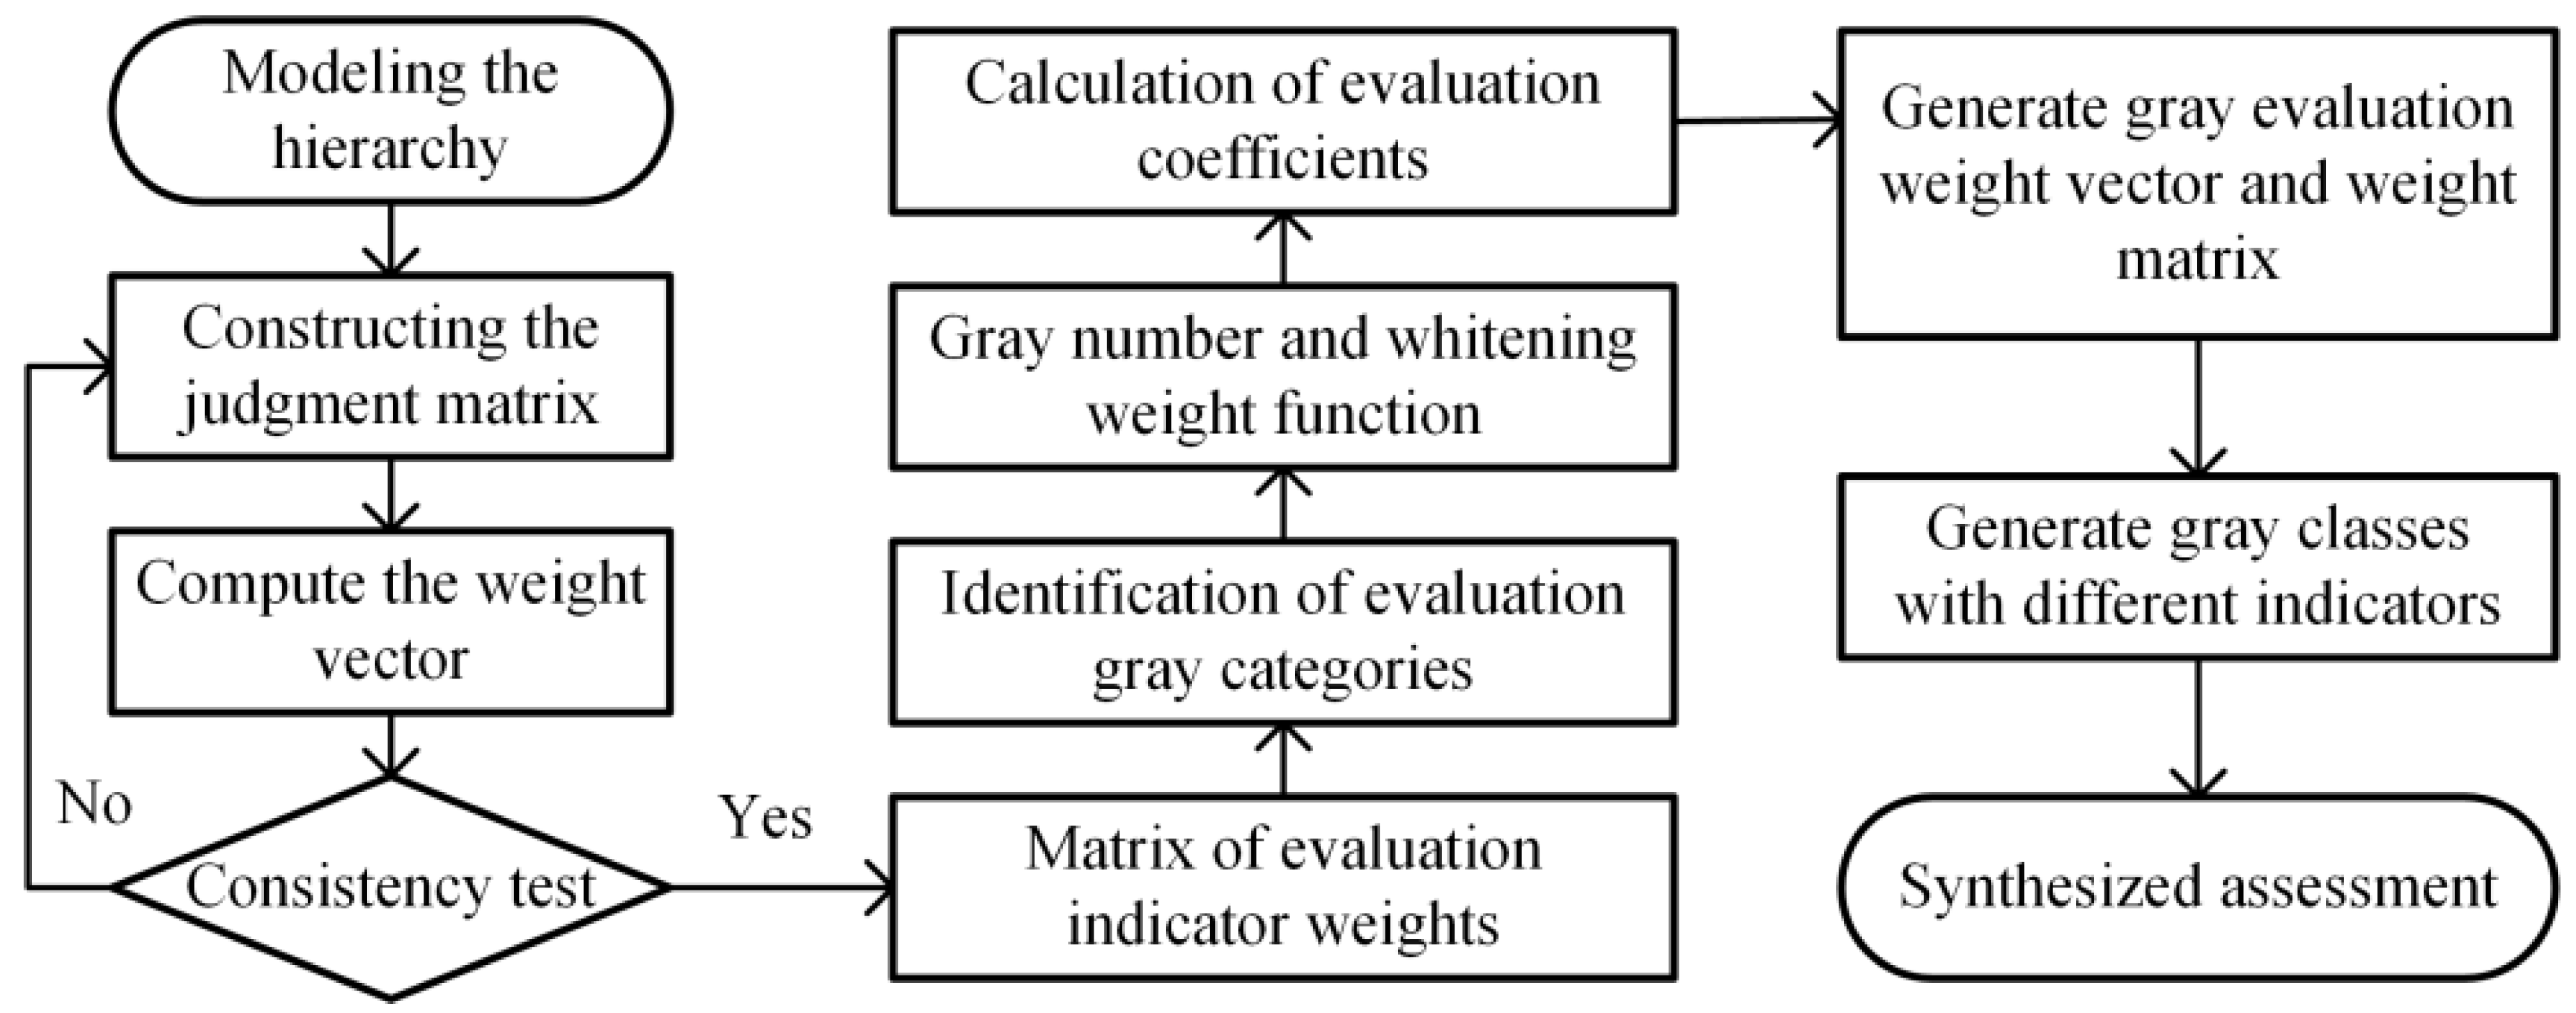
The currently commonly used comprehensive evaluation method is the Multi-Level Gray System Method, which is effective in addressing the issue of multi-objective uncertain systems with small samples. After establishing the evaluation system, known information from each air-conditioning system renovation scheme can be used to extract evaluation parameters and evaluate and compare the alternative renovation schemes. The multi-level gray decision-making process flowchart is shown in
Figure 2.
2.2.1. Evaluation Indicators
There is currently no universally applicable evaluation system for industrial building air-conditioning renovation schemes. By referencing the more reasonable evaluation index systems of residential building air conditioning and existing building renovation evaluation index systems, an evaluation index system for industrial building air-conditioning renovation schemes that includes both qualitative and quantitative indicators has been constructed.
The construction of an evaluation index system for the renovation of industrial building air-conditioning systems should follow these principles: (1) principle of scientific completeness; (2) principle of simplicity; (3) principle of operability; (4) principle of combining qualitative and quantitative methods; and (5) principle of suitability to local conditions. Based on the Chinese standard GB 50019-2015 “Design Code for Heating, Ventilation, and Air Conditioning in Industrial Buildings” [
17], the evaluation indices for air-conditioning anti-freeze renovation are divided into target level, criterion level, and indicator level. These are further categorized into five major modules: safety and reliability, technical evaluation, economic evaluation, operational management, and environmental impact, with secondary indicators further analyzed within these five categories, as shown in
Table 3 2.2.2. Judgment Matrix Construction and Eigenroot Calculation
According to the hierarchical analysis method, after constructing the evaluation hierarchy, the pairwise comparison judgment matrix should be constructed to determine the weights of the evaluation indexes at each level, using the scale method proposed by the American operations researcher Prof. T.L. Saaty (T.L. Saaty) in the early 1970s, i.e., the 1–9 scale method, through the relative scales, the indexes are compared with each other, and the indexes are evaluated according to the importance of the degree of the indexes, and
ij is the result of the comparison judgment of importance of index
i and index
j.
ij is the result of comparing the importance of indicator
i and indicator
j. The relative importance scale of the judgment matrix indicators is shown in
Table 4.
Experienced HVAC designers, building equipment managers, and HVAC professionals were selected as survey subjects to evaluate the relative importance of each indicator in the judgment matrix. A total of 15 valid questionnaires were collected. The respondents primarily included senior engineers and individuals with master’s degrees or lower. The distribution of the survey experts is as follows: 0 in the AA category, 6 in the A category, and the remaining 9 in other categories. The expert distribution table is shown in
Table 5.
The respondents evaluated the relative importance of each indicator based on their experience. After collecting the experts’ relative importance scale tables, judgment matrices for each criterion level were established, named B1, B2, B3, B4, and B5. These matrices were used to assign importance scales to each indicator, calculate their eigenvalues, and determine the weights of each indicator.
2.2.3. Consistency Test
The judgment matrices B
1, B
2, B
3, B
4, and B
5 were subjected to consistency checks, and the results are shown in
Table 6. The Consistency Index (CI) is used to determine the extent of inconsistency; a higher CI value indicates poorer consistency of the judgment matrix. When the CI value is 0, it signifies complete consistency. The Random Consistency Index (RI) is introduced to measure the size of CI. The value of RI is related to the order
n of the judgment matrix; as
n increases, the likelihood of random deviations from consistency also increases.
All judgment matrices passed the consistency check, indicating that the survey results are reliable and trustworthy. The weights were calculated and integrated into the judgment matrices, forming the quantitative values for the evaluation indicators of the air-conditioning system anti-freezing renovation in
Table 7.
A comprehensive evaluation system for air-conditioning system anti-freezing renovation has been established, consisting of both qualitative and quantitative indicators. The weights for each evaluation indicator have been calculated. This evaluation system, which considers the system’s anti-freezing capability, can be used for the optimal selection of air-conditioning system renovation plans in extremely cold regions.
2.3. Program Preference
2.3.1. Gray Correlation Modeling
When the research object is a single-level model consisting of
m indicators, and the research object consists of
n schemes with original indicator values forming matrix
X, then the
m indicators of the
i-th scheme form a reference sequence
Xik = [
Xi1,
Xi2, …,
Xim], where
i = 1, 2, …
n, and
k = 1, 2, …
m.
- 2.
Non-dimensional processing of evaluation indicator values.
After obtaining the original value matrix, the original data should be processed to become dimensionless, converting the original data into a unified quantitative value between [0,1] to eliminate the influence of different dimensions and magnitudes. Indicators are divided into benefit type and cost type. Benefit-type indicators are those where higher values are better, while cost-type indicators are those where lower values are better. Different dimensionless methods are applied to different evaluation indicators.
The quantitative formula for efficiency-based indicators is:
The quantitative formula for cost-based indicators is:
In the formula, xik represents the dimensionless value of the k-th indicator for the i-th scheme, and and denote the maximum evaluation value of the k-th indicator among all schemes.
- 3.
Calculation of the gray correlation.
The formula for calculating the gray correlation value is as follows:
In the formula, i = 1, 2, … n; k = 1, 2, … m; and η is the distinguishing coefficient, where η ∈ [0,1]. According to empirical evidence, when η > 0.5, the differences between the association coefficients are relatively small. However, when η ≤ 0.5436, the distinguishing power of the coefficient η is optimal. Therefore, in this study, η is set to 0.5.
After the results are calculated for each correlation value, a matrix of correlation coefficients L can be formed:
The matrix of correlation coefficients is multiplied by the matrix of evaluation indicator weights to obtain the correlation matrix R for the evaluation program, where the correlation formula for the
i-th program is as follows:
2.3.2. Results
The established evaluation index table for the air-conditioning system anti-freezing modification is used as an evaluation survey form. The four schemes are rated anonymously on a scale of 10 points. The returned questionnaires are compiled into an evaluation value matrix. Based on the constructed evaluation index system, matrix calculations yield the primary index evaluation table for the four schemes. By standardizing the quantitative and qualitative indicators, a unified scale for evaluating the modification schemes is obtained, as shown in
Table 8.
Based on the above calculation results, Scheme A has a correlation degree of 0.7512, Scheme B has a correlation degree of 0.7254, Scheme C has a correlation degree of 0.6760, and Scheme D has a correlation degree of 0.6774. The correlation degrees are ranked as rA > rB > rD > rC. This indicates that Scheme A is closer to the ideal solution for the air-conditioning system modification in this study. Among the four modification schemes, Scheme A is the preferred option and is recommended for adoption.
3. Operational Strategy Research
The operation of the electric heating and bypass duct interlocking control system is divided into three phases: (1) During the transition season and early winter, the electric heater is inactive; the bypass valve and heat exchanger adjust airflows to ensure the supply air meets the target temperature. (2) In winter, when the outdoor temperature is above the preheat activation threshold, the electric heater remains off, and the heat exchanger operates at maximum capacity; slight reductions in supply air temperature and indoor comfort may occur if heating is insufficient. (3) When outdoor temperatures drop below the activation threshold, the electric heater preheats the air, with the bypass valve and heat exchanger ensuring adequate mixing; the supply air temperature and comfort may still decrease slightly.
When adopting the third-stage anti-freezing air-conditioning system operation scheme, the electric heater is activated for preheating during very cold winter temperatures. This results in increased system energy consumption and a reduced indoor design temperature, leading to decreased comfort. Therefore, it is crucial to balance comfort and energy consumption within a reasonable range. Given that energy consumption and comfort cannot both be minimized simultaneously and are non-linearly related, this problem can be summarized as a multi-objective optimization issue. Consequently, it is necessary to establish a multi-objective optimization model for the anti-freezing air-conditioning system, including models for total system energy consumption and thermal comfort.
For the multi-objective optimization model, the expression is denoted as:
where
x is the decision variables, and
n is the total number of optimization objectives.
3.1. Modeling of Operational Energy Consumption of Anti-Freezing Air-Conditioning Systems
3.1.1. Auxiliary Electric Heaters
The energy consumption of the auxiliary electric heater consists of two parts: the energy used to heat the air and the energy lost due to dissipation. The total energy consumption of the auxiliary electric heater is calculated by summing these two components, as follows:
where
is the auxiliary heater power, kW.
ma is the fluid mass flow, kg/h.
cpf is the specific heat of air, kJ/kg-K.
Tset is the auxiliary heater set temperature, °C.
Thi is the auxiliary heater inlet air temperature, °C.
Tho is the auxiliary heater outlet air temperature, °C.
is the average temperature difference between the inlet and outlet, and °C.
ηhtr is the auxiliary heater efficiency.
3.1.2. Pumps
Motors are the main energy-consuming components of frequency pumps, based on the law of similarity can be approximated that the pump energy consumption
Ppumb is a third-degree polynomial of the flow rate Q, so the frequency pump energy consumption formula is as follows:
where
mw is the actual hot water flow rate, m
3/s.
3.1.3. Heat Exchangers
The heat exchanger assumes the fresh air load during the winter operation of the system, and the energy change that occurs when the air is raised from the preheating temperature to the design temperature is calculated as follows:
where
is the heat exchanger heat transfer capacity, kW;
ma is the air volume through the heat exchanger, m
3/s;
cp is the specific heat capacity of air;
Tout is the air temperature through the heat exchanger, °C; and
ηex for the efficiency of the heat exchanger.
3.1.4. Ventilator
With reference to the pump efficiency equation, the bypass fan mathematical equation can be expressed as:
where
a0~
a3 and
b0~
b3 are the model parameters,
Pyfan is the bypass fan energy consumption, kW; and
ms is the actual airflow, m
3/s.
Through the analysis of system operation and energy consumption and the establishment of mathematical models for each component, it is determined that the main energy-consuming equipment of the freeze-proof air-conditioning system is the auxiliary electric heater, the hot water pump, the fresh air bypass fan, and the total energy consumption of the air-conditioning system is the sum of energy consumption of each piece of equipment, so it is possible to set up the objective function of the air-conditioning system’s energy consumption model as follows:
The objective function
F1(x) optimization variable is:
Since it is unreasonable for electrical energy to be used to heat energy, according to the design of the operation program, the working time of the electric heater should be reduced as much as possible when the outdoor temperature is low enough to turn on the electric heating, and the heating capacity of the electric heater will be 405 kW as the electric heater working limit, so the maximum value of the energy consumption objective function constraint is 1202 kW. When the electric heater is turned off, the bypass airflow reaches the maximum, and the temperature of the supply air after mixing is in the range of the specification, the energy consumption of the system is constrained to be 597 kW as the minimum value of the energy consumption objective function.
3.2. Thermal Comfort Modeling of Personnel Activity Areas
In this paper, the Predicted Mean Valuation (PMV) and the Predicted Percentage Dissatisfaction (PPD) of thermal comfort environment were chosen to quantify the thermal comfort of a building [
18,
19,
20,
21]. PMV, proposed by Prof. Fanger of Denmark, is a comprehensive judgment index based on empirical equations, which integrates six factors of thermal comfort, namely air temperature, air relative humidity, air flow rate, average radiation temperature, human metabolic rate, and clothing thermal resistance of thermal comfort influence, representing most people to the same indoor environment thermal comfort feeling. The PMV was divided into seven evaluation levels of 3, 2, 1, 0, −1, −2, and −3, which are positive and negative values indicating hot and cold, and values close to 0 indicate higher thermal comfort. The corresponding hot and cold sensations for each level are shown in
Table 9 [
22].
For the selected thermal comfort evaluation indexes
PMV and
PPD, a comprehensive evaluation model of thermal comfort is established, and the objective function is as follows:
According to the relevant provisions of the thermal comfort evaluation of the indoor environment of industrial buildings, the evaluation index is expected to be greater than or equal to the average thermal sensation index. The PMV value should be greater than or equal to −1 and should be less than or equal to 1, and the expected percentage of unsatisfied people PPD value should be less than or equal to 27%. Therefore, the range of parameter values in the thermal comfort evaluation model is −1 ≤ PMV ≤ 1 and PPD ≤ 27%.
There are seven unknown variables in the thermal comfort evaluation model, including human energy metabolic rate M, mechanical work done by the human body W, partial pressure of water vapor around the human body Pa, indoor air temperature ta, thermal resistance of clothing Icl, average radiant temperature of the room tr, and indoor air flow rate va.
In the diesel engine factory, workers are mainly engaged in moderate labor, so the human body doing work W takes the value of 200 W. The human energy metabolic rate M when sitting quietly takes the value of 1 Met, of which 1 Met is about 58.15 W/m2. And in the light activity according to the degree of different activities, M takes the value of 2 ~ 3.4 Met between about 116 and 197 W/m2, the human body energy metabolic rate M takes 2 Met. This study is for winter conditions, so the thermal resistance of clothing is taken as 1.2 clo, with 1 clo about 0.155 (m2·°C)/W.
3.3. Bi-Objective Optimization Model for Freeze-Proof Air-Conditioning System
Through the analysis of the actual system equipment and the analysis of the heat exchange process, the energy consumption model and thermal comfort model of the air-conditioning system operation are established, the constraints of the optimization variables are determined, and the multi-objective optimization problem model, with energy consumption and thermal comfort as the objective function, is derived as follows:
3.4. Multi-Objective Optimization Based on NSGA-II Algorithm
The fast non-dominated sorting genetic algorithm (NSGA-II) is a kind of genetic algorithm, and the theoretical ideas are originated from the basis of evolutionary theory and the basis of genetics. Compared to the non-dominated sorting genetic algorithm (NSGA), the NSGA-II algorithm adds a new, fast non-dominated sorting algorithm, adopts an elite retention strategy, and introduces a new crowding degree and a new crowding degree comparison operator. In the optimization process, the replication probability is empirically taken to be between 0.75 and 0.95, and the crossover probability is empirically taken to be between 0.60 and 0.90 [
23]. The variation probability generally takes a value between 0.01 and 0.07, with its maximum value not exceeding 0.5; it is difficult to generate a new genetic structure when the variation probability is too small, and a too-large genetic algorithm would make the variation probability become a purely random search.
According to the above method and after repeated simulations, the optimal values are obtained. MATLAB2018 is used as the platform to write the multi-objective function optimization algorithm program, setting the population size popsize as 100, the individual length popth as 14, the number of iterations as 100, the crossover probability pc as 0.9, and the mutation probability pm as 0.07.
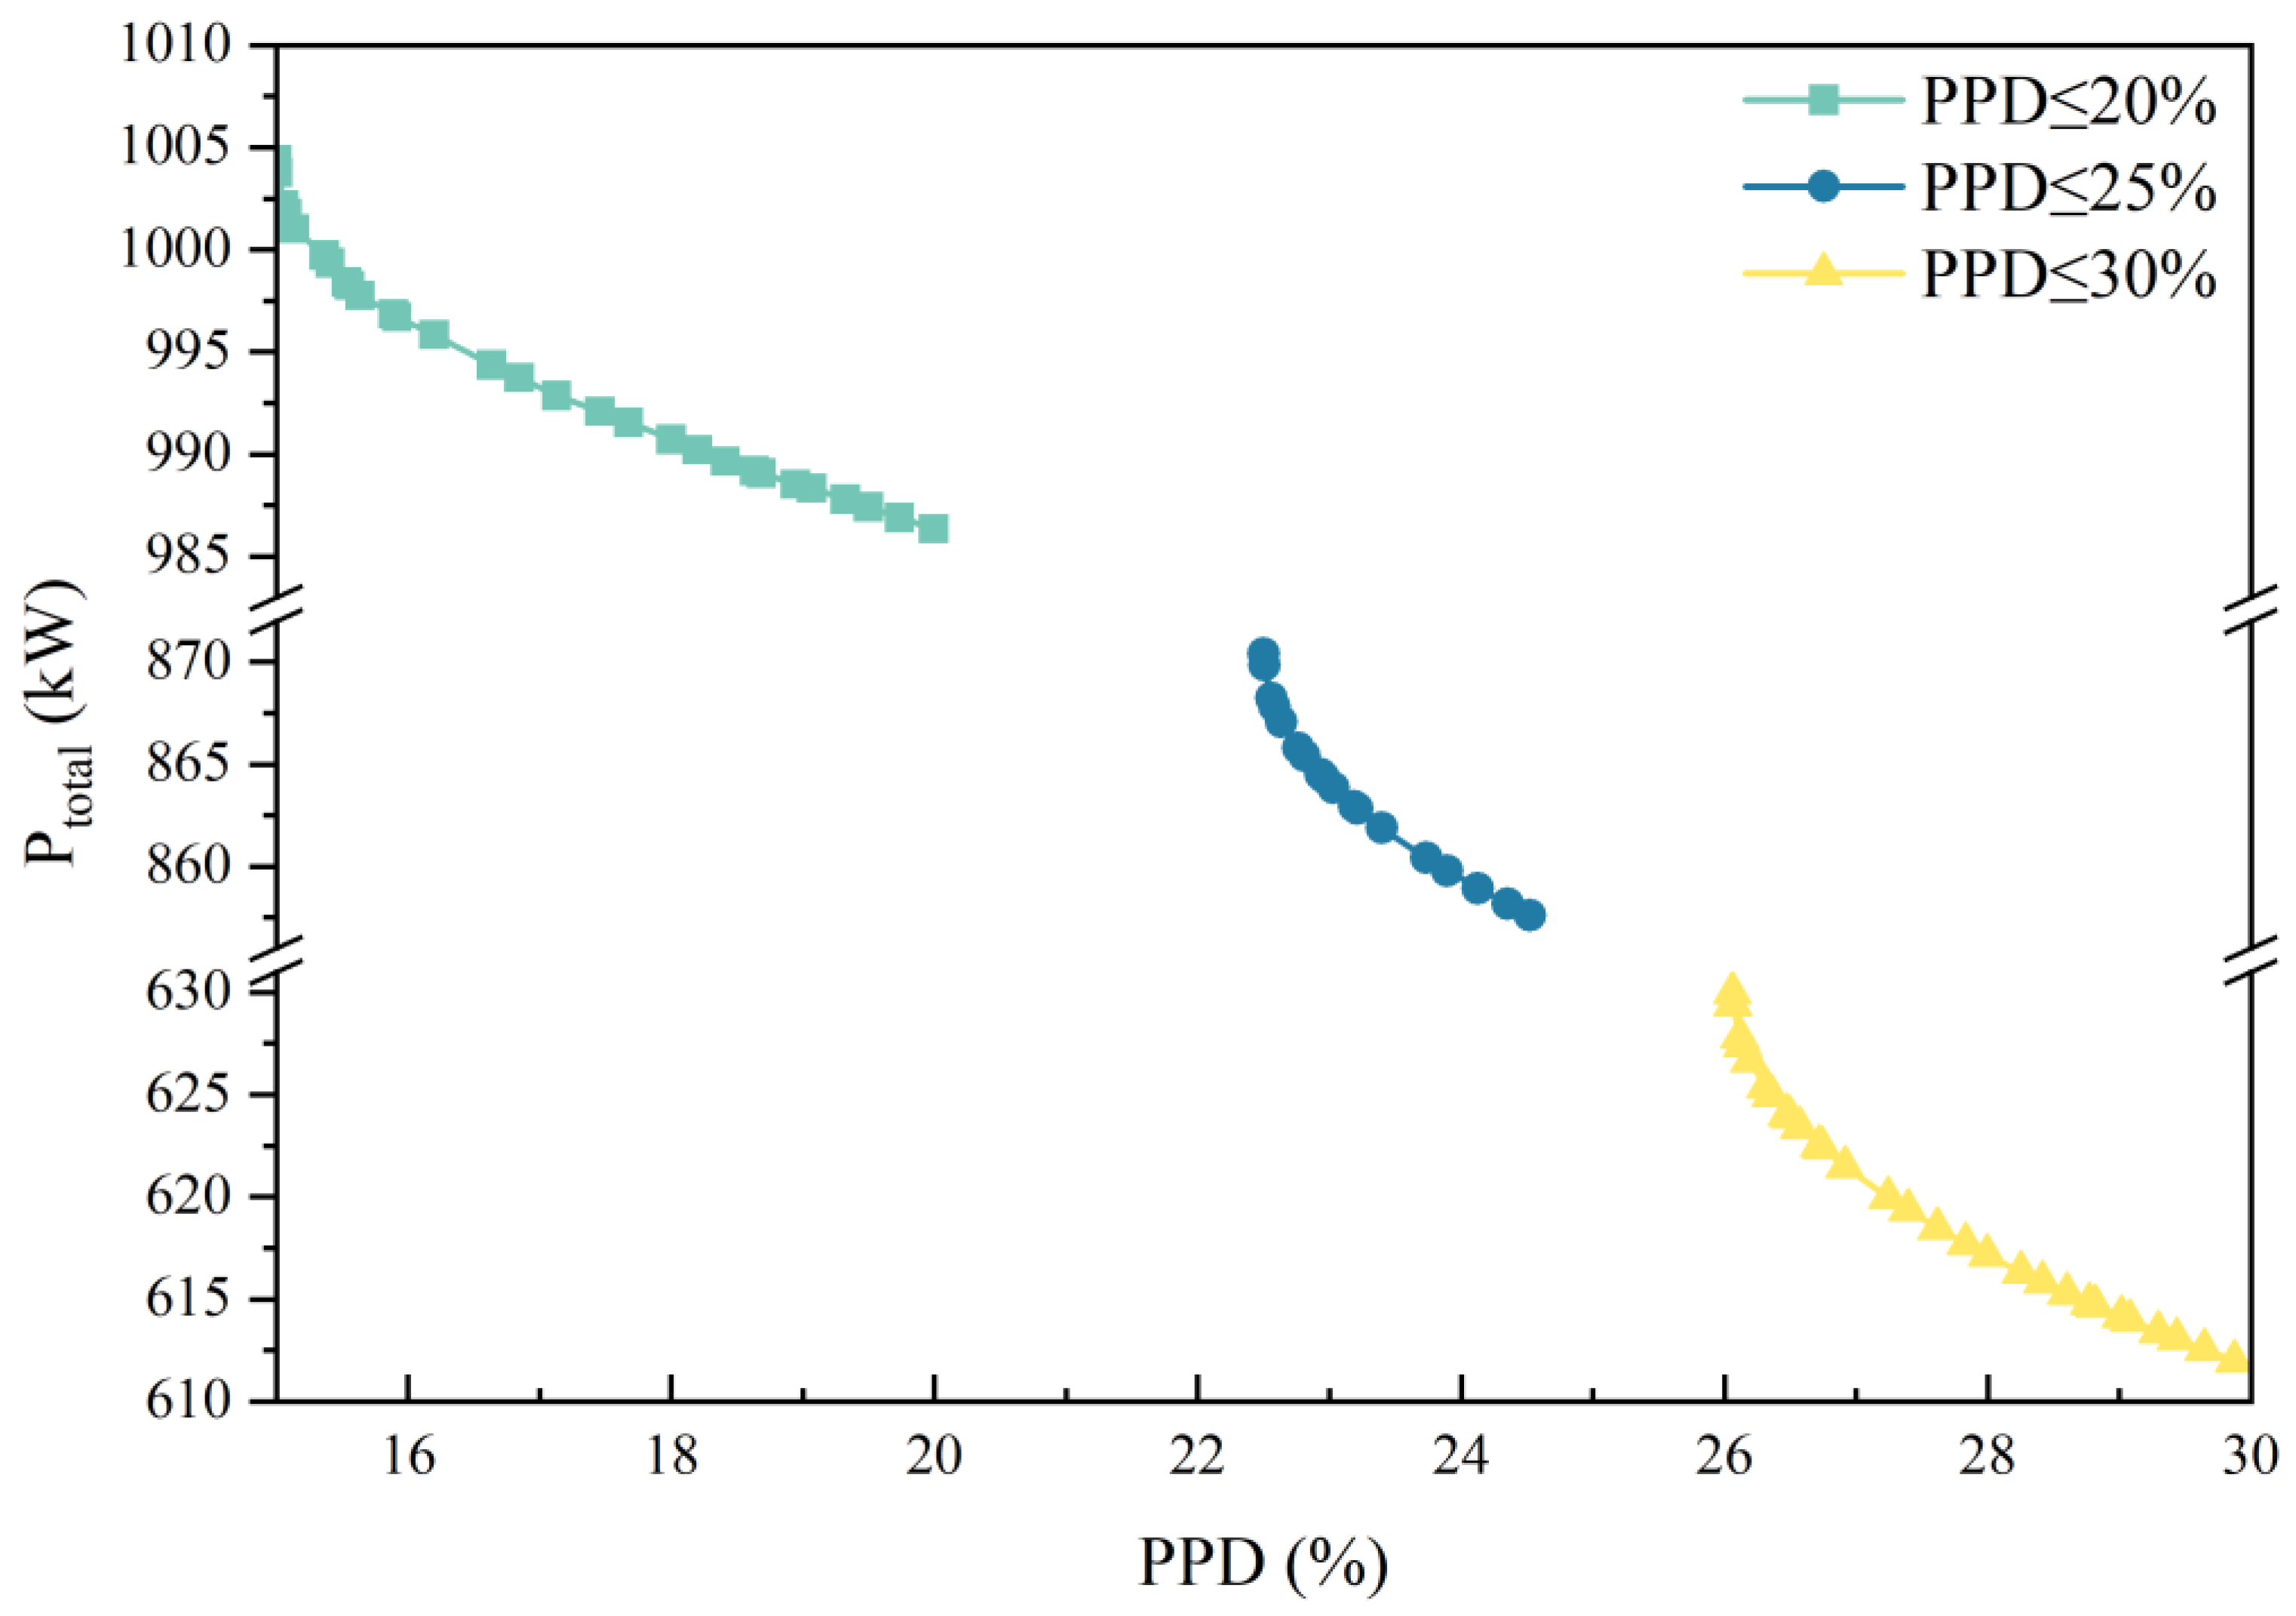
From the optimization calculation results (
Figure 3), we can see that the objective function
F1(
x) has a negative correlation with
F2(
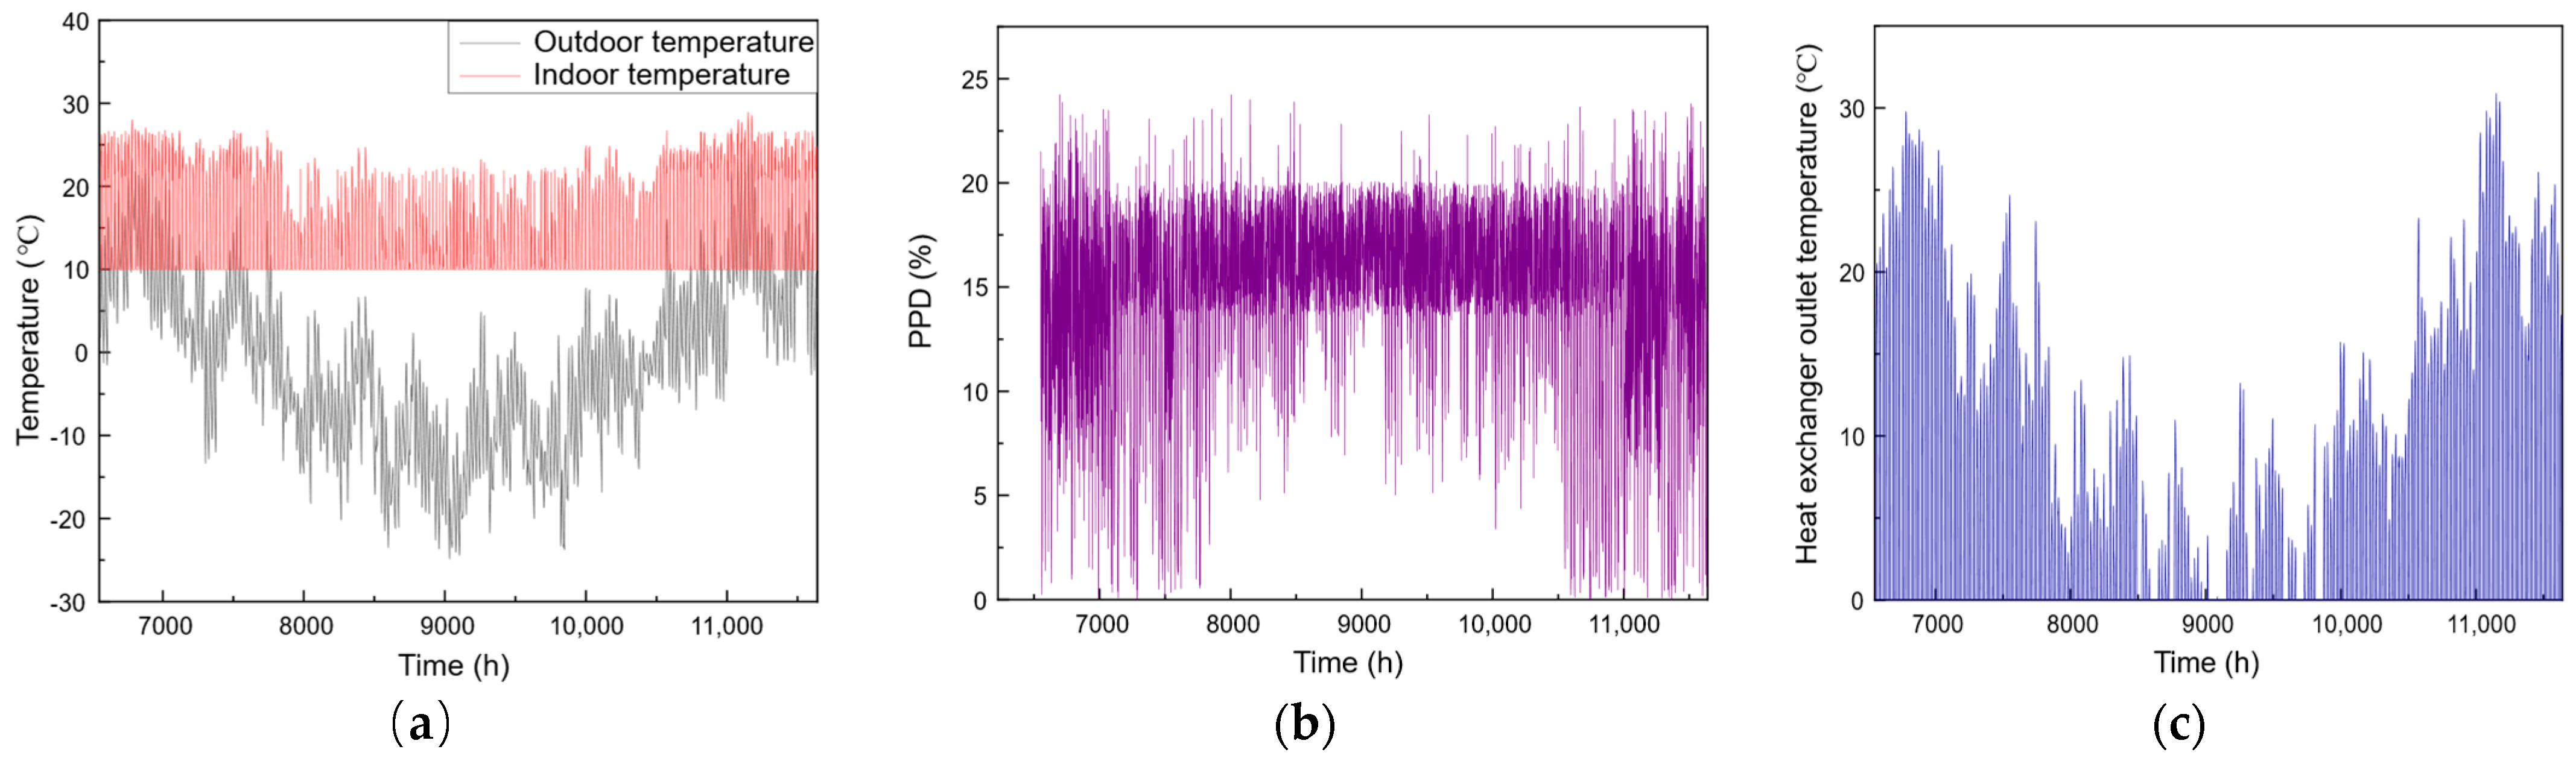
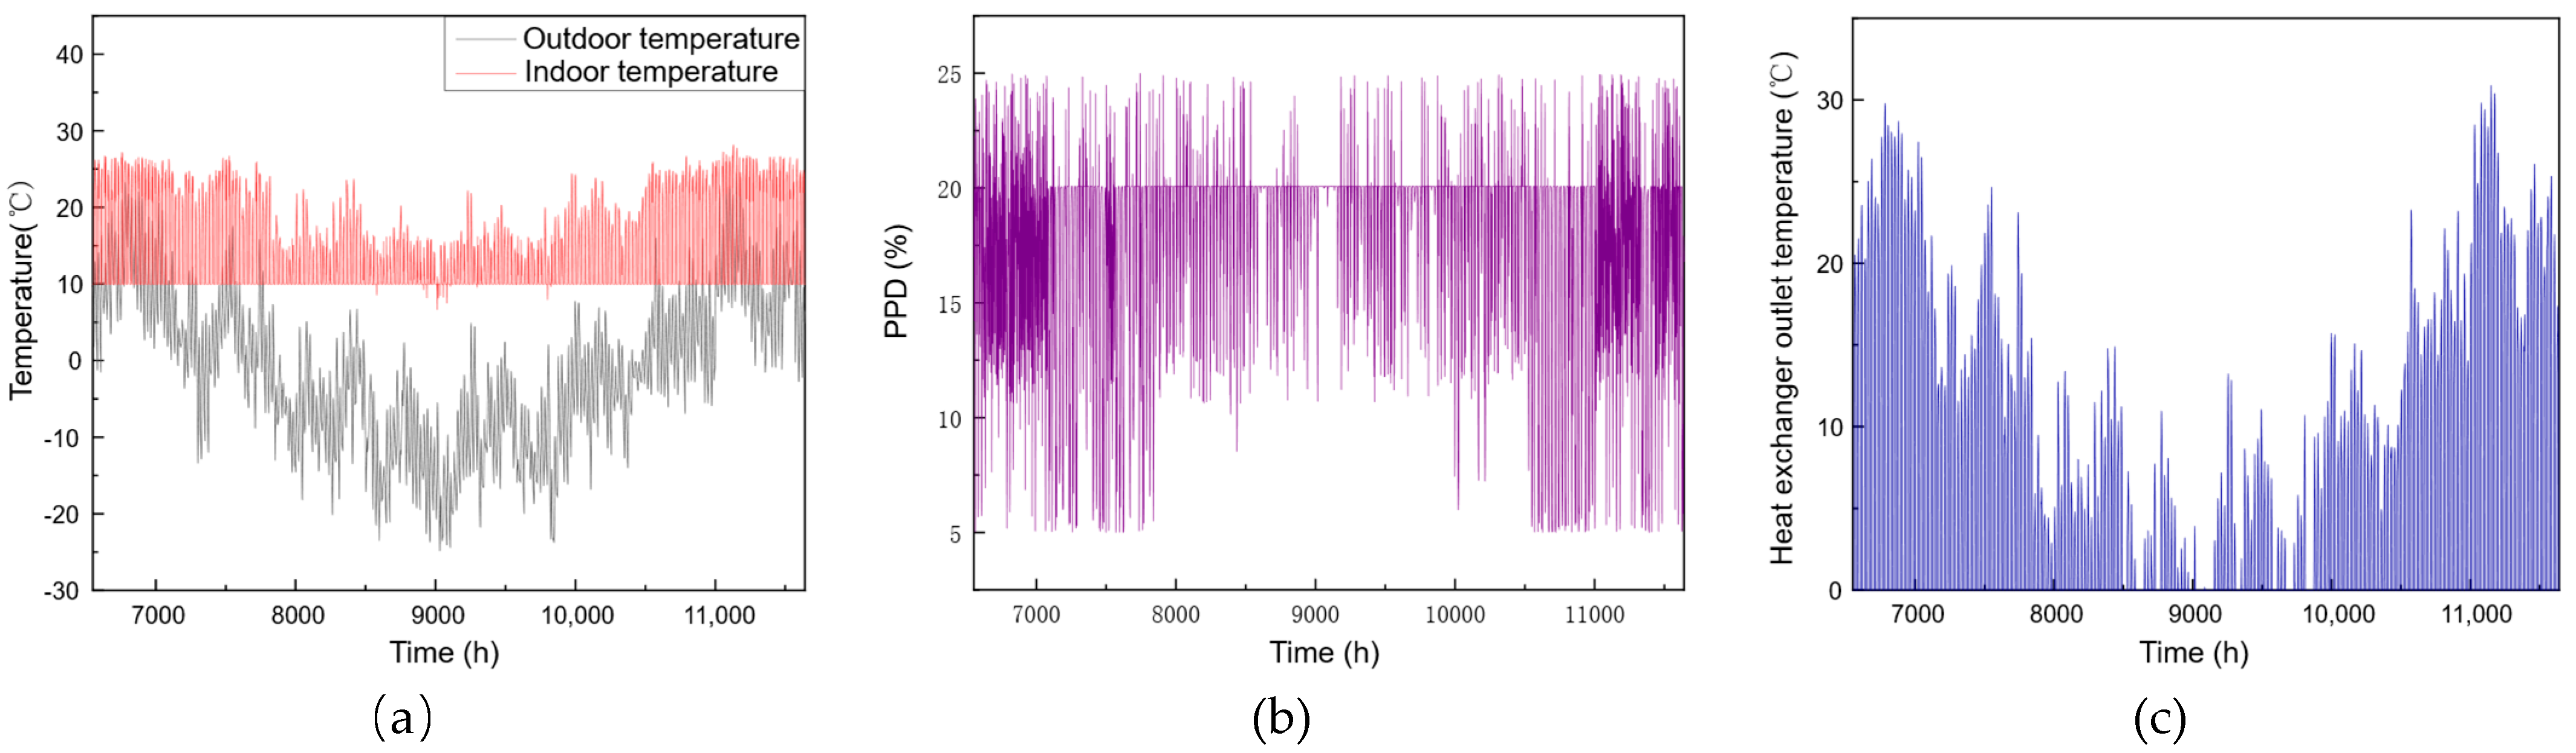
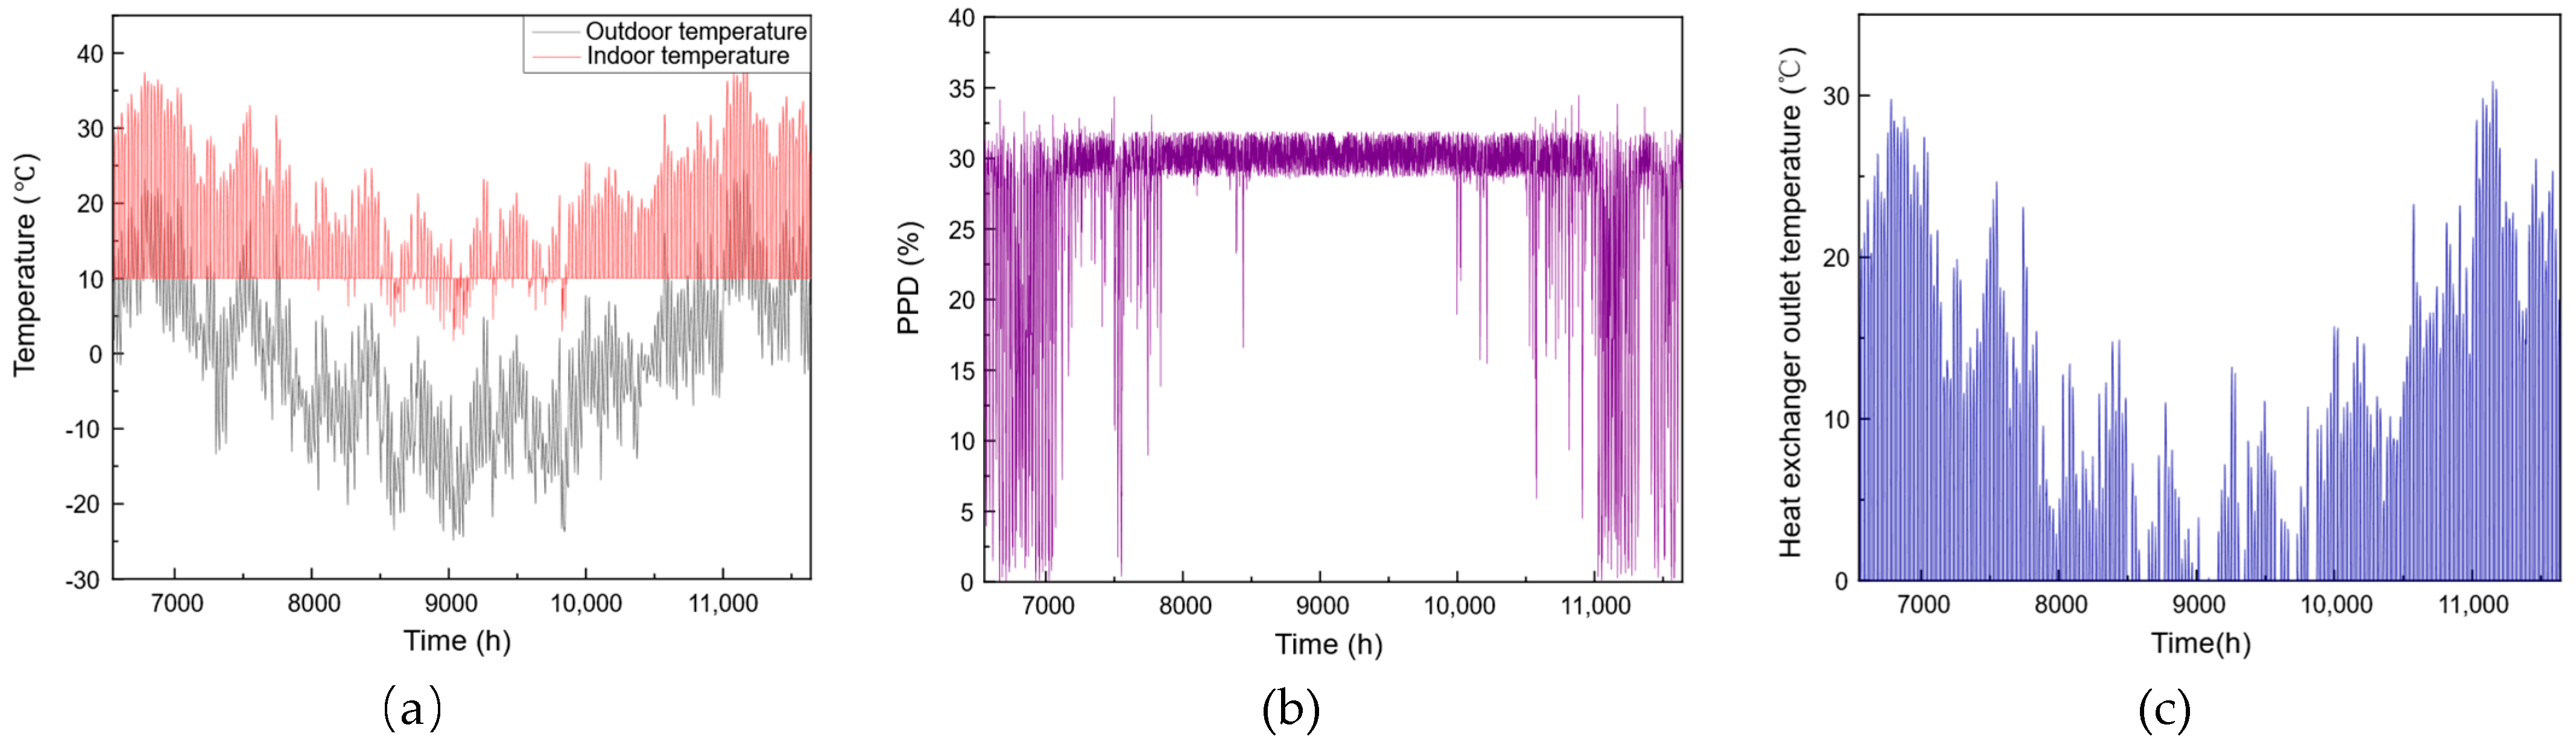
x); that is, the air-conditioning system multi-objective optimization model of energy consumption has a negative correlation with the PPD, in line with the actual situation. When the PPD ≤ 20%, the minimum value of system energy consumption in the optimization result is 986.36 kW, and the maximum value is 1004.36 kW; the minimum value of PPD is 15.00, and the maximum value is 19.99. When the PPD ≤ 25%, the minimum value of system energy consumption in the optimization result is 852.42 kW, and the maximum value is 870.42 kW; the minimum value of PPD is 6.30, and the maximum value is 24.53. When the PPD ≤ 30%, the minimum value of system energy consumption in the optimization result is 612.00 kW, and the maximum value is 629.99 kW; the minimum value of PPD is 25.87, and the maximum value is 29.86.
After running the multi-objective optimization algorithm, the optimized values of decision parameters are obtained as
Table 10.
4. TRNSYS Simulation Modeling of Electric Heating–Bypass Anti-Freezing System
In this study, TRNSYS 18 simulation software is selected to build the simulation model of the air-conditioning system.
4.1. Architectural Model Setup
According to the standard design requirements, the winter outdoor design temperature for ventilation at the diesel engine testing facility is −21.6 °C, with a winter outdoor relative humidity of 60% and an atmospheric pressure of 100,540 Pa. The engine used is a TBD234V6 medium-speed diesel engine (Henan Diesel Heavy Industry Co., Ltd., Luoyang, China), with a rated power of 222 kW and a speed of 1800 r/min. The building model is set with a length of 30 m, a width of 15 m, a height of 10 m, a roof heat transfer coefficient of 1.8 W/(m2∙K), an exterior wall heat transfer coefficient of 1.56 W/(m2∙K), and an exterior window heat transfer coefficient of 4.8 W/(m2∙K).
In the building model, the system simulation time is set from 1 November to 1 March, totaling 122 days. The working days are Monday through Friday, with operation hours from 8:00 to 20:00. On Saturdays and Sundays, the system is not activated, and only heat preservation is maintained. A schedule is set, with weekdays labeled as WEEKDAY and weekends as WEEKEND. The USE parameter is set to 1 during work hours, indicating operational status, and 0 during non-working hours. The ventilation system in the room is set up, with air temperature and humidity controlled through an external interface, calculated by the equipment module and input into the system, following the weekly schedule.
The heat source power inside the building is set at 222 kW, with the operation mode following the weekly schedule. The facility accommodates 10 people, including both staff and mobile personnel. Most staff are engaged in engine testing, debugging, and data recording, so the labor intensity is set to Mode No.2, with an average heat emission of 120 W per person. Monitoring equipment is simplified to desktop computers, with a total of 10 computers, each with a power consumption of 140 W. Lighting is simplified to fixtures with a lighting density of 5 W/m2, covering an area of 450 m2, with operation time following the weekly schedule.
4.2. Modeling
Heat exchanger module: In this study, the selection is made among Type52a, Type52b, Type52c, and Type5. Ultimately, the finned cross-flow heat exchanger Type5 is chosen as the heat exchanger module for this simulation.
Fan module: In the optimal selection of the air-conditioning system retrofit plan, two variable frequency fans are designed: a main fan and a bypass duct fan. Therefore, in TRNSYS, a variable frequency fan model is chosen, specifically the Type662 module that allows for setting the flow rate, to serve as the fan module for this simulation.
Pump module: For the air-conditioning system retrofit plan, the pump is replaced with a variable frequency pump. In TRNSYS, the variable speed pump model Type110 is selected to serve as the variable frequency pump model. This module works by adjusting the system pipeline resistance to change the pump flow rate. The performance parameters for the variable frequency pump, such as the design flow rate, design head, and motor heat loss rate, are set according to the provided sample. The external input parameters required for the pump module include fluid temperature and fluid flow rate. The pump module can output parameters such as pump energy consumption and pump efficiency.
Control module: The three-way valve is a component in the air-conditioning system responsible for diverting bypass fresh air. The fresh air is partially heated through a heat exchanger and partially bypassed. The bypass air and the air that has undergone heat and moisture treatments are mixed through a confluence valve and then input into the building module. The three-way components are chosen as Type11e and Type11g, and this module can control the proportion of bypass fresh air through external input signals, achieving system operation adjustments.
Auxiliary heating module: The Type6 module is used as the auxiliary electric heater model in this study, with the heating mode set to Mode 1. The maximum heating rate and auxiliary heater efficiency are set according to the sample provided by the equipment manufacturer. The heating set temperature in the input parameters serves as an operational adjustment parameter.
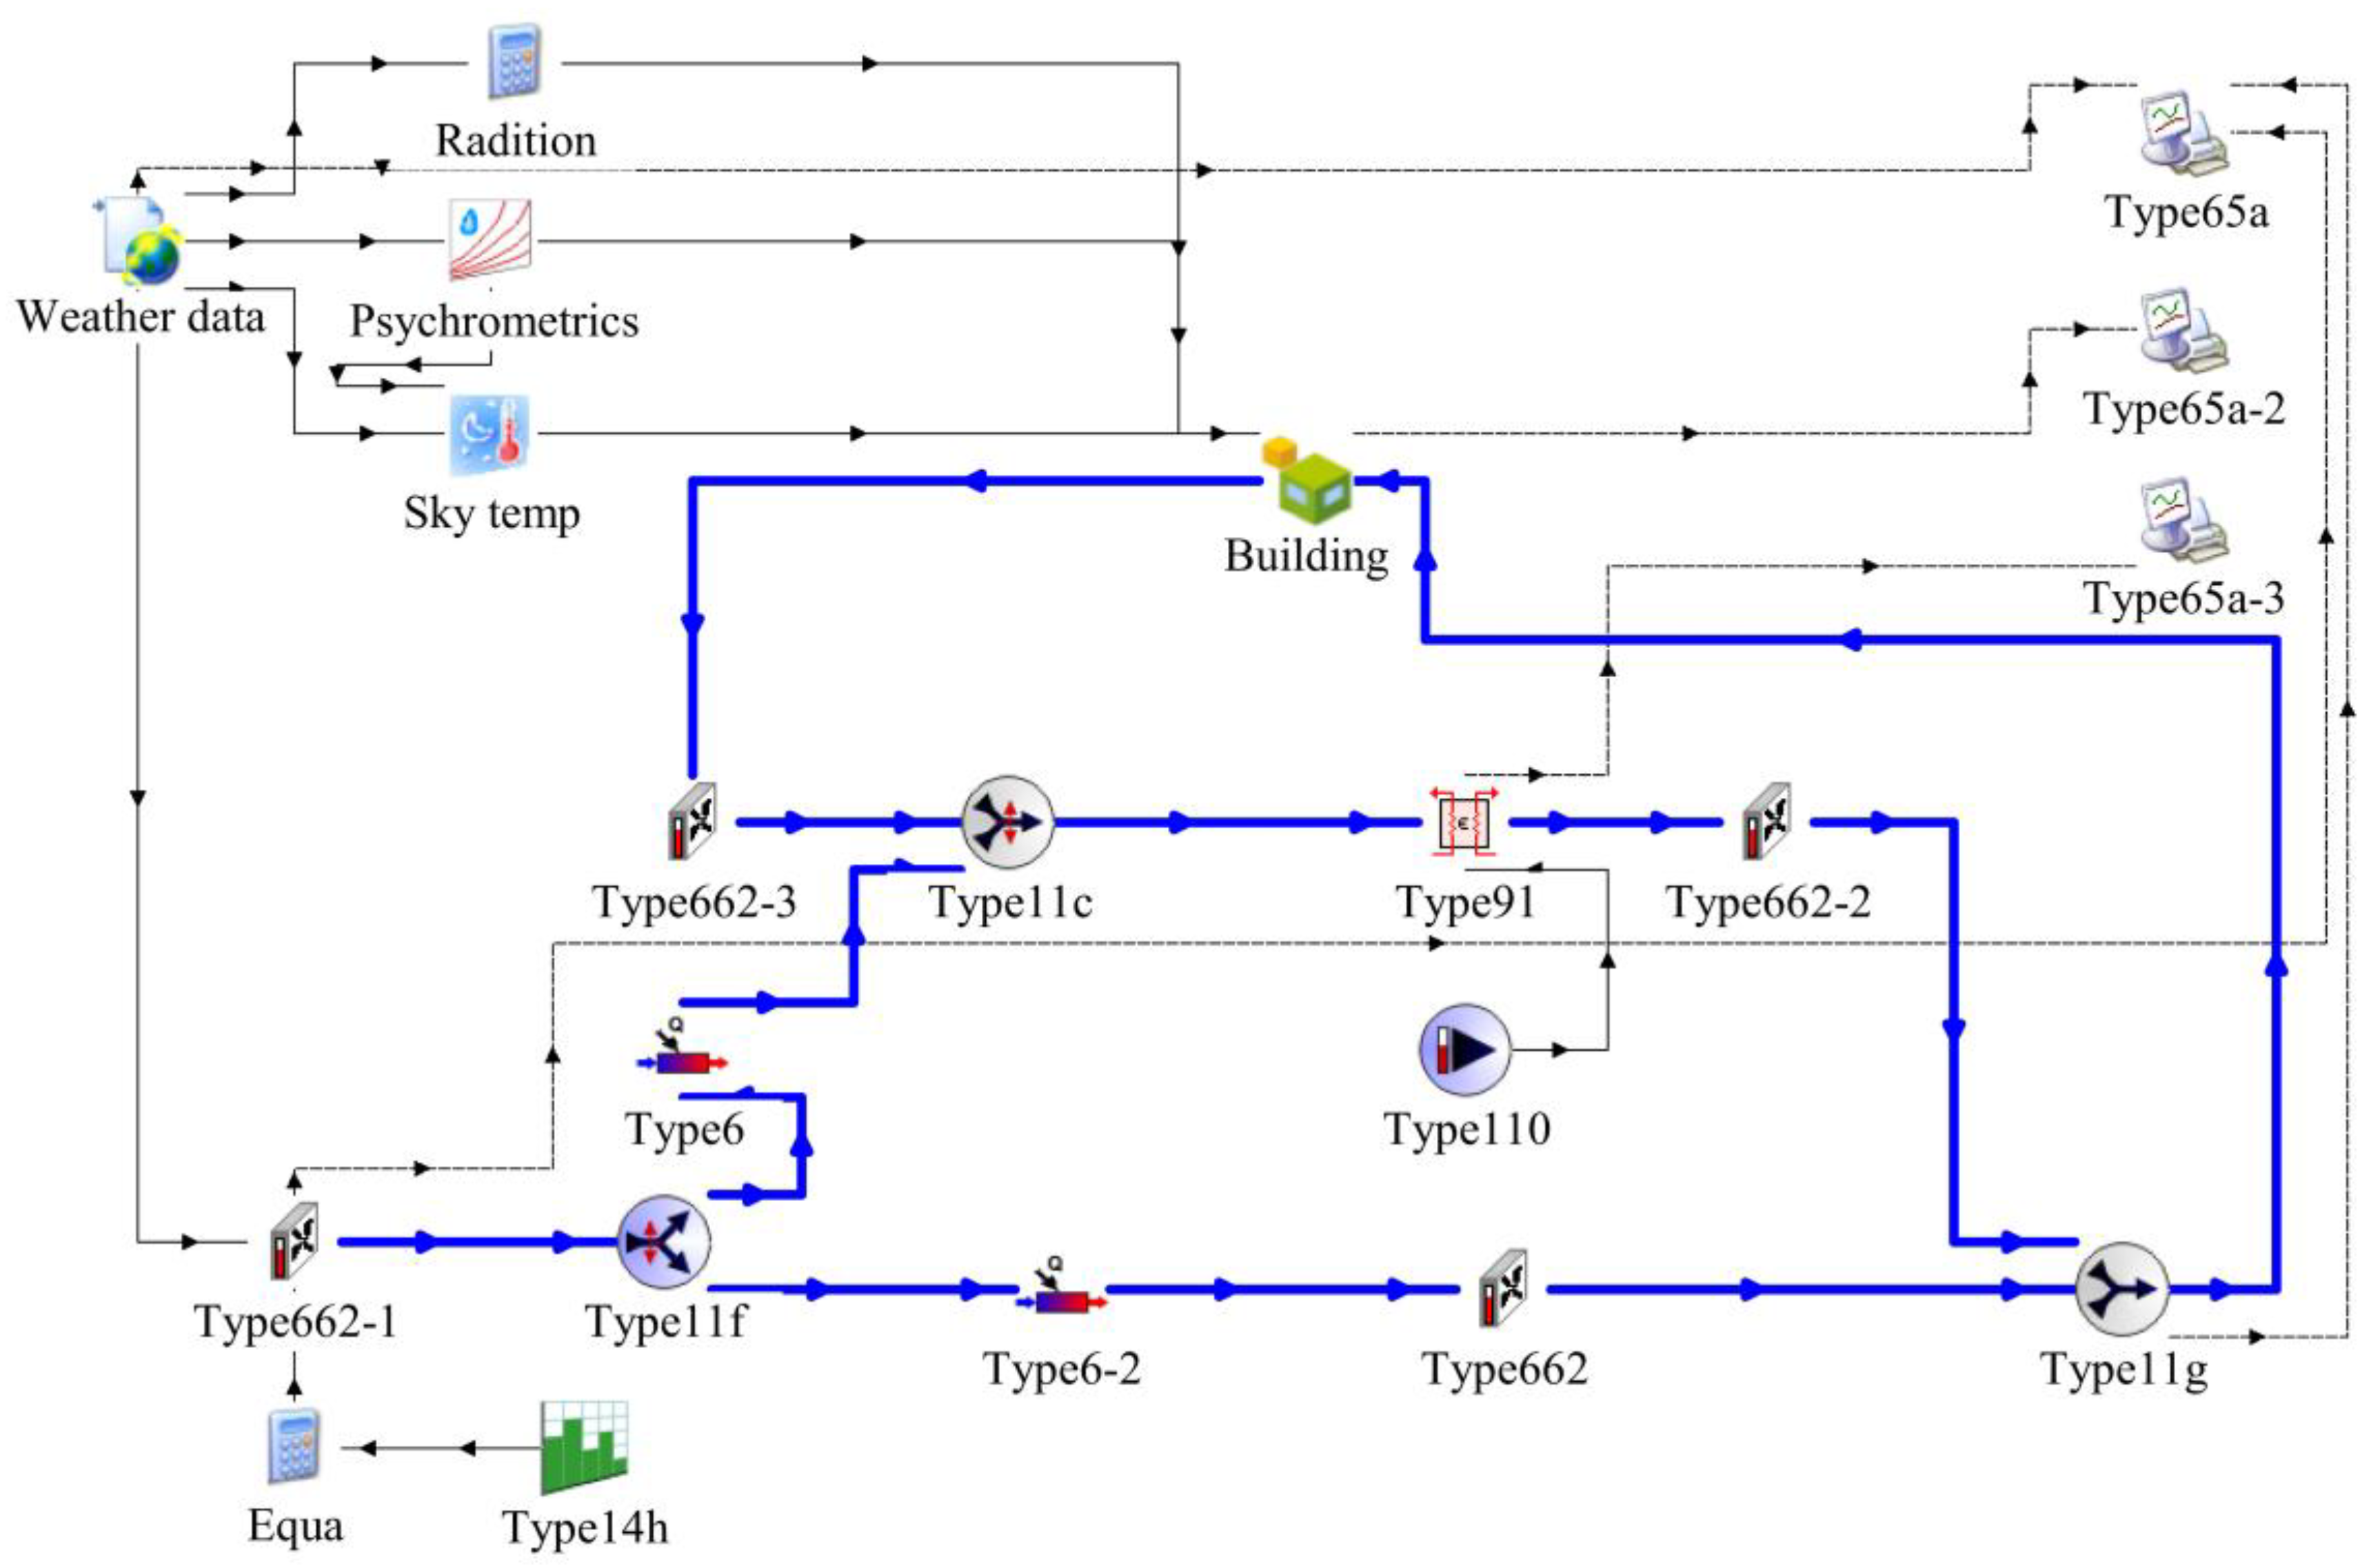
After establishing the equipment modules, the components are connected, and the simulation system is controlled using a calculator control module. The TRNSYS air-conditioning system simulation model is established as shown in
Figure 4, and it is used for the operation simulation of the frost protection air-conditioning system.
4.3. Model Validation
To verify the accuracy of the TRNSYS model for the electric preheating–bypass frost protection system, the simulation results are compared with the measured data. The apparatus used in the experiment and its detailed parameters are shown in
Figure 5 and
Table 11.
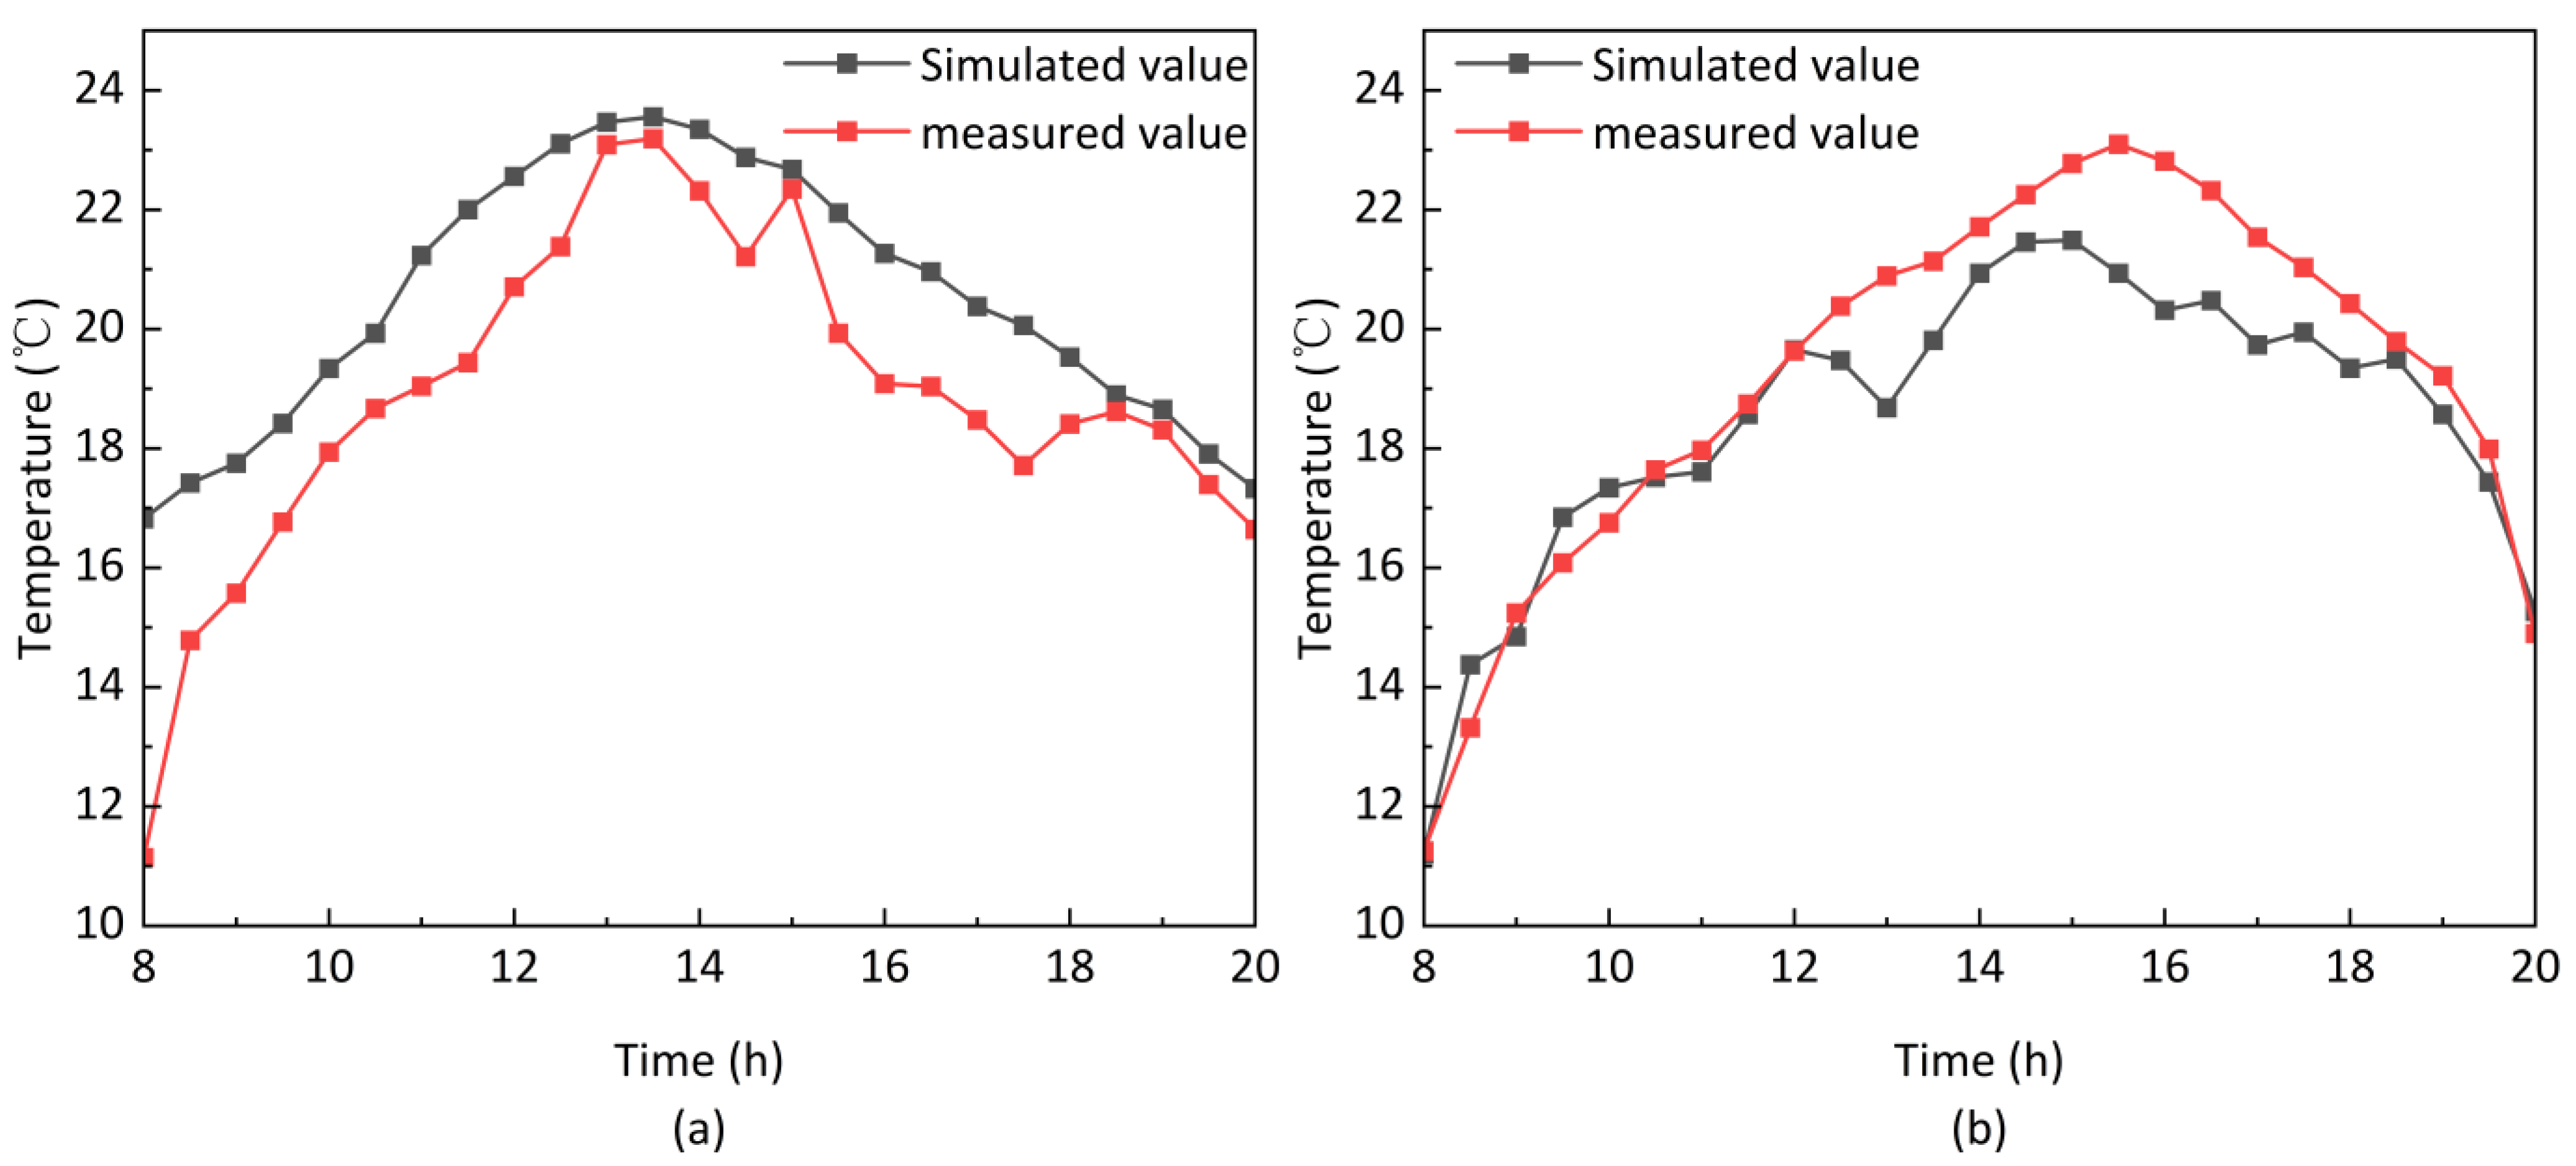
The simulation start and end times are set to 6609–6618 h, with a simulation step size of 1 h. The parameters for each equipment module are set according to the measured conditions. The deviation between the simulated and experimental values is analyzed using a deviation formula. Based on the above settings, the simulation results are obtained and compared with the measured values, as shown in
Figure 6.
From
Figure 6, it can be observed that the deviation is significantly larger at 8:00, when the system is first started, but apart from this, the simulated values and the measured values are generally in good agreement. The maximum error in the heat exchanger’s outlet water temperature is 6.05%, and the maximum error in the indoor air temperature is 6.14%. The reasons for the deviation between the simulated and measured results can be mainly attributed to three factors. First, the modules in the TRNSYS platform are somewhat idealized, resulting in discrepancies from the actual equipment; second, the simulation’s operational control is based on direct computational results, whereas the real system’s control adjustments have a response time; third, the measuring instruments used in the actual test have a certain margin of error, and inaccuracies can also occur during data reading and recording. These reasons contribute to the deviations between the simulation and experimental results. However, since the deviation values are within the allowable range, it can be concluded that the accuracy of the established TRNSYS model is relatively high and suitable for further simulation research.


