1. Introduction
The renewed European Union (EU) Energy Performance of Buildings Directive (EBPD) makes renovation mandatory in all member states, targeting to save 60% to 90% of energy by renovating 75% of EU building stock [
1]. Sandberg et al. [
2] modelled European building stock and showed that renovation volumes must rise. Suitable cost-optimal and energy-efficient measures must be developed to achieve decarbonized building stock by 2050. Currently, strategies, approaches, and methods for dealing with the goals of the renovation wave are primarily focused on individual building level to find cost-optimal renovation solutions [
3,
4,
5].
The Renovation Wave calls for an integrated, participatory, neighborhood-to- neighborhood renovation approach tailored to local environments. Municipal decision-makers and large-scale real estate owners must define, generate, simulate, and quantitatively analyze full-renovation scenarios adapted to specific districts and buildings to make well-informed investment decisions [
6]. To assess the energy performance of the buildings on a district scale, renovation strategy tools use data from national registries such as the building register, register of cultural monuments, climatic restrictions from the Land Board, etc. [
7,
8]. However, the effectiveness of these tools depends on the accuracy and completeness of the underlying data. In Estonia, for example, the quality of the Estonian Building Registry (EBR) data significantly affects the feasibility of (semi-)automatically suggesting energy-efficient renovation strategies for selected areas [
9,
10]. In particular, we try to solve the problem of data inconsistency in the EBR.
For preparing and maintaining long-term renovation plans, statistical or reference-building methods, or a combination of the two, are typically used [
7]. Calculating energy performance on a district scale often requires data that are unavailable in public registries. Previously, three approaches have been used to tackle this issue: building typologies, building archetypes, and reference buildings [
11]. Studies have been conducted to assess energy performance and promote building typology-based building-stock renovation in 20 European countries [
12] and evaluate building stock characteristics in Eastern Europe [
13,
14,
15].
There are multiple studies on building classification, many of which have compared different machine learning models on similar data available in the Estonian Building Registry (EBR). One study compared different machine learning models to classify buildings as residential or non-residential using OpenStreetMap [
16]. A 2021 study used machine learning to characterize buildings by the number of floors and the first year of use based on data on yearly electricity consumption, height, perimeter, area, and type of building [
17].
A typology similar to TABULA (2016 or later) [
12] was developed to support energy performance calculations in the Estonian building stock renovation strategy. This typology groups buildings into standardized types, requiring each building to be attributed to a specific category based on key characteristics. Among these, the external wall type is a critical parameter, as it significantly influences thermal performance and, consequently, renovation planning. While the Estonian Building Registry (EBR) contains many entries describing external wall materials, these values are often inconsistent, overly specific, or missing [
18,
19].
To address this, the national typology simplifies the range of wall descriptions found in the EBR into four generalized categories: wood, brick, lightweight concrete, and precast concrete panel. These categories are defined primarily by material and structural properties, for example, distinguishing between single-layer block walls and multi-layer panel systems. This generalization improves consistency for modeling purposes, though it requires resolving mismatches in the source data.
For instance, walls made from gas silicate panels are frequently misclassified in the EBR. Some users label them as lightweight blocks, while others list them as precast concrete panels. Neither label is technically accurate, though the former more closely reflects the material’s physical properties. In the typology, these are classified under lightweight concrete. Such inconsistencies highlight the need for a systematic identification process to assign the correct wall type, as classification errors can significantly impact renovation strategy due to differing thermal performance and retrofit requirements.
Data enrichment research has mainly focused on adding data, such as enriching the Great Britain landslide database with data from old newspaper articles [
20]. Belsky and Sacks [
21] described an innovative approach for enriching building models with semantically useful concepts inferred from explicit and implicit information in the building model. Their prototype applies a rule-processing engine and allows the composition of inference rule sets that can be tailored for different domains. Similarly, statistical modeling techniques such as Gaussian mixture models (GMM) with expectation maximization (EM) have been applied to build energy performance datasets to generate synthetic data, improving the reliability of large-scale energy modeling [
22]. These probabilistic approaches can help address data inconsistencies and enhance the accuracy of energy performance predictions. Furthermore, multiple studies have focused on building level of detail (LOD) data enrichment, like the enrichment of the level of development of LOD1 and LOD2 models with windows and doors to reach LOD3 [
23,
24,
25].
When datasets like EBR are already available, the focus shifts from adding new data to improving data quality. Ensuring the accuracy of external wall data in building registers, such as the EBR, is critical for developing effective national renovation strategies across the EU. External wall type plays a key role in calculating a building’s thermal properties, including thermal transmittance, thermal bridges, and air leakage rate. Given that these calculations inform renovation needs, inaccuracies in wall-type classification can lead to suboptimal investment decisions and ineffective energy-saving measures. Our analysis indicates that the external wall data in the EBR is of low reliability. We hypothesize that this issue can be addressed through data enrichment, using either an expert-driven approach or machine learning techniques. Specifically, by leveraging existing registry data, it should be possible to derive missing wall-type classifications or identify incorrect entries with sufficient accuracy, improving the reliability of thermal performance assessments and supporting more effective renovation strategies.
Comparison of expert and machine learning (ML) models is a sparsely researched topic. Although the superiority of ML models is often assumed and sometimes demonstrated [
26,
27,
28], a credit scoring case study by Bend-David and Frank [
29] found no statistically significant advantage for dozens of ML models over the expert system. They concluded that more expert systems in various domains need to be tested against machine learning models before one can reliably deduce which of the approaches gives more accurate results and under which conditions. Older studies in the area of medical diagnosis [
30] reported an advantage of expert systems over ML methods, while studies on soybean pathology [
26] and census data coding [
27] gave the advantage to ML. In the field of construction, an article by Bloch and Sacks [
28] from 2018 compared machine learning and rule-based inferencing for semantic enrichment of building information models, specifically for the classification of room types. Their expert model applied rule sets to unique feature signatures. They concluded that while the ML approach was very effective, the rule engineering approach was only able to classify 5 out of 15 types of spaces. A review of the 86 articles citing Ben-David and Eibe [
29] does not reveal any new comparisons between ML and expert models though there are articles describing hybrid expert–ML models [
31,
32]. To address this gap, our study systematically compares these two approaches in the context of EBR data enrichment, assessing their respective advantages and limitations. Our comparison should help in filling this research gap for our area of application. Therefore, our main objectives are the development of effective data enrichment models to correct the faulty wall types in the EBR and the comparison of expert and ML approaches for this problem domain.
We will give an overview of current research comparing expert and ML models, describe the models used to predict the correct external wall type, and evaluate their accuracy. The method of enriching low-quality data using a smaller set of expert-annotated training data and the comparison of expert and machine learning models should be of general interest. Finally, we will verify the hypothesis that additional training data would significantly improve the performance of the ML models.
2. Methods
2.1. Data from the Estonian Building Registry
Our research object, the Estonian Building Registry (EBR) (
https://livekluster.ehr.ee/ui/ehr/v1 (accessed on 22 March 2025)), contains information about buildings and infrastructure objects that are planned, under construction, or have been constructed on the territory of Estonia. The registry was established in 2003 and holds records for more than 758,545 buildings. Building owners and local governments use the EBR to process construction documents. The EBR also contains digital twin models of buildings at LOD 0, 1, and 2 [
33]. EBR and LOD models with building-specific reference information create a unique possibility to speed up building energy performance assessment at the district level. However, data availability and quality per building in the EBR and LOD models vary significantly. The EBR is the only authoritative source to obtain necessary initial information for building performance calculation at the neighbourhood level. Yet, there are limitations that we aim to overcome through data enrichment.
To develop expert and machine learning classification approaches, 416 apartment buildings from the EBR were studied and used as training data. The focus of this research is on older buildings waiting for renovation. The addresses of 416 buildings were collected from a database of renovated buildings. This ensured that all buildings possessed readily available design documentation within the EBR, enabling us to cross-verify the registry information. The correct external wall type was assigned to each building through a combination of visual on-site observations and an examination of design documentation. In parallel, a building registry-based type was queried from the EBR. In cases where multiple values or information were missing (an occurrence present in a single case within our training data), the wall type was left unassigned.
A closer look at these 416 buildings helped us identify a data quality gap. To evaluate the data quality, the EBR wall type value was used. External walls form most of the building envelope areas for multi-story buildings and, compared to other building envelope structures, have more variations in used materials and solutions. Thus, the external wall types are the basis for archetype assessment for Estonian apartment building archetypes. If the wall type value in the EBR contained either 0 or multiple values, the wall type was determined as unassigned, whereas for single values, the wall type was determined as the EBR value. The EBR wall types were compared to expert-assigned wall types. Overall, 46% of buildings (training and test data) suffered from an inaccurate wall type (in 22% of cases, the assigned wall type was incorrect, whereas for 24% of buildings, the wall type was unassigned).
An additional set of 66 buildings was utilized to validate the performance of both expert assessments and machine learning (ML) models. These buildings had not been renovated and as a result, design documentation was not available in the EBR. Their inclusion was primarily based on the feasibility of visually classifying the external wall type. The test set size was determined by practical constraints, particularly the availability of buildings meeting these criteria and the resources required for visual verification. The selected set provided sufficient coverage of the major wall type categories observed in the training data. Similarly to training data, EBR and expert observation wall types were acquired for all 66 buildings. The EBR data were evaluated similarly: if the wall type value in EBR contained either 0 or multiple values, the type was determined as unassigned, and for single values, the wall type was determined as the EBR value. Overall, 46% of buildings were assigned an inaccurate wall type (13% of walls were assigned an incorrect type, and 33% were unassigned). The data quality in EBR was similar for both the training and test datasets.
The training data obtained from EBR contained ten different external wall types. However, several of these were not feasible external wall types in principle—one such example is cladding. Cladding is an exterior finish material rather than a type of wall, illustrating the problem with raw data from the EBR. Therefore, we could not use these types as prediction targets and used expert labels to reduce the list of external wall types to four: wood, brick, lightweight concrete, and precast concrete panels.
The building data from the EBR contain 40 attributes that our models use to predict external wall type. These can be divided into the following:
Attributes describing building areas: net floor area, heated area, building common area, etc., presented as real numbers.
Attributes describing buildings rooms and floors: number of rooms, number of underground floors, etc., presented as integer numbers.
Nominal textual attributes describing the building location: county, city, and address.
Real numbered coordinates describing the building location: x and y.
Nominal textual attributes describing various materials: external walls (our target), load-bearing walls, etc.
Nominal textual values describing building systems: heating system, cooling system, ventilation system, and energy sources—several may be present at the same time, for example, an oven and a heat pump.
The 416 expert-labeled buildings do not present a large amount of data and, therefore, are not well suited for deep learning models. However, many machine learning (ML) models can be trained on such a limited amount of data. For example, the seminal classification dataset of iris flowers by R.A. Fisher [
34] contains only 150 flowers in total for training and testing. In addition, as buildings built during the Soviet era were standardized, there is also a high level of regularity. In the following sections, our learning curves demonstrate that the ML model’s performance plateau can be reached on even smaller sample sizes.
2.2. Expert and Machine Learning Approaches
This study addresses a well-known and general classification problem in the field of machine learning: predicting the class (here, external wall type) from other data. A subset of buildings was hand-checked by an expert for correct external wall type, out of which 416 buildings were used to train the models and 66 separate buildings were used as test data.
An iterative process was used to develop the expert model. A literature-based analysis [
35,
36,
37] was utilized first to identify attributes for verifying the EBR data on external walls. The first four main attributes were identified from the literature, and new ones were added based on iterative analysis of EBR data.
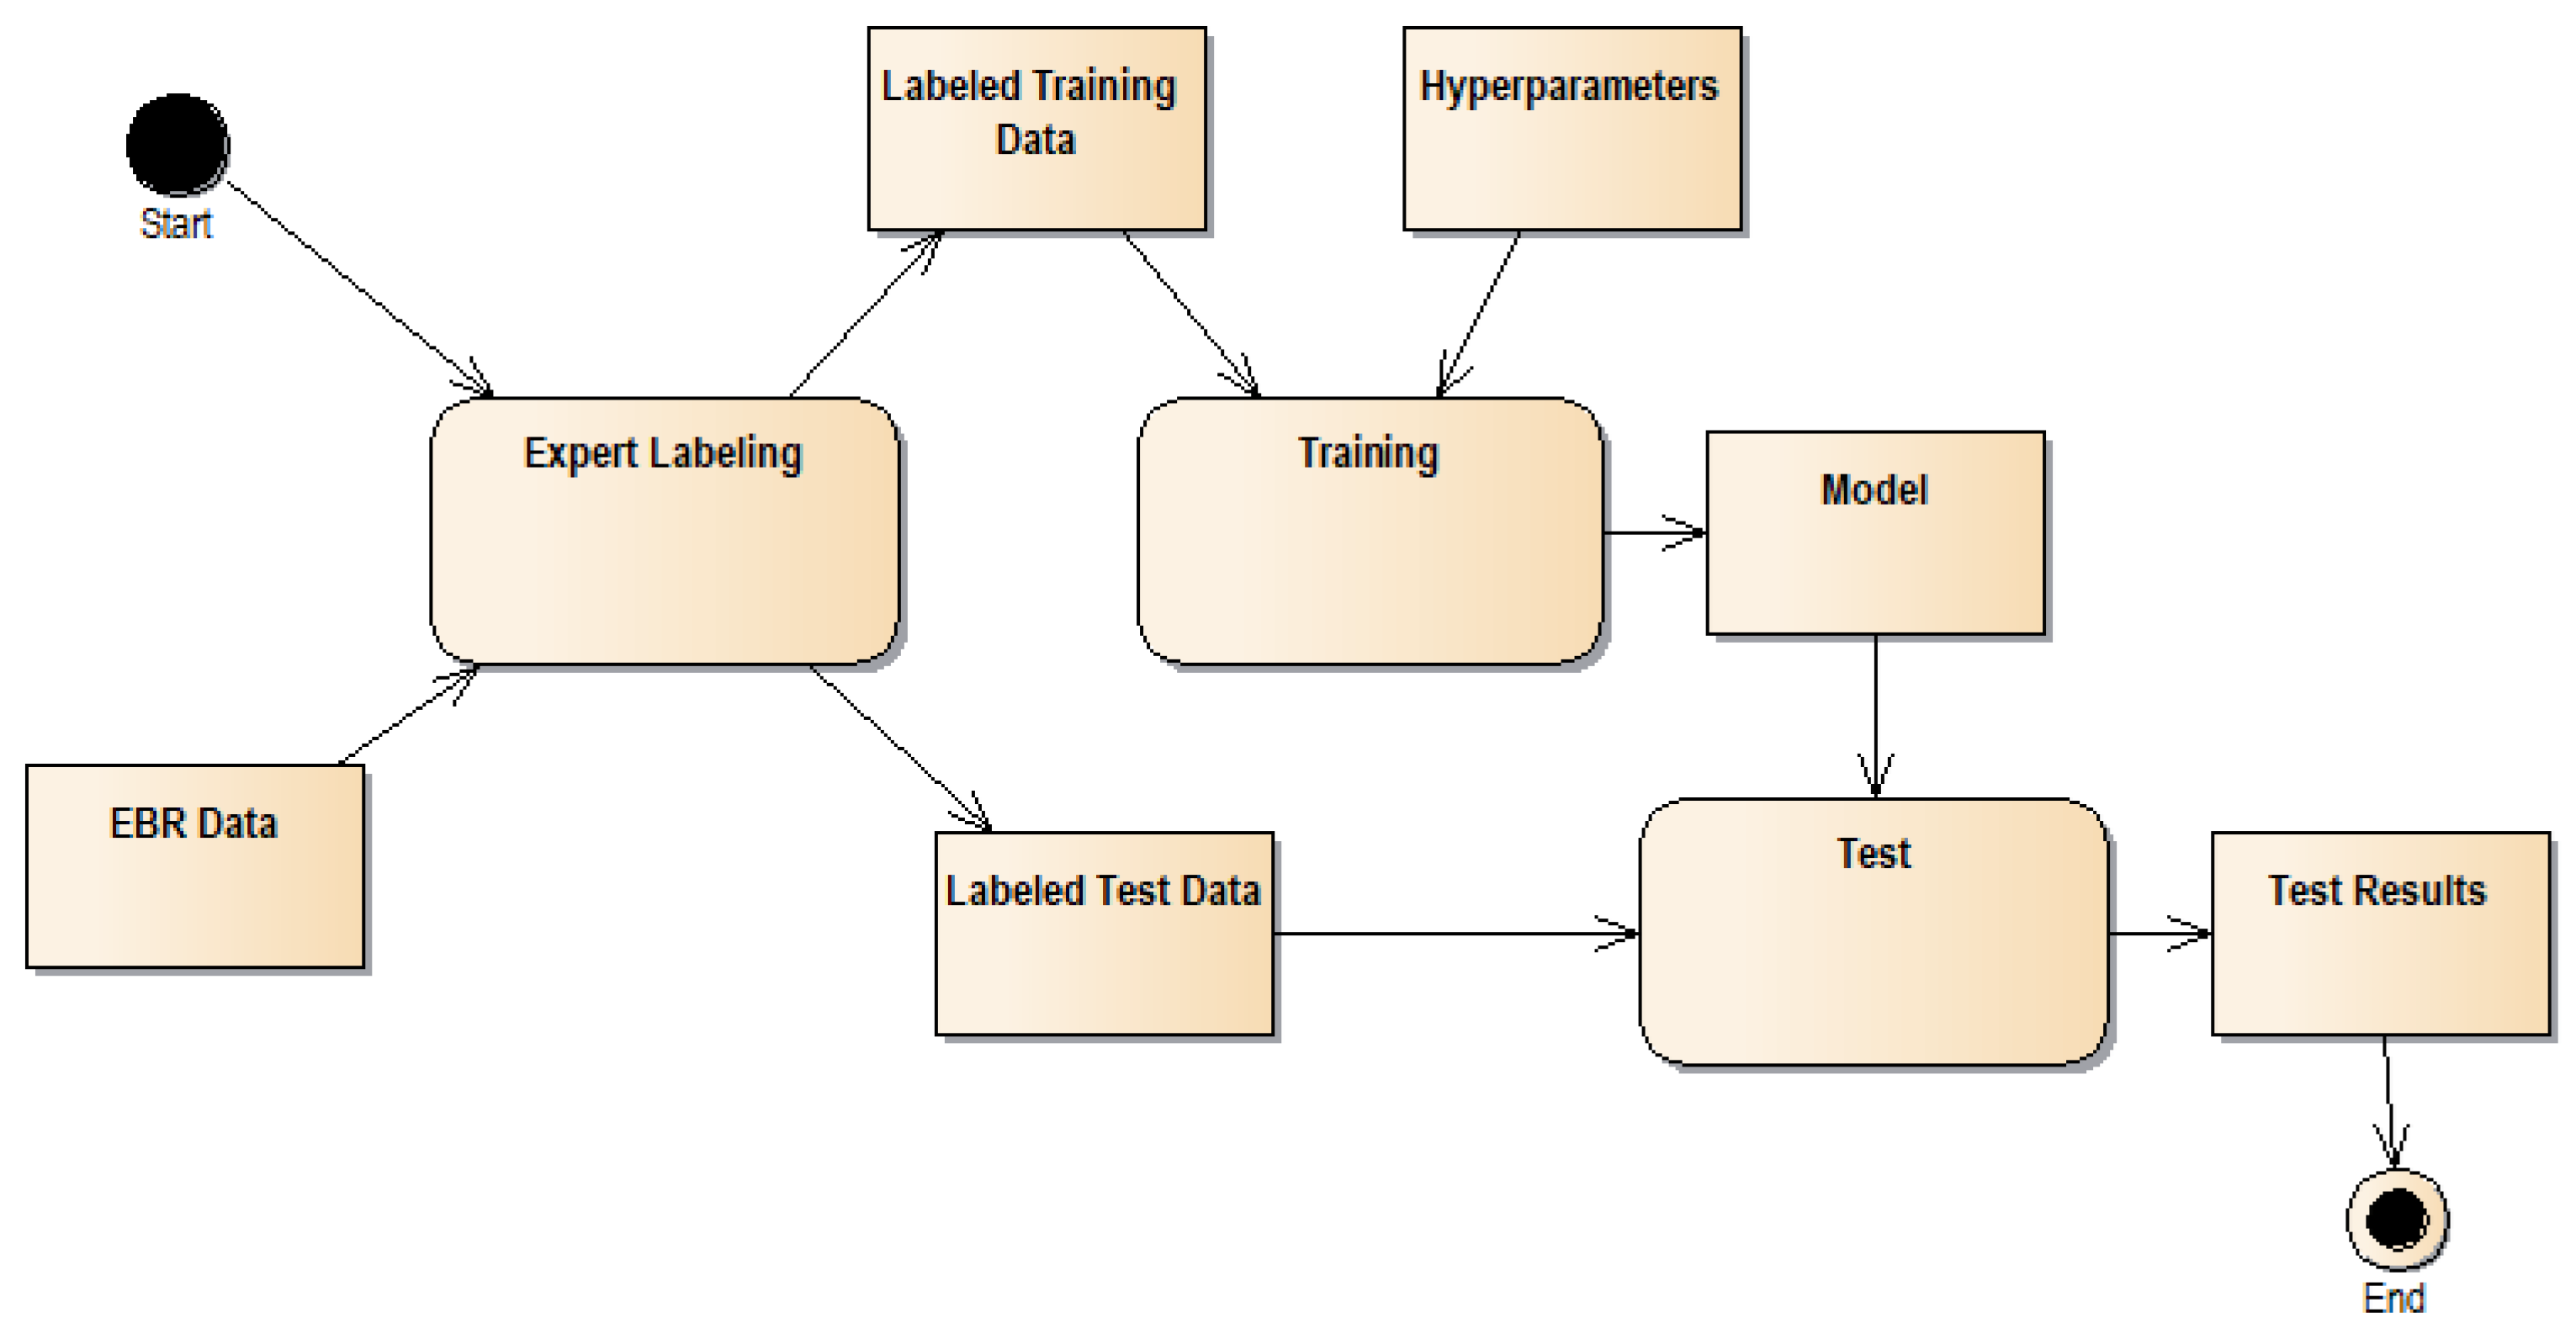
The general machine learning process is depicted in
Figure 1. We used expert labeling to provide ground truth for wall types in a subset of EBR data, which we further divided into training and test data. We use training data and hyperparameters (like the maximum depth of a decision tree) to train our predictive models. Then, we evaluate their performance with the test data.
We created three machine learning (ML) models: decision tree [
38], random forest [
39], and logistic regression ML classifiers. Training of those ML models was based on several hyper-parameters (parameters controlling the training process) like the maximal depth of a tree or the number of estimators in the forest. We used automatic hyper-parameter tuning to find optimal hyper-parameters for accuracy. The fourth ML model based on the simplified random forest was added after learning curve analysis.
Learning curves that plot model performance for a given sample size were used to detect over-fitting and to assess possible benefits from the additional training data. If the model’s performance is significantly better for training than the test sample, then it indicates that the model complexity approaches that of the training data. Such a model encodes the expected result for each training sample (building), performing poorly on novel data due to over-fitting. A larger amount of training data reduces over-fitting. Secondly, if the model’s performance on test data plateaus before the maximal available amount is reached, then we cannot expect much benefit from additional training data for that model. However, if the performance maintains an upward trend, we can expect further performance improvements from additional training data.
To compare our expert and ML models, we divided our data into training and test datasets and used well-known metrics like accuracy, F1 score, and confusion matrix for the evaluation.
A feature engineering step that selects an informative subset of existing attributes or introduces new attributes is often used in machine learning processes. While selecting an effective subset of attributes can benefit some models like logistic regression, models like decision tree and random Forest are quite insensitive to the presence of irrelevant attributes. As our main aim is to develop machine learning models that mimic the expert model (a decision tree), use the same data, and can be implemented quickly (advantage of ML), we did not include a feature engineering step.
3. Expert and Machine Learning Models
We created expert and ML models to predict the correct external wall material using the training dataset in which we provided the correct external wall type (annotations) based on expert observations. Our test dataset contained 66 annotated buildings with expert labels.
3.1. Expert Data Enrichment
Four main attributes were identified based on the literature review [
35,
36,
37]: external wall type value in EBR, location (represented by county), number of floors, and year of first use. A dataset of 416 buildings was used to evaluate whether the literature-based attributes represent reality. Our analysis demonstrated that the statistical characteristics of these attributes were consistent with the findings documented in the literature. Consequently, the first iteration of the expert model was developed utilizing those four attributes. However, this initial model’s efficacy was found to be inadequate, primarily due to some buildings having either missing or too many wall type values listed in EBR. As a solution, additional attributes had to be considered. We introduced the structural material value obtained from the EBR as an additional attribute for buildings with either no or multiple values listed as the wall type. The expert-created decision tree model is depicted below as a nested list with predicted wall types in bold. A sub-tree of the full decision tree is described separately as Sub-tree One to manage complexity.
External wall type?
- (a)
Brick: Structural material value contains block?
- (b)
Small or large block: More than 5 stories?
- (c)
Precast concrete panel: Structural material value contains block?
- (d)
Equals wood, log or timber truss with filling: More than 4 stories?
- (e)
Has multiple values or value is missing: Go to Sub-tree One...
Sub-tree One is depicted below.
- 2.
Structural material type?
- (a)
Brick: Brick.
- (b)
Small or large block: More than 5 stories?
- (c)
Has multiple values: Structural material value contains block?
- (d)
Value is missing: More than 4 stories?
The expert model was designed with a decision tree structure, branching into three distinct paths based on the availability of data within the EBR. Focusing on the reliability of the external wall type value within the EBR gave this attribute top priority in the decision-making process. The three distinct paths in the expert model were implemented as follows:
In instances where the external wall type consisted of a singular value, supplementary checks were conducted, culminating in the assignment of the final wall type.
In the case of missing or multiple external wall type values, the determination of wall type relied on the structural material type value, as depicted in Sub-tree One. As a result, the expert model predicted a detailed type or the general identification of stone or wood type.
For multiple structural material types, the listed values were checked for keywords. If certain keywords were found, then assigning a specific external wall type was possible. A stone or wood type was assigned if keywords were not listed.
If the structural material type was missing in the EBR data, then based on the checks (Sub-tree One), only the general stone or wood external walls were predicted. This represents a loss of accuracy.
3.2. Machine Learning Data Enrichment
The expert and machine learning (ML) models used the same training and test datasets. We transformed all the data into a numerical form for our ML models. We dropped the attribute corresponding to the precise building address as it was too specific. We kept the attributes corresponding to county or town. The original dataset contained several other nominal attributes corresponding to building materials used for roofs, walls, etc., or the presence of a furnace, heat pump, etc. These were all transformed into binary attributes for each nominal value using one-hot encoding.
We used decision tree [
38], random forest [
39], and logistic regression ML classifiers as implemented in the Python 3.11 scikit-learn [
40] library, version 1.2.2. We tuned the hyper-parameters that defined the structure of our models and the training process for each of these models using grid search as implemented using scikit-learn. The tuning process optimized the hyper-parameters for best accuracy. We analyze the learning curves using the corresponding scikit-learn functionality.
The first model we trained was a decision tree. Optimal hyper-parameters for the decision tree were as follows:
criterion = entropy;
max depth = 3;
splitter = random.
Criterion is the function that measures the quality of the sub-sample selected by each node in the tree; the options checked were
entropy and
Gini. Max depth sets the maximum amount of nodes in one branch. Splitter selects the feature and threshold used in the decision node; the options checked were
random and
best. A detailed hyper-parameter description can be found in the Python scikit-learn library [
40] documentation and theoretical literature. A decision tree trained on the training data of 416 buildings using the above-mentioned optimal hyper-parameters is shown below as a nested list where output types are in bold.
It is interesting to note that the max depth is quite low, and the decision tree has somewhat lower complexity than the expert model, which is also organized as a decision tree. As machine learning training processes are pretty opaque, it is hard to give a precise explanation for such simplicity besides the fact that such a model gives optimal results for the hyperparameter search space under consideration.
Next, we explored the random forest. The optimal hyper-parameters for the random forest were as follows:
criterion = Gini;
max depth = unlimited;
number of trees = 80.
Criterion and max depth are the same as for the previous decision tree model, applying to all decision trees in the forest, while the number of trees is the number of decision trees in the forest. The prediction of the forest is found through the majority voting of the trees. Interestingly, the optimal max depth of a single tree is unlimited, which makes every tree in the forest more complex than the previous decision tree model and the entire forest much more complex. It is unrealistic to reproduce the entire forest of 80 trees here. Therefore, we give the feature importances for the nine most important features of the forest as calculated by
sklearn in
Table 1.
We also trained a simplified version of the random forest, but as the justification of its creation follows from the analysis of the results of the random forest, we present it later in the Results section.
Finally, we trained an ML model based on logistic regression that estimates the probability of the material based on linear functions of the features, where the features are assigned positive (increase the probability), zero, or negative (decrease the probability) coefficients. The logistic regression pipeline included standardization of all attributes to a mean of 0.0 and standard deviation of 1.0.
Optimal hyper-parameters for the logistic regression were as follows:
C = 0.45;
Penalty = L1;
Max iterations = 180;
Solver = liblinear.
Cost (C) is the inverse regularization strength; smaller values support stronger regularization, and the default is 1. Regularization aims to simplify the generated functions. The penalty is the norm to use for regularization, with the options being L1 (lasso) and L2 (least squares error). L1 tends to increase the number of zero coefficients. Max iterations is the maximum number of iterations used in training the model and the solver represents different algorithms for generating the model, with options being lbfgs and liblinear.
As the number of non-zero coefficients was high even with L1 regularization, we will only present those numbers for each class in
Table 2 to illustrate the complexity of our functions.
4. Results
A test set of 66 buildings was used to evaluate the accuracy of the created models. To assess the baseline accuracy of the registry data, we compared the raw EBR data to expert-verified wall types. Using the same approach described in the Methods section for evaluating training data, 54% of the buildings in the test set had a correctly assigned wall type in the EBR. Applying the developed expert model, 89% of buildings were assigned correct wall types, while ML random forest correctly assigned 88% of wall types. In the context of gas silicate panel walls, the most-often indicated wall type within the EBR, the building register values were correct for 56%. Using the expert model decreased the error and the accurate type was assigned for 82% of buildings.
We evaluate the performance of the models by accuracy and F1 score. Accuracy is the ratio of correct predictions to all predictions. Accuracy can be misleadingly high if classes are unbalanced and the classifier exhibits good performance for common classes and poor performance for rare classes. The F1 score is used to compensate for the class imbalance. For two classes (positive and negative) F1 score is defined as follows:
where precision is the ratio of true positives to all predicted positives and recall is the ratio of true positives to all real positive cases. The multiclass F1 score (macro F1 score) is an average F1 score over all classes (positive being the presence of the class and negative the lack of the class). Accuracy and F1 score are therefore both dimensionless quantities that range from 0 to 1. Random guessing between two equally probable classes should have an accuracy and F1 score of around 0.5. The results for our models are presented in
Table 3.
The confusion matrix displays the frequencies of objects for all true class (row) and predicted class (column) combinations (correct predictions are on the main diagonal), making explicit the frequencies of different error types (false positives, false negatives for binary classification).
4.1. Expert Data Enrichment
Utilizing the expert model, the correct type was predicted for 89% of buildings.
Accuracy = 0.8933.
F1 = 0.9012.
The confusion matrix for the expert model is shown in
Table 4. As shown in the confusion matrix, the different types of errors are mostly balanced with no single type dominating. There is a slight tendency towards predicting precast concrete when the actual wall type is lightweight concrete or brick.
These results improve significantly on initial low-quality data and are very competitive with the results from machine learning models described below.
4.2. Machine Learning Data Enrichment
For the ML data enrichment models, we checked for over-fitting and the potential for improvement through additional data by plotting the learning curves. As this involves training and evaluating the model afresh for various sample sizes, we could not use this method for the hand-crafted expert model.
Metrics for the decision tree calculated on the test data were as follows:
Accuracy = 0.8267.
F1 = 0.8452.
The confusion matrix is shown in
Table 5.
As demonstrated by the scores and confusion matrix, our classes are quite balanced, and the simple accuracy metric is informative and sufficient. As shown in the confusion matrix, there is a strong tendency to predict precast concrete when the actual wall type is lightweight concrete.
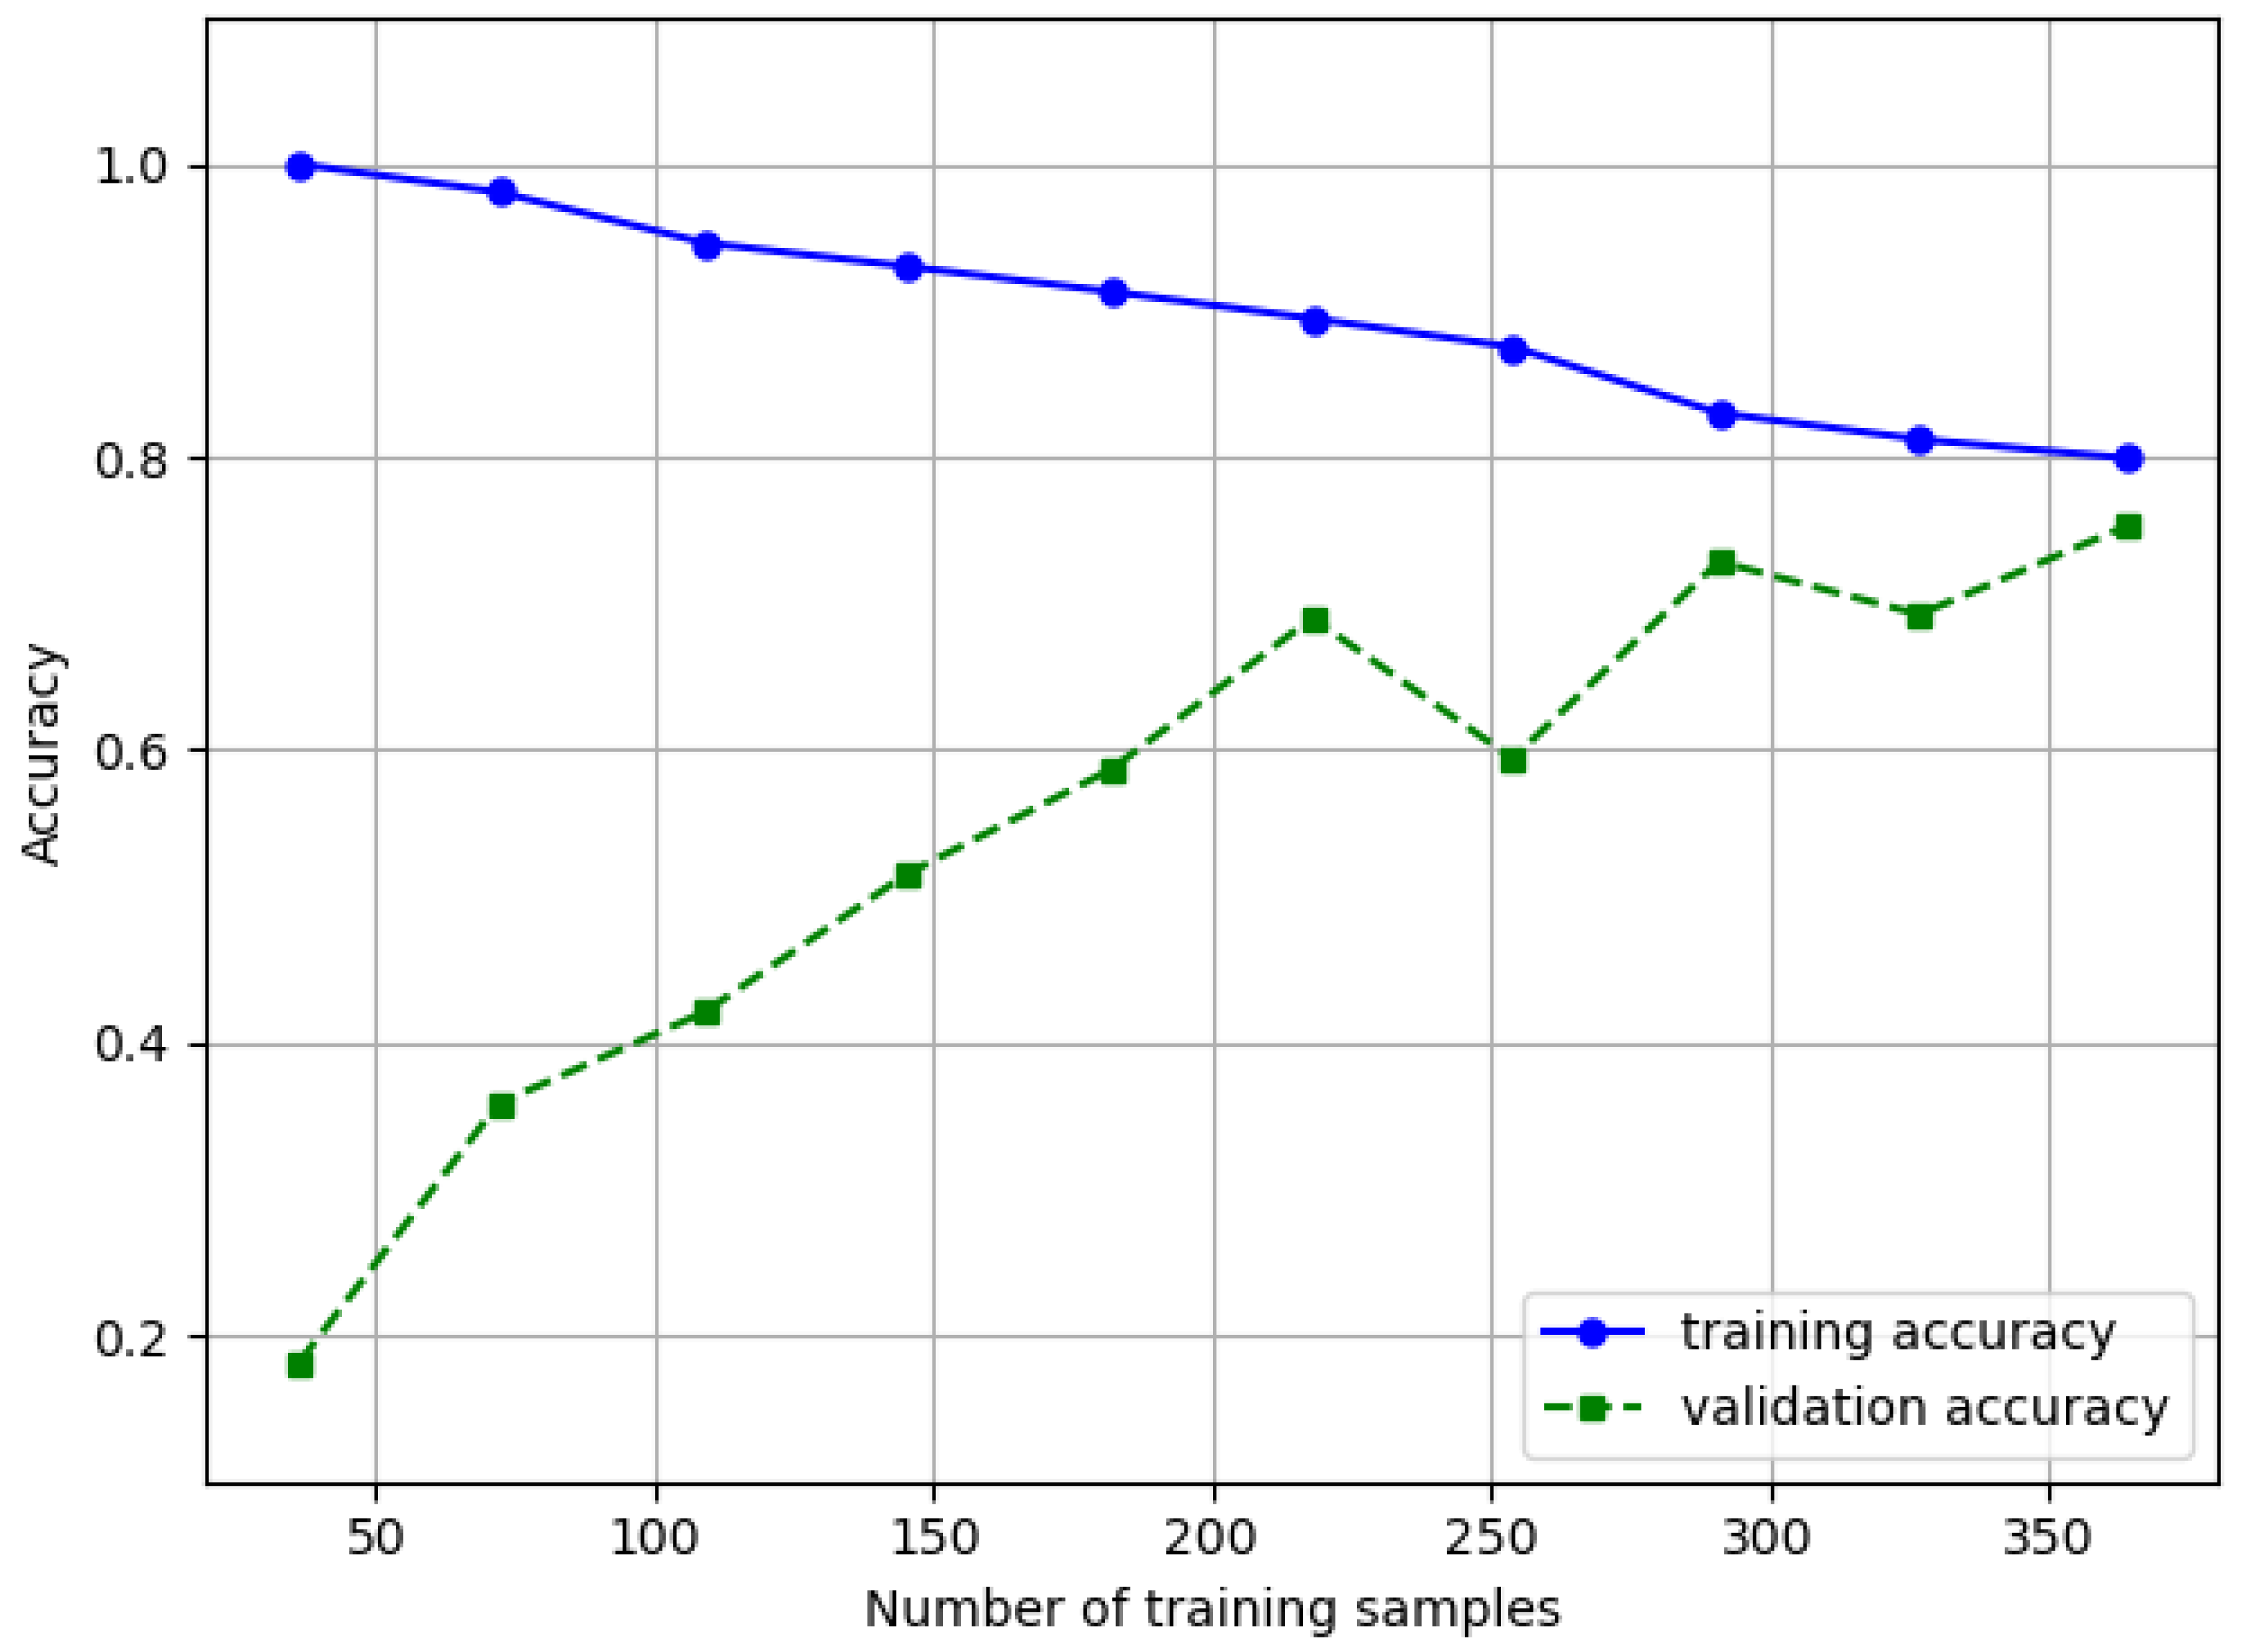
The learning curve for the decision tree (
Figure 2) plateaus around 220 buildings and the difference between training and validation accuracy becomes quite narrow beyond this point. This demonstrates the absence of over-fitting and that we have sufficient data for the model.
Metrics for the random forest calculated on the test data were as follows:
Accuracy = 0.8800.
F1 = 0.8903.
The confusion matrix is shown in
Table 6. As was the case with the expert model, the different types of errors are mostly balanced with no single type dominating. There is no tendency to falsely predict lightweight concrete walls as precast concrete, which was the case in the previous model.
Although the learning curve for random forest (
Figure 3) plateaus around 220 buildings, the difference between training and validation accuracy remains wide and accuracy for training data is optimal at 1.0. This indicates strong over-fitting from the complex model (no limit for max depth of trees, etc.). Even when validation accuracy remains high, this indicates benefits of simplifying the model or training the model with a larger dataset. Acquiring a larger labeled dataset was not realistic at the time of the study; therefore, we also included a simpler random forest.
To find the optimal hyper-parameters for the simpler random forest, we limited the max depth to five and the maximal number of trees to 100 for our hyper-parameter tuning. The best hyper-parameters were the following:
criterion = entropy.
max depth = 5.
number of trees = 60.
Feature importances for the 10 most important features of the simplified forest, as calculated by sklearn, are given in
Table 7. These are dimensionless units showing the mean decrease in impurity as measured by Gini or entropy metrics.
Metrics for the simple random forest calculated on the test data were the following:
Accuracy = 0.8133,
F1 = 0.8319.
There is a slight decrease in accuracy and a slight increase in F1 score compared to the previous complex version of random forest (see
Table 3).
The confusion matrix is shown in
Table 8. There is a tendency to falsely predict that lightweight concrete walls are precast concrete walls, which was not present in the previously discussed more complex random forest.
The learning curve for the simple random forest (
Figure 4) shows a dip in training accuracy starting from 250 training samples. Over-fitting is less of a problem than for a more complex random forest, but additional data would likely reduce this even further.
Finally, we trained a logistic regression model. The linear functions for predicting each material were following:
Its performance metrics were as follows:
Accuracy = 0.8133
F1 = 0.8319
There is a decrease in accuracy and F1 score compared to the decision tree and both random forest models.
The confusion matrix is shown in
Table 9 and, as was the case with decision tree, significantly exhibits the error of predicting precast concrete when the actual wall type is lightweight concrete.
Its learning curve (
Figure 5) plateaus around the sample size of 250 buildings. Over-fitting does not seem to be a major problem at this point, as the training and validation curves become quite close. Additional data are unlikely to improve this model.
To compare the performance of different methods over different wall types, we also calculated F1 scores (Equation (
1)) for each separate class (wall type) as shown in
Table 10.
We can see that the expert model and random forest outmatch other models when predicting precast and lightweight concrete walls. For other wall types, the performance is comparable.


 ,
, 


