

Modified Energy-Based Design Method of the Precast Partially Steel-Reinforced Concrete Beam–CFST Column Eccentrically Braced Frame
Abstract
1. Introduction
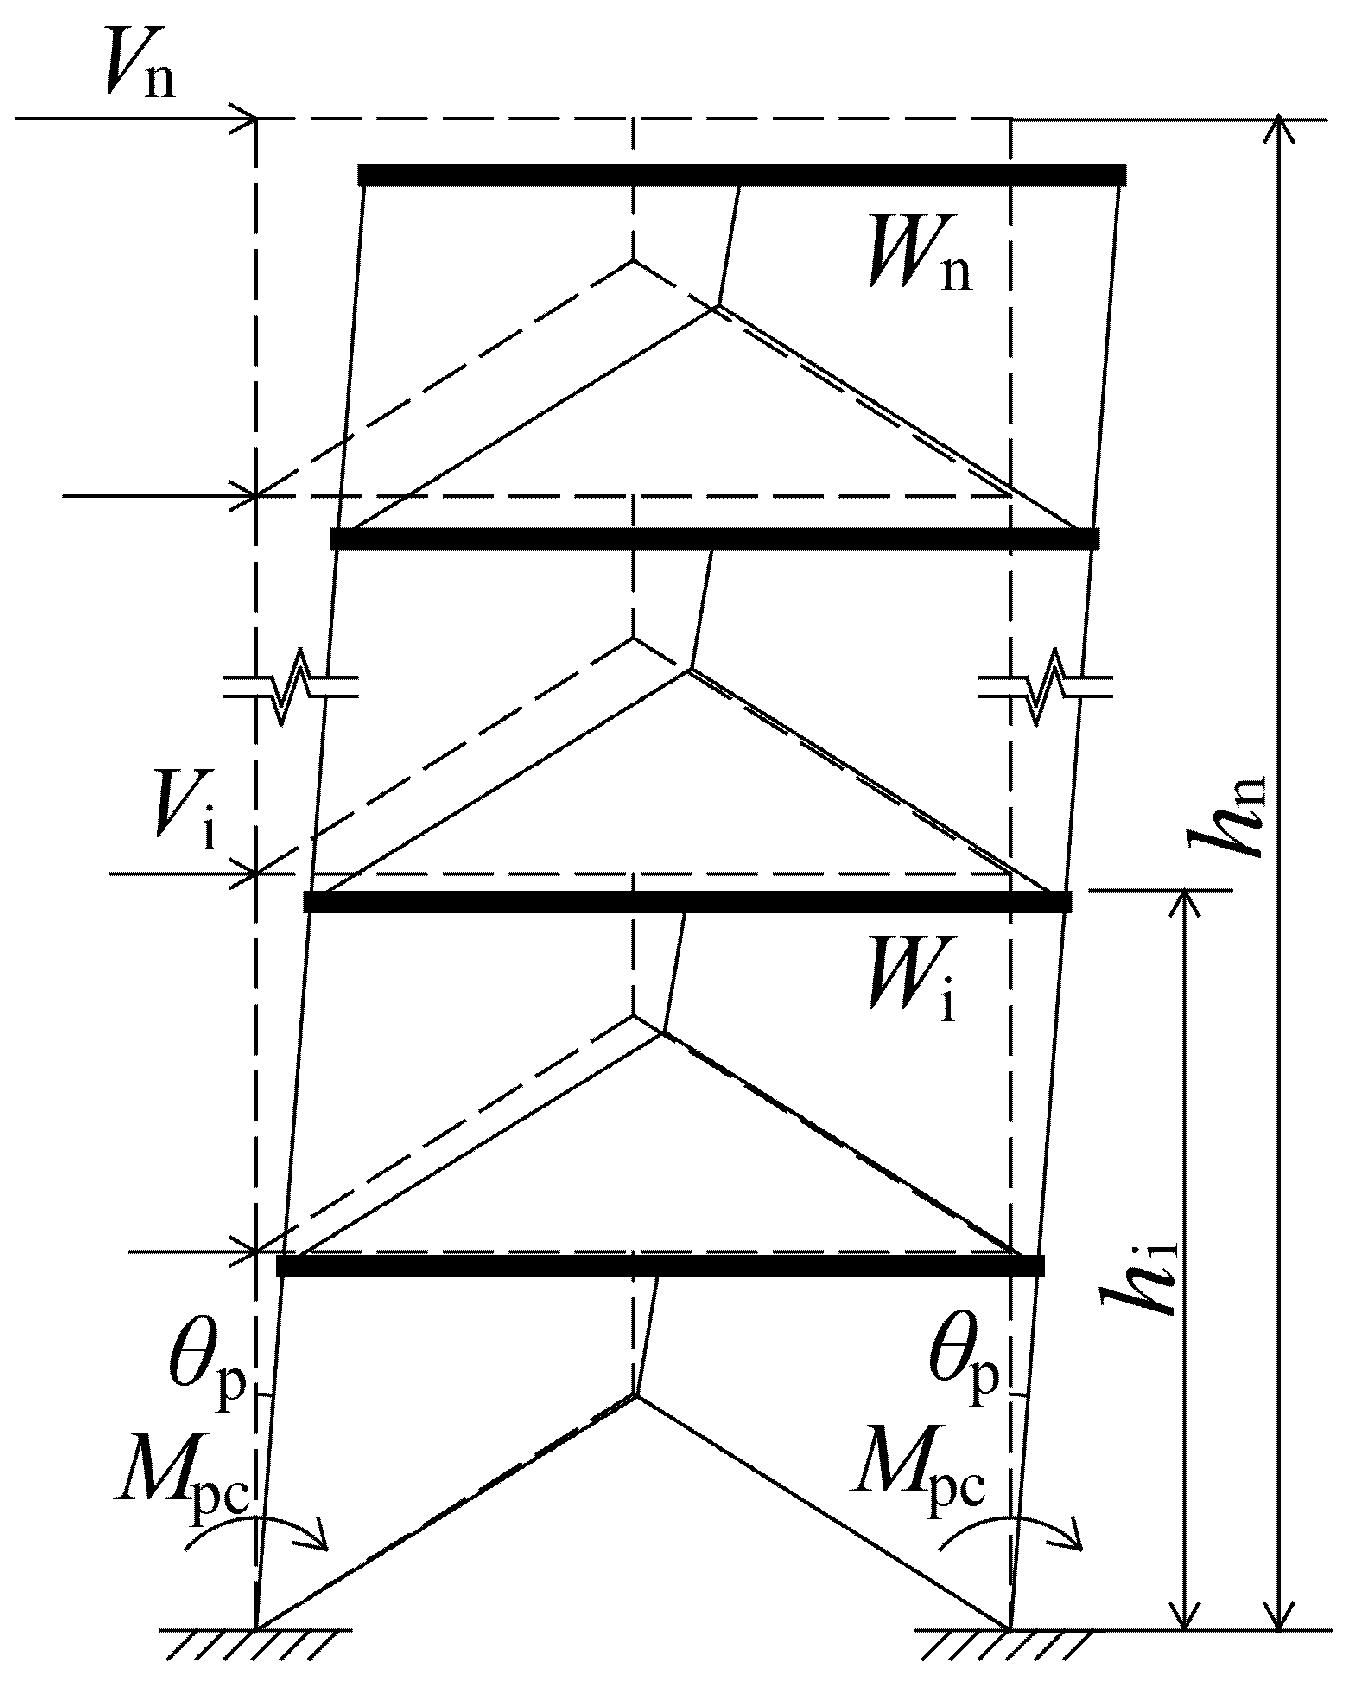
2. Design Method
- (1)
- Determination of the cross-sectional dimensions and design parameters
- (2)
- Determination of the energy dissipation
- (3)
- Determination of the lateral force
- (4)
- Determination of the distribution coefficient ψ for the energy dissipation
- (5)
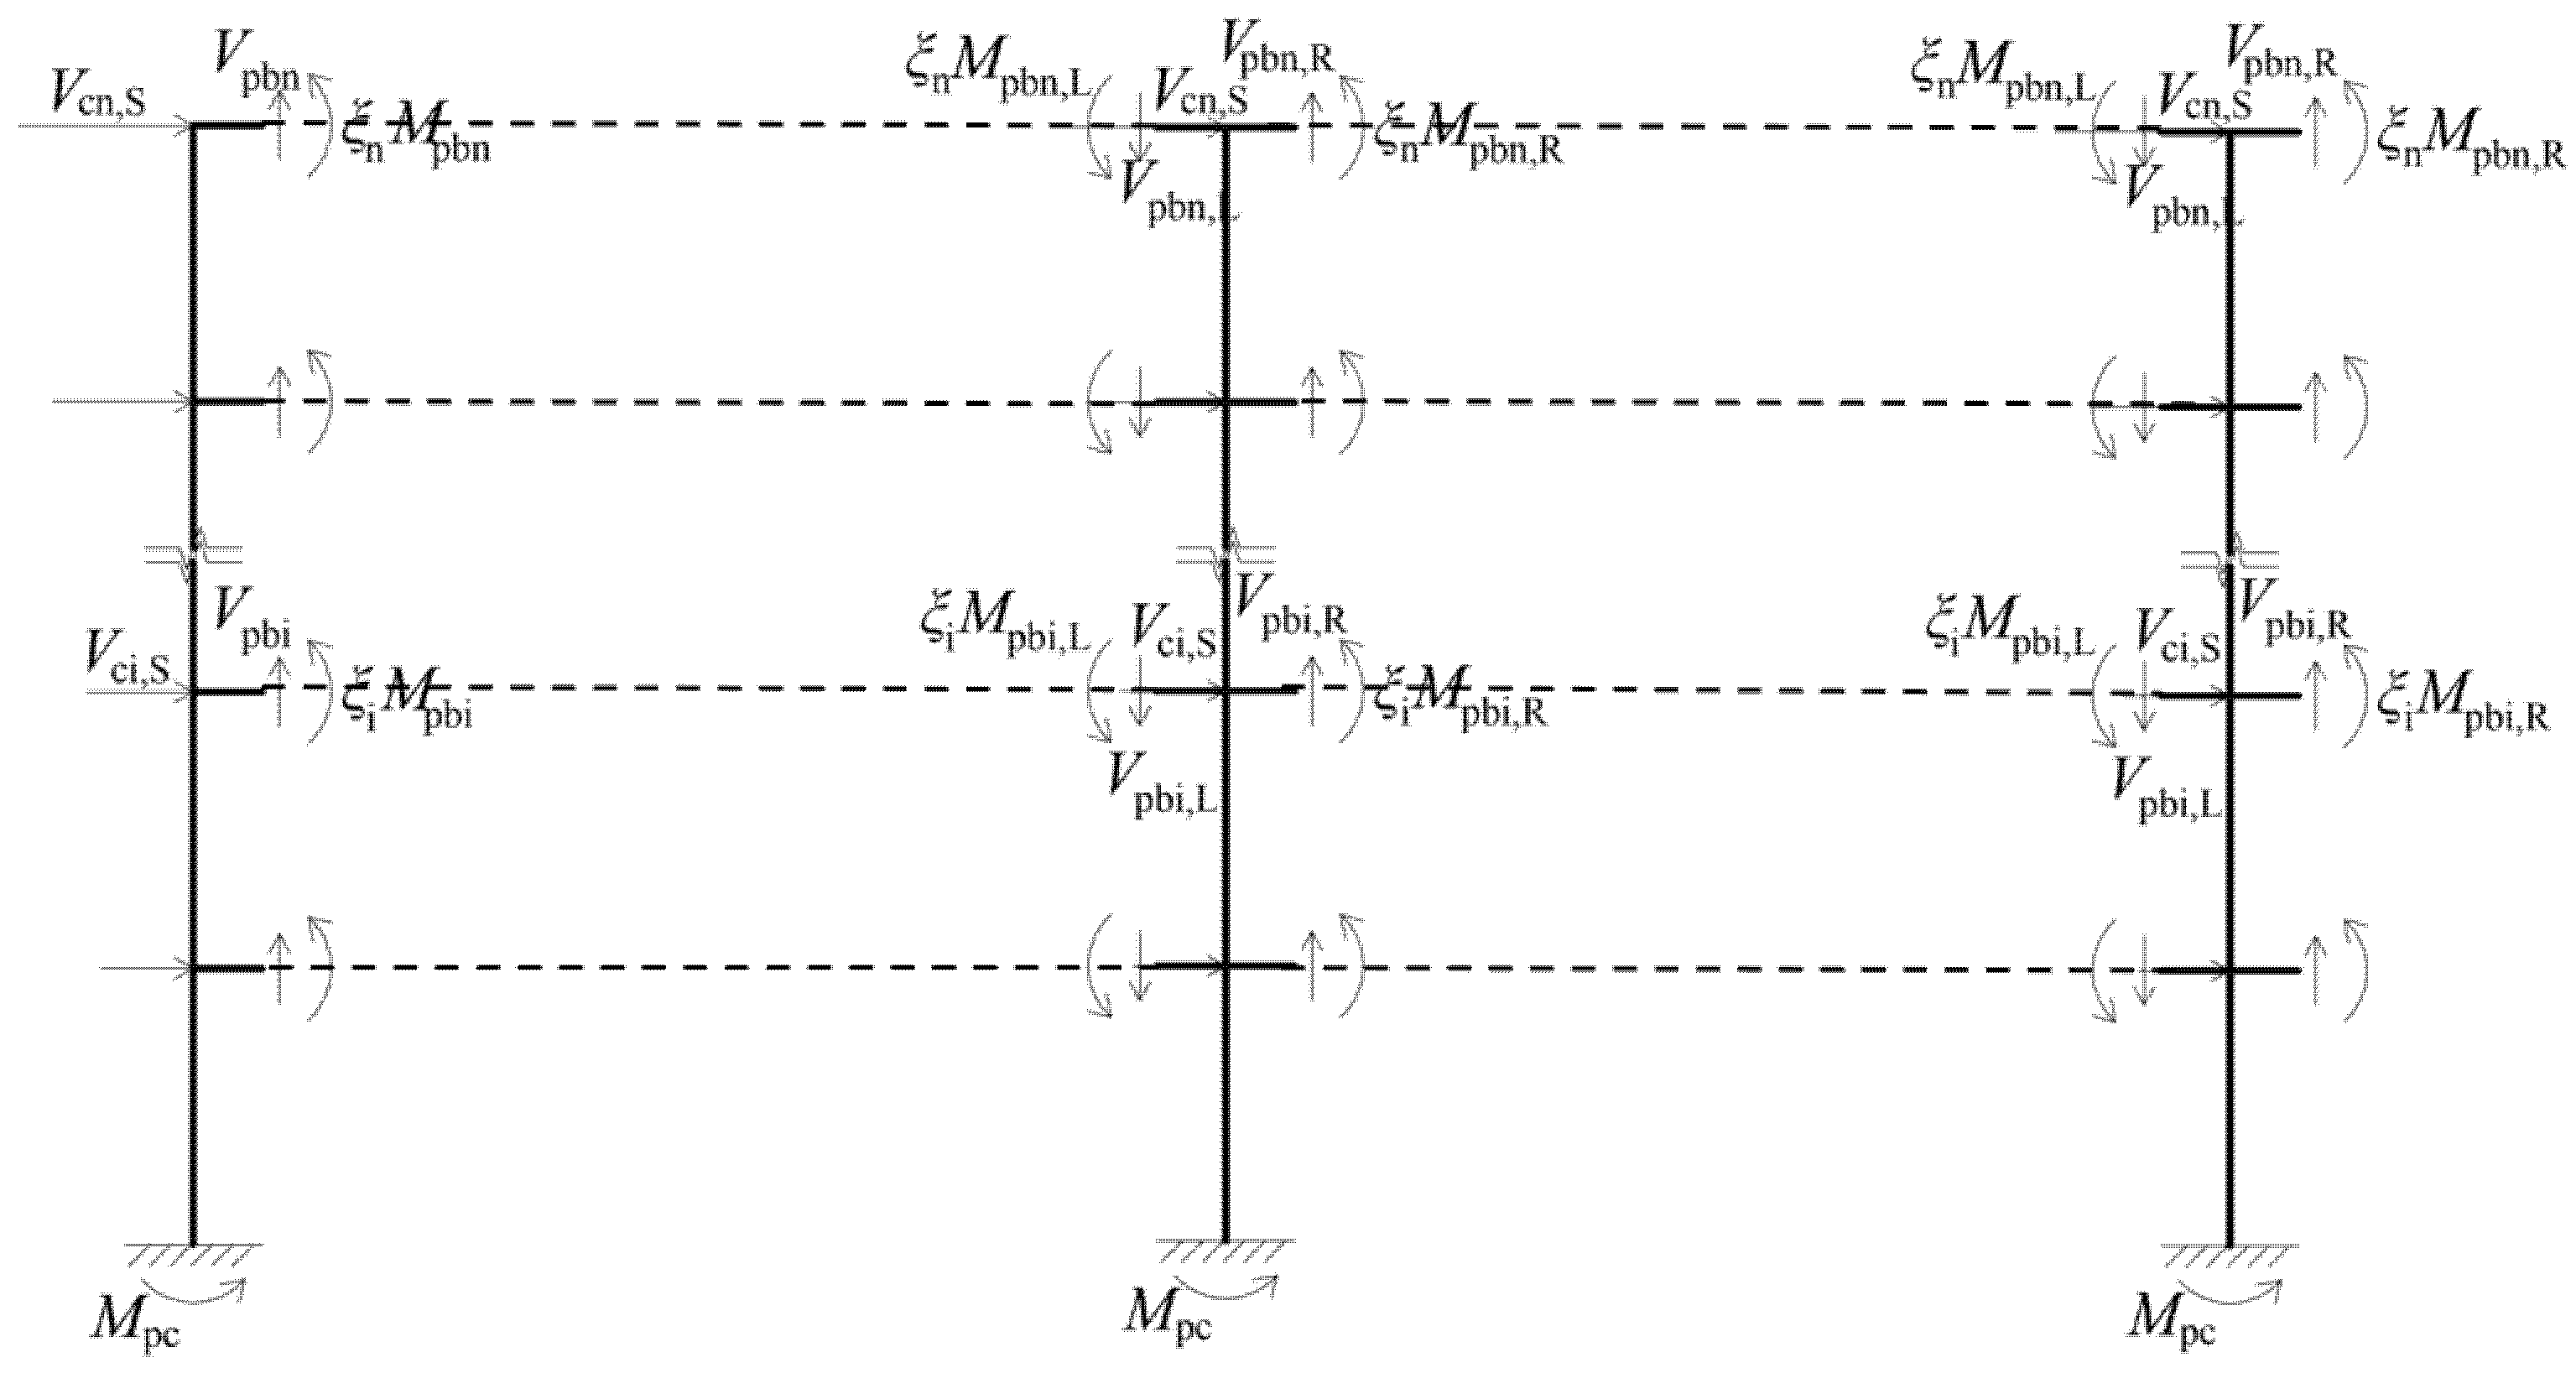
- Design of the frame beam
- (6)
- Design of the frame column
- (7)
- Design of the eccentric brace system
- (8)
- Determination of the additional influence of the eccentric brace system
- (9)
- Check the deformation requirement
3. Case Study
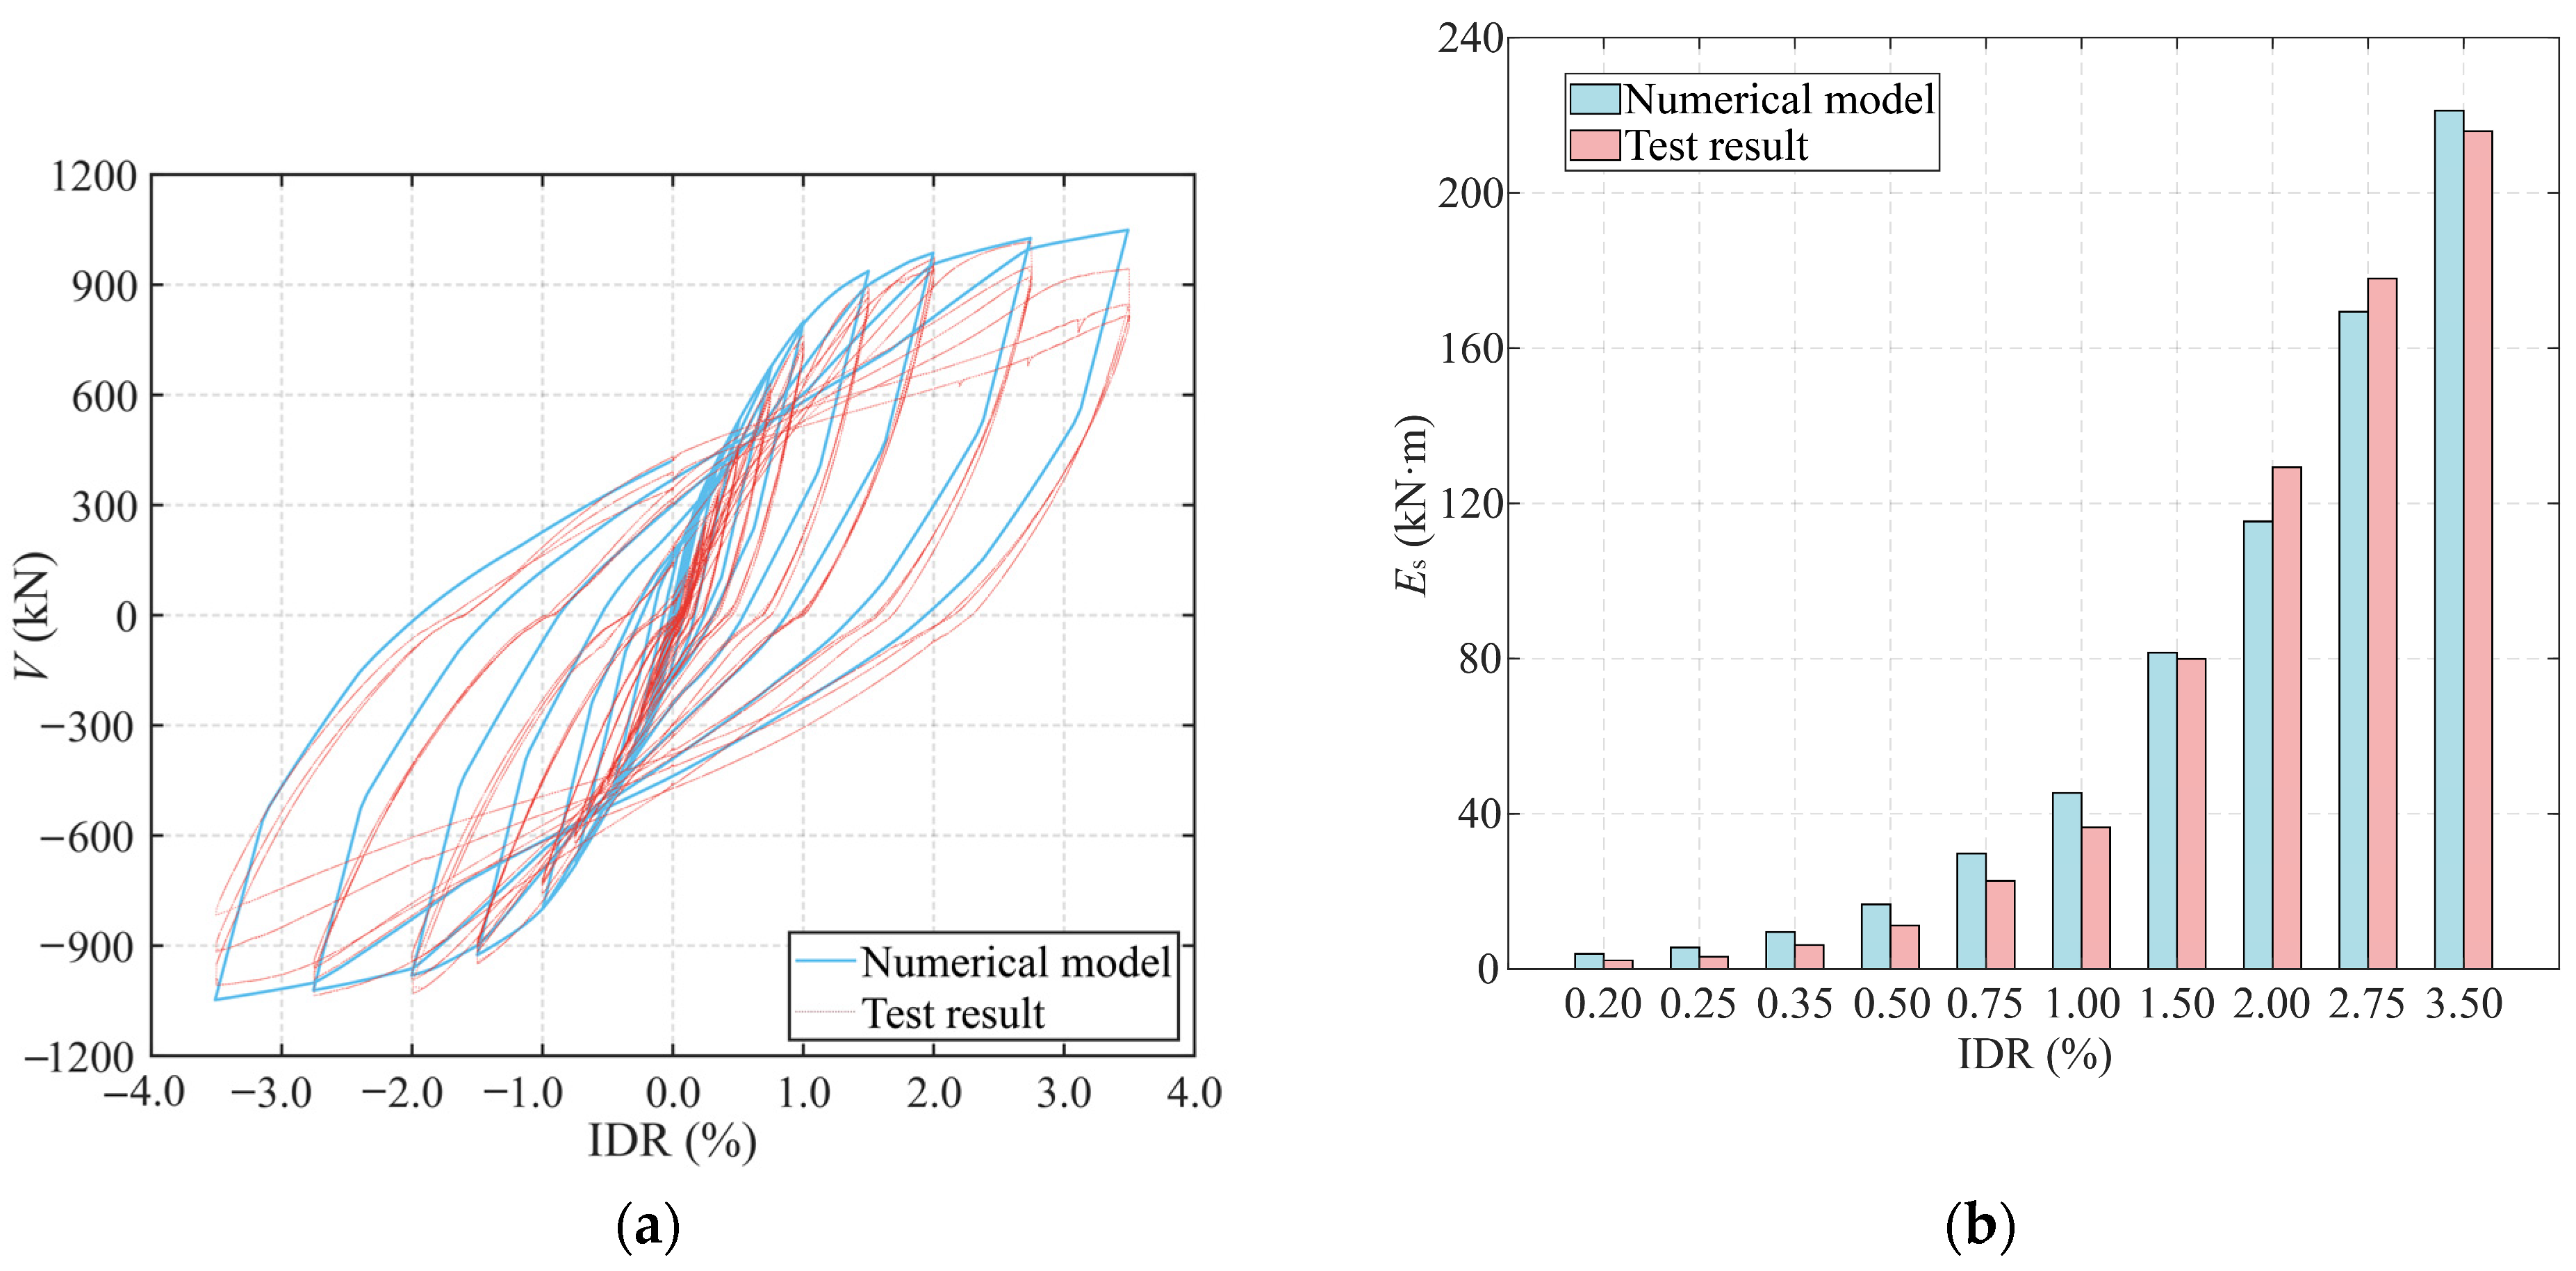
3.1. Benchmark Model
3.2. Numerical Model
3.3. Selection of the Ground Motion
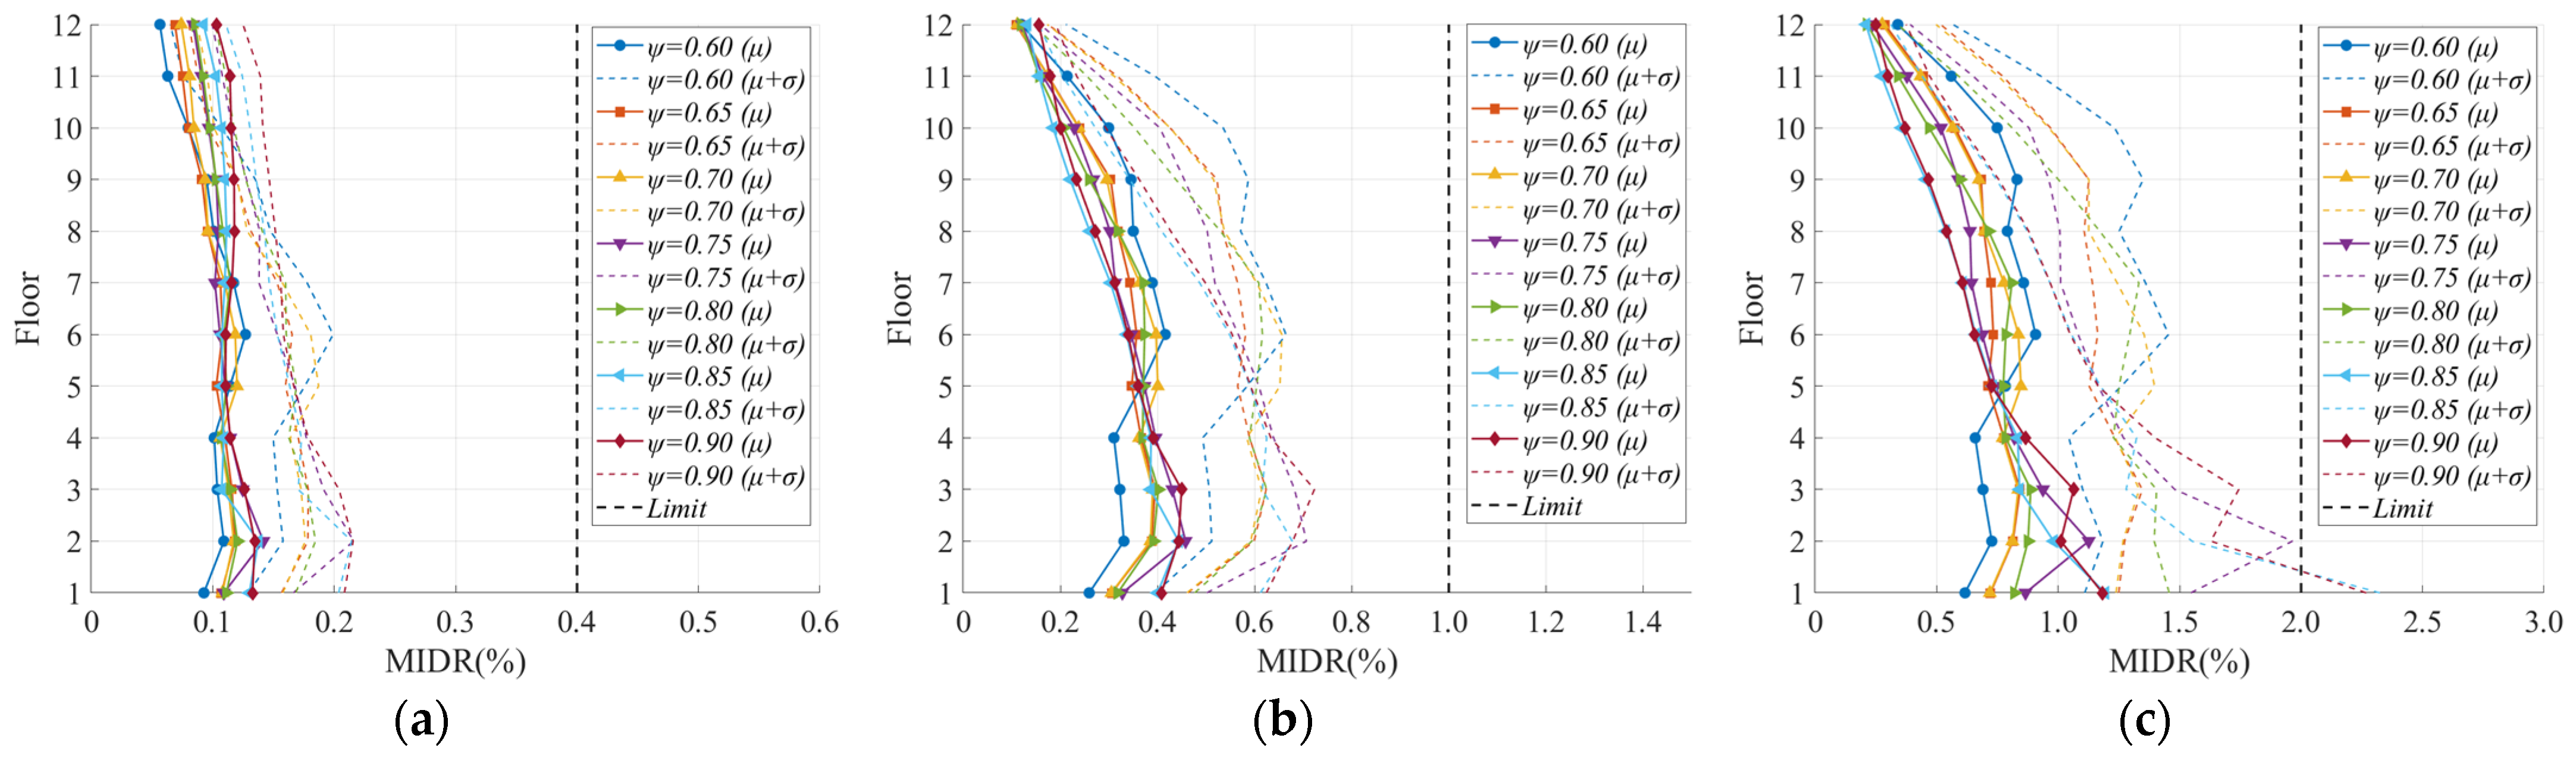
3.4. Determination of the Distribution Coefficient for the Energy Dissipation
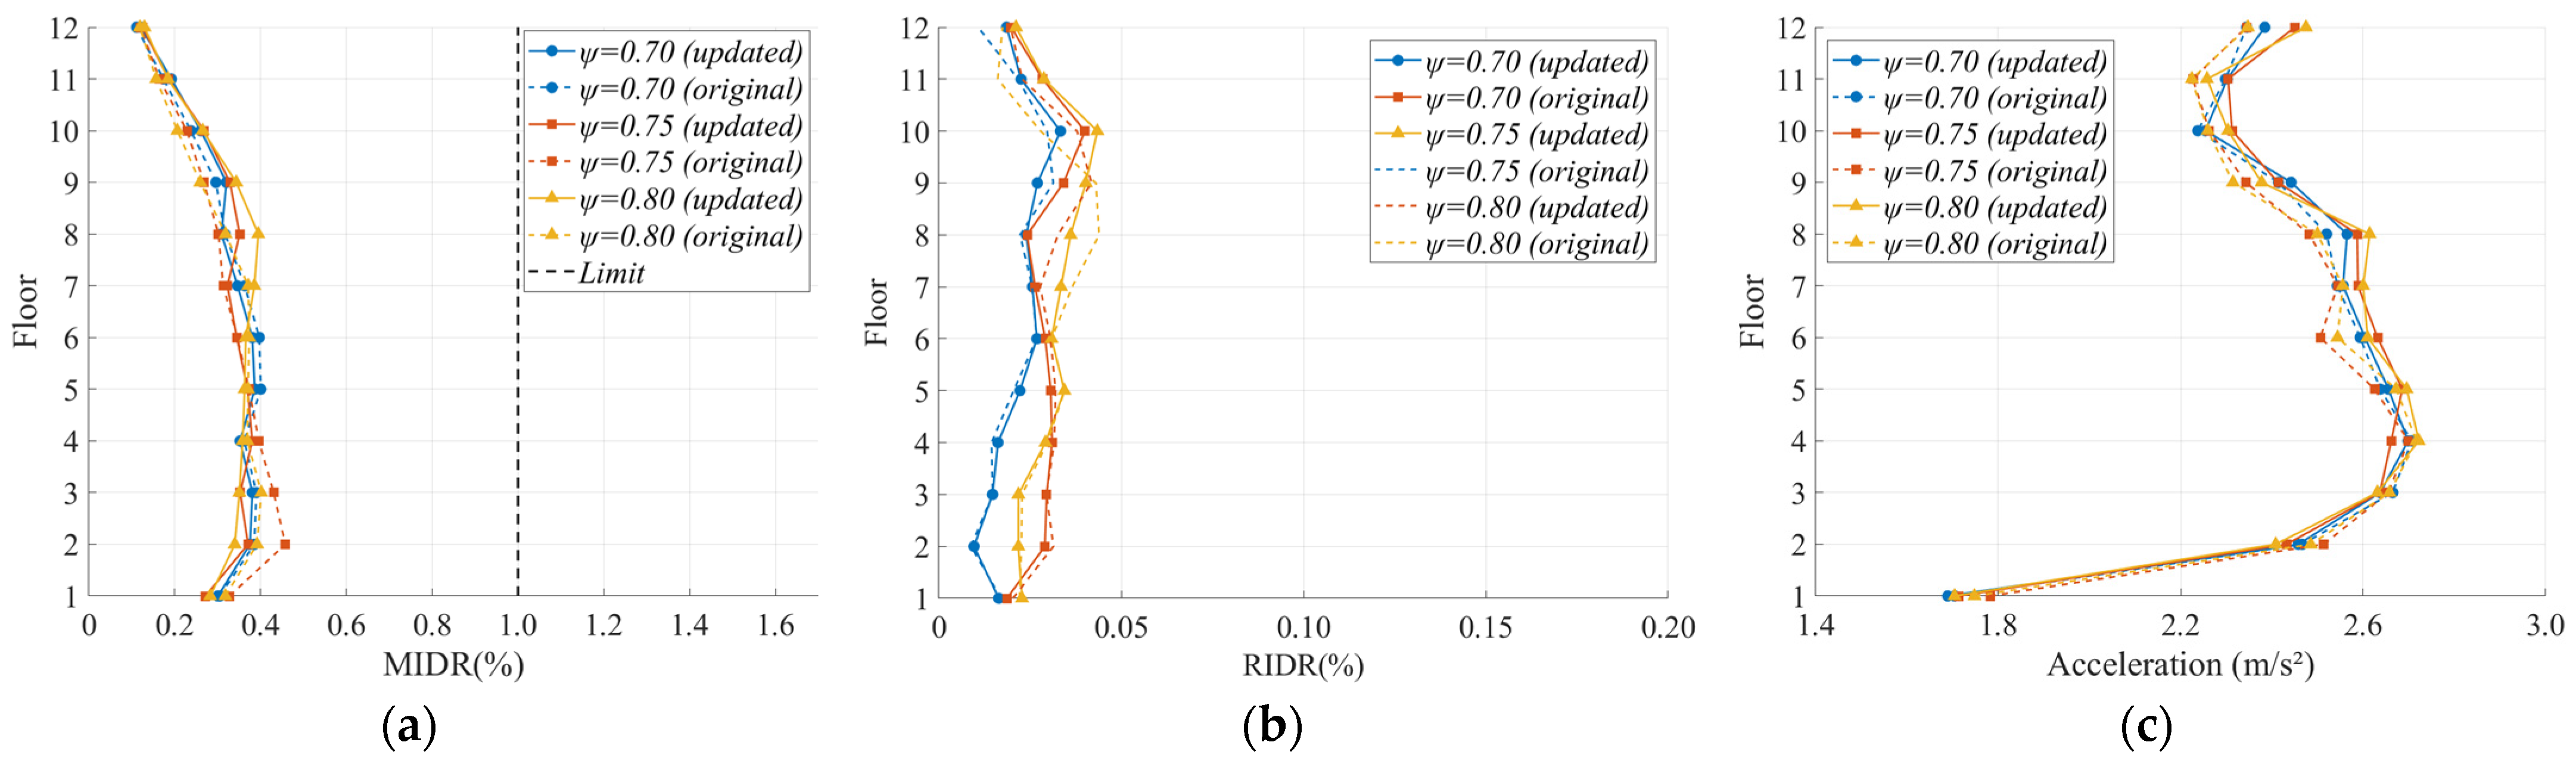
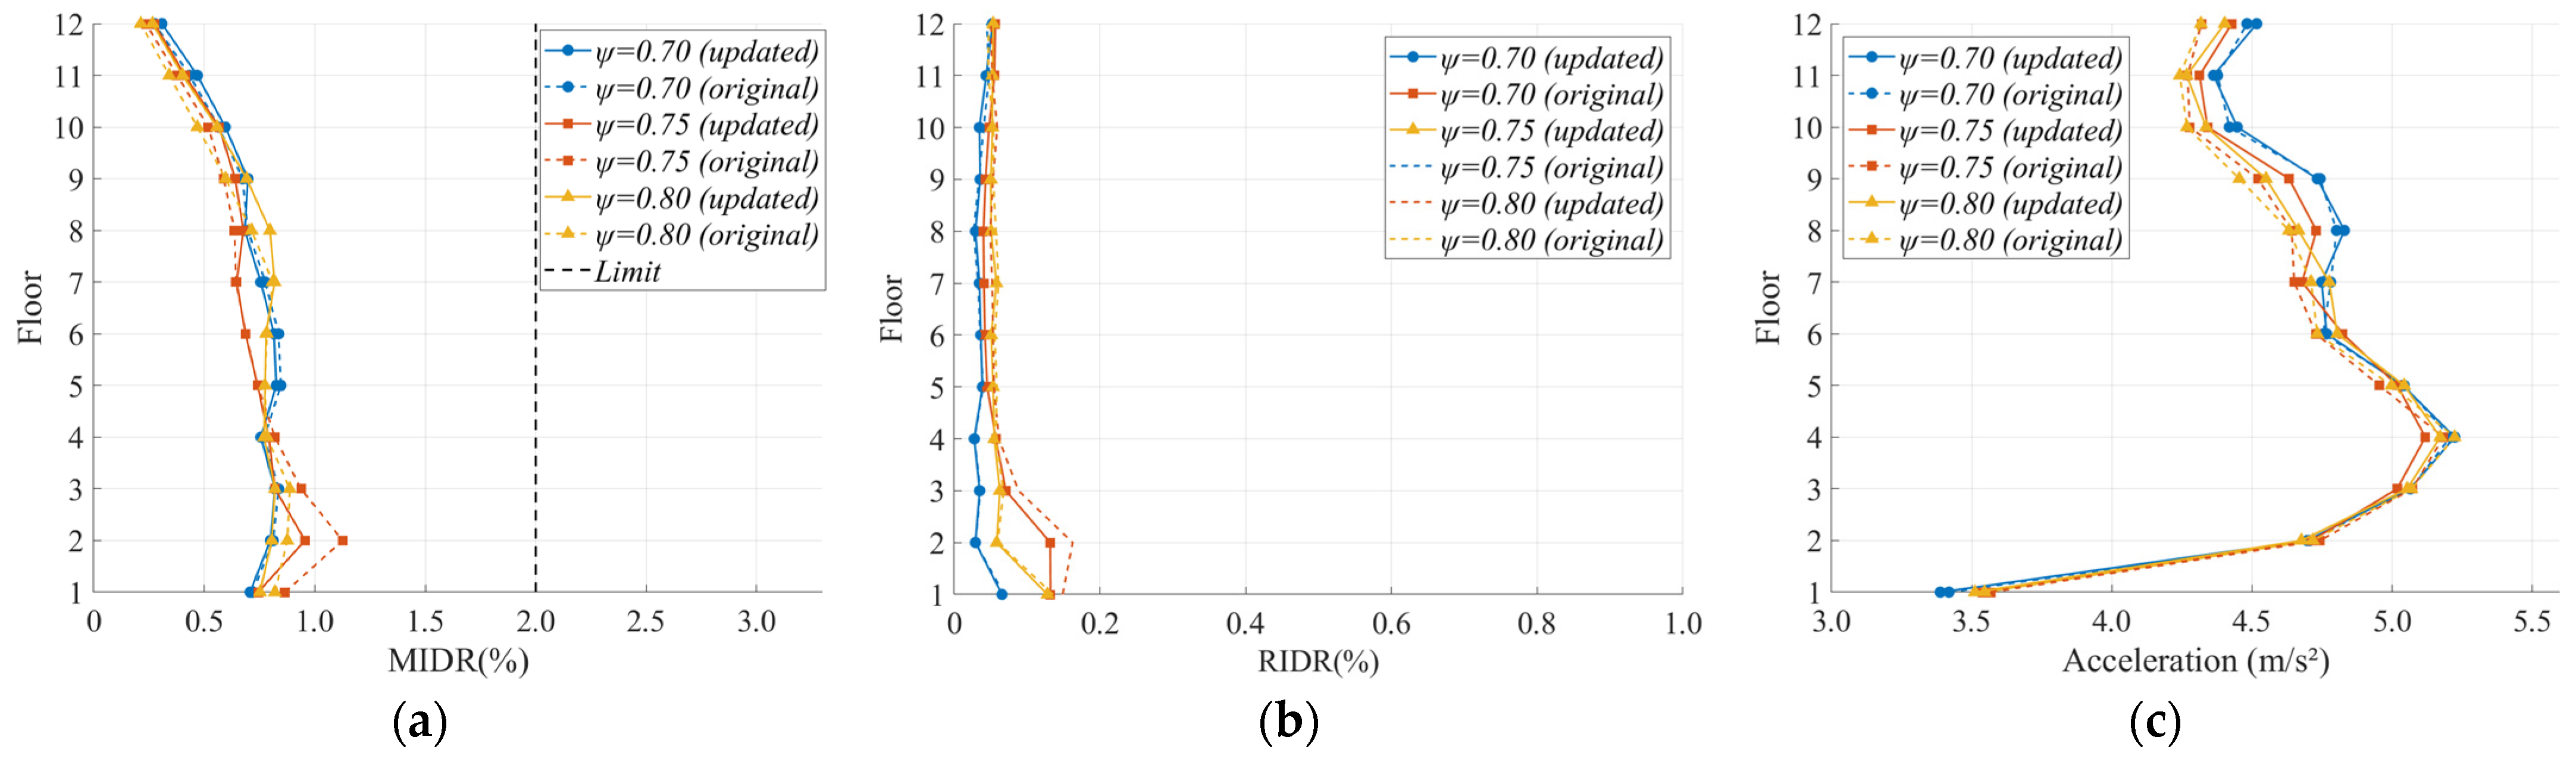
3.4.1. Maximum Interstory Drift Ratio
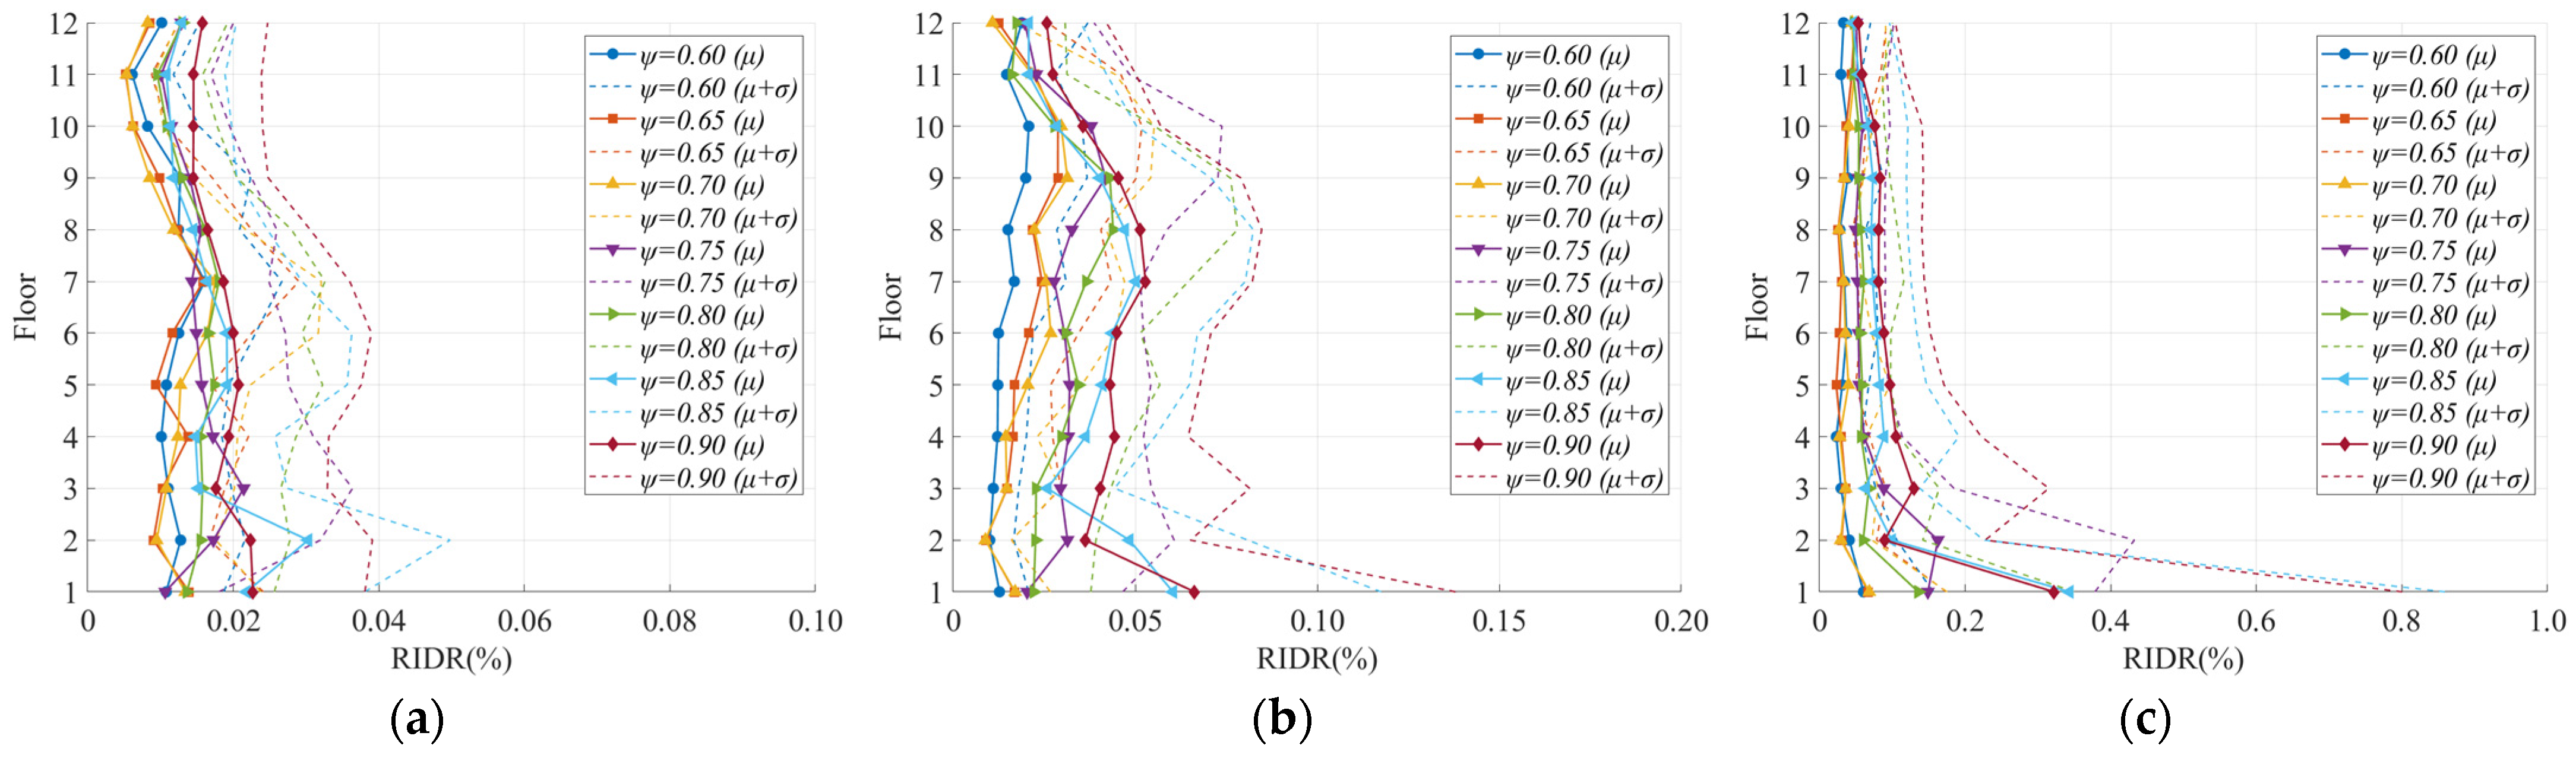
3.4.2. Residual Interstory Drift Ratio
3.4.3. Peak Acceleration
3.5. Layout of Dampers
4. Conclusions
Author Contributions
Funding
Data Availability Statement
Acknowledgments
Conflicts of Interest
Appendix A

| Floor | Distribution Coefficient ψ | |||||||||||||
|---|---|---|---|---|---|---|---|---|---|---|---|---|---|---|
| 0.60 | 0.65 | 0.70 | 0.75 | 0.80 | 0.85 | 0.90 | ||||||||
| Side | Middle | Side | Middle | Side | Middle | Side | Middle | Side | Middle | Side | Middle | Side | Middle | |
| 12 | 430 × 8 | 529 × 8 | 430 × 8 | 430 × 8 | 430 × 8 | 430 × 8 | 430 × 8 | 430 × 8 | 430 × 8 | 430 × 8 | 430 × 8 | 430 × 8 | 430 × 8 | 430 × 8 |
| 11 | 430 × 8 | 529 × 8 | 430 × 8 | 430 × 8 | 430 × 8 | 430 × 8 | 430 × 8 | 430 × 8 | 430 × 8 | 430 × 8 | 430 × 8 | 430 × 8 | 430 × 8 | 430 × 8 |
| 10 | 430 × 8 | 529 × 8 | 430 × 8 | 430 × 8 | 430 × 8 | 430 × 8 | 430 × 8 | 430 × 8 | 430 × 8 | 430 × 8 | 430 × 8 | 430 × 8 | 430 × 8 | 430 × 8 |
| 9 | 430 × 8 | 529 × 8 | 430 × 8 | 430 × 8 | 430 × 8 | 430 × 8 | 430 × 8 | 430 × 8 | 430 × 8 | 430 × 8 | 430 × 8 | 430 × 8 | 430 × 8 | 430 × 8 |
| 8 | 430 × 8 | 630 × 8 | 430 × 8 | 529 × 8 | 430 × 8 | 529 × 8 | 430 × 8 | 430 × 8 | 430 × 8 | 430 × 8 | 430 × 8 | 430 × 8 | 430 × 8 | 430 × 8 |
| 7 | 430 × 8 | 630 × 8 | 430 × 8 | 529 × 8 | 430 × 8 | 529 × 8 | 430 × 8 | 529 × 8 | 430 × 8 | 430 × 8 | 430 × 8 | 430 × 8 | 430 × 8 | 430 × 8 |
| 6 | 430 × 8 | 630 × 8 | 430 × 8 | 529 × 8 | 430 × 8 | 529 × 8 | 430 × 8 | 529 × 8 | 430 × 8 | 529 × 8 | 430 × 8 | 430 × 8 | 430 × 8 | 430 × 8 |
| 5 | 529 × 8 | 630 × 8 | 430 × 8 | 630 × 8 | 430 × 8 | 529 × 8 | 430 × 8 | 529 × 8 | 430 × 8 | 529 × 8 | 430 × 8 | 430 × 8 | 430 × 8 | 430 × 8 |
| 4 | 529 × 8 | 720 × 10 | 430 × 8 | 630 × 8 | 430 × 8 | 630 × 8 | 430 × 8 | 529 × 8 | 430 × 8 | 529 × 8 | 430 × 8 | 430 × 8 | 430 × 8 | 430 × 8 |
| 3 | 529 × 8 | 720 × 10 | 430 × 8 | 630 × 8 | 430 × 8 | 630 × 8 | 430 × 8 | 529 × 8 | 430 × 8 | 529 × 8 | 430 × 8 | 529 × 8 | 430 × 8 | 430 × 8 |
| 2 | 529 × 8 | 720 × 10 | 529 × 8 | 630 × 8 | 529 × 8 | 630 × 8 | 430 × 8 | 529 × 8 | 430 × 8 | 630 × 8 | 430 × 8 | 529 × 8 | 430 × 8 | 529 × 8 |
| 1 | 529 × 8 | 720 × 10 | 529 × 8 | 630 × 8 | 529 × 8 | 630 × 8 | 430 × 8 | 630 × 8 | 430 × 8 | 630 × 8 | 430 × 8 | 529 × 8 | 430 × 8 | 529 × 8 |
| Floor | Distribution Coefficient ψ | ||||||
|---|---|---|---|---|---|---|---|
| 0.60 | 0.65 | 0.70 | 0.75 | 0.80 | 0.85 | 0.90 | |
| 12 | 450 × 300 × 11 × 18 | 400 × 300 × 10 × 16 | 400 × 300 × 10 × 16 | 400 × 300 × 10 × 16 | 400 × 300 × 10 × 16 | 400 × 300 × 10 × 16 | 350 × 300 × 9 × 14 |
| 11 | 450 × 300 × 11 × 18 | 400 × 300 × 10 × 16 | 400 × 300 × 10 × 16 | 400 × 300 × 10 × 16 | 400 × 300 × 10 × 16 | 400 × 300 × 10 × 16 | 350 × 300 × 9 × 14 |
| 10 | 450 × 300 × 11 × 18 | 450 × 300 × 11 × 18 | 450 × 300 × 11 × 18 | 400 × 300 × 10 × 16 | 400 × 300 × 10 × 16 | 400 × 300 × 10 × 16 | 400 × 300 × 10 × 16 |
| 9 | 450 × 300 × 11 × 18 | 450 × 300 × 11 × 18 | 450 × 300 × 11 × 18 | 400 × 300 × 10 × 16 | 400 × 300 × 10 × 16 | 400 × 300 × 10 × 16 | 400 × 300 × 10 × 16 |
| 8 | 500 × 300 × 11 × 18 | 450 × 300 × 11 × 18 | 450 × 300 × 11 × 18 | 450 × 300 × 11 × 18 | 400 × 300 × 10 × 16 | 400 × 300 × 10 × 16 | 400 × 300 × 10 × 16 |
| 7 | 500 × 300 × 11 × 18 | 450 × 300 × 11 × 18 | 450 × 300 × 11 × 18 | 450 × 300 × 11 × 18 | 400 × 300 × 10 × 16 | 400 × 300 × 10 × 16 | 400 × 300 × 10 × 16 |
| 6 | 500 × 300 × 11 × 18 | 500 × 300 × 11 × 18 | 450 × 300 × 11 × 18 | 450 × 300 × 11 × 18 | 400 × 300 × 10 × 16 | 400 × 300 × 10 × 16 | 400 × 300 × 10 × 16 |
| 5 | 500 × 300 × 11 × 18 | 500 × 300 × 11 × 18 | 450 × 300 × 11 × 18 | 450 × 300 × 11 × 18 | 400 × 300 × 10 × 16 | 400 × 300 × 10 × 16 | 400 × 300 × 10 × 16 |
| 4 | 600 × 300 × 12 × 20 | 500 × 300 × 11 × 18 | 500 × 300 × 11 × 18 | 450 × 300 × 11 × 18 | 450 × 300 × 11 × 18 | 400 × 300 × 10 × 16 | 400 × 300 × 10 × 16 |
| 3 | 600 × 300 × 12 × 20 | 500 × 300 × 11 × 18 | 500 × 300 × 11 × 18 | 450 × 300 × 11 × 18 | 450 × 300 × 11 × 18 | 400 × 300 × 10 × 16 | 400 × 300 × 10 × 16 |
| 2 | 600 × 300 × 12 × 20 | 500 × 300 × 11 × 18 | 500 × 300 × 11 × 18 | 450 × 300 × 11 × 18 | 450 × 300 × 11 × 18 | 400 × 300 × 10 × 16 | 400 × 300 × 10 × 16 |
| 1 | 600 × 300 × 12 × 20 | 500 × 300 × 11 × 18 | 500 × 300 × 11 × 18 | 450 × 300 × 11 × 18 | 450 × 300 × 11 × 18 | 400 × 300 × 10 × 16 | 400 × 300 × 10 × 16 |
| Floor | Distribution Coefficient ψ | ||||||
|---|---|---|---|---|---|---|---|
| 0.60 | 0.65 | 0.70 | 0.75 | 0.80 | 0.85 | 0.90 | |
| 12 | 374-235-8 | 374-250-8 | 374-265-8 | 374-280-8 | 374-290-8 | 374-305-8 | 374-315-8 |
| 11 | 374-235-8 | 374-250-8 | 374-265-8 | 374-280-8 | 374-290-8 | 374-305-8 | 374-315-8 |
| 10 | 374-235-8 | 374-250-8 | 374-265-8 | 374-280-8 | 374-290-8 | 374-305-8 | 374-315-8 |
| 9 | 374-235-8 | 374-250-8 | 374-265-8 | 374-280-8 | 374-290-8 | 374-305-8 | 374-315-8 |
| 8 | 374-235-8 | 374-250-8 | 374-265-8 | 374-280-8 | 374-290-8 | 374-305-8 | 374-315-8 |
| 7 | 374-235-8 | 374-250-8 | 374-265-8 | 374-280-8 | 374-290-8 | 374-305-8 | 374-315-8 |
| 6 | 374-235-8 | 374-250-8 | 374-265-8 | 374-280-8 | 374-290-8 | 374-305-8 | 374-315-8 |
| 5 | 374-235-8 | 374-250-8 | 374-265-8 | 374-280-8 | 374-290-8 | 374-305-8 | 374-315-8 |
| 4 | 374-235-8 | 374-250-8 | 374-265-8 | 374-280-8 | 374-290-8 | 374-305-8 | 374-315-8 |
| 3 | 374-235-8 | 374-250-8 | 374-265-8 | 374-280-8 | 374-290-8 | 374-305-8 | 374-315-8 |
| 2 | 374-235-8 | 374-250-8 | 374-265-8 | 374-280-8 | 374-290-8 | 374-305-8 | 374-315-8 |
| 1 | 374-235-8 | 374-250-8 | 374-265-8 | 374-280-8 | 374-290-8 | 374-305-8 | 374-315-8 |
Appendix B
| Floor | Distribution Coefficient ψ | ||
|---|---|---|---|
| 0.70 | 0.75 | 0.80 | |
| 12 | 328-245-7 | 328-260-7 | 374-260-8 |
| 11 | 328-245-7 | 328-260-7 | 374-260-8 |
| 10 | 328-245-7 | 328-260-7 | 374-260-8 |
| 9 | 328-245-7 | 328-260-7 | 374-260-8 |
| 8 | 328-245-7 | 328-260-7 | 374-260-8 |
| 7 | 374-280-8 | 374-280-8 | 374-300-8 |
| 6 | 374-280-8 | 374-280-8 | 374-300-8 |
| 5 | 374-280-8 | 374-280-8 | 374-300-8 |
| 4 | 374-280-8 | 374-280-8 | 374-300-8 |
| 3 | 374-280-8 | 374-340-8 | 422-340-9 |
| 2 | 374-280-8 | 374-340-8 | 422-340-9 |
| 1 | 374-280-8 | 374-340-8 | 422-340-9 |
References
- Liu, Y.; Ma, Z.; Lv, X. Seismic performance study of a novel steel truss energy dissipation coupling beam. J. Constr. Steel Res. 2024, 216, 108556. [Google Scholar] [CrossRef]
- Jia, M.; Chen, Y.; Jin, P. Development and validation analysis of a steel-lead hybrid dual-yield BRB for multi-stage seismic energy dissipation. Thin Wall. Struct. 2024, 199, 111822. [Google Scholar] [CrossRef]
- Chen, J.; Abbas, N.; Sun, J.; Furuta, T.; Wei, Y.; Xiong, H. An innovative energy-dissipation angle bracket for CLT structures: Experimental tests and numerical analysis. Eng. Struct. 2024, 314, 118381. [Google Scholar] [CrossRef]
- Zhang, W.; Yang, X.; Lin, J.; Lin, B.; Huang, Y. Experimental and numerical study on the torsional behavior of rectangular hollow reinforced concrete columns strengthened by CFRP. Structures 2024, 70, 107690. [Google Scholar] [CrossRef]
- Zhang, Z.; Guo, F.; Gao, J.; Deng, E.; Kong, J.; Zhang, L. Seismic performance of an innovative prefabricated bridge pier using rapid hardening ultra-high performance concrete. Structures 2025, 74, 108558. [Google Scholar] [CrossRef]
- Li, B.; Kulkarni, S.A.; Leong, C.L. Seismic performance of precast hybrid-steel concrete connections. J. Earthq. Eng. 2009, 13, 667–689. [Google Scholar] [CrossRef]
- Yang, K.H.; Seo, E.A.; Hong, S.H. Cyclic flexural tests of hybrid steel–precast concrete beams with simple connection elements. Eng. Struct. 2016, 118, 344–356. [Google Scholar] [CrossRef]
- Feng, S.; Guan, D.; Guo, Z.; Liu, Z.; Li, G.; Gong, C. Seismic performance of assembly joints between HSPC beams and concrete-encased CFST columns. J. Constr. Steel Res. 2021, 180, 106572. [Google Scholar] [CrossRef]
- Zhang, J.; Zhang, T.; Yuan, W. Development and experimental seismic study of bearing-two-level yielding energy dissipation beam-column-slab joints for precast concrete frames. J. Build. Eng. 2024, 86, 108779. [Google Scholar] [CrossRef]
- Guo, L.; Wang, J.; Wang, W.; Hu, Z. Experimental study and analytical evaluation on seismic performance of CECFST moment resisting frame with bolted connections. Eng. Struct. 2022, 259, 114074. [Google Scholar] [CrossRef]
- Feng, S.; Guan, D.; Ni, L.; Lin, Y.; Liu, Z.; Guo, Z.; Li, G. Experimental study on seismic behavior of joints connecting precast H-steel reinforced concrete beams and concrete-filled steel tube columns. J. Build. Eng. 2022, 45, 103444. [Google Scholar] [CrossRef]
- Lin, Y.; Guan, D.; Guo, Z.; Zhu, M.; Yang, H. Seismic performance on PSPC beam-concrete encased CFST column frame with a built-in reduced beam section. Case Stud. Constr. Mater. 2024, 21, e03966. [Google Scholar] [CrossRef]
- Chen, J.; Chan, T.M.; Chung, K.F. Design of square and rectangular CFST cross-sectional capacities in compression. J. Constr. Steel Res. 2021, 176, 106419. [Google Scholar] [CrossRef]
- Zhang, Y.; Ren, C.; Yi, J.; Wei, Y.; Li, G.; Zhao, H. Axial compression performance of concrete-filled steel tubular columns with damaged BFRP jackets. Constr. Build. Mater. 2024, 442, 137640. [Google Scholar] [CrossRef]
- Rong, C.; Peng, Y.; Shi, Q.; Wang, P. Eccentric compression performance of concrete filled steel tube slotted columns: Experiment and simulation analysis. Structures 2025, 74, 108580. [Google Scholar] [CrossRef]
- Zhang, R.; Qiu, C.; Wang, W. Peak and residual deformation-based seismic design for multi-story hybrid concentrically braced frames. J. Build. Eng. 2023, 67, 106075. [Google Scholar] [CrossRef]
- Li, H.; Zhang, W. Seismic energy and axial column demands of steel concentrically braced frames. Structures 2024, 64, 106586. [Google Scholar] [CrossRef]
- Chen, Z.P.; Zhu, S.; Yu, H.; Wang, B. Development of novel SMA-based D-type self-centering eccentrically braced frames. Eng. Struct. 2022, 260, 114228. [Google Scholar] [CrossRef]
- Ulger, T.; Karabulut, M.; Mert, N. Lateral load performance of a reinforced concrete frame with pultruded GFRP box braces. J. Struct. Eng. Appl. Mech. 2022, 5, 40–49. [Google Scholar] [CrossRef]
- Mortazavi, P.; Kwon, O.S.; Christopoulos, C. Pseudo-dynamic hybrid simulations of steel eccentrically braced frames equipped with cast steel replaceable modular yielding links. Earthq. Eng. Struct. Dyn. 2023, 52, 3622–3648. [Google Scholar] [CrossRef]
- Li, T.; Su, M.; Sui, Y.; Ma, L. Real-time hybrid simulation on high strength steel frame with Y-shaped eccentric braces. Eng. Struct. 2021, 226, 111369. [Google Scholar] [CrossRef]
- Liu, B.; Lu, Y.; Li, W.; Li, J.; Zhao, J.; Wang, S.; Ni, G.; Meng, Q. Study on Seismic Behavior of Different Forms of Eccentrically Braced Steel Frames. Buildings 2024, 14, 2064. [Google Scholar] [CrossRef]
- Lin, Y.; Wang, Y.; Wu, W.; Yang, S.; Guo, Z.; Guan, D.; Li, G. Experimental study on PSPC beam–Concrete encased CFST column frame installed with novel steel panel dampers. Eng. Struct. 2023, 288, 116211. [Google Scholar] [CrossRef]
- GB50011-2010; Code for Seismic Design of Buildings. China Architecture & Building Press: Beijing, China, 2016. (In Chinese)
- Ye, L.; Cheng, G.; Qu, Z.; Lu, X. Study on energy-based seismic design method and application on steel braced frame structures. J. Build. Struct. 2012, 33, 36–45. (In Chinese) [Google Scholar]
- Ye, L.; Miao, Z.; Cheng, G.; Ma, Q.; Lu, X. Study on the energy-based seismic design method of building structures. Eng. Mech. 2014, 31, 1–12+20. (In Chinese) [Google Scholar] [CrossRef]
- Chao, S.; Goel, S.; Lee, S. A seismic design lateral force distribution based on inelastic state of structures. Earthq. Spectra 2012, 23, 547–569. [Google Scholar] [CrossRef]
- Ali, A.; Zhang, C.; Bibi, T.; Sun, L. Experimental investigation of sliding-based isolation system with re-centering functions for seismic protection of masonry structures. Structures 2024, 60, 105871. [Google Scholar] [CrossRef]
- Cao, X.Y.; Shen, D.; Ji, K.; Qu, Z.; Wang, C.N. Recovery resilience framework of replaceable AB-BRB for seismic strengthening during the aftershock stage. Thin Wall. Struct. 2024, 205, 112389. [Google Scholar] [CrossRef]
- Huang, L.; Hu, J.; Zeng, B.; Xie, Q. Cyclic behavior of variable friction dampers with two-stage energy dissipation and stiffness. J. Constr. Steel Res. 2025, 226, 109290. [Google Scholar] [CrossRef]
- Zhang, Y.; Xia, B.; Guo, X.; Sun, B.; Hu, D.; Wei, Y. Genetic algorithm-enhanced Housner intensity measure for seismic vulnerability analysis of reinforced concrete column-steel beam (RCS) frame structure. Soil Dyn. Earthq. Eng. 2025, 193, 109320. [Google Scholar] [CrossRef]
- Li, T.; Su, M.; Guo, J. A plastic design method based on multi-objective performance for high-strength steel composite K-shaped eccentrically braced frame. J. Constr. Steel Res. 2022, 198, 107562. [Google Scholar] [CrossRef]
- Ouyang, X.; Zhang, Y.; Ou, X.; Shi, Y.; Liu, S.; Fan, J. Seismic fragility analysis of buckling-restrained brace-strengthened reinforced concrete frames using a performance-based plastic design method. Structures 2022, 43, 338–350. [Google Scholar] [CrossRef]
- Zhai, Z.; Liu, Y.; Guo, W.; Mercan, O.; Chen, H.; Zhou, F. A seismic resilient design method for structures equipped with two-level yielding dampers, accounting for extremely rare earthquakes. Eng. Struct. 2023, 294, 116797. [Google Scholar] [CrossRef]
- Yan, X.; Shu, G.; Rahgozar, N.; Alam, M.S. Seismic design and performance evaluation of hybrid braced frames having buckling-restrained braces and self-centering viscous energy-dissipative braces. J. Constr. Steel Res. 2024, 213, 108359. [Google Scholar] [CrossRef]
- Xiong, J.; Chen, W.; Hu, S.; Wang, X.; Zeng, S. Study of an optimum design method for Y-shaped EBFs based on energy balance theory and energy dissipation coefficient. J. Nanchang Univ. (Nat. Sci.) 2019, 43, 284–295. (In Chinese) [Google Scholar]
- Cao, X.Y.; Feng, D.C.; Wu, G.; Wang, Z. Experimental and theoretical investigations of the existing reinforced concrete frames retrofitted with the novel external SC-PBSPC BRBF sub-structures. Eng. Struct. 2022, 256, 113982. [Google Scholar] [CrossRef]
- Yu, X.; Li, Z.; Yang, A.; Li, Y.; Lu, D.; Dai, K. Time-Dependent Seismic Fragility of Coastal RC Frames Considering Effect of Distance from Coastline. Buildings 2025, 15, 737. [Google Scholar] [CrossRef]
- Habibi, A.; Chan, R.; Albermani, F. Energy-based design method for seismic retrofitting with passive energy dissipation systems. Eng. Struct. 2013, 46, 77–86. [Google Scholar] [CrossRef]
- Newmark, N.; Hall, W. Earthquake Spectra and Design; Earthquake Engineering Research Institute: El Cerrito, CA, USA, 1982. [Google Scholar]
- ANSI/AISC 358-16; Prequalified Connections for Special and Intermediate Steel Moment Frames for Seismic Applications, Including Supplement No. 1. American Institute of Steel Construction: Chicago, IL, USA, 2016.
- FEMA-350. Recommended Seismic Design Criteria for New Steel Moment-Frame Buildings; Federal Emergency Management Agency: Washington, DC, USA, 2000. [Google Scholar]
- Guo, X.N.; Gao, S.Y.; Bui, T.; Luo, X. Experimental study on static performance of embedded channel joints of precast concrete beams. J. Tongji Univ. (Nat. Sci.) 2017, 45, 1258–1264. (In Chinese) [Google Scholar]
- Leelataviwat, S.; Goel, S.C.; Stojadinović, B. Toward performance-based seismic design of structures. Earthq. Spectra 1999, 15, 435–461. [Google Scholar] [CrossRef]
- Lin, Y.; Yang, S.; Guan, D.; Guo, Z. Modified strip model for indirect buckling restrained shear panel dampers. J. Constr. Steel Res. 2020, 175, 106371. [Google Scholar] [CrossRef]
- ASCE. Minimum Design Loads and Associated Criteria for Buildings and Other Structures, ASCE/SEI 7-16 [S.]; American Society of Civil Engineers: Reston, VA, USA, 2016. [Google Scholar]
- Zhang, C.; Shu, J.; Zhang, H.; Ning, Y.; Yu, Y. Estimation of load-carrying capacity of cracked RC beams using 3D digital twin model integrated with point clouds and images. Eng. Struct. 2024, 310, 118126. [Google Scholar] [CrossRef]
- Long, X.; Iyela, P.M.; Su, Y.; Atlaw, M.M. Numerical predictions of progressive collapse in reinforced concrete beam-column sub-assemblages: A focus on 3D multiscale modeling. Eng. Struct. 2024, 315, 118485. [Google Scholar] [CrossRef]
- OpenSees, Open System for Earthquake Engineering Simulation; Computer Program. University of California: Berkeley, CA, USA, 2025. Available online: http://opensees.berkeley.edu (accessed on 5 January 2025).
- Neuenhofer, A.; Filippou, F.C. Geometrically nonlinear flexibility-based frame finite element. J. Struct. Eng.-ASCE 1998, 124, 704–711. [Google Scholar] [CrossRef]
- Niu, Y.; Wang, W.; Su, Y.; Jia, F.R. Plastic damage prediction of concrete under compression based on deep learning. Acta Mech. 2024, 235, 255–266. [Google Scholar] [CrossRef]
- Han, L.H. Concrete Filled Steel Tubular Structures: Theory and Practice, 3rd ed.; China Science Pubilshing: Beijing, China, 2016. (In Chinese) [Google Scholar]
- Feng, D.C.; Wang, Z.; Wu, G. Progressive collapse performance analysis of precast reinforced concrete structures. Struct. Des. Tall Spec. 2019, 28, e1588. [Google Scholar] [CrossRef]
- Fukumoto, T.; Morita, K. Elastoplastic behavior of panel zone in steel beam-to-concrete filled steel tube column moment connections. J. Struct. Eng.-ASCE 2005, 131, 1841–1853. [Google Scholar] [CrossRef]
- FEMA-P695. Quantification of Building Seismic Performance; Federal Emergency Management Agency: Washington, DC, USA, 2009. [Google Scholar]
- PEER. PEER Strong Ground Motion Databse, University of Califoria, Berkeley. 2025. Available online: https://peer.berkeley.edu/peer-strong-ground-motion-databases (accessed on 10 January 2025).
- Erochko, J.; Christopoulos, C.; Tremblay, R.; Choi, H. Residual drift response of SMRFs and BRB frames in steel buildings designed according to ASCE 7-05. J. Struct. Eng.-ASCE 2011, 137, 589–599. [Google Scholar] [CrossRef]


| Design Parameter | Value | Design Parameter | Value |
|---|---|---|---|
| T | 1.20 s | α1 | 0.325 |
| θy | 0.005 | Rμ | 2.5 |
| θp | 0.015 | μs | 2.5 |
| θu | 0.020 | γs | 0.688 |
| αs | 0.135 | ζ | 0.05 |
| Material | Type | Nominal Diameter/Thickness (mm) | Yield Strength (Mpa) | Ultimate Strength (Mpa) | Elastic Modulus (Mpa) |
|---|---|---|---|---|---|
| Steel | Stirrup | 6 | 614.1 | 709.8 | 208.1 |
| Longitudinal bar | 10 | 542.5 | 635.2 | 205.3 | |
| 14 | 441.4 | 615.0 | 201.9 | ||
| Shear plate in SPD | 8 | 299.2 | 443.5 | 202.0 | |
| Tube | 7 | 430.0 | 562.3 | 204.8 | |
| Prestressed strand | 10.8 | 1633.1 | 1751.3 | 203.1 | |
| Unconfined concrete | Encasing concrete | - | - | 30.3 | 29.9 |
| Precast concrete | - | - | 38.0 | 32.1 | |
| In situ concrete | - | - | 39.6 | 32.5 |
| No. | Name | Monitoring Station | Magnitude | Seismic Component | PGA (g) |
|---|---|---|---|---|---|
| GM1 | Northridge | Beverly Hills-Mulhol | 6.7 | MUL009 | 0.416 |
| GM 2 | Northridge | Canyon Country-WLC | 6.7 | LOS000 | 0.410 |
| GM 3 | Duzce, Turkey | Bolu | 7.1 | BOL090 | 0.822 |
| GM 4 | Hector Mine | Hector | 7.1 | HEC090 | 0.338 |
| GM 5 | Imperial Valley | Delta | 6.5 | H-DLT262 | 0.238 |
| GM 6 | Imperial Valley | El Centro Array#11 | 6.5 | H-E11140 | 0.364 |
| GM 7 | Kobe, Japan | Nishi-akashi | 6.9 | NIS090 | 0.503 |
| GM 8 | Kobe, Japan | Shin-Osaka | 6.9 | SHI000 | 0.243 |
| GM 9 | Kocaeli, Turkey | Duzce | 7.5 | DZC180 | 0.312 |
| GM 10 | Kocaeli, Turkey | Arcelik | 7.5 | ARC000 | 0.219 |
| GM 11 | Landers | Yermo Fire Station | 7.3 | YER270 | 0.244 |
| GM 12 | Landers | Coolwater | 7.3 | CLW-TR | 0.417 |
| GM 13 | Loma Prieta | Capitola | 6.9 | CAP090 | 0.443 |
| GM 14 | Loma Prieta | Gilroy Array#3 | 6.9 | G03000 | 0.555 |
| GM 15 | Manjil, Iran | Abbar | 7.4 | ABBAR-L | 0.515 |
| GM 16 | Superstition Hills | El Centro Imp. Co. | 6.5 | B-ICC090 | 0.238 |
| GM 17 | Superstition Hills | Poe Road | 6.5 | B-POE360 | 0.300 |
| GM 18 | Cape Mendocino | Rio Dell Overpass | 7.0 | RIO270 | 0.385 |
| GM 19 | Chi-chi, Taiwan | CHY101 | 7.6 | CHY101-E | 0.340 |
| GM 20 | Chi-chi, Taiwan | TCU045 | 7.6 | TCU045-N | 0.507 |
| GM 21 | San Fernando | LA-Hollywood Stor | 6.6 | PEL090 | 0.210 |
| GM 22 | Friuli, Italy | Tolmezzo | 6.5 | A-TMZ270 | 0.315 |
| ψ | Seismic Intensity | Value Type | MIDR | RIDR | Peak Acceleration | |||
|---|---|---|---|---|---|---|---|---|
| Original | Updated | Original | Updated | Original | Updated | |||
| 0.70 | FE | Average | 0.10 | 0.10 | 0.011 | 0.012 | 0.98 | 0.98 |
| CoV | 15.37% | 12.65% | 33.89% | 26.14% | 12.85% | 12.77% | ||
| DBE | Average | 0.31 | 0.31 | 0.02 | 0.021 | 2.43 | 2.43 | |
| CoV | 30.14% | 26.67% | 35.91% | 30.63% | 11.19% | 11.26% | ||
| MCE | Average | 0.69 | 0.69 | 0.039 | 0.039 | 4.65 | 4.65 | |
| CoV | 25.96% | 23.07% | 29.55% | 28.27% | 9.99% | 10.15% | ||
| 0.75 | FE | Average | 0.11 | 0.11 | 0.015 | 0.016 | 0.98 | 1.01 |
| CoV | 14.18% | 20.16% | 21.81% | 24.36% | 12.73% | 14.95% | ||
| DBE | Average | 0.31 | 0.31 | 0.03 | 0.028 | 2.42 | 2.45 | |
| CoV | 32.93% | 26.11% | 22.02% | 20.51% | 10.38% | 10.93% | ||
| MCE | Average | 0.68 | 0.66 | 0.074 | 0.064 | 4.58 | 4.61 | |
| CoV | 35.65% | 27.46% | 53.94% | 52.23% | 9.51% | 9.26% | ||
| 0.80 | FE | Average | 0.11 | 0.11 | 0.015 | 0.017 | 0.98 | 1.02 |
| CoV | 9.45% | 20.50% | 17.83% | 28.75% | 13.18% | 14.82% | ||
| DBE | Average | 0.3 | 0.31 | 0.029 | 0.03 | 2.42 | 2.45 | |
| CoV | 31.78% | 26.48% | 31.9% | 24.79% | 11.05% | 11.44% | ||
| MCE | Average | 0.67 | 0.67 | 0.063 | 0.06 | 4.58 | 4.6 | |
| CoV | 32.73% | 26.50% | 37.6% | 35.69% | 9.89% | 9.75% | ||
Disclaimer/Publisher’s Note: The statements, opinions and data contained in all publications are solely those of the individual author(s) and contributor(s) and not of MDPI and/or the editor(s). MDPI and/or the editor(s) disclaim responsibility for any injury to people or property resulting from any ideas, methods, instructions or products referred to in the content. |
© 2025 by the authors. Licensee MDPI, Basel, Switzerland. This article is an open access article distributed under the terms and conditions of the Creative Commons Attribution (CC BY) license (https://creativecommons.org/licenses/by/4.0/).
Share and Cite
Hou, F.; Chong, W.; Lin, Y.; He, X.; Zhang, G. Modified Energy-Based Design Method of the Precast Partially Steel-Reinforced Concrete Beam–CFST Column Eccentrically Braced Frame. Buildings 2025, 15, 1797. https://doi.org/10.3390/buildings15111797
Hou F, Chong W, Lin Y, He X, Zhang G. Modified Energy-Based Design Method of the Precast Partially Steel-Reinforced Concrete Beam–CFST Column Eccentrically Braced Frame. Buildings. 2025; 15(11):1797. https://doi.org/10.3390/buildings15111797
Chicago/Turabian StyleHou, Fugui, Weiguang Chong, Yu Lin, Xijun He, and Guanglei Zhang. 2025. "Modified Energy-Based Design Method of the Precast Partially Steel-Reinforced Concrete Beam–CFST Column Eccentrically Braced Frame" Buildings 15, no. 11: 1797. https://doi.org/10.3390/buildings15111797
APA StyleHou, F., Chong, W., Lin, Y., He, X., & Zhang, G. (2025). Modified Energy-Based Design Method of the Precast Partially Steel-Reinforced Concrete Beam–CFST Column Eccentrically Braced Frame. Buildings, 15(11), 1797. https://doi.org/10.3390/buildings15111797