Article

Evaluating Art Exhibition Spaces Through Space Syntax and Multimodal Physiological Data

1
Faculty of Innovation and Design, City University of Macau, Macao 999078, China
2
School of Creativity and Design, Guangzhou Huashang College, Guangzhou 511300, China
*
Author to whom correspondence should be addressed.
Buildings 2025, 15(11), 1776; https://doi.org/10.3390/buildings15111776
Submission received: 11 April 2025 / Revised: 6 May 2025 / Accepted: 21 May 2025 / Published: 22 May 2025
(This article belongs to the Section Architectural Design, Urban Science, and Real Estate)

Abstract

:
Art exhibition spaces increasingly emphasize visitor experience, yet the relationships among spatial structure, visitor behavior, and emotional response remain unclear. Traditional space syntax analyses typically focus on physical spatial structures, insufficiently capturing visitors’ emotional and cognitive experiences. To address these gaps, this study presents an integrative evaluation framework that combines space syntax theory with multimodal physiological measurements to systematically assess spatial design performance in art exhibition environments. Eye-tracking and heart rate variability (HRV) experiments were conducted to investigate how spatial configuration affects visual attention and emotional responses. Visibility graph analysis, spatial integration metrics, and regression modeling were applied using the third-floor temporary exhibition hall of the Pudong Art Museum in Shanghai as a case study. The results revealed that HRV levels (β = −7.92) were significantly predicted via spatial integration, and the relationship between spatial integration and the number of fixations was partially mediated by HRV (indirect effect: β = −0.36; direct effect: β = 8.23). Additionally, zones with higher occlusivity were associated with more complex scanpaths (mean complexity: 0.14), whereas highly integrated regions triggered more fixations (mean = 10.54) and longer total fixation durations (mean = 2946.98 ms). Therefore, spatial syntax, when coupled with physiological indicators, provides a robust and actionable method for evaluating and optimizing exhibition space design.

1. Introduction

With the growing demand for cultural consumption and the expansion of the cultural tourism sector, art exhibition spaces have evolved from traditional venues for displaying artworks to dynamic platforms for emotional resonance, cognitive interaction, and cultural immersion [1,2]. High-quality spatial configuration can effectively guide visitor movement, enhance the communicative power of artistic content, and increase both overall satisfaction and the intention to revisit [3]. This then strengthens the competitiveness and appeal of cultural institutions [4]. In this context, many institutions have adopted innovative spatial strategies for differentiation. However, there is still relatively little mental research on how spatial structure affects visitors’ emotional responses [5], spatial attention patterns and behavioral dynamics. A comprehensive understanding of how spatial design mediates exhibition experience remains underdeveloped in both academic and practical domains.
Traditional paradigms that focused predominantly on formal aesthetics and functional zoning are gradually being replaced by experience-oriented strategies with the growing implementation of human-centered design principles in exhibition space planning [6,7]. Nonetheless, there is little academic discourse on in-depth theoretical exploration and empirical validation of how spatial structure—through visual guidance, circulation planning, and spatial organization—can effectively enhance audience participation and emotional resonance [8]. This gap between theory and practice hinders progress in spatial design research and limits the availability of practical guidelines for designers.
Therefore, there is a need for systematic empirical research on the interrelationships between spatial structure, visitor behavior, and emotional responses [9]. A deeper understanding of how spatial structure shapes audience experience can offer a robust scientific foundation for optimizing exhibition layouts, improving visitor satisfaction, and enhancing the overall competitiveness of cultural venues [10]. This exploration has significant theoretical and practical value for promoting the high-quality development of cultural and creative industries [11].
Space syntax theory, a quantitative method for spatial analysis [12], has been widely applied in urban planning [13], transportation systems [14], and interior architectural design [15]. In detail, space syntax has been widely adopted across diverse cultural and geographic contexts worldwide, demonstrating strong adaptability and cross-cultural analytical value [16]. In Scandinavian countries, it is often employed to foster openness and social interaction in public spaces [17], whereas it is primarily used to optimize circulation and spatial organization under constrained conditions in high-density East Asian cities [18]. These contextual differences are also evident in exhibition environments: in Korean museums, space syntax supports fluid spatial flow and collective immersion [19], while it enhances narrative legibility and interpretive sequencing in Italian historical galleries [20]. Despite its global proliferation [21], traditional space syntax analysis continues to focus primarily on formal spatial structure. This limits its ability to capture the full complexity of visitor experiences—including emotional responses, cognitive load, and social interaction.
Advancements in physiological sensing technologies, such as eye-tracking [22] and heart rate variability (HRV) [23], have provided new objective dimensions to explore spatial experience. Eye-tracking metrics reveal patterns of visual attention and cognitive pathways [23], while HRV offers insight into levels of emotional arousal [24]. When combined, these indicators can effectively compensate for the limitations of subjective questionnaire-based evaluations in explaining spatial cognition and behavioral responses. However, few existing studies have integrated space syntax with multimodal physiological data into a unified research framework for the systematic evaluation and modeling of art exhibition space structures.
To address this gap, an innovative research paradigm that integrates space syntax analysis with multimodal experiments involving eye-tracking and HRV measurements was proposed. The third-floor temporary exhibition space of the Pudong Art Museum in Shanghai served as the empirical case study. The following hypotheses were proposed (see Table 1):
H1. 
Areas with higher spatial integration will correspond to more fixations, indicating stronger visual guidance potential;
H2. 
Areas with greater occlusivity will produce more complex scanpaths, reflecting the difficulty in acquiring visual information and increased exploration demand;
H3. 
A higher number of fixations will be associated with lower HRV fluctuation, suggesting focused attention and reduced cognitive load;
H4. 
More complex scanpaths will correlate with greater HRV fluctuation, reflecting heightened emotional arousal or uncertainty within the space;
H5. 
Emotional responses, indexed by HRV, may serve as a mediating variable in the relationship between spatial structure and visual behavior, potentially influencing how spatial environments shape attentional patterns.
This study contributes to a deeper theoretical understanding of the relationship between exhibition space structure and user experience and provides a practical, data-driven framework for optimizing spatial design in future exhibition practices.

2. Theoretical Foundation and Research Framework

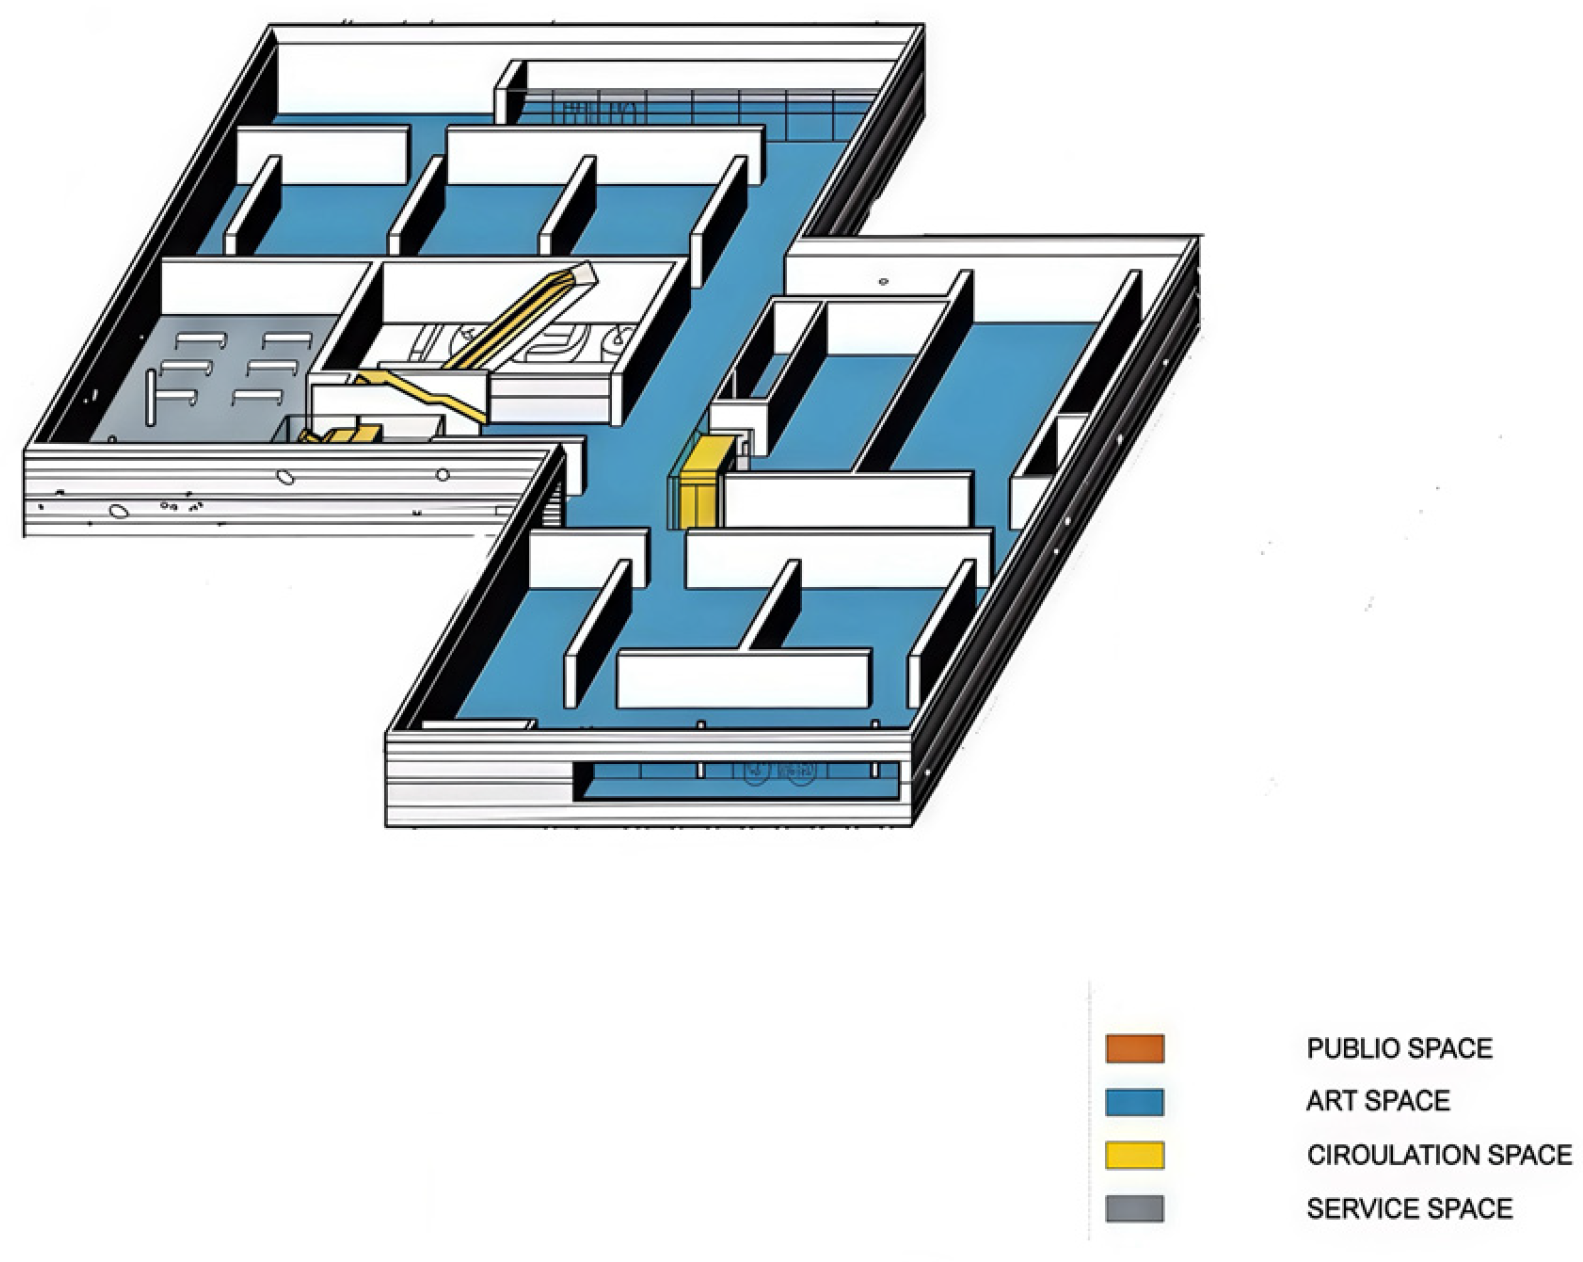
2.1. Space Syntax Theory and Its Application in Art Exhibition Design

In recent years, the design of exhibition spaces has increasingly emphasized visitor experience [25], characterized by global adaptability and spatial sequencing [26]. Hölscher et al. [27] applied space syntax metrics to analyze users’ wayfinding paths in complex buildings and proposed strategies for improving navigation and orientation. This highlights the significance of space syntax in low-visibility environments. Additionally, Wineman et al. [28] and J. Medaković et al. [29] investigated how spatial layout affects museum visitors’ exploration and interpretation strategies. These studies emphasized the relationship between behavioral patterns and spatial features, especially the systemic links between accessibility and visibility.
Some scholars further explored the topological (e.g., accessibility and visibility) and geometric (e.g., location, shape, size) properties of architectural forms. For instance, S. Qanazi et al. [30] applied space syntax theory to analyze the suitability of urban service locations by mapping social behavior dynamics. Similarly, Y. Wu [31] employed configurational analysis to identify “priority” and “inefficient” segments in street layouts and verified the relationships between the changes in accessibility/visibility and socio-cultural transformations. Psarra [32] examined the parallels between architecture and language based on the framework of space syntax, particularly in syntactic and semantic structures. She argued that space syntax was grounded in both spatial configuration and linguistic expression—meaning that buildings and cities embody the social spatial structure and reflect underlying conceptual, discursive, and semantic systems.
Since it is impractical to evaluate each spatial point individually, space is typically discretized into a fine grid—ideally at human scale—and isovist fields are computed for each grid cell. A graph is then formed using these grid cells as nodes and their mutual visibility as edges [33]. The properties of these isovist fields are linked to human spatial behavior, demonstrating that individuals are highly sensitive to isovist areas and capable of identifying positions with the largest isovist extent [34].
In the context of art exhibition design, space syntax methods can be employed to reveal how spatial layouts influence visitor circulation, clustering, and attention to architectural structure. The indicators used in this study were derived from the DeCodingSpaces toolbox, developed by the Computational Planning Group (CPlan) on the Grasshopper platform. Of the 17 available isovist-based metrics, 10 were selected according to theoretical relevance to capture core spatial characteristics and thus effectively quantified different aspects of exhibition space configuration (Table 2).

2.2. Application of Multimodal Experiments in Space Syntax Evaluation

In recent studies, dynamic sensor technologies have been adopted to measure objective physiological signals and analyze emotional responses in spatial environments [35]. Among these, eye-tracking technology has been widely used in spatial design evaluation, allowing precise detection of users’ visual attention patterns, including fixation points, scanpaths, and dwell times. These indicators can effectively reflect the clarity and guidance of spatial layouts and help designers identify focal points and problematic zones within a space.
Heart rate and blood volume are also well-established physiological indicators frequently used to measure emotional arousal [36]. For example, Radwan and Ergan utilized a Body Sensor Network (BSN) platform to record subjects’ physiological data in indoor architectural environments, including heart rate, facial expression, and muscle movement [37].
The first step in applying perceptual experiments to spatial environments involves creating suitable test setups. This may be categorized into two types: (1) natural environments and (2) experimental environments created using technologies such as photos or video simulations [37]. High-quality visualizations can be used to simulate spatial experiences before actual exhibition space construction. Furthermore, accurate quantification of visitors’ perceptions requires controlled test conditions [38], in which specific design variables can be manipulated and assessed individually. Controlled environments also offer high realism to enable both viewers and designers to rapidly replicate and flexibly adjust experimental conditions [39].

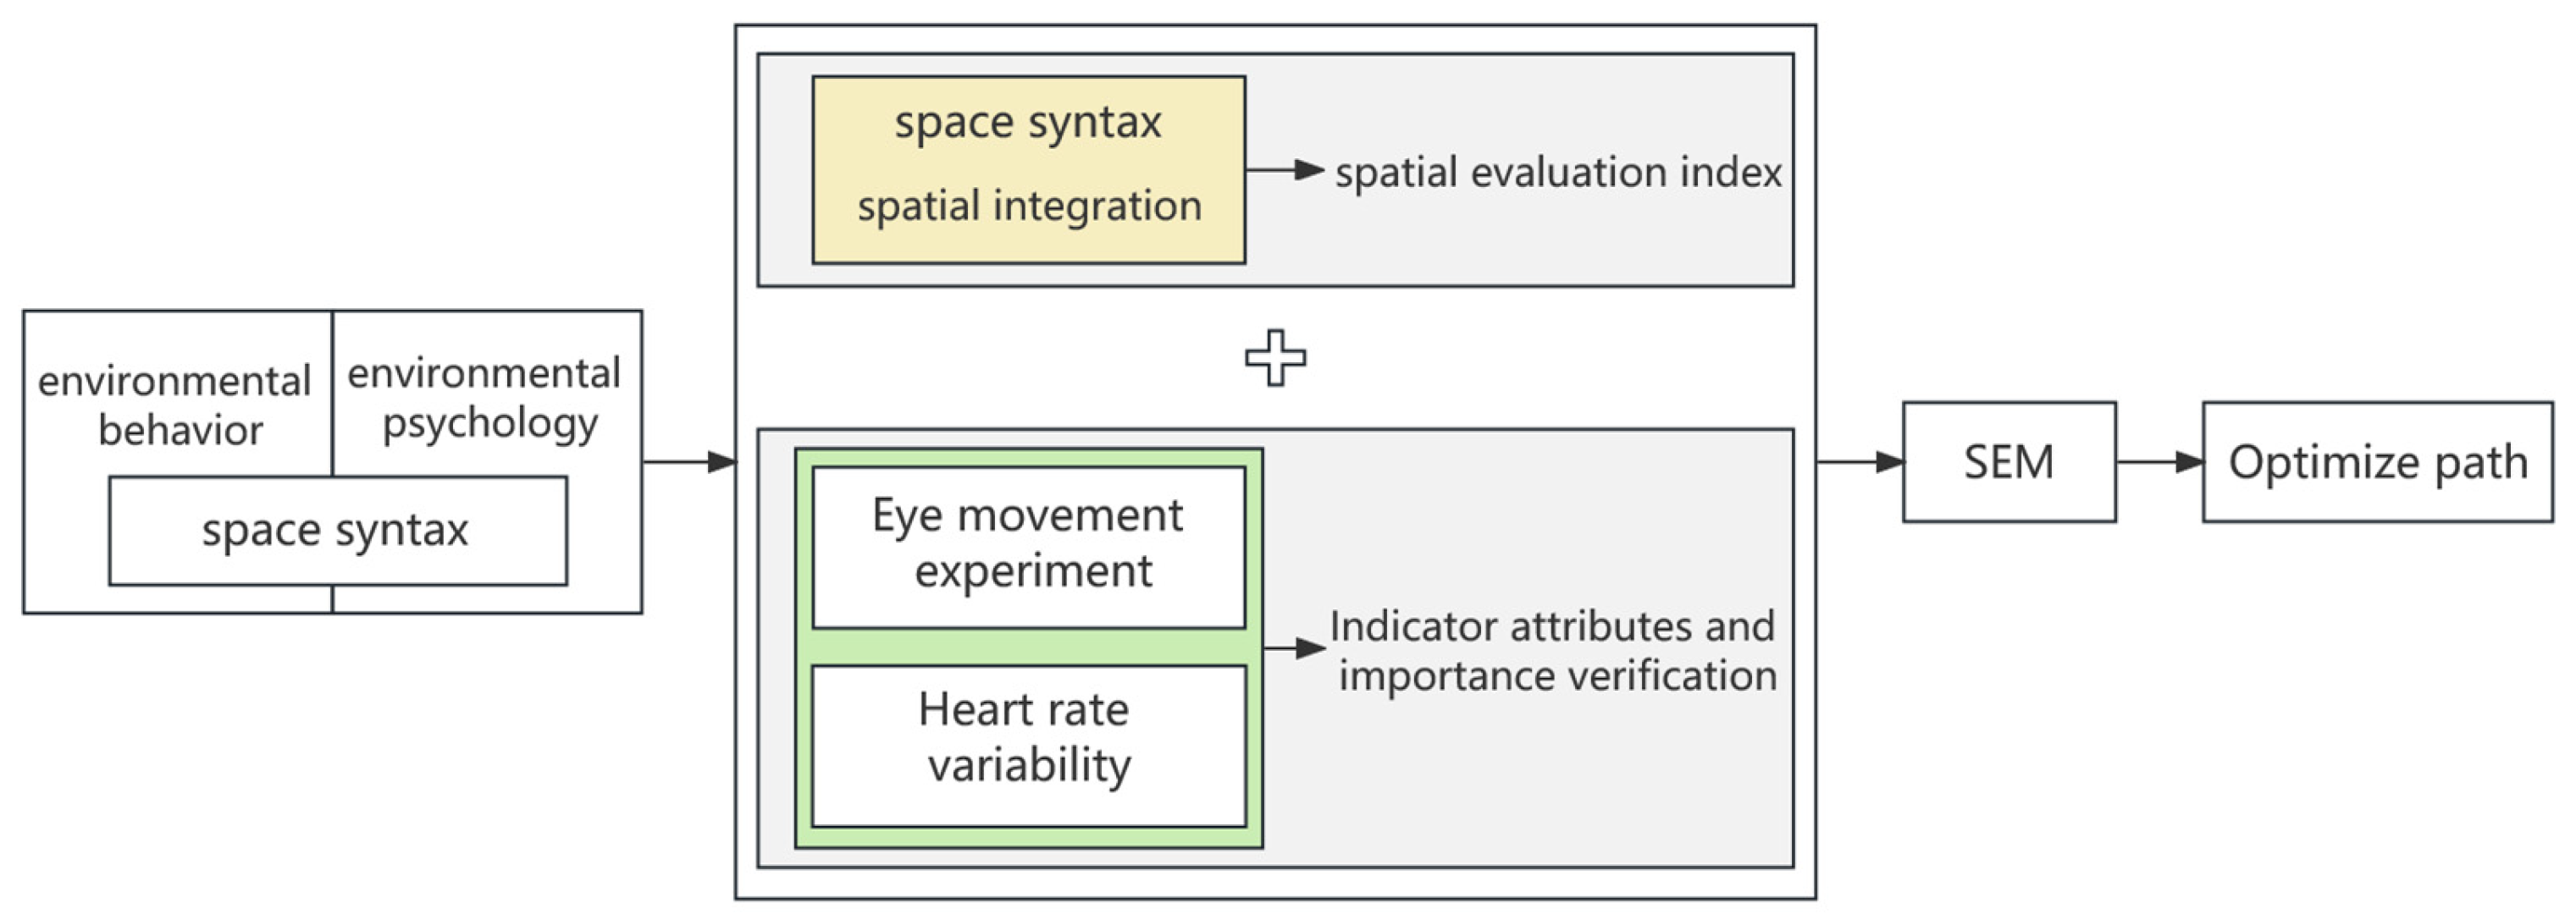
2.3. Research Framework

As illustrated in Figure 1, an integrated spatial evaluation frame was constructed based on the dual foundation of environmental behavior and environmental psychology. Objective spatial configuration analysis was combined with physiological and behavioral data to identify and optimize key spatial variables that influence visitor experience.
The model includes three main components: (1) By calculating spatial integration values, space syntax provides quantitative spatial evaluation indices. These metrics reflect the accessibility and visibility of different spatial segments, which serve as structural predictors of user movement and interaction patterns; (2) both cognitive attention and emotional arousal were captured through eye movement experiments and HRV. This dual data stream helped verify the psychological salience and perceptual significance of spatial attributes, revealing which areas prompt stronger visual engagement and physiological responses; and (3) All spatial and experimental data were then synthesized into a SEM framework to test the causal relationships among spatial configuration, emotional state, and visual behavior. This model can derive optimal spatial paths to inform evidence-based design strategies for improving visitor satisfaction.

3. Research Methods

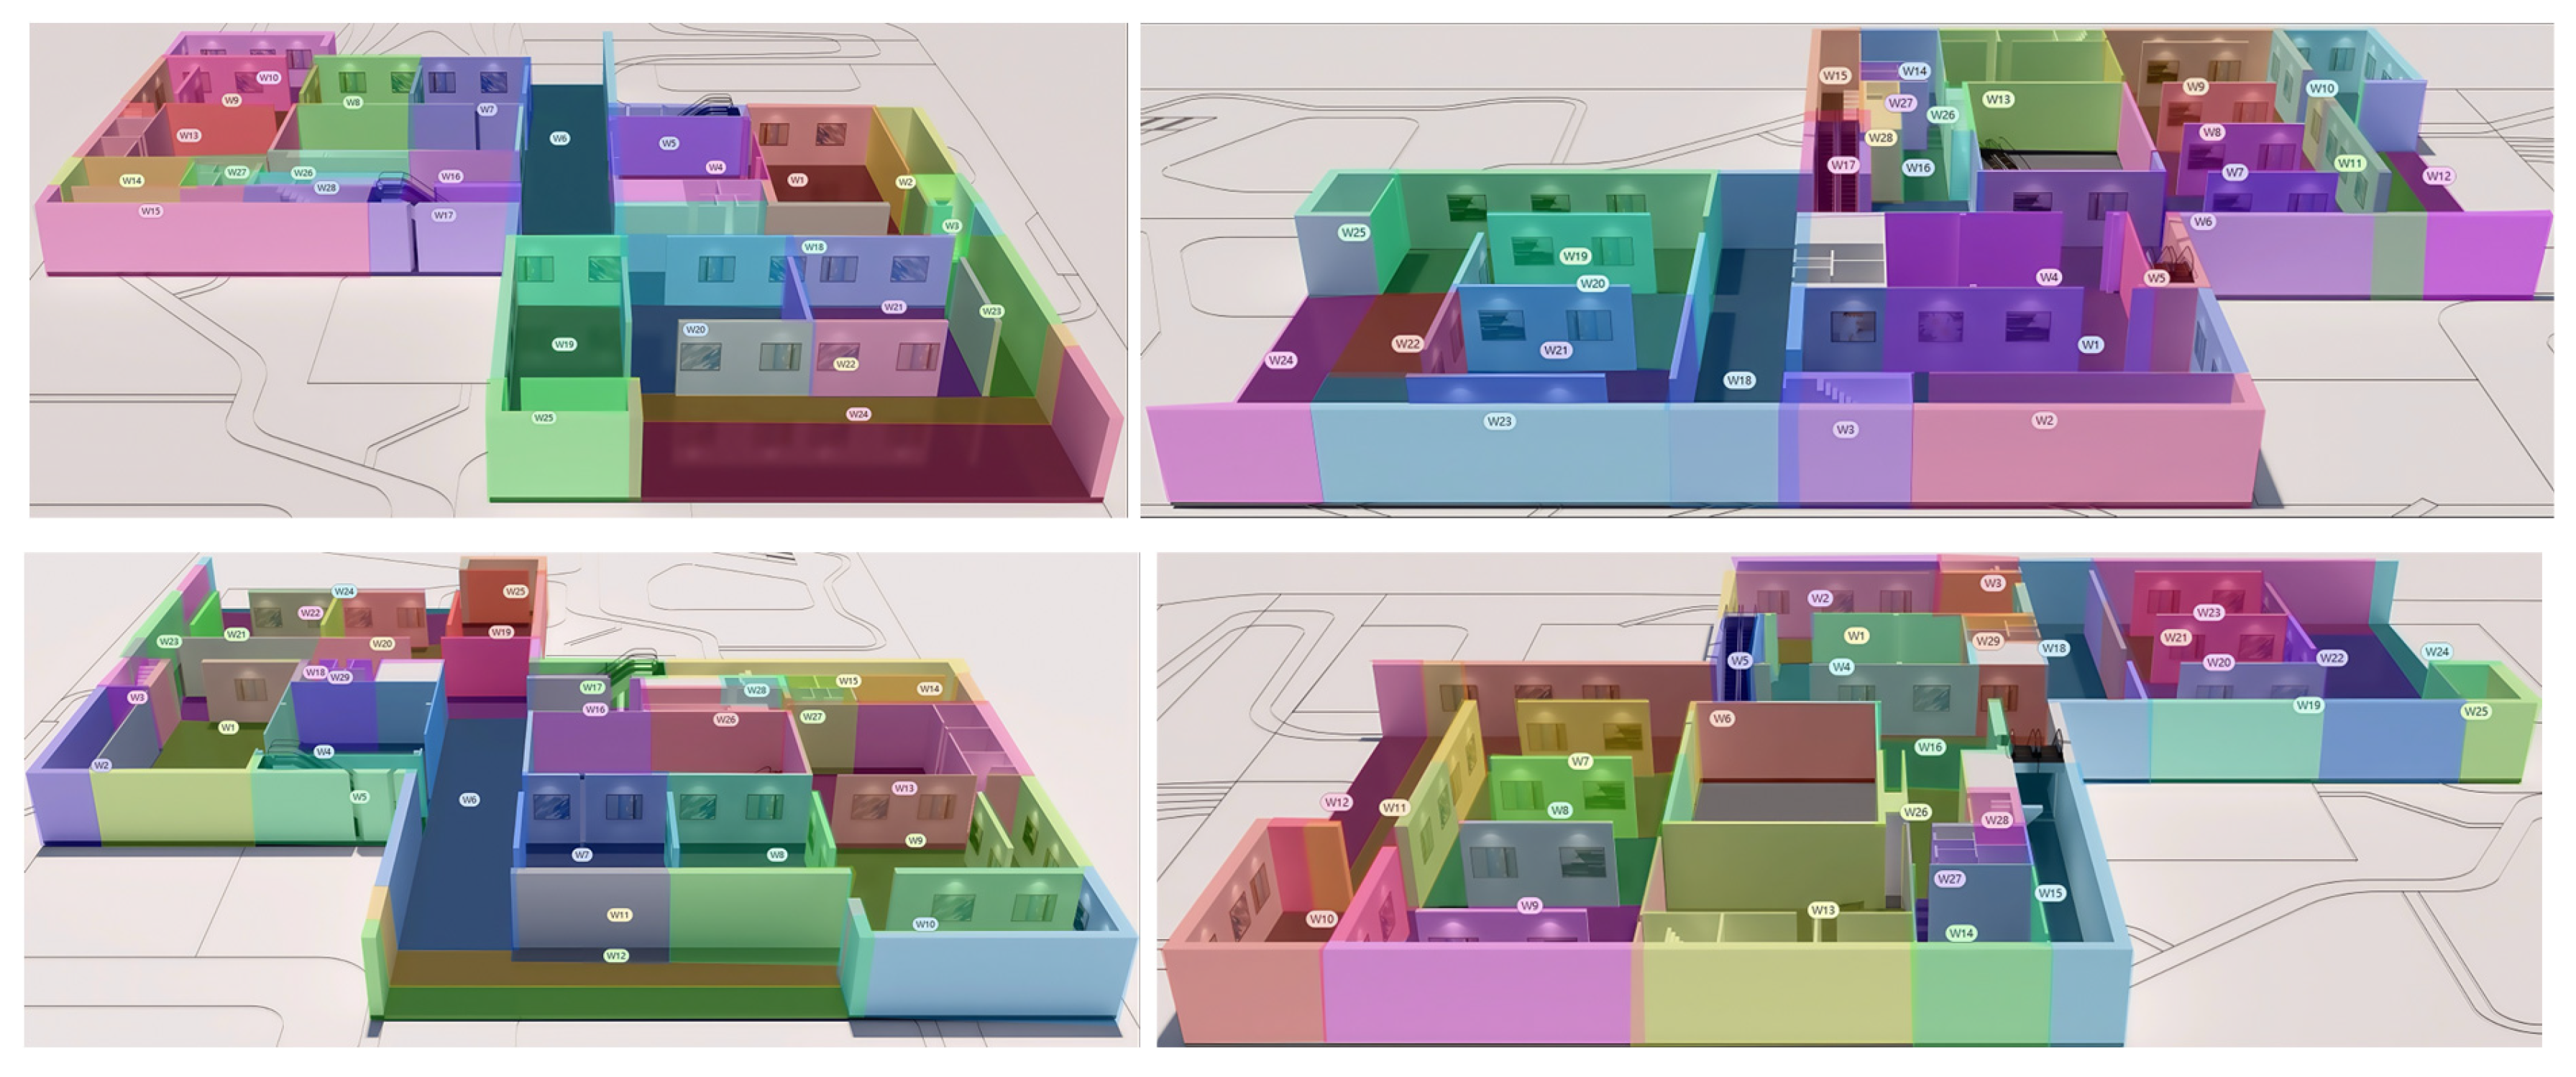
3.1. Visibility Graph Analysis Based on Space Syntax Theory

By superimposing a grid over the spatial layout of an exhibition space, various syntactic metrics can be calculated to assign quantitative values to the geometry and topology of the space. Among the commonly used space syntax indicators, Connectivity (C) and Integration (I) values were employed.
Under the constraint of physical boundaries such as walls, the C was used to calculate the number of grid points visible from a given analysis point. This index is derived from the concept of the isovist, which is a polygonal field drawn from a reference point within the architectural layout [34]. The polygon represents the entire surface area visible from the observation point.
I, by contrast, represents the relative accessibility of a point within the analyzed layout. It describes the average topological depth of a point relative to all other points in the system [40]. The depth of a point was defined as the topological (rather than geometric) distance that separates it from another point—measured as the number of steps along the shortest path connecting the two points.
I was defined as follows:
I = ( k 1 ) / D t
Space syntax analysis could be automated using specialized software. In this study, spatial attributes were derived using DepthmapX, developed by the Space Syntax Laboratory at the Bartlett School of Architecture, University College London (UCL). The input data for the software consisted of a vector-format DXF file of the Pudong Art Museum in Shanghai. This museum is situated near the Huangpu River waterfront and is surrounded by flowing water and lush trees, providing a culturally driven spatial experience for visitors. Figure 2 presents an exploded axonometric view of the building’s vertical organization and functional distribution, highlighting the specific location of the third-floor exhibition hall.
The analysis specifically focused on the third-floor temporary exhibition space, which served as the case study. Figure 3 illustrates the functional layout of the third-floor exhibition hall, categorized into four types of spatial usage: public space (orange), art space (blue), circulation space (yellow), and service space (gray). The visual segmentation highlights the separation between display zones and movement paths, forming the basis for spatial syntax and eye-tracking analysis.
As shown in the floor plan (Figure 3), spatial boundaries were defined by walls and exhibition layouts. These boundaries were modeled to approximate the visitor’s eye-level visual field at a height of 1.50 m. The software generated color-coded visual maps and numerical data tables, which proved highly useful for comparing and interpreting various syntactic metrics across different zones of the layout.
As an example, a visibility graph analysis was conducted for the third-floor temporary exhibition hall selected as the case study. The results are presented as a convex space visibility map (Figure 4). The high level of spatial integration observed in the convex space highlights its pivotal function in organizing and guiding visitor movement throughout the exhibition layout. According to Turner [41], the syntactic values for visibility are represented using a gradient color scale—from blue (indicating very low values) to red (indicating very high values). This visualization effectively reveals areas with strong spatial integration and potential hotspots for visitor circulation.

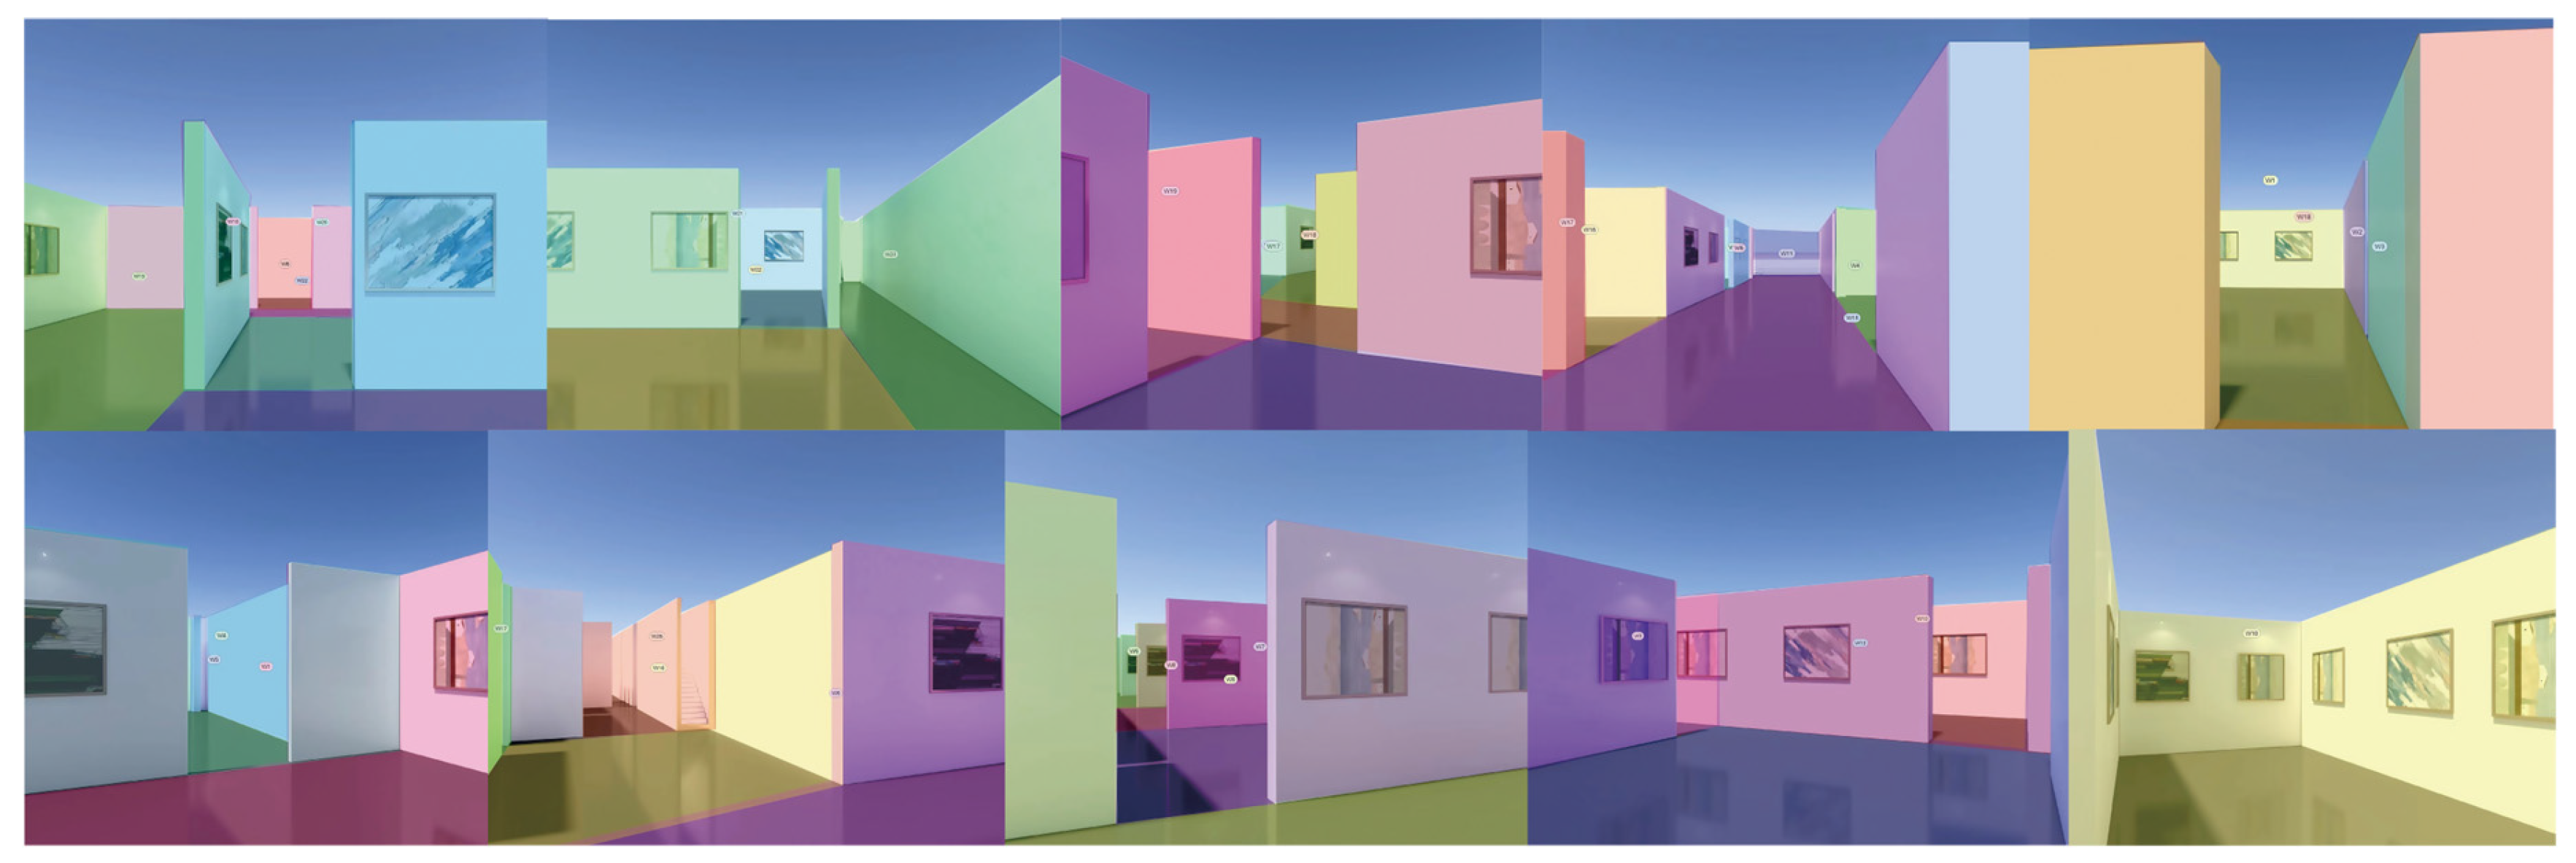
3.2. Eye-Tracking and HRV Experiment Design

Tobii Pro eye tracker (Tobii AB, Stockholm, Sweden)was employed to record participants’ visual attention data, including fixation heatmaps and scanpath trajectories. Simultaneously, a wrist-worn multimodal signal acquisition device (EryLife S2, Wecare Medical Co., Hangzhou, China) was used to monitor emotional arousal in real time by capturing variations in electrodermal activity and heart rate signals.
In order for participants to perceive spatial objects in a clear and realistic manner, the spatial configuration of the environment must exhibit directional clarity. According to European technical standards and international guidelines, the modeling index (M) is a critical parameter when assessing the visual modeling quality of both indoor and outdoor environments. This index was selected based on parameters relevant to the spatial characteristics of art exhibition environments—where visitors typically walk along defined paths, pausing intermittently to observe exhibits. This behavior is analogous to that observed in urban pedestrian scenarios.
Therefore, the modeling index proposed in CIE 136/2000 was adopted in this study. It was defined as the ratio of vertical illuminance (EV) to semi-cylindrical illuminance (ESC) at a given observation point. An M value between 0.8 and 1.3 was generally considered optimal, indicating a well-modeled environment. In other words, when the modeling index falls within this range, the three-dimensional spatial structure is perceived as well-balanced and realistic [42].
To control perceptual distortion and reduce experimental variability, all visual stimuli used in this study were software-simulated and calculated in accordance with the above standards. This ensured that the modeled visual environments closely resembled actual exhibition conditions, thereby minimizing perceptual deviation caused by lighting or spatial inconsistencies.
The integration of eye-tracking data and heart rate variability (HRV) responses was designed to address spatial evaluation from two complementary dimensions. Eye-tracking and heart rate data were utilized to validate and enrich the spatial design dimensions typically assessed through subjective perception. On the other hand, the experimental results provide contextual insights that help clarify how different design dimensions influence the visual behavior of various user groups.
Task Design: (1) Each participant was asked to complete an eye-tracking session simulating navigation through an art exhibition space. Using the Tobii Pro eye tracker, participants’ fixation points, dwell durations, and scanpaths were recorded as they freely explored a modeled virtual exhibition environment. In addition to free exploration, task-based activities were included (e.g., “Find the most efficient route”). The experimental interface was built using Tobii Pro Lab, Version 1.207.44884(x64), a platform capable of integrating with 360-degree panoramic imagery for immersive visual testing. The system allows precise tracking and analysis of visual attention within virtual spaces. At the same time, participants wore an EryLife S2 wristband, which was synchronized with the eye-tracking system, enabling real-time multimodal data collection across both platforms (Figure 5).
(2) Area of Interest (AOI) Configuration. To evaluate participants’ spatial navigation behavior within the modeled environment, specific experimental zones were defined based on overall spatial integration characteristics. These included areas of high and low integration, as well as distinct functional regions such as interactive zones and exhibition display areas. Drawing upon the results from DepthmapX (Figure 6), the AOIs were delineated using a combination of key spatial metrics [43], including convex space integration, isovist integration, and axial integration, alongside pedestrian flow simulations. Based on this analysis, as shown in Figure 7, the entire exhibition space was divided into 29 AOIs, labeled W1–W29 (Figure 7), in four directions, ensuring that each zone’s spatial properties aligned with the corresponding experimental objectives [44].
Furthermore, informed by the spatial depth values calculated in DepthmapX, the pedestrian movement routes were designed to follow paths of highest integration, specifically through areas W6 and W18. These paths represent the most visually and topologically connected routes within the environment. Based on these routes, a series of localized spatial stimuli were generated from a first-person perspective to emulate natural navigation behavior (Figure 8).
(3) Participants.Before the main experiment, a pilot study involving six participants was conducted under identical spatial and sensor conditions to verify the feasibility of the experimental design. In the pilot study, the calibration of the Tobii Pro eye tracker and HRV sensor was tested, AOI segmentation clarity was evaluated, and the smooth execution of the visual stimulus and measurement process were ensured. The results showed consistent behavioral patterns and minimal variance across fixation duration, saccades, and HRV values, confirming the reliability of the experimental setup.
The experiment was conducted in the Belt and Road Laboratory of the School of Innovation and Design, The experimental environment is shown in Figure 9, City University of Macau from 3–7 April 2025. A total of 21 participants with diverse backgrounds were recruited for the experiment. They were randomly assigned to the experimental group and the data were collected in sequence, including eye-tracking and HRV (Heart Rate Variability) measurements. Each participant completed the experiment individually to ensure the independence and validity of the collected data. Leveraging a within-subjects repeated-measures design, each participant contributed multiple data points across 29 predefined Areas of Interest (AOIs). This design enhanced data density and statistical robustness, supporting reliable exploratory and correlational analyses at the spatial unit level. The dataset revealed stable patterns of visual attention and physiological response, providing an empirical foundation for subsequent model development and contextual comparisons.
All had normal or corrected-to-normal vision and no history of neurological or psychiatric disorders. The participant sample included: (a) University students, including undergraduate, master’s, and doctoral students; (b) Professionals working in the field of art and design; and (c) The gender distribution consisted of 10 males and 11 females, with ages ranging from 18 to 55 years. All participants had provided informed consent and this study was conducted in accordance with the Declaration of Helsinki (1975, revised 2013).
(4) Data Collection. The following metrics were recorded during the experiment: eye-tracking data, including dwell time, scanpaths, fixation points, and saccadic velocity, as well as HRV as an indicator of physiological arousal.

4. Experimental Results and Analysis

4.1. Analysis of Spatial Configuration Features: Visibility and Integration Metrics

DepthmapX was employed to conduct a space syntax analysis of the third-floor temporary exhibition space at the Pudong Art Museum in Shanghai. Key spatial metrics were extracted, including Integration, Connectivity, and Visibility Graph Analysis (VGA) [45]. The exhibition layout was divided into uniform grid cells, and topological computations were performed on each cell to evaluate its spatial relationships. These metrics were then mapped onto the functional exhibition layout to identify potential visitor circulation paths and spatial affordances.
Figure 10 displays five viewshed metrics generated via DepthmapX: clustering, linking, control, depth, and integration. Warmer colors indicate higher values of visual connectivity or accessibility, while cooler colors indicate lower visibility. The analysis revealed several notable patterns: the highest integration values were observed near the entrance area and along the main exhibition corridor, with a peak value of 4.66. This suggests that these areas have strong visual guidance and spatial connectivity, which naturally attracts visitors and supports the formation of major movement routes. The highest Connectivity values were observed at the central exhibition nodes, highlighting these locations as spatially accessible hubs where visitor behaviors converge and circulation transitions occur. VGA results showed that the main pathways and open-plan exhibition areas offered large isovist fields and low occlusivity, suggesting strong visual permeability. These zones are more effective at capturing attention and enhancing perceived spatial openness. In contrast, peripheral galleries and dead-ends had low visual accessibility, limiting their ability to attract visitors or support intuitive wayfinding. These spatial configuration insights provide a quantitative basis for understanding how layout affects user experience, which can inform curatorial strategies and architectural improvements in exhibition design.
Furthermore, the geometric attributes of each isovist point were extracted and quantified, including isovist area, mean radius, standard deviation, circularity, occlusivity, compactness, and drift. Figure 11 presents the Pearson correlation coefficients, and the following conclusions were drawn. Spaces with large isovist areas and high mean radii often function as primary visual focal zones, naturally attracting visitors’ initial attention. These areas are ideal for placing key exhibits or interactive installations. Spaces with high circularity and strong compactness help establish a stable and well-ordered visual environment, thereby reducing cognitive load and enhancing spatial comfort. Areas with high occlusivity and large drift values tend to possess a sense of spatial mystery, which can stimulate exploratory interest. However, they may cause wayfinding difficulties and cognitive confusion if not properly managed. Zones characterized by high jaggedness and spatial complexity exhibit ambiguous visual boundaries, potentially leading to attentional dispersion and hesitation in movement. These findings highlight the nuanced relationship between local visual field properties and user perception, providing design insights for optimizing functional zoning and quality of experience in exhibition spaces.
Isovist Area and Max Radial: Significant positive correlation (≈0.98): The larger the visual area, the longer the maximum radial distance (maximum visible radius). This shows that the openness of the space determines the breadth of visual coverage. Visual Integration and Visual Control/Controllability: There is a moderate to high positive correlation, indicating that areas with high integration have both strong controllability and potential visual guidance. Visual entropy and Mean Depth: a significant positive correlation exists: spaces with greater depth typically have more complex visual pathways and higher entropy values, reflecting increased cognitive load.
Overall, spatial configuration features influence visitors’ path choices and dwell zones, and directly affect their perceptual clarity and behavioral efficiency. The findings from this section provide critical structural variables that support the subsequent analyses of eye-tracking behavior and HRV-based emotional responses, forming the foundation of an integrated “Space Structure—Emotion—Behavior” analytical pathway.

4.2. Physiological Data Analysis

(1) Eye-Tracking Data
To investigate differences in visual guidance and viewing behavior across spatial zones, a statistical analysis of eye-tracking data collected from participants in both global (Table 3)and local (Table 4) areas of interest (AOIs) was conducted within the exhibition space, in conjunction with the full-space heat map in Figure 12 and the local-space heat map in Figure 13. Five core metrics were extracted: number of fixations, total fixation duration, average fixation duration, number of visits, and scanpath complexity.
1. Visually Attractive Zones (e.g., W1 and W13): Zone W1 recorded the highest fixation count (5.23) and the longest total fixation duration (1255.67 ms), suggesting its central role in capturing and maintaining visitor attention within the overall exhibition layout. Likewise, Zone W13 showed elevated fixation frequency (4.62) and visit count (2.20), indicating that its spatial positioning or exhibit composition may have strongly influenced navigational behavior. Notably, both zones exhibited higher scanpath complexity values (0.14 and 0.13, respectively), reflecting more intricate visual search patterns. This suggests that participants engaged in more cognitively demanding exploration in these areas, potentially due to denser visual stimuli or multiple competing focal elements.
2. Cognitively Demanding Zones (e.g., W10 and W12): Both W10 and W12 exhibited relatively high average fixation durations, exceeding 260 ms (260.58 ms and 260.48 ms, respectively), suggesting that participants maintained prolonged visual attention in these areas. This may reflect a higher cognitive load due to dense informational content or increased interpretative difficulty of the exhibits. However, these zones also showed lower fixation counts and visit frequencies, indicating that although sustained attention was required, these areas were not primary focal points in participants’ visual behavior.
3. Low-Engagement Zones (e.g., W11 and W12): Zones W11 and W12 recorded relatively low numbers of fixations (3.41 and 2.28, respectively) and shorter total fixation durations (822.27 ms and 575.38 ms), suggesting reduced levels of visual engagement compared to other areas. Notably, W12 had the lowest visit frequency (1.67), indicating that this zone may be spatially peripheral or exhibit limited visual or thematic appeal to visitors.
4. Relationship Between Path Complexity and Spatial Guidance: Scanpath complexity reached the highest level in zones W1 and W13 (0.14 and 0.13, respectively), suggesting that these areas featured more intricate spatial configurations, exhibit arrangements, or visual navigation cues that prompted complex viewing patterns. In contrast, W12 exhibited the lowest scanpath complexity (0.09), reflecting a more linear and predictable navigation experience with limited exploratory demand.
5. Comparative Analysis of Viewing Perspectives (Global vs. Local Observers): To investigate how different observation strategies—namely global (complete) versus local viewing perspectives—affect visual attention, the fixation counts across shared areas of interest (AOIs) under both conditions were compared. A non-parametric Mann-Whitney U test was carried out to evaluate group differences. The results are summarized as follows (Table 5):
Specifically, participants in the partial-view condition exhibited significantly more fixations (M = 10.54 vs. 4.59, p < 0.001) and longer total fixation durations (M = 2946.98 ms vs. 1124.86 ms, p < 0.001). It can be concluded that spatial views framed by local boundaries tend to elicit higher levels of cognitive engagement and more concentrated visual exploration. In contrast, full-view conditions—defined by expansive spatial exposure—appear to diffuse attention across a wider field, resulting in shorter fixation durations and a more dispersed visual scanning pattern.
From a space syntax perspective, these differences in visual engagement reflect underlying differences in spatial attractiveness. Areas with higher isovist area, integration, and visual openness tend to correspond with increased visitor attention and interaction, particularly under conditions where visual information is constrained or concentrated. This phenomenon aligns with previous findings that spatial occlusion, if properly designed, can enhance the environment’s mystique and exploration potential without disrupting navigational clarity.
To assess how spatial scale modulates visual attention patterns, eye-tracking data across global AOIs (W1–W29) were compared and local AOIs were selected. Boxplots for six eye-tracking metrics—average fixation duration, total fixation duration, number of saccades, number of regressions, scanpath complexity, and number of saccades within AOIs—were used to visualize behavioral variability at both levels (see Figure 14 and Figure 15).
Globally, AOIs such as W1, W13, and W18 demonstrated higher fixation durations, and W7, W10, and W25 revealed higher scanpath complexity. Locally, W3, W5, and W13 showed stronger visual retention, indicating stable attentional attraction across scales. W7 and W15 showed similar behavior, indicating spatial ambiguity or dense exhibit arrangement. W3 and W25 showed frequent regressions in both global and local analyses, possibly due to interpretive uncertainty or perceptual overload. This comparative analysis implies that some AOIs, such as W13, maintain consistent cognitive salience across both global and local levels, while others, such as W7 and W15, are scale-sensitive and more reactive in localized contexts. Hence, spatial design should incorporate multi-scale diagnostics—addressing macro-level circulation and visibility and identifying micro-level zones that may introduce perceptual ambiguity or attention fragmentation. These insights provide a methodological foundation for integrated spatial optimization strategies that account for both macro circulation clarity and micro exhibit legibility.
(2) HRV Data
The Figure 16 illustrates multi-group comparisons of HRV values across 12 spatial nodes, revealing clear fluctuations in HRV across different locations. This variation indicates that spatial structure differentially modulates visitors’ autonomic nervous system responses depending on the node [12]. In most areas of interest, the green-coded group exhibited higher HRV values, suggesting that the corresponding spatial environments were more likely to evoke physiological arousal or stress responses under that experimental condition. Conversely, in a few nodes, HRV values converged across all groups, implying a consistency in physiological experience regardless of viewing condition. These findings reinforce the theoretical proposition that spatial configuration shapes emotional and physiological responses, while providing empirical evidence to inform the optimization of spatial layouts and circulation strategies in future design practice.
HRV values derived from the complete heart rate dataset ranged from 0 ms to 14.14 ms, with a mean of 2.87 ms and a standard deviation of 2.23 ms. This suggests considerable variation in autonomic nervous system activity across different spatial locations. Most HRV data points clustered within the range of 1.47 ms to 3.59 ms, indicating a moderate level of physiological fluctuation and suggesting that participants generally remained in a relatively stable physiological state throughout the exhibition experience. However, notably elevated HRV values were observed at certain spatial nodes. This demonstrates that spatial complexity or spatial disorientation may have triggered heightened physiological arousal and emotional responses.

4.3. Coupled Analysis of Spatial Structure, Visual Attention, and Physiological Response

This section presents a systematic analysis of the relationships among spatial configuration, visual attention behavior, and physiological responses. The study incorporates statistical evaluations of correlations between spatial metrics, eye-tracking data, and heart rate variability (HRV), as well as regression modeling to explore how visual behavior and autonomic arousal interact with spatial design features.
(1) High inter-correlation among eye-tracking variables
Strong correlations were observed among key eye-tracking indicators. In particular, fixation count exhibited a near-perfect positive relationship with total fixation duration (R2 = 0.94), indicating that the number of visual fixations is closely tied to the overall time spent observing a spatial region. Likewise, the number of saccades within AOIs was strongly correlated with scanpath complexity (R2 = 0.88), suggesting that gaze trajectory complexity aligns with the intensity of visual exploration [46]. These findings indicate that cognitive load during spatial wayfinding is reflected in a constellation of interdependent eye-movement parameters, suggesting a coherent underlying structure in attentional deployment and behavioral regulation.
(2) Eye-tracking and HRV association (Figure 17)
HRV and Duration of First Fixation: A moderately strong positive correlation was observed between HRV and the duration of the first fixation. This suggests that participants exhibiting higher HRV—indicative of a more relaxed or emotionally regulated physiological state—tended to dwell longer on their initial point of focus. Such prolonged fixation may reflect enhanced cognitive engagement or more deliberate visual processing in response to spatial stimuli.
HRV and Number of Fixations: A moderate negative correlation was identified between HRV and the number of fixations. This relationship implies that lower HRV levels—potentially associated with heightened emotional arousal or stress—correspond to more frequent fixations, indicative of fragmented or hypervigilant visual scanning behavior.
HRV and Total Fixation Duration: There was a relatively weak association between HRV and total fixation duration, suggesting that accumulated gaze time across the viewing task may be more substantially influenced by spatial characteristics or task relevance than by emotional regulation alone.
HRV and Scanpath Complexity: A slight negative correlation was found between HRV and scanpath complexity, indicating that lower HRV may be associated with more complex, irregular gaze paths. This may reflect elevated cognitive load or an increased tendency toward exploratory behavior under physiological stress.
(3) Mediation Analysis: HRV as a Mediator Between Spatial Integration and Visual Behavior
To examine whether emotional arousal, as indexed by HRV, mediates the relationship between spatial configuration and visual behavior, a series of linear regression models were conducted based on Baron and Kenny’s approach.
Spatial Integration → HRV → Number of Fixations. The results showed that spatial integration significantly predicted HRV (β = −7.92), indicating that spaces with higher integration were associated with reduced HRV, reflecting a higher level of arousal or cognitive engagement. HRV, in turn, negatively predicted the number of fixations (β = −0.36), suggesting that lower HRV levels were associated with more frequent fixations. Even after controlling for HRV, spatial integration still significantly predicted the number of fixations (β = 8.23), compared to the total effect (β = 11.06). These findings provide empirical support for a partial mediation model, wherein HRV contributes to explaining the pathway through which spatial configuration influences the intensity of visual attention.
Spatial Integration → HRV → Scanpath Complexity. For the pathway involving scanpath complexity, spatial integration also significantly predicted HRV (β = −7.92). However, HRV had only a weak effect on scanpath complexity (β = −0.0041), and the direct effect of spatial integration on scanpath complexity remained largely unchanged (β = 0.134), compared to the total effect (β = 0.167). The results suggest that scanpath complexity is primarily governed by spatial factors such as visibility and occlusion, rather than being substantially modulated by physiological arousal. This indicates that in the observed relationship, spatial configuration exerts a more direct influence on visual search behavior than HRV dynamics. In summary, these findings support the hypothesis that HRV mediates the relationship between spatial configuration and attentional behavior, particularly in fixation-related metrics. However, its mediating effect appears to be limited with respect to scanpath complexity (Figure 18).

5. Conclusions and Implications

5.1. Key Empirical Findings

In the current study, a conceptual framework was proposed and empirically validated, which linked spatial configuration, emotional arousal (measured by heart rate variability, HRV), and visual attention behavior (measured by eye-tracking). As quantified through space syntax, spatial integration significantly influenced both physiological and behavioral dimensions of visitor experience. Specifically, HRV was found to partially mediate the relationship between spatial integration and fixation frequency, suggesting that environments with higher syntactic coherence facilitate stable emotional states that support focused attention. Meanwhile, scanpath complexity was more strongly associated with spatial visibility and perceptual uncertainty. This highlights the structural role of openness and occlusion in shaping visual exploration.
Methodologically, this work offers a novel integration of spatial syntax analysis (via DepthmapX), physiological sensing (wrist-based HRV), and behavioral tracking (eye movement data) to form a multimodal evaluation framework. This approach enables the direct mapping of spatial variables to affective and attentional outcomes, expanding the analytical toolkit for evaluating empirical spatial experience in exhibition settings. It also offers a methodological reference for future research that intersects architecture, design, and cognitive science.

5.2. Theoretical and Practical Contributions

This study advances the interdisciplinary field of experiential space research by integrating spatial configuration theory with emotional and perceptual indicators. HRV, as a mediating construct between space and behavior presents a novel methodological perspective that deepens our understanding of how built environments influence affective and cognitive states. Moreover, the application of space syntax to identify integration levels and correlate them with physiological and visual attention patterns provides valuable insights for practice. Exhibition designers, curators, and planners can leverage these findings to optimize circulation [47], enhance emotional resonance [48], and strategically guide visitor attention [49]. This study also supports the broader use of multimodal data—combining spatial metrics, physiological signals, and behavioral observation—as a foundation for evidence-based spatial design.

5.3. Limitations and Future Research Directions

Although this study offers a robust and integrated methodological framework, there are several limitations. First, despite conducting a pilot study with six participants, the main experiment involved only 21 subjects. Second, the participant group was demographically narrow, consisting mainly of individuals from East Asia. As spatial perception and emotional responses are often culturally mediated [50], future studies should incorporate more diverse and cross-cultural samples. Third, the study focused on a single spatial typology—a formal, institutional gallery—which may not capture the range of experiences in informal, participatory, or open-air settings. Additionally, although experimental simulations allowed for high control and repeatability, they may not fully replicate the embodied, multisensory realism of real-world environments. This is particularly relevant for HRV, which is sensitive to spatial immediacy [51], physical activity [52], and environmental richness [53]. The absence of full-body locomotion, tactile interaction, and spontaneous social engagement in simulation-based experiments may influence attentional and emotional outcomes.
Future research should address these issues by employing larger, more diverse samples and by comparing different types of exhibition spaces—including immersive installations, community-based art environments, and mobile exhibitions. Additionally, further work could incorporate more comprehensive physiological and psychological measures (e.g., galvanic skin response, facial expression analysis, subjective emotional scales) to triangulate the affective impact of spatial configurations.Integrating dynamic simulation or virtual reality tools, as demonstrated in previous studies [54], may facilitate controlled manipulation of spatial parameters and real-time tracking of behavior in ecologically valid settings.

Author Contributions

Conceptualization, Y.D.; methodology, Y.D. and Y.R.; writing—original draft preparation, Y.D. and Y.R.; writing—review and editing, Y.D., Y.R. and H.L.; picture drawing, Y.D. and M.W. All authors have read and agreed to the published version of the manuscript.

Funding

This research was funded by Guangdong Province’s key project for colleges and universities: “Research on the aging-friendly design system of health information for rural elderly people in a healthy village”, grant number 2024ZDZX4038.

Data Availability Statement

Data will be available on reasonable request.

Conflicts of Interest

The authors declare no conflicts of interest.

References

  1. Takala, G.B. The interactive creativity of the digital era: Exploring how media art redefines the relationship between audience and artwork. Stud. Art Archit. 2023, 2, 28–44. [Google Scholar] [CrossRef]
  2. Gül, S.N.; Akmehmet, K.T. Interactive spaces in art museums: A landscape of exhibition strategies. Sol. Polje 2015, 26, 141–155. [Google Scholar]
  3. Li, P. Cultural communication in museums: A perspective of the visitors experience. PLoS ONE 2024, 19, e0303026. [Google Scholar] [CrossRef]
  4. Qilin, Z.; Zhang, L.; Li, H.; Estrada, M.V. Digital Transformation of the Shaolin Cultural Industry: Pathways and Challenges for Achieving Sustainable Development. Preprints 2025. Not Peer Reviewed. [Google Scholar] [CrossRef]
  5. Gao, M.; Fang, C. Do urban park spatial features influence public emotional responses during jogging? Evidence from social media data. J. Outdoor Recreat. Tour. 2025, 50, 100864. [Google Scholar] [CrossRef]
  6. Roofigari-Esfahan, N.; Morshedzadeh, E. A conceptual framework for designing human-centered building-occupant interactions to enhance user experience in specific-purpose buildings. Des. Sci. 2025, 11, e5. [Google Scholar] [CrossRef]
  7. Zeng, H. Experience-Oriented Ecological Design: A Methodological Framework to Improve Human Experience in Urban Public Space Ecological Design. Ph.D. Thesis, Virginia Tech, Blacksburg, VA, USA, 2005. [Google Scholar]
  8. Xu, H.; Jin, C.; Chai, Y.; Zhao, J. Research on Multi-Sensory Experience Design of Interior Space from the Perspective of Spatial Perception: A Case Study of Suzhou Coffee Roasting Factory. Buildings 2025, 15, 1393. [Google Scholar] [CrossRef]
  9. Chen, X.; Zhang, Q.; Liu, W.; Rahimi, R.; Qi, J. Exploring visual attention and perception in hospitality and tourism: A comprehensive review of eye-tracking research. J. Hosp. Tour. Insights 2025. ahead of print. [Google Scholar] [CrossRef]
  10. Çevik, H.; Chen, S.S.; Mastromartino, B.; Zhang, J.J. Understanding esports venue operations: How venue characteristics influence spectator outcomes. Mark. Intell. 2025. ahead of print. [Google Scholar] [CrossRef]
  11. Sisneros-Kidd, A.M.; D’Antonio, A.; Monz, C.; Mitrovich, M. Improving understanding and management of the complex relationship between visitor motivations and spatial behaviors in parks and protected areas. J. Environ. Manag. 2021, 280, 111841. [Google Scholar] [CrossRef]
  12. Liu, B.P.; Kuo, C.G.; Lee, C.W. The Quantitative Research of Applying Visibility Graph Analysis Method of Space Syntax Theory to Visual and Access Cost of Evacuating Buildings. In Proceedings of the 3rd Eurasian Conference on Educational Innovation 2020 (ECEI 2020), Hanoi, Vietnam, 5–7 February 2020; pp. 913–916. [Google Scholar]
  13. Choi, A.S.; Kim, Y.O.; Oh, E.S.; Kim, Y.S. Application of the space syntax theory to quantitative street lighting design. Build. Environ. 2006, 41, 355–366. [Google Scholar] [CrossRef]
  14. Karimi, K. The configurational structures of social spaces: Space syntax and urban morphology in the context of analytical, evidence-based design. Land 2023, 12, 2084. [Google Scholar] [CrossRef]
  15. Xing, Z.; Guo, W. A new urban space analysis method based on space syntax and geographic information system using multisource data. ISPRS Int. J. Geo-Inf. 2022, 11, 297. [Google Scholar] [CrossRef]
  16. Griffiths, S. The use of space syntax in historical research: Current practice and future possibilities. In Proceedings of the 8th International Space Syntax Symposium, Environment and Ecology, Santiago, Chile, 6 January 2012; Volume 8, pp. 1–26. [Google Scholar]
  17. Ottenby, N. A Spatial Syntax for Perceived Safety in Urban Environments: For Application in Urban Planning. 2017. Available online: https://www.diva-portal.org/smash/get/diva2:1120125/FULLTEXT01.pdf (accessed on 5 April 2025).
  18. Luo, Y.; Lin, Z. Spatial Accessibility Analysis and Optimization Simulation of Urban Riverfront Space Based on Space Syntax and POIs: A Case Study of Songxi County, China. Sustainability 2023, 15, 14929. [Google Scholar] [CrossRef]
  19. Lee, J.H. Public Memory, Architectural Language, and Its Configurational Relationship in the Memorial Museum: A Case Study of the War Memorial of Korea Using Space Syntax and Movement Tracking. Buildings 2024, 14, 590. [Google Scholar] [CrossRef]
  20. Tzortzi, K. The Interaction Between Building Layout and Display Layout in Museums. PhD. Thesis, University College London, London UK, 2007. [Google Scholar]
  21. Mohamed, A.A.; van der Laag Yamu, C. Space syntax has come of age: A bibliometric review from 1976 to 2023. J. Plan. Lit. 2024, 39, 203–217. [Google Scholar] [CrossRef]
  22. Zeng, Z.; Zhang, K.; Zhang, B. Study on the influence of spatial attributes on passengers’ path selection at fengtai high-speed railway station based on eye tracking. Buildings 2024, 14, 3012. [Google Scholar] [CrossRef]
  23. Strachan-Regan, K.; Baumann, O. The impact of room shape on affective states, heartrate, and creative output. Heliyon 2024, 10, e28340. [Google Scholar] [CrossRef]
  24. Eisenbarth, H.; Oxner, M.; Shehu, H.A.; Gastrell, T.; Walsh, A.; Browne, W.N.; Xue, B. Emotional arousal pattern (EMAP): A new database for modeling momentary subjective and psychophysiological responding to affective stimuli. Psychophysiology 2024, 61, e14446. [Google Scholar] [CrossRef]
  25. Qi, Y.; Ni, Q.; Xue, Q.; Wu, J.; Lee, S. Analysis of museum exhibition space optimization design: Grounded theory and analytic hierarchy process. Asia-Pac. J. Converg. Res. Interchange 2024, 10, 439–453. [Google Scholar] [CrossRef]
  26. Mezhenna, N.; Zymina, S.; Ushakov, G.; Filippova, D. Variability of modern possibilities of organization of museum and exhibition space. AIP Conf. Proc. 2023, 2490, 30010. [Google Scholar]
  27. Hölscher, C.; Brösamle, M. Capturing indoor wayfinding strategies and differences in spatial knowledge with space syntax. In Proceedings of the 6th International Space Syntax Symposium, Istanbul, Turkey, 12–15 June 2007; pp. 43.1–43.12. [Google Scholar]
  28. Wineman, J.D.; Peponis, J. Constructing spatial meaning: Spatial affordances in museum design. Environ. Behav. 2010, 42, 86–109. [Google Scholar] [CrossRef]
  29. Medaković, J.; Atanacković Jeličić, J.; Ecet, D.; Nedučin, D.; Krklješ, M. The interplay between spatial layout and visitor paths in modern museum architecture. Buildings 2024, 14, 2147. [Google Scholar] [CrossRef]
  30. Qanazi, S.; Hijazi, I.H.; Shahrour, I.; Meouche, R.E. Exploring urban service location suitability: Mapping social behavior dynamics with space syntax theory. Land 2024, 13, 609. [Google Scholar] [CrossRef]
  31. Wu, Y.; Liu, Q.; Hang, T.; Yang, Y.; Wang, Y.; Cao, L. Integrating restorative perception into urban street planning: A framework using street view images, deep learning, and space syntax. Cities 2024, 147, 104791. [Google Scholar] [CrossRef]
  32. Psarra, S. Architecture and language: Morphosyntactic-morphosemantic relations and (con) figuration. In Proceedings of the 13th International Space Syntax Symposium, Bergen, Norway, 20 June 2022. [Google Scholar]
  33. Turner, A. Depthmap: A program to perform visibility graph analysis. In Proceedings of the 3rd International Symposium on Space Syntax, Atlanta, GA, USA, 7–11 May 2001. [Google Scholar]
  34. Benedikt, M.L. To take hold of space: Isovists and isovist fields. Environ. Plan. B Plan. Des. 1979, 6, 47–65. [Google Scholar] [CrossRef]
  35. Bordel, B.; Alcarria, R. Assessment of human motivation through analysis of physiological and emotional signals in industry 4.0 scenarios. J. Ambient. Intell. Humaniz. Comput. 2024, 15, 1443–1463. [Google Scholar] [CrossRef]
  36. Khaleghi, A.; Shahi, K.; Saidi, M.; Babaee, N.; Kaveh, R.; Mohammadian, A. Linear and nonlinear analysis of multimodal physiological data for affective arousal recognition. Cogn. Neurodyn. 2024, 8, 2277–2288. [Google Scholar] [CrossRef]
  37. Ergan, S.; Radwan, A.; Zou, Z.; Tseng, H.; Han, X. Quantifying human experience in architectural spaces with integrated virtual reality and body sensor networks. J. Comput. Civ. Eng. 2019, 33, 4018062. [Google Scholar] [CrossRef]
  38. Franz, G.; Von Der Heyde, M.; Bülthoff, H.H. An empirical approach to the experience of architectural space in virtual reality—Exploring relations between features and affective appraisals of rectangular indoor spaces. Autom. Constr. 2005, 14, 165–172. [Google Scholar] [CrossRef]
  39. Harris, D.J.; Bird, J.M.; Smart, P.A.; Wilson, M.R.; Vine, S.J. A framework for the testing and validation of simulated environments in experimentation and training. Front. Psychol. 2020, 11, 605. [Google Scholar] [CrossRef]
  40. de Cataldo, M.A.A. Perverse sheaves and the topology of algebraic varieties (2015 PCMI). arXiv 2015, arXiv:1506.03642. [Google Scholar]
  41. Turner, A. Depthmap 4: A Researcher’s Handbook; Bartlett School of Graduate Studies, University College London: London, UK, 2004; Available online: https://discovery.ucl.ac.uk/id/eprint/2651 (accessed on 5 April 2025).
  42. Zaikina, V.; Matusiak, B.S. Verification of the accuracy of the luminance-based metrics of contour, shape, and detail distinctness of 3d object in simulated daylit scene by numerical comparison with photographed hdr images. Leukos 2017, 13, 177–188. [Google Scholar] [CrossRef]
  43. Ma, X.; Yang, Q. Research on the spatial location design of guidance signage systems to connect the space of transit-orientated development sites based on multi-software analysis. Buildings 2025, 15, 683. [Google Scholar] [CrossRef]
  44. Fidler, M.; Gallistl, F.; Champati, J.P.; Widmer, J. 2D-AoI: Age-of-information of distributed sensors for spatio-temporal processes. arXiv 2024, arXiv:2412.12789. [Google Scholar]
  45. Omrani Azizabad, S.; Mahdavinejad, M.; Hadighi, M. Three-dimensional embodied visibility graph analysis: Investigating and analyzing values along an outdoor path. Environ. Plan. B Urban Anal. City Sci. 2024. [Google Scholar] [CrossRef]
  46. Ai, D.; Wang, H.; Kuang, D.; Zhang, X.; Rao, X. Measuring pedestrians’ movement and building a visual-based attractiveness map of public spaces using smartphones. Comput. Environ. Urban Syst. 2024, 108, 102070. [Google Scholar] [CrossRef]
  47. Liu, Y.; Chen, L.; Xu, Y.; Yang, J. Exhibition Space Circulation in Museums from the Perspective of Pedestrian Simulation. Buildings 2024, 14, 847. [Google Scholar] [CrossRef]
  48. Watson, F. Design as Exhibit (Curator as Space-maker). In The New Curator: Exhibiting Architecture and Design; Routledge: London, UK, 2021; pp. 29–58. [Google Scholar]
  49. Bitgood, S. Attention and Value: Keys to Understanding Museum Visitors; Routledge: London, UK, 2016. [Google Scholar]
  50. Deregowski, J.B. Real space and represented space: Cross-cultural perspectives. Behav. Brain Sci. 1989, 12, 51–74. [Google Scholar] [CrossRef]
  51. Park, G.; Van Bavel, J.J.; Vasey, M.W.; Egan, E.J.; Thayer, J.F. From the heart to the mind’s eye: Cardiac vagal tone is related to visual perception of fearful faces at high spatial frequency. Biol. Psychol. 2012, 90, 171–178. [Google Scholar] [CrossRef]
  52. Makivić, B.; Nikić Djordjević, M.; Willis, M.S. Heart Rate Variability (HRV) as a tool for diagnostic and monitoring performance in sport and physical activities. J. Exerc. Physiol. Online 2013, 16, 1097–9751. [Google Scholar]
  53. Kobayashi, H.; Song, C.; Ikei, H.; Park, B.J.; Lee, J.; Kagawa, T.; Miyazaki, Y. Forest walking affects autonomic nervous activity: A population-based study. Front. Public Health 2018, 6, 278. [Google Scholar] [CrossRef]
  54. Parsons, T.D. Virtual reality for enhanced ecological validity and experimental control in the clinical, affective and social neurosciences. Front. Hum. Neurosci. 2015, 9, 660. [Google Scholar] [CrossRef]
Figure 1. Integrated spatial-behavioral framework combining space syntax and multimodal physiological evaluation. Source: Conceptual model designed and drawn by the authors based on spatial theory and experimental workflow.
Buildings 15 01776 g001
Figure 2. Shanghai Pudong Art Museum axonometric diagram of functional distribution across all floors. Source: Visualized by the authors based on building section data and functional planning.
Buildings 15 01776 g002
Figure 3. Functional zoning of the 3rd floor exhibition space. Source: Drawn by the authors based on architectural plans and field survey.
Buildings 15 01776 g003
Figure 4. Spatial integration distribution of the exhibition floor. Source: Computed and visualized by the authors using DepthmapX (v10.19,UCL, London, UK), based on the vectorized floorplan of the Pudong Art Museum.
Buildings 15 01776 g004
Figure 5. Workflow of physiological data acquisition using the EryLife S2 wrist-worn multimodal sensing device. Source: Designed and illustrated by the authors based on experimental protocol.
Buildings 15 01776 g005
Figure 6. Spatial segmentation and AOI labeling based on key syntactic metrics. Source: Generated by the authors using DepthmapX and Grasshopper spatial overlays.
Buildings 15 01776 g006
Figure 7. Overall spatial AOI segmentation and labeling. Source: Visualized by the authors based on eye-tracking data collected using Tobii Pro Lab. The color corresponding areas are marked in the picture.
Buildings 15 01776 g007
Figure 8. Local space AOI segmentation and labeling. Source: Visualized by the authors based on eye-tracking data collected using Tobii Pro Lab. The color corresponding areas are marked in the picture.
Buildings 15 01776 g008
Figure 9. Experimental room layout and participant movement range. Source: Drawn by the authors based on the spatial setup of the testing environment.
Buildings 15 01776 g009
Figure 10. Viewshed-based spatial metrics. Source: Computed and visualized by the authors using DepthmapX (UCL), based on the isovist algorithm.
Buildings 15 01776 g010
Figure 11. Correlation Matrix of Isovist and Visibility Metrics. Source: Computed and visualized by the authors using DepthmapX and Seaborn v0.13.0 in Python 3.11 (Python Software Foundation, Wilmington, DE, USA).
Buildings 15 01776 g011
Figure 12. Heat map of cumulative gaze distribution across the full exhibition space. Source: Generated and visualized by the authors using Tobii Pro Lab. Red indicates higher fixation frequency; green indicates lower fixation frequency.
Buildings 15 01776 g012
Figure 13. Heat map of cumulative gaze distribution across the local exhibition space. Source: Generated and visualized by the authors using Tobii Pro Lab. Red indicates higher fixation frequency; green indicates lower fixation frequency.
Buildings 15 01776 g013
Figure 14. Eye-tracking boxplots of visual metrics across the full exhibition space AOIs. Source: Data collected using Tobii Pro Lab and visualized by the authors in Python.
Buildings 15 01776 g014
Figure 15. Eye-tracking boxplots of visual metrics across the local exhibition space AOIs. Source: Data collected using Tobii Pro Lab and visualized by the authors in Python.
Buildings 15 01776 g015
Figure 16. Trends in heart rate variability (HRV) across spatial zones under different spatial configuration conditions. Source: Created by the authors based on experimental data collected in this study.
Buildings 15 01776 g016
Figure 17. Correlation: HRV vs. Eye-tracking Behavioral Metrics. Source: Generated by the authors based on experimental eye-tracking and HRV data analysis using Python.
Buildings 15 01776 g017
Figure 18. SEM Path Diagram: Spatial Integration → HRV → Visual Behavior. Source: Created by the authors based on structural equation modeling results.
Buildings 15 01776 g018
Table 1. Hypothesis table.
Hypothesis IDPathwayAnalytical Focus
H1Spatial Integration → Number of FixationsTo examine the relationship between spatial integration and fixation count
H2Spatial Occlusivity → Scanpath ComplexityTo assess the association between spatial occlusivity and the complexity of scanpaths
H3HRV Variability → Number of FixationsTo investigate the correlation between fixation count and HRV fluctuation
H4HRV Variability → Scanpath ComplexityTo evaluate the relationship between scanpath complexity and HRV fluctuation
H5Spatial Structure → HRV (Mediation Analysis) → Visual BehaviorTo examine whether emotional responses (indexed by HRV) mediate the relationship between spatial structure and visual behavior, indicating a possible pathway of influence.
Table 2. 10 indicators of spatial characteristics.
Isovist MetricComputationSpatial Property
Area (Ar)Area of the isovistExtent of the visible region
Perimeter (Pe)Length of the isovist boundarySize of the isovist
Mean Radius (Me)Average radial lengthReachability within the view
Standard Deviation (Sd)Standard deviation of radial lengthAxial length variation
Circularity (Ci) C i r c u l a r i t y = ( π | r | 2 A r e a )
r: Mean radius area: isovist area
Shape roundness
Compactness (Co) C o = π A r e a \Pe
Pe: Perimeter of view
Area: isovist area
Radial compactness
Occlusivity (Oc)Total length of occluded segments on boundarySpatial mystery/enclosure
Convexity (Con)Shell area minus shape area divided by shell areaShape irregularity
Drift (Dr) D r i f t = ( d y c y ) 2 + ( d x c x ) 2
d x y : 2D coordinates of the centroid of the viewshed shape
c x y : 2D coordinates of observation points
Visual attraction/off-center
Jaggedness (Ja) J a = p e 2 | A r
Pe: Perimeter of view
Area: isovist area
Spatial complexity
Table 3. Full spatial eye movement data.
MetricTestH_ValueDfp_Value
Number of fixationsKruskal-Wallis596.6360112286.8861 × 10−108
Total duration of fixationsKruskal-Wallis532.4297099281.3796 × 10−94
Average duration of fixationsKruskal-Wallis55.93370197280.001310507
Number of saccades in AOIKruskal-Wallis493.4625307281.49284 × 10−86
Number of RegressionsKruskal-Wallis448.0487854283.11056 × 10−77
Scanpath ComplexityKruskal-Wallis466.02713286.45634 × 10−81
Table 4. Local space eye movement data.
MetricTestH_ValueDfp_Value
Number of fixationsKruskal-Wallis273.1767048202.33754 × 10−46
Total duration of fixationsKruskal-Wallis257.6753822203.22335 × 10−43
Average duration of fixationsKruskal-Wallis24.9449189200.203546498
Number of saccades in AOIKruskal-Wallis247.2590156204.07621 × 10−41
Number of RegressionsKruskal-Wallis139.0993728207.49903 × 10−20
Scanpath ComplexityKruskal-Wallis268.3435175202.23379 × 10−45
Table 5. Comparison between overall space and local space.
View TypeCountMeanSdMin25%50%75%Max
Number of fixationsFull View7924.592.5512.54.256.2517
Number of fixationsPartial View42610.547.02159.51431.5
Total duration of fixationsFull View7921124.86682.1167556.251040.751574.063899.5
Total duration of fixationsPartial View4262946.981971.97661392.412609.54119.758807
Average duration of fixationsFull View792241.2860.6867206.5237273.12545
Average duration of fixationsPartial View426290.84113.8566229.12274.753291333
Number of saccades in AOIFull View7921.731.6400.331.252.7510.25
Number of saccades in AOIPartial View4265.425.5301.0847.528
Number of VisitsFull View7922.511.1111.662.3338
Number of VisitsPartial View4263.681.812.53.5511
Duration of first fixationFull View792234.2277.3145181.625224277.75705.5
Duration of first fixationPartial View426244.82156.935155.1252212951675
Number of RegressionsFull View7921.511.1100.671.3327
Number of RegressionsPartial View4262.681.801.52.5410
Scanpath ComplexityFull View7920.130.050.020.080.120.160.34
Scanpath ComplexityPartial View4260.190.130.0040.090.160.260.62
Disclaimer/Publisher’s Note: The statements, opinions and data contained in all publications are solely those of the individual author(s) and contributor(s) and not of MDPI and/or the editor(s). MDPI and/or the editor(s) disclaim responsibility for any injury to people or property resulting from any ideas, methods, instructions or products referred to in the content.

