
Erosion Resistance of Iron Ore Tailings as Aggregate for Manufacturing of Cement-Based Materials


Abstract
1. Introduction
2. Materials and Test Methods
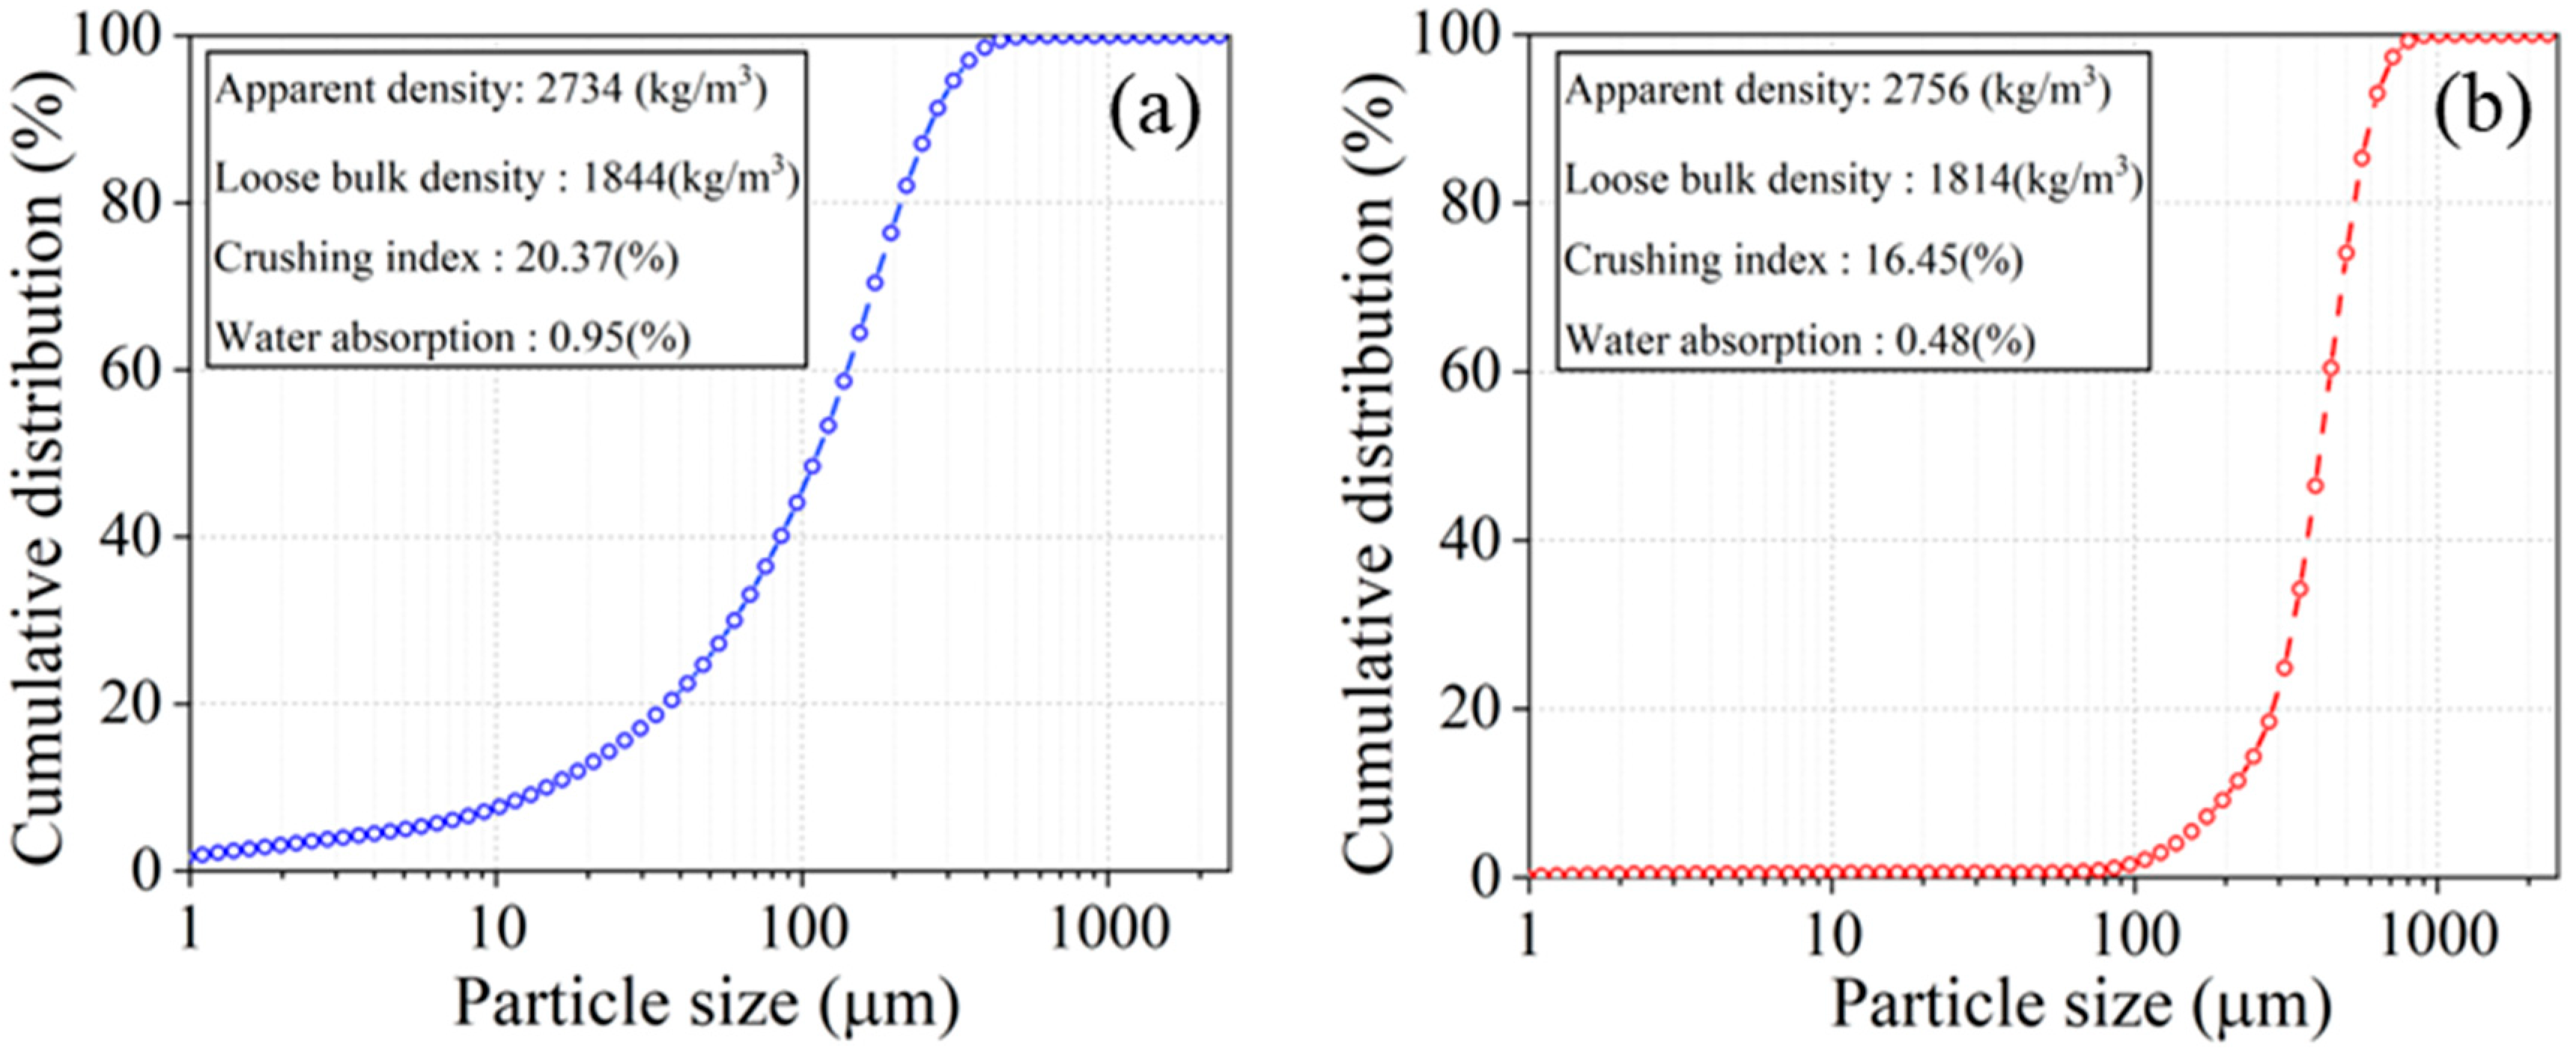
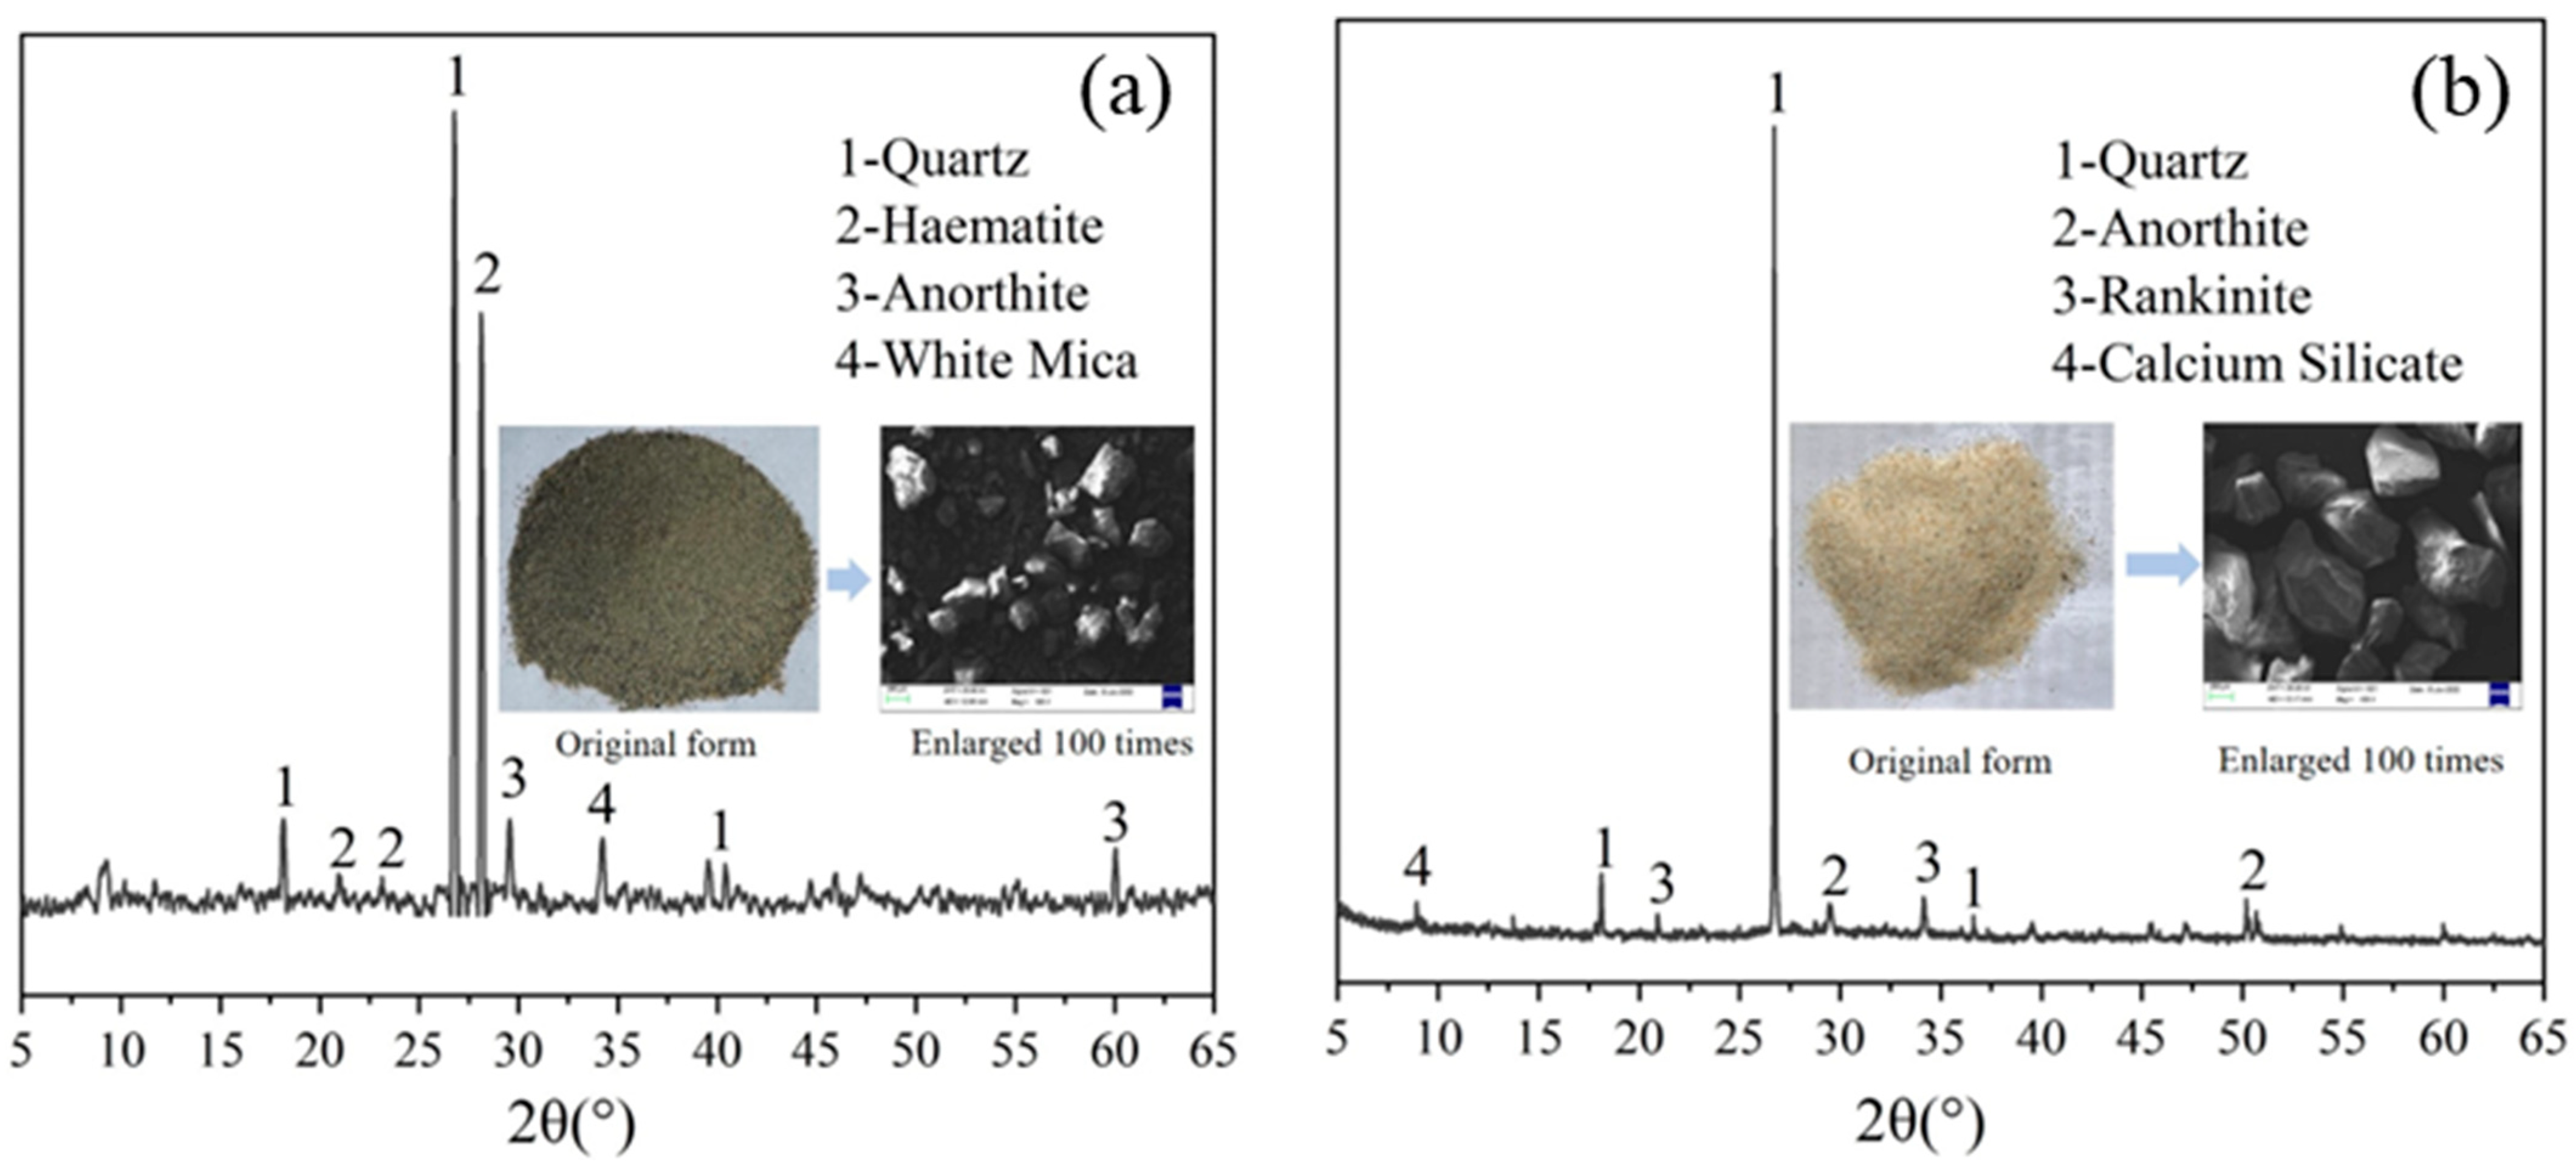
2.1. Raw Materials and Specimen Preparation
2.2. Test Methods
2.2.1. Test for Chloride Resistance of Specimens Under Salt Spray Environment
2.2.2. Test for Chloride Ion Content in Specimens Under Salt Spray Environment
2.2.3. Test for Pore Structure of Specimens Under Salt Spray Environment
2.2.4. Test for Microstructure of Specimens Under Salt Spray Environment
3. Results and Discussion
3.1. Chloride Resistance
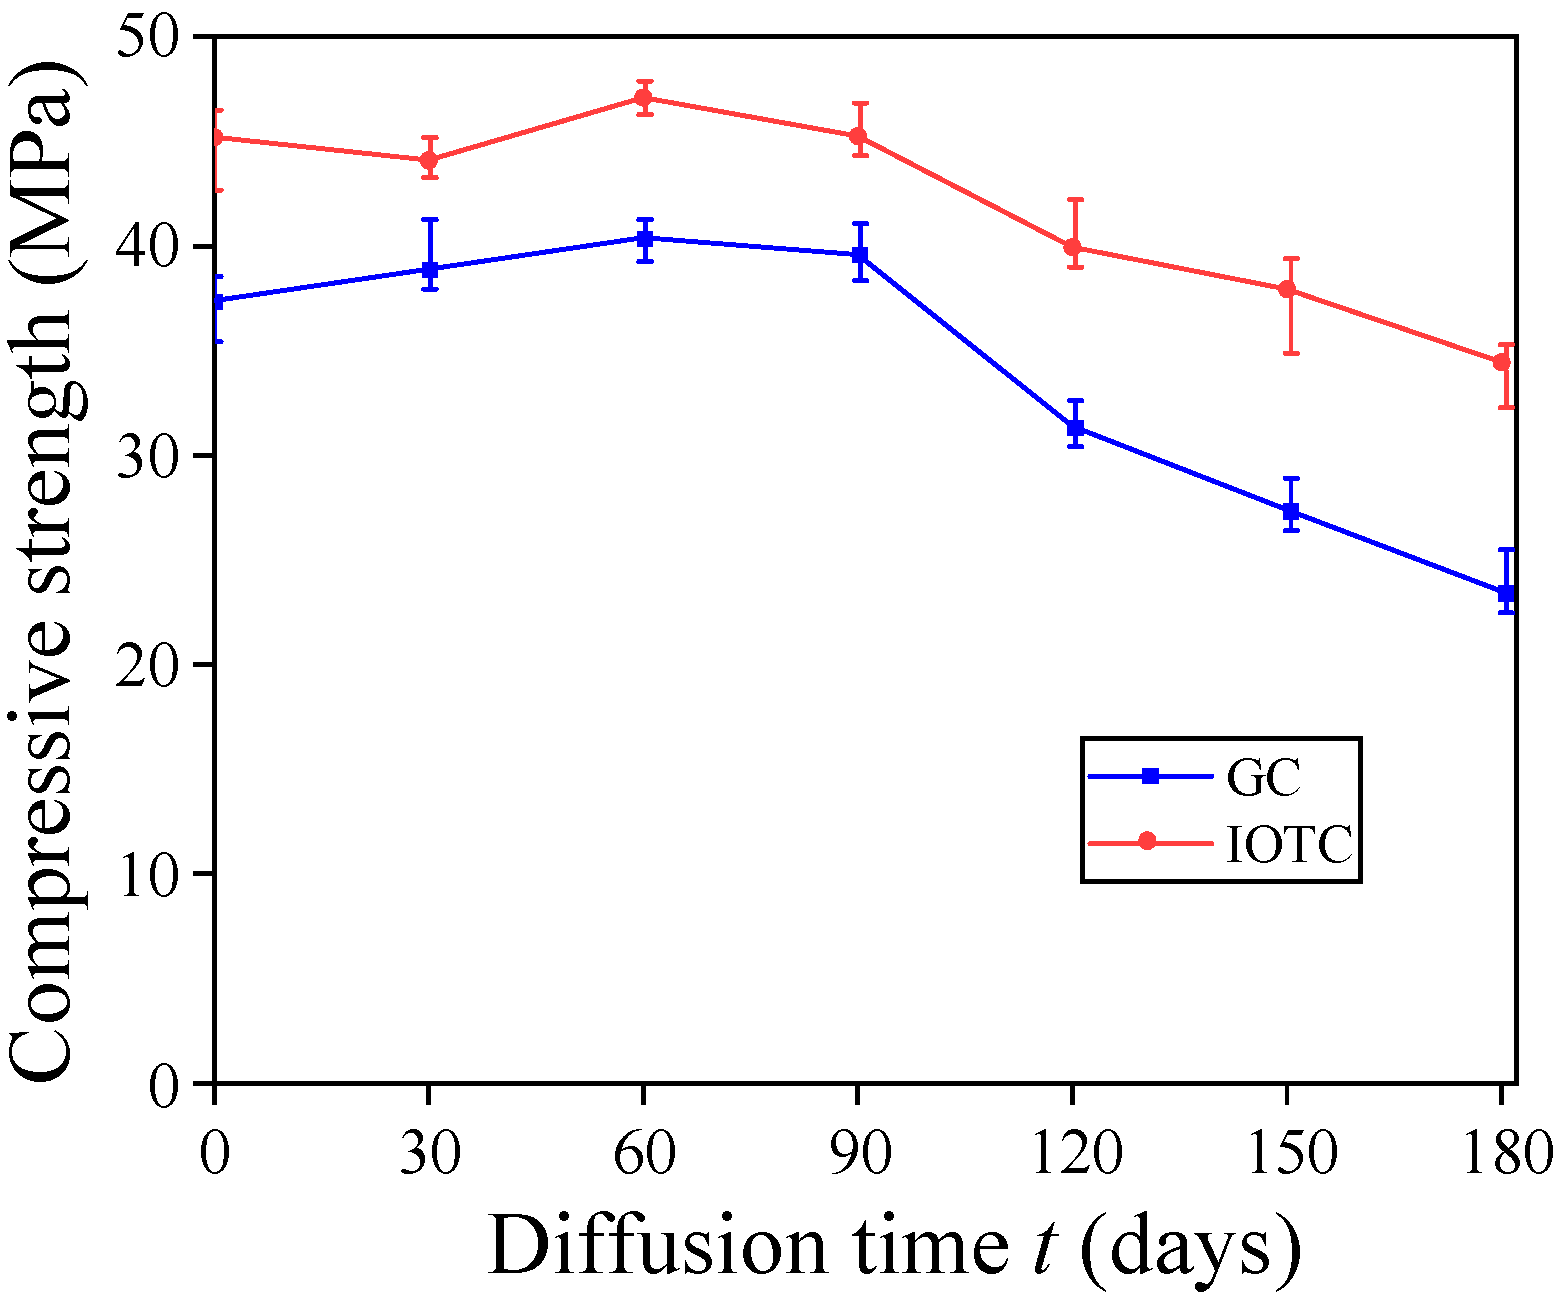
3.1.1. Compressive Strength
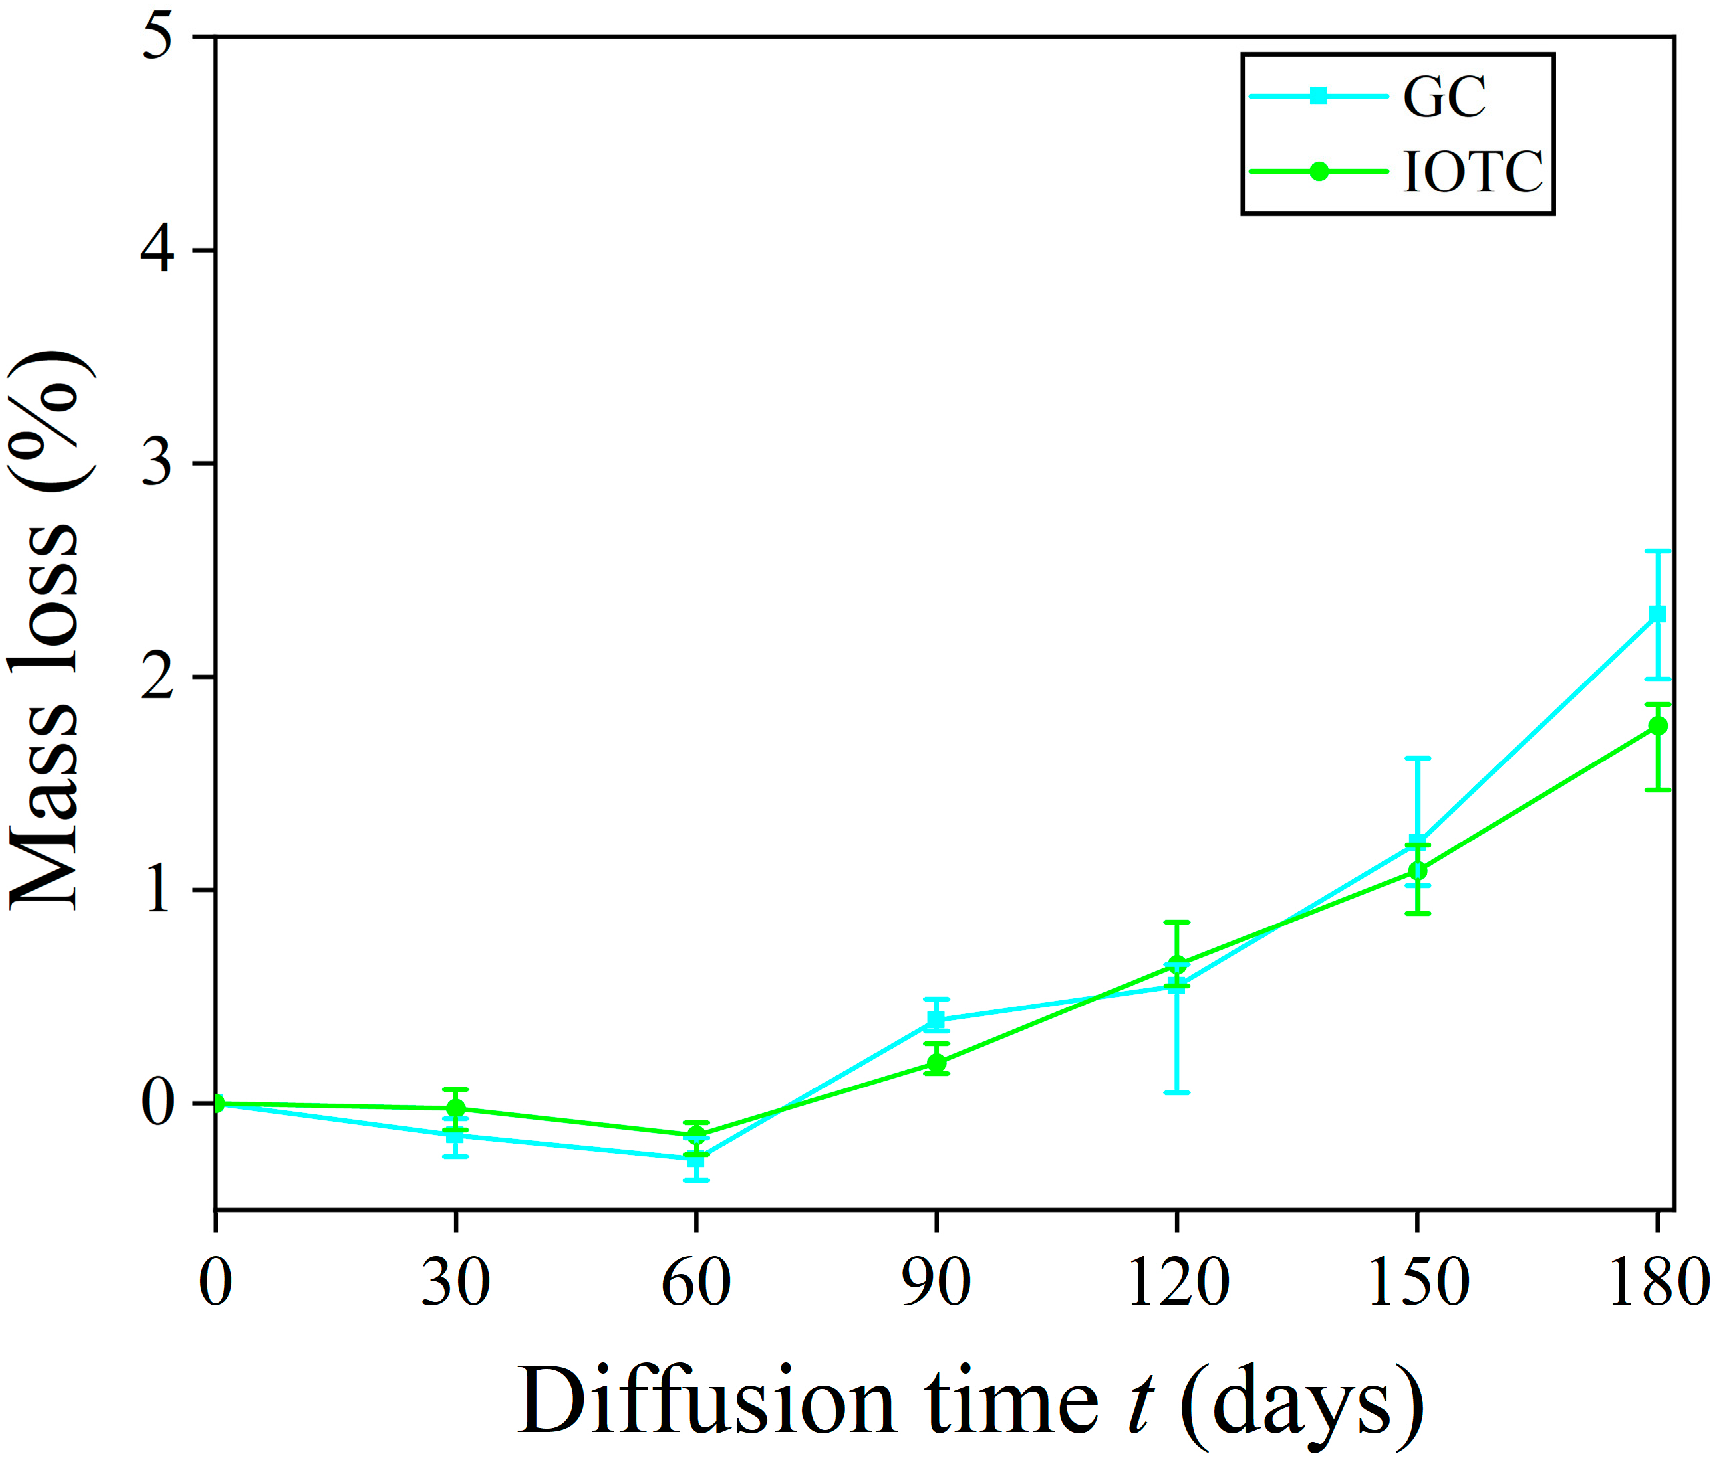
3.1.2. Mass Loss
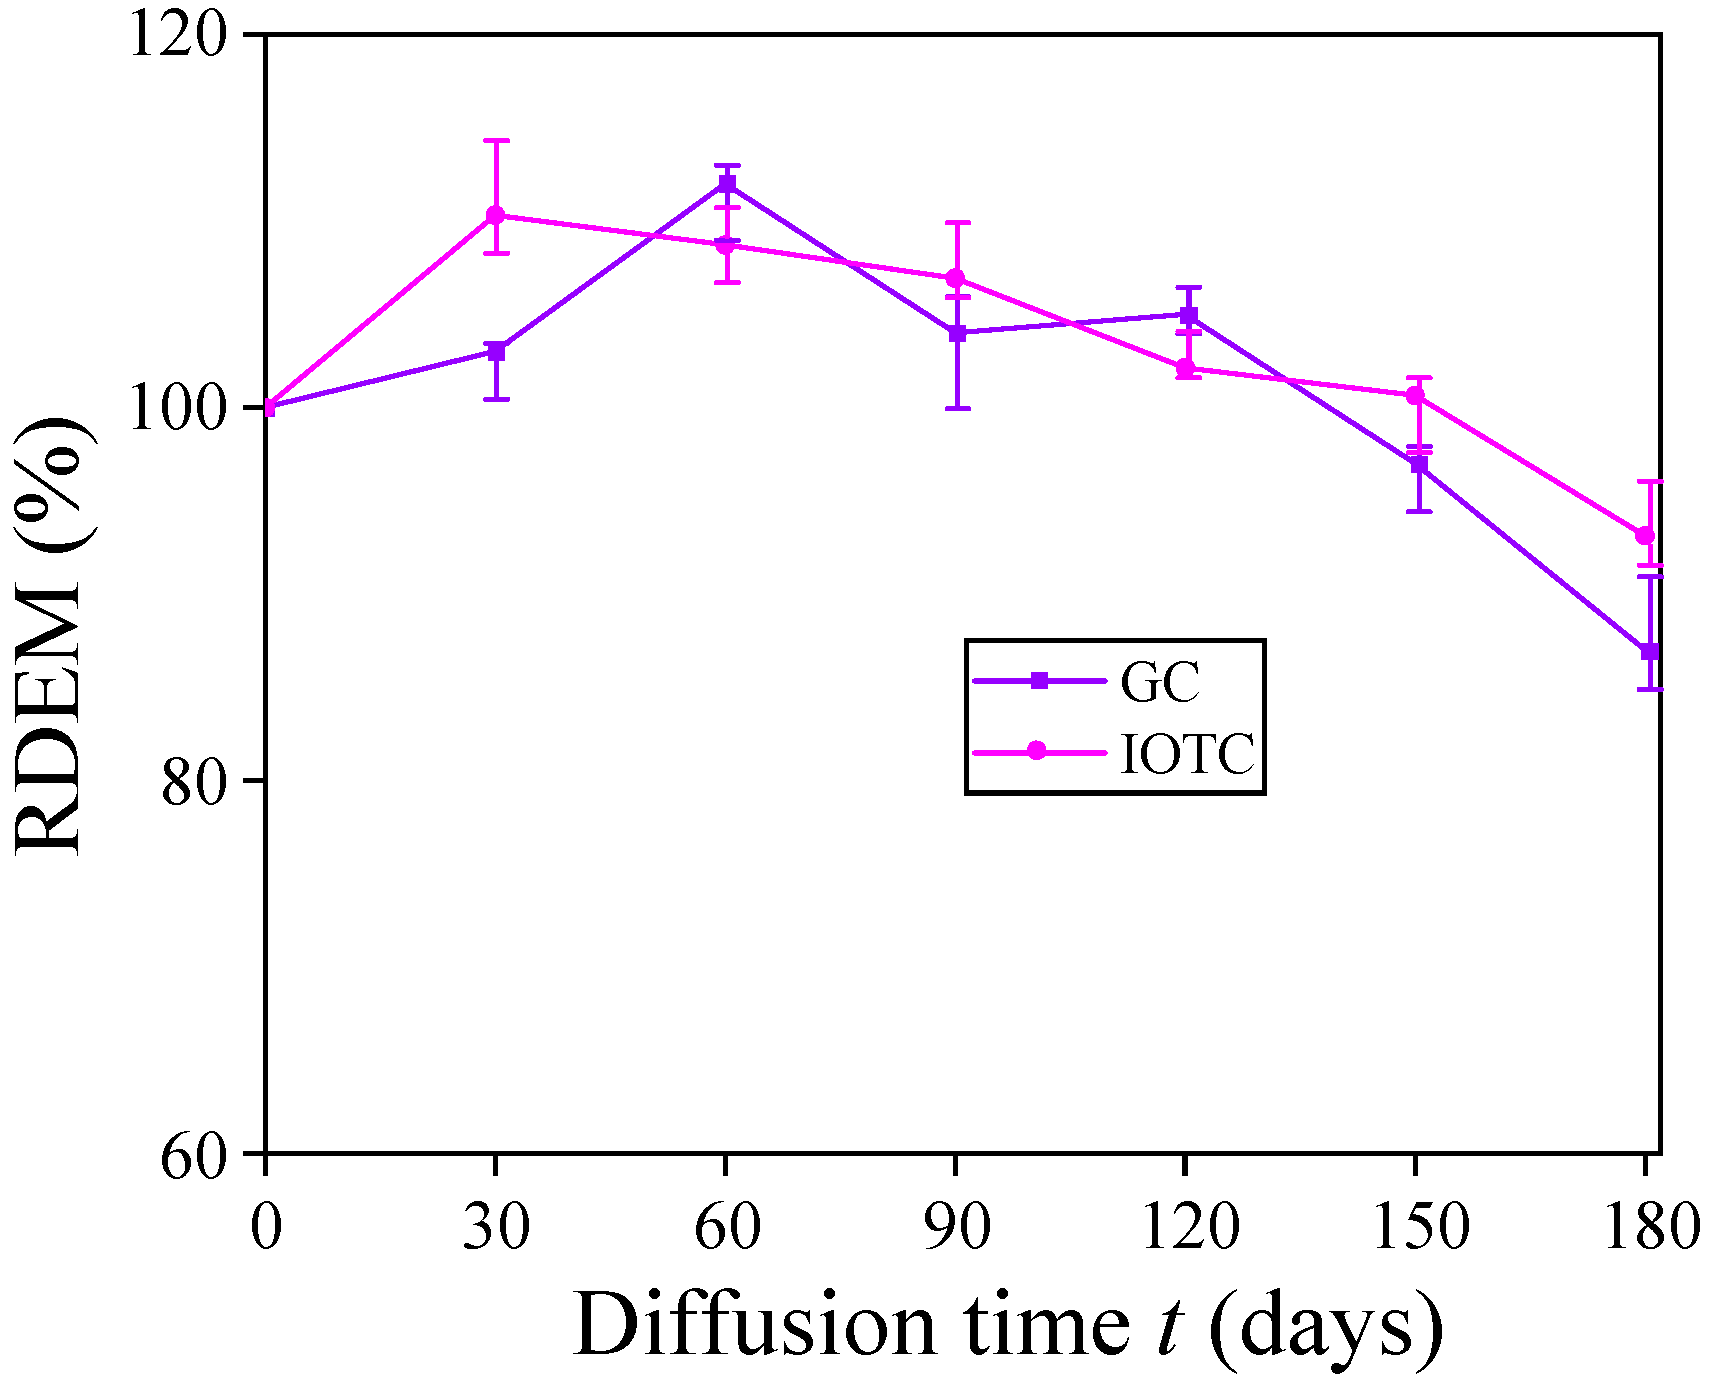
3.1.3. RDEM
3.2. Chloride Ion Diffusion Behavior
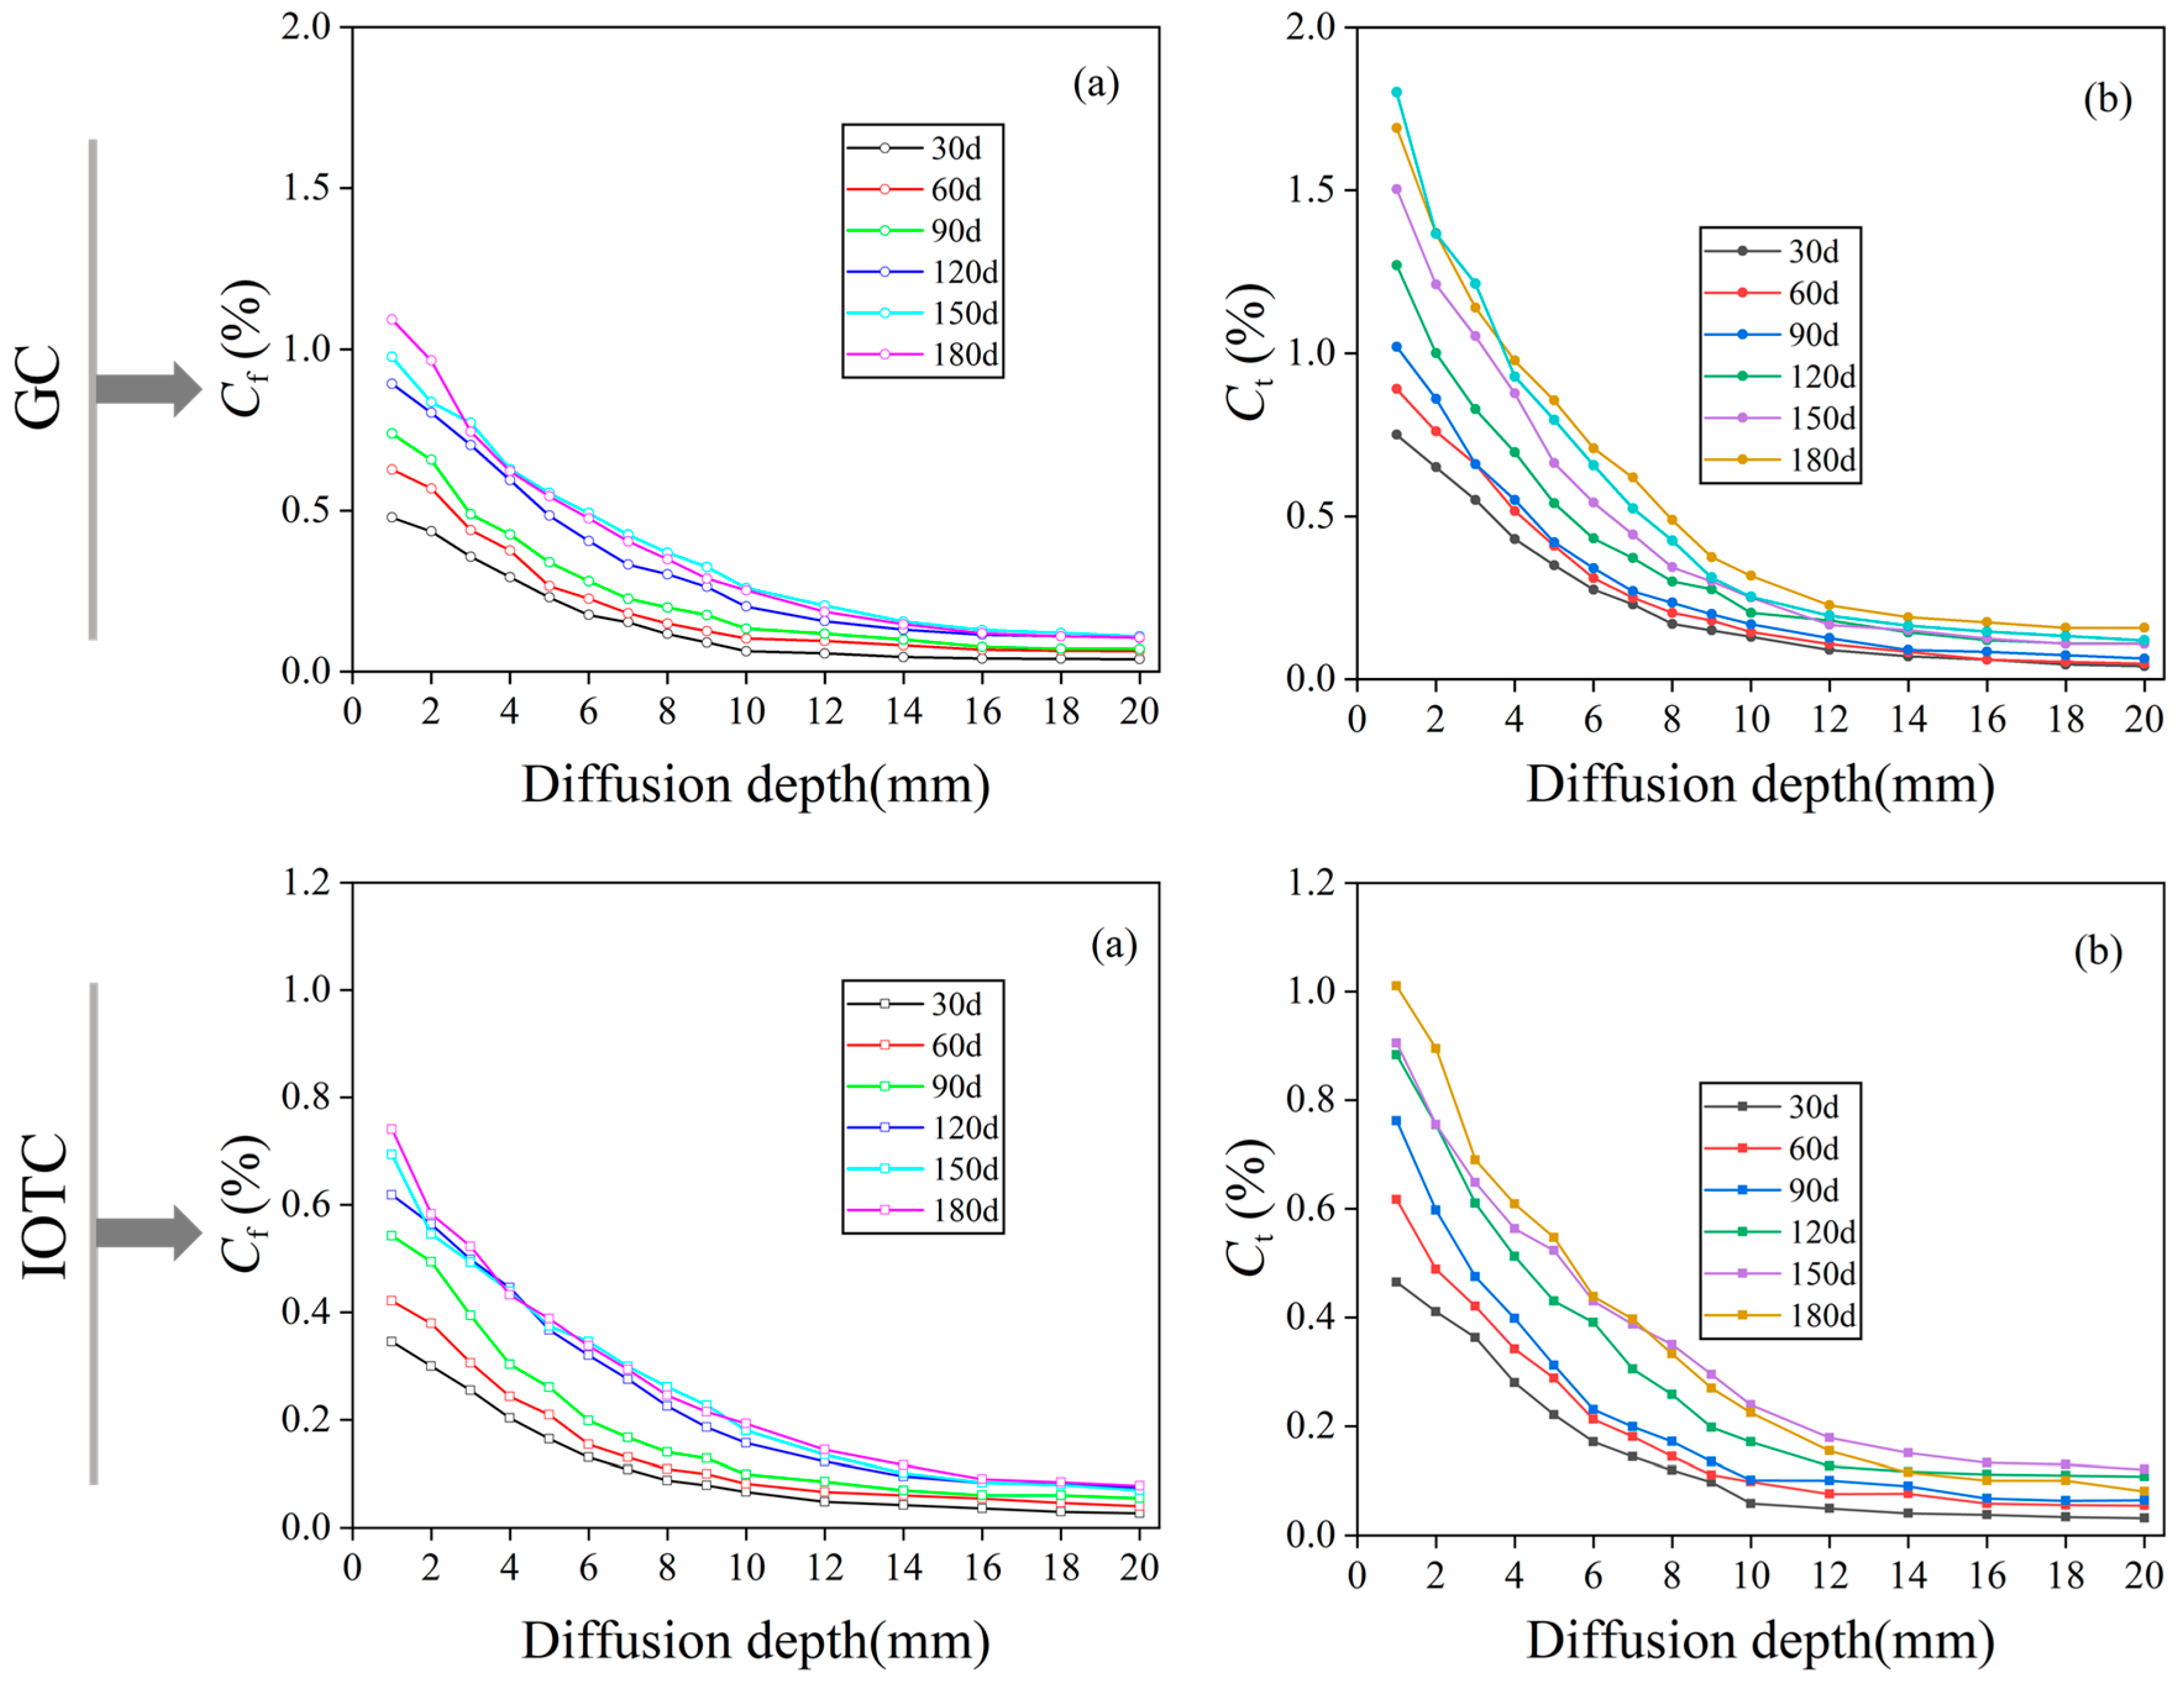
3.2.1. Free Chloride Ions and Total Chloride Ions
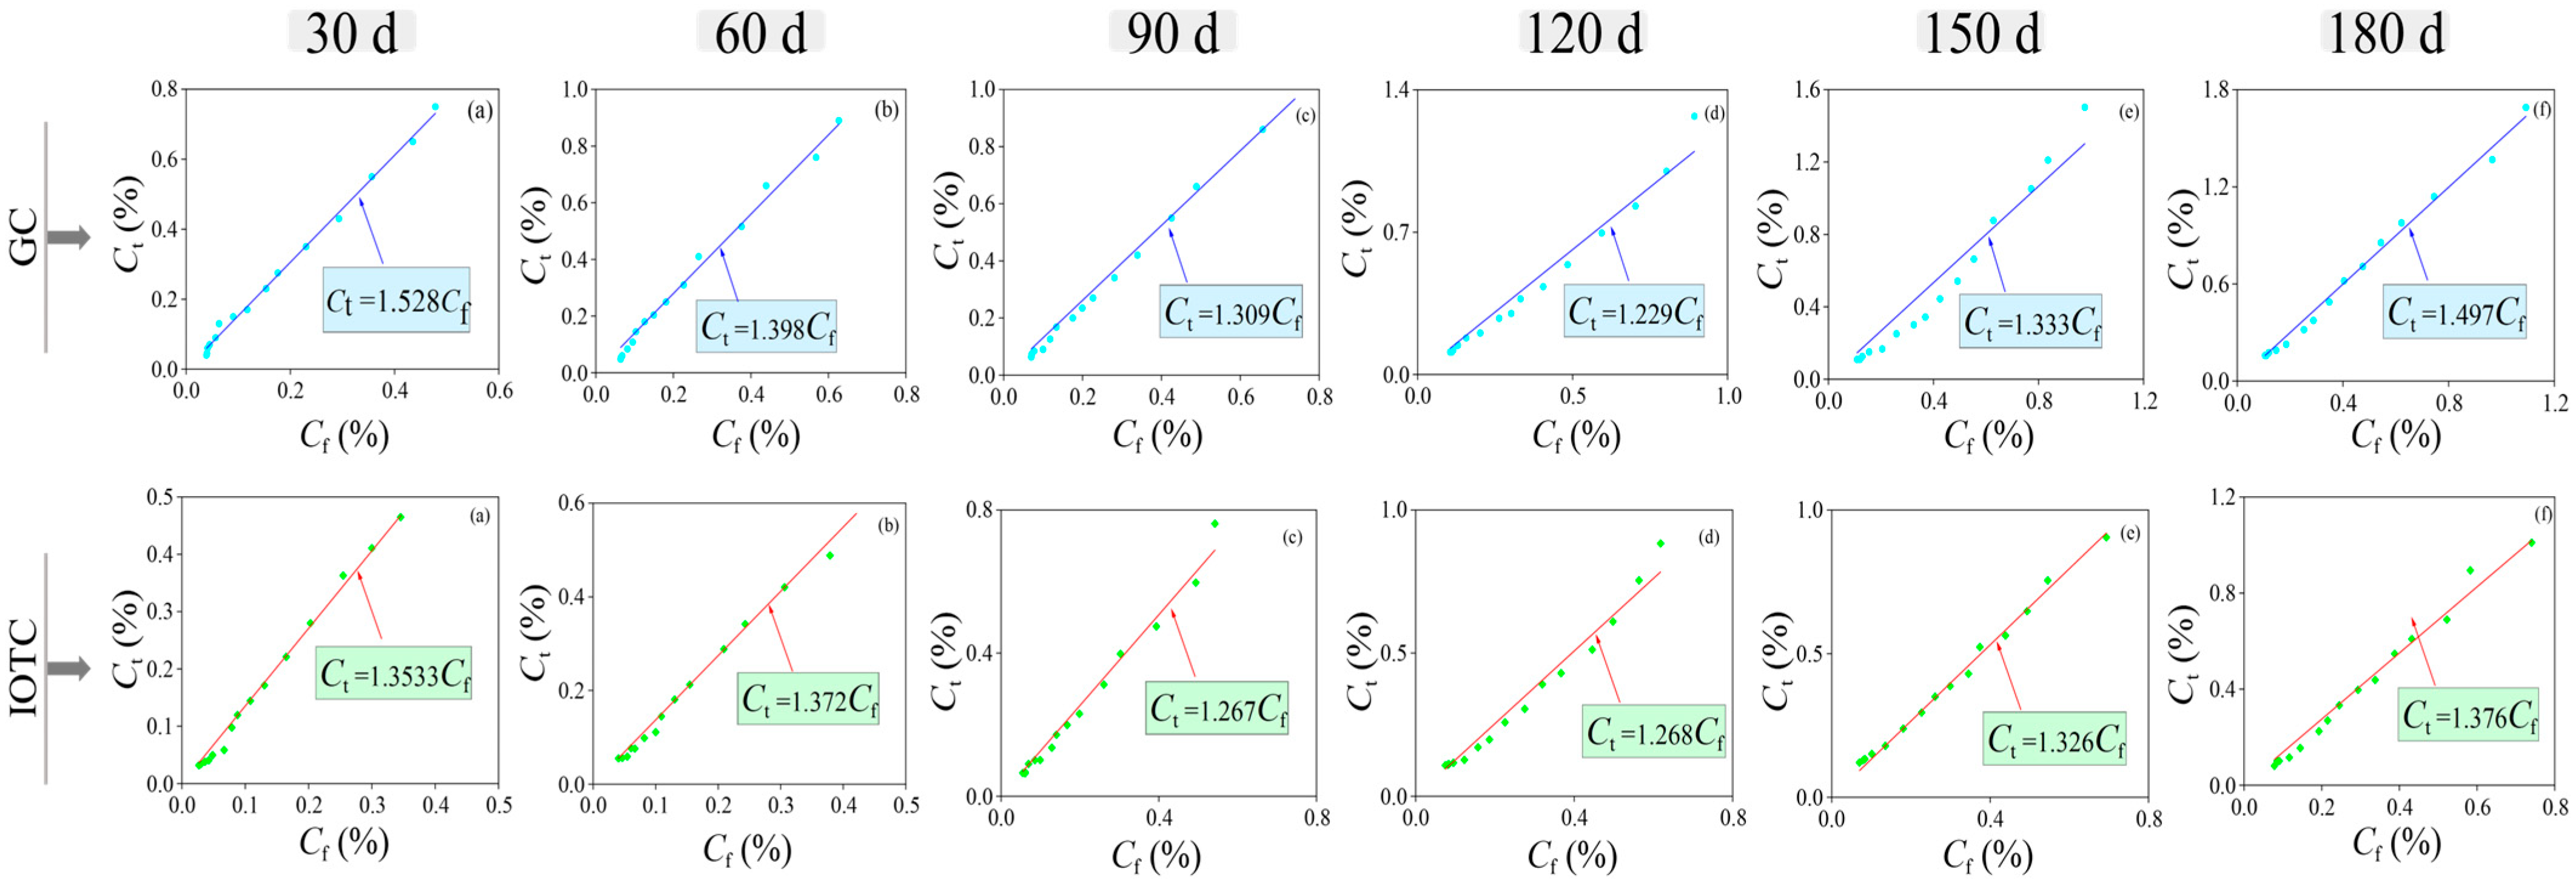
3.2.2. Bound Chloride Ions
3.2.3. Chloride Diffusion Coefficient
3.3. Pore Characteristics
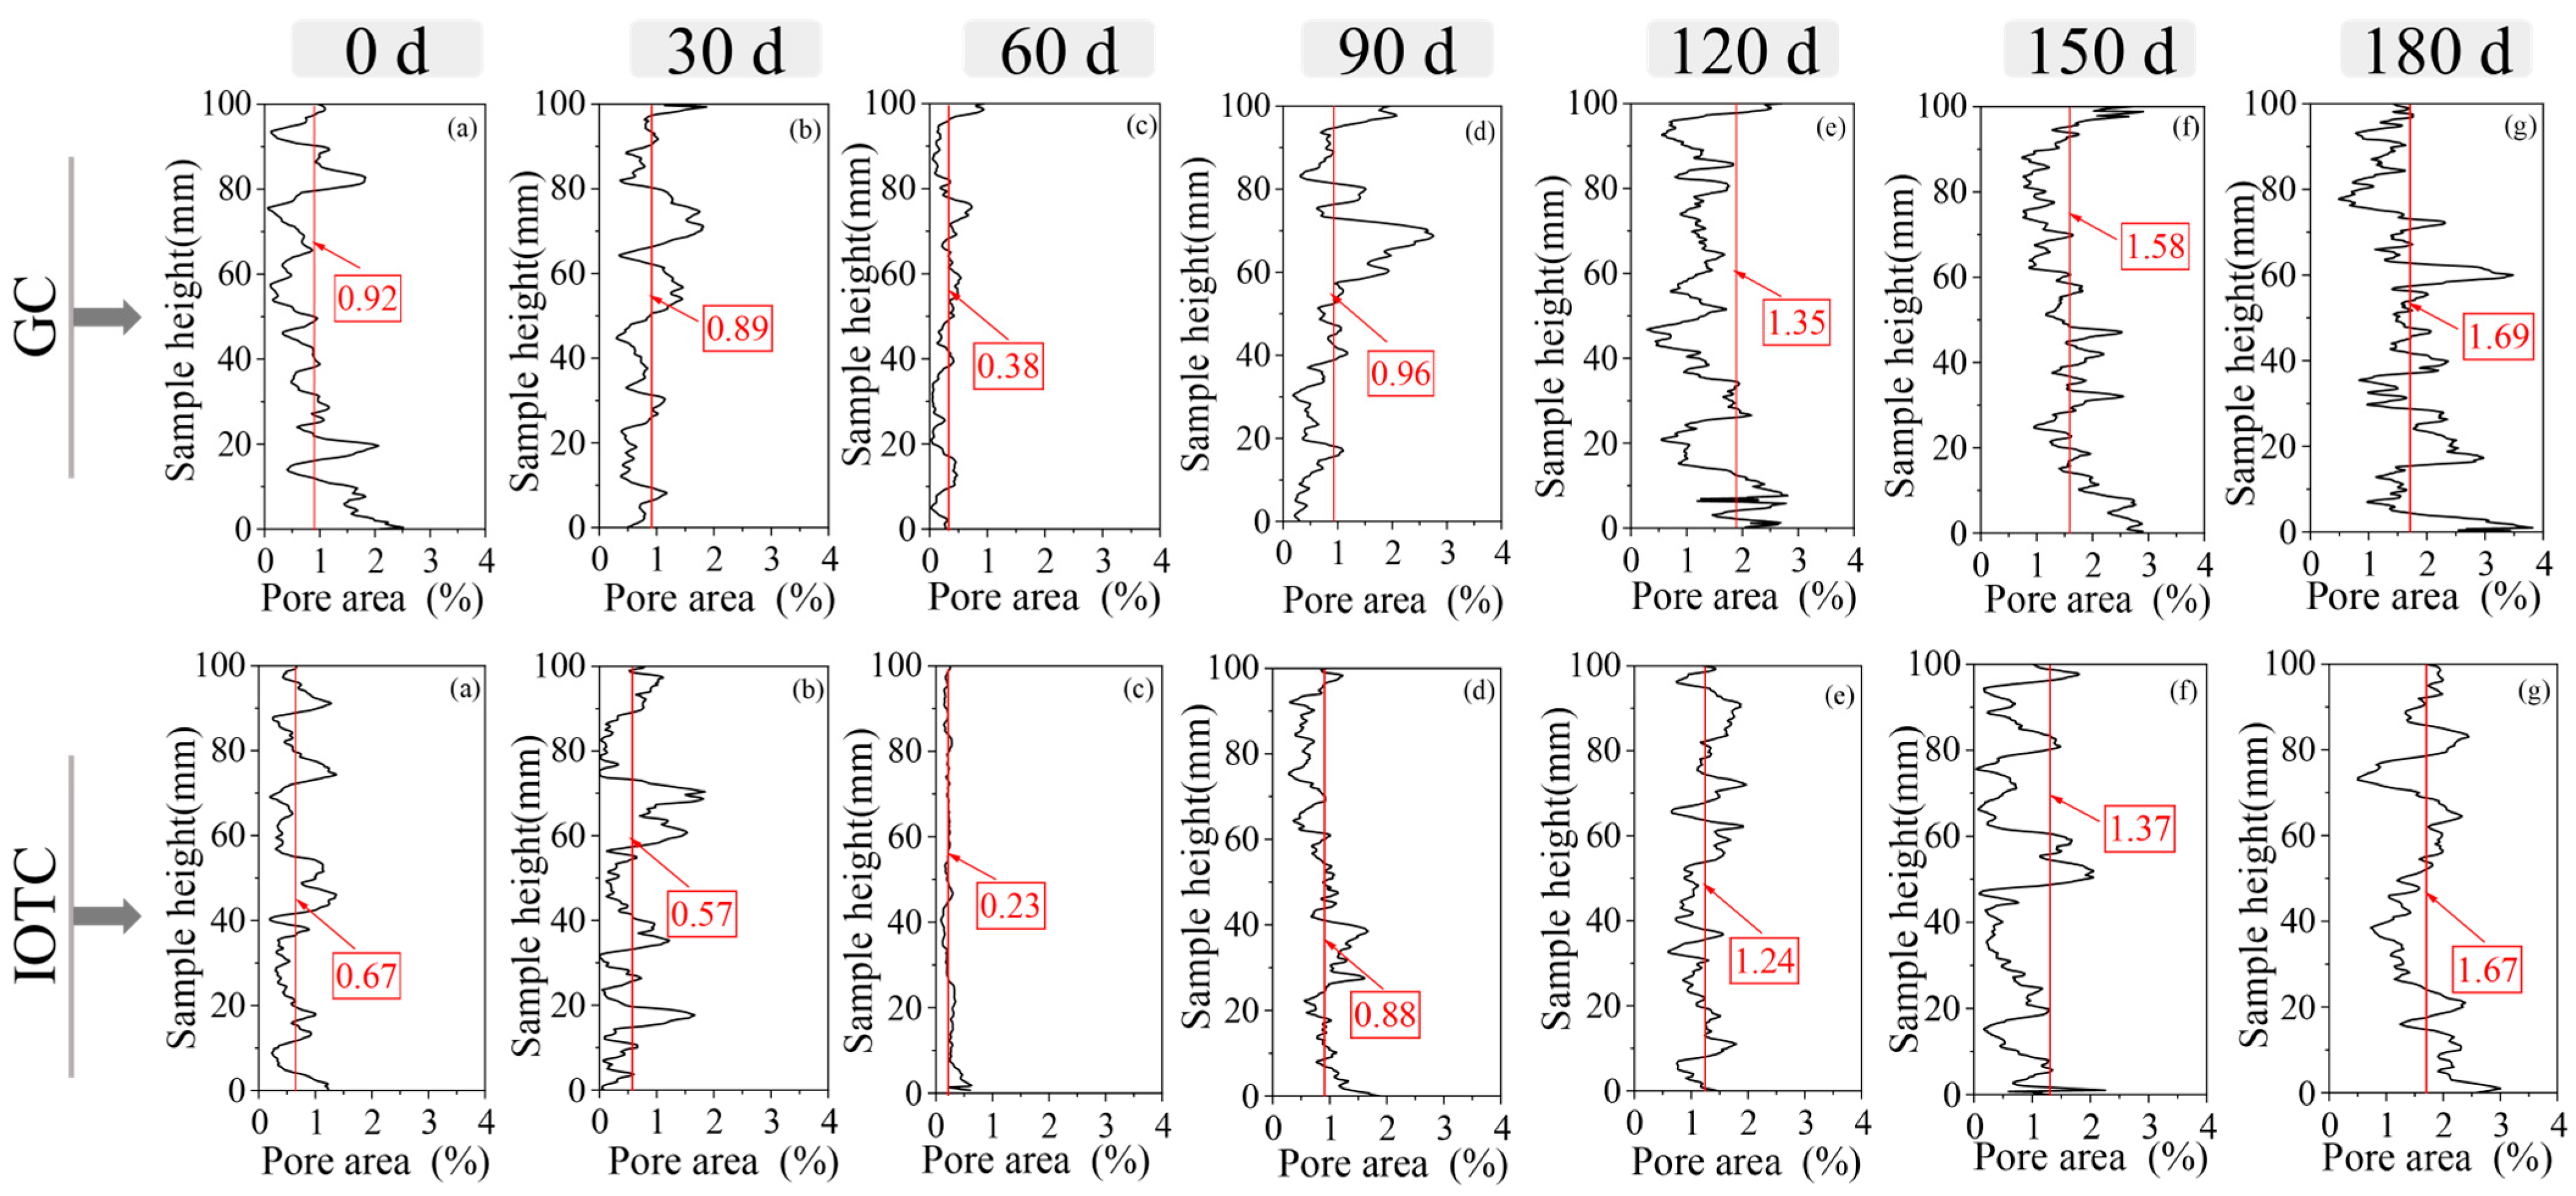
3.3.1. Porosity
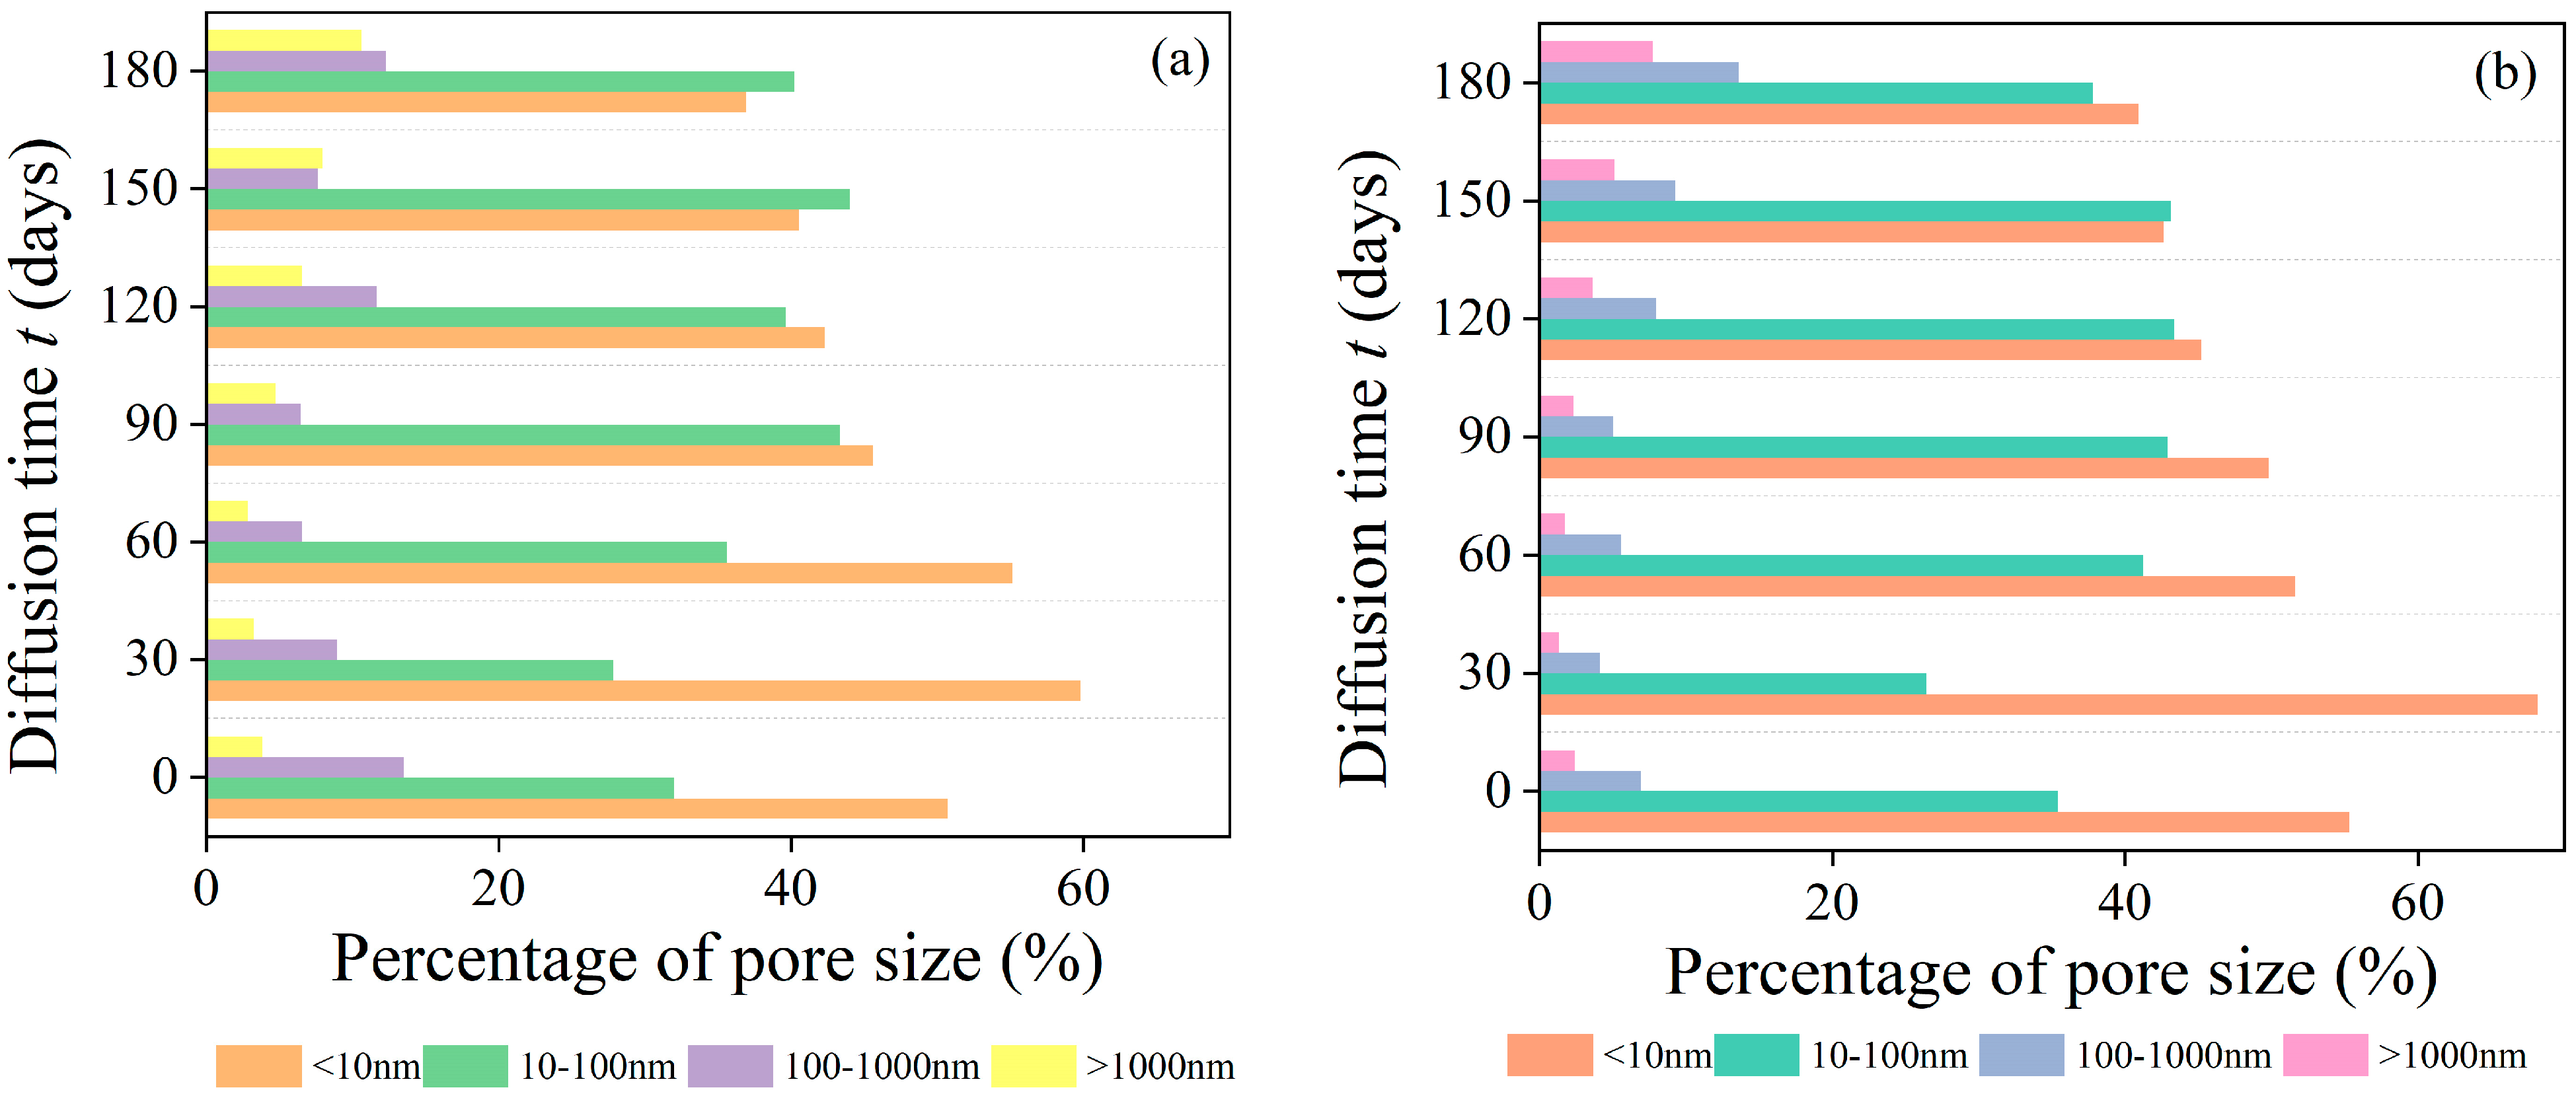
3.3.2. Size of Pores
3.4. Microstructure
4. Conclusions
Author Contributions
Funding
Data Availability Statement
Conflicts of Interest
References
- Carmignano, O.; Vieira, S.; Teixeira, A.P.; Lameiras, F.; Brandão, P.R.; Lago, R. Iron Ore Tailings: Characterization and Applications. J. Braz. Chem. Soc. 2021, 32, 1895–1911. [Google Scholar] [CrossRef]
- Davila, R.B.; Fontes, M.P.F.; Pacheco, A.A.; Ferreira, M.d.S. Heavy metals in iron ore tailings and floodplain soils affected by the Samarco dam collapse in Brazil. Sci. Total Environ. 2020, 709, 136151. [Google Scholar] [CrossRef] [PubMed]
- Wang, C.; Jing, J.; Qi, Y.; Zhou, Y.; Zhang, K.; Zheng, Y.; Zhai, Y.; Liu, F. Basic characteristics and environmental impact of iron ore tailings. Front. Earth Sci. 2023, 11, 1984. [Google Scholar] [CrossRef]
- Mercader-Moyano, P.; Camporeale, P.E.; López-López, J. A construction and demolition waste management model applied to social housing to trigger post-pandemic economic recovery in Mexico. Waste Manag. Res. J. Sustain. Circ. Econ. 2022, 40, 1027–1038. [Google Scholar] [CrossRef]
- Amjad, H.; Abd-Elaal, E.-S.; Ma, X.; Benn, T.; Fisher, M. A critical review of iron ore tailings as cement and aggregate substitutes for robust infrastructure: Mechanical, durability, eco-economic, and social impacts. J. Clean. Prod. 2025, 492, 4853. [Google Scholar] [CrossRef]
- Adiguzel, D.; Tuylu, S.; Eker, H. Utilization of tailings in concrete products: A review. Constr. Build. Mater. 2022, 360, 9574. [Google Scholar] [CrossRef]
- da Silva, A.P.V.; Silva, A.O.; de Lima, F.R.D.; Benedet, L.; Franco, A.d.J.; de Souza, J.K.; Júnior, A.C.R.; Batista, É.R.; Inda, A.V.; Curi, N.; et al. Potentially toxic elements in iron mine tailings: Effects of reducing soil pH on available concentrations of toxic elements. Environ. Res. 2022, 215, 114321. [Google Scholar] [CrossRef] [PubMed]
- Chen, B.; Li, B.; Pang, L.; Liu, B. Study on the synergistic preparation of supplementary cementitious materials from multiple solid wastes: Bayer red mud and gold tailings. J. Environ. Chem. Eng. 2024, 12, 2599. [Google Scholar] [CrossRef]
- Jing, C.; Wang, N.; Shi, W.; Meng, X.; Guo, C. Experimental study on iron ore tailings sand and municipal solid waste incineration fly ash used in semi-rigid base of asphalt pavement. Constr. Build. Mater. 2023, 393, 1981. [Google Scholar] [CrossRef]
- Liu, K.; Wang, S.; Quan, X.; Wu, J.; Xu, J.; Zhao, N.; Liu, B. Development of Engineered Cementitious Composites (ECCs) Incorporating Iron Ore Tailings as Eco-Friendly Aggregates. Buildings 2023, 13, 1341. [Google Scholar] [CrossRef]
- Zhang, Y.; Li, Z.; Gu, X.; Nehdi, M.L.; Marani, A.; Zhang, L. Utilization of iron ore tailings with high volume in green concrete. J. Build. Eng. 2023, 72, 6585. [Google Scholar] [CrossRef]
- Zhao, J.; Ni, K.; Su, Y.; Shi, Y. An evaluation of iron ore tailings characteristics and iron ore tailings concrete properties. Constr. Build. Mater. 2021, 286, 122968. [Google Scholar] [CrossRef]
- Lv, Z.; Jiang, A.; Liang, B. Development of eco-efficiency concrete containing diatomite and iron ore tailings: Mechanical properties and strength prediction using deep learning. Constr. Build. Mater. 2022, 327, 6930. [Google Scholar] [CrossRef]
- Zhao, S.; Fan, J.; Sun, W. Utilization of iron ore tailings as fine aggregate in ultra-high performance concrete. Constr. Build. Mater. 2014, 50, 540–548. [Google Scholar] [CrossRef]
- Zhang, W.; Gu, X.; Qiu, J.; Liu, J.; Zhao, Y.; Li, X. Effects of iron ore tailings on the compressive strength and permeability of ultra-high performance concrete. Constr. Build. Mater. 2020, 260, 9917. [Google Scholar] [CrossRef]
- Shi, J.; Pan, W.; Kang, J.; Yu, Z.; Sun, G.; Li, J.; Zheng, K.; Shen, J. Properties of Ultra-High Performance Concrete incorporating iron tailings powder and iron tailings sand. J. Build. Eng. 2024, 83, 8442. [Google Scholar] [CrossRef]
- Shettima, A.U.; Hussin, M.W.; Ahmad, Y.; Mirza, J. Evaluation of iron ore tailings as replacement for fine aggregate in concrete. Constr. Build. Mater. 2016, 120, 72–79. [Google Scholar] [CrossRef]
- Protasio, F.N.M.; De Avillez, R.R.; Letichevsky, S.; Silva, F.D.A. The use of iron ore tailings obtained from the Germano dam in the production of a sustainable concrete. J. Clean. Prod. 2021, 278, 123929. [Google Scholar] [CrossRef]
- Zhang, B. Durability of low-carbon geopolymer concrete: A critical review. Sustain. Mater. Technol. 2024, 40, e00882. [Google Scholar] [CrossRef]
- Elmesalami, N.; Celik, K. A critical review of engineered geopolymer composite: A low-carbon ultra-high-performance concrete. Constr. Build. Mater. 2022, 346, 8491. [Google Scholar] [CrossRef]
- Gupta, S.; Chaudhary, S. State of the art review on supplementary cementitious materials in India—II: Characteristics of SCMs, effect on concrete and environmental impact. J. Clean. Prod. 2022, 357, 131945. [Google Scholar] [CrossRef]
- Kwon, S.-J.; Lee, H.-S.; Karthick, S.; Saraswathy, V.; Yang, H.-M. Long-term corrosion performance of blended cement concrete in the marine environment—A real-time study. Constr. Build. Mater. 2017, 154, 349–360. [Google Scholar] [CrossRef]
- Paul, S.C.; van Zijl, G.P. Crack Formation and Chloride Induced Corrosion in Reinforced Strain Hardening Ce-ment-Based Composite (R/SHCC). J. Adv. Concr. Technol. 2014, 12, 340–351. [Google Scholar] [CrossRef]
- Ali, M.; Shams, M.A.; Bheel, N.; Almaliki, A.H.; Mahmoud, A.S.; Dodo, Y.A.; Benjeddou, O. A review on chloride induced corrosion in reinforced concrete structures: Lab and in situ investigation. RSC Adv. 2024, 14, 37252–37271. [Google Scholar] [CrossRef] [PubMed]
- Ez-Zaki, H.; Diouri, A. Chloride penetration through cement material based on dredged sediment and shell powder. J. Adhes. Sci. Technol. 2017, 32, 787–800. [Google Scholar] [CrossRef]
- Angst, U.; Elsener, B.; Larsen, C.K.; Vennesland, Ø. Critical chloride content in reinforced concrete—A review. Cem. Concr. Res. 2009, 39, 1122–1138. [Google Scholar] [CrossRef]
- GB/T14684-2011; Sand for Construction. Standardization Administration of China: Beijing, China, 2012.
- Liu, K.; Wang, S.; Quan, X.; Jing, W.; Xu, J.; Zhao, N.; Ying, H. Industrial byproduct Iron ore tailings as ecofriendly materials in the utili-zation of cementitious composites. Constr. Build. Mater. 2023, 372, 130813. [Google Scholar] [CrossRef]
- GB/T50082-2019; Standard for Test Methods of Long-Term Performance and Durability of Ordinary Concrete. Ministry of Construction of the People’s Republic of China: Beijing, China, 2019.
- ASTM B117-18; Standard Practice for Operating Salt Spray (Fog) Apparatus. ASTM International: West Conshohocken, PA, USA, 2018.
- GB/T 10125-2012; Artificial Atmosphere Corrosion Tests—Salt Spray Tests. General Administration of Quality Supervision, Inspection and Quarantine of the People’s Republic of China, Standardization Administration of China: Beijing, China, 2012.
- JGJ/T 322-2013; Technical Specification for Detection of Chloride Ion Content in Concrete. China Architecture & Building Press: Beijing, China, 2013.
- ASTM C1152/C1152M-20; Standard Test Method for Acid-Soluble Chloride in Mortar and Concrete. ASTM International: West Conshohocken, PA, USA, 2020.
- ASTM C1218/C1218M-17; Standard Test Method for Water-Soluble Chloride in Mortar and Concrete. ASTM International: West Conshohocken, PA, USA, 2017.
- Li, X.; Xu, F.; Chen, B.; Li, B.; Chen, Z.; Zhu, J.; Peng, C.; Lin, J. Investigation on the chloride ion erosion mechanism of cement mortar in coastal areas: From experiments to molecular dynamics simulation. Constr. Build. Mater. 2022, 350, 8810. [Google Scholar] [CrossRef]
- Liu, J.; Qiu, Q.; Chen, X.; Wang, X.; Xing, F.; Han, N.; He, Y. Degradation of fly ash concrete under the coupled effect of carbonation and chloride aerosol ingress. Corros. Sci. 2016, 112, 364–372. [Google Scholar] [CrossRef]
- Liu, J.; Qiu, Q.; Chen, X.; Xing, F.; Han, N.; He, Y.; Ma, Y. Understanding the interacted mechanism between carbonation and chloride aerosol attack in ordinary Portland cement concrete. Cem. Concr. Res. 2017, 95, 217–225. [Google Scholar] [CrossRef]
- Martinez-Echevarria, M.; Lopez-Alonso, M.; Garach, L.; Alegre, J.; Poon, C.; Agrela, F.; Cabrera, M. Crushing treatment on recycled aggregates to improve their mechanical behaviour for use in unbound road layers. Constr. Build. Mater. 2020, 263, 517. [Google Scholar] [CrossRef]
- Li, H.; Liu, F.; Zhen, H.; Xiong, Z.; Song, Y.; Wang, J.; Li, L. Evaluating strength, hydration characteristics, microstructure evolution, and sustainability of seawater-sea sand cement-based materials containing iron ore tailings. Constr. Build. Mater. 2024, 457, 139163. [Google Scholar] [CrossRef]
- Martın-Pérez, B.; Zibara, H.; Hooton, R.; Thomas, M. A study of the effect of chloride binding on service life predictions. Cem. Concr. Res. 2000, 30, 1215–1223. [Google Scholar] [CrossRef]


| OPC | FA | MK | S | IOT | |
|---|---|---|---|---|---|
| SiO2 | 20.5 | 52.9 | 22.13 | 98.21 | 70.26 |
| Al2O3 | 4.3 | 29.9 | 63.81 | 1.02 | 6.42 |
| CaO | 64.1 | 3.6 | 5.1 | 0.32 | 4.21 |
| MgO | / | 1.5 | 0.94 | 0.14 | 2.85 |
| Fe2O3 | 2.8 | 7.9 | 5.51 | 0.11 | 13.75 |
| TiO2 | 0.2 | / | / | / | / |
| SO3 | / | 0.6 | 2.15 | 0.02 | 0.24 |
| Others | 0.3 | 3.2 | 0.62 | 0.16 | 1.22 |
| No. | Fine Aggregate | Cementitious Materials | W | SP | Flow Diameter | 28 d fcu (MPa) | |||
|---|---|---|---|---|---|---|---|---|---|
| S | IOT | OPC | FA | MK | (mm) | ||||
| GC | 565.6 | 0 | 692 | 377.4 | 188.7 | 377 | 5.04 | 215 | 37.4 |
| IOTC | 424.2 | 141.4 | 692 | 377.4 | 188.7 | 377 | 5.69 | 185 | 45.2 |
Disclaimer/Publisher’s Note: The statements, opinions and data contained in all publications are solely those of the individual author(s) and contributor(s) and not of MDPI and/or the editor(s). MDPI and/or the editor(s) disclaim responsibility for any injury to people or property resulting from any ideas, methods, instructions or products referred to in the content. |
© 2025 by the authors. Licensee MDPI, Basel, Switzerland. This article is an open access article distributed under the terms and conditions of the Creative Commons Attribution (CC BY) license (https://creativecommons.org/licenses/by/4.0/).
Share and Cite
Liu, S.; Liu, K.; Wu, J.; Wang, S. Erosion Resistance of Iron Ore Tailings as Aggregate for Manufacturing of Cement-Based Materials. Buildings 2025, 15, 1741. https://doi.org/10.3390/buildings15101741
Liu S, Liu K, Wu J, Wang S. Erosion Resistance of Iron Ore Tailings as Aggregate for Manufacturing of Cement-Based Materials. Buildings. 2025; 15(10):1741. https://doi.org/10.3390/buildings15101741
Chicago/Turabian StyleLiu, Shuang, Kangning Liu, Jing Wu, and Sheliang Wang. 2025. "Erosion Resistance of Iron Ore Tailings as Aggregate for Manufacturing of Cement-Based Materials" Buildings 15, no. 10: 1741. https://doi.org/10.3390/buildings15101741
APA StyleLiu, S., Liu, K., Wu, J., & Wang, S. (2025). Erosion Resistance of Iron Ore Tailings as Aggregate for Manufacturing of Cement-Based Materials. Buildings, 15(10), 1741. https://doi.org/10.3390/buildings15101741