Abstract
With the development of the knowledge economy, the significance of the creative industry has become increasingly prominent. Individual creativity can be stimulated by optimal lighting. This research consists of two parts: Part I examines the effects of illuminance and color temperature on creativity through three experiments, while Part II employs a two-factor repeated-measures design to investigate their interaction effects. The participants completed creativity tests during light exposure, including TTCT tasks in Part I of the experiment, and AUT and RAT tasks in Part II. They also completed questionnaires to assess their mood, and HRV data were collected for physiological analysis. The results showed that the subjects performed worse on a creativity test at an extremely low illuminance of 150 lx. Within a comfortable neutral lighting range, the participants’ creativity at 300 lx was superior to that at 1500 lx. In exploring light color, the conventional correlated color temperature (CCT) variable was replaced with colored lighting. The results indicated that both blue and orange light enhanced creative performance compared to white light. Additionally, an interactive effect of illuminance and colored lighting was observed. Fluency on the Alternative Uses Task (AUT) test was greater under 5000 K and 300 lx lighting, while originality on the AUT test was enhanced under 1500 lx, colored lighting. Emotional experience was found to be significantly correlated with creative performance. These findings contribute to the development of a design guideline that utilizes lighting intensity, color, and other elements to foster a relaxing indoor atmosphere that enhances positive mood and creativity.
1. Introduction
In the context of the rise of the knowledge economy and intensified global competition, the creative industry is gradually becoming a pillar industry in many countries [1]. Creativity is the foundation of innovation, and the common definition of creativity proposed by many researchers is the ability to produce useful and novel ideas in all fields [2,3,4]. Determining how to enhance individuals’ creativity has long been a focal point in organizational behavior studies [5]. In the early 21st century, Dul and Ceylan emphasized the necessity of distinguishing between the social and physical work environments and confirmed that physical environmental stimuli such as office color, lighting, and noise control have significant impacts on creativity [6]. Further efforts have been made to explore the core environmental factors that enhance creativity [7,8]. McCoy categorized these factors into spatial organization, views, resources, environmental conditions, and architectural details [9]. Research has shown that visual details in the interior environment [10,11,12], positive sounds, and noise levels [13,14] all contribute to creativity. Sicotte et al. demonstrated that indoor air quality plays a significant role in creative stimulation, highlighting the importance of prioritizing air quality over superficial comfort [15]. Additionally, the quality and arrangement of furniture can also influence creativity [16,17]. Similarly, studies have found that offices characterized by high creative potential tend to have lower complexity and more plants compared to those with low creative potential [18,19]. Lee et al. revealed the connection between specific environmental elements and creative performance. In their study, 15 physical environmental attributes, including lighting, visual stimuli, and indoor plants, were found to significantly impact individual or organizational creativity, among which lighting was identified as one of the most important factors [20].
Multiple studies have confirmed that lighting environments significantly influence work performance [21,22,23,24]. Research on the non-visual effects of light indicates that light affects brain activity, impacting both physiology (e.g., hormone production, alertness, and wakefulness) and cognitive or creative abilities (e.g., working memory, attention, and problem-solving skills) [25]. Among the lighting parameters, illuminance is one of the most explored [26]. Some studies support that increasing lighting illuminance can enhance cognitive abilities, including working memory and attention [27,28]. However, other studies have reached contrary conclusions, suggesting that dim lighting supports the generation of new ideas. For instance, Steidle and Werth found that darkness enhances the sense of freedom from constraints, reducing inhibition and thereby fostering creative performance [29]. Chung et al. found no difference in creative performance under high-and low-illuminance conditions [30,31,32]. In the field of cognitive neuroscience, creative behavior has been analyzed from physiological perspectives, such as brain structure and neural efficiency. Martindale and Hines proposed the low arousal theory of creativity [33], which was later confirmed by Fink and Neubauer [34,35]. This theory suggests that novel and original ideas are more likely to emerge when the brain is in a state of low cortical arousal. While this seems to be consistent with the low-light environment advocated by Steidle and Werth, in the latter study, the dim lighting was set to a too-low level (only 150 lx) that fell below the lower limits of most national lighting design standards, thus significantly restricting its practical application. Furthermore, whether long-term exposure to such low illuminance causes fatigue or discomfort remains to be investigated.
Beyond illuminance, light color is another critical factor [36,37,38,39]. Weitbrecht et al. tested three color temperatures (3000 K, 4500 K, and 6000 K) under a high illuminance level of 1000 lx. The results showed that performance on creative tasks was better under lower CCT light (3000 K) than under higher CCT light (4500 K, 6000 K) [40]. Lan et al. examined how illuminance (300 lx vs. 2000 lx) and color temperature (3000 K vs. 6000 K) affected participants’ mood and creativity. While verbal fluency and flexibility were found to be improved under standard illuminance and warm light (3000 K, 300 lx), verbal originality was found to be improved under bright cool light (6000 K, 2000 lx). Furthermore, participants reported higher positive moods under these two light settings [27]. With advancements in dimming technology, the application of colored LED lights for indoor lighting has become increasingly prevalent, and numerous products offering color illumination have emerged. Colored lighting has seldom been a research focus, which has led to arbitrary color selection in the practical application of colored lighting. Nevertheless, some studies have expanded beyond CCT to explore the specific impacts of colored lighting [41,42]. Gou explored the role of color-changing LED lighting in supplementing daylight via compared daylight with four LED colors (orange, yellow, green, blue). The results showed that warm-colored light (orange, yellow) made the room feel more interesting, while green light had a negative impact on daylight perception [43]. Kombeiz et al. used conventional lighting at 3800 K and 640 lx in workspaces and applied different wall illumination colors as background lighting, including red light (<2000 K), blue light (>10,000 K), and neutral white light (4000 K). The results showed that creative performance was significantly better under the red and blue light backgrounds than under neutral white light [44]. Currently, while some research has investigated the effects of colored light on cognitive tasks, few studies have focused on creativity-related tasks. Particularly lacking is research concerning the interactive effects of illuminance and colored light on creative performance.
Emotional states, regardless of lighting conditions, have been found to correlate significantly with creative outcomes. Research indicates that positive and negative emotions are associated in different ways with various creativity-related skills. Estrada et al. reported that positive emotions enhance creative problem-solving and contribute to practical satisfaction [45]. Subramaniam et al. noted that participants experiencing higher emotional states were able to solve more problems, demonstrating greater insight compared to those with lower emotional states [46]. Yamada et al. revealed that positive moods facilitate flexible thinking and consequently lead to the production of unconventional and atypical ideas [47]. Zhan et al. revealed that the induction of anger more strongly promotes an individual’s divergent thinking than the induction of joy, and that both emotions can effectively support creative problem-solving [48]. Du et al. demonstrated that negative moods during the COVID-19 pandemic could enhance individuals’ creative ideation and emotional creativity through the serial mediation of rumination and reflection [49]. These aforementioned findings regarding the relationship between mood and creativity were not based on lighting as a variable. Some recent studies have found that lighting can induce mood changes, thereby affecting creativity. For example, Steidle et al. found that darkness enhances the feeling of freedom from constraints and reduces inhibition, thereby promoting creative performance [29]. In an experimental study, Lan et al. found that participants’ affective states were influenced by lighting conditions (illumination and color temperature), which in turn affected their creative performance [27]. However, in such studies, illuminance and color temperature are often used as experimental variables; few studies have specifically focused on colored lighting and its effects on mood. Further explorations of mood as a mediating factor in the relationship between lighting and creativity remain relatively scarce.
In summary, with the advancement of lighting technology, the use of colored LED light in indoor environments has become increasingly prevalent. Nevertheless, research on the impact of colored light on human creativity, particularly regarding its interaction with illuminance, remains limited. The objective of the present research is to analyze the combined effects of colored light and illuminance on creativity through psychophysiological testing. Specifically, the following issues are explored.
- Illuminance: Based on the low arousal theory of creativity, this study seeks to verify whether low illuminance can enhance creativity. Additionally, considering that excessively low illuminance may cause fatigue or discomfort, separate experiments were conducted under low and extremely low illuminance to verify whether both are conducive to creativity.
- Light color: instead of using the conventional CCT variable, this study explores whether adding colored light near a desk—while maintaining white light on the tabletop—can better enhance creativity.
- Interaction effects and moderating factors: Using a two-factor repeated-measure experimental design, this study explores the interactive effect of illuminance and colored lighting on creativity. Furthermore, it investigates whether emotions and physiological arousal play moderating roles in the relationship between lighting and creativity.
Focusing on office scenarios, this study investigates the mechanisms by which lighting parameters (illuminance and light color) affect creative performance. This research consisted of two parts. First, the effects of illuminance and colored lighting on creativity were independently validated in Part I. Building on these findings, Part II was conducted to further explore the interactive effects of illuminance and colored lighting, as well as the moderating roles of emotional and physiological indicators in the relationship between lighting and creativity. The outcomes of this study offer a practical reference for lighting designers and can contribute to the construction of more efficient and comfortable work environments in the context of the knowledge economy era.
2. Part I: The Impacts of Illuminance and Light Color on Creativity
The following three experiments were conducted in this study:
Experiment A: Comparing the impacts of excessively low and high illuminance on creativity;
Experiment B: Comparing creative performance under white lighting versus colored lighting;
Experiment C: Comparing creative performance under low illuminance add colored lighting versus high illuminance under white lighting.
2.1. Participants
A total of 76 healthy participants, aged between 18 and 24, were recruited from the Sichuan Fine Arts Institute. The summary of the participants for each experiment is as follows:
Experiment A: 27 participants (13 males, 14 females), mean age = 21.19;
Experiment B: 25 participants (8 males, 17 females), mean age = 20.2;
Experiment C: 24 participants (8 males, 16 females), mean age = 21.13.
All participants had normal or corrected-to-normal vision, no color blindness or color weakness, and self-reported no history of emotional disorders. They voluntarily signed an informed consent form after being briefed on the experiment and data collection process.
2.2. Experimental Setting
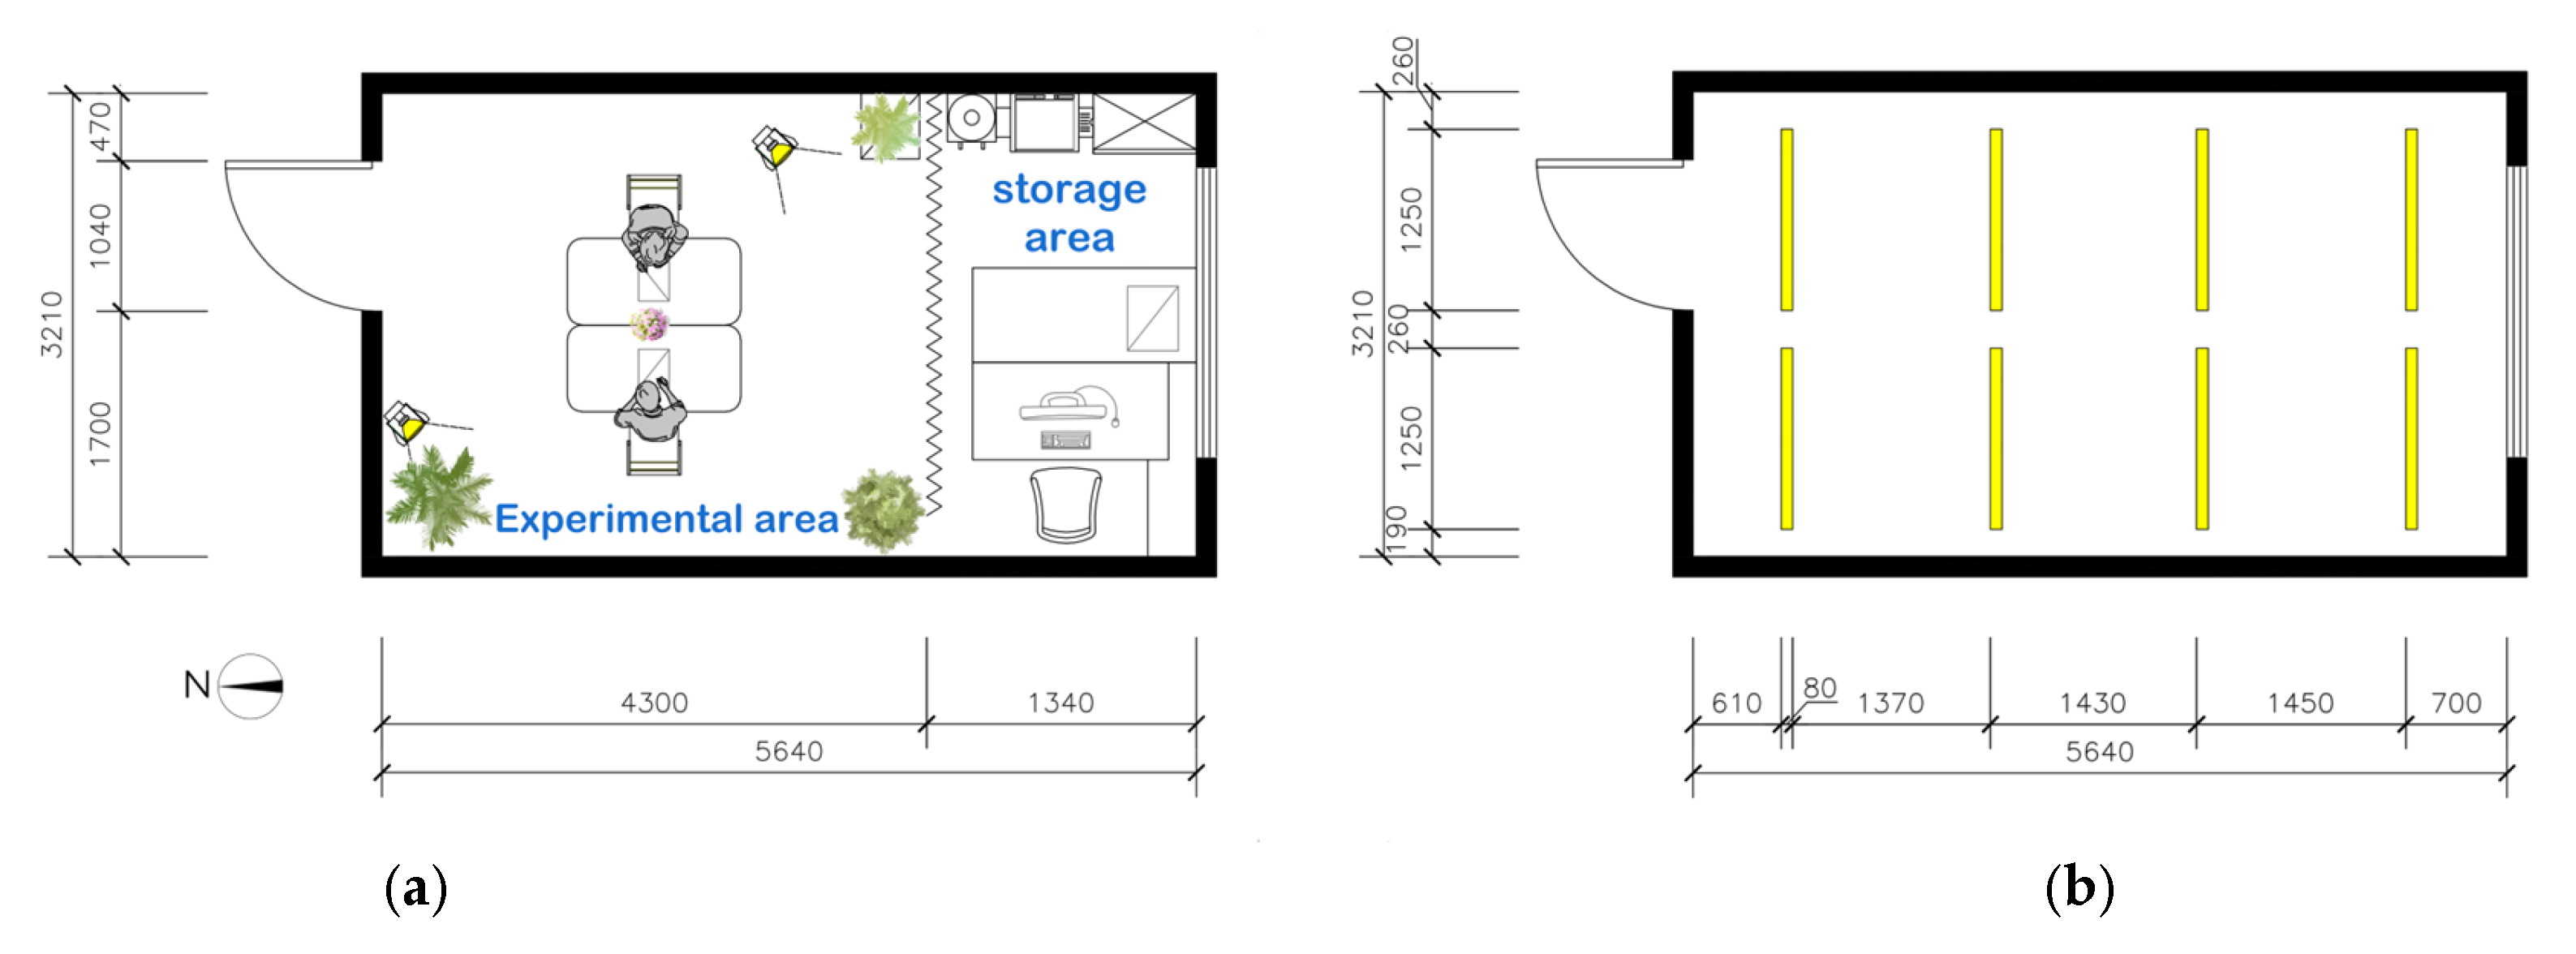
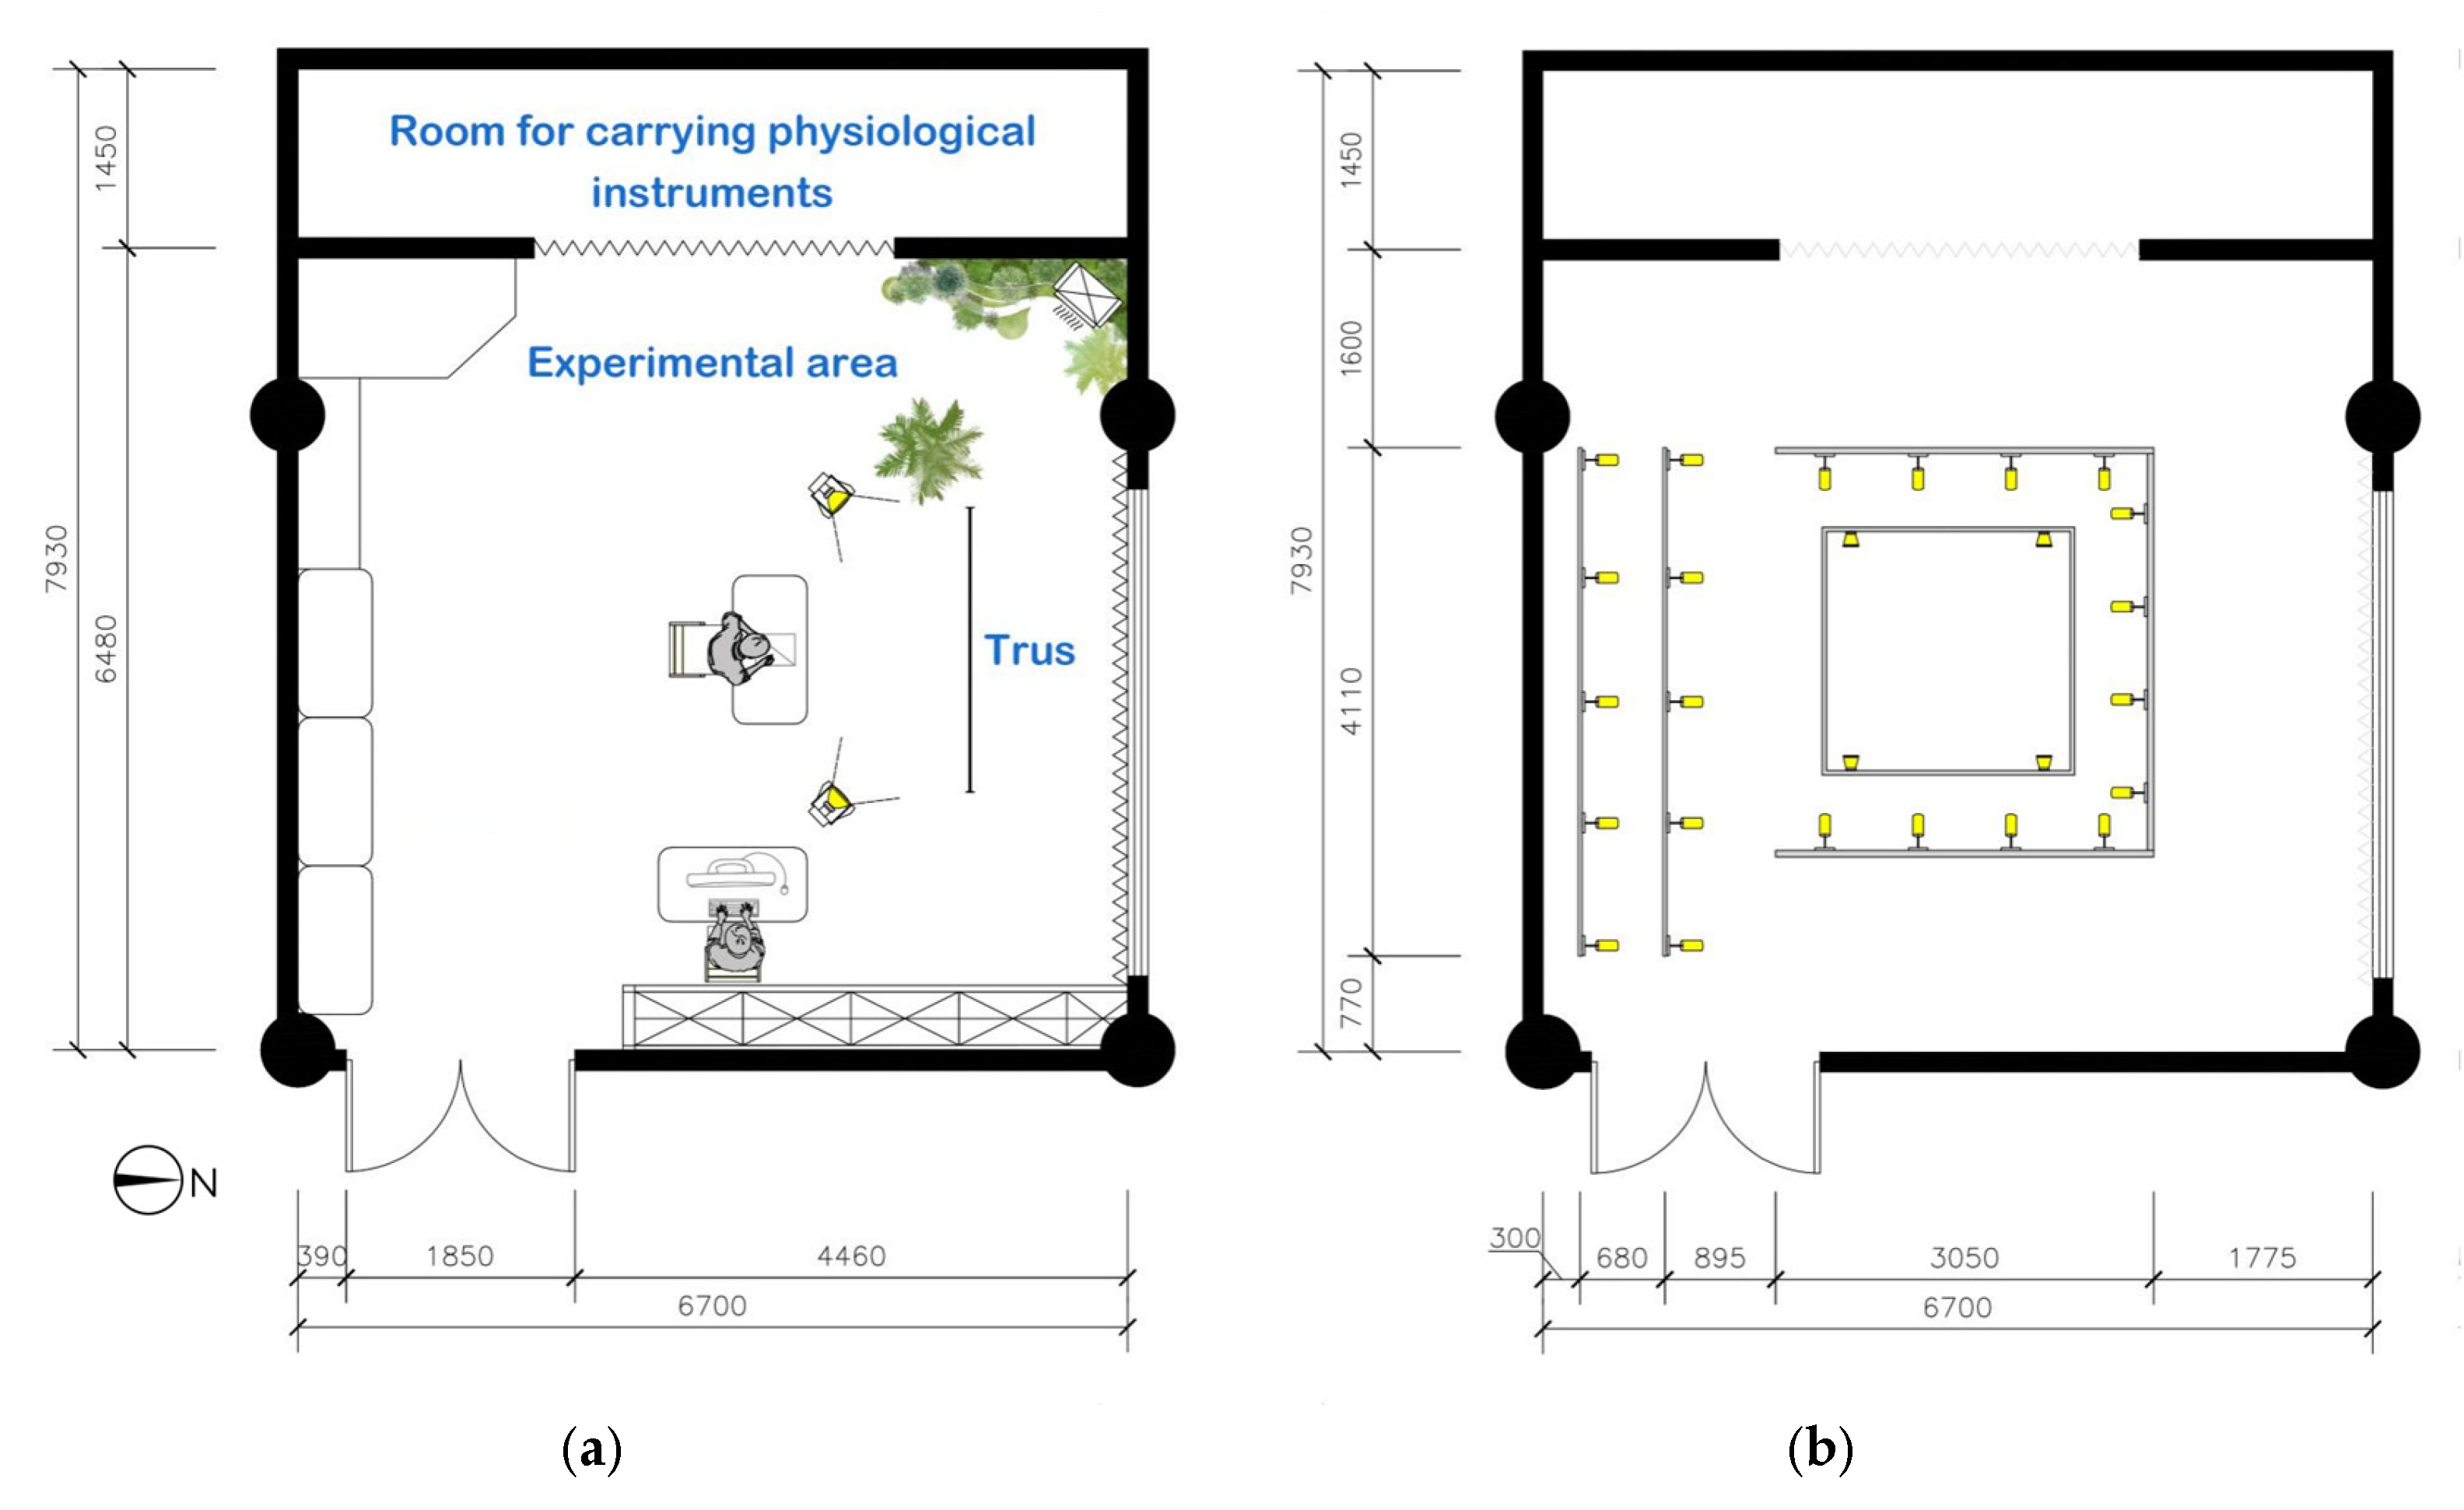
The experimental space (5.64 m × 3.21 m × 3.00 m) was a typical office in the Lighting Art Research Center of the Sichuan Fine Arts Institute. To ensure the accuracy of the experimental results, the space was divided into an experimental area and a storage area. As illustrated in Figure 1a, the experimental area featured two desks arranged opposite each other, each with a chair, and plants positioned in three corners of the room. The storage area housed the experimental devices, questionnaires, and related materials, and included a dedicated experimenter’s desk equipped for computer-controlled adjustments of the LED light intensity and CCT in the experimental area. The walls of the room were painted white, while the single window was covered with internal blackout curtains to block natural light. Other indoor conditions were kept stable within a comfortable range (temperature: 22 ± 0.8 °C; humidity: 40–60%; noise level: 45 ± 5 dB).
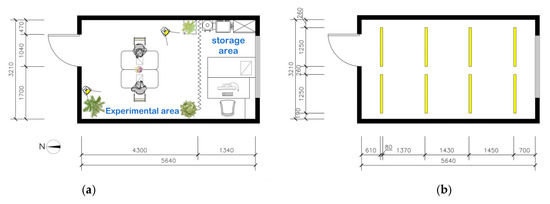
Figure 1.
Room layout for Experiments A–C, including (a) furniture view; (b) lighting view.
The ceiling was equipped with eight dimmable LED tube lights with a high color rendering index (CRI). A lighting control system capable of adjusting the color temperature (3500–6500 K) and illuminance output (0–100%) was used (refer to Figure 1b). Two colored spotlights were used to project chromatic accent lighting onto the western and southern walls. Full-space 5000 K ambient lighting vs. 5000 K desktop lighting + chromatic wall illumination were compared in Experiment B and Experiment C to assess their impacts on human creativity.
2.3. Basic Design and Independent Variables
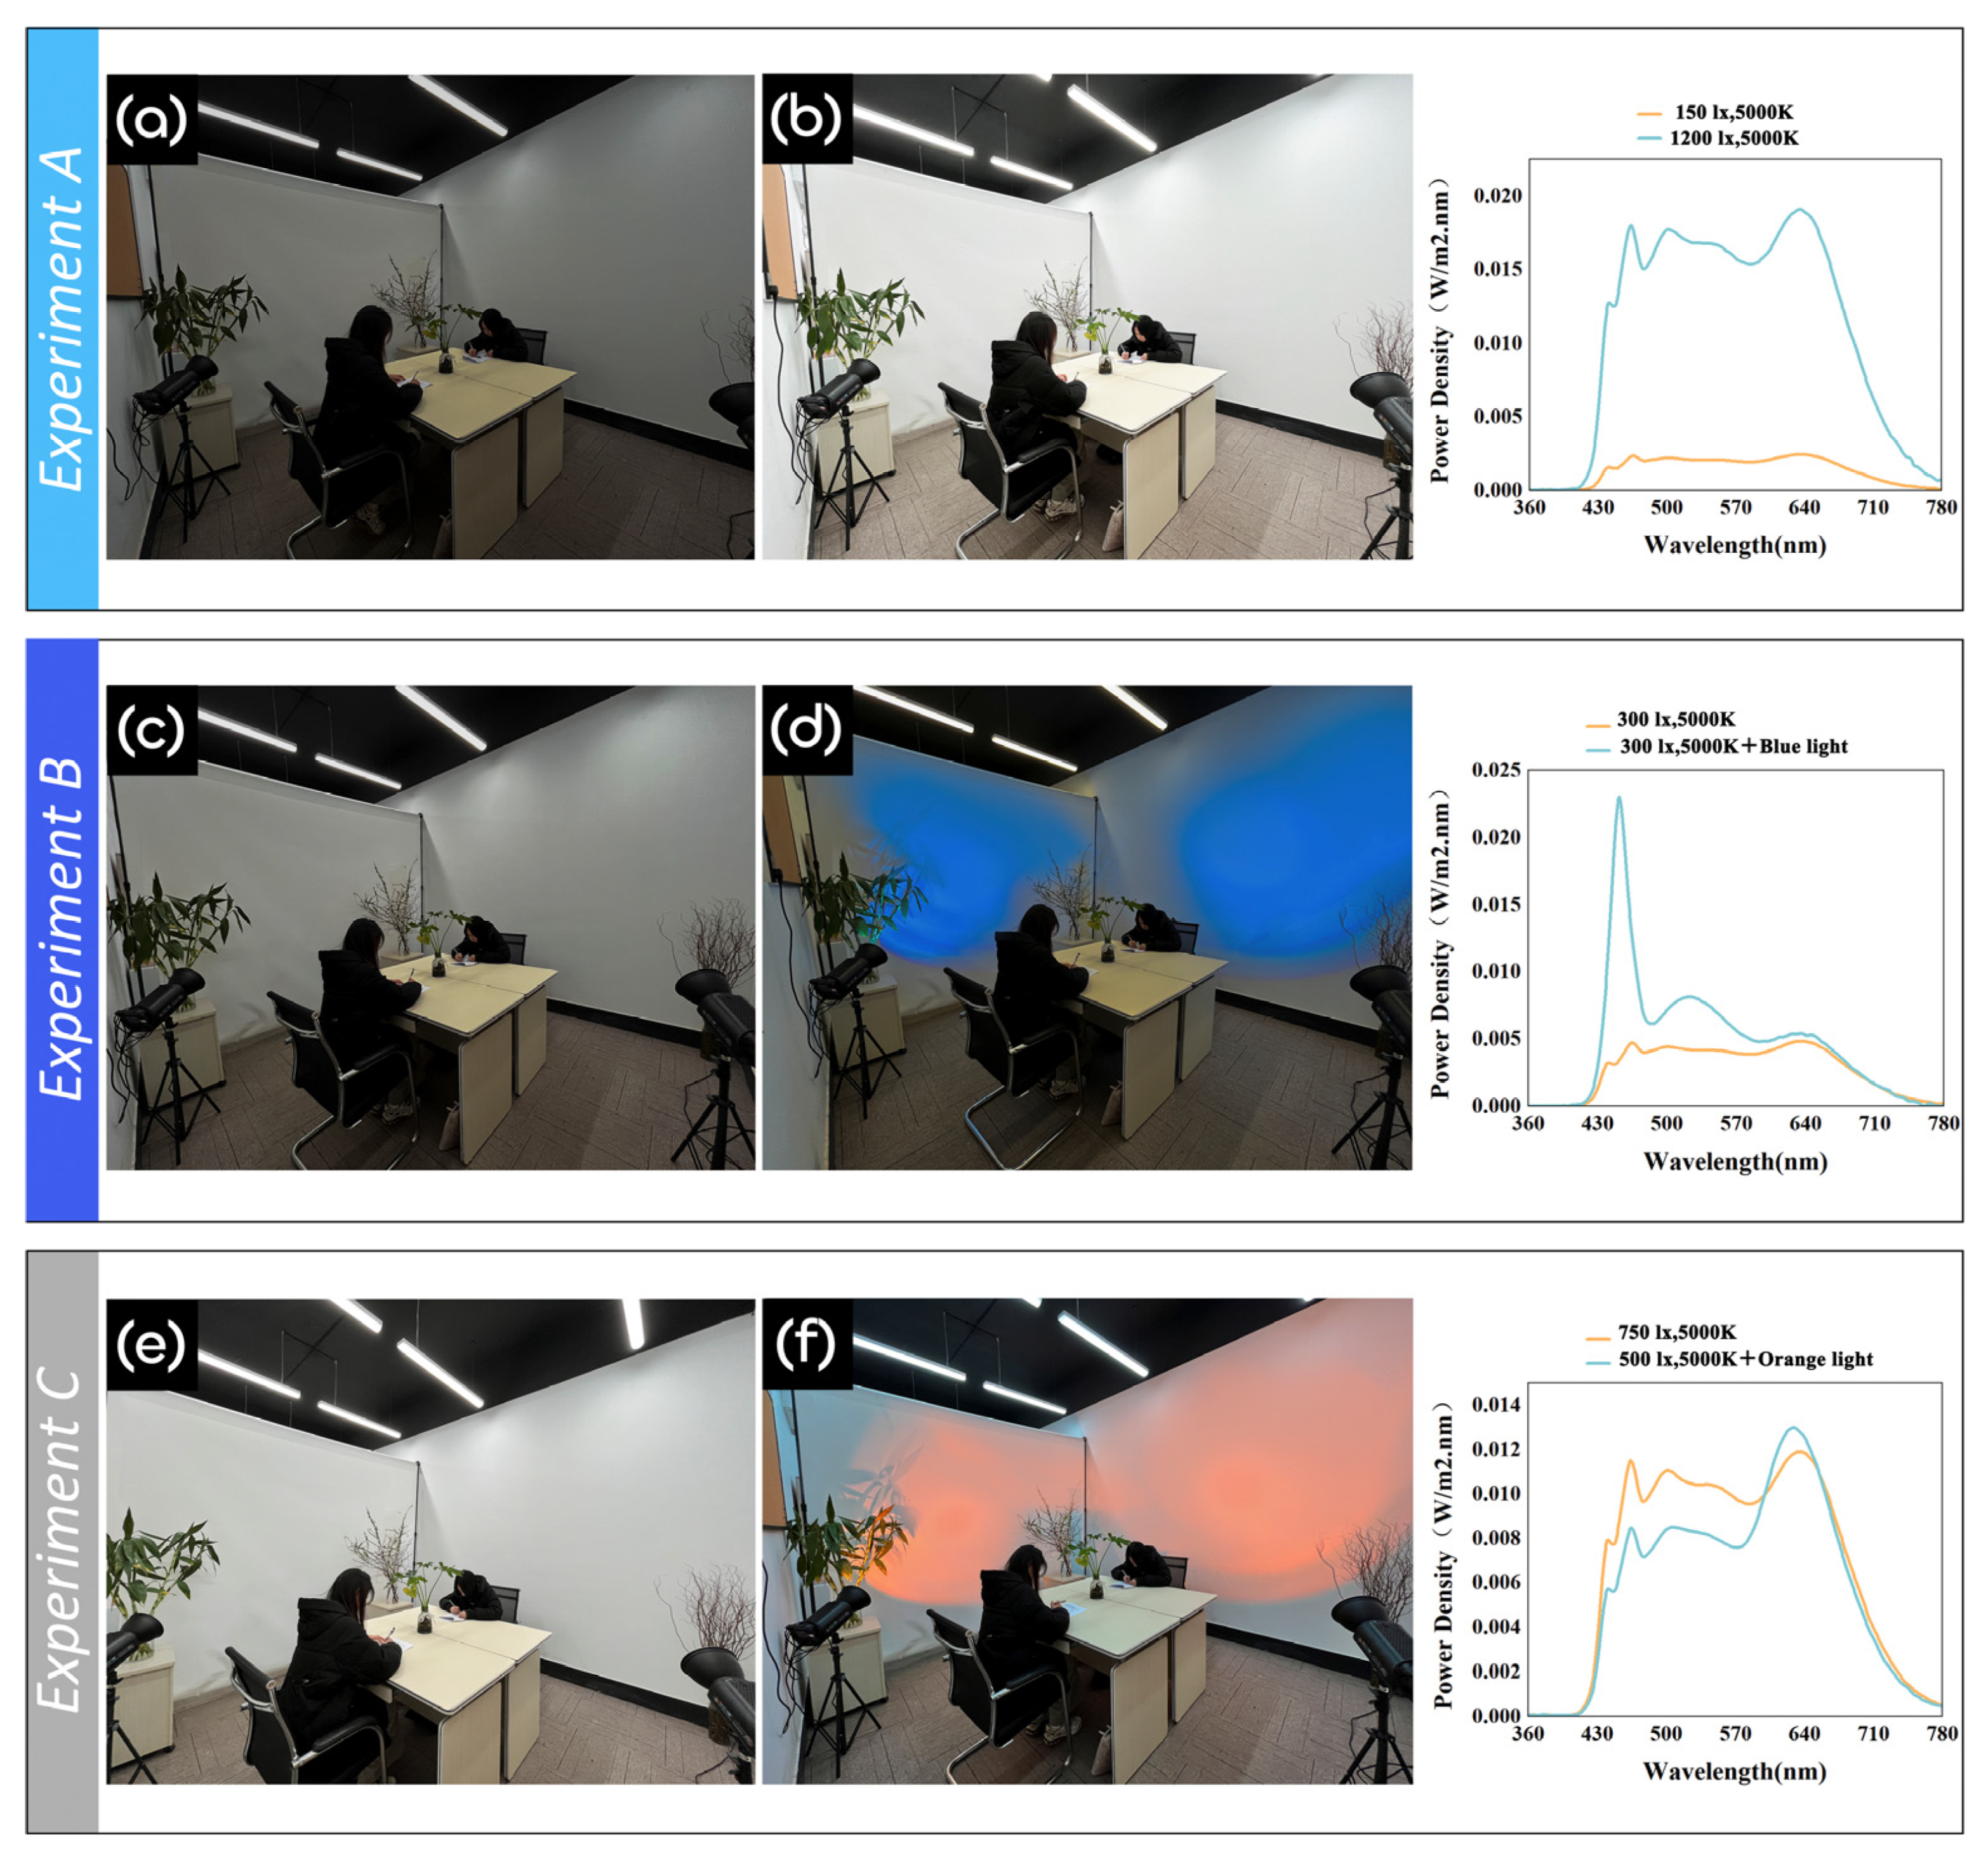
This study aimed to investigate and validate the impacts of illuminance and lighting color on creativity. Figure 2 presents photographs of the six experimental scenarios (A–C) and the spectral power distributions (SPDs) of the experimental light sources. The spectral energy in high-illumination scenes is higher than that in low-illumination scenes, with blue and orange light exhibiting spectral energy peaks at the short-wavelength and long-wavelength bands, respectively. Spectral measurements were performed using a Konica Minolta CL-500A spectroradiometer (Konica Minolta, Tokyo, Japan). The three experiments conducted under controlled conditions are detailed as follows:
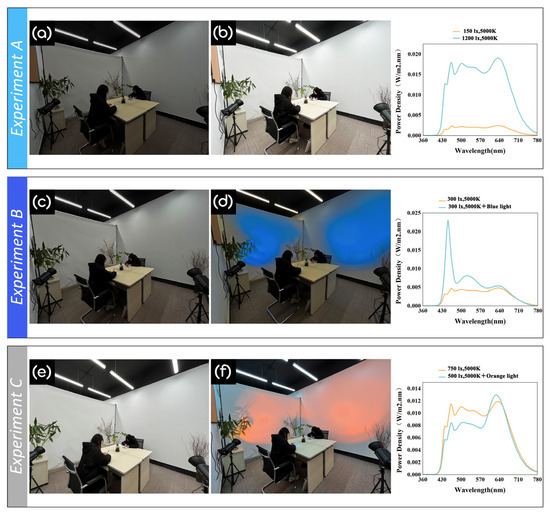
Figure 2.
Experimental photos: (a) 150 lx, 5000 K; (b) 1200 lx, 5000 K; (c) 300 lx, 5000 K; (d) 300 lx, 5000 K, with added blue light; (e) 750 lx, 5000 K; (f) 500 lx, 5000 K, with added orange light; and the relative spectral power distribution curve of different lighting scenes (a–f) was measured using a spectroradiometer in the middle of the table, facing upward toward the light sources.
Experiment A: the effects of low and high illuminance on creativity were compared: 5000 K, 150 lx vs. 5000 K, 1200 lx;
Experiment B: a fixed desk illuminance of 300 lx was maintained while comparing creative performance with or without additional colored wall lighting: 5000 K, 300 lx vs. 5000 K, 300 lx + blue wall light;
Experiment C: creative performance was compared under high desk illuminance versus low desk illuminance with colored wall lighting: 5000 K, 750 lx vs. 5000 K, 500 lx + orange wall lighting.
2.4. Dependent Variables
The creativity test was based on the classical Torrance Tests for Creative Thinking (TTCT), including picture construction and picture completion. In the picture construction task (5 min), the participants were asked to create a meaningful drawing from an egg-shaped outline and tell a creative story. In the picture completion task (10 min), the participants were given 10 sets of incomplete lines and were required to complete them into unique objects or patterns. The participants were instructed to generate uncommon, original ideas and provide creative, engaging titles for their drawings. The scoring of the test was used to calculate 4 subscales of creativity factors, including fluency, originality, flexibility, and elaboration.
A questionnaire evaluation (refer to Figure 3) included surveys on the control variables (Q1), perceived freedom from constraints (Q2), and lighting perception (Q3). Regarding the control variables, the participants were asked to rate the difficulty of the priming task, their level of enjoyment of the task, their level of motivation, and their emotional state at the time. Regarding perceived freedom from constraints, the participants were asked to rate their sense of feeling self-conscious, inhibited and worried about what the experimenter thought of them under the lighting conditions. Regarding lighting perception, the participants were asked to rate the comfort, brightness, warmth, and softness of the lighting, measured on a 7-point Likert scale.
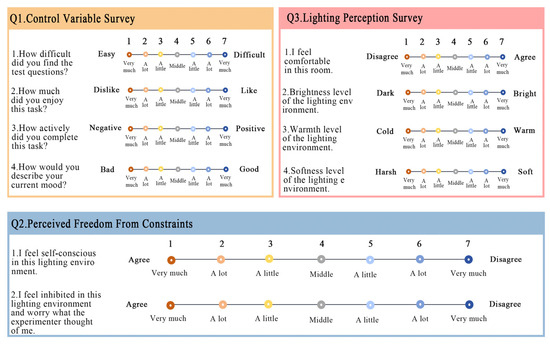
Figure 3.
Lighting evaluation item 1.
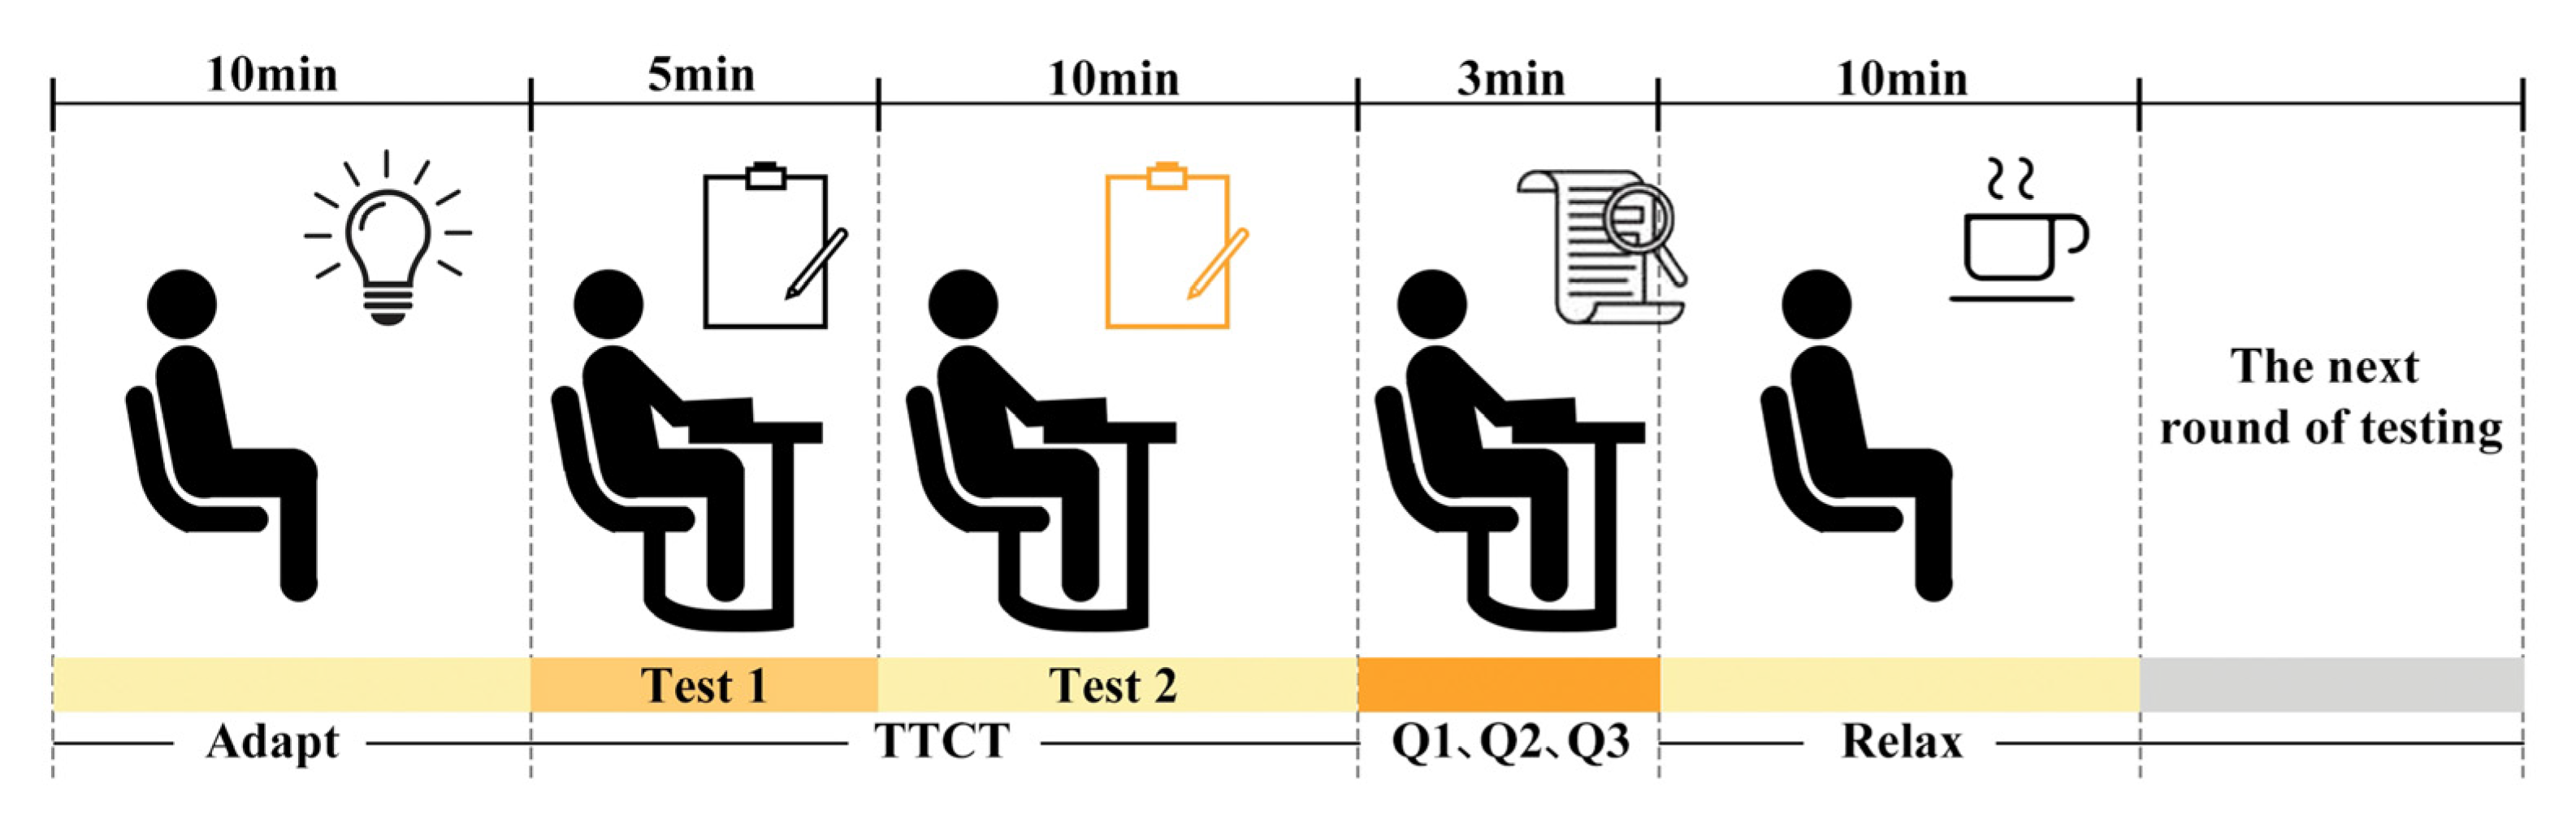
Each participant completed only one experiment (A, B, or C), with testing under two different lighting conditions. The experiments in Part I were conducted in November 2024. All participants underwent testing from 14:00 to 16:00. To mitigate possible fatigue, all subjects were required to fully rest after lunch. The procedure was as follows. The adaptation phase began with a 10 min exposure period to allow the participants to adjust to the ambient lighting conditions. During this time, the examiner introduced the content and procedures of the experiment. The participants then completed the TTCT, including the picture construction task 1 (5 min duration) and the picture completion task 2 (10 min duration). After the creative tasks, they completed the surveys on the control variables, perceived freedom from constraints, and lighting perception. Following a short break (10 min) after the first lighting scene test, the test of the second light scene was administered. To control experimental errors, a Latin square design was used to balance the exposure order of repeated tests (refer to Figure 4).
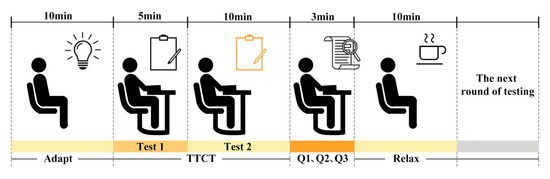
Figure 4.
The procedure of Experiments A–C.
2.5. Results
2.5.1. TTCT Creative Performance
Table 1 reports the participants’ performance on the TTCT under the six lighting conditions. Elaboration was found to be sensitive to illuminance and spectral variations. As shown in Figure 5, in Experiment A, the elaboration scores were significantly higher under high illuminance (1200 lx) than under low illuminance (150 lx) (p < 0.01, d = 0.24). In Experiment B, the elaboration scores were enhanced under blue light compared to white light (p = 0.039, d = 0.17). In Experiment C, the elaboration scores were significantly higher under low illuminance paired with colored wall lighting than under the high illuminance condition (p = 0.045, d = 0.164).

Table 1.
TTCT performance (mean ± standard deviation) under different lighting conditions in Experiments A–C (d represents Cohen’s effect size, and the p-values are from two-tailed tests).
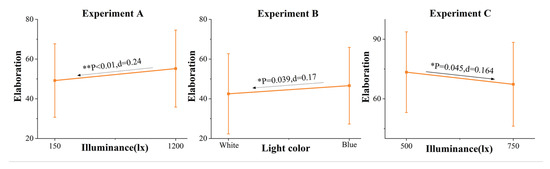
Figure 5.
The paired comparisons of the effects of lighting conditions on the TTCT elaboration scores in Experiments A–C (p-values and effect sizes are shown, ** p < 0.01, * p < 0.05).
No significant differences in fluency, originality, and flexibility were observed among the lighting conditions.
2.5.2. Lighting Perception
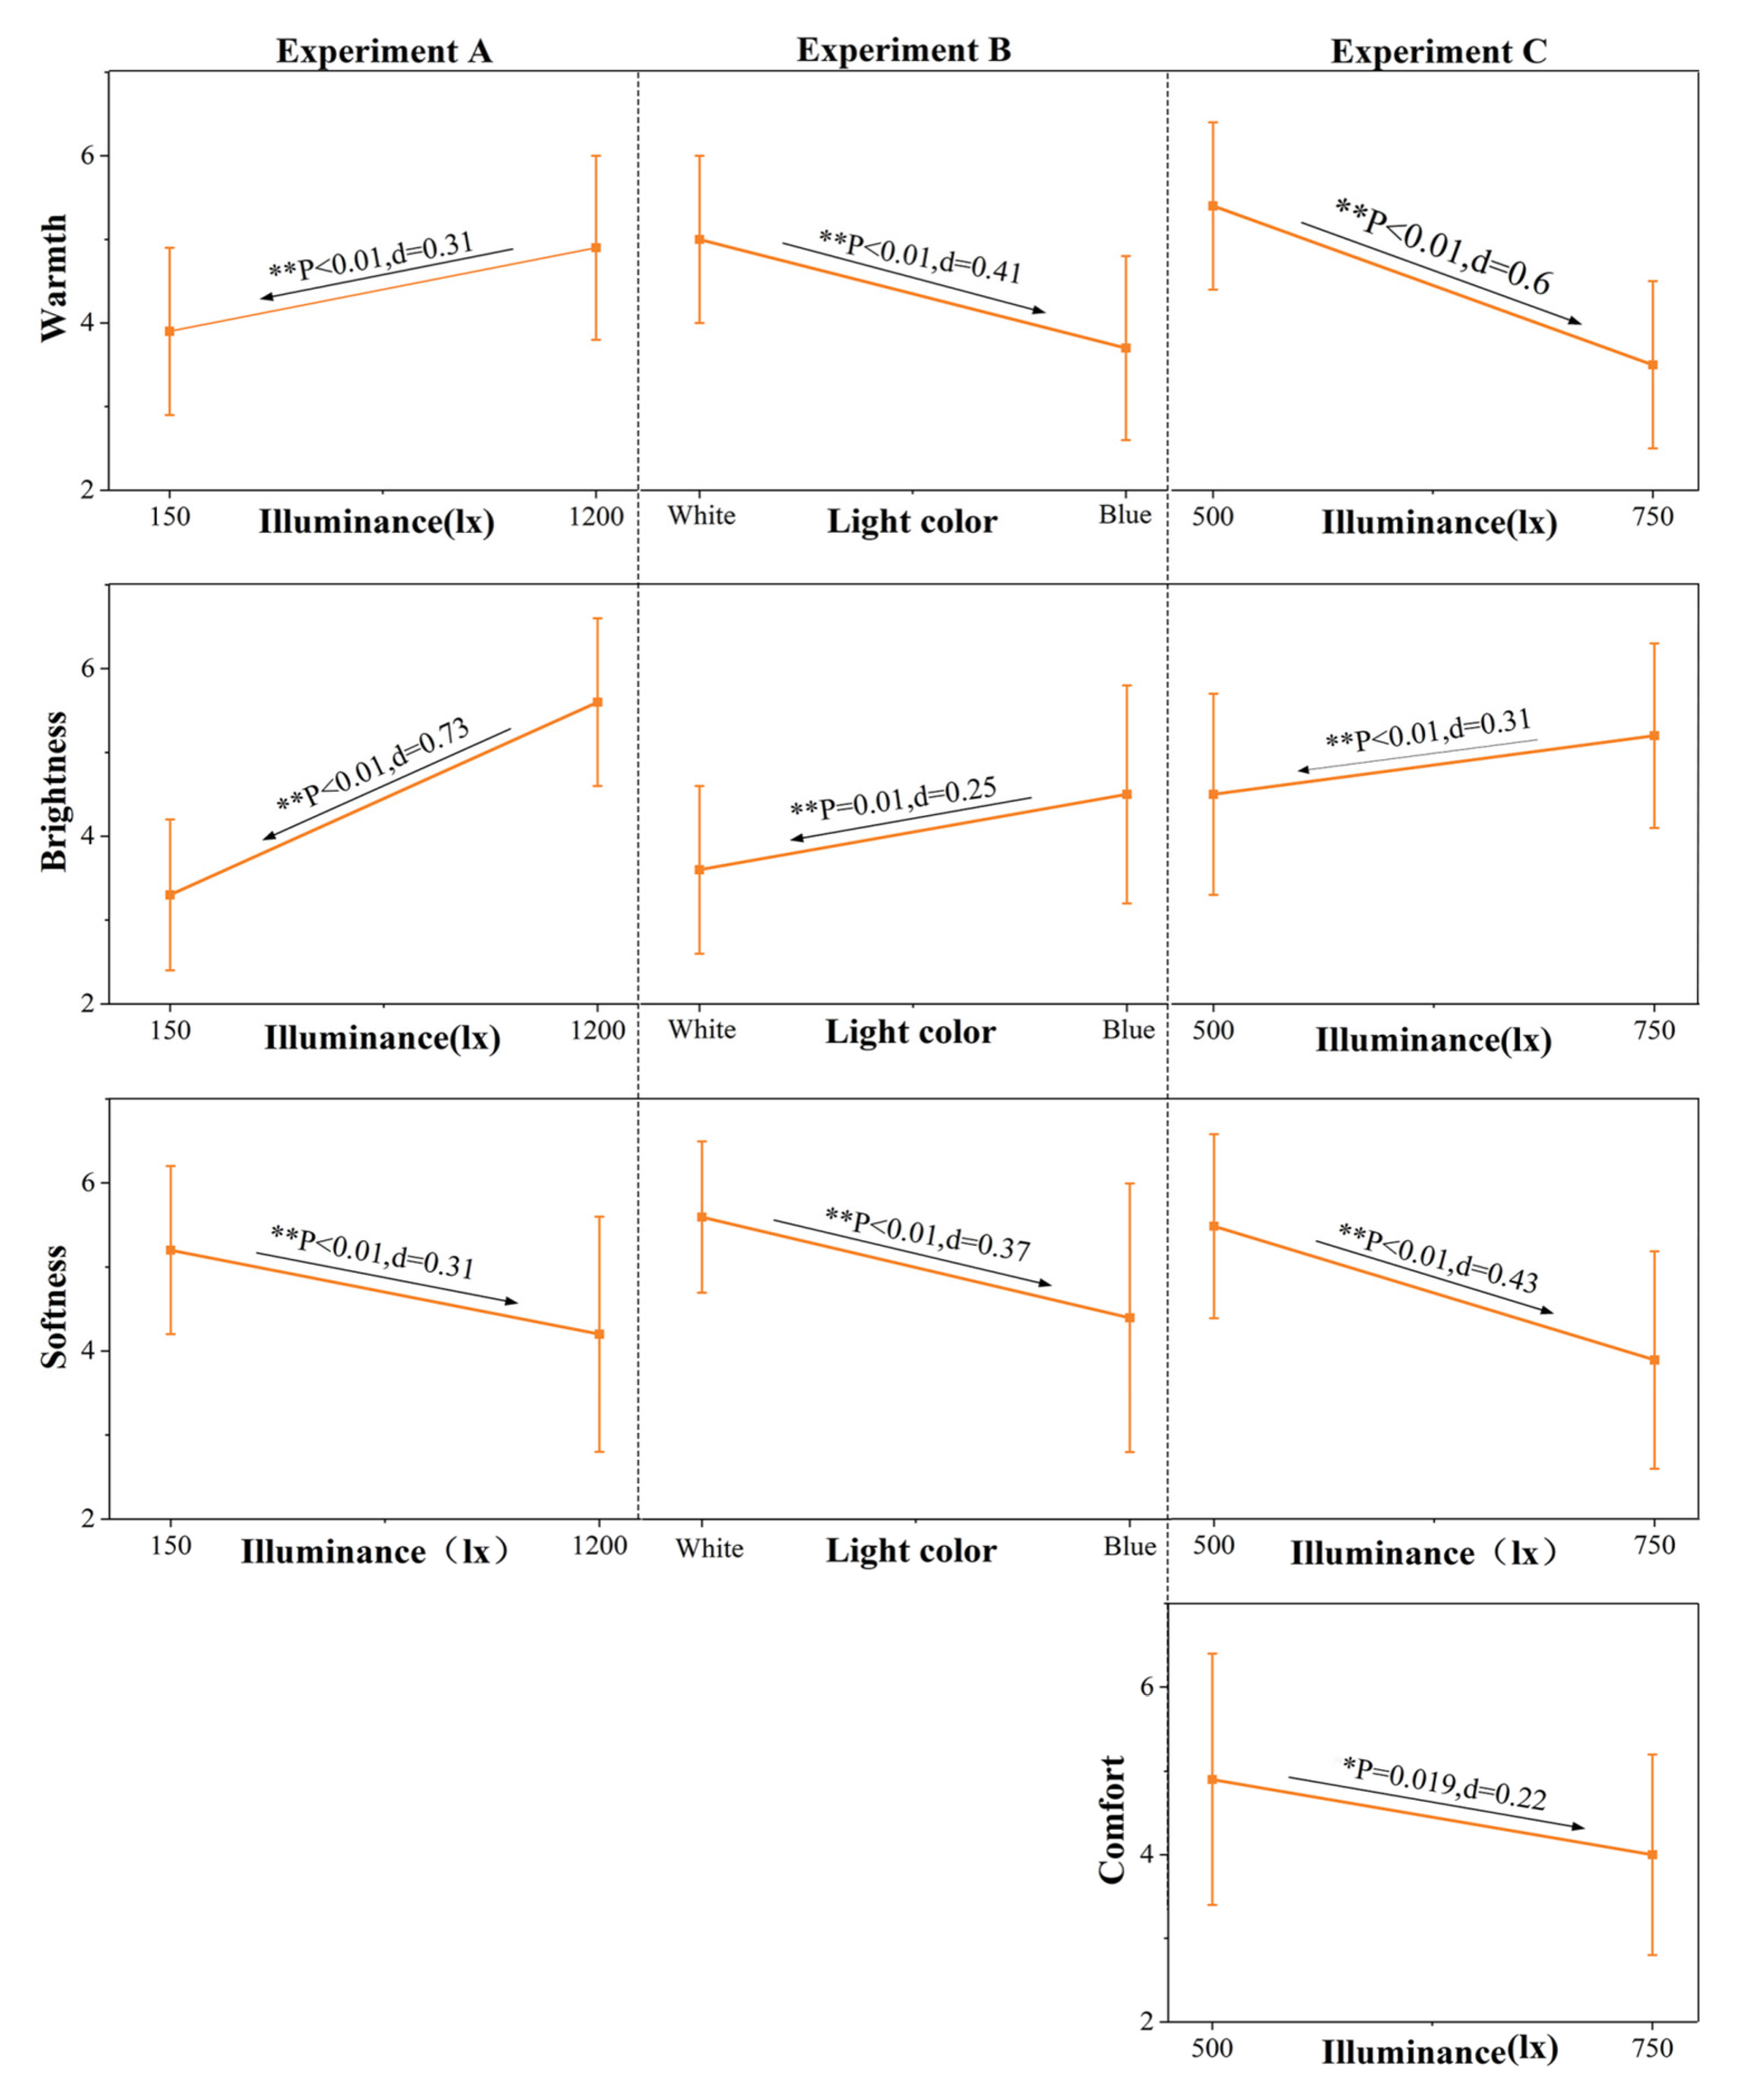
Table 2 indicates significant differences in lighting perception across all three experiments. In Experiment A, illuminance had significant main effects on perceived brightness (p < 0.01, d = 0.73), warmth (p < 0.01, d = 0.31), and softness (p < 0.01, d = 0.31). Figure 6 reveals that in Experiment A, under high illuminance (1200 lx), the participants rated brightness and warmth higher, while under low illuminance (150 lx), softness was rated higher. In Experiment B, lighting color significantly influenced perceived brightness (p = 0.01, d = 0.25), warmth (p < 0.01, d = 0.41), and softness (p < 0.01, d = 0.37). The addition of blue wall lighting increased brightness perception but reduced warmth and softness perception. In Experiment C, comparisons between the desktop condition at 500 lx with added orange lighting and the desktop condition at 750 lx with added white lighting revealed significant differences in perceived brightness (p < 0.01, d = 0.31), warmth (p < 0.01, d = 0.6), softness (p < 0.01, d = 0.43), and comfort level (p = 0.019, d = 0.22). Orange lighting at 500 lx was rated as warmer, softer, and more comfortable, while white lighting at 750 lx was perceived as brighter (Figure 6).
Table 2.
Lighting perception (mean ± standard deviation) under different lighting conditions in Experiments A–C.
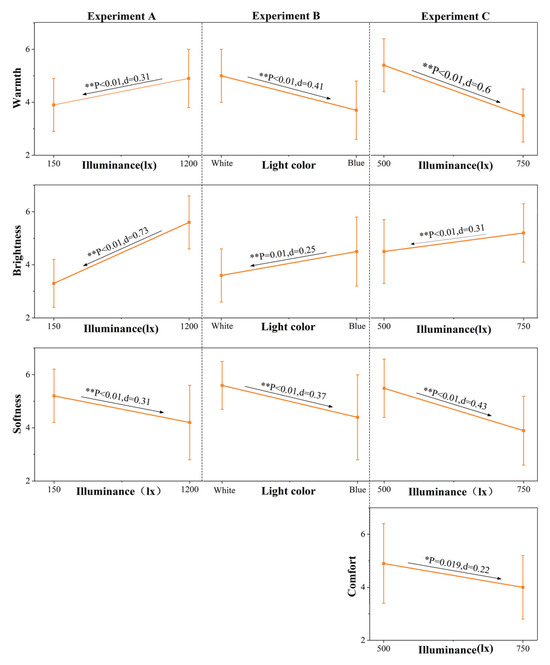
Figure 6.
The paired comparisons of the effects of lighting conditions on the lighting perception scores in Experiments A–C (p-values and effect sizes are shown, ** p < 0.01, * p < 0.05).
No significant effect of lighting conditions on comfort level was detected in Experiments A and B.
These results highlight that higher illuminance enhances perceived brightness but reduces perceived softness, while warm colored lighting amplifies perceived warmth and comfort.
Table 3 reports the Pearson correlations among creativity, perceived freedom from constraints, and lighting perception across the three experiments.
Table 3.
The Pearson correlations among creativity, perceived freedom from constraints, and lighting perception variables in Experiments A–C.
In Experiment A, originality exhibited a moderate negative correlation with the perception of inhibition, while elaboration showed a stronger negative association with it. Comfort level was strongly negatively correlated with both feeling inhibited and self-consciousness. Additionally, the perceived softness of lighting was inversely correlated with inhibition, and fluency displayed a weak positive correlation with perceived warmth.
In Experiment B, comfort level remained negatively associated with feeling inhibited, self-consciousness, and warmth, though no significant correlations emerged between the creativity metrics (e.g., originality, elaboration) and lighting perceptions.
In Experiment C, comfort level again exhibited negative correlations with self-consciousness and warmth, but no significant links were observed between the creativity scores and subjective lighting evaluations.
These results, particularly those of Experiment A, suggest that perceptions of inhibition and self-consciousness under specific lighting conditions are closely tied to reduced comfort levels. The warmth and softness of lighting may mitigate feelings of constraint, indirectly fostering creative elaboration. However, the strength and direction of these relationships varied across experimental contexts, highlighting the nuanced interplay between environmental perception and creative outcomes.
2.6. Discussion
Similar to the research by Steidle [29], a low illuminance setting of 150 lx was adopted in Experiment A; however, the results were contrary. Specifically, under the 150 lx illuminance, creative performance declined significantly. This is possibly because the light sources were different in the two studies. Fluorescent lamps were used in Steidle’s experiment, while LED was adopted in our research. Previous studies indicated that optimal illuminance differs under varying light spectra [50,51]. Furthermore, the conclusions of Experiment B were similar to the results of Kombeiz [44], confirming that colored light can enhance creative performance. Experiment C compared the effects of low illuminance with colored light versus high illuminance on creative performance, yielding a conclusion that is contrary to that of Experiment A. In this experiment, creativity was found to be higher under low illuminance, which may have been due to the addition of colored lighting, or, as proposed in the introduction, because the low illuminance motivated a relaxed mood. No significant differences were found in the perceived freedom from constraints under different lighting conditions. Some studies suggest that when the differences in lighting conditions are minimal, subjects’ perception of light is similar [52,53]. Therefore, this result was likely due to the relatively small differences in light intensity between the two conditions of Experiments B and C, whereas the too-dim or too-bright lighting in Experiment A failed to stimulate a sense of freedom in the participants. Hence, there were no differences in mood perception across these tests. Furthermore, a correlation analysis revealed a moderate correlation between creativity and the perceived freedom from constraints. In Part II of this research, more measures of mood are included.
Overall, the first part of this study confirmed that too-low illuminance (150 lx) is not conducive to creativity, while colored lighting can indeed enhance creativity. The interactive effect of illuminance and lighting color is subsequently further explored, and more emotional and physiological indicators are considered to verify the previously proposed hypothesis, that low illuminance and colored lighting within a comfortable range help enhance creativity.
3. Part II: Research on the Interaction of Illuminance and Lighting Color
3.1. Participants
A total of 25 healthy participants (16 females, 9 males, 18–27 years old) were randomly recruited from the Sichuan Fine Arts Institute. All participants had normal or corrected-to-normal vision, no color blindness or color weakness, and self-reported no history of emotional disorders. They voluntarily signed an informed consent form after being briefed on the experiment and data collection process.
3.2. Experimental Setting
Experiment D took place in the architectural physics laboratory at the Huxi Campus of the Sichuan Fine Arts Institute. The laboratory comprised two primary areas: a physiological instrument preparation area and an experimental area. The preparation area allowed the participants to discreetly put on heart rate monitors prior to testing, ensuring privacy. In the experimental area, one wall (6.70 m × 7.93 m × 3.00 m) was painted white, while the other three walls were covered with dark gray curtains to ensure the absence of natural light interference. Comfortable temperature and humidity ranges were maintained through air conditioning and dehumidifiers to reduce adverse effects on the experimental results. A set of table and chair facilities was arranged in the experimental area, with one participant assigned for each test. In front of the test table, a truss (2 m wide × 3 m high) with white cloth hung to simulate a white wall was set up and also used to display colored lighting during the experiment. A table for the experimenter was located on the right side of the participant’s table to place the relevant operating equipment and to monitor each participant’s physiological data, including heart rate variability (HRV), in real time. Plants were positioned in a corner against the laboratory wall (refer to Figure 7).
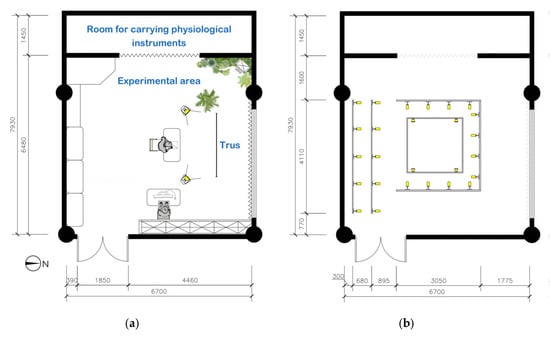
Figure 7.
Room layout for Experiment D, including (a) furniture view; (b) lighting view.
3.3. Basic Design and Independent Variables
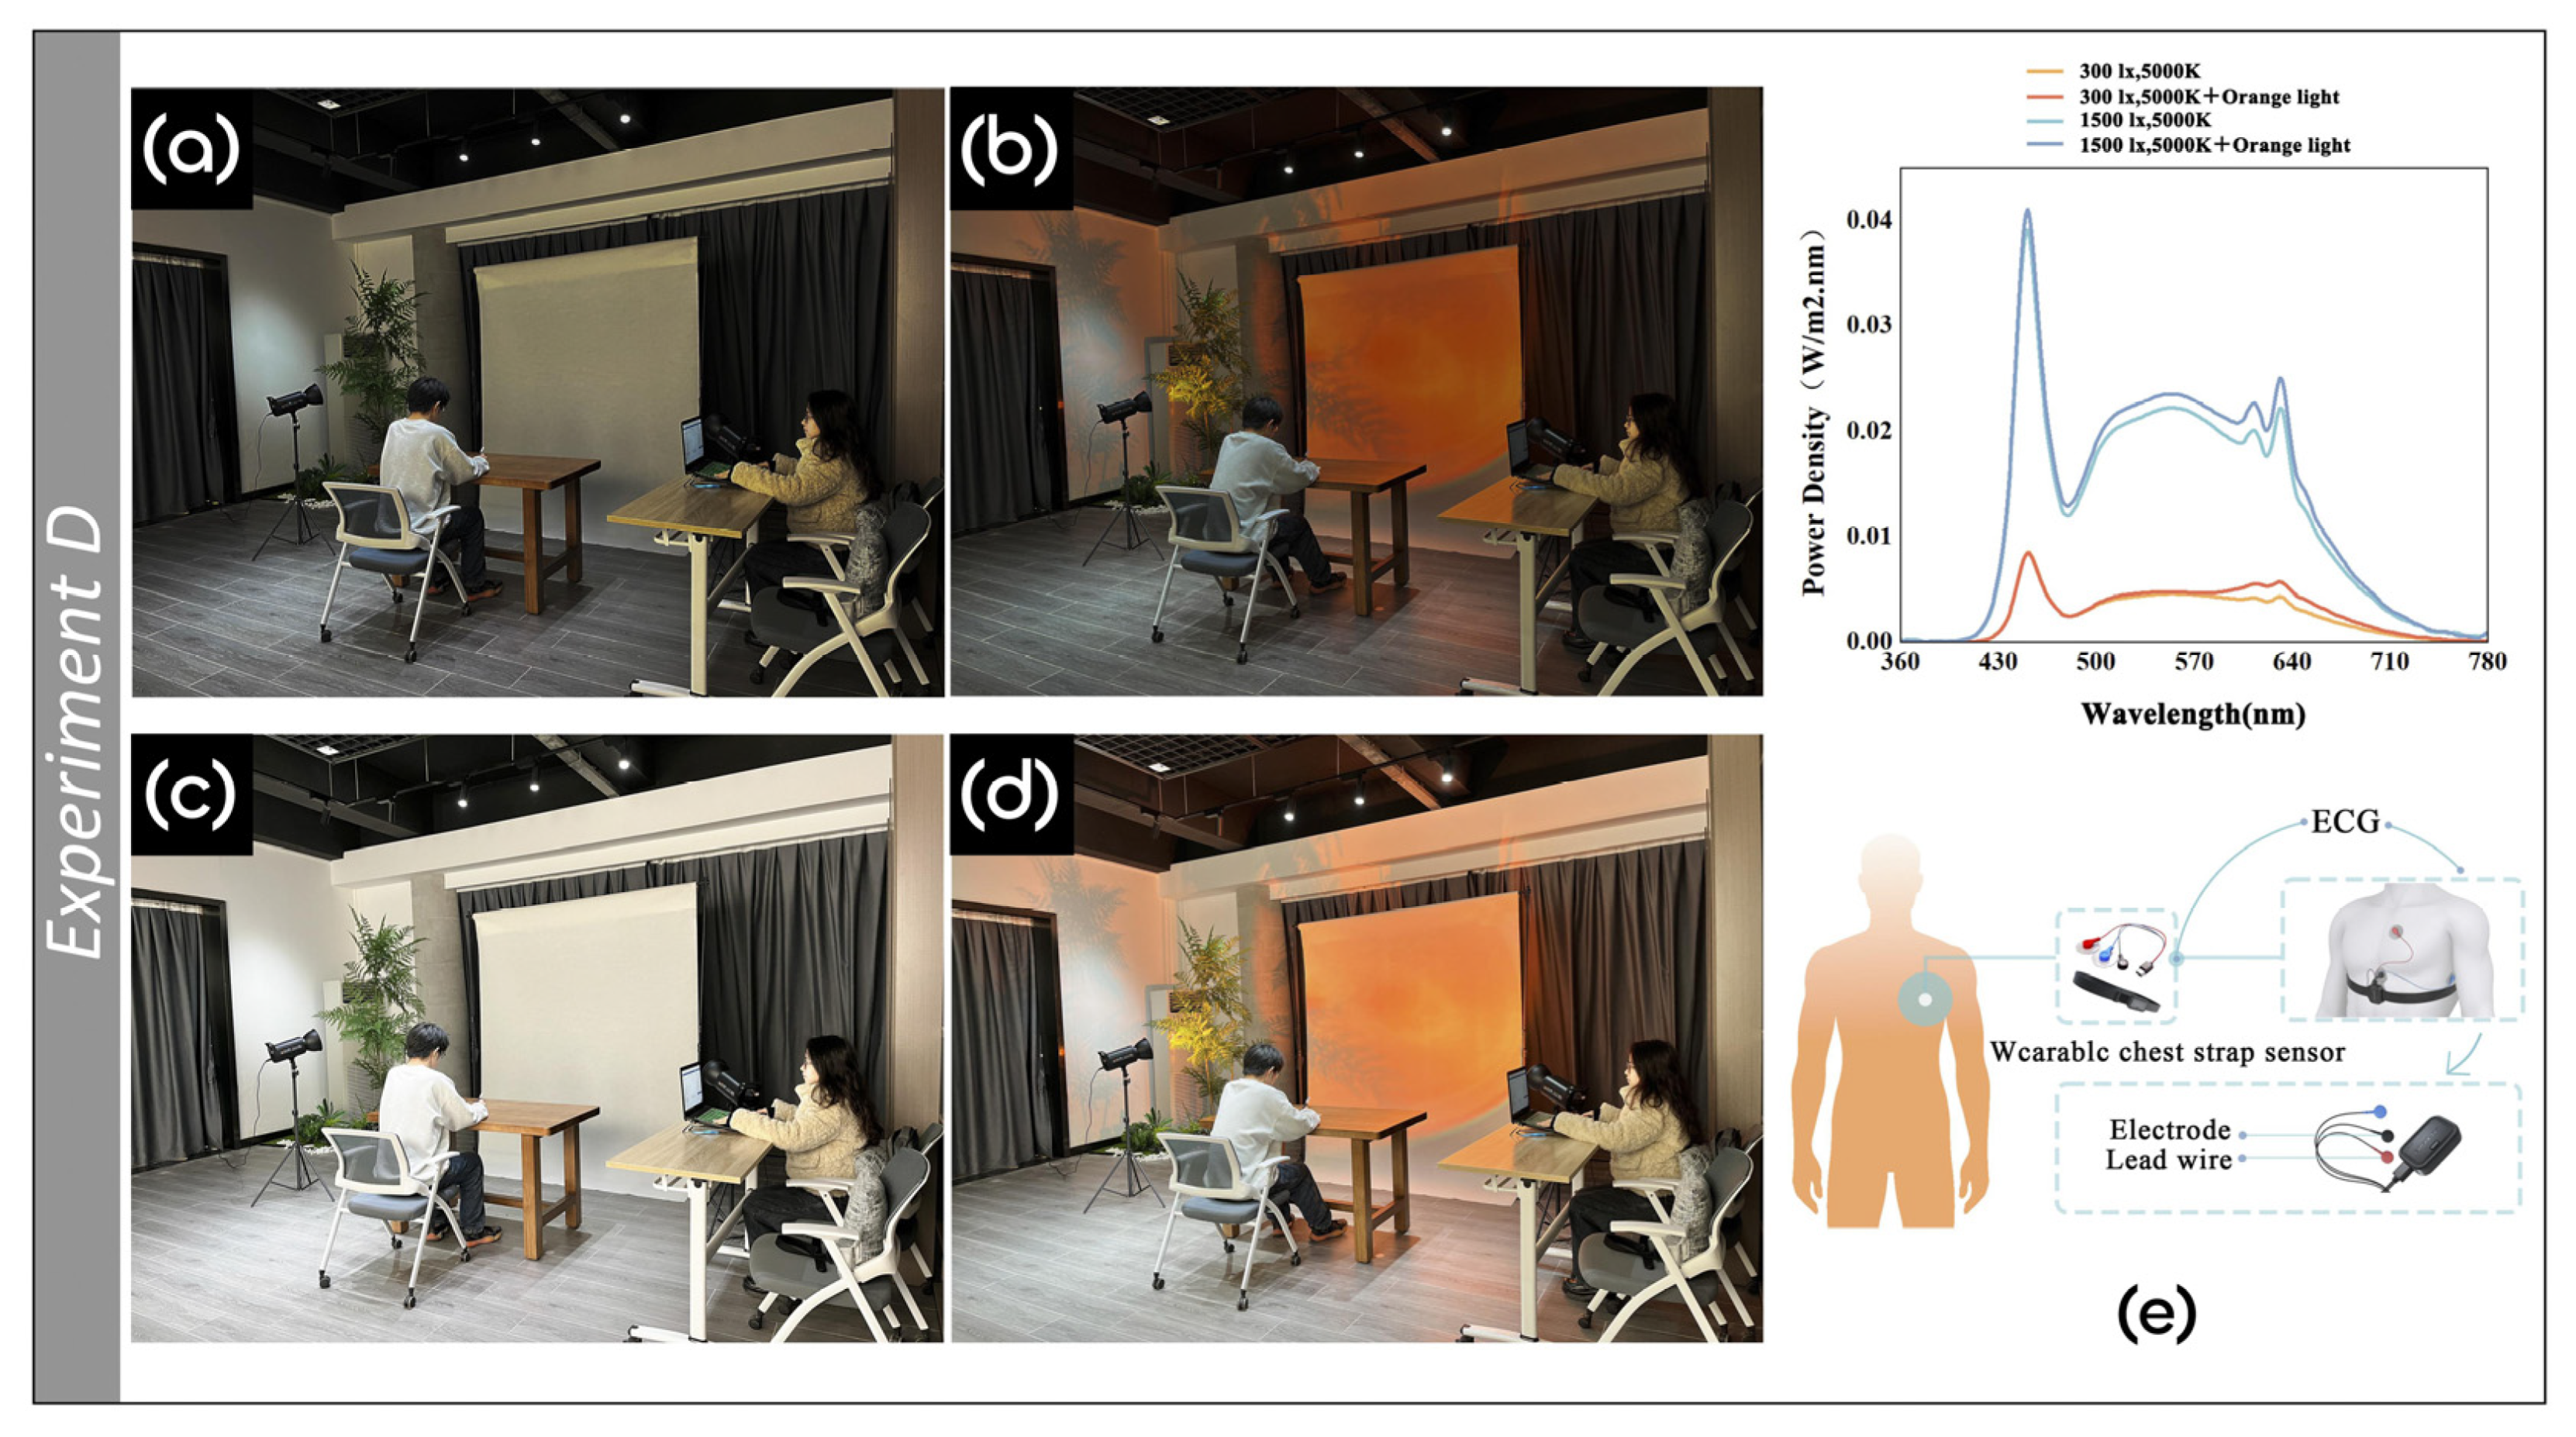
A factorial within-subject design was employed with two independent variables: 2 (wall light color, 5000 K vs. orange) × 2 (desktop illuminance, 300 lx vs. 1500 lx). Via the experimental design, the same 25 participants were tested under each of the four lighting conditions. A Latin square design was used to balance the exposure order of each participant. Figure 8 presents the four experimental scenarios investigated in this study and the SPD diagrams of four distinct light sources measured on the experimental workstation. The spectral energy in the high-illuminance scenes is significantly higher than that in the low-illuminance scenes, and the addition of orange lighting resulted in more energy distribution in the long-wavelength bands.
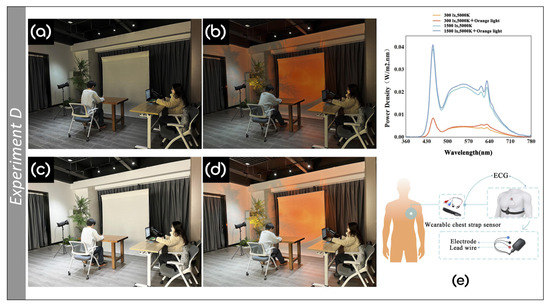
Figure 8.
Experimental photos: (a) 300 lx, 5000 K; (b) 300 lx, 5000 K, with added orange lighting; (c) 1500 lx, 5000 K; (d) 1500 lx,5000 K, with added orange lighting; (e) active electrode attachment locations for measuring HRV. The relative spectral power distribution of different lighting scenes (a–d) was measured by the spectroradiometer in the middle of the table facing up towards the light sources.
3.4. Dependent Variables
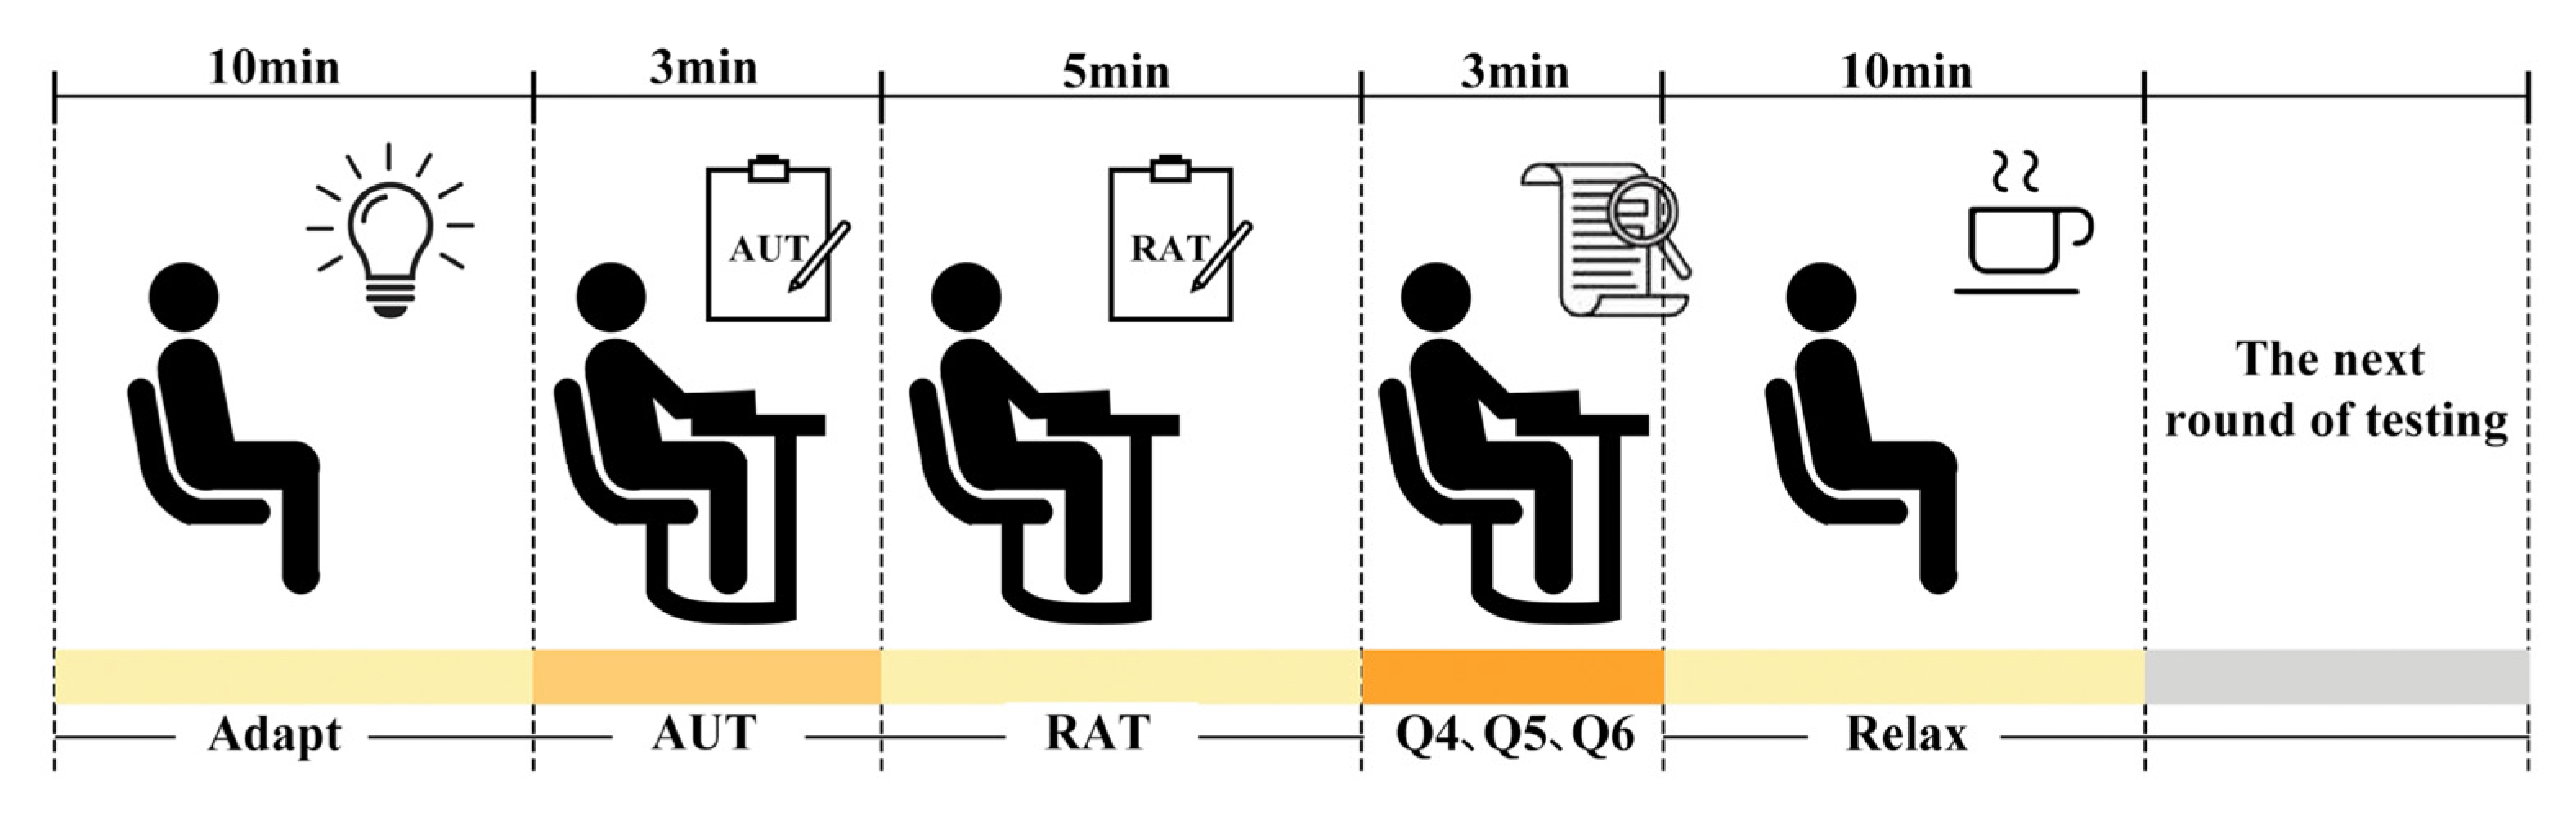
The experimental materials included creativity tests (RAT and AUT), a mood questionnaire (Q4), a perception survey (Q5), and an estimation of work performance (Q6). A Chinese language version of the RAT was used to measure the participants’ Chinese-character association ability. The questionnaire presented 20 Chinese-character word association items. For each question, three Chinese “cue words” were given, and the participants were required to find a single extra Chinese “answer word” that would link all the others together. These words could be associated by forming a semantic association reflecting creative ability to find the single correct answer that was not the most obvious. The testing lasted 5 min, and the number of correct answers was tallied at the end. The Alternative Uses Task (AUT) was administered to test verbal divergent thinking ability. The participants were given one daily life object (such as a newspaper, a mineral water bottle, socks, etc.) and were asked to list as many alternative uses of this object as possible within 3 min (refer to Figure 9).

Figure 9.
The procedure of Experiment D.
Mood was measured by the Positive Affect Negative Affect Schedule (PANAS), which is composed of 20 items that represent two orthogonal dimensions of mood (positive vs. negative). During the experiment, the participants were required to read each word and mark a response based on their actual feelings in the current lighting environment.
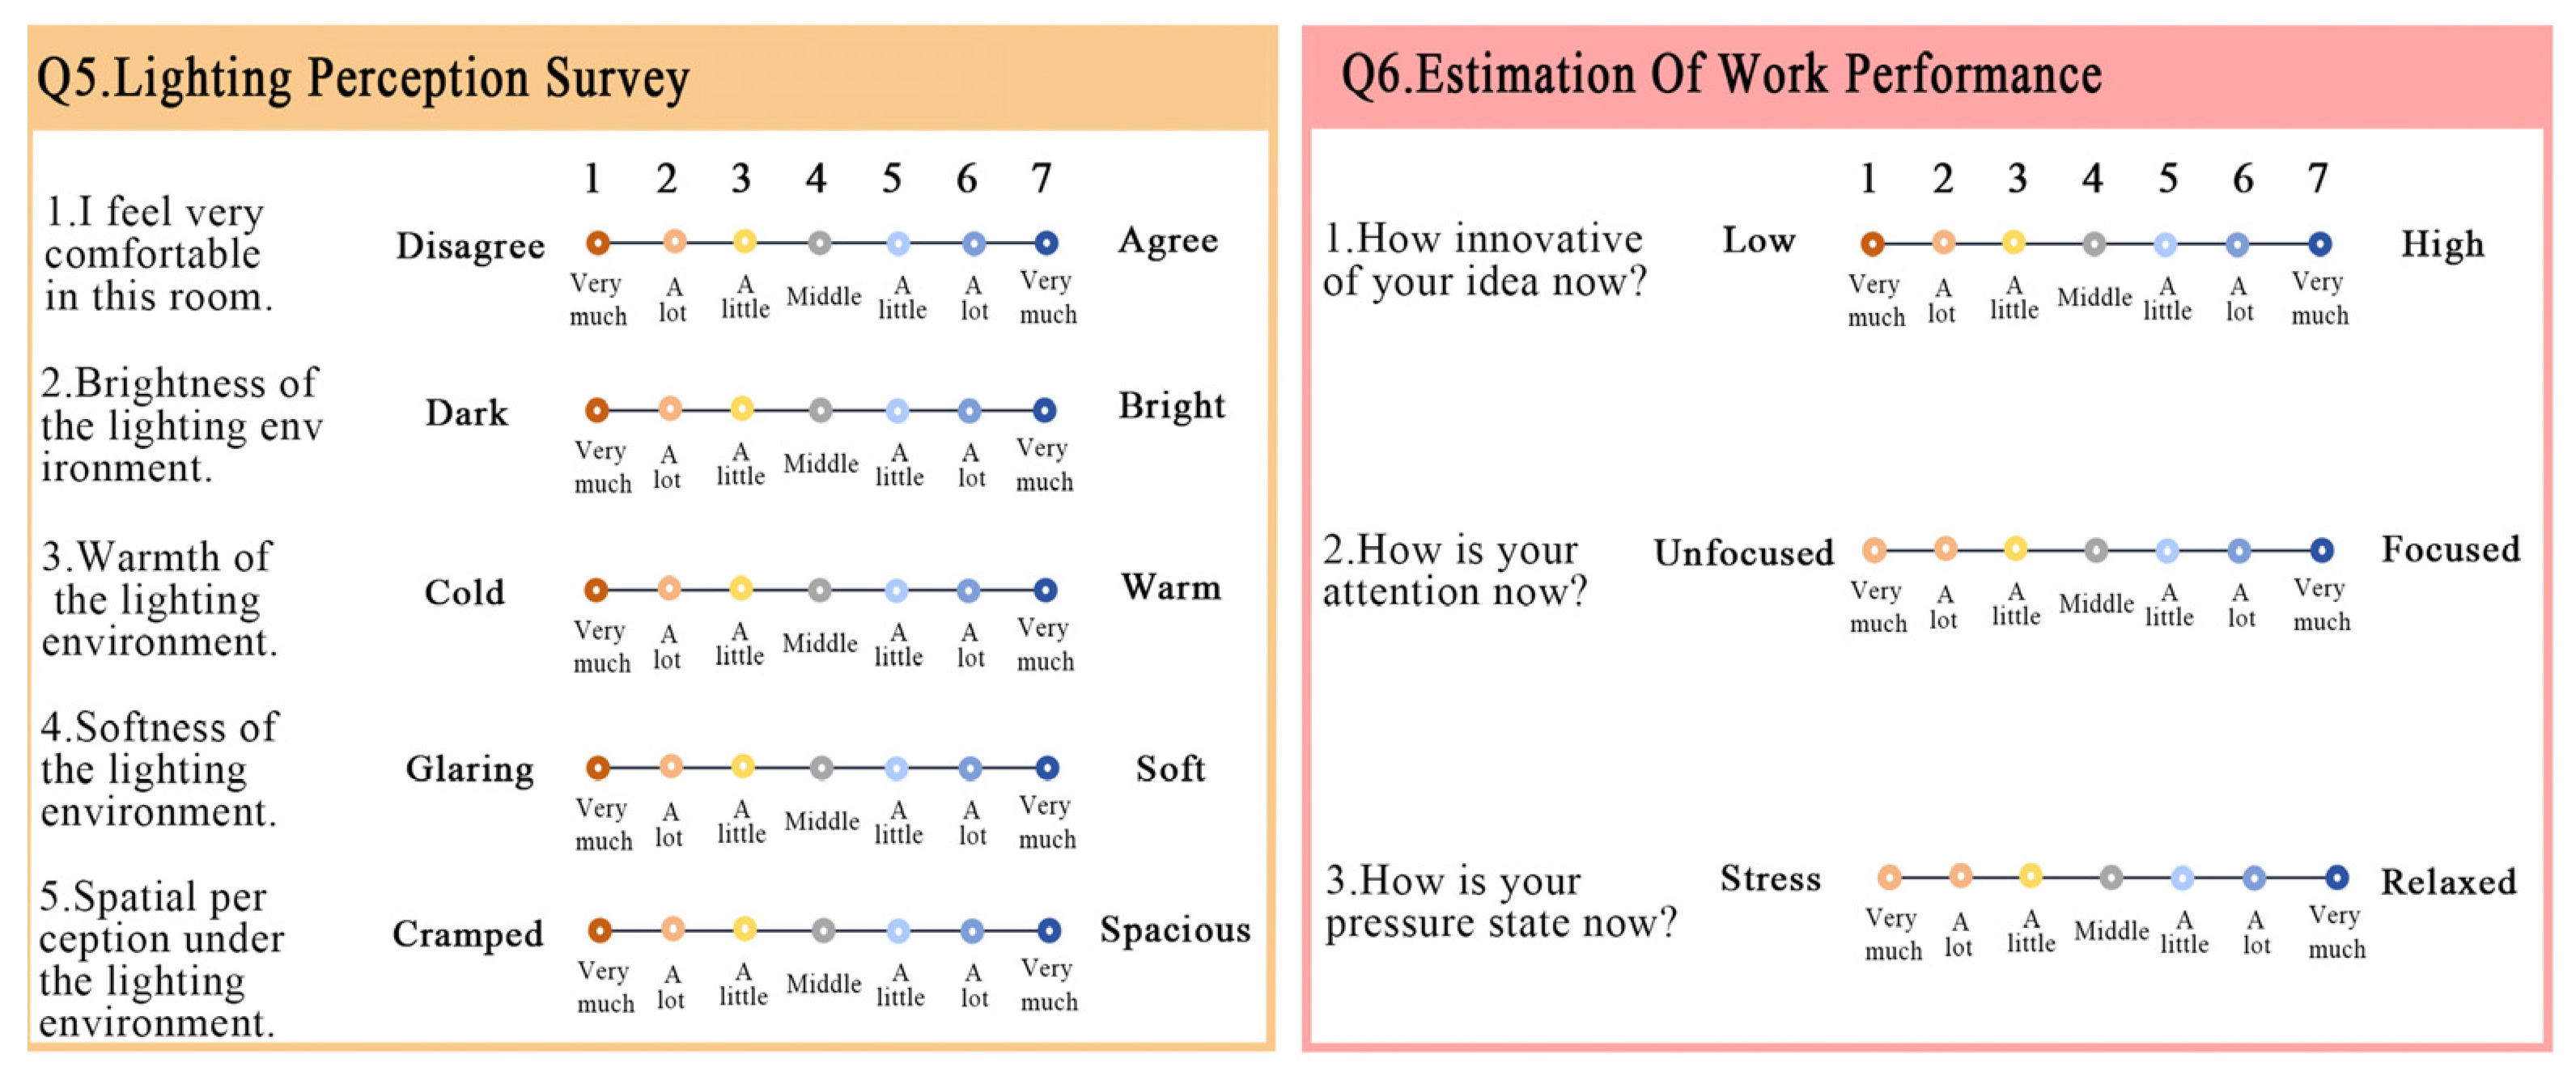
As shown in Figure 10, the lighting perception questionnaire investigated the comfort, brightness, warmth, and softness of the lighting environment, while the estimation of work performance examined the participants’ perceived level of creativity, attention during work, and stress levels. The participants’ ratings were made on a 7-point scale.
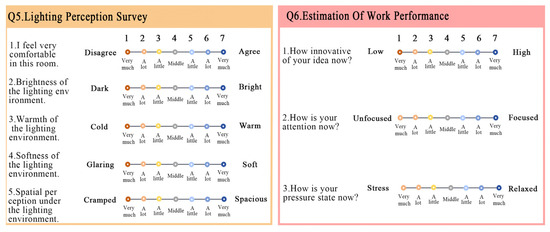
Figure 10.
Lighting evaluation item 2.
During the AUT and RAT, participants applied electrodes for the heart rate measures according to the instructions given by the experimenter (refer to Figure 8). To ensure data accuracy, the participants were required to ensure they had adequate sleep the night before the experiment. The collection of HRV data was conducted using Ergo LAB 3.0 software, which collected the LF/HF ratio (the low-frequency to high-frequency power ratio) for data analysis. Data in the low-frequency (LF: 0.04–0.15 Hz) and high-frequency (HF: 0.15–0.40 Hz) bands, with power expressed in normalized units (n.u.), were collected, and the LF/HF power ratio was used in this study.
3.5. Results
3.5.1. Creative Performance
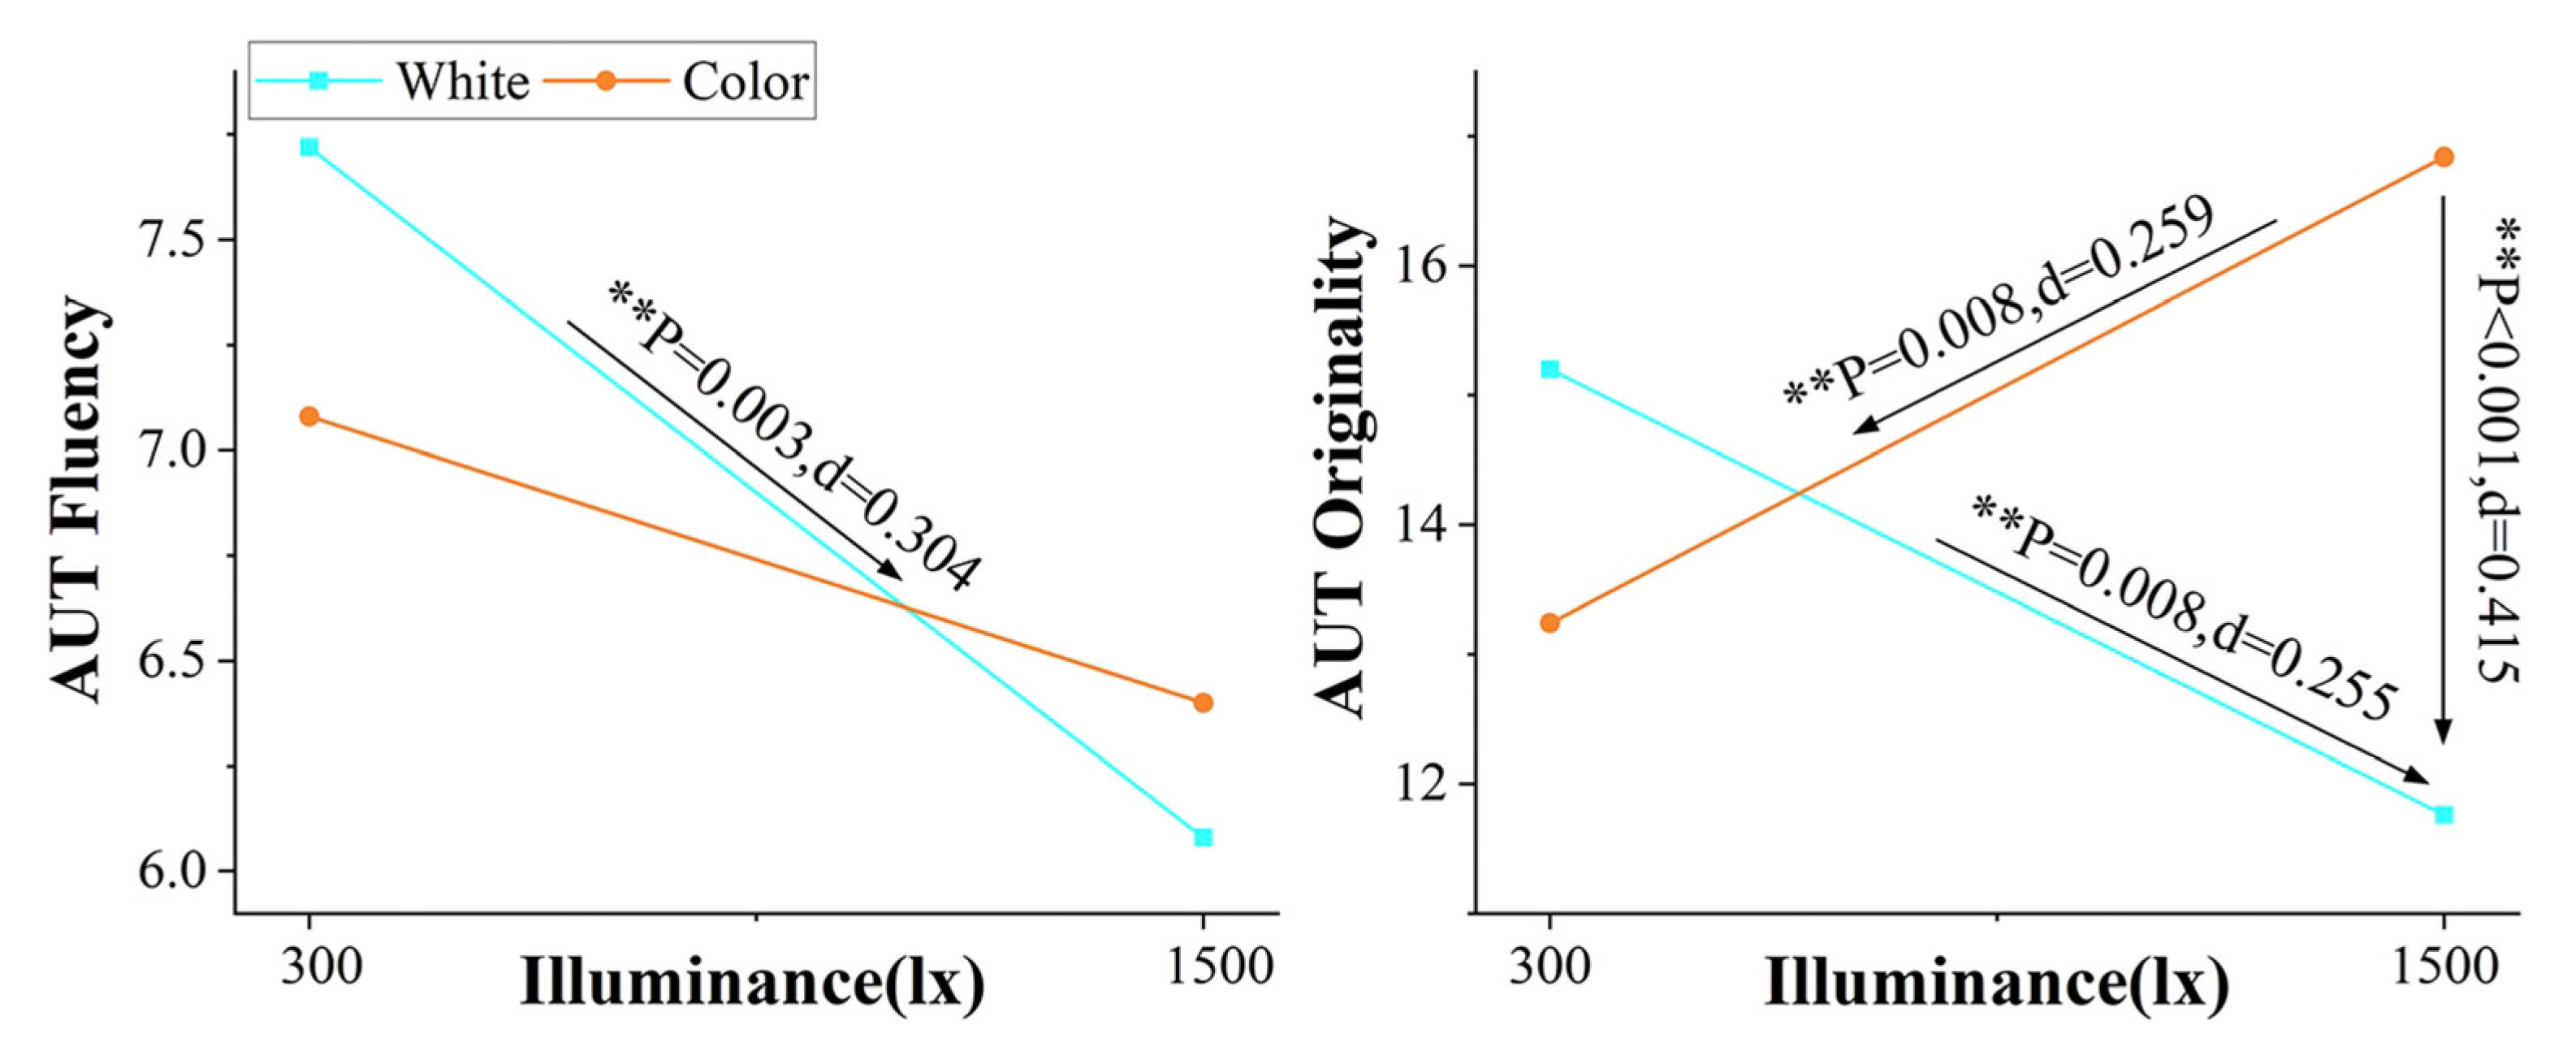
Table 4 reports the performance on the RAT and AUT under the four lighting conditions, revealing a significant main effect of illuminance on AUT fluency (p = 0.002, d = 0.343). Regarding AUT originality, the effect of the lighting color and the interaction effect of illuminance and the lighting color approached significance. Figure 11 shows that when white light was used, the AUT fluency score under low illuminance (300 lx) was higher than that under high illuminance (1500 lx). Moreover, the participants exhibited higher originality scores under high illuminance and orange lighting than under low illuminance or white lighting. In summary, when white lighting was used, the participants’ originality was higher under low illuminance; when colored light was used, the participants’ originality was higher under high illuminance.
Table 4.
The performance on creative tasks (mean ± standard deviation) under the four lighting conditions in Experiment D.
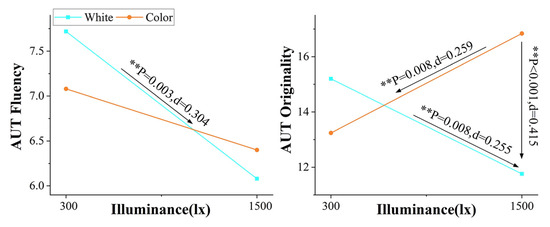
Figure 11.
The paired comparisons of the effects of lighting conditions on the AUT fluency and originality scores in Experiment D (p-values and effect sizes are shown, ** p < 0.01, * p < 0.05).
No significant main effects of illuminance or color, nor any interaction effects, were observed for AUT flexibility or RAT performance.
3.5.2. Mood
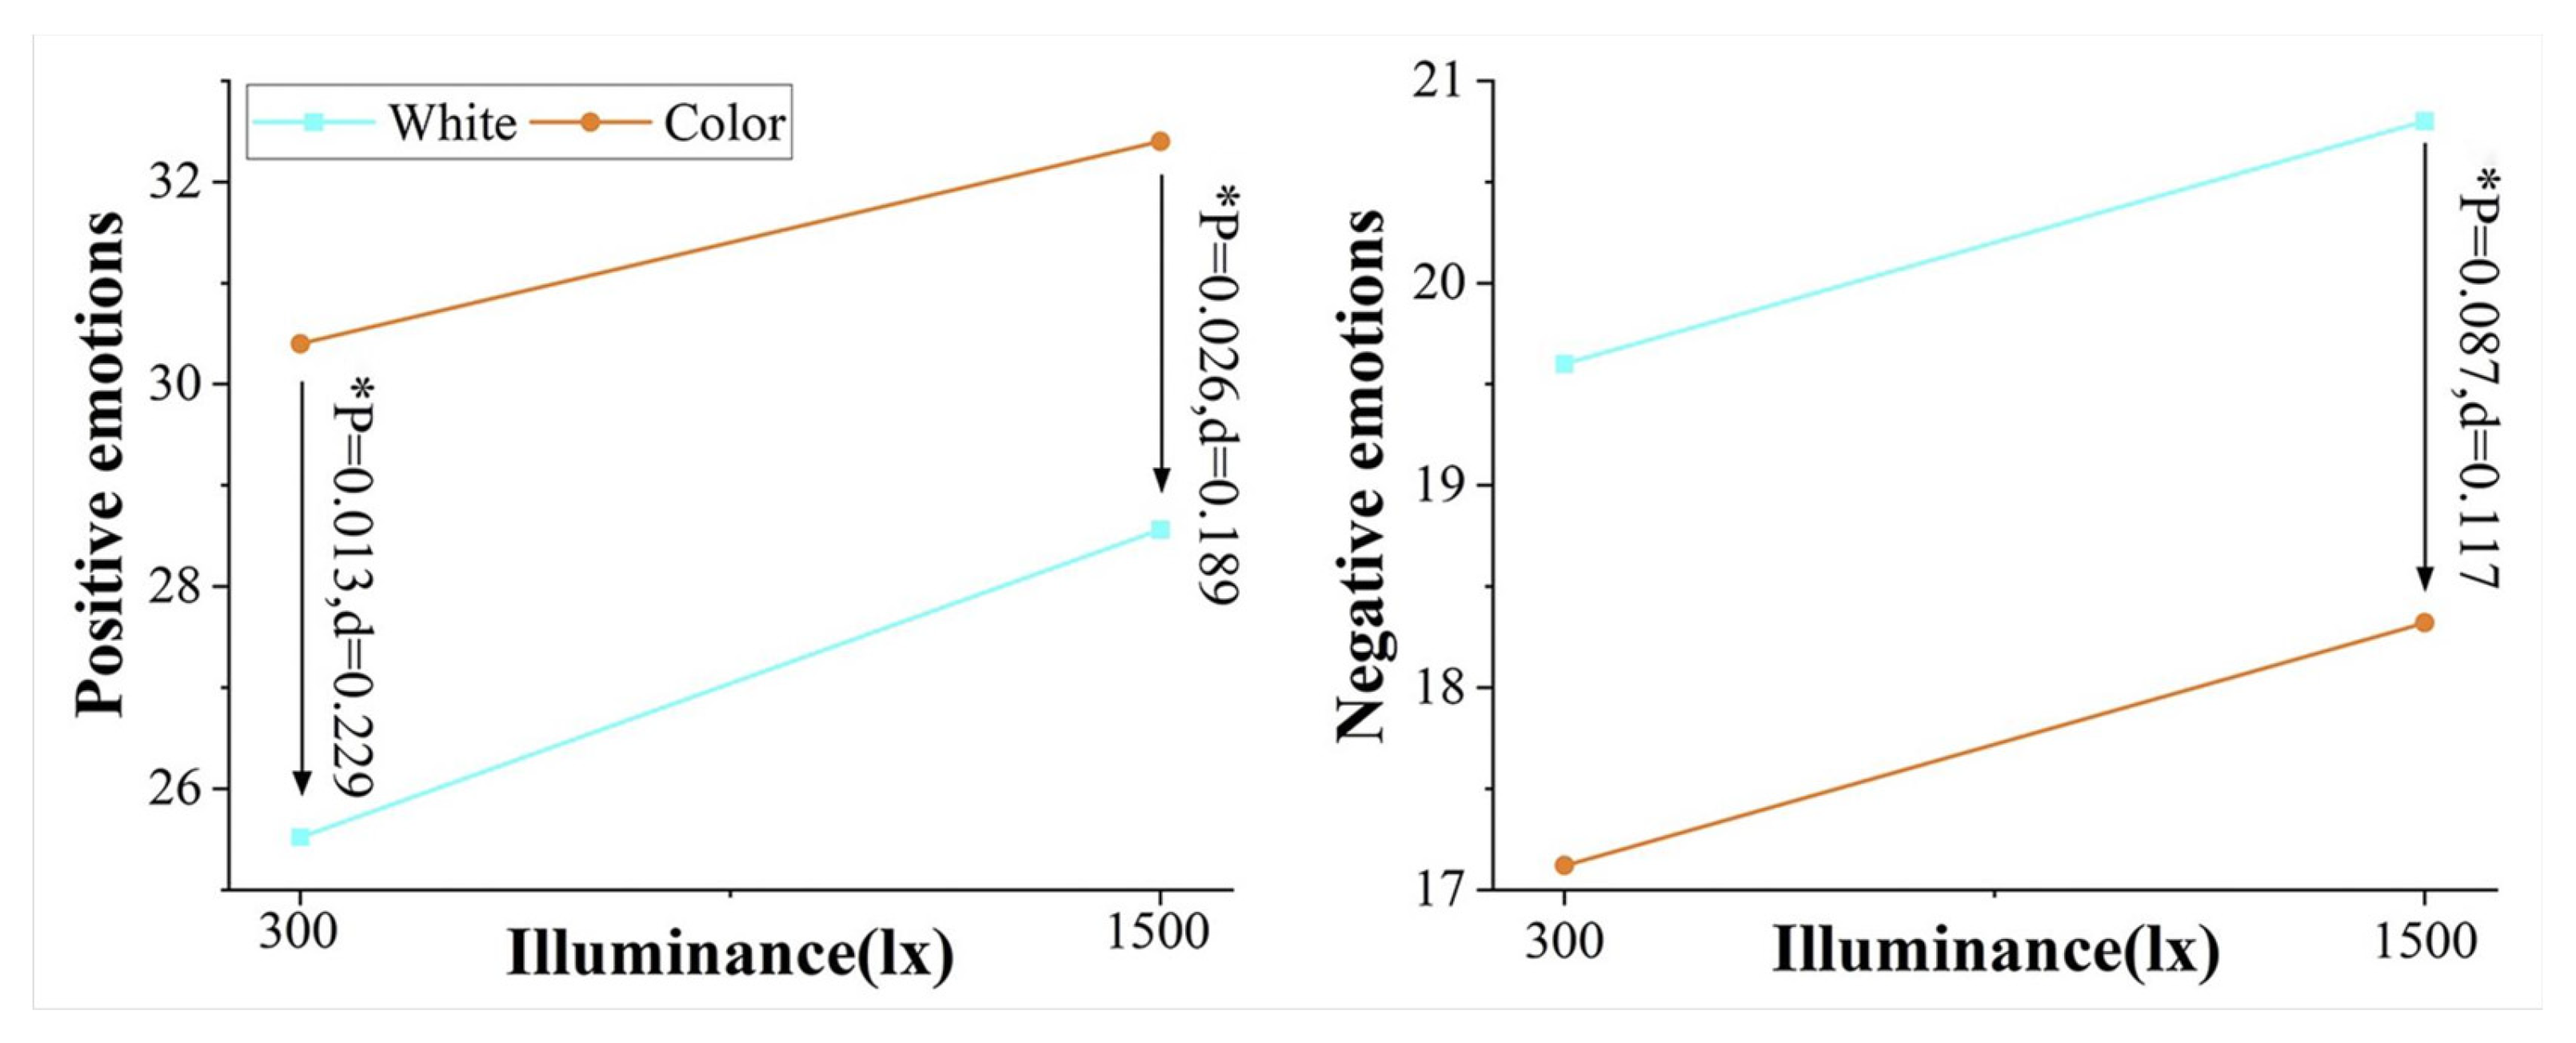
Table 5 reports the mood evaluation results under the four lighting conditions. A significant main effect of lighting color on positive mood was observed (p = 0.006, d = 0.277). However, no main effect of illuminance, nor any interaction effect between illuminance and color, was observed on positive affect. Figure 12 shows that the participants reported higher levels of positive affect under orange lighting than under white lighting, regardless of whether the illuminance was high or low.
Table 5.
The mood evaluation scores (mean ± standard deviation) under the four lighting conditions in Experiment D.
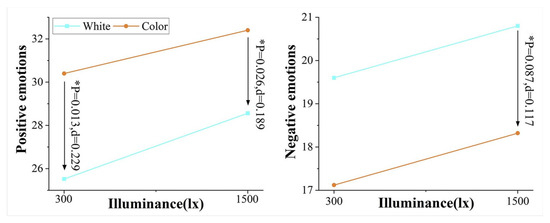
Figure 12.
The paired comparisons of the effects of lighting conditions on the mood evaluation scores in Experiment D (p-values and effect sizes are shown, ** p < 0.01, * p < 0.05).
No significant main effects of illuminance or light color, nor any interaction effects, were observed for negative affect.
3.5.3. Lighting Perception
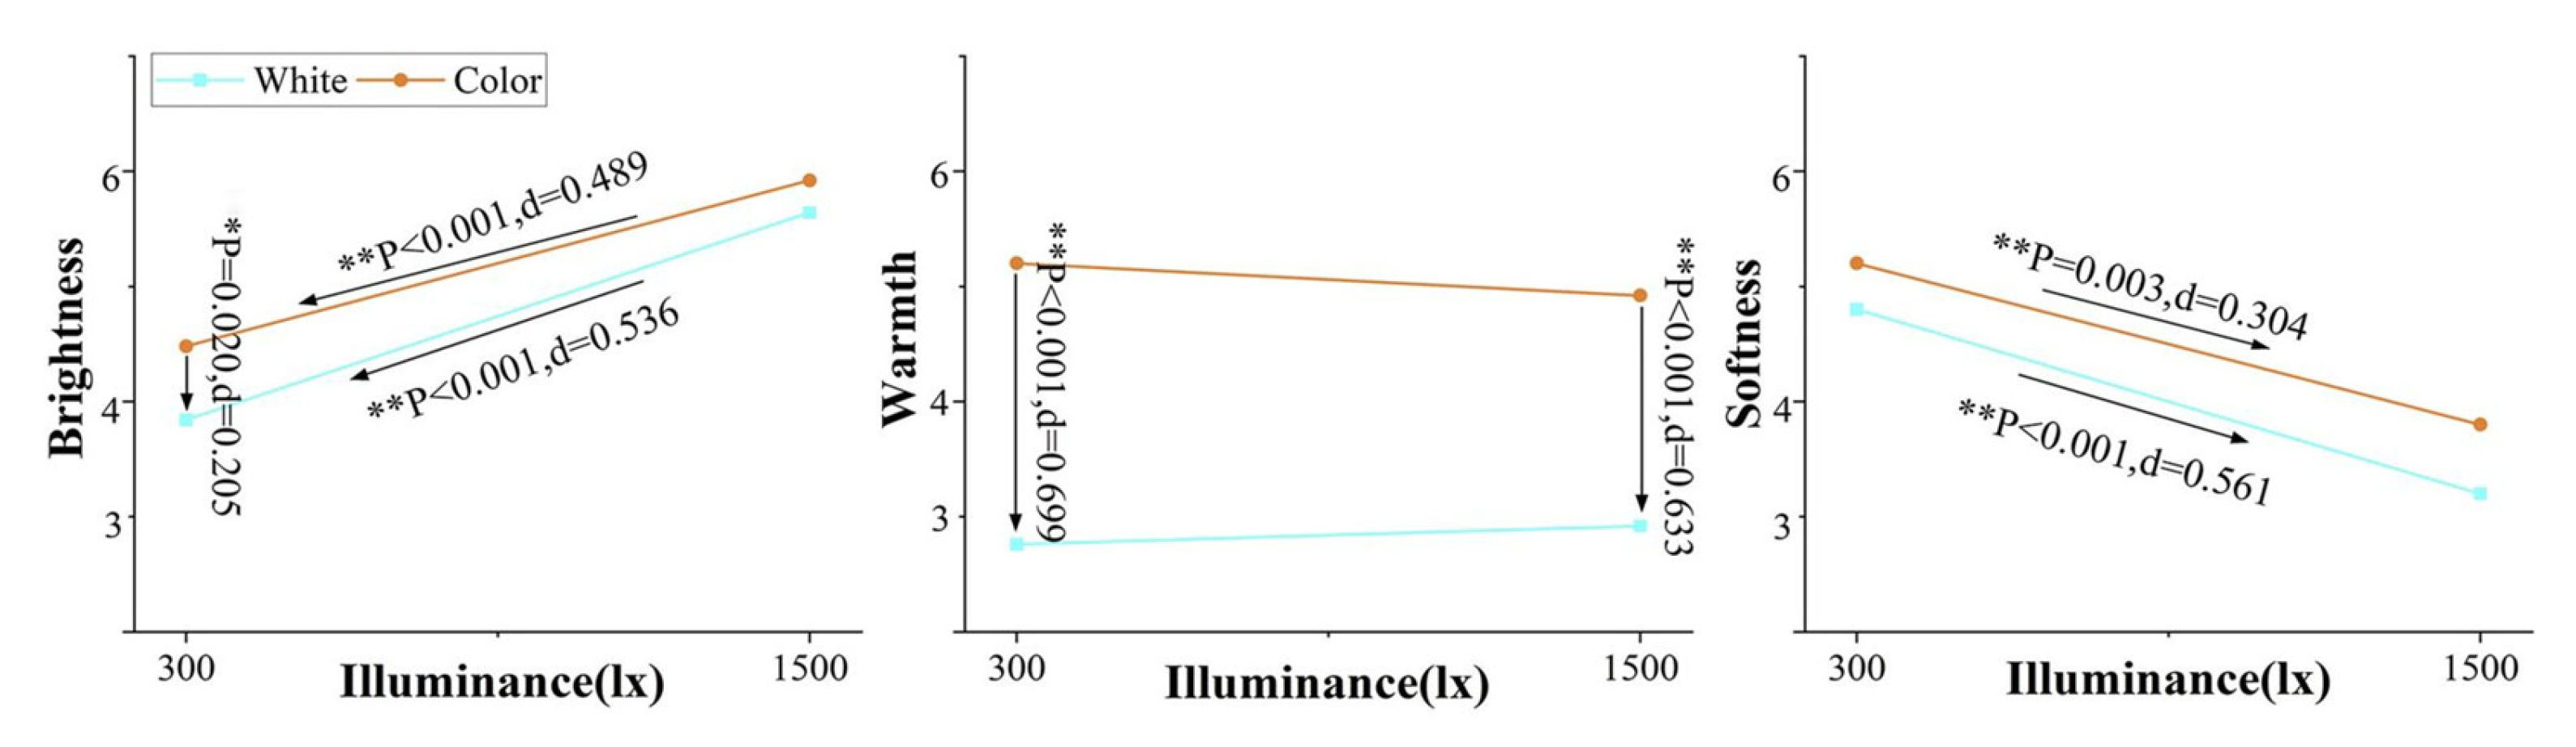
Table 6 reports the lighting perception results under the four lighting conditions in Experiment D. Significant main effects of illuminance on perceived brightness (p < 0.001, d = 0.564) and softness (p < 0.001, d = 0.534) were observed. Moreover, the effects of lighting color on perceived brightness (p = 0.034, d = 0.175), softness (p = 0.043, d = 0.159), and warmth (p < 0.001, d = 0.715) approached significance. According to Figure 13, the participants reported that the environment appeared brighter under high illuminance than under low illuminance. Furthermore, under low illuminance, orange lighting was rated significantly brighter than white lighting. Regarding warmth, orange lighting was rated significantly warmer than white lighting. Regarding softness, low illuminance was rated softer than high illuminance.
Table 6.
Lighting perception (mean ± standard deviation) under the four lighting conditions in Experiment D.
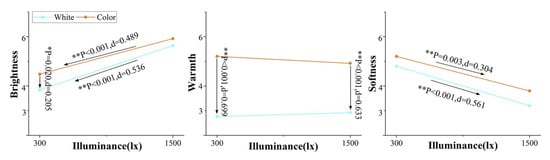
Figure 13.
The paired comparisons of the effects of lighting conditions on the brightness, warmth, and softness scores in Experiment D (p-values and effect sizes are shown, ** p < 0.01, * p < 0.05).
No significant interaction effects between illuminance and color were detected. These results highlight that an elevated illuminance enhances brightness but reduces softness, while warm-colored lighting amplifies perceived warmth.
3.5.4. Estimation of Work Performance
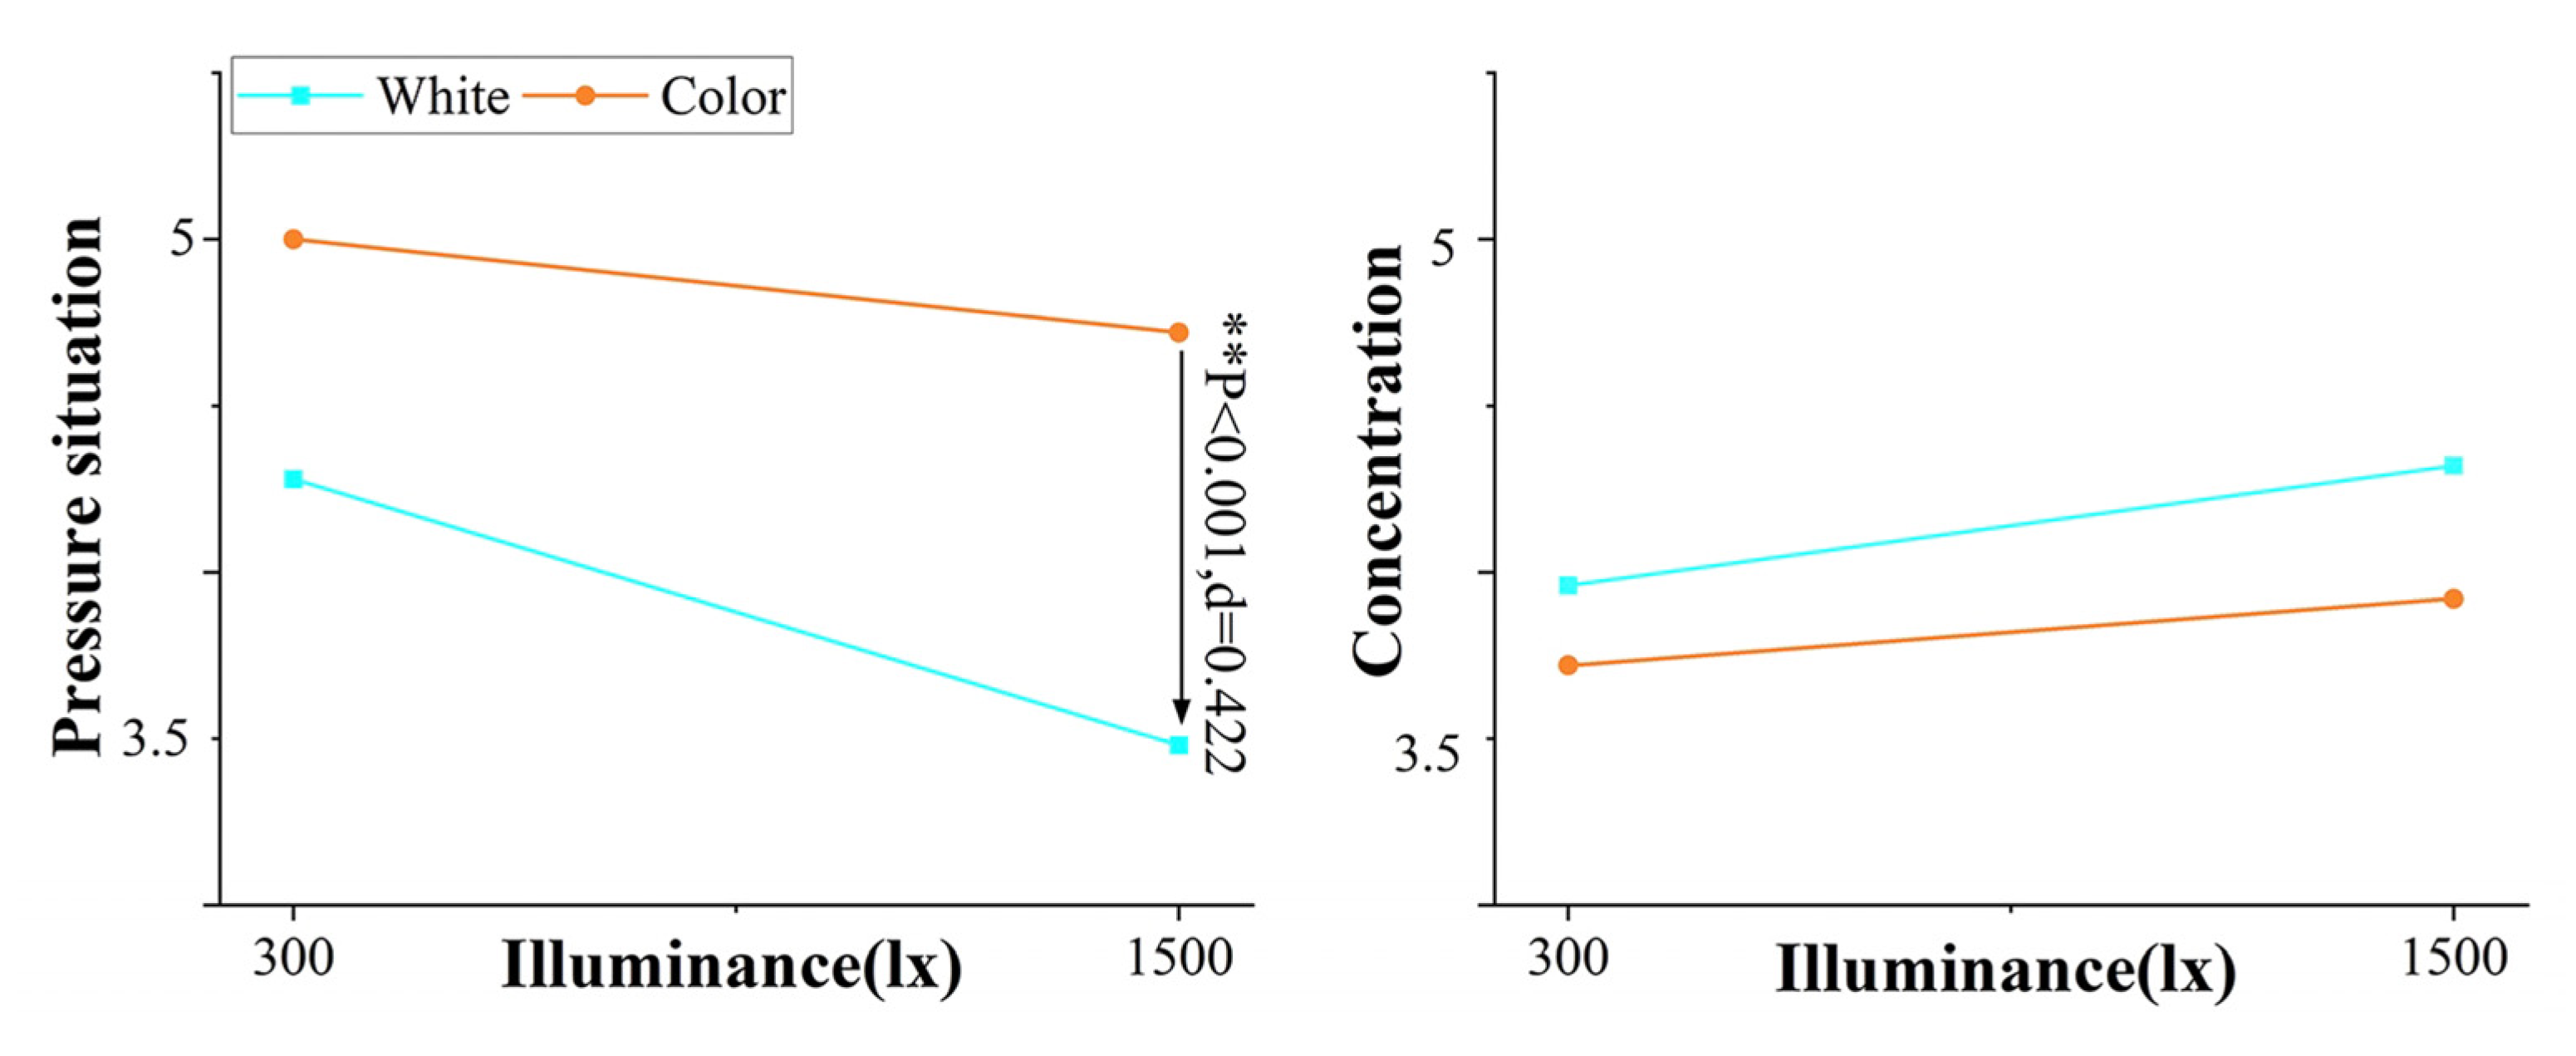
Table 7 reports the results of estimations of work performance, revealing a significant main effect of illuminance on pressure perception (p = 0.045, d = 0.158).
Table 7.
The estimation of work performance (mean ± standard deviation) under the four lighting conditions in Experiment D.
Figure 14 shows that under high illuminance, the participants felt significantly more relaxed under colored lighting than under white lighting (Y-axis: a value of 4 indicates neutrality, with values above 4 reflecting higher perceived relaxation and values below 4 reflecting increased pressure). Warm-colored lighting may amplify pressure perception, particularly under high illuminance.

Figure 14.
The paired comparisons of the effects of lighting conditions on the estimation of work performance in Experiment D (p-values and effect sizes are shown, ** p < 0.01, * p < 0.05).
No significant main effects of illuminance or lighting color, nor any interaction effect between illuminance and color, were observed on concentration.
3.5.5. Heart Rate Variability
The effects of illuminance and lighting color on HRV during creative tasks are shown in Table 8. No significant main or interaction effects of lighting conditions (300 lx vs. 1500 lx, white vs. orange lighting) were observed for LF, HF, or LF/HF ratios during either the AUT or RAT.
Table 8.
Heart rate variability (HRV) during creative tasks (mean ± standard deviation) under the lighting conditions in Experiment D.
Table 9 presents the Pearson correlations between AUT performance, mood, lighting perception, and estimations of work performance. AUT fluency and originality were found to have significant positive correlations with positive affect, while they were both weakly associated with pressure perception. Lighting perception metrics, including warmth, comfort, sense of space, and brightness, were strongly correlated with positive affect. Conversely, softness exhibited a negative correlation with negative affect. Estimations of work performance, such as innovative ideas and attention state, were positively linked to positive affect, whereas the pressure state was inversely correlated with negative affect.
Table 9.
The Pearson correlations among AUT performance, mood, lighting perception, and estimation of work performance in Experiment D.
These results indicate that, while HRV remains unaffected by lighting variations, positive emotional states and favorable lighting perceptions (e.g., warmth, brightness) are closely tied to enhanced creative performance and self-reported work productivity. When people feel that the lighting environment is warmer and more comfortable, positive affect is higher, while negative affect is lower, and creative performance is consequently improved. Although the classical HRV LF/HF index was not found to be correlated with creative performance, during the last minute of both the RAT and AUT, the LF and HF values were correlated with creative performance. This indicates that physiological activity is somewhat related to creativity, although the commonly used LF/HF indicator was not significant. This requires further research in the future.
3.6. Discussion
The results of the second part of this research indicate that creative performance is influenced by a combination of illuminance and light color. When using white light, fluency on the AUT was higher under low illuminance; in contrast, when using colored lighting, originality on the AUT was higher under high illuminance. This may not support the assertion that high illuminance is better for colored lighting. The findings may also be attributed to the fact that Experiment D was conducted in a larger laboratory, with better spatial perception under high illuminance. Furthermore, similar to the findings of Roslyakova et al. [54], an interaction effect of illuminance and colored light on AUT originality was observed. However, the research by Lan et al. indicated that cool lighting at high illuminance and warm lighting at low illuminance offer more advantages [27]. The findings of this study indicate that colored lighting has advantages under both high and low illuminance. To carry out a more detailed investigation, further research is needed to subdivide colored lighting [55]. For example, Xie et al. studied the effects of four groups of colored lighting (green, blue, red, yellow) on emotions and found that red lighting is more likely to evoke emotional changes such as tension, stability, and joy [56].
According to the correlational analysis, positive affect was found to be significantly related to fluency and originality on the AUT, as was the feeling of stress. This is similar to the findings of Chen et al. [57], which indicated that emotional intensity is beneficial for work performance. As Steidle [29] discovered, a lighting environment that feels more relaxed and free is more conducive to creativity. Additionally, similar to the findings of Zhu et al. [58], this study found that the warmth, comfort, brightness, and spatial perception of light are all significantly related to positive affect. The participants’ perceived levels of creativity, attention, and stress during work were also found to be significantly related to positive affect. The results demonstrate that the participants expressed higher positive affect and enhanced creative performance when they rated the lighting as warmer and more comfortable.
4. Discussion
Throughout the two parts of this research, the hypothesis that low illuminance helps to stimulate creativity was only validated under certain conditions. In Experiment A, the creative performance of the participants was poor at excessively low illuminance. This is contrary to the results of Steidle’s [29], which is probably due to difference in the light sources used in the two studies, as discussed in 2.6. Considering the wide application of LED [59], which was used in this study, we suggested that office lighting illuminance should not be lower than 300 lx. However, in Experiment C, when comparing 500 lx and 750 lx, the former showed an advantage. The explanation is that 500 lx falls within the comfortable lighting range, in which lower illuminance is more advantageous. Moreover, Experiment D demonstrated that fluency on the AUT was better under lower illuminance compared to white lighting. In summary, the conjecture that low illuminance is more conducive to enhancing creativity requires establishing a premise: in comparison with white light within a comfortable range (greater than 300 lx), low illuminance indeed enhances creativity.
This research investigated the effects of colored lighting on performance in creative tasks. It first verified the research conclusion by Kombeiz [44], that under the same desktop white lighting conditions, the addition of colored lighting to the spatial interface is more conducive to creativity. An interactive effect of illuminance and lighting color was revealed in Experiment D. When using colored lighting, originality on the AUT test was superior under high illuminance. However, this does not simply imply that high illuminance is more suitable, perhaps due to spatial perception and other factors. Overall, the test results for colored lighting revealed a significant advantage, with higher ratings of lighting perception and stronger positive emotions. The findings of this study differ slightly from those of Ishii et al. [60] and Lan [27] regarding color temperature as a variable. Lan found that both high and low color temperatures, under specific light intensity matches, such as cool light matching high illuminance and warm light matching low illuminance, are more beneficial for creativity. In the present study, blue light was used in Experiment B, while orange light was used in Experiments C and D. From the perspective of hue, both cool and warm colors were represented, but the results showed that creative performance was better under both blue and orange lighting. The results indicate that colored lighting has significant advantages. This represents a highly promising research direction for the future, and further studies involving additional variables such as hue, lightness, and chroma are needed.
The participants’ mood states were measured in both parts of this research. Although most mood indicators showed no significant differences in Part I, the data from Experiment A indicated a significant correlation between creativity and the feeling of freedom. Experiment B revealed a significant correlation between the lighting perception and the feeling of freedom. Our findings align with those of Butler, who pointed out that changes in lighting may lead to changes in emotional states, also resulting in cognitive changes [61]. Experiment D provided further validation of this assertion; positive affect and originality on the AUT were found to be better under colored lighting. Experiment D also revealed significant correlations between AUT creativity (originality, fluency) and positive affect. The estimation of innovative idea and the pressure state were found to be significantly correlated with emotions. This aligns with the conclusions of Li [62] and Aryani et al. [63], indicating that emotions have a significant moderating effect on the cognitive processes influenced by light exposure. However, in this experiment, the typical HRV index LF/HF was not correlated with creativity. According to the study by Smolders [64], HRV was most significant toward the end of the one-hour experimental light exposure, suggesting that the effect of light stimulation on human physiological rhythms requires a certain duration. It may be that the short duration of the experiments conducted in this study resulted in less noticeable physiological benefits. However, some indicators still showed a correlation (e.g., the HF value in the third minute of the AUT task was correlated with fluency and originality, and the HF value in the fifth minute of the RAT was significantly correlated with the RAT accuracy rate).
Despite the originality and contributions of the main findings, this study has a number of limitations. First of all, the sample of colored light should be expanded. This study focused on comparing white light with blue- and orange-colored lights, without involving more variations in hue, lightness, or chroma. Second, the testing duration in each lighting environment was limited; the experiments in Part I lasted about 20 min under each lighting condition, and the experiment in Part II lasted about 15 min under each condition. This is different from the actual working intensity of prolonged exposure in a workplace. Relevant research indicates that a significant impact of experimental lighting on physiological indicators (such as HRV) requires longer light exposure (1 h). Thirdly, human creativity testing includes various categories, such as divergent thinking, convergent thinking, scenario simulation, observation, and physiological and neurological testing. Due to time limitations, only a few commonly used creativity testing materials were selected for adoption in this study, and further research must be carried out to explore and validate the findings from multiple aspects. It is also worth noting that the ceiling color of the experiment room in this study was not standard white. Instead, luminaires were suspended from a higher black ceiling, which may affect the generalizability of the research results to interior spaces with conventional ceiling configurations. Finally, the participants in this study were art college students aged between 18 and 27, who may therefore differ to some extent from older individuals or those without an art background. Further, gender imbalance existed in certain experiments; for instance, Experiment B, included 8 males and 17 females, and Experiment C included 8 males and 16 females, which may have introduced some bias into the findings. In future research, the age range and academic backgrounds of the sample should be broadened, while also aiming to improve gender balance in the experimental design.
5. Conclusions
This study investigated the combined effects of lighting illuminance and colored lighting on creativity and mood. The following main observations were made:
- Low illuminance helps to stimulate innovation, provided that the lighting parameters are set within a comfortable white-light range;
- Compared to white lighting, colored lighting offers significant advantages in enhancing positive affect and stimulating creativity;
- A more liberated mood is significantly related to creativity, and individuals under lighting that stimulates more positive mood exhibit better creativity. From the perspective of the correlation between lighting perception and mood, a lighting environment that feels more relaxed, comfortable, and pleasant leads to a better mood and higher creativity;
- The findings of this study provide valuable implications for professional lighting design, particularly concerning illuminance and lighting color. In the context of lighting design for innovation-driven workspaces, the application of colored accent lighting is recommended when feasible, as both warm and cool hues contribute positively to creative outcomes. In some limited scenarios without colored lighting, lower illuminance levels (e.g., 300 lx) under comfortable white lighting conditions are more effective in enhancing creativity compared to higher illuminance.
Author Contributions
Conceptualization, Y.G. and H.H.; methodology, Y.G. and B.Z.; statistical data analysis, Q.R.; investigation, H.H. and Y.Z.; writing—original draft preparation, B.Z. and Y.Z.; writing—review and editing, L.P. All authors have read and agreed to the published version of the manuscript.
Funding
This research was funded by the Natural Science Foundation of Chongqing (Grant No. cstc2021jcyj-msxmX0868), the State Key Lab of Subtropical Building Science, South China University of Technology (Grant No. 2022ZB09), the Science and Technology Research Program of Chongqing Municipal Education Commission (Grant No. KJZD-K202201003), and the Key Youth Project of the Open University of Sichuan (Grant No. KTKYC2023006Q).
Data Availability Statement
The original contributions presented in this study are included in the article. Further inquiries can be directed to the corresponding author.
Acknowledgments
We would especially like to acknowledge the support of Ningbo SUNPU LED Co., Ltd. for providing the experimental instruments (dimmable LED tube lights) and thank the reviewers for their valuable feedback.
Conflicts of Interest
The authors declare no conflicts of interest.
Abbreviations
The following abbreviations are used in this manuscript:
| ILL | Illuminance |
| CCT | Correlated Color Temperature |
| TTCT | Torrance Test for Creative Thinking |
| AUT | Alternative Uses Task |
| RAT | Remote Associates Task |
| SPD | Spectral Power Distribution |
| HRV | Heart Rate Variability |
References
- Jiang, Y.; Chen, X.; Gao, C. The relationship between the spatial agglomeration of China’s creative industry and economic growth. Enterp. Econ. 2020, 2, 146–152. [Google Scholar] [CrossRef]
- Woodman, R.W.; Sawyer, J.E.; Griffin, R.W. Toward a theory of organizational creativity. Acad. Manag. Rev. 1993, 18, 293–321. [Google Scholar] [CrossRef]
- Amabile, T.M.; Conti, R.; Coon, H.; Lazenby, J.; Herron, M. Assessing the work environment for creativity. Acad. Manag. J. 1996, 39, 1154–1184. [Google Scholar] [CrossRef]
- Stein, M.I. Stimulating Creativity: Individual Procedures; Academic Press: New York, NY, USA, 2014. [Google Scholar]
- McKay, A.S.; Reiter-Palmon, R.; Coombes, S.M.T.; Coombs, J.E. A meta-analysis of creativity training in organizational settings. Creat. Innov. Manag. 2024, 33, 587–602. [Google Scholar] [CrossRef]
- Dul, J.; Ceylan, C. Work environments for employee creativity. Ergonomics 2011, 54, 12–20. [Google Scholar] [CrossRef] [PubMed]
- Lin, S.; Chang, H. Does open-plan office environment support creativity? The mediating role of activated positive mood. Creat. Stud. 2020, 13, 1–20. [Google Scholar] [CrossRef]
- Meinel, M.; Maier, L.; Wagner, T.F.; Voigt, K.-I. Designing creativity-enhancing workspaces: A critical look at empirical evidence. J. Technol. Innov. Manag. 2017, 1, 1–12. [Google Scholar]
- McCoy, J. Linking the Physical Work Environment to Creative Context. J. Creat. Behav. 2005, 39, 167–189. [Google Scholar] [CrossRef]
- Wu, Y.; Lu, C.; Yan, J.; Chu, X.; Wu, M.; Yang, Z. Rounded or angular? How the physical work environment in makerspaces influences makers’ creativity. J. Environ. Psychol. 2021, 73, 101546. [Google Scholar] [CrossRef]
- Wagner, M.; Growe, A. Creativity-enhancing work environments: Eventisation through an inspiring work atmosphere in temporary proximity. Raumforsch. Und Raumordn. Spat. Res. Plan. 2020, 78, 53–70. [Google Scholar] [CrossRef]
- De Paoli, D.; Sauer, E.; Ropo, A. The spatial context of organizations: A critique of ‘creative workspaces’. J. Manag. Organ. 2019, 25, 331–352. [Google Scholar] [CrossRef]
- Lukersmith, S.; Burgess-Limerick, R. The perceived importance and the presence of creative potential in the health professional’s work environment. Ergonomics 2013, 56, 922–934. [Google Scholar] [CrossRef] [PubMed]
- Mehta, R.; Zhu, R.; Cheema, A. Is noise always bad? Exploring the effects of ambient noise on creative cognition. J. Consum. Res. 2012, 39, 784–799. [Google Scholar] [CrossRef]
- Sicotte, H.; De Serres, A.; Delerue, H.; Ménard, V. Open creative workspaces impacts for new product development team creativity and effectiveness. J. Corp. Real Estate 2019, 21, 290–306. [Google Scholar] [CrossRef]
- Hoff, E.V.; Öberg, N.K. The role of the physical work environment for creative employees—A case study of digital artists. Int. J. Hum. Resour. Manag. 2015, 26, 1889–1906. [Google Scholar] [CrossRef]
- Knight, A.P.; Baer, M. Get up, stand up: The effects of a non-sedentary workspace on information elaboration and group performance. Soc. Psychol. Personal. Sci. 2014, 5, 910–917. [Google Scholar] [CrossRef]
- Ceylan, C.; Dul, J.; Aytac, S. Can the office environment stimulate a manager’s creativity? Hum. Factors Ergon. Manuf. Serv. Ind. 2008, 18, 589–602. [Google Scholar] [CrossRef]
- McCoy, J.M.; Evans, G.W. The potential role of the physical environment in fostering creativity. Creat. Res. J. 2002, 14, 409–426. [Google Scholar] [CrossRef]
- Lee, J.H.; Lee, S. Relationships between physical environments and creativity: A scoping review. Think. Ski. Creat. 2023, 48, 101276. [Google Scholar] [CrossRef]
- Liu, C.; Zhang, N.; Wang, Z.; Pan, X.; Ren, Y.; Gao, W. Correlation between brain activity and comfort at different illuminances based on electroencephalogram signals during reading. Build. Environ. 2024, 261, 111694. [Google Scholar] [CrossRef]
- Wessolowski, N.; Rahim, R.J. Is executive attention affected by environmental lighting conditions? PLoS ONE 2025, 20, e0305998. [Google Scholar] [CrossRef]
- Aliparast, S.; Onaygil, S. A Field Study of Individual, Energy-Efficient, and Human-Centered Indoor Electric Lighting: Its Impact on Comfort and Visual Performance in an Open-Plan Office Part 1. Buildings 2024, 14, 936. [Google Scholar] [CrossRef]
- Collier, J.M.; Wilkerson, A.; Durmus, D.; Rodriguez-Feo Bermudez, E. Studying response to light in offices: A literature review and pilot study. Buildings 2023, 13, 471. [Google Scholar] [CrossRef]
- Ru, T.; de Kort, Y.A.W.; Smolders, K.C.H.J.; Chen, Q.; Zhou, G. Non-image forming effects of illuminance and correlated color temperature of office light on alertness, mood, and performance across cognitive domains. Build. Environ. 2019, 149, 253–263. [Google Scholar] [CrossRef]
- Payedar-Ardakani, P.; Gorji-Mahlabani, Y.; Ghanbaran, A.H.; Ebrahimpour, R. Daylight illuminance levels, user preferences, and cognitive performance in office environments: Exploring an optimal illuminance range using virtual reality. Build. Environ. 2024, 258, 111638. [Google Scholar] [CrossRef]
- Lan, L.; Hadji, S.; Xia, L.; Lian, Z. The effects of light illuminance and correlated color temperature on mood and creativity. Build. Simul. 2021, 14, 463–475. [Google Scholar] [CrossRef]
- Jung, D.; An, J.; Hong, T. Exploring the relationship between office lighting, cognitive performance, and psychophysiological responses: A multidimensional approach. Build. Environ. 2024, 263, 111863. [Google Scholar] [CrossRef]
- Steidle, A.; Werth, L. Freedom from constraints: Darkness and dim illumination promote creativity. J. Environ. Psychol. 2013, 35, 67–80. [Google Scholar] [CrossRef]
- Chung, S.E. Effects of Lighting on Creative Performance. Ph.D. Thesis, Cornell University, Ithaca, NY, USA, 2015. [Google Scholar]
- De Vries, A.; Souman, J.L.; de Ruyter, B.; Heynderickx, I.; de Kort, Y.A.W. Lighting up the office: The effect of wall luminance on room appraisal, office workers’ performance, and subjective alertness. Build. Environ. 2018, 142, 534–543. [Google Scholar] [CrossRef]
- Kort, Y.D.; Smolders, K.C.H.J. Effects of dynamic lighting on office workers: First results of a field study with monthly alternating settings. Light. Res. Technol. 2010, 42, 345–360. [Google Scholar] [CrossRef]
- Martindale, C.; Hines, D. Creativity and cortical activation during creative, intellectual and eeg feedback tasks. Biol. Psychol. 1975, 3, 91–100. [Google Scholar] [CrossRef] [PubMed]
- Fink, A.; Neubauer, A.C. EEG alpha oscillations during the performance of verbal creativity tasks: Differential effects of sex and verbal intelligence. Int. J. Psychophysiol. 2006, 62, 46–53. [Google Scholar] [CrossRef] [PubMed]
- Fink, A.; Benedek, M.; Grabner, R.H.; Staudt, B.; Neubauer, C.A. Creativity meets neuroscience: Experimental tasks for the neuroscientific study of creative thinking. Methods 2007, 42, 68–76. [Google Scholar] [CrossRef]
- Yang, W.; Jeon, J.Y. Effects of correlated colour temperature of LED light on visual sensation, perception, and cognitive performance in a classroom lighting environment. Sustainability 2020, 12, 4051. [Google Scholar] [CrossRef]
- Studer, P.; Brucker, J.M.; Haag, C.; Van Doren, J.; Moll, G.H.; Heinrich, H.; Kratz, O. Effects of blue-and red-enriched light on attention and sleep in typically developing adolescents. Physiol. Behav. 2019, 199, 11–19. [Google Scholar] [CrossRef]
- Shahidi, R.; Golmohammadi, R.; Babamiri, M.; Faradmal, J.; Aliabadi, M. Effect of warm/cool white lights on visual perception and mood in warm/cool color environments. EXCLI J. 2021, 20, 1379. [Google Scholar]
- Xiao, J. Research on the Quantification Method of Light Color Preference in Landscape Lighting. Ph.D. Thesis, Tianjin University, Tianjin, China, 2008. [Google Scholar]
- Weitbrecht, W.; Bärwolff, H.; Lischke, A.; Jünger, S. Wirkung der Farbtemperatur des Lichts auf Konzentration und Kreativität. Fortschritte Der Neurol. Psychiatr. 2015, 83, 344–348. [Google Scholar] [CrossRef]
- Chen, X.; Zhang, X.; Du, J. Glazing type (colour and transmittance), daylighting, and human performances at a workspace: A full-scale experiment in Beijing. Build. Environ. 2019, 153, 168–185. [Google Scholar] [CrossRef]
- Wei, Y.; Zhang, Y.; Wang, Y.; Liu, C. A study of the emotional impact of interior lighting color in rural bed and breakfast space design. Buildings 2023, 13, 2537. [Google Scholar] [CrossRef]
- Gou, Z. Colourising daylight in buildings:Visual responses in a daylit room supplemented with colour-changing light-emitting diode luminaires. Indoor Built Environ. 2018, 27, 34–46. [Google Scholar] [CrossRef]
- Kombeiz, O.; Steidle, A. Facilitation of creative performance by using blue and red accent lighting in work and learning areas. Ergonomics 2018, 61, 456–463. [Google Scholar] [CrossRef] [PubMed]
- Estrada, C.A.; Isen, A.M.; Young, M.J. Positive affect improves creative problem solving and influences reported source of practice satisfaction in physicians. Motiv. Emot. 1994, 18, 285–299. [Google Scholar] [CrossRef]
- Subramaniam, K.; Kounios, J.; Parrish, T.B.; Jung-Beeman, M. A brain mechanism for facilitation of insight by positive affect. J. Cogn. Neurosci. 2009, 21, 415–432. [Google Scholar] [CrossRef] [PubMed]
- Yamada, Y.; Nagai, M. Positive mood enhances divergent but not convergent thinking. Jpn. Psychol. Res. 2015, 57, 281–287. [Google Scholar] [CrossRef]
- Zhan, J.; Jiang, S.; Luo, J. The angrier or the happier the more creative? The impact of anger and joy induction on creative problem-solving and divergent thinking. PsyCh J. 2020, 9, 864–876. [Google Scholar] [CrossRef]
- Du, Y.; Yang, Y.; Wang, X.; Xie, C.; Liu, C.; Hu, W.; Li, Y. A positive role of negative mood on creativity: The opportunity in the crisis of the COVID-19 epidemic. Front. Psychol. 2021, 11, 600837. [Google Scholar] [CrossRef]
- Yan, Y.H.; Guan, Y.; Tang, G.L. Experimental research of visual performance with differenet optical spectrum light sources. Adv. Mater. Res. 2012, 433, 6375–6383. [Google Scholar] [CrossRef]
- Yan, Y.H.; Lee, T.G.; Guan, Y.; Liu, X.D. Evaluation index study of students’ physiological rhythm effects under fluorescent lamp and LED. Adv. Mater. Res. 2012, 433, 4757–4764. [Google Scholar] [CrossRef]
- Hu, W.; Davis, W. Dimming curve based on the detectability and acceptability of illuminance differences. Opt. Express 2016, 24, A885–A897. [Google Scholar] [CrossRef]
- O’Carroll, D.C.; Warrant, E.J. Vision in dim light: Highlights and challenges. Philos. Trans. R. Soc. B Biol. Sci. 2017, 372, 20160062. [Google Scholar] [CrossRef]
- Roslyakova, S.; Laushkina, A.; Bragina, T.; Zemlyanova, E.; Basov, O. The influence of lighting system photometric characteristics on mental state of users. The case study of keyboard handwriting. In Proceedings of the GraphiCon 2021: 31st International Conference on Computer Graphics and Vision, Nizhny Novgorod, Russia, 27–30 September 2021; pp. 826–836. [Google Scholar]
- Golmohammadi, R.; Yousefi, H.; Khotbesara, N.S.; Nasrolahi, A.; Kurd, N. Effects of light on attention and reaction time: A systematic review. J. Res. Health Sci. 2021, 21, e00529. [Google Scholar] [CrossRef]
- Xie, X.; Cai, J.; Fang, H.; Tang, X.; Yamanaka, T. Effects of colored lights on an individual’s affective impressions in the observation process. Front. Psychol. 2022, 13, 938636. [Google Scholar] [CrossRef] [PubMed]
- Chen, R.; Tsai, M.-C.; Tsay, Y.-S. Effect of color temperature and illuminance on psychology, physiology, and productivity: An experimental study. Energies 2022, 15, 4477. [Google Scholar] [CrossRef]
- Zhu, Y.; Yang, M.; Yao, Y.; Xiong, X.; Li, X.; Zhou, G.; Ma, N. Effects of illuminance and correlated color temperature on daytime cognitive performance, subjective mood, and alertness in healthy adults. Environ. Behav. 2019, 51, 199–230. [Google Scholar] [CrossRef]
- Pattison, P.M.; Hansen, M.; Tsao, J.Y. LED lighting efficacy: Status and directions. Comptes Rendus Phys. 2018, 19, 134–145. [Google Scholar] [CrossRef]
- Ishii, H.; Kanagawa, H.; Shimamura, Y.; Uchiyama, K.; Miyagi, K.; Obayashi, F.; Shimoda, H. Intellectual productivity under task ambient lighting. Light. Res. Technol. 2018, 50, 237–252. [Google Scholar] [CrossRef]
- Butler, D.L.; Biner, P.M. Preferred lighting levels: Variability among settings, behaviors, and individuals. Environ. Behav. 1987, 19, 695–721. [Google Scholar] [CrossRef]
- Li, Y.; Ru, T.; Chen, Q.; Liu, Q.; Luo, X.; Zhou, G. Effects of illuminance and correlated color temperature of indoor light on emotion perception. Sci. Rep. 2021, 11, 14351. [Google Scholar] [CrossRef]
- Aryani, S.M.; Kusumawanto, A.; Suryabrata, J.A. The Effects of Lighting on Mood in the Workplace: A Literature Review of the Research Method Applied. Int. J. Des. Nat. Ecodyn. 2023, 18, 395–405. [Google Scholar] [CrossRef]
- Smolders, K.C.H.J.; de Kort, Y.A.W.; Cluitmans, P.J.M. A higher illuminance induces alertness even during office hours: Findings on subjective measures, task performance and heart rate measures. Physiol. Behav. 2012, 107, 7–16. [Google Scholar] [CrossRef]


Disclaimer/Publisher’s Note: The statements, opinions and data contained in all publications are solely those of the individual author(s) and contributor(s) and not of MDPI and/or the editor(s). MDPI and/or the editor(s) disclaim responsibility for any injury to people or property resulting from any ideas, methods, instructions or products referred to in the content. |
© 2025 by the authors. Licensee MDPI, Basel, Switzerland. This article is an open access article distributed under the terms and conditions of the Creative Commons Attribution (CC BY) license (https://creativecommons.org/licenses/by/4.0/).