1. Introduction
To accommodate the demands of rapid economic development, infrastructure construction in cold regions has significantly increased. Since the late 19th and early 20th centuries, piles have been widely adopted as deep foundations to resist frost damage in construction, transportation, and power transmission projects in China, Russia, the United States, and Canada [
1]. Although piles offer sufficient capacity when installed in frozen ground, their performance can deteriorate significantly due to freeze–thaw cycles, which control the variation and transition of their mechanical behavior [
2]. Nevertheless, the freeze–thaw-induced instability of piles remains a recurring issue in practical engineering applications. Field observations have revealed that the transmission tower foundations along the Qinghai–Tibet transmission line have experienced persistent frost heave and thaw settlement after construction [
3,
4]. On the 500 kV Yifeng transmission line, frost jacking caused cast-in-place piles beneath several towers to be uplifted by as much as 2 m [
5]. Belled piles are commonly employed to mitigate frost jacking, as their enlarged bases can counteract the uplift forces induced by frost [
6]. However, their construction requires extensive excavation, which can lead to considerable earthwork and potential environmental disturbances. Helical anchors represent a viable alternative because their helical plates enhance both tensile and compressive capacities by increasing the contact area with the surrounding soil compared with traditional piles. In addition, they offer rapid installation, immediate load-bearing capability, cost-effectiveness, and minimal noise and vibrations during deployment [
7,
8,
9,
10,
11]. In recent years, their application in cold-region electric power engineering has increased gradually [
12].
In recent years, the issues of foundation bearing capacity, frost jacking, and thaw settlement in permafrost and seasonally frozen soils have been extensively investigated through experiments [
13,
14,
15], field studies [
16,
17,
18,
19,
20], and numerical modeling [
21,
22,
23,
24]. In order to be understood clearly, the following basic terminology related to frost jacking throughout this paper is first introduced. Frost heave refers to the overall upward deformation of soil caused by the volumetric expansion of water during freezing. Frost jacking specifically denotes the upward displacement of foundations induced by frost heave. Thaw settlement describes the vertical subsidence that occurs after thawing, resulting from the phase transition of ice and subsequent drainage consolidation. Lu et al. [
13,
17,
18] focused on the effects of temperature on the bearing capacity of foundations. Tang et al. [
14] conducted physical model tests on isolated reinforced concrete foundations under varying temperatures to examine water migration, frost-heave force, and frost jacking characteristics. Wu et al. [
15] conducted model tests to investigate the influence of water at the pile base on pile stability in frozen soil, and found that the presence of water affects the distribution of freezing force and end resistance. Johnson performed field tests to measure the tangential frost-heave stress distribution on pipe piles, H-shaped piles, and concrete piles, and analyzed its correlation with temperature [
16]. Wen et al. [
19,
20] monitored stress and temperature at the base of conical belled piles in transmission lines located in permafrost regions and evaluated the effects of climate warming on foundation stability. Liu et al. [
21] developed a modified strain-softening model to characterize pile-frozen soil interaction, incorporating the effects of atmospheric pressure, subzero temperature, and moisture content based on experimental results. They further analyzed the temporal evolution of the temperature, volumetric ice content, displacement, and stress within the pile–soil system. Wang [
22] used COMSOL to simulate the long-term frost heave and thaw settlement displacements of smooth piles in permafrost regions. Gao [
23] analyzed displacement and stress in cone-column pile foundations under freeze–thaw cycles using thermo-mechanical coupling theory in ABAQUS. Hao et al. [
24] developed a thermos-hydro-mechanical coupled numerical model to study the influence of pile material (steel vs. concrete) on the freezing behavior of the pile−soil system under unidirectional freezing conditions.
Regarding the frost-jacking characteristics and bearing capacity of helical anchors in cold regions, various studies have employed field tests, model experiments, and numerical simulations. In permafrost regions, researchers have investigated the creep behavior and bearing capacity of helical anchors, revealing a relationship between their time-dependent response and creep parameters [
25,
26]. It was found that the creep displacement of piles in ice-rich soils significantly influences their ultimate bearing capacity [
27,
28]. The effects of temperature variations on the load transfer [
29] and uplift capacity [
30] of helical piles have also been examined. The complex geometry of helical anchors significantly influences their frost-jacking behavior. Wang et al. [
31,
32] conducted model tests to investigate the frost jacking behavior of screw piles and proposed a simplified method to predict their freezing response based on soil shear modulus. Liu et al. [
33] examined the effects of helix spacing on frost jacking and analyzed the anti-frost jacking performance of piles coated with asphalt of varying thicknesses. Chen [
34] employed the finite element method to analyze how geometric parameters of helical piles affect frost jacking behavior and the resulting soil failure modes. Tian [
35] investigated the influence of screw blades on frost-heave forces and proposed a simplified model for estimating the frost heaving force at the pile top of half-helix piles. Wang et al. [
36,
37] performed numerical simulations on the frost resistance and pull-out performance of photovoltaic screw piles in seasonally frozen regions using thermodynamic and coupled moisture-temperature-stress models. They incorporated frozen soil strength correction factors into existing uplift capacity formulas to improve frost-resistance estimations. The results indicated that during frozen soil thawing, increases in pore water pressure lead to decreases in undrained strength and stiffness, thereby significantly reducing the uplift capacity of piles.
The above studies have mainly focused on the freezing or thawing processes of piles and helical anchors, while few studies have addressed their vertical displacement and stress behavior under repeated freeze–thaw cycles. Moreover, in numerical simulations of such cycles, the soil is often simplified as an elastic material [
34,
37,
38], and the anchor–soil interaction is commonly represented by tie contact [
34], frictional contact [
38], or cohesion-friction contact models [
35,
38]. These simplifications may not accurately capture the large deformations involved in the repeated freeze–thaw processes. As a result, the current understanding of the stress and displacement behavior of helical anchors under such conditions remains limited.
To bridge this knowledge gap, this study investigates the influence of geometric parameters on the displacement behavior of helical anchors during freeze–thaw cycles through both physical model tests and numerical analysis. Particular attention is paid to whether anchors with similar uplift capacities exhibit comparable resistance to frost jacking. In the numerical model of the anchor–soil system, the Mohr−Coulomb elastic-perfectly plastic model is used for the soil, and a cohesion-damage-friction interface model is applied to simulate the anchor–soil interaction, aiming to better capture the soil shear behavior and contact mechanics. The evolution of displacement, frost-heave stress, and load transfer in helical anchors during freeze–thaw cycles is analyzed to assess the influence of anchor geometry on frost-heave resistance. This study offers a reference for the stability assessment and design of helical anchors in seasonally frozen soils.
2. Freeze–Thaw Cycle Model Test
2.1. Test Program and Preparation
The experimental program examines the influence of geometric dimensions such as the number of helical plates, helix spacing, and helix diameter. The geometric specifications of the helical anchors are listed in
Table 1. The anchor rod is made of stainless steel with a wall thickness of 3 mm. Each helical plate is 1 mm thick, has a pitch of 0.3
D (where
D is the helix diameter), and is welded to the anchor rod. The burial depth
H of the lowest helix for all anchors is maintained at 700 mm. The geometric parameters are defined in
Table 1, and the anchor models are shown in
Figure 1a.
The ultimate uplift capacities
Qt were first determined using pull-out tests conducted in dry silty sand. A unilateral freezing method was employed by setting the top cover of the freeze–thaw cycle box to −20 °C, freezing the soil for approximately 50 h—sufficient to maintain a stable soil temperature for two hours without further cooling—after which the boundary temperature was raised to 15 °C for thawing. Freeze–thaw tests were carried out using a simulated cold environment system that includes a cold bath circulation unit (Thermo Haake A40) and a unilateral freeze–thaw box with a coolant circulation range of −40 °C to 30 °C at the top cover, as shown in
Figure 1b. The inner dimensions of the box are 1.5 m × 1.5 m × 1.5 m, with five pre-drilled holes in the top cover for connecting the anchor rods to external displacement transducers. These holes are sealed prior to testing. The distance between the edge holes and the adjacent sidewalls is 300 mm. The anchors are pre-embedded in the soil, and their layout is shown in
Figure 1c. The spacing between adjacent anchors and between each anchor rod and the box wall is not less than 6
D, in order to satisfy the boundary conditions required for the freeze–thaw cycle tests [
23].
Silty sand was used in the experiment, with maximum and minimum dry densities of 1.82 g/cm3 and 1.47 g/cm3, respectively, and a specific gravity of 2.7. The soil freezing temperature was −0.3 °C. A dry soil sample with a relative density of 0.84 was prepared using the layered compaction method. Vaseline was applied to the inner wall of the test chamber to ensure good contact and lubrication between the soil and the chamber wall, thereby minimizing boundary effects. Based on a relative density of 0.84, the required dry soil mass ms and the corresponding water mass mw to achieve the target saturation were calculated for a 30 cm thick soil layer. Dry soil was poured into the test chamber, approximately 70% of mw was sprayed uniformly, and compaction was performed using a rubber hammer. After the soil layer reached a height of 30 cm, the surface was leveled and the remaining 30% of the mw was sprayed. At this stage, the anchor was installed to ensure vertical alignment. Subsequently, additional soil layers, each 20 cm thick, were added and compacted using the same procedure until the desired height was reached. The surface of the soil was then leveled, and the test chamber was covered with plastic film and allowed to sit for ten days to ensure adequate moisture migration within the soil.
The temperature was measured using PT-100 sensors with an accuracy of ±0.1 °C. The sensors were attached to the rod of anchor 3# at 10 cm intervals from the ground surface, with four measurement points labeled as TP1 to TP4. The vertical displacement at the top of the anchors was measured using a WY-10 displacement transducer with an accuracy of ±0.0025 mm and a measurement range of 10 mm.
2.2. Testing Process
First, pull-out tests were conducted on helical anchors embedded in dry silty sand using MTS hydraulic actuators under displacement-controlled loading. Two parallel tests were conducted for each anchor, and the resulting load-displacement curves are shown in
Figure 2. The ultimate uplift capacity
Qt for each anchor was determined from the peak of the load-displacement curve. The average values of
Qt and the corresponding displacements
up for each anchor are presented in
Table 2.
Double-helix anchors 2# and 5#, with the same embedment depth as the lowermost helix and helix diameter, exhibited similar uplift capacities. The uplift capacity of anchor 5#, with a larger helix spacing, was 11.4% higher than that of anchor 2#. This suggests that the two helices of anchor 2# interact, thereby reducing the independent contribution of each helix to the overall capacity of the sensor.
Subsequently, a freeze–thaw cycle test was initiated, starting with a freezing temperature of −20 °C. The temperatures at measurement points TP1 to TP4 were recorded every two hours. The cooling process was terminated once the temperatures at all the measurement points remained constant for two hours. The temperature was then adjusted to 15 °C to initiate the thawing process. Once the bottom sensor temperature approached its initial value, the cooling system was turned off. The displacement at the top of the anchor was recorded every hour.
2.3. Test Results and Development Rule of Freeze–Thaw Displacement
2.3.1. Temperature Field and Frost Depth
Figure 3a shows the temperature variations at the measurement points during the freeze–thaw cycle. The temperature profiles at each measuring point are similar, exhibiting a rapid decline during the initial stage. After approximately 40 h, the rate of temperature change gradually decreases, and the curves tend to flatten. The temperature data from TP1, TP2, and TP3 were selected to calculate the freezing depth z
f based on Lagrange interpolation, as shown in Equation (1). The evolution of the frost depth is shown in
Figure 3b. The maximum frost depth z
fmax is approximately 18.3 cm, accounting for 26% of the anchor embedment depth.
where,
Tf is the freezing temperature,
zi is the depth of the temperature point,
Ti and
Tk are the instantaneous temperature of different points.
2.3.2. Displacement Development During Freeze–Thaw Cycle
Figure 4 shows the displacement evolution of the anchors during the freeze–thaw cycle. Each anchor gradually began to undergo frost jacking after 8 h of cooling, corresponding to a frost depth of 0.2 cm. With increasing frost depth, the jacking displacement also increases progressively. The displacement curve can be divided into three stages: a stage of rapid linear growth (8–23 h), a phase of moderate growth (23–31 h), and a plateau stage (31–40 h). The jacking displacement of the small-diameter anchors (1#, 2#, 3#, and 5#) ranges from 1.43 mm to 2.26 mm, while that of the large-diameter anchor (4#) is 1.51 mm.
During the soil thawing stage, the displacement of each anchor begins to decrease after 3–5 h of heating. The jacking displacement decreases approximately linearly and eventually stabilizes. After complete soil thawing, a residual displacement ur remains for each anchor. The residual displacement ur of small-diameter anchors ranges from 0.09 mm to 1.2 mm, while that of the large-diameter anchor is 1.05 mm. The ratio of the residual displacement to the maximum frost jacking ranges from 0.48 to 0.60. The order of frost jacking magnitude and residual displacement is as follows: 1#, 4#, 2#, 5#, and 3#.
Freeze–thaw displacement generally correlates with the uplift capacity of the anchor in unfrozen soil. Anchors with greater uplift capacities in unfrozen soil tend to exhibit smaller frost jacking and residual displacements. However, although anchor 5# has slightly higher uplift capacity than anchor 2#, it exhibits greater freeze–thaw displacement. This indicates that smaller helix spacing helps mitigate frost jacking. This effect is further analyzed in the numerical simulation section.
3. Numerical Model and Verification
A coupled thermal-mechanical model for anchor–soil interaction under repeated freeze–thaw cycles was developed using ABAQUS. The model integrates the heat conduction and stress equilibrium equations. The soil strain induced by temperature variation is characterized by the thermal expansion coefficient
α of the soil. The detailed computational procedure is described in [
37]. The soil domain, anchor–soil interaction model, and relevant simulation parameters employed in the analysis are introduced below.
3.1. Soil and Anchor Model
An elastic-perfectly plastic Mohr–Coulomb model was adopted for the soil. The modulus, Poisson’s ratio, and strength change with negative temperature, as described by the following formula [
39]:
where
a1 and
a2 are the modulus and Poisson’s ratio for unfrozen soil,
b1,
b2, and
m are fitting parameters according to the laboratory data. They are determined based on triaxial tests for similar soil [
40].
a1 = 9.0 MPa,
b1 = 32.5,
a2 = 0.30,
b2 = −5.0 × 10
−3,
m = 0.6.
During the freeze–thaw process of soil, the cohesion
c and internal friction angle
ϕ vary with temperature. According to the results of direct shear tests on silt during the freeze–thaw cycle [
41], the strength parameters can be expressed by Equations (4) and (5) when temperature
T is less than the freezing temperature
Tf. When
Tf is greater than −0.3 °C,
c and
ϕ are 5 kPa and 20°, respectively.
The soil volumetric heat capacity
Cs, and thermal conductivity
λs are expressed in a simplified form as follows:
where Δ
Tf is the temperature range for the phase change (from unfrozen to frozen), Δ
Tf = 0.7 °C; The subscripts “u” and “f” represent the unfrozen state and frozen state, respectively,
Csu = 2.50 kJ/(m
3·°C),
Csf = 2.07 kJ/(m
3·°C),
λsf = 2.18 W/(m·°C),
λsu = 1.69 W/(M·°C) [
42].
The thermal expansion coefficient
α is used to simplify the soil frost heave phenomenon, which varies with the soil volumetric strain
εv [
37], as shown in Formula (6). The relationship between the volumetric strain
εv and temperature
T is based on previous laboratory test results [
37], as listed in
Table 3.
The helical anchor is made of steel and has less deformation than the soil; therefore, it is assumed to be linear elastic with a density, ρ of 7.85 g/cm3, Young’s modulus, Ep of 206 GPa, and Poisson’s ratio, v of 0.3. The thermal conductivity λp and volumetric heat capacity Cp of the anchor are set to 50 W/(m °C) and 0.46 kJ/(m3 °C), respectively.
3.2. Anchor–Soil Interface Model
The freezing strength at the interface between the anchor and frozen soil consists of both cohesion and friction, and the choice of the interface model is crucial for establishing a reliable numerical simulation. Due to the presence of ice adhesion at the interface between the frozen soil and structures, the interface shear behavior typically exhibits strain-softening characteristics, as illustrated in
Figure 5. Traditional models assume that the interfacial shear strength is governed solely by temperature-dependent cohesion and friction coefficients [
37], which fail to capture the strain-softening behavior caused by the rupture of the ice bond during shear. Chen et al. [
43] developed a cohesion-damage-friction model and captured the interfacial behavior of frozen soil and concrete accurately. Therefore, in this simulation, a coupled cohesion-damage-friction model was adopted to represent the interface behavior of the steel pile and frozen soil. This model is implemented in ABAQUS as follows: in the initial stage of interface shearing, the cohesive contact is active while frictional contact is inactive, and the shear stress at the interface increases linearly. Damage begins to develop as the relative displacement initiates at the interface. The frictional contact is then activated and acts jointly with the cohesive contact to resist the shear. As damage continues to accumulate, the interfacial bonding material (e.g., ice membrane) progressively fails, and the interface transitions to a sliding state. At this stage, the shear stress is entirely resisted by frictional contact, and the cohesive contribution is completely degraded.
To obtain the anchor–soil interface parameters, interface shear tests between steel piles and silty sand were conducted using a modified temperature-controlled triaxial compression apparatus. The diameters of the steel pile and soil column are 25 mm and 61.8 mm, respectively. The soil column has the same density and moisture content as the silty sand used in the helical anchor model test. The interface shear curves between the pile and silty sand are shown in
Figure 6. It can be observed that temperature has a more significant impact on the ultimate freezing strength (
τp) than the confining pressure (
σ3), as the ice film at the pile−soil interface during freezing governs the interface strength through bonding. The shear curves exhibit characteristics similar to those of the “cohesion-damage-friction” model. Based on the test data, the parameters for the contact model are determined and are listed in
Table 4.
3.3. Boundary and Initial Conditions
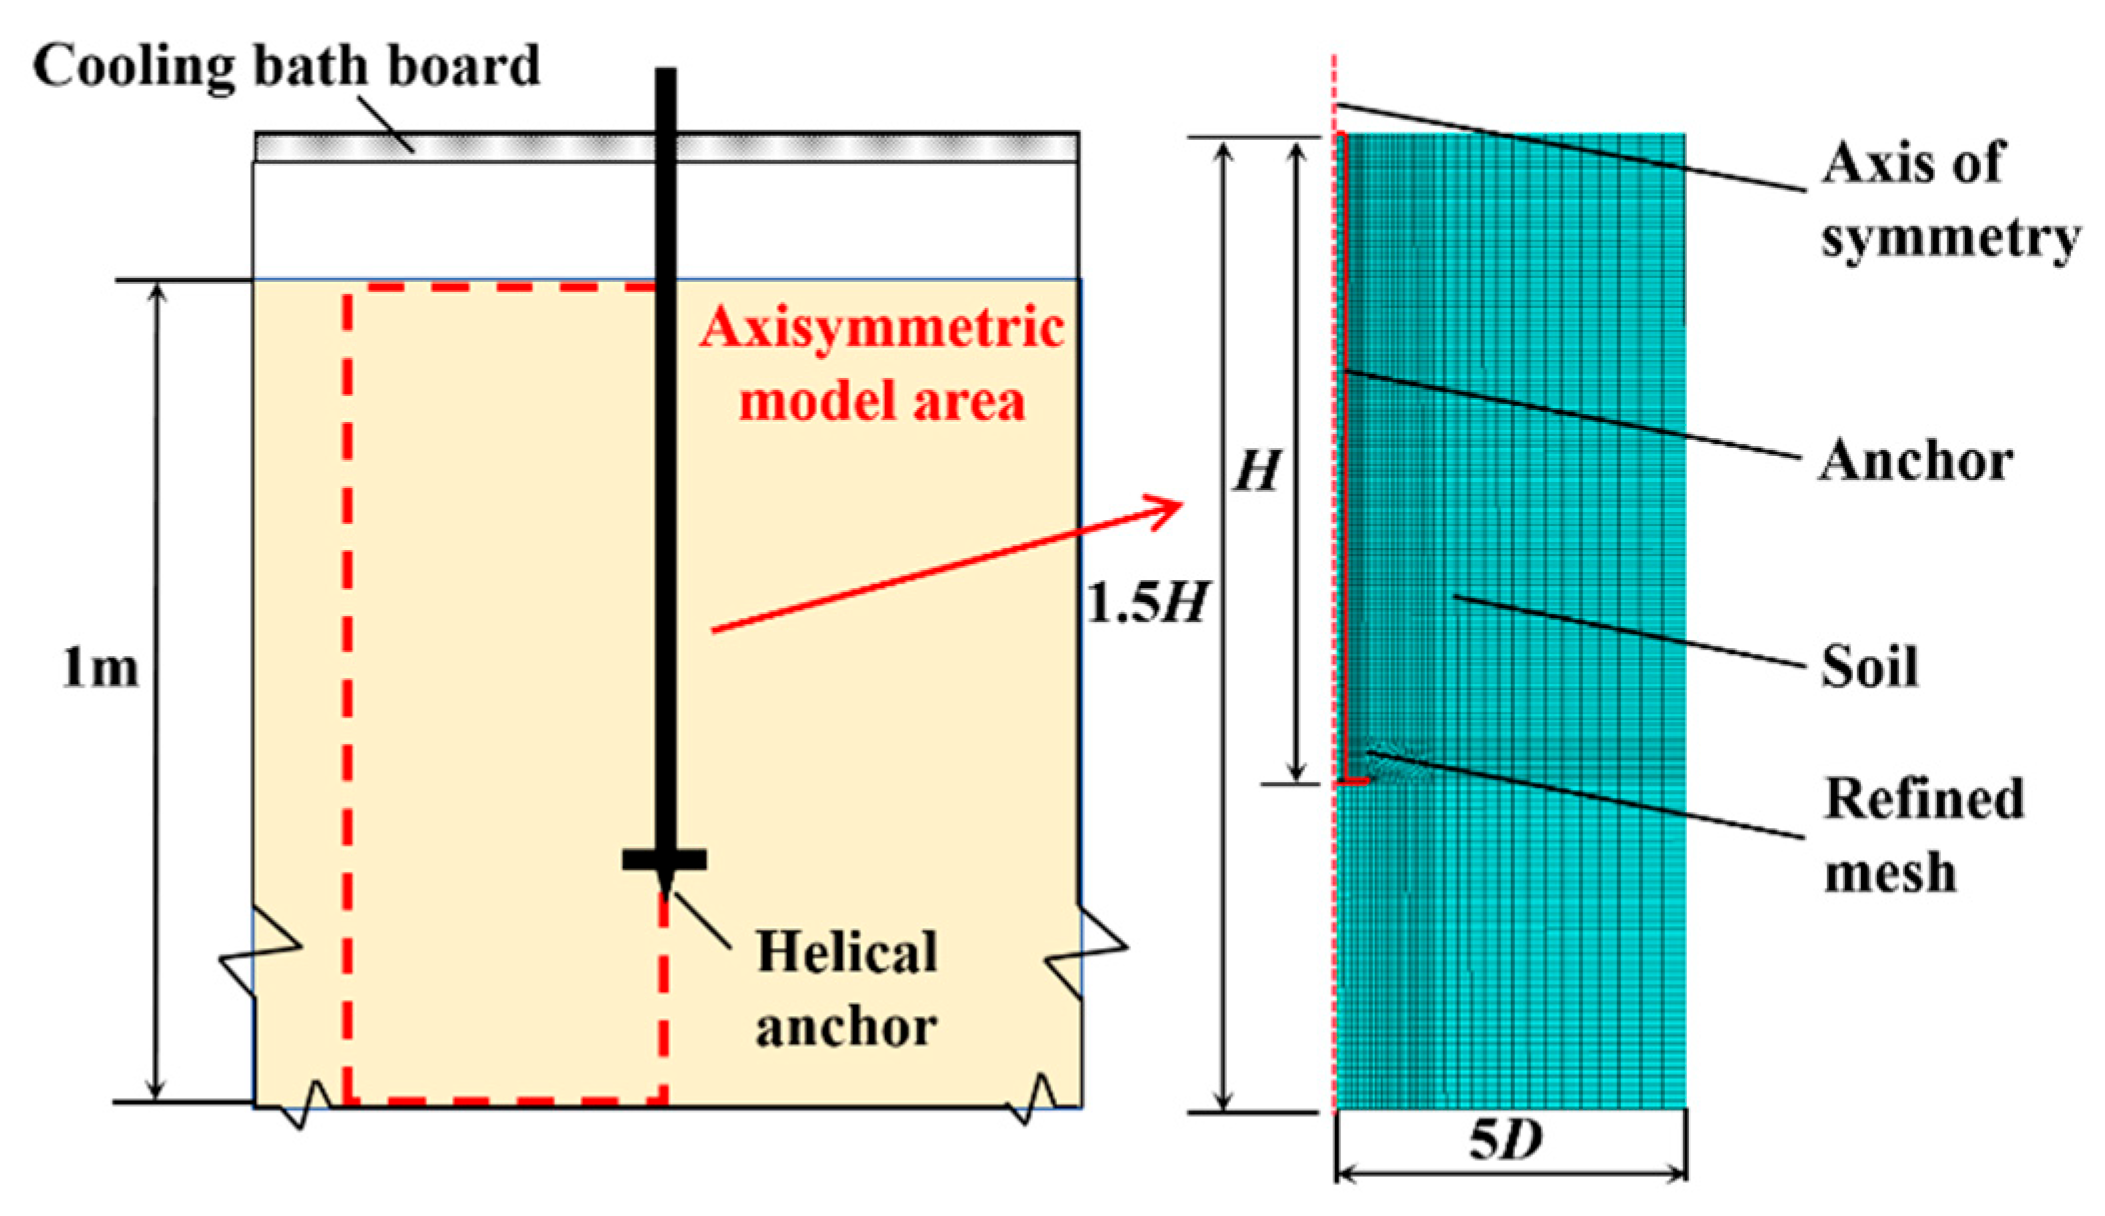
Due to the symmetry of the geometric shape, boundaries, and load conditions in simulating the frost jacking and pull-out behavior of helical anchors, an axisymmetric model is adopted to simplify the calculations, as shown in
Figure 7. The helical plates are replaced with circular plates of 0.05
D thickness based on previous findings that the geometric shape of the plates has little influence on the bearing capacity [
44]. To eliminate the influence of boundary conditions in simulating anchor frost jacking during freeze–thaw cycles and uplift behavior without freezing, the computational domain is set to 1.5
H × 5
D [
24,
45], where
H is the anchor embedment depth and
D is the helix diameter. The normal displacements on the symmetric and lateral external boundaries are constrained, and the bottom boundary of the model is fixed. A surface-to-surface contact model with a “cohesion-damage-friction” interface model is applied between the anchor and soil. Both the anchor and the soil are modeled as discrete solid parts, meshed using the 4-node thermally coupled axisymmetric quadrilateral reduced integration element CAX4RT for frozen soil simulation and the 4-node axisymmetric quadrilateral reduced integration element CAX4R for pull-out simulation in unfrozen soil. The initial stress state is applied using geostress equilibrium. The pre-defined temperature field for the entire model is set to 5 °C. The bottom and side boundaries are adiabatic, and the temperature of the upper boundary decreases uniformly from 5 °C to −5 °C within 10 h, remains constant for 50 h, then increases back to 5 °C step-by-step over 35 h, and remains constant for 15 h, completing one freeze–thaw cycle. The mesh is refined around the anchor, with the minimum element size near the plate. The optimal mesh density is determined by trial, with the smallest element size around the plate being 0.015
D. Displacement-controlled loading is used to determine the uplift capacity of the helical anchors in unfrozen soil. A reference point is placed at the top of the anchor, with a vertical displacement of at least 0.1
D.
3.4. Model Verification
Figure 8 presents the temperature nephograms at different time points. Areas with temperatures above the soil freezing point (−0.3 °C) are shown in gray, and the colored regions represent frozen zones. As illustrated, due to the higher thermal conductivity of steel, the temperature of the helical anchor body changes rapidly in response to the ambient temperature. During the freezing stage, soil temperature decreases progressively from the surface downward. When the boundary temperature increases, the shallow soil responds first to the change, whereas the deeper soil remains below freezing and depends on heat transfer from the upper layers for thawing. This results in a residual frost depth persisting even after the boundary temperature begins to rise for a period of time. The complete thawing of the frozen soil is achieved within 88 h. This thawing behavior is consistent with in situ observations from the Changchun area [
46].
The temperatures at depths of 10 cm, 20 cm, 30 cm, and 40 cm below the surface were extracted from the numerical simulation and compared with the experimental results, as shown in
Figure 9a. The temperature evolution trends at the four depths are generally consistent with the overall behavior observed in the experiments. The temperature development at 10 cm aligns well with the measured value at point PT1, while a noticeable lag is observed in the numerical results at greater depths when compared with the experimental data. Despite the evident deviation in deep soil temperatures, as the soil below 20 cm remains above the freezing point, the discrepancy has minimal influence on the soil’s mechanical behavior and therefore does not significantly affect the freeze–thaw displacement and stress analysis.
During the thawing phase, the temperature evolution at PT2 from the simulation diverges from the experimental results, leading to different thawing patterns. In the simulation, soil thawing initiates at the surface and progresses downward, whereas in the experiment, thawing occurs simultaneously from the top and bottom, resulting in the appearance of two freezing fronts during the process. This difference in thawing mode between the experiment and the simulation may be attributed to the environmental temperature conditions of the experimental hall.
The comparison of frost depth evolution between the simulation and experiment, shown in
Figure 9b, reveals a similar development trend within the first 50 h and a comparable maximum frost depth. Although the simulation shows continued slow development of frost depth from 50 to 75 h, the final frost depth remains close to that observed in the experiment, indicating comparable effects on anchor freeze-induced displacement and stress. The total thawing durations are 88 h for the simulation and 84 h for the experiment. Therefore, the slight difference has a negligible impact on the overall displacement analysis following the freeze–thaw cycle.
Figure 10 presents a comparison of the frost jacking displacement and residual displacement after thawing between the simulated and experimental results for the five anchor models. Overall, the measured displacements were generally larger than the values predicted by the simulation. This discrepancy is mainly attributed to the numerical model’s omission of moisture migration during the freezing process. Due to the physicochemical properties of the soil-water system, a certain amount of unfrozen water can persist below 0 °C [
47,
48]. As the subzero temperature further decreases, the thermodynamic potential (i.e., Gibbs free energy) of the unfrozen water film declines. The resulting temperature gradient within the freezing zone induces a suction gradient that drives moisture migration from the unfrozen region toward the frozen region through continuous unfrozen water films [
49]. The migrated water subsequently freezes, and the quantity of water that enters and freezes directly contributes to soil frost heave, thereby affecting the upward displacement of the pile.
Despite this discrepancy, the simulated results are in good agreement with the experimental data, with errors ranging from −3% to 16%. This indicates that the numerical modeling approach, along with the adopted interface contact model, can reasonably capture the stress and deformation behavior of the anchor–soil system during the freeze–thaw cycles.
4. The Influence of Anchor Geometry on Freeze–Thaw Displacement
To investigate the influence of geometry and loading conditions on the freeze–thaw displacement of full-scale helical anchors, a series of anchor models with varying helix diameters, helix spacing ratios, and numbers of helices were established. The geometric configurations of the helical anchors are presented in
Table 5. The diameter of the anchor shaft is fixed at 100 mm. SH, DH, and TH represent single-, double-, and triple-helix anchors, respectively. The numbers following “D” and “S” denote the helix diameter and the helix spacing-to-diameter ratio (
S/
D).
The temperature variation follows the annual temperature fluctuation in Liaoning Province, China, and is described by the following function:
where
t is time in days.
Each freeze–thaw cycle lasts 360 days. The lowest temperature of −8 °C occurs on day 180, and the highest temperature of 24 °C appears on day 360. The temperature reaches 0 °C on days 120 and 240. Thus, the soil experiences subzero conditions for approximately 120 days in each cycle, accounting for one-third of the full period. The temperature loading profile is illustrated in
Figure 11.
4.1. Uplift Capacity of Helical Anchors in Unfrozen Soil
Figure 12 illustrates the relationship between the uplift resistance and displacement for anchors of varying geometries in silty sand. The results indicate that the uplift resistance increases continuously with displacement, and the curve maintains an upward trend even when the displacement reaches 0.1
D, a value commonly adopted as the criterion for determining the ultimate uplift capacity [
50]. In this analysis, the displacement-based control criterion is also employed to define the ultimate uplift capacity,
Qt, as indicated by the solid markers in
Figure 12.
For double-helix anchors with identical helix diameters, shaft diameters, and bottom-helix embedment depths, both the embedment depth of the top helix and helix spacing influence the ultimate uplift capacity. A greater helix spacing can enhance the bearing performance of the bottom helix but simultaneously cause the top helix to be positioned closer to the surface, thereby reducing its contribution to uplift resistance. Consequently, when all other geometric parameters remain constant, the influence of helix spacing on the uplift capacity is nonlinear and uncertain. Numerical simulations of double-helix anchors with different spacings in silty sand reveal that the uplift capacity is the lowest when the spacing is 2D (Anchor DH-D400-S2). As the spacing increases, the uplift capacity improves, but slightly declines when the spacing reaches 6D compared to that at 3D. Furthermore, although the double-helix anchor DH-D400-S2 and triple-helix anchor TH-D400-S2 exhibit similar ultimate uplift capacities, the triple-helix anchor demonstrates a stiffer load-displacement response. The uplift resistances corresponding to 0.04 m are 137.648 kN, 130.181 kN, 163.37 kN, 171.264 kN, 161.332 kN and 177.949 kN for SH-D500, DH-D400-S2, DH-D400-S3, DH-D400-S4, DH-D400-S6 and TH-D400-S2, respectively.
These variations in uplift capacity are closely related to the failure modes of the surrounding soil, as illustrated by the equivalent plastic strain nephograms shown in
Figure 13. When the helix spacing is less than 4
D, a
columnar failure mode is observed. In this case, the failure surface at a certain thickness rises vertically from the bottom helix to the top helix, and a large bubble-shaped failure zone develops above it. When the helix spacing exceeds 4
D, the surrounding soil exhibits independent failure modes, as exemplified by DH-D400-S6. Similar failure patterns have been reported in previous studies on deeply embedded helical anchors [
45,
51]. This numerical investigation aims to identify anchor configurations with comparable uplift capacities, in preparation for the subsequent analysis of their performance under freeze–thaw conditions.
4.2. Anti-Jacking Performance During Freeze–Thaw Cycle
4.2.1. Soil Temperature and Displacement
The temperature range for the ice-water phase transition in the simulation is set between −0.3 °C and −1 °C. Below −1 °C, no further phase change occurs; therefore, −1 °C is defined as the frost depth threshold.
Figure 14a illustrates the temperature profiles at various time points during the first freeze–thaw cycle.
As the surface temperature drops below 0 °C (after day 120), the temperature of the shallow soil decreases with depth and gradually stabilizes at greater depths. Above the frost depth, the temperature decreases nearly linearly and rapidly. A noticeable inflection point appears near the frost depth. Below this point, the rate of temperature decrease exhibits a nonlinear behavior. By day 180, the surface temperature reaches its minimum value. Although the surface temperature begins to rise after day 180, the frost depth continues to develop due to the thermal inertia of the soil. The maximum frost depth of approximately 1.2 m is reached on day 220. This indicates that there is a time lag between the increase in surface temperature and the response of the frost depth. Once the surface temperature exceeds 0 °C, the frost depth decreases rapidly and returns to zero around day 250.
Figure 15 presents the soil displacement nephograms at various freezing times, using anchor DH-D400-S4 as a representative example. It can be observed that the frost heave in the soil surrounding the anchor is less than that in the far field. At the lowest surface temperature (day 180), the surface frost heave does not reach its maximum. Instead, the maximum heave occurs at around day 200. As the temperature continues to rise, the surface frost heave gradually decreases. After one complete freeze–thaw cycle (360 days), residual deformation remains in the foundation soil.
4.2.2. The Influence of Anchor Geometry
Figure 16 illustrates the displacements of the anchors with varying geometric configurations during the freeze–thaw cycles. The patterns of frost jacking and thaw settlement are consistent across multiple freeze–thaw cycles. As the frost depth increases, frost jacking begins to rise after day 120 and reaches a peak around day 190. Although frost depth continues to increase beyond day 190, the jacking displacement of the anchors begins to decline. This phenomenon is influenced by changes in the tangential frost-heave force. The extended frost depth after day 180 increases the tangential force in the newly frozen region, but the rising temperatures near the surface reduce the contact stress between the anchor and the upper soil. As a result, the total tangential frost-heave force along the entire frozen zone decreases after day 190, leading to reduced frost jacking displacement.
As the frozen layer thaws, the anchor settles gradually; however, a certain amount of irreversible (residual) displacement remains after thawing. With the accumulation of freeze–thaw cycles, both the maximum frost jacking during freezing and the residual displacement after thawing gradually decrease, eventually stabilizing after more than three cycles.
Displacement development under freeze–thaw conditions is influenced by several factors, including soil type, moisture content, foundation material, and interface characteristics between the foundation and soil. Most existing field monitoring studies of foundation displacement in frozen ground focus on a single freeze period [
33], and there are limited data available for multiple freeze–thaw cycles in seasonally frozen regions. Zhang et al. [
52] conducted laboratory model tests on cone-belled piles in three types of compacted soils under multiple freeze–thaw cycles. Their findings revealed that the pile displacement behavior varied significantly depending on the soil compaction conditions. In highly compacted soil, the pile’s vertical displacement curve shifts upward under multiple freeze–thaw cycles, with the growth rate of the curve decreasing after 10 freeze–thaw cycles. In poorly compacted soil, thaw subsidence is more pronounced and remains unchanged after settlement. In moderately compacted soil, the pile’s vertical displacement remains relatively unchanged throughout the freeze–thaw cycles.
In this numerical model, the frost-heave behavior of the soil is simulated using an expansion coefficient derived from tests on relatively dense soil. Consequently, during the freeze–thaw cycles, the pile displacement trends align with those observed by Zhang et al. in compacted soils [
52]. Specifically, the anchor displaces upward during the first freezing, but the maximum frost jacking displacement decreases during the second freezing. In subsequent freeze–thaw cycles, the variation in the maximum displacement during freezing becomes minimal. This behavior is linked to the damage characteristics of the anchor–soil interface. During the first freeze, the relative displacement between the anchor and the soil is small, and the interface behavior is dominated by bonding or bond damage. As freeze–thaw cycles progress, the relative displacement increases, shifting the interface behavior to a sliding-dominated mechanism. This transition reduces the transfer of the frost-heave force from the soil to the anchor.
Comparing the freeze–thaw displacement responses of different geometric helical anchors, it is evident that the single-helix anchor SH-D500 exhibits the largest freeze–thaw displacement, while the triple-helix anchor TH-D400-S2 experiences the smallest displacement. As shown in
Figure 12, the load-displacement curves for anchors SH-D500 and DH-D400-S2 are nearly identical when the pull-out displacement (
u) is less than 0.03 m, indicating that their bearing capacities are equivalent within this displacement range. However, a significant difference exists in the frost jacking caused by the tangential frost-heave force at the top of the anchor. The maximum frost jacking for anchor DH-D400-S2 is 73% lower than that of SH-D500 in the first cycle. Anchors DH-D400-S3, DH-D400-S4, DH-D400-S6, and TH-D400-S2 show similar uplift capacities, but it is evident that the triple-helix anchor demonstrates superior anti-frost performance. The maximum frost jacking for anchor TH-D400-S2 is 73%, 82%, and 84% lower than that of anchors DH-D400-S3, DH-D400-S4, and DH-D400-S6, respectively. A comparison of frost jacking between the two groups shows that anchors with more helices perform better in resisting frost jacking while maintaining similar uplift capacities. The residual displacements of the six anchors range from 12% to 33% of the maximum frost jacking, with the single-helix anchor exhibiting the highest ratio, and the double-helix anchor with a 6
D spacing showing the lowest ratio.
Helix spacing affects not only the uplift capacity but also the anti-frost performance. Among the four double-helix anchors with identical shaft length but varying helix spacing (2D–6D), the maximum relative difference in uplift capacity-calculated as () is 31%. However, their frost-jacking behaviors differ significantly. Anchor DH-D400-S2 exhibits the best stability during freeze–thaw cycles, showing the lowest frost jacking and residual displacement, despite having the smallest uplift capacity in unfrozen soil. Anchors DH-D400-S4 and DH-D400-S6 show similar frost jacking levels after three cycles, but DH-D400-S6 has lower residual displacement. Based on the above analysis, it is advisable to select anchors with a helix spacing of 2D-3D to resist freeze–thaw effects, provided that this spacing does not result in a significant loss of uplift capacity.
4.2.3. Tangential Frost-Heave Stress
The shear stresses along the anchor surface caused by soil frost heave during the first freeze–thaw cycle are extracted, using anchors SH-D500, DH-D400-S4, and DH-D400-S2 as examples, as shown in
Figure 17. The depth corresponding to zero shear stress for each anchor (denoted by hollow circles) is similar at different times, which corresponds to the frost depth. Above the frost depth line, the anchor shear stress represents the tangential frost-heave stress, while below the frost depth line, it reflects the stress distribution resisting the frost-heave force. The distribution of the tangential frost-heave stress (
τc) for each anchor follows a similar pattern over time. When the frost depth (
zf) is shallow (at 150 days), the maximum value of
τc is near the surface and rapidly decays with depth. As the frost depth increases, the tangential frost-heave stress within the frost depth range increases. At 180 days, when the surface temperature reaches its lowest value, the
τc value near the surface reaches its maximum. After the surface temperature begins to rise, the frost depth continues to develop, and
τc continues to increase with a relatively uniform distribution, as observed after 200 days. As the surface temperature continues to rise, at 220 days, the value of
τc near the ground decreases to zero, although the surface temperature remains negative. The generation of tangential frost-heave stress is related to the amount of soil frost heave deformation and the contact characteristics of the anchor–soil interface. As the temperature increases, the volume strain rapidly decreases, which can lead to the anchor detaching from the soil and causing the frost-heave stress to disappear. In the next cycle, the soil undergoes frost heave again, and the anchor–soil contact is restored.
Although the development rule of the ground temperature is the same and the distribution of the tangential frost-heave stress of each anchor is similar, the values of τc differ. This variation is due to the differing anti-frost-jacking performances of each anchor and the differences in the relative displacement of the anchor–soil interface. The maximum average tangential frost-heave stress occurs at 180 days and ranges from 170 kPa to 250 kPa for these anchors.
The shaft friction and helix resistance gradually come into play during freezing. As shown in
Figure 17, the side frictional resistance along the rod below the frost depth is the first to occur, and it quickly transfers to the helix of the single-helix anchor or the upper helix of multi-helix anchors. Only a small section of the anchor rod is effective, and most of the frost-heave force is borne by the helical plates. The helical plate of the single-helix anchor bears the greatest force, while the uppermost helix typically provides greater resistance due to its shallow embedment depth in multi-helix anchors. Multi-helix anchors alleviate frost jacking through a layered resistance mechanism that redistributes frost-heave forces across helices at different depths. The frost-heave force in a single-helix anchor (SH-D500) is concentrated on one plate, resulting in a high stress concentration of up to 2500 kPa on the helix. In contrast, a double-helix anchor (DH-D400-S4) distributes the frost-heave force between the upper and lower helices, yielding a more uniform stress distribution of approximately 1200 kPa, thereby reducing the local plastic deformation of the surrounding soil. This can also be the mechanical reason that the multi-helix anchor mentioned above has a better anti-frost jacking performance.
5. Conclusions
To analyze the frost jacking and thaw settlement behavior of helical anchors in silty sand under multiple freeze–thaw cycles (typical of cold regions), model experiments and numerical simulations with anchors of various geometries were conducted. The main conclusions are as follows:
(1) The shear behavior at the interface between the anchor and frozen soil can be described using a cohesion-damage-friction model, with parameters determined from steel pile−soil interface shear tests. A numerical modeling approach incorporating these interface characteristics was validated using experimental results. The frost displacement of helical anchors obtained from numerical simulations has an error range of −3% to 16% compared with the experimental results.
(2) Both experimental tests and numerical simulations revealed residual displacement after the freeze–thaw cycles. In the numerical simulations of full-scale anchors, the residual displacements ranged from 12% to 33% of the maximum frost jacking, with single-helix anchors exhibiting the highest ratio and double-helix anchors with 6D spacing exhibiting the lowest ratio. As the number of freeze–thaw cycles increased, both the frost jacking and residual post-thaw displacement gradually decreased, stabilizing after more than three cycles.
(3) Helical anchors with higher uplift capacities in unfrozen soil generally exhibit greater resistance to frost jacking. Among anchors with similar uplift capacities, those with multiple helices perform better in resisting frost jacking. Considering the helix spacing from 2D to 6D, a double-helix anchor with 2D spacing demonstrates the greatest stability during freeze–thaw cycles, followed by an anchor with 3D spacing. However, the anchor with 2D spacing has the lowest uplift capacity in unfrozen soil. Therefore, a helix spacing of 2D to 3D is recommended to resist freeze–thaw effects, provided that this spacing does not significantly reduce the anchor’s uplift capacity.
(4) At the lowest ground surface temperature, the tangential frost-heave stress reached its maximum. As the surface temperature began to rise, the frost depth continued to increase, and the tangential frost-heave stress became more uniformly distributed. For the anchors studied, the average tangential frost-heave stress at the time of the minimum ground surface temperature ranged from 170 to 250 kPa.
(5) During freezing, both the shaft friction and helical plate resistance progressively resisted frost jacking. Initially, lateral friction developed along the portion of the anchor rod below the frost depth, and the load was then quickly transferred to the helix (for a single-helix anchor) or to the upper helix (for a multi-helix anchor). In practice, only a small segment of the anchor rod contributes effectively to the load resistance, and the majority of the frost-heave force is resisted by the helical plates.
(6) The frost jacking and thaw settlement of helical anchors under freeze–thaw conditions are influenced by various factors. This study is a preliminary exploration of the helical anchor geometry configuration on frost jacking and load transfer mechanisms subjected to freeze–thaw cycles. The conclusions drawn need to be further verified through field and experimental tests.


 ,
, 


