1. Introduction
The protection and reuse of industrial heritage is an important topic in current urban renewal in China, especially in the context of urban expansion and functional transformation in recent years. In China, a significant number of industrial plants have been abandoned in the centers of industrial cities, creating “isolated” stock spaces. Transforming these areas into functional living spaces within the post-industrial era and converting them into public spaces where people are willing to linger presents a critical challenge [
1,
2]. Since the issuance of the “Implementation Plan for Promoting the Development of Industrial Culture (2021–2025)” in 2021, the Ministry of Industry and Information Technology has officially recognized six batches totaling 231 national industrial heritage sites. Among China’s industrial heritage renovation projects, cultural industrial parks, museums, urban public spaces, commercial areas, office complexes, and residential developments represent the primary types of renovations. Among these, cultural industrial parks dominate, accounting for 49.68% of all projects [
3]. Within this context, as the predominant model for industrial heritage regeneration [
4,
5], the operational success of creative industrial parks is closely tied to the vitality of the parks, with pedestrian activity serving as one of the core indicators of this vitality [
6]. Therefore, the study of pedestrian vitality in creative industrial parks has high practical significance.
Due to the traces left by the production process and the large-scale spatial characteristics of industrial buildings, which typically feature unconventional floor heights and spans, industrial heritage exhibits redundancy in urban renewal processes. In comparison to traditional streets, industrial heritage often possesses larger spans, floor heights, and road spacings as a result of its large-span factories. This enables it to accommodate large-scale art installations and drone performances that traditional streets cannot, thereby attracting the public to linger. Functionally, traditional streets are often limited to single functions such as transportation, residence, or commerce, whereas industrial heritage streets can be designed as multi-functional spaces to achieve multiple uses within the same infrastructure. Culturally, industrial heritage carries historical significance and serves as the collective memory of several generations, while traditional streets generally lack this sense of identity. In conclusion, industrial heritage sites that have been successfully renovated are highly appealing to both local residents and tourists, thereby enhancing the vitality of the surrounding areas. Therefore, analyzing pedestrian vitality in creative industrial parks transformed from industrial heritage is essential, as it contributes to achieving a dynamic balance between preserving historical heritage and meeting contemporary needs, ultimately enhancing the resilience of industrial heritage.
Research shows that pedestrian vitality is influenced by multiple factors, including accessibility, orderliness, comfort, convenience, and functionality. In the special context of transforming industrial heritage into creative industrial parks, accessibility has a significant positive effect on pedestrian vitality [
7,
8,
9,
10,
11]. First, the inherently closed spatial texture of industrial heritage frequently results in a lack of accessibility hierarchy, creating structural obstacles to the permeation of urban publicness. Second, prior studies [
12,
13,
14,
15] have demonstrated that accessibility can empower other vitality factors through spatial topological network effects; specifically, enhancing spatial penetration efficiency indirectly strengthens the comfort and convenience of a place. Third, from an urban renewal perspective, optimizing accessibility offers quantifiable spatial intervention strategies, providing actionable planning tools for the regeneration of industrial heritage. Therefore, studying the relationship between accessibility and pedestrian vitality in the transformation of industrial heritage into creative industrial parks is of great significance for the regeneration and reuse of industrial heritage and urban renewal.
As one of the birthplaces of modern industry in China, Qingdao’s textile industry was once renowned as “Shang, Qing, Tian” [
16]. With the advancement of urban renewal, a large number of old textile industrial zones in the urban area of Qingdao urgently need to be transformed and given new functions to integrate into contemporary urban life [
17]. However, in these transformation projects, strategies to enhance the pedestrian vitality of streets to support the sustainable development of parks still lack systematic research and practical guidance.
This study takes Qingdao Textile Valley as an example and uses a combination of field measurements and model analysis to study the relationship between pedestrian vitality and accessibility in the park’s streets. The specific research objectives are as follows: (1) to model the pedestrian vitality of the main streets in Qingdao Textile Valley using multi-agent behavioral rules and calibrate social force parameters to achieve a precise simulation and prediction of crowd behavior within the creative industrial park, while quantifying the distribution characteristics of pedestrian vitality; (2) to conduct a quantitative analysis of the correlation between accessibility and pedestrian vitality; and (3) from a micro-accessibility perspective, to propose optimization strategies and update scheme designs, followed by simulation and optimization verification to ensure the effectiveness of the proposed schemes.
2. Literature Review
2.1. Research on Street Vitality
In 1961, Jane Jacobs formally introduced the concept of pedestrian vitality in her seminal work [
18], thereby initiating academic research on street vitality. Early studies predominantly focused on qualitative analyses aimed at designing public spaces to promote pedestrian activities and community interactions, leading to the development of several foundational theories [
19,
20,
21]. However, due to a lack of quantitative support, these early designs often failed to fully align with residents’ actual needs. In recent years, quantitative analysis has gradually become the mainstream approach in studying street pedestrian vitality, complementing and enhancing qualitative methods. Current quantitative research methods for street vitality can be categorized into three main types: First, mobile phone signaling data analysis [
22], which uses population density data to reflect street dynamics but struggles to distinguish between static and dynamic populations. Second, field surveys [
23], which assess vitality levels by observing and recording pedestrian numbers and dwell times, providing precise insights at a small scale. Third, questionnaire surveys and the Semantic Differential (SD) method [
24], which gather subjective experiences in the street environment to inform improvement suggestions.
Advancements in computer technology have introduced pedestrian simulation into architecture and urban design, providing scientific support for street planning. The Java-based multi-functional simulation platform AnyLogic (AnyLogic Company, Saint Petersburg, Russia) employs social force models and visual data analysis to simulate pedestrian flow direction, density, and walking time [
25]. Through pedestrian simulation based on real measurement data, researchers can have a more comprehensive understanding of the vitality of the street and propose more precise and effective optimization strategies based on the simulation outcomes. For instance, Liu, J.H. [
26], proposed a path optimization plan for Harbin’s Qilin business district based on simulation results, while Tong, X., et al. [
27] conducted pedestrian scenario simulations in Chongqing’s Nanqiao Temple area to enhance the walking experience and layout rationality. Chen, Y., et al. [
28] optimized the facility layout of Suzhou’s Pingjiang Historical District using simulation models, proposing effective strategies for tourist diversion and facility placement. The integration of simulation technology has significantly enhanced the accuracy and reliability of street pedestrian vitality research, with the AnyLogic software playing an indispensable role in this field.
2.2. Research on Quantitative Methods and Analytical Models of Accessibility
Accessibility measures the convenience with which people can reach destinations and participate in social activities via the transportation system. Its concept can be traced back to Reily’s theory of commercial attraction [
29] and was formally introduced into location theory by Hansen in 1959 [
30]. Over six decades, accessibility research has evolved from traditional transportation supply–demand models to complex frameworks such as space syntax [
31], developing into a cross-disciplinary quantitative analysis system. Today, accessibility research, combined with GIS and Big Data [
32,
33], is widely applied in traffic optimization and planning practices at both neighborhood and city scales, playing a crucial role in both theoretical and practical applications.
This study primarily uses space syntax to quantitatively evaluate accessibility. Space syntax theory, proposed by Bill Hillier and Julienne Hanson in 1984, focuses on defining spatial adjacency and accessibility relationships and examining how other elements influence these relationships. In specific applications, the topological method of space syntax is suitable for fine-grained spatial scales, such as subway lines, urban blocks, and parks [
34,
35,
36]. This method divides space into graph nodes and uses graph theory to derive variables like connection value, control value, and node depth to analyze the impact of spatial structure characteristics. Hillier et al. introduced Normalized Angular Choice (NACH) and Normalized Angular Integration (NAIN) in 2012, enhancing the accuracy of choice and integration metrics in quantifying spatial accessibility [
37]. Paul A. Longley utilized space syntax to simulate visitor flows at Tate Britain, optimizing the functional layout [
38]; Dai, X.L., analyzed the correlation between street networks and pedestrian flow in Hangzhou’s northern districts, validating the “natural movement principle” in China [
39]. However, space syntax is predominantly used in macro-scale urban research and has lower accuracy in medium- and small-scale public spaces. Therefore, some scholars have combined space syntax with multi-agent simulation to more accurately predict pedestrian distribution and improve accessibility accuracy. Studies by Han, D.Q., et al. [
40] and Chen, Y.L. and Li, B. [
41], demonstrate that at the mesoscale and microscale, multi-agent simulation can extend space syntax by integrating static spatial attributes with dynamic behavioral characteristics, enhancing model predictive power. Hu, K., et al. [
42] and Hu, H., et al. [
43] used multi-agent models to verify the relationship between space syntax parameters and pedestrian flow, confirming that these parameters accurately reflect urban node vitality and accessibility.
This study integrates the space syntax tool DepthmapX-0.8.0 (Space Syntax Laboratory, University College London, London, UK) with the pedestrian simulation tool AnyLogic Personal Learning Edition v8.9 (AnyLogic Company, Saint Petersburg, Russia) to simulate pedestrian density within Qingdao Textile Valley’s internal streets, revealing that spatial accessibility significantly influences pedestrian density and, consequently, street vitality.
2.3. Research on the Spatial Vitality of Urban Creative Industrial Parks
In recent years, the optimization and enhancement of urban street space vitality have emerged as focal areas in urban renewal research. However, existing studies on the street space vitality of creative industrial parks transformed from industrial heritage remain limited. This scarcity can be attributed to the fact that the operational success of transforming industrial heritage into creative industrial parks hinges primarily on their economic benefits. Moreover, the sustainability of such parks relies not only on national policy support but also on the endorsement of local communities and commercial interests [
44]. The current academic research on the spatial vitality of industrial heritage converted into creative industrial parks highlights three key paradigm shifts: (1) from single-form preservation to research on the sustainability of vitality; (2) from physical space transformation to the coordination of social space; and (3) from static assessment to dynamic monitoring. The evolution of research methodologies is notably characterized by a deep integration of multi-source data fusion technologies. Yang, B., et al. [
45] conducted field surveys across 42 sample areas, constructing a “space element–pedestrian density” correlation model that confirmed the substantial influence of public service facility accessibility on spatial vitality. Gu, Y., et al. [
44] employed a multi-scale analytical framework, combining a real-time density analysis of WeChat heat maps with a POI spatial pattern analysis to elucidate the vitality disparities between mixed-function and single-function areas. Zhou, J., et al. [
2] introduced a “four-pillar method” evaluation system, designating vitality islands as a core indicator while using functional density and population activity intensity as evaluation criteria. Through multi-source data analysis, this study developed a systematic approach for assessing the degree of “isolation” in industrial heritage sites. Song, J., et al. [
14] utilized social network analysis techniques to identify three critical spatial challenges—functional layout, spatial accessibility, and path richness—and proposed strategies for optimizing network structures. Empirical evidence demonstrated that these interventions significantly enhance both space utilization rates and site vitality post-transformation.
In summary, existing studies have constructed a multi-level analytical framework for assessing the spatial vitality of industrial heritage parks, ranging from micro-grids to macro-regions. This framework integrates multi-source data, including POI, heat maps, and on-site observations, alongside methodologies such as spatial syntax and social network analysis. However, research on the vitality of creative industrial parks still faces certain limitations: First, most studies rely on static data and lack spatio-temporal dynamic analysis tools to comprehensively evaluate vitality. Second, while the current research primarily focuses on assessing vitality indicators, it falls short in rigorously testing the feasibility of specific optimization measures. Third, park renewal planning predominantly depends on economic indicators, with insufficient emphasis on vitality-oriented approaches, leading to mismatches between spatial transformation and actual usage requirements. Therefore, this study emphasizes the development of a dynamic model, proposing optimization strategies grounded in the correlation between accessibility and pedestrian vitality and aiming to achieve the sustainable enhancement of the vitality of industrial heritage parks transitioning into creative industrial parks.
3. Data and Methods
3.1. Study Area
Textile Valley Creative Industrial Park is a representative case of the regeneration and utilization of industrial heritage in Qingdao. Situated on the former site of Qingdao’s fifth textile factory, one of the city’s nine major cotton mills, the park spans an area of 140,000 square meters and has a total building area of 120,000 square meters. Situated at No. 80, Siliu South Road, Shibei District, The fifth state-owned cotton mill, originally established in 1934 as “Shanghai Textile Co., Ltd., Qingdao Branch”, underwent significant development over seven decades. In 2005, it initiated industrial restructuring, transforming the original factory site into the Textile Valley Creative Industrial Park, which officially opened to the public in 2014. In 2017, Textile Valley was designated as one of China’s top ten textile and garment creative design pilot parks by the Ministry of Industry and Information Technology (MIIT). In April 2018, it was included in the second batch of national industrial heritage sites for recognition.
The park aims to develop into a national textile and garment integrated innovation platform, a city fashion life experience center, and a landmark industrial tourism destination. By preserving key structures such as the main factory buildings, staff dormitories, water towers, sculptures, old walls, and various pieces of production equipment, as well as by establishing a textile museum, Textile Valley has successfully continued the community’s collective memory and preserved the cultural legacy of the textile industry, making it a successful example of industrial heritage reuse in Qingdao.
However, the transformation of the old industrial factory area into a modern industrial park presents complex functional layout challenges. It requires coordinating the spatial layout of the original factory area with the park’s new functions, adapting old building spaces to new business forms, and addressing changes in the park’s functional layout due to project operation rules and phased development [
46]. Textile Valley faces issues such as mismatches between functional layout and spatial form, the insufficient integration of cultural displays with modern functions, and weak peripheral traffic connectivity.
The park has four entrances and exits: the south and north entrances allow both pedestrians and vehicles, while the east and west entrances are pedestrian-only. There are six node spaces and eight main roads, namely ① Guomian Avenue; ② Exotic Style Street; ③ Xiu Street; ④ Hongqiao Road; ⑤ Sculpture and Mural Art Street; ⑥ Shang Street; ⑦ Graffiti Art Street; and ⑧ Huaxiu Road. Among these, Guomian Avenue and Xiu Street are pedestrian-only, while the remaining roads accommodate both pedestrians and vehicles. The length, width, architectural style along the streets, and business types are illustrated in
Figure 1. Points A–M in the figure are Street intersections and characteristic node Spaces, which are subsequent observation points.
3.2. Methodology
This study adopts the technical workflow of “data collection–model construction–optimization verification” (as shown in
Figure 2).
3.2.1. Data Collection
The data collection encompasses three dimensions: spatial features, pedestrian behavior, and functional business types. The spatial data are derived from field measurements and include elements such as spatial morphology, building outlines, entrance/exit locations, green space distribution, parking lot positions, and pedestrian walkway widths. Pedestrian data are collected by establishing observation points at major pedestrian intersections and scenic spots, recording pedestrian flow and dwell counts (staying ≥ 1 min) during different time periods on weekdays and holidays. This clarifies pedestrian movement patterns and distribution characteristics while comprehensively reflecting the dynamic behaviors of the park’s population across various usage scenarios. For business type data, the park’s businesses are categorized into seven classes [
47]: catering, shopping, leisure, education, public services, personal care, and healthcare. Based on POI (Point of Interest) information, on-site surveys are conducted to document the spatial locations, entrance/exit distributions, and storefront opening widths of these business types.
This study employs a stratified time-period sampling method. On 24 March 2024 (a holiday) and 9 May 2024 (a weekday), three peak periods (10:00–10:30, 14:30–15:00, 17:45–18:15) were selected. Observation points were established at 13 representative road intersections within the park to simultaneously record pedestrian crossing volumes, dwell counts (staying ≥ 1 min), and walking speeds (measured with laser speedometers, accuracy ±0.1 m/s). Road network topology data were acquired via the Baidu Maps API and subsequently verified and corrected through on-site inspections. A two-dimensional vector road network model was then constructed using AutoCAD 2021 (Autodesk, Inc., San Rafael, CA, USA), defining nodes, connecting edges, and annotating attributes such as pedestrian walkway widths. This provided a robust data foundation with high temporal and spatial precision for subsequent simulations.
3.2.2. Analysis of Street Vitality
Through the construction of simulation models with Anylogic, a pedestrian micro-simulation system based on the social force model is established. The physical space model and the logic of crowd behavior are constructed using street spatial data and pedestrian flow information collected from field surveys and Baidu Maps, with the aim of simulating the distribution of pedestrian activity levels along major streets.
The logic of crowd behavior is constructed based on peak-hour data. Specifically, the dataset with the highest pedestrian flow among the three peak hours on both holidays and weekdays is selected to address congestion on core streets and enhance pedestrian activity levels on peripheral streets. Four park entrances/exits are configured as pedSource nodes, where walking speeds and arrival rates are input. Additionally, eight main roads and six key nodes are assigned either pedGoto or pedWait actions. The corresponding crossing coefficients, staying coefficients, and entrance/exit passing coefficients are calculated using actual survey data and integrated into the logic model. Notably, the crossing and staying coefficients for the nodes are derived from the number of pedestrians observed during the actual peak hour, while the entrance/exit passing coefficients are computed based on the recorded inflow/outflow at each entrance/exit. A pre-survey revealed that most visitors spend approximately one hour walking within the park. Consequently, AnyLogic is employed to simulate a one-hour operational cycle, with pedSink nodes set at the four park entrances/exits to represent pedestrian departure.
- 2.
Physical Space Modeling
The spatial environment model is based on real photos of the park, Baidu Maps, and field research data. Using Anylogic’s “Pedestrian Dynamics Library” tool, the model simulates and represents the outer contours of buildings, roads, green spaces, and other elements. Obstacles are placed in areas restricted to pedestrians, such as parking lots occupied by motor vehicles. Polygonal nodes are established in characteristic node spaces, and attraction points are set according to the proportion of people lingering in these areas.
- 3.
Model Verification
Based on the Anylogic platform, the model’s accuracy was repeatedly verified to ensure consistency between the simulation data and the actual observed data. The accuracy of the results obtained from the model simulation was validated by selecting a day for investigation and comparing the simulation results of that day with the measured results. Visualization outputs from the platform and the consistency index
d are used to evaluate the model’s accuracy. The consistency index
d measures the degree of approximation between the simulation values and the measured values. A value of
d closer to 1 indicates higher consistency between the simulation and actual data. The formula for calculating the consistency index
d [
48] is as follows (1):
Pi represents the population data obtained from the survey in a specific period, and Oi represents the population data obtained from the simulation in the same specific period.
- 4.
Pedestrian Simulation Data Output
The spatial environment and crowd behavior data are input into the AnyLogic platform. The pedFlowStatistics module is used to count the pedestrian flow. For major streets, area nodes are defined to calculate the area and obtain the pedestrian density using the following Formula (2):
where pedestrian flow is the number of pedestrians passing through the area within a unit of time, typically expressed as people per hour, and the area is measured in square meters (m
2).
The simulation outputs the crowd density data every minute during its operation. These data are subsequently aggregated in Excel to generate a time-based curve of crowd density, with the vertical axis expressed in units of people/(m2·hour) and the horizontal axis set in minutes for temporal representation. This approach enables a more microscopic presentation of the data, allowing researchers to observe the trend in crowd density changes on a finer time scale. By adopting this method, the potential roughness of the chart caused by overly macroscopic time scales is avoided, thereby facilitating a comprehensive understanding of the general patterns of crowd flow at the minute level. Such an analysis enhances the dynamic observation of pedestrian vitality changes. The exported data provide the average and maximum crowd densities over one hour of simulation, which serve as critical indicators for evaluating street vitality and identifying congestion nodes as well as low-vitality streets.
3.2.3. Calculation of Street Diversity and Accessibility
Prior to conducting the space syntax road network accessibility analysis, it is essential to examine the mechanism of mutual influence between the boundary of the open park and its surrounding areas. Establishing a buffer zone can mitigate the boundary effect to some extent, thereby enhancing the stability and accuracy of the internal spatial representation within the study area. Consequently, in this study, a 200 m radius buffer zone is delineated around the original park boundaries to incorporate additional surrounding streets that are influenced by the park.
The CAD line segment model is imported into the space syntax software DepthmapX-0.8.0. This study selects the Normalized Angular Integration Index (NAIN) and the Normalized Angular Choice Index (NACH) as accessibility analysis indicators. NACH reflects the choice degree of the street network, representing the frequency with which a line segment is traversed as part of the shortest path. A higher NACH value indicates stronger spatial accessibility. NAIN measures the integration degree of a spatial node with other nodes in the network, with a higher value indicating the greater centrality of the node. The formulas for the Normalized Angular Choice Index (NACH) and Normalized Angular Integration Index (NAIN) [
49] are as follows (3) and (4):
The standardized formulas for the NACH and NAIN include both global and local indicators, enabling a precise analysis of accessibility across different radius ranges. This study adopts the global indicators suitable for small-scale research.
3.2.4. Correlation Analysis
To investigate the linear relationships between variables, this study employs SPSS statistical software to conduct a Pearson correlation analysis. The Pearson correlation coefficient is a statistical method used to measure the degree of linear correlation between two continuous variables, with values ranging from −1 to +1. A value of −1 indicates a perfect negative correlation, +1 indicates a perfect positive correlation, and 0 indicates no linear correlation. The formula for the Pearson correlation coefficient is as follows (5):
In this formula, r denotes the Pearson correlation coefficient, which quantifies the extent of linear association between two variables. Xi and Yi signify the values of the i-th data point in the sample for variables X and Y, respectively. and , respectively, represent the sample means of the variables X and Y.
This study constructs an association model between the pedestrian density and spatial parameters of the road network, taking the average pedestrian flow density as the dependent variable to represent the intensity of pedestrian vitality in the space. The Normalized Angle Choice Heterogeneity (NACH) and Normalized Angle Integration (NAIN) are selected as independent variables. This study uses SPSS 25.0 software to conduct a Pearson correlation analysis. Before that, numerical tests are conducted to verify the normality and continuity of the variables to ensure that the data meet the basic prerequisites for Pearson correlation analysis. The specific process is as follows: (1) Set the significance threshold at 0.05 under the two-tailed test framework. (2) Calculate the Pearson correlation coefficient (r value) between each pair of variables. (3) Obtain the corresponding p value through hypothesis testing. According to the principle of statistical inference, when p < 0.05, it can be considered that there is a statistically significant correlation between the variables. All analysis results are calculated through the standard algorithm of the SPSS software to ensure the standardization and repeatability of the calculation process.
3.2.5. Optimization and Simulation Verification
This study aims to enhance street vitality from a spatial perspective. First, streets with low vitality and poor accessibility are identified as optimization targets based on the calculated street vitality and accessibility scores. Specific optimization design schemes are then proposed. This stage focuses on spatial factors and comprehensively considers multiple aspects, including spatial layout, node space functions, and traffic organization, to improve the overall performance of the streets. Simulation models are used to verify the optimization design schemes, analyzing their feasibility and effectiveness. The simulation results are used to evaluate the improvement effects of the optimization schemes on street vitality and accessibility.
Based on the simulation verification results, it is determined whether the optimization schemes have achieved the expected goals. If the results do not meet the standards, the optimization strategies are adjusted, improved, and re-verified until the goal of enhancing street vitality is achieved. Ultimately, a practical and feasible optimization scheme is formed, providing scientific support for enhancing street vitality.
4. Results
4.1. The Results of the Data Collection
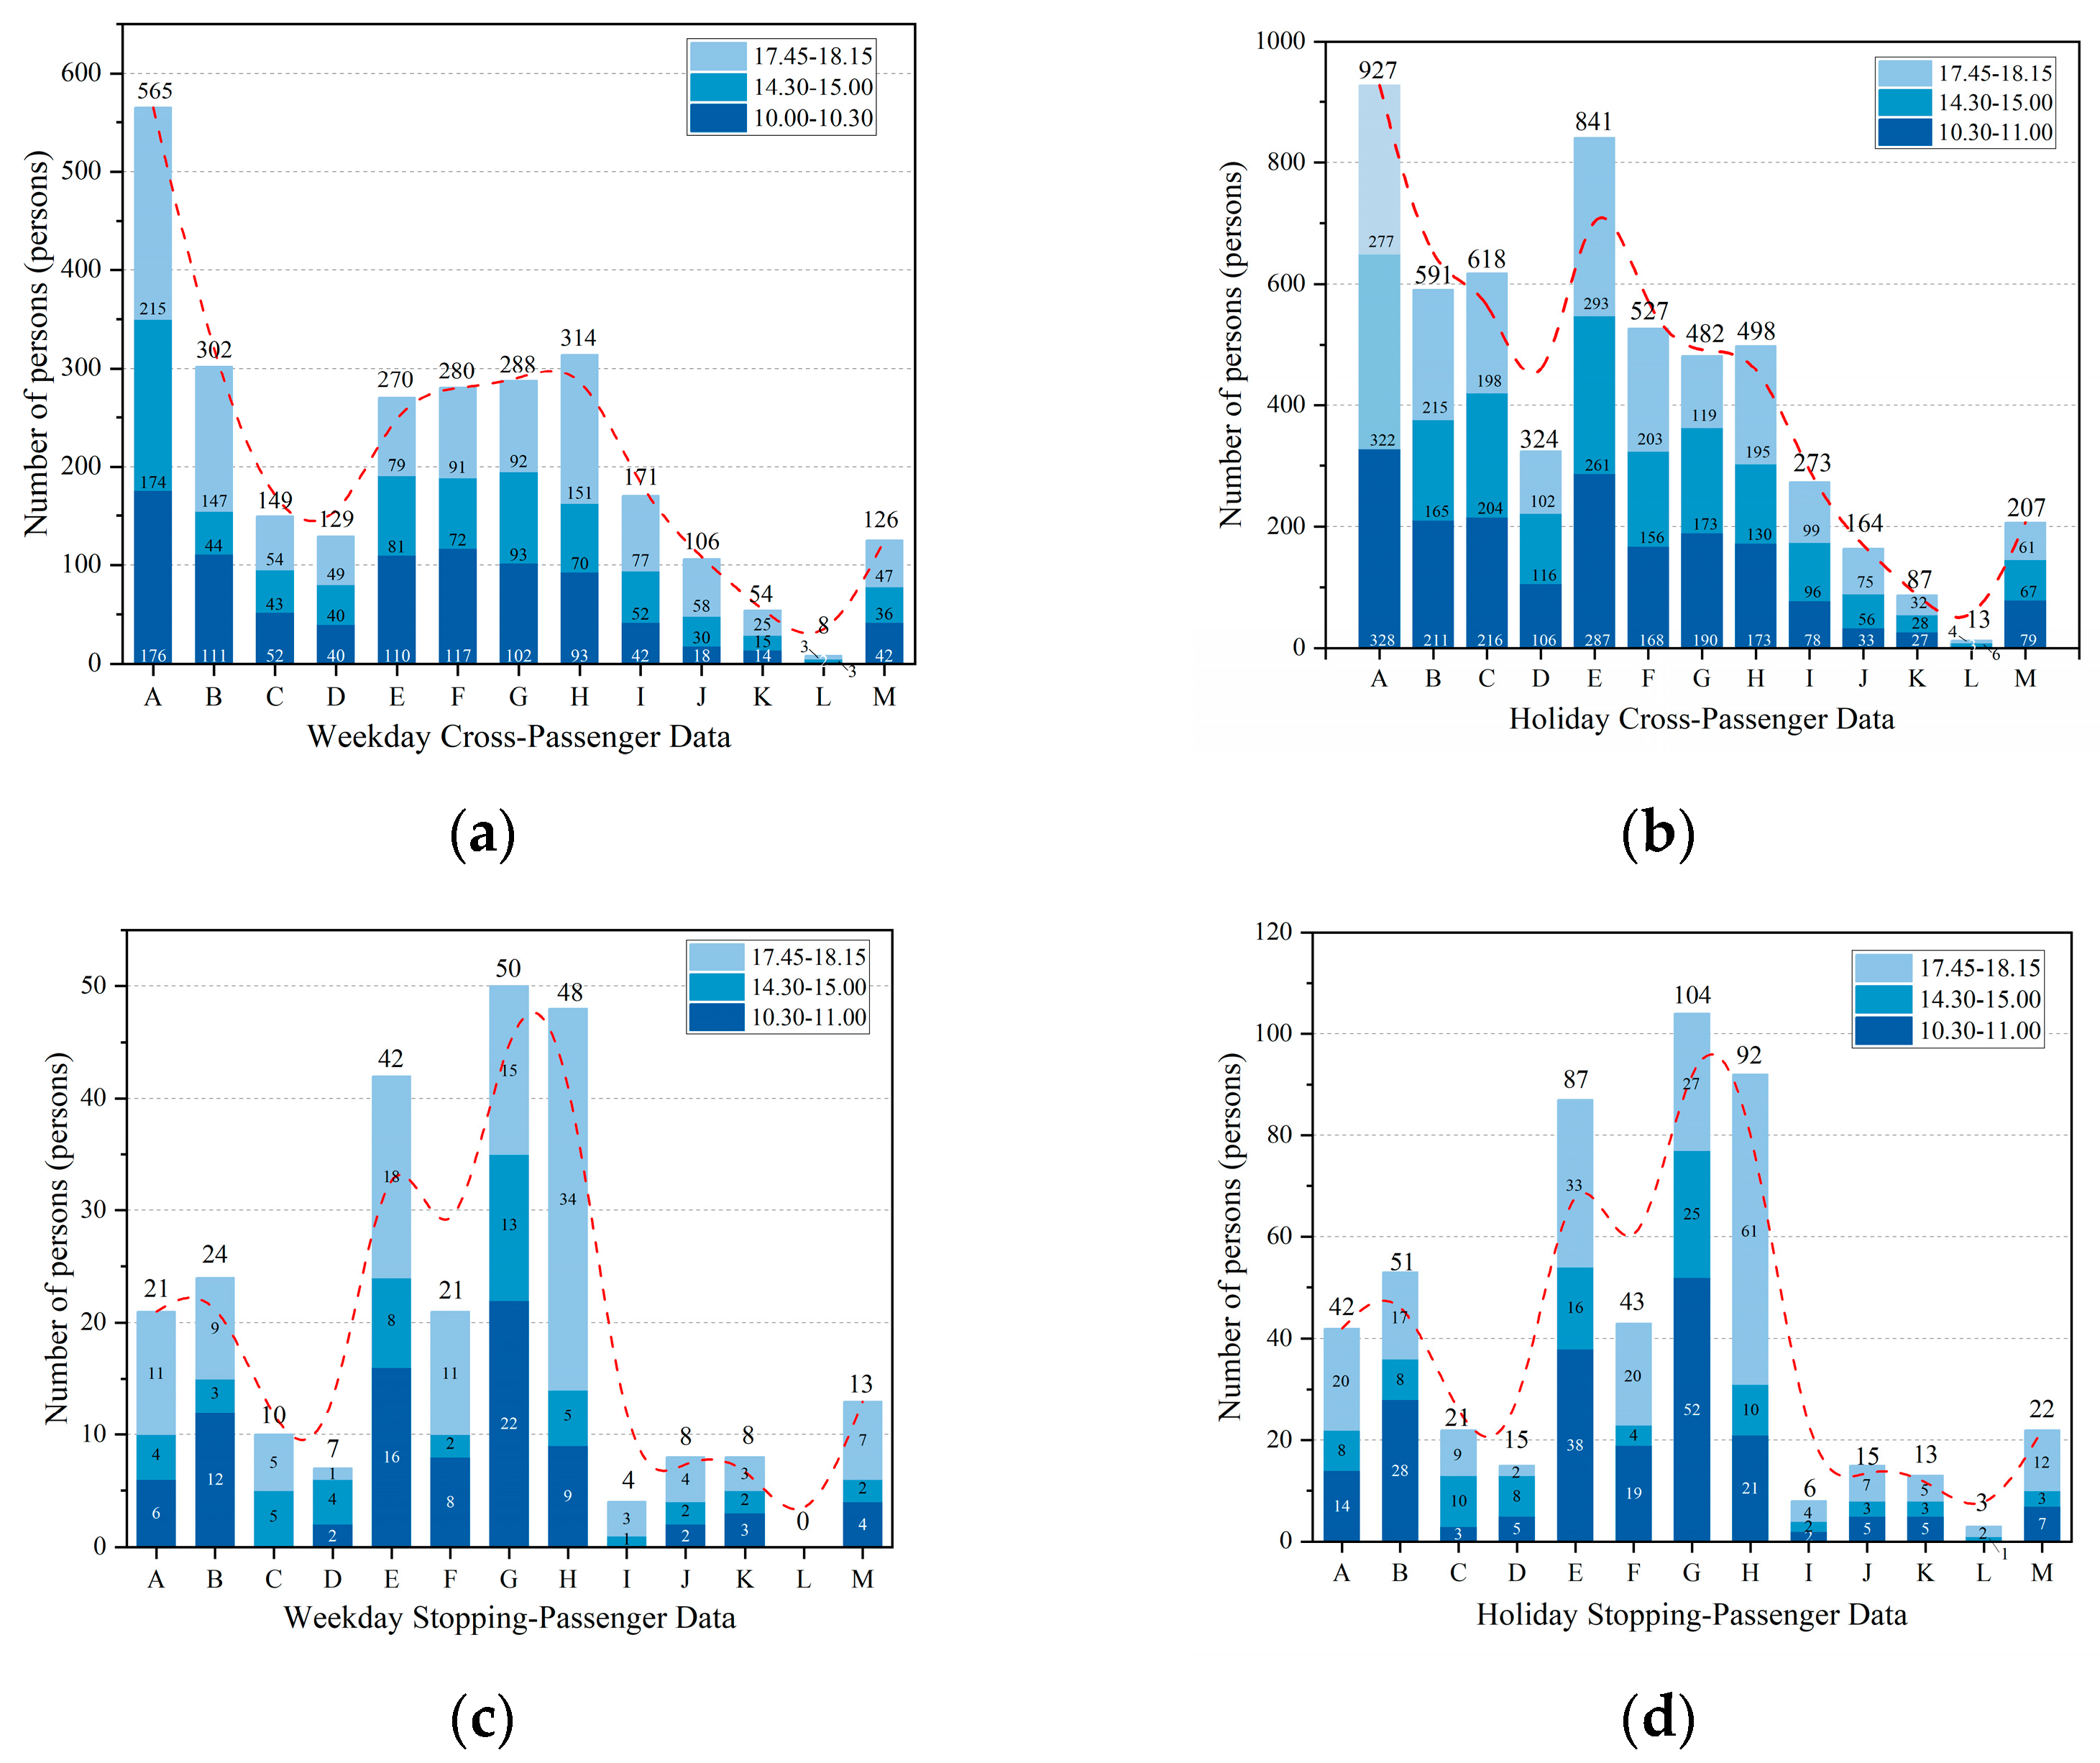
According to the on-site surveys, the average walking speed of pedestrians ranges from 0.73 m/s to 1.14 m/s. The pedestrian flow data at the main observation points during working days and holidays are presented in
Figure 3. Among these points, A, B, C, and D represent the primary entrances and exits of the park, while the remaining points correspond to observation locations established at major road intersections and key node spaces. It is evident that pedestrian flow is significantly higher on holidays compared to working days, with the peak period occurring between 10:30 and 11:00 in the morning. Among the four entrances and exits, the south entrance (A) records the highest number of people entering and exiting. Among all nodes and intersections, the intersection of Guomian Avenue exhibits the largest number of crossings. Additionally, the stillwater pool and locomotive head site nodes show a higher tendency for people to pause and linger.
Based on the data of the maximum number of people in each time period presented in
Figure 3, the crossing coefficient, dwelling coefficient, and entrance/exit passage coefficient for each node and entrance/exit were calculated and subsequently input into the AnyLogic crowd behavior logic diagram (
Table 1).
4.2. The Results of Street Vitality Analysis
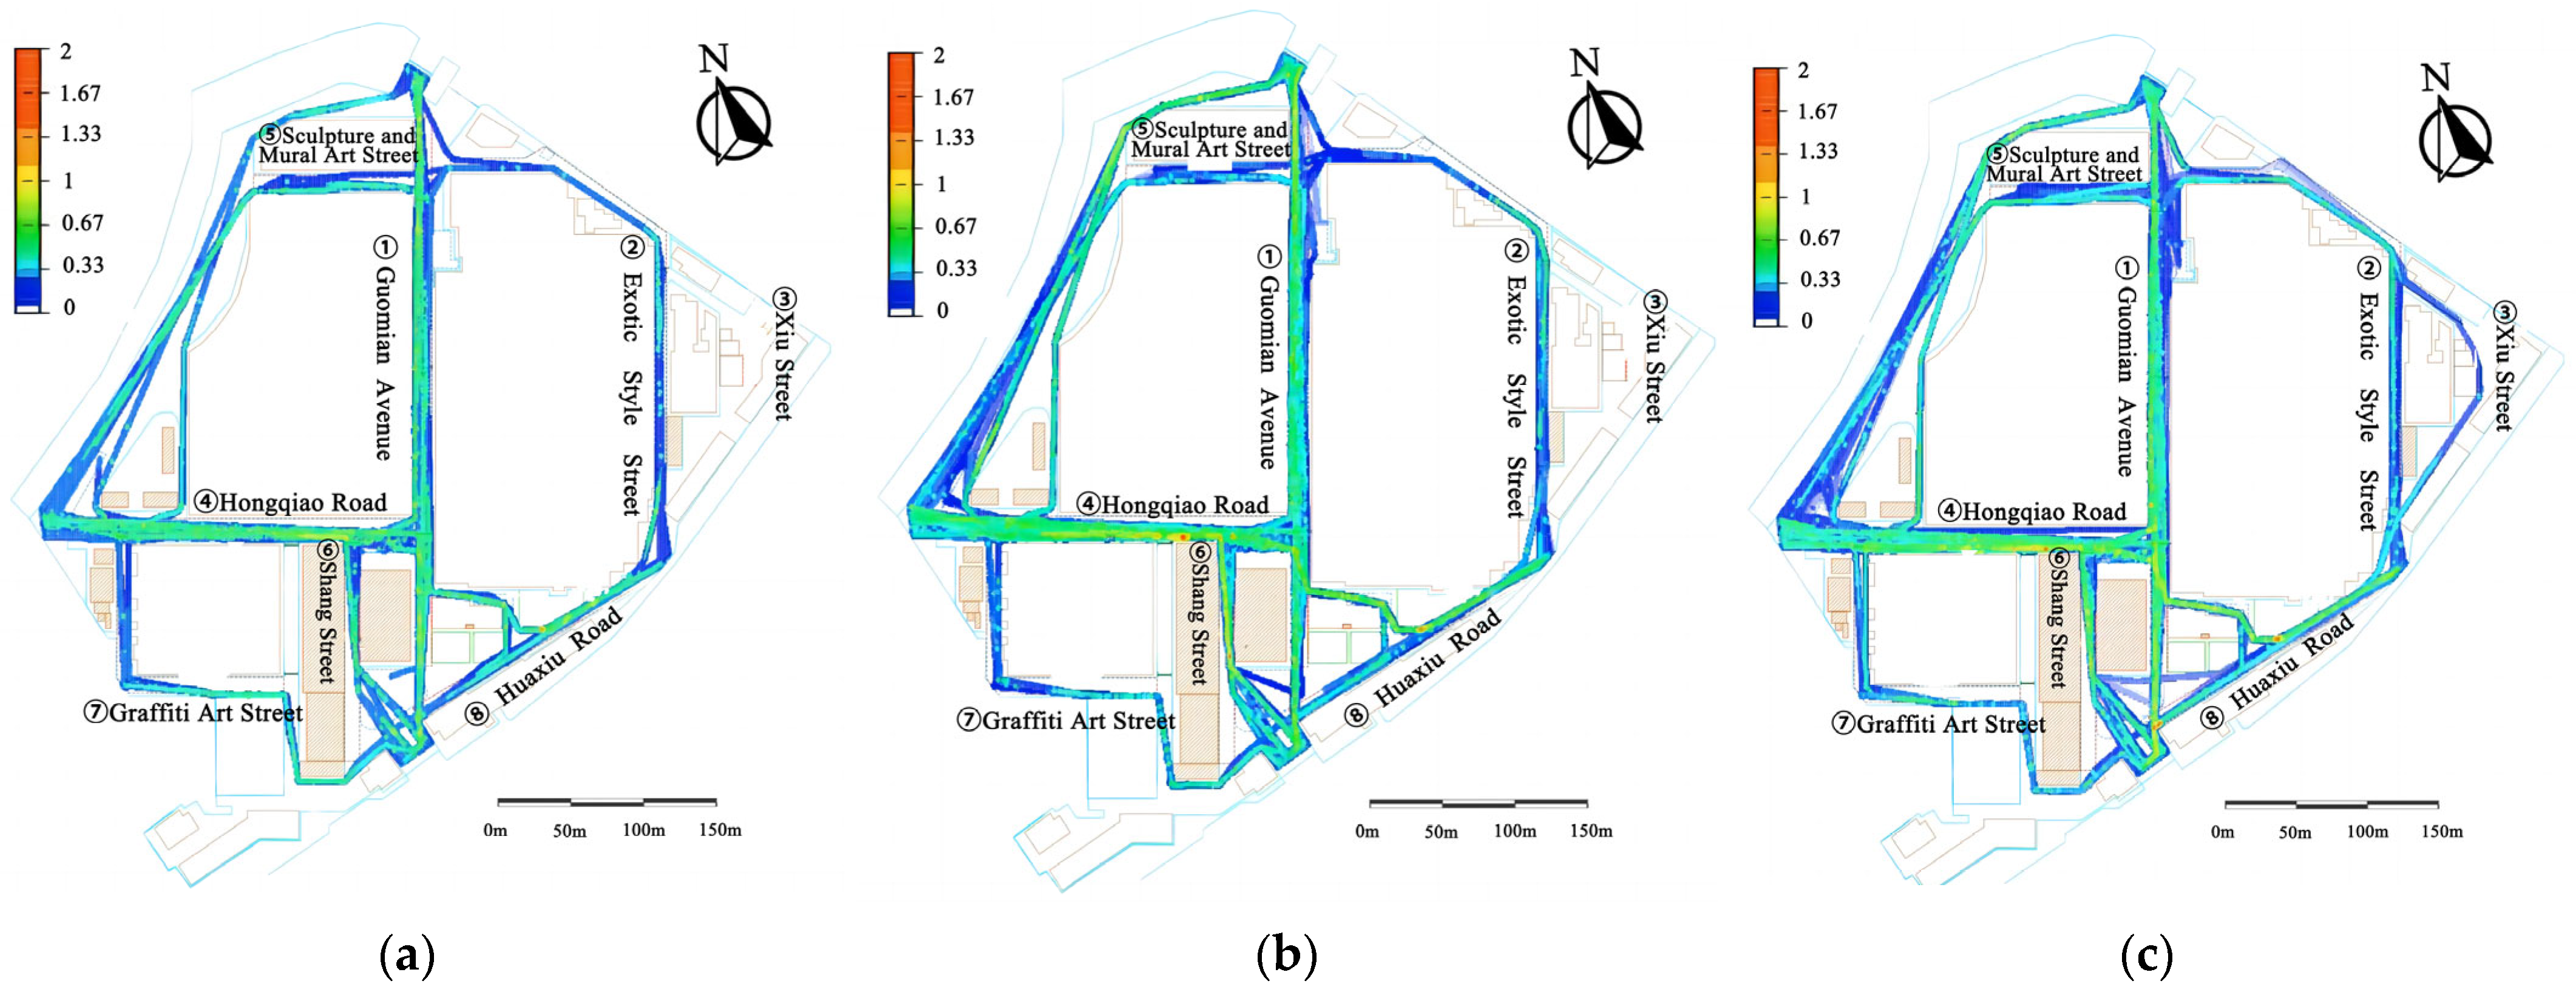
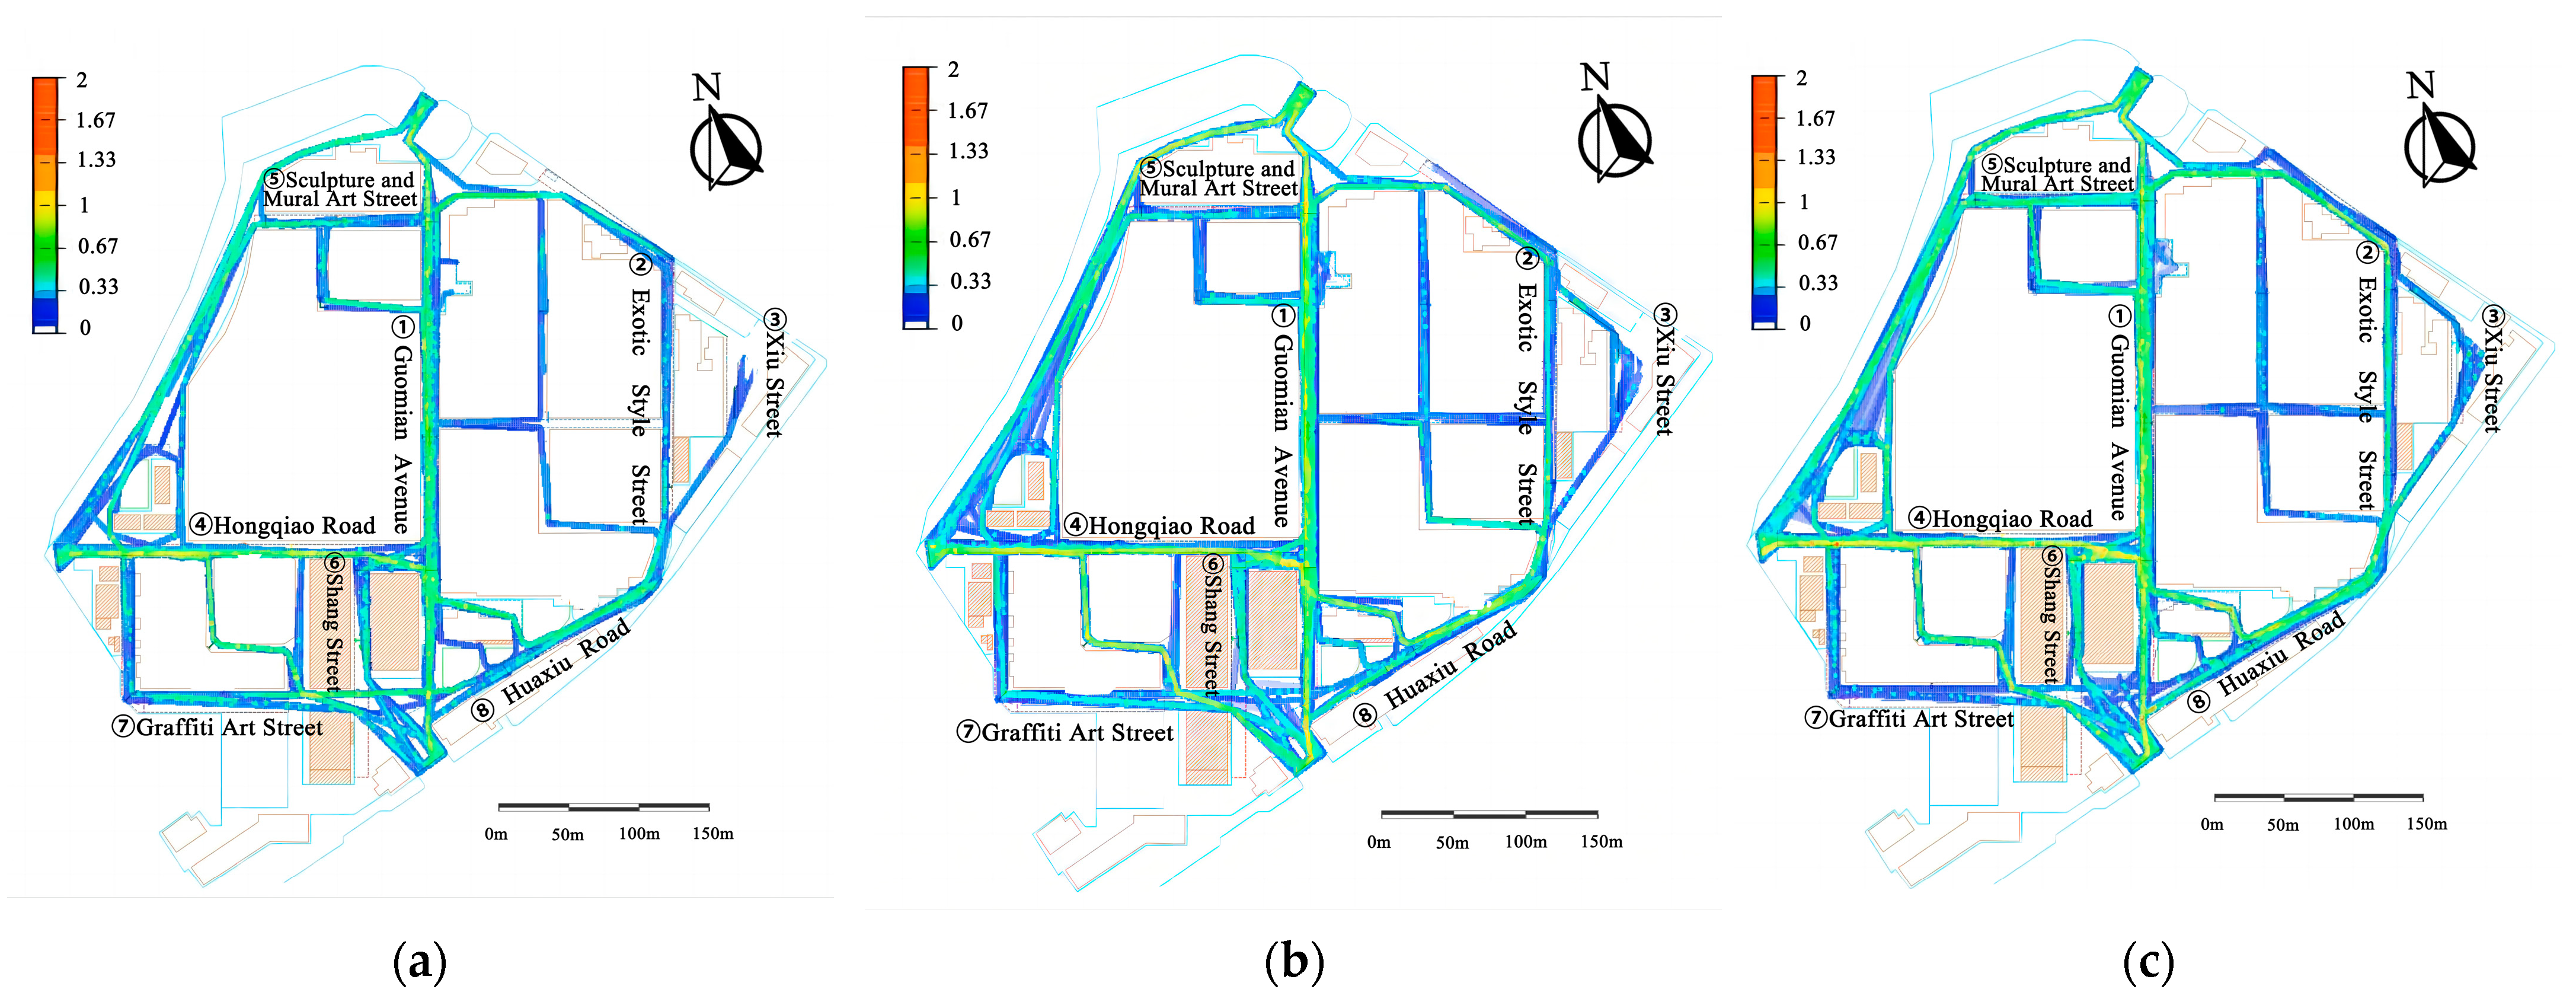
Figure 4 presents the crowd density map generated by the simulation. The consistency index
d between the actual survey data during peak hours and the simulation results from running the software for half an hour is 0.985, indicating a high degree of consistency. Therefore, the data obtained from the Anylogic simulation are used as feedback to reflect the actual vitality of the street. This study extracts pedestrian density maps at three representative time points—10 min, 30 min, and 50 min after pedestrians enter the Textile Valley Creative Industry Park. These correspond to the initial stage, mid-process turning point, and final stage in the pedestrian passage simulation process. The initial time point illustrates the initial distribution and preparation state of pedestrians, providing a basis for subsequent analysis. The middle time point captures critical turning situations during the passage process, such as congestion formation and changes in diversion patterns. The final time point presents the ultimate outcome of the pedestrian flow simulation. The analysis of the diagram indicates potential congestion bottlenecks at Hongqiao Road, Huaxiu Road, and the South Entrance Square, which require targeted mitigation measures. In contrast, Xiu Street and Sculpture Mural Art Street exhibit minimal pedestrian crossing activity.
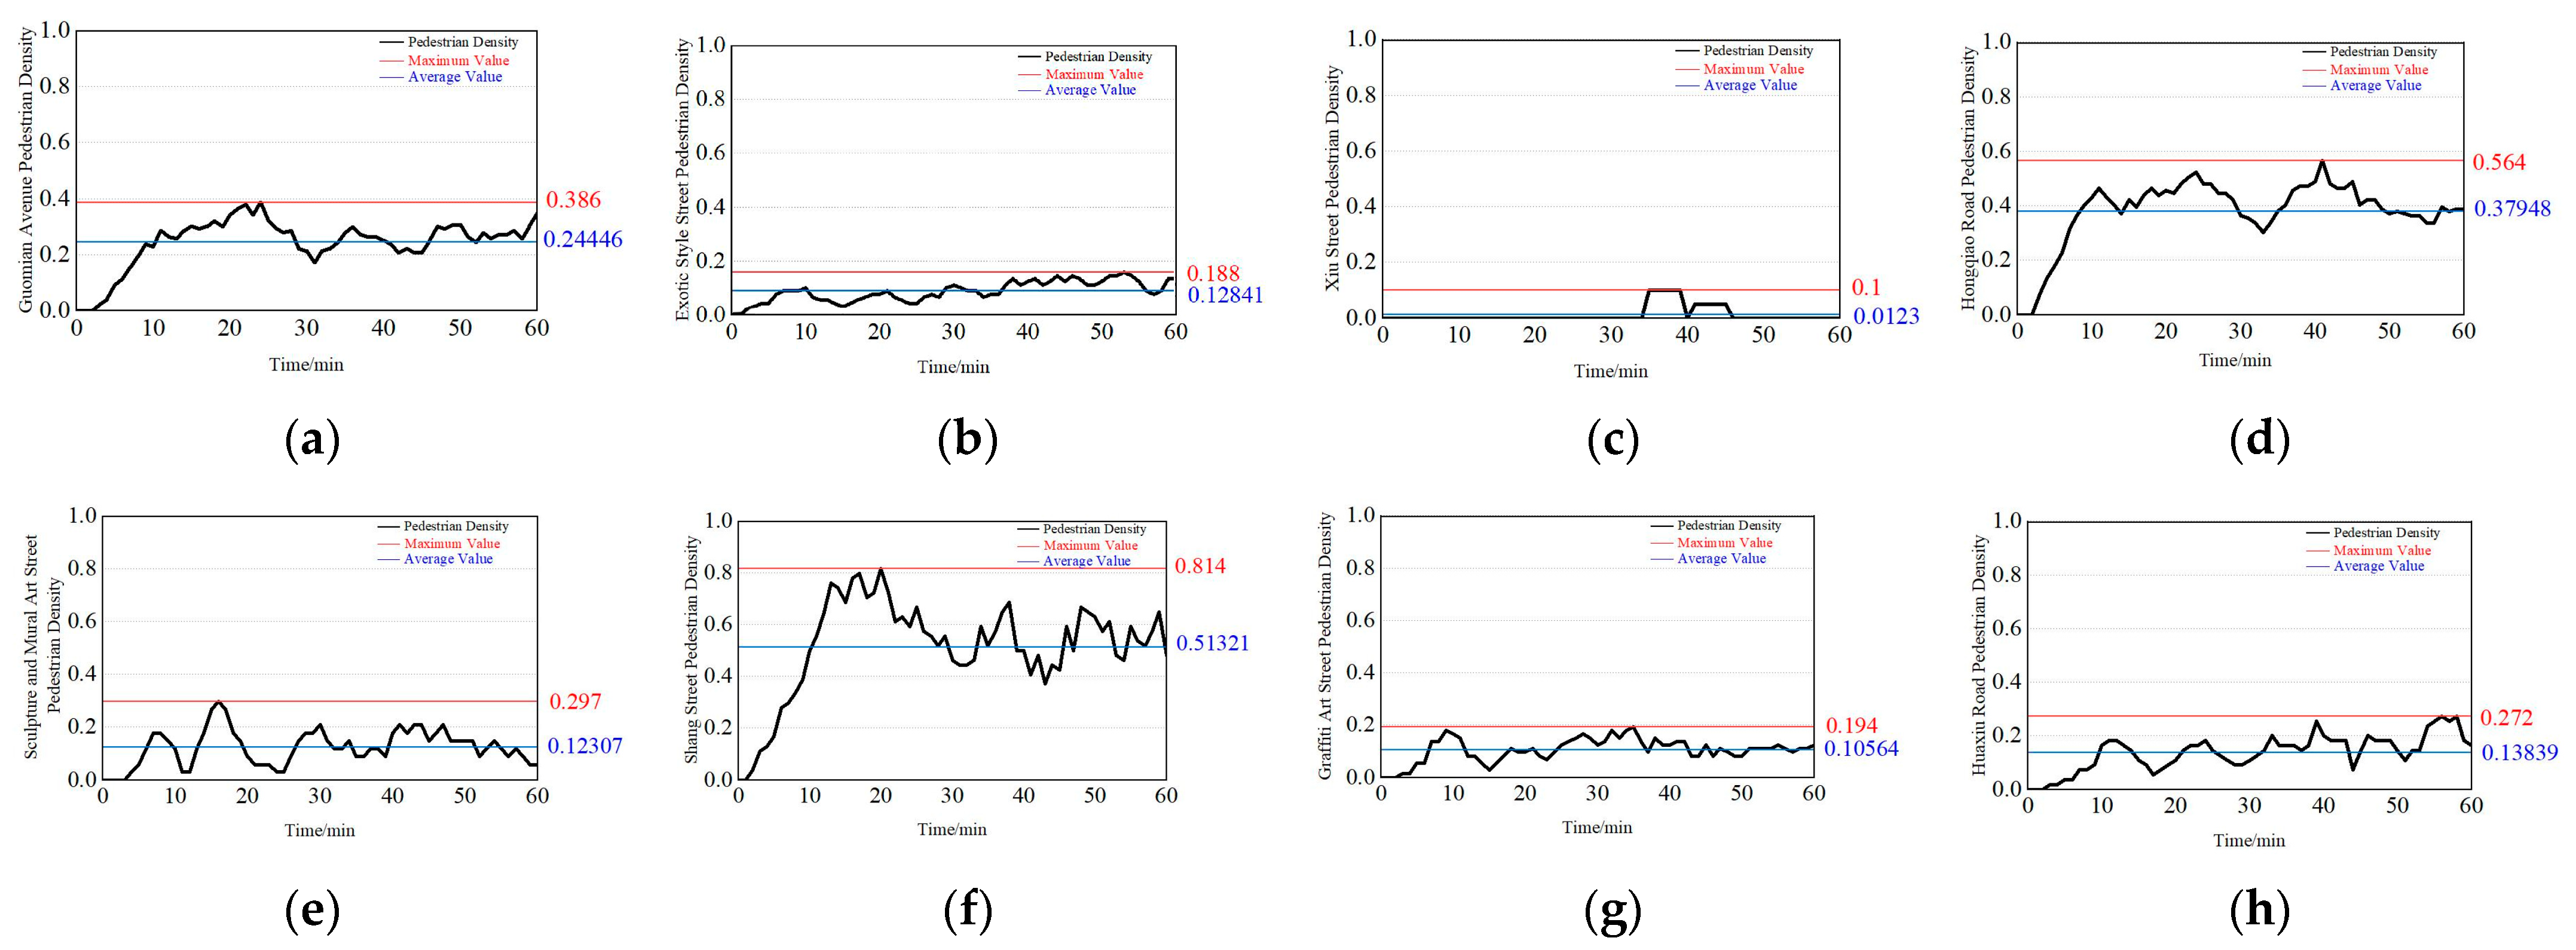
After the Anylogic simulation runs for one hour, the pedestrian density data of each street are exported as a line chart showing the changes over time (
Figure 5). The street pedestrian density map generated by AnyLogic simulation elucidates the varying levels of pedestrian vitality across different streets within the study area, demonstrating the spatial characteristics and distribution patterns of pedestrian activity. The distribution of street pedestrian vitality exhibits a core–periphery structure: streets in the core area exhibit significantly higher vitality compared to those in the peripheral areas. This pattern underscores the impact of spatial functional layout and street accessibility on pedestrian movement, offering critical insights for optimizing street design and enhancing the overall vitality of the urban block. Based on the analysis of the simulation results after one hour of model operation, it is evident that Guomian Avenue, Hongqiao Road, and Shang Street are high-activity streets, with maximum pedestrian densities of 0.386 persons/m
2, 0.814 persons/m
2, and 0.564 persons/m
2, respectively. The intersections of these streets, along with the adjacent South Entrance Square, serve as the activity hubs of the entire park. Conversely, peripheral roads such as Xiu Street and Sculpture Mural Art Street exhibit relatively lower pedestrian traffic, with maximum densities of 0.1 persons/m
2 and 0.194 persons/m
2, respectively, classifying them as low-activity streets.
4.3. The Results of the Park Accessibility Index
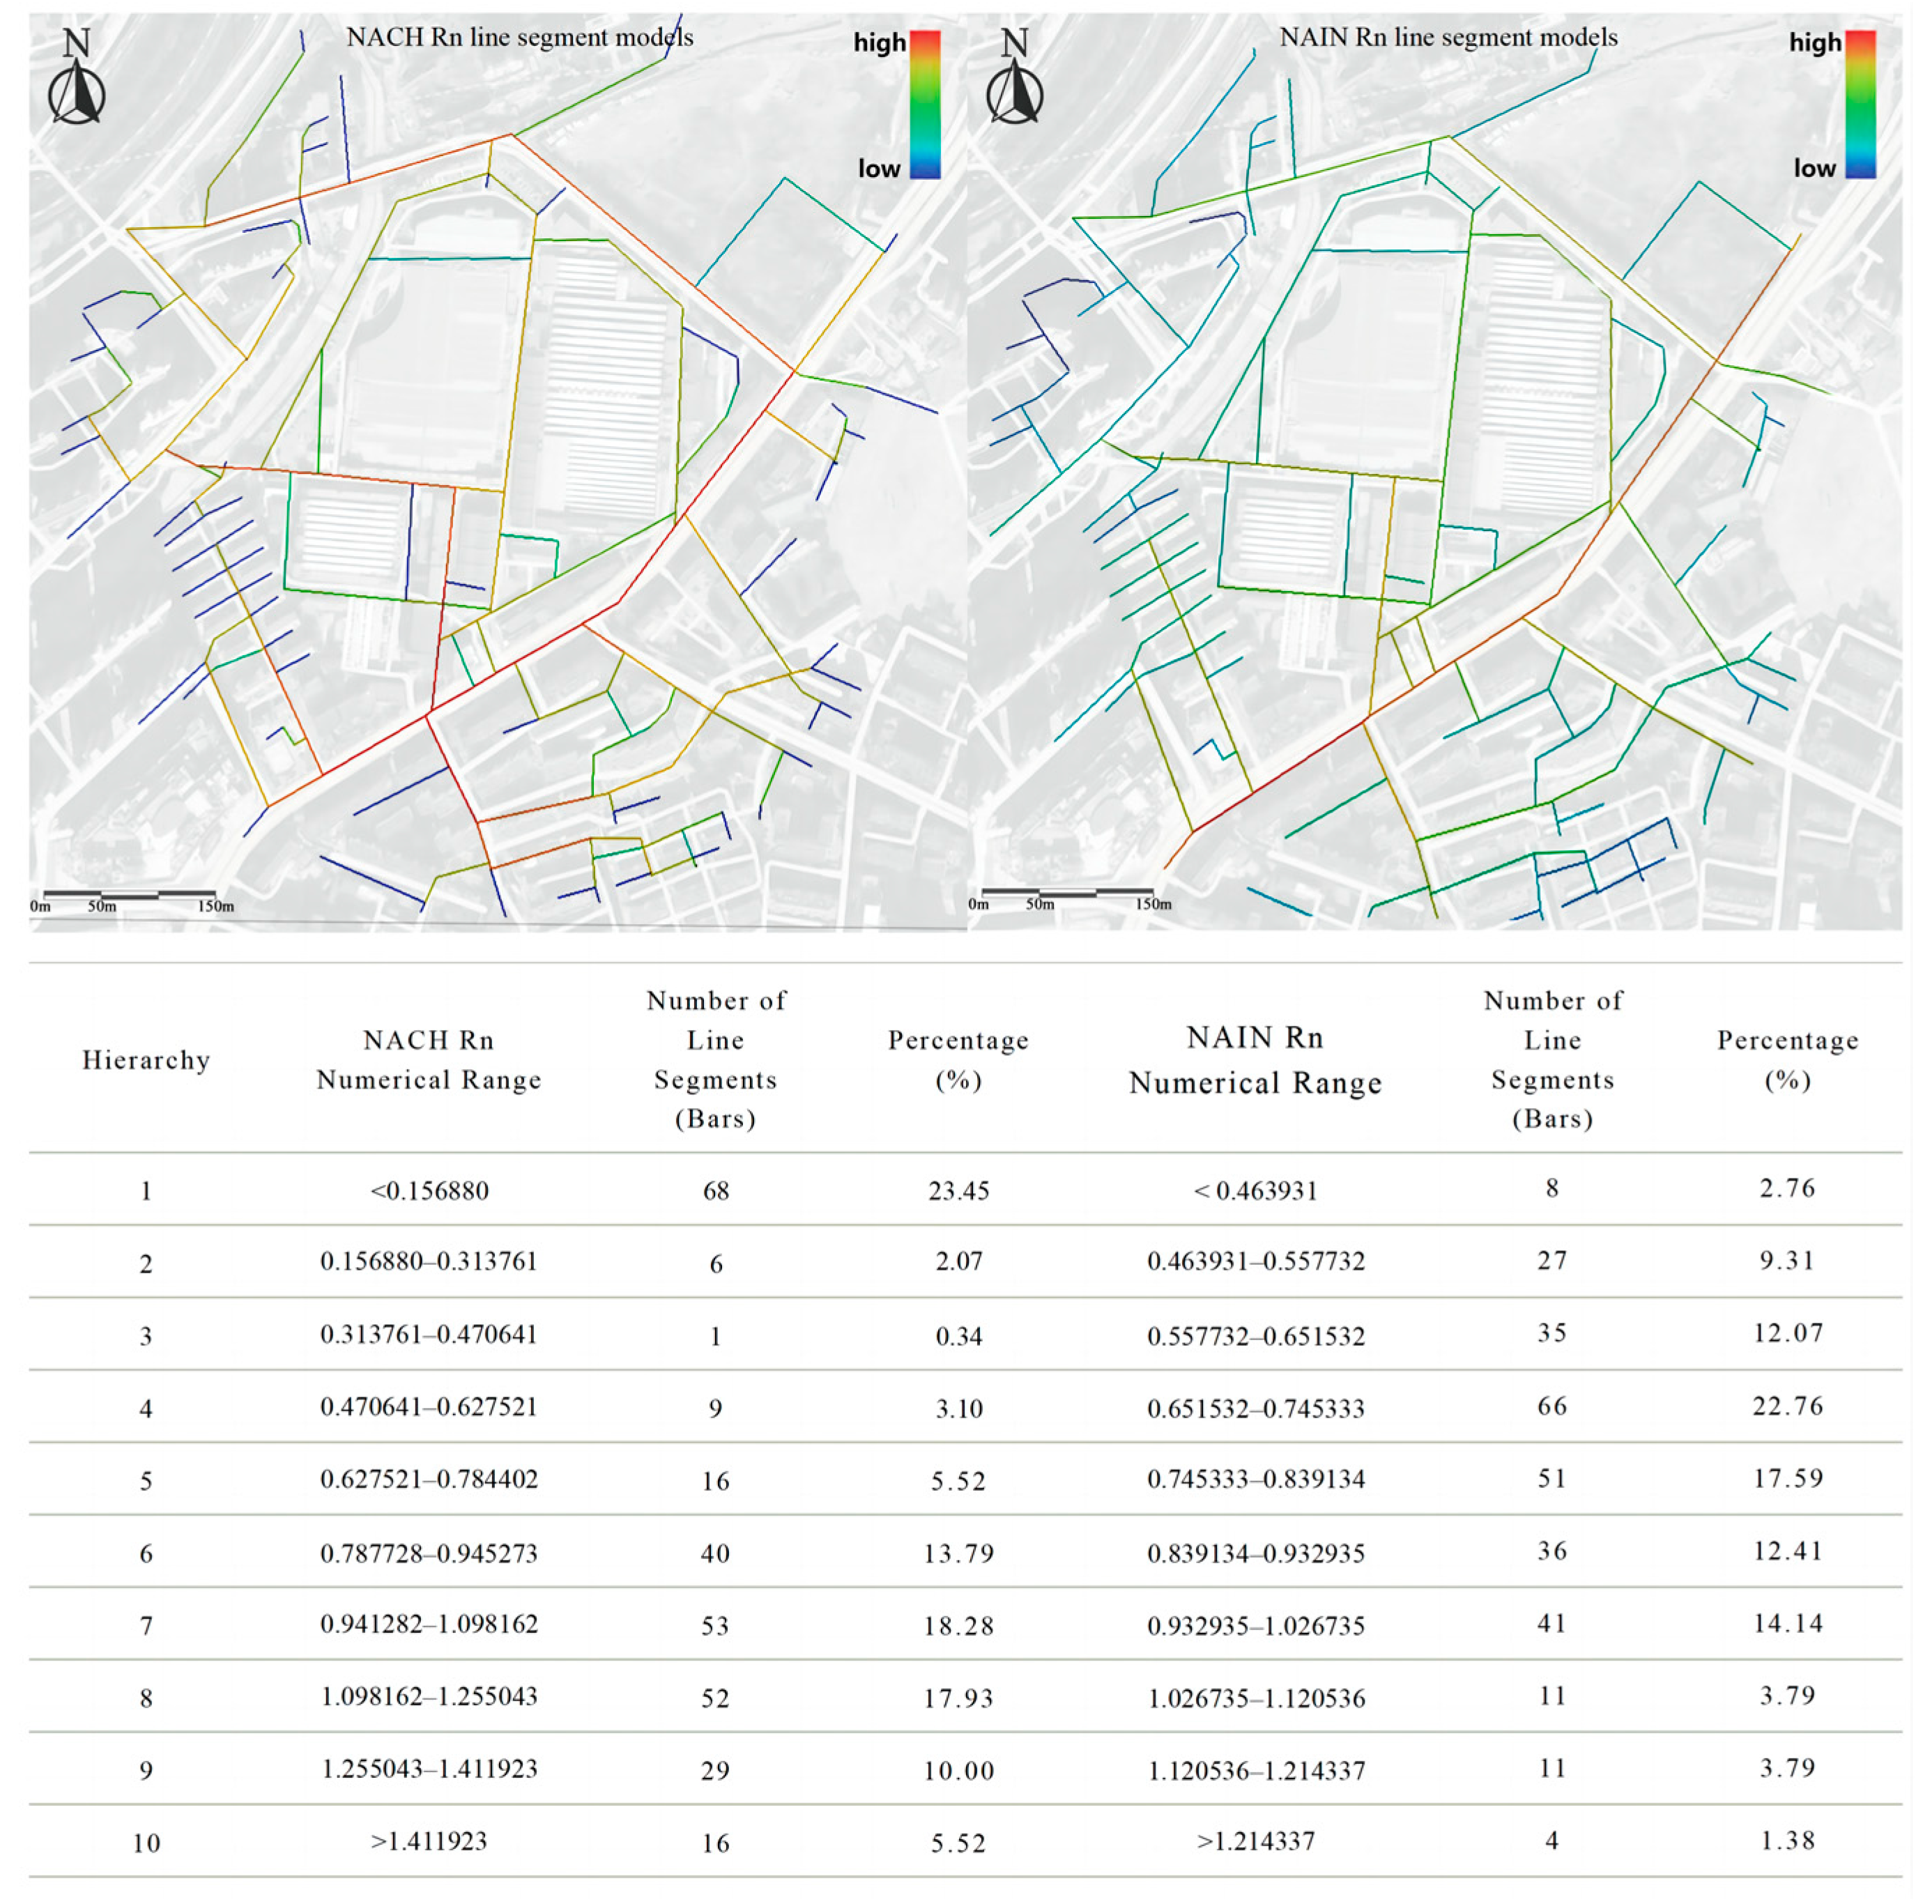
This study performed NACH Rn and NAIN Rn accessibility analyses on the line segment model of the road network in Textile Valley. The model consists of 290 line segments, which are categorized into ten levels based on their traversal degree parameter values. Each road segment is represented by a different color, with warmer colors indicating higher parameter values and cooler colors representing lower ones. The specific parameter values and the number of line segments corresponding to each color category are illustrated in
Figure 6. A higher traversal degree value for a given line segment indicates that the associated road is traversed more frequently by other roads within the park, reflecting stronger accessibility. Similarly, a higher integration value signifies greater spatial integration with other roads, thereby enhancing overall network accessibility. Spaces with NACH Rn values exceeding 0.941 account for 51.7% of the total, surpassing the average value of 0.794, which suggests that many primary roads in the Textile Valley exhibit high traversal characteristics. Conversely, only 35.52% of road sections have NAIN Rn values above 0.839, which is still higher than the overall average of 0.780. This finding implies that the integration and connectivity of most roads within the park require further improvement.
By calculating the average NACH value of the line segments of the eight studied streets and determining their grades, the following can be concluded: The south entrance on Sifang South Road, as the main entrance and exit of the park, has a high NACH value of 0.993 and serves as a critical connection point for internal and external traffic. Guomian Avenue, as the main connecting road to the south entrance, has an NACH value of 1.181 and constitutes one of the park’s key traffic arteries. Shang Street and Hongqiao Road, shown as high-value areas (red and orange), belong to the main traffic skeletons of the park, with respective NACH values of 1.418 and 1.354, indicating strong passability and pedestrian attraction. High-value points also appear on Exotic Style Street and Huaxiu Road, with NACH values of 1.007 and 1.087, respectively, which carry significant through-traffic in the Textile Valley and exhibit good connectivity with surrounding streets, thereby possessing a high locational value. In contrast, Xiu Street and Sculpture Mural Art Street have lower-grade values, with NACH values of 0.412 and 0.498, respectively, indicating poor accessibility.
Similarly, by calculating the average NAIN value of the line segments of the eight streets and subsequently determining their grades, the following can be concluded: High-integration-degree areas in Textile Valley are concentrated in central regions such as Shang Street and Hongqiao Road, as well as sections connected to main roads. Their respective NAIN values are 1.055 and 0.942, which indicate that these roads possess strong network centrality and play a critical role in facilitating both internal and external traffic within the park. Guomian Avenue, as the core arterial road, has a NAIN value of 0.905, connects multiple secondary roads within the park, including Exotic Street and Huaxiu Road, and enhances the overall traffic network structure by connecting with highly integrated roads like Hongqiao Road. In contrast, Xiu Street and Sculpture Mural Art Street show relatively lower integration compared to the other roads, with respective NAIN values of 0.763 and 0.719.
Through the analysis of NACH and NAIN, it can be clearly seen that the main roads in Textile Valley, such as Guomian Avenue, Hongqiao Road, and Shang Street, occupy a core position in the transportation network. These high-value roads not only have high permeability in their spatial structure but also possess good integration. The roads in low-value areas, such as Xiu Street and Sculpture Mural Art Street, due to their remote locations or inactive business types, show lower centrality and accessibility.
4.4. Comprehensive Analysis of Each Road
The simulation results of the model align with the findings from the on-site investigation. Spatial accessibility exerts a differentiated influence on human behavior. High-vitality areas are typically connected to major thoroughfares, and the transitions between different road levels are relatively seamless. Under the radiating effect of the main roads, this layout establishes a relatively balanced “sub-network,” thereby fostering more opportunities for social interaction among pedestrians on the streets. The quantitative data regarding the various indicators of pedestrian activities and spatial accessibility within the park are presented in
Table 2.
Based on the results of the space syntax analysis and on-site measurement data, Shang Street, Hongqiao Road, and Guomian Avenue exhibit average pedestrian densities of 0.513 p/m2, 0.379 p/m2, and 0.244 p/m2, respectively, classifying them as high-vitality streets. As traffic-center streets, their NACH grades are 10, 9, and 8, respectively, while their NAIN grades are 8, 7, and 6, respectively, all ranking among the higher grades across all sections (the larger the value, the higher the grade). Consequently, these streets demonstrate high accessibility and integration, convenient transportation, and diverse functions.
Huaxiu Road and Exotic Style Street have average pedestrian densities of 0.138 p/m2 and 0.128 p/m2, respectively. Located in the middle of the park, they possess NACH grades of 7 and NAIN grades of 6, both at a medium level. Therefore, these streets may exhibit deficiencies in functional support, integration, and overall attractiveness.
Sculpture Mural Art Street, Graffiti Art Street, and Xiu Street display average pedestrian densities of 0.123 p/m2, 0.106 p/m2, and 0.012 p/m2, respectively, categorizing them as low-vitality streets. Positioned at the edge of the park, they have NACH grades of 6, 4, and 3, respectively, and NAIN grades of 5, 4, and 5, respectively, all ranking among the lower grades across all sections. As a result, their overall connectivity is limited, and their transportation conditions and functions are relatively weak, lacking appeal to pedestrians.
4.5. Correlation Analysis of Street Accessibility and Spatial Vitality
This study employed SPSS software to investigate the correlation between spatial syntax indicators (NAIN and NACH) and average pedestrian density and elucidate the correlations of spatial accessibility on the distribution of pedestrian activity. Kolmogorov–Smirnov and Shapiro–Wilk tests revealed that the significance levels for the average pedestrian density, NAIN, and NACH were all above 0.05 (
Table 3), indicating that these variables did not significantly deviate from a normal distribution, thus satisfying the prerequisites for Pearson correlation analysis.
The Pearson correlation coefficient between the NAIN and average pedestrian flow density is 0.780 (
p = 0.022), indicating a significant positive correlation. This result suggests that areas with higher spatial integration tend to exhibit greater pedestrian flow density, thereby validating the theoretical expectation that spatial integration exerts an attractive effect on pedestrian movement. The correlation coefficient between the NACH and average pedestrian flow density is 0.816 (
p = 0.013), demonstrating an even stronger positive correlation (
Table 4). Areas with higher spatial selectivity significantly enhance pedestrian flow density, further underscoring the critical role of network selectivity in spatial usage. The significant positive correlations between the NAIN, NACH, and pedestrian density suggest that enhancing spatial integration and selectivity can effectively guide pedestrian distribution and optimize the efficiency of space utilization.
The research results demonstrate that the NAIN and NACH are crucial spatial syntax indicators influencing pedestrian density, both of which exhibit significant positive correlations with the average pedestrian density, consistent with spatial syntax theory. Spaces characterized by high integration and high choice values exhibit significant characteristics in attracting individuals, thereby offering valuable insights for optimizing urban space design, pedestrian network planning, and transportation hub layout.
4.6. The Results of the Optimization and Simulation Verification
4.6.1. Optimization Strategy
The following improvement strategies are proposed for the existing problems in the Textile Valley streets:
Increase the density of pedestrian pathways, particularly by augmenting the number of paths in core urban areas and refining the layout of pedestrian infrastructure in high-footfall zones. This will enhance the diversity and accessibility of walking options, thereby promoting pedestrian mobility and safety [
50]. Optimize intersection design by refining turning nodes, reducing turning radius, and ensuring smoother pedestrian passage through key areas. For instance, establish a dedicated pedestrian loop along Huaxiu Road, Graffiti Art Street, Xiu Street, and Hongqiao North Road (
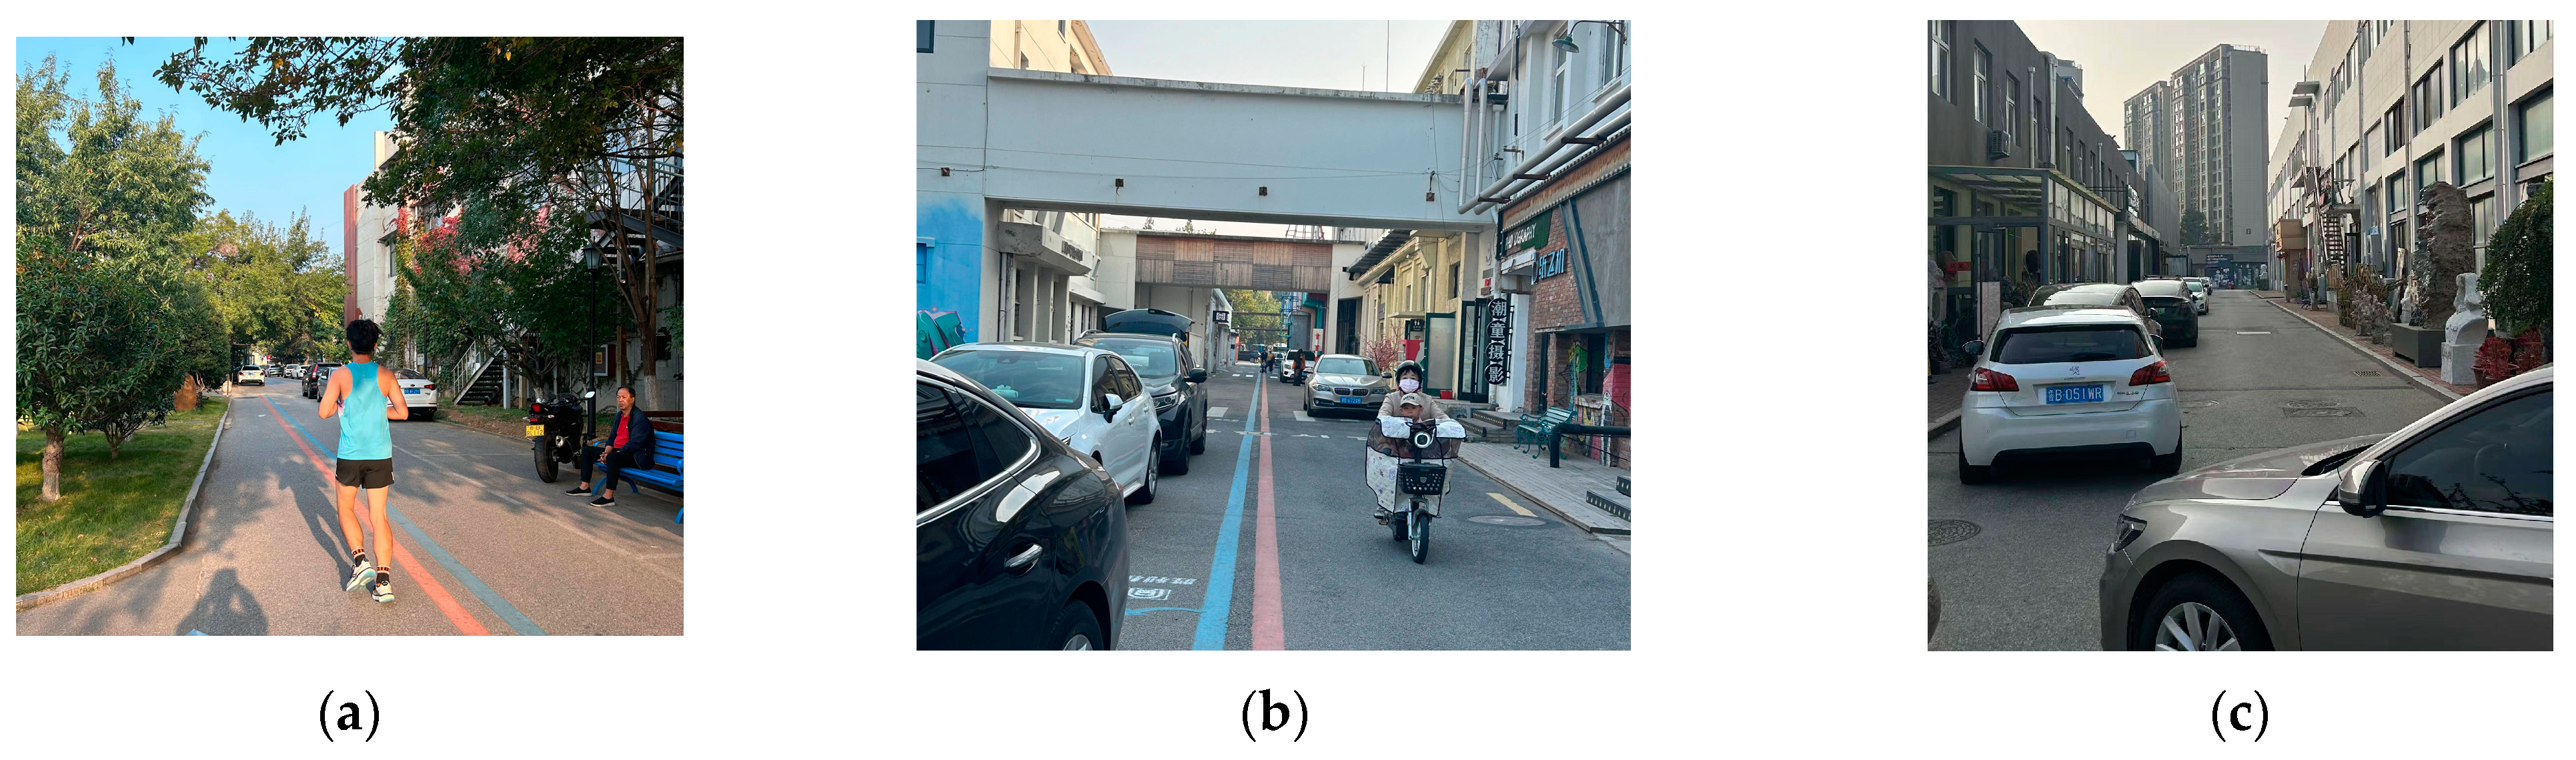
Figure 7a). Differentiate pedestrian and vehicle lanes using color-coded roads to prevent mixed use and reduce traffic chaos (
Figure 7b,c). Where necessary, employ green plants as separators. Develop green plant gardens along fitness loops, such as on the idle land along Hongqiao North Road, to enhance the environment. Add new roads along Exotic Style Street to create distinctive and functional intersections.
- 2.
Enhance the Connectivity of the Pedestrian Network
Improve Pedestrian Path Connections: Supplement or enhance existing pedestrian paths, particularly those connecting different areas of the park, to reduce dead ends and blind spots and improve overall connectivity [
51]. This will ensure smoother and more efficient pedestrian movement. Increase Intersection Frequency: Enhance the intersection frequency of pedestrian paths to make walking routes between different areas more direct, thereby improving the integration of these areas. For example, add new road connections from key road networks such as Guomian Avenue and Hongqiao Road to low-vitality and low-reachability streets like Graffiti Art Street and Sculpture Mural Art Street. Establish new entrances and exits at the corners of Exotic Style Street to increase the number of intersections between internal park roads and external roads.
4.6.2. Optimization Design and Simulation Verification
The Depthmap tool was employed to optimize the road network of the Textile Valley Park. After multiple iterations of computation, the optimized road network was derived (
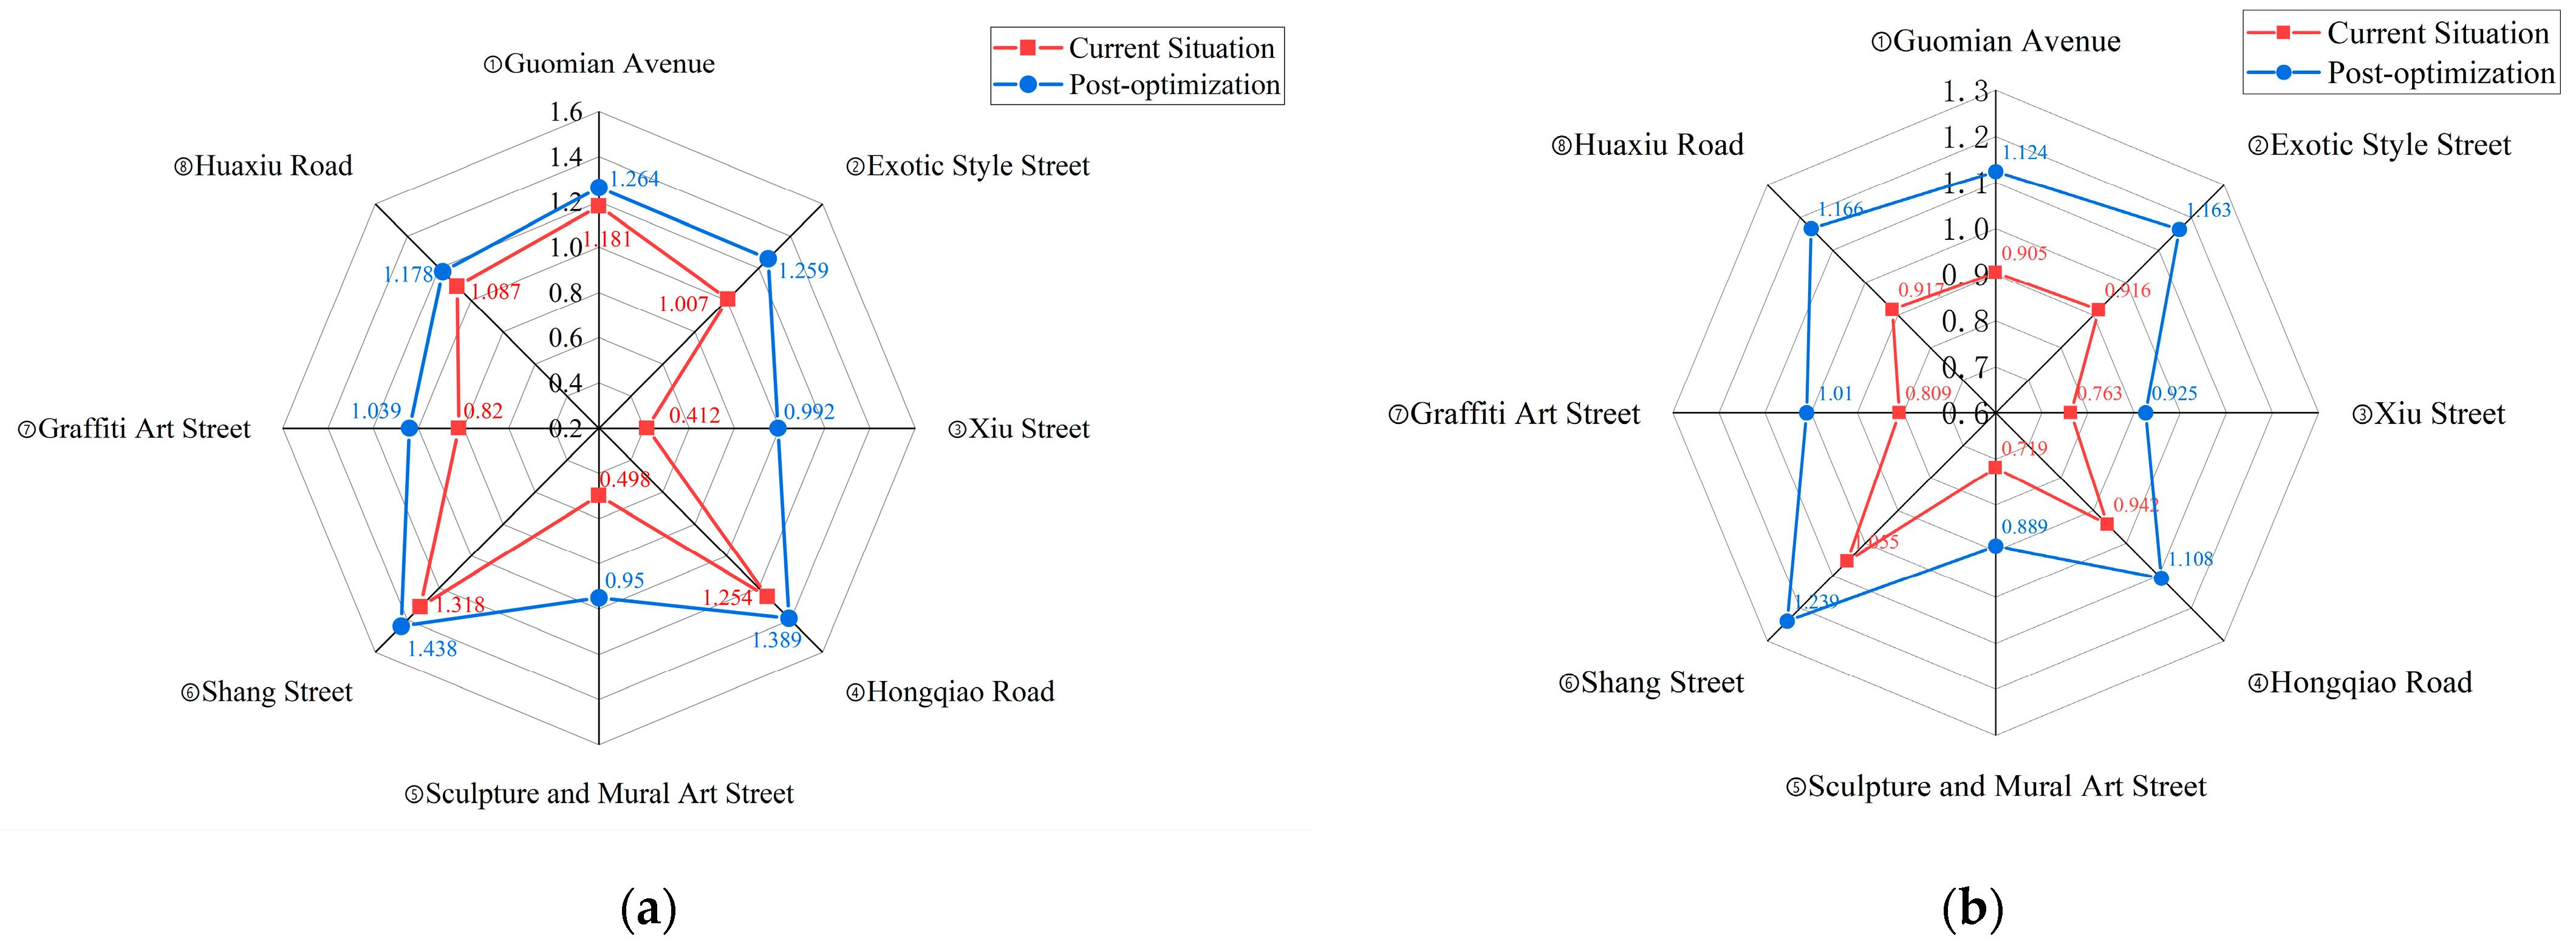
Figure 8). Following optimization, the average NACH and NAIN values of the overall road network increased by 0.05 and 0.13, respectively. The proportions of line segments exceeding the average value rose by 3.33% and 7.72%, respectively. Moreover, the NACH and NAIN values of the eight primary streets were markedly enhanced, leading to improved accessibility (
Figure 9).
Based on the above improvement strategies, the optimized design plan for the Textile Valley Park is shown in
Figure 10.
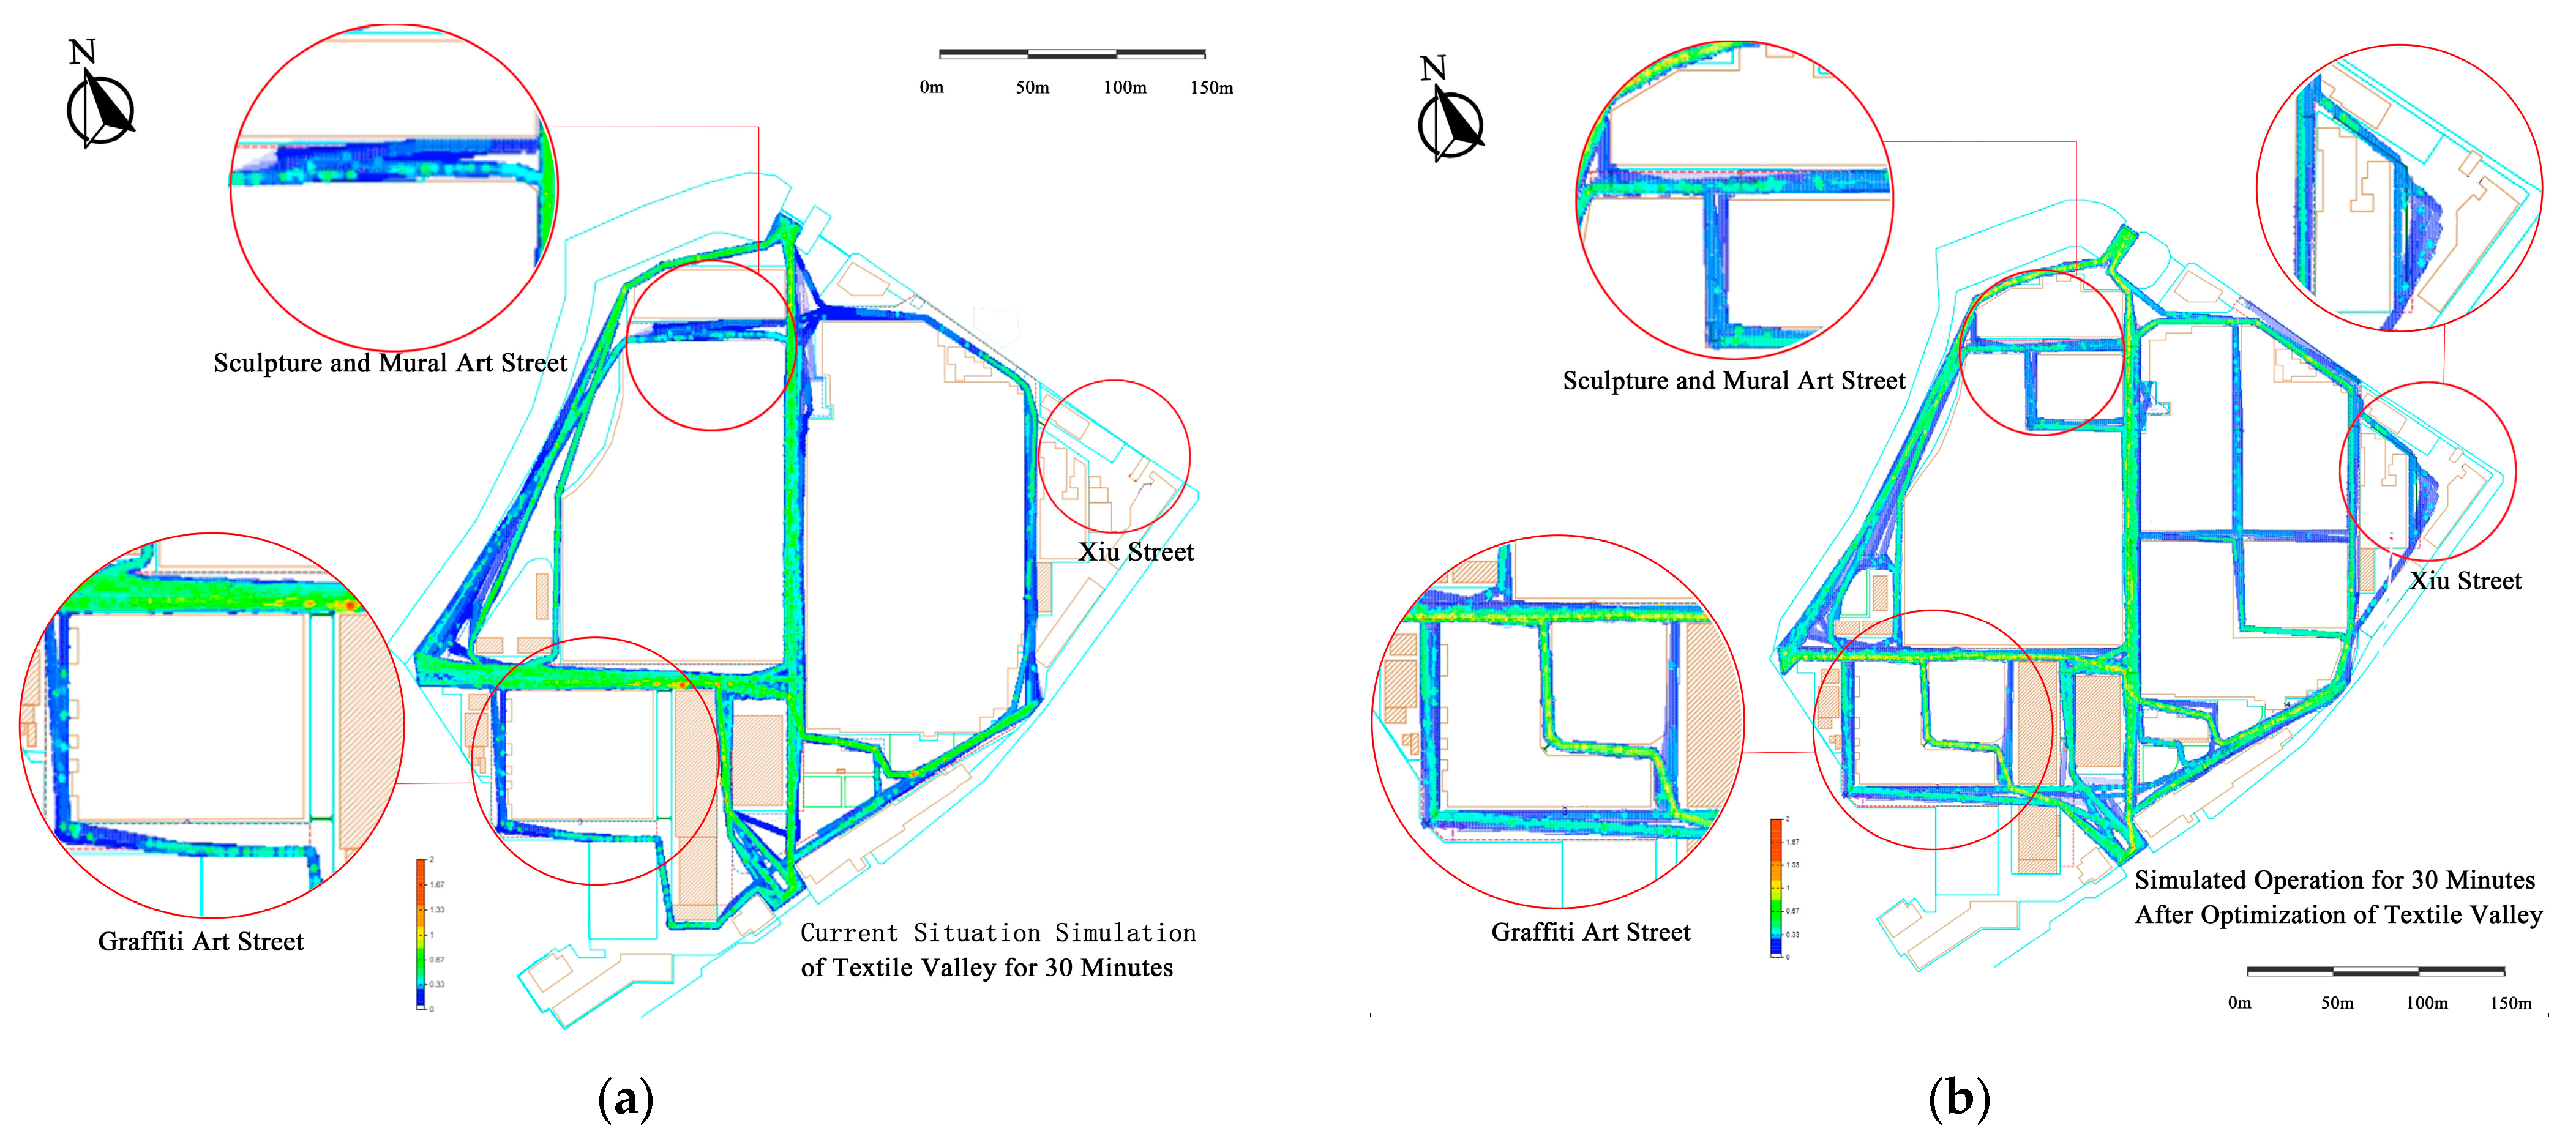
The data from the optimized plan were input into AnyLogic. The resulting simulation graphs indicate that the pedestrian flow in the peripheral streets, which previously exhibited low vitality, improved. Meanwhile, the congestion in the core streets, characterized by high pedestrian activity, were effectively alleviated (
Figure 11 and
Figure 12). Specifically, areas that previously had a lower pedestrian density, such as Xiu Street and Graffiti Art Street, experienced an increase in pedestrian density. The optimized plan alleviated the excessive use and congestion of recreational facilities in key areas of the original park, such as near the dedication sculpture on Huaxiu Road and beside the stillwater pool along Guomian Avenue. Pedestrian density increased in various areas of the park, including nodes like the China Courtyard and the Bauhaus Workshop.
Table 5 shows the average pedestrian density of the streets before and after optimization. Streets with a relatively high pedestrian density showed a reduction in congestion, while those with a very low pedestrian density experienced an increase. These results indicate that the optimization strategy is both feasible and effective.
5. Discussion and Conclusions
5.1. Discussion
This study investigated the relationship between pedestrian vitality and the Normalized Angle Choice Heterogeneity (NACH) and Normalized Angle Integration (NAIN) based on spatial accessibility. The results demonstrated that the correlation coefficients between the NACH and NAIN and the average pedestrian density were 0.816 and 0.780, respectively. These findings indicate that spatial integration and choice degrees significantly influence street-level pedestrian vitality, presenting a strong positive correlation. Based on these insights, an optimization strategy for enhancing spatial accessibility was proposed. This strategy led to an increase in the average NACH and NAIN values of the overall road network by 0.05 and 0.13, respectively, while the proportion of line segments exceeding the average value rose by 3.33% and 7.72%. Notably, the NACH and NAIN values of the eight main streets in the Textile Valley Park were markedly improved. Simulations validating the optimization scheme revealed a more balanced overall pedestrian density across the main streets, alleviating congestion on core streets and enhancing pedestrian vitality on peripheral streets.
By integrating Anylogic dynamic simulation with Depthmap spatial configuration analysis, this study developed a “behavior–space” dual-dimensional verification framework tailored to industrial heritage contexts. This approach significantly enhanced the accuracy of pedestrian flow prediction. Compared to traditional paradigms reliant on subjective questionnaire surveys or static topological analyses [
14,
15,
45], the proposed framework leverages multi-agent behavior rule modeling and social force parameter calibration to visualize pedestrian density distribution throughout the day. As a result, it serves as a robust dynamic quantitative analysis tool for studying crowd behavior in creative industrial parks.
Based on the spatial redundancy characteristics of industrial heritage, this study proposes the theoretical approach of “microscopic accessibility intervention”, which focuses on optimizing key elements such as road network density, intersection design, and pedestrian connectivity. This approach overcomes the limitation of the existing research, which prioritizes global integration (e.g., space syntax) while overlooking localized spatial renewal. By adjusting the spatial modules such as nodes and paths in the model according to practical requirements, this study investigates the changing patterns of human activity behaviors under various spatial configurations. These findings provide valuable insights and support for the spatial planning, performance evaluation, and maintenance management of industrial heritage spaces, demonstrating high applicability in subsequent related practices.
5.2. Conclusions
Based on field research in Qingdao Textile Valley, this study utilized the AnyLogic platform and space syntax tools to analyze the pedestrian density and accessibility of eight main roads within the park. It was found that some peripheral streets exhibited low pedestrian density and poor accessibility. To address these issues, this study improved the accessibility of peripheral roads by increasing the density of the pedestrian network and strengthening the connectivity of the pedestrian network. These measures optimized pedestrian density in the park and significantly enhanced pedestrian vitality. The research approach and methods provide valuable references for creative industrial parks and other types of industrial heritage protection and reuse projects, offering significant value for enhancing the vitality and quality of public spaces during urban renewal processes.
Constrained by time and space limitations, this study focuses solely on pedestrian density as the core indicator for measuring vitality, without considering other potential factors that may influence pedestrian vitality, such as pedestrian dwell time, fluctuations in activity timing, and the extent of pedestrian congregation. Furthermore, while this study uses Qingdao Textile Valley as its research subject, Qingdao also hosts other types of industrial heritage creative parks, including Sifang Locomotive Factory and the sixth textile factory in Qingdao. Thus, a systematic investigation of additional cases is necessary to accumulate practical experience and uncover the underlying patterns of renewal strategies for creative industrial parks.


