Article

Exploring the Impact of Waterfront Street Environments on Human Perception

1
Faculty of Environmental Engineering, The University of Kitakyushu, Kitakyushu 808-0135, Japan
2
School of Architecture and Urban Planning, Shenyang Jianzhu University, Shenyang 110168, China
3
School of Art and Design, Shenyang Jianzhu University, Shenyang 110168, China
*
Authors to whom correspondence should be addressed.
Buildings 2025, 15(10), 1678; https://doi.org/10.3390/buildings15101678
Submission received: 27 March 2025 / Revised: 27 April 2025 / Accepted: 13 May 2025 / Published: 16 May 2025
(This article belongs to the Section Architectural Design, Urban Science, and Real Estate)

Abstract

Urban waterfront streets are important mediators that reflect a city’s image and characteristics. They play a positive role in enhancing residents’ cohesion, mental and physical health, and social interactions. Human perceptions represent individuals’ psychological experiences and feelings toward the surrounding environment. Previous studies have explored the impact of urban street-built environmental factors on perceptions; however, research focusing on waterfront street environments and their impacts on human perceptions remains limited. Therefore, exploring the specific impact of waterfront street environmental characteristics on different dimensions of human perception is essential for guiding the development of livable cities. Based on Street View images (SVIs), this study applied artificial neural networks and machine learning semantic segmentation techniques to obtain physical feature data and human perception data of the Murasaki River waterfront line spaces in Kitakyushu, Japan. In addition, correlation and regression analyses were conducted to explore the specific impact of physical features on different dimensions of human perception in waterfront line spaces, and corresponding optimization strategies were proposed. The results show that street greenness significantly enhances perceptions of safety, wealth, and beauty, while effectively reducing boredom and depression. Furthermore, the building visual ratio contributes to increased street vitality. On the other hand, physical features such as openness, spatial indicators, and environmental color diversity have negative effects on positive perceptions, including safety and vitality. In particular, openness significantly increases boredom and depression. This study advances the exploration of urban waterfront street environments from the perspective of human perception, providing a theoretical foundation for improving the spatial quality of waterfront streets and offering references for human-centered urban planning and construction.

1. Introduction

Urban waterfront space is an important linear open space in the city, with the potential to serve as a high-quality urban environmental resource [1]. Compared to ordinary urban streets, waterfront streets typically offer expansive water views, an organic integration of natural and built environments, and diverse spaces for leisure and social activities [2,3]. With their superior ecological functions and landscape quality, waterfront streets have increasingly become vital settings for urban public life [4,5]. Urban waterfront streets not only promote the development of the urban ecology [6], cultural [7], economic [8], and political aspects [9], but also are an important medium for reflecting the urban image [10,11,12]. Studies have shown that the development of urban waterfront streets contributes to urban vitality and enhances the competitiveness and attractiveness of cities [4]. Urban waterfront spaces could effectively improve the emotional responses of people [13]. At the same time, waterfront streets can provide pedestrians with greater walking benefits than other types of urban streets [14]. The redevelopment of waterfront streets has become a key initiative in enhancing the construction of livable cities. However, the renewal and redevelopment of waterfront streets may also generate a range of social impacts, raising concerns, particularly regarding potential inequalities, gentrification processes, and social exclusion. Several studies have noted that, due to their superior landscape resources and investment appeal, waterfront streets have become some of the most tourism-driven areas in urban planning [15,16]. This can result in the displacement of original residents and the restructuring of community composition, ultimately undermining social diversity and spatial inclusivity [17].
Therefore, a key aspect of waterfront street redevelopment is to fully consider residents’ perceptions of the environment, as their experiences not only directly impact the effectiveness of public space usage but also influence the social acceptance and long-term sustainability of the project. Studies have shown that built environments have an impact on the subjective perceptions of residents [18], which greatly influence a person’s impression of a place, socialization, behavior, and willingness to stay [19]. Residents living in different street environments exhibit variations in their emotional states [20,21]. Many studies have shown that people who live in positively perceived environments are more likely to participate in outdoor activities and have healthy lifestyles [22]. Conversely, negative street environments can be detrimental to people’s physical and mental health, including psychological stress [23], sedentary behavior [24], and the risk of drug abuse [25]. Some scholars have analyzed the impact of environmental factors on human perception from such perspectives as urban infrastructure and land use [26,27]; these factors also include climate, lighting, and color [28]. Subsequently, some researchers have realized the significant influence of the street-level built environment features on human perceptions [29]. As vision is the primary means through which people perceive the street environment, related research quantifies the street environment by calculating street physical features based on visual information, such as floor area ratio, greenness, enclosure, street scale, and tidiness [30,31]. Lynch (1960) [32] proposed in The Image of the City that an individual’s perception of the environment is composed of five elements: paths, nodes, districts, edges, and landmarks. Based on this theory, some scholars have researched the impact of the physical features of streets on human perception. For example, sky, tree shade, and wide sidewalks can provide a sense of comfort and safety for residents [33], while large numbers of buildings and obstacles can cause feelings of insecurity, boredom, and depression [34]. The presence of blue spaces in the visual field can alleviate mental fatigue and stress [35]. Wu et al. assessed pedestrians’ perceptions of safety by evaluating such factors as walkability, spatial enclosure, visual permeability, and vitality [36]. Additionally, traffic elements, such as motor vehicles and bicycles, can also influence pedestrians’ sense of safety in the street environment [37]. Some scholars have explored the relationships between comfort and built environment factors, such as street greenery [38,39], street openness [40], and street facilities [41].
The methods for measuring human perception include field surveys [42,43,44], photography [34], emoji-based emotion classification [45,46], cognitive mapping [47], and wearable sensors [48,49]. Early scholars described residents’ neighborhood life in terms of social networks [50]; Montello et al. [51] used face-to-face interviews and questionnaires to investigate residents’ perceptions of street quality; Cao et al. [52] used psychophysical methods such as the Likert scale to measure public emotions and perceptions of street environments and landscapes. In addition, Zhou et al. utilized virtual reality devices to investigate the impact of street landscape elements on people’s perceptions of walking needs [53]. Although these methods have obvious advantages in terms of being close to reality, there are problems such as slow data collection, small scope of research, imbalance between subjective and objective data, and incomplete data. In addition, these methods also have limitations in terms of time and money.
With the rapid development of map services and computer technology, a large number of images depicting the urban environment and attaching geographic information have become accessible to the public [54,55]. Compared to traditional methods such as expert evaluations [56,57] and field surveys [58], Street View images have been widely used to measure the physical features of urban streets due to their rich visual information and extensive coverage [59]. Some researchers have used Street View images to quantify human activity, street quality, and environmental comfort [60,61,62]. In addition, image processing, as one of the most widely utilized applications of deep learning technology [63], offers significant opportunities for large-scale urban streetscape analysis. An increasing number of studies combine semantic segmentation with Street View images [64,65,66], which are widely applied in urban planning and landscape research [67]. Huang et al. used a deep learning-based semantic segmentation method to assess the walkability of urban streets in Seoul [68]. Junehyung Jeon and Ayoung Woo further explored the interrelationship between public housing and walkable environments based on semantic segmentation technology applied to Street View images [69]. In addition, some researchers have integrated deep learning with Street View image data to accurately assess landscape visual quality [70] and pedestrian quality of service [71] and conduct large-scale automated predictions of human perception [31,72,73]. The Place Pulse 2.0 crowdsourced dataset extends urban perception research to six basic perception metrics, including beauty, safety, vitality, wealth, boredom, and depression, and it covers Street View data from 56 cities. These six perception dimensions comprehensively capture the public’s emotional experience of urban environments. Beauty refers to the visual appeal and esthetic value of the streetscape, while safety reflects subjective judgments of potential threats or feelings of insecurity. Vitality indicates pedestrian density and the atmosphere of social activity, while wealth represents impressions of economic resources conveyed by the built environment. In contrast, boredom describes the monotonous experience resulting from a lack of environmental diversity, while depression corresponds to negative emotional associations evoked by bleak or desolate scenes [62,74]. These multidimensional perception indicators provide a detailed framework for characterizing the emotional experience of street spaces and contribute to systematically revealing the combined effects of various urban physical features on human perception. Due to their low cost and high accuracy, these methods and datasets have been widely used in subsequent urban perception studies [75,76].
Previous studies have primarily explored the relationship between the urban built environment and human perception from the perspective of spatial environmental factors. However, research specifically focusing on the impact of the physical features of waterfront streets on human perception remains limited, possibly because it is not easy to measure the physical features and human perception in waterfront streets. In summary, the prerequisite for constructing a livable waterfront street is to apply an efficient and accurate methodology to measure the environmental characteristics of waterfront streets and the human perception of the waterfront street environment. Secondly, exploring the complex relationship between the built environment characteristics of waterfront streets and human perception is of great significance for optimizing and improving the spatial conditions of waterfront streets. The key questions of this study were as follows: (1) applying an efficient and accurate method to quantify the physical features and human perceptions of urban waterfront streets; (2) spatial heterogeneity of physical features and human perception of the Murasaki River waterfront streets; (3) exploring the impact mechanism of the physical features of waterfront streets on human perceptions and providing suggestions for the responsible planners to build a human-centered waterfront street environment.
To achieve the above objectives, this study focused on the waterfront streets along the Murasaki River in Kyushu, utilizing Street View image data combined with artificial intelligence techniques for analysis. Specifically, Python programs were used to collect images of the waterfront streets along the Murasaki River (Figure 1). Deep learning-based semantic segmentation techniques were applied to extract landscape elements from the images, quantifying nine physical features of the waterfront streets. Simultaneously, six perception indicators from the Place Pulse 2.0 dataset (beauty, safety, vitality, wealth, boredom, and depression) were used to quantify human perceptions of the waterfront streets. Subsequently, correlation analysis and regression models were employed to systematically explore the relationships between the physical features of the waterfront streets and human perceptions. Furthermore, spatial heterogeneity in the physical features and human perceptions within the study area was analyzed, providing scientific evidence and practical recommendations for human-centered waterfront street planning and design.

2. Methods

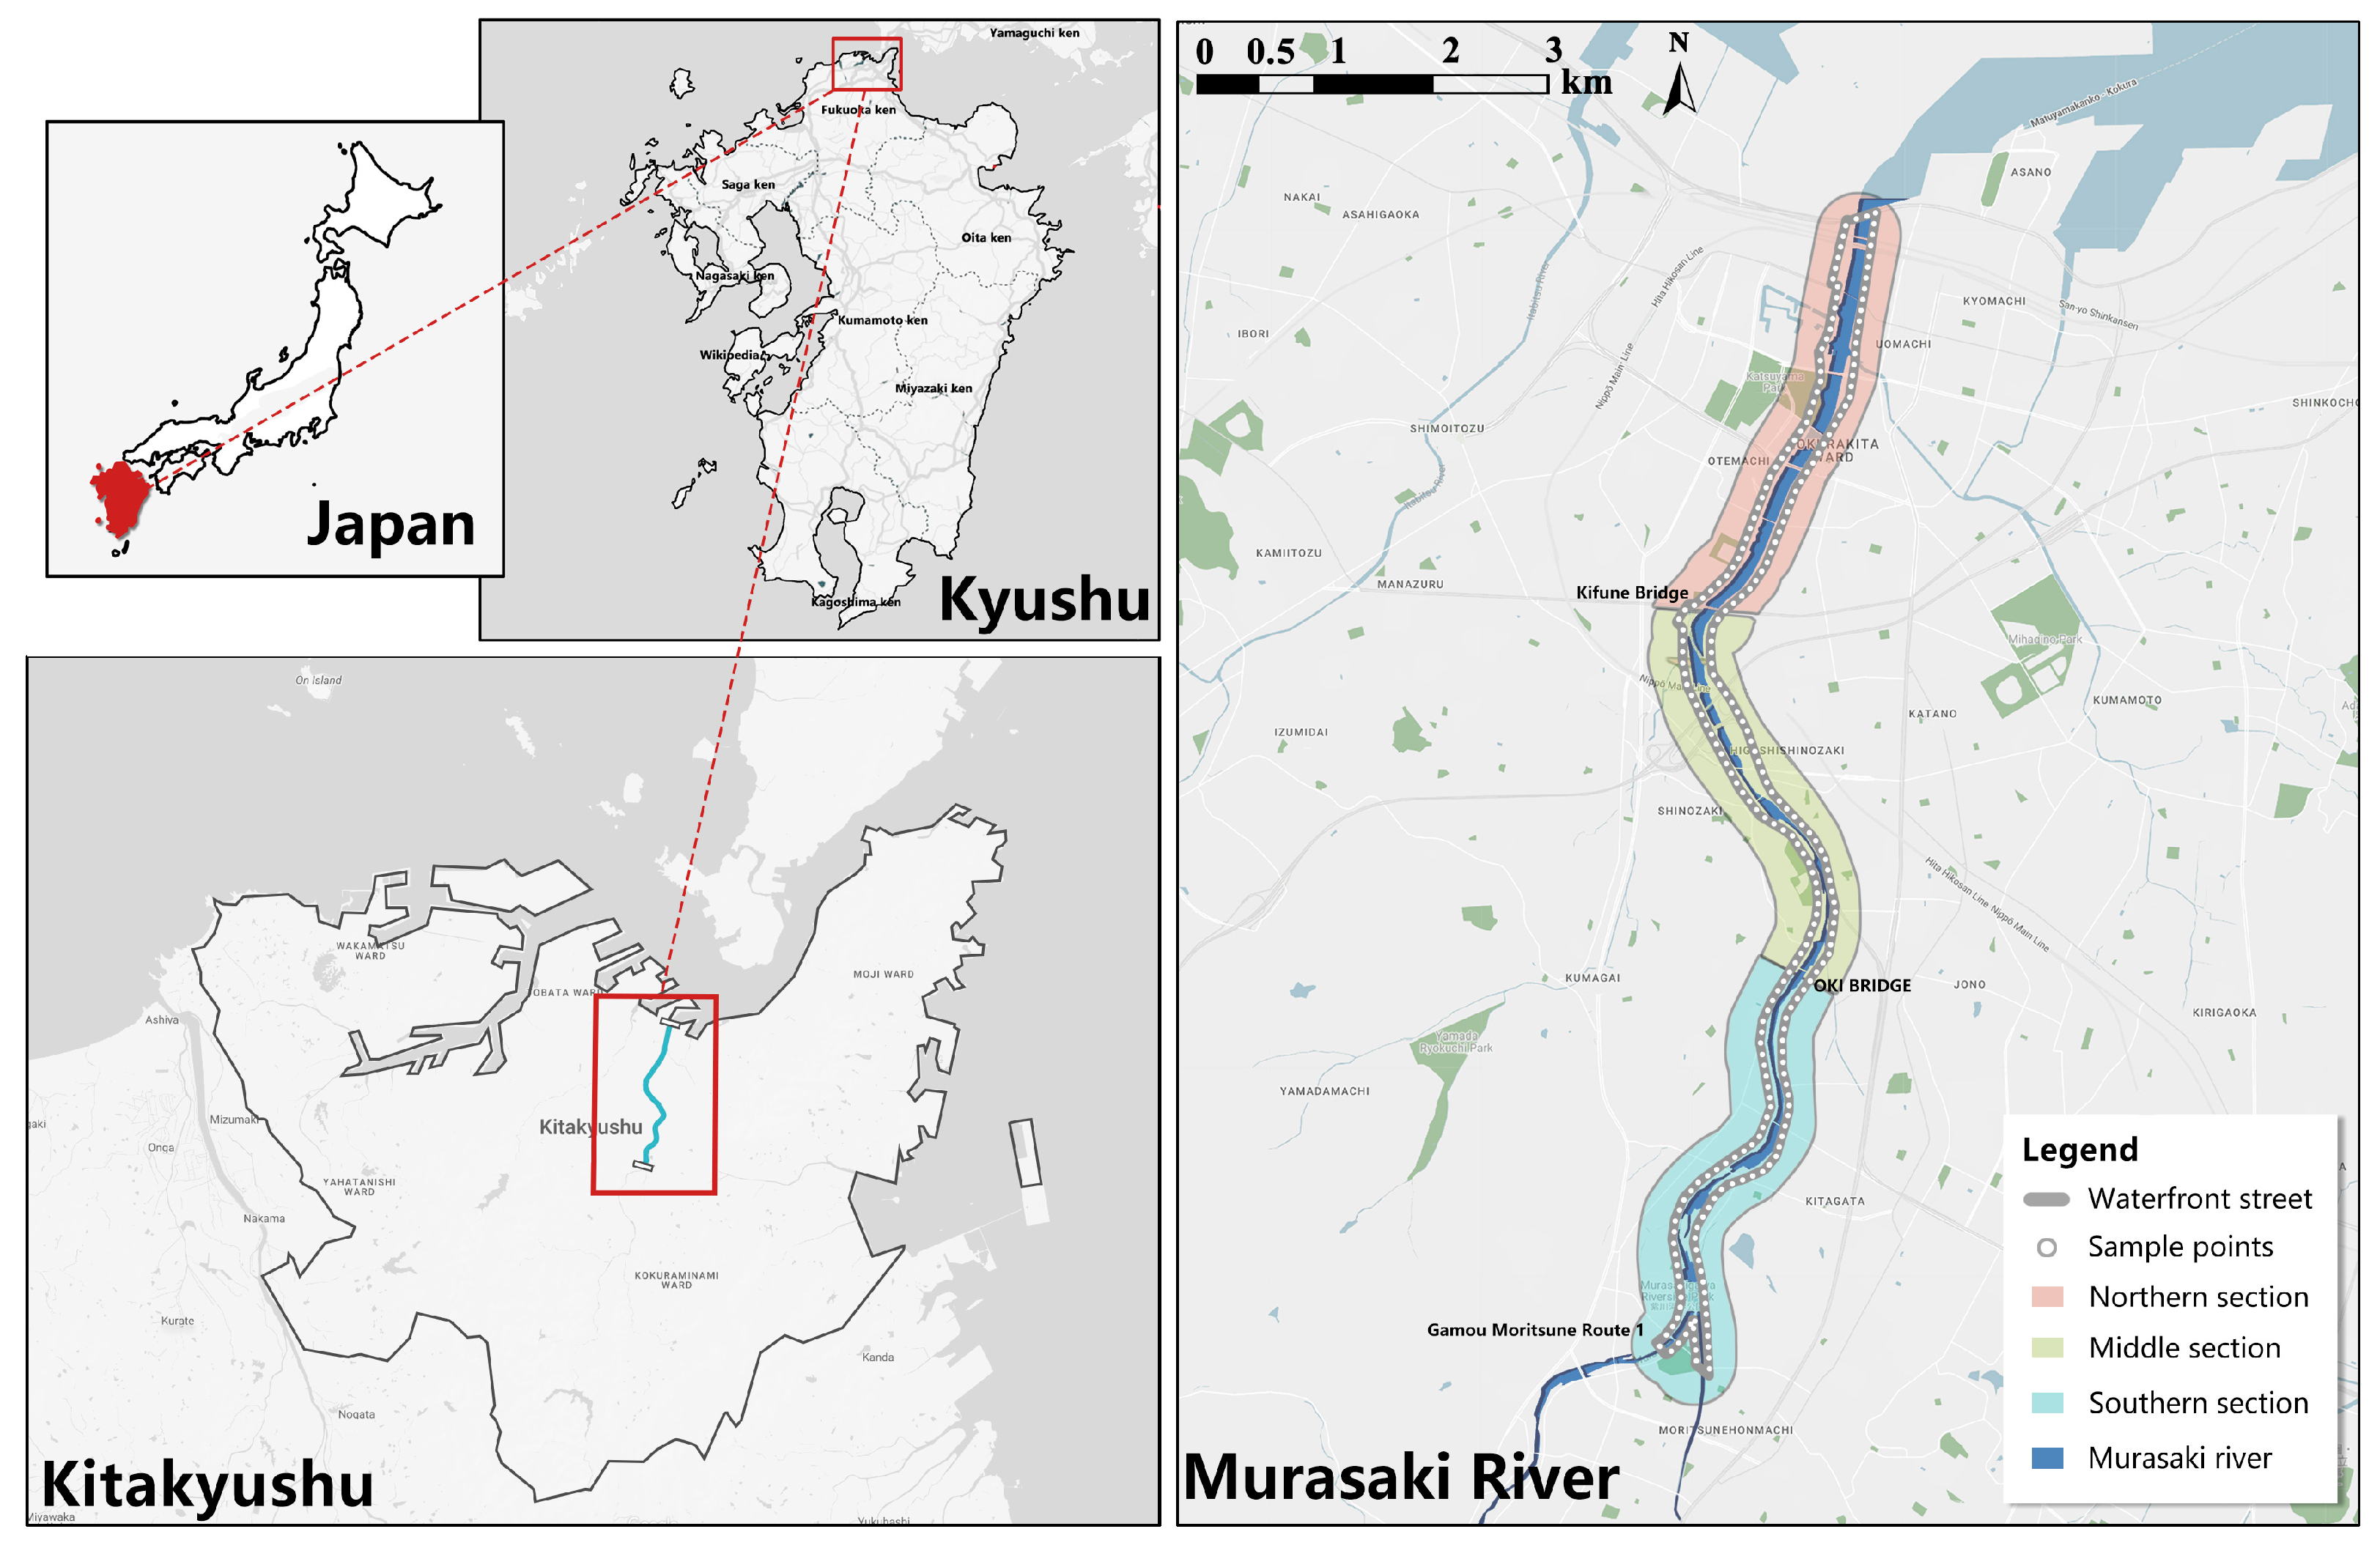
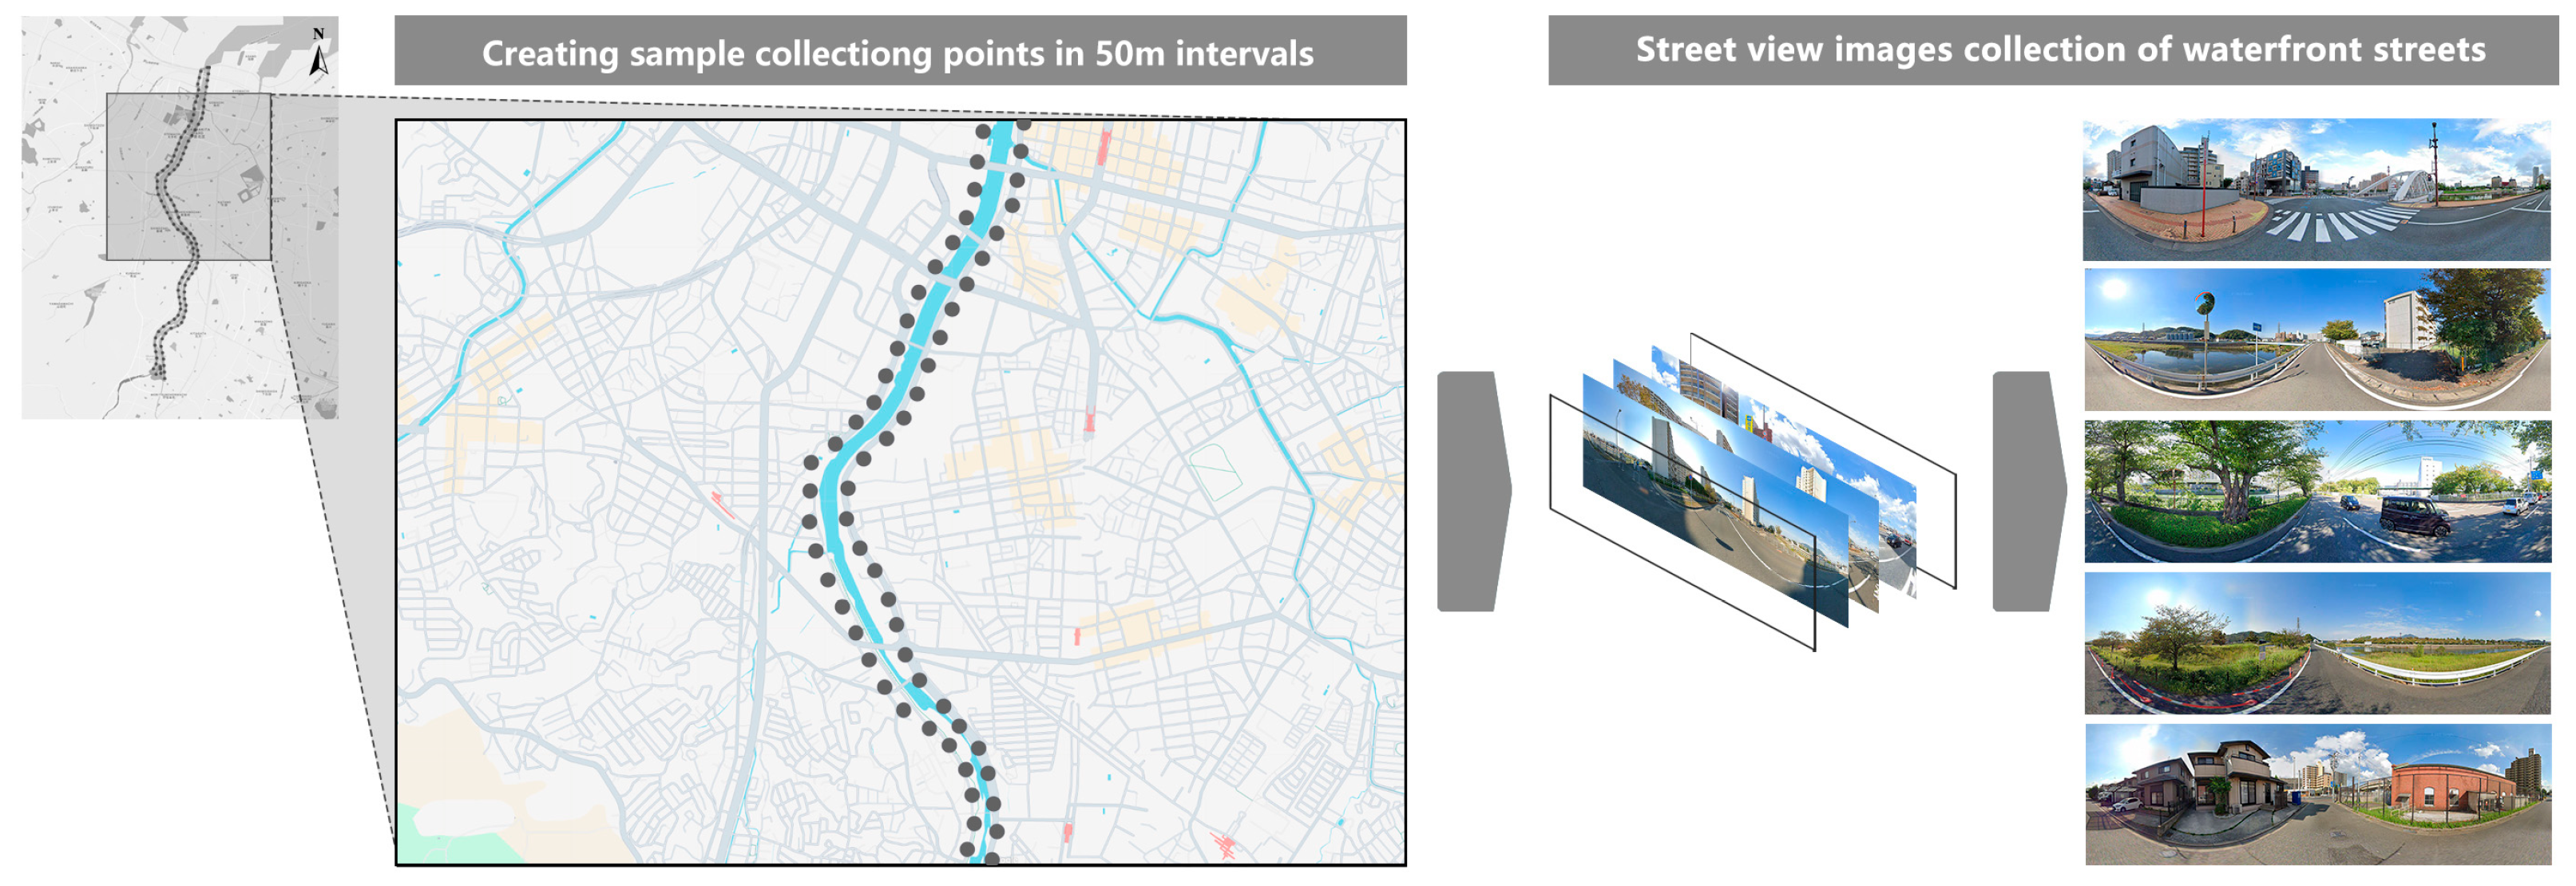
2.1. Study Area and Street View Image Collection

We selected the Murasaki River waterfront street as the research area. The Murasaki River, a major river located in Kitakyushu, Fukuoka Prefecture, Japan, originates from Mount Adachiyama in the southern part of Kitakyushu, flows through the city center, and finally flows into the Hibiki-nada of the Seto Inland Sea (Figure 2).
The northern section of the Shikawa River continues from the river mouth to the Kifune Bridge. This section is primarily located in the city center of Kitakyushu, and its waterfront street space includes commercial and recreational areas, offering a diverse range of functions. The central section is from the Kifune Bridge to the Ōki Bridge. The waterfront street space in this section is mainly residential and transport-oriented. The southern section is from the Ōki Bridge to Gamou Moritsune Route 1. This section is farther from the city center and is characterized by abundant natural landscapes, with a lower level of urbanization. The Murasaki River has witnessed the transformation of Kitakyushu from an industrial city to one focused on environmental improvement. In recent years, Kitakyushu City has vigorously promoted the improvement of water quality in the Murasaki River and the development of its riverside streets. These efforts have led to a significant improvement in water quality. Today, the riverbanks cover several parks, green spaces, and cultural heritage buildings. Moreover, various cultural events and festivals are held annually, attracting many tourists and residents.
The Murasaki River waterfront street integrates natural landscapes (e.g., vegetation and water bodies) with artificial elements (e.g., buildings and street facilities), representing the typical characteristics of waterfront streets. It is also distinguished by a dynamic urbanization context, rich historical and cultural value, and diverse social activities. These features not only make it an ideal case for studying the impact of physical features on human perceptions, but also establish it as a representative area for exploring the role of waterfront environments in shaping urban identity and enhancing residents’ well-being. Therefore, improving the environmental quality of the Murasaki River waterfront street is significant for both the city’s image and the quality of life of its residents.
Streetscape data allow observers to view the urban environment from a human-centered perspective. To comprehensively assess the impact of waterfront street environments on human perceptions while ensuring thorough photo coverage and balanced data, this study followed the methodology of Yang et al. [77] and referenced previous studies [62,78,79]. Sampling points were created every 50 m along the street. In total, 327 sampling points were established within the OpenStreetMap (OSM) street network along the entire waterfront street.
In this study, Python code was written to obtain panoramic street images of all the sample points. The parameter information that needed to be set was image resolution (2048 × 624 pixels) and location (latitude and longitude of the sample points using ArcGIS 10.5.1). The horizontal field of view was set to 60°, the pitch angle—to 22.5° [33], generating uniform resource locators (URLs). For streets with multiple lanes, the SVIs closest to the pedestrian sidewalk were selected. Using the latitude and longitude information of these points, panoramic images of the waterfront street were retrieved (Figure 3). A total of 327 panoramic images were collected for the months of June, September, and October 2024 using Python 3.12.

2.2. Human Perception Acquisition

This study used the Place Pulse 2.0 dataset to train a DCNN model for predicting human perceptions, a method widely adopted in urban cognition studies [74,80,81,82]. Initiated by the MIT Media Lab in 2013, the Place Pulse project contains 1.2 million Street View images from 56 cities, including Kyoto. Dubey et al. trained a deep learning computer vision model based on this dataset, achieving an accuracy of 73.5% in predicting human perception features [74,83]. Displaying two Street View images from different cities, the project measured human perceptions of urban areas, including six emotional perceptions: beauty, safety, vitality, wealth, boredom, and depression. These six dimensions of perception include positive and negative perceptions, have been widely used in measuring the public’s perception of street space [62,84], and have more accurately measured how people feel about urban street spaces. By October 2016, the dataset had collected 1,169,078 pairwise comparisons from 81,630 online participants [74]. Based on these six types of human perception, many scholars have conducted a large number of studies related to human urban perception in recent years [82,85,86]. In addition, the environmental features of waterfront streets differ from other urban streets, which may raise concerns about the reliability of perception scores predicted by deep learning models. Therefore, in this study, we randomly selected 82 samples (accounting for 25% of the total) and conducted subjective evaluations of six human perceptions using the semantic differential (SD) method. The SD method has been widely used in environmental assessment studies due to its applicability [57,87]. Ten participants with backgrounds in urban design and environmental psychology were involved in the evaluation. Subsequently, we conducted a correlation analysis between the subjective evaluation scores (perception S) and the model-predicted scores (perception P). The validation results (Table 1) show that, for most perception dimensions, the model’s predicted scores had a sufficiently high and significant correlation with human subjective evaluation. These results suggest that the perception scores predicted by the deep learning model can reasonably approximate human subjective perceptions.

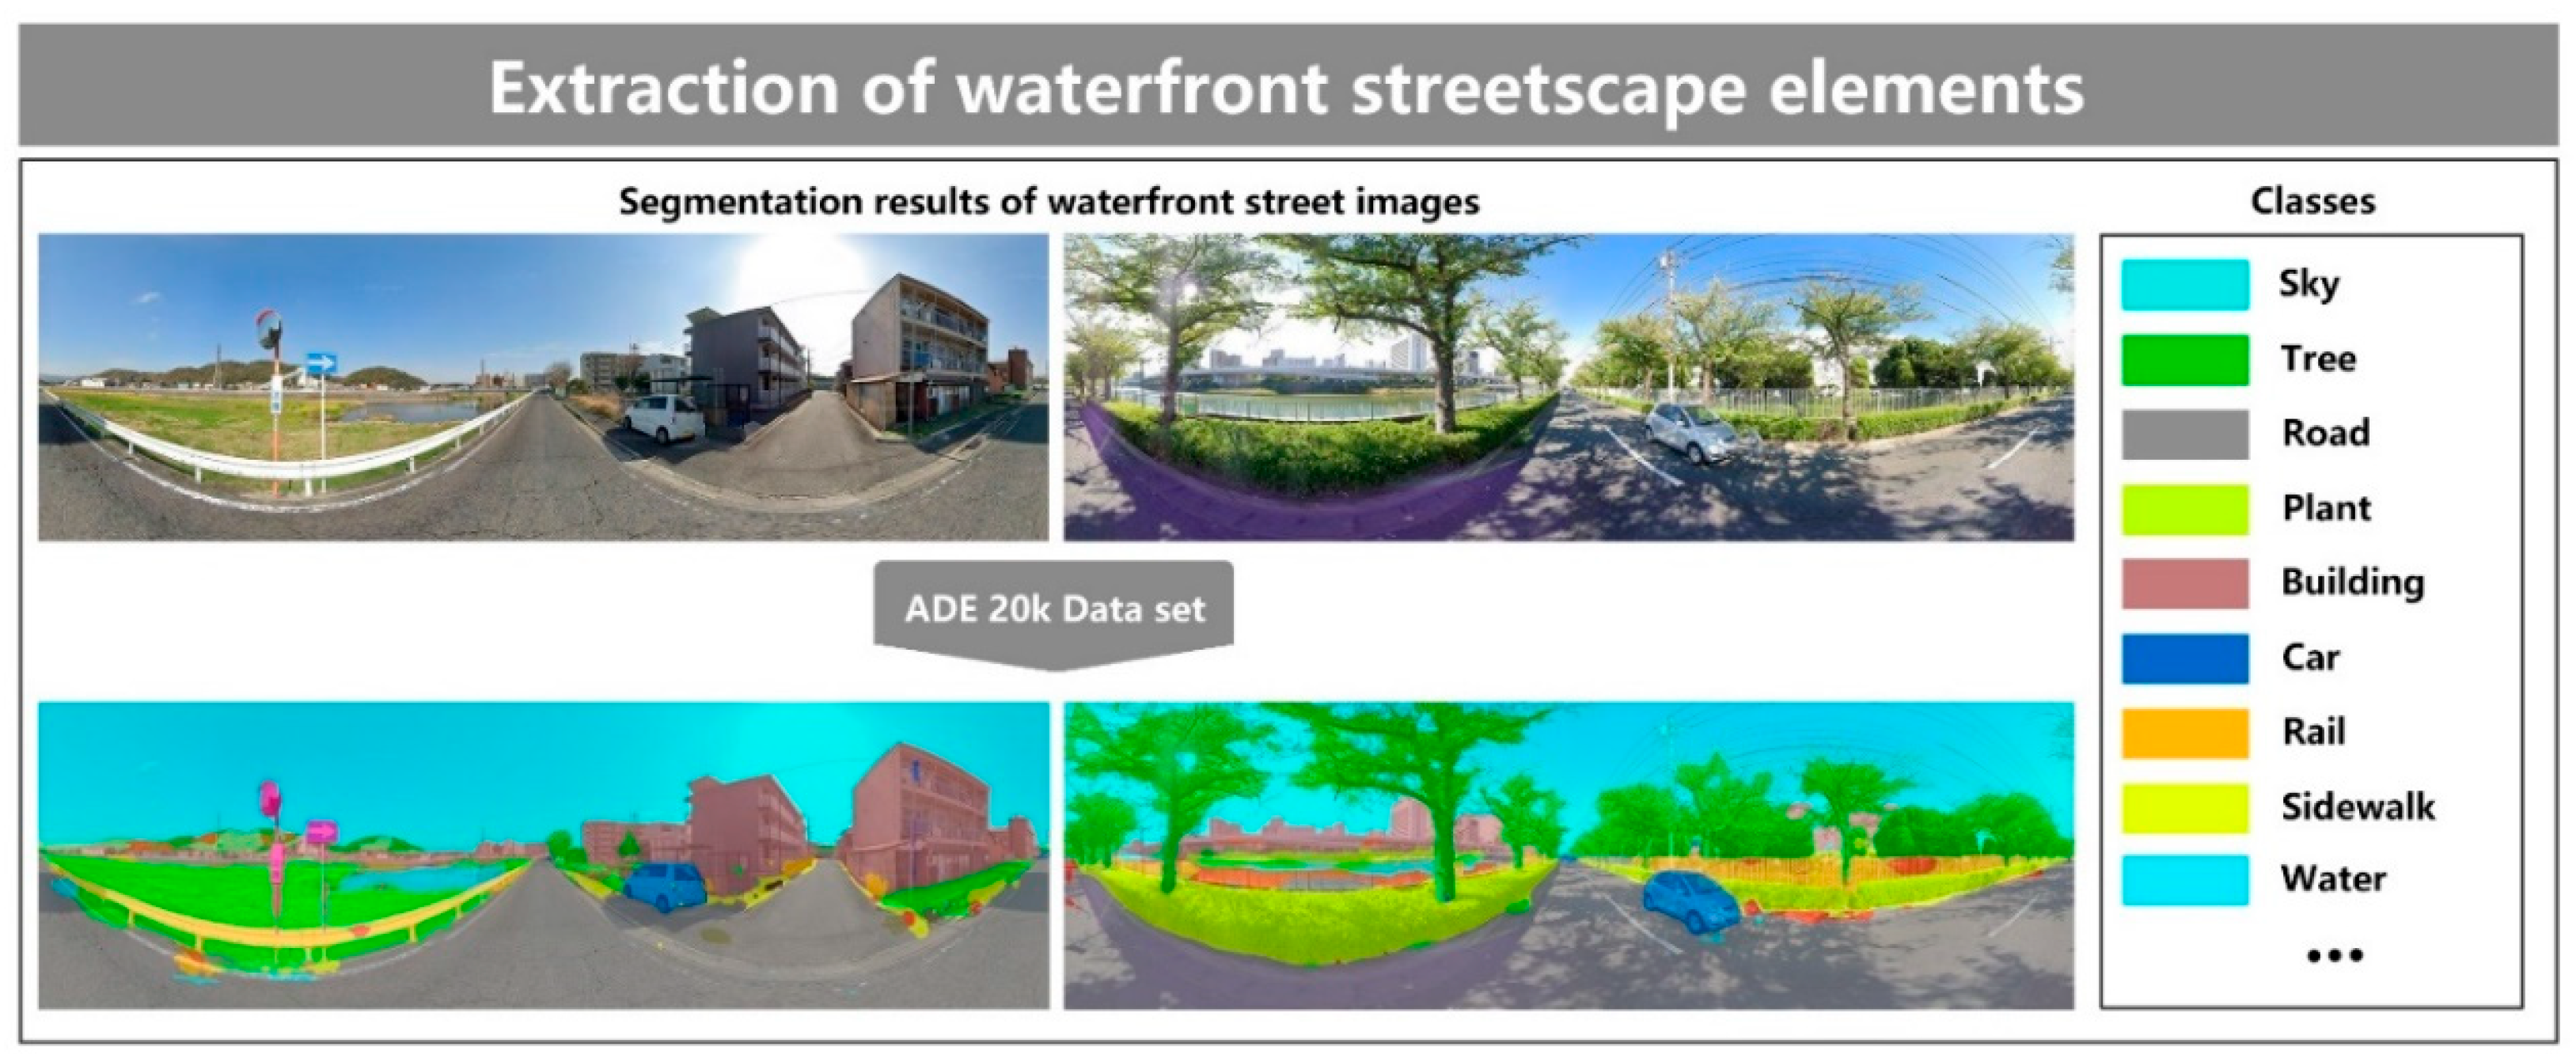
2.3. Street Physical Features Calculation

This study utilized semantic segmentation based on deep learning to extract the proportions of landscape elements from waterfront Street View images and calculated the street physical features. Semantic segmentation is a key technique in the field of computer vision that assigns each pixel in an image to a specific category, enabling precise recognition and segmentation of different objects or regions [88]. In this study, we applied the Pyramid Scene Parsing Network (PSPNet), a widely used semantic segmentation model, to extract the percentage of streetscape elements from SVIs. Earlier semantic segmentation methods primarily relied on pixel color; however, they struggled to distinguish between objects with similar colors [89]. The PSPNet, by contrast, effectively recognizes street elements in Street View images by using deep convolutional neural networks to process visual information in images, such as buildings, sky, plants, roads, and sidewalks [90,91].
Additionally, the study utilized the ADE-20K dataset as a training dataset, which is an open-source semantic segmentation dataset released by the CSAILVision team at MIT [92,93]. A total of 150 categories representing elements from daily life, such as sky, road, car, plant, etc., are shown in Figure 4. This diversity enables the dataset to comprehensively capture the complexity of real-world scenarios. The PSPNet demonstrates state-of-the-art performance at the ADE-20K data level, achieving over 80% accuracy. These accurate segmentation results provide a reliable foundation for constructing human perception models and calculating street physical features.
Based on previous research, Ewing and Handy (2009) [94] proposed the well-known concept of urban design quality, which includes five dimensions related to design: imageability, enclosure, human scale, transparency, and complexity. They are expected to influence people’s perception of the environment by affecting their personal feelings and emotions [94,95]. Some researchers have conducted studies on the quality of urban street environments based on these indicators. By reviewing the literature, we selected eight key physical features of streets that are widely used to assess the built environment of streets (Table 2). These physical features have frequently been used in previous studies to characterize the built street environment [96,97,98,99,100]. Additionally, we included a “blueness” indicator to reflect the proportion of water visible in the viewer’s field of view. Prior research has shown that blue spaces can effectively alleviate mental fatigue and stress [35], indicating their important role in shaping people’s perceptions of the environment.

2.4. Statistical Analysis

The study used SPSS 26.0 software to conduct Pearson correlation and regression analyses. The human perceptions of the waterfront street were chosen to be dependent variables, and the physical features were chosen as the independent variables. Then, correlation and regression analyses were conducted to explore the impact of waterfront street environmental features on human perceptions.

3. Results

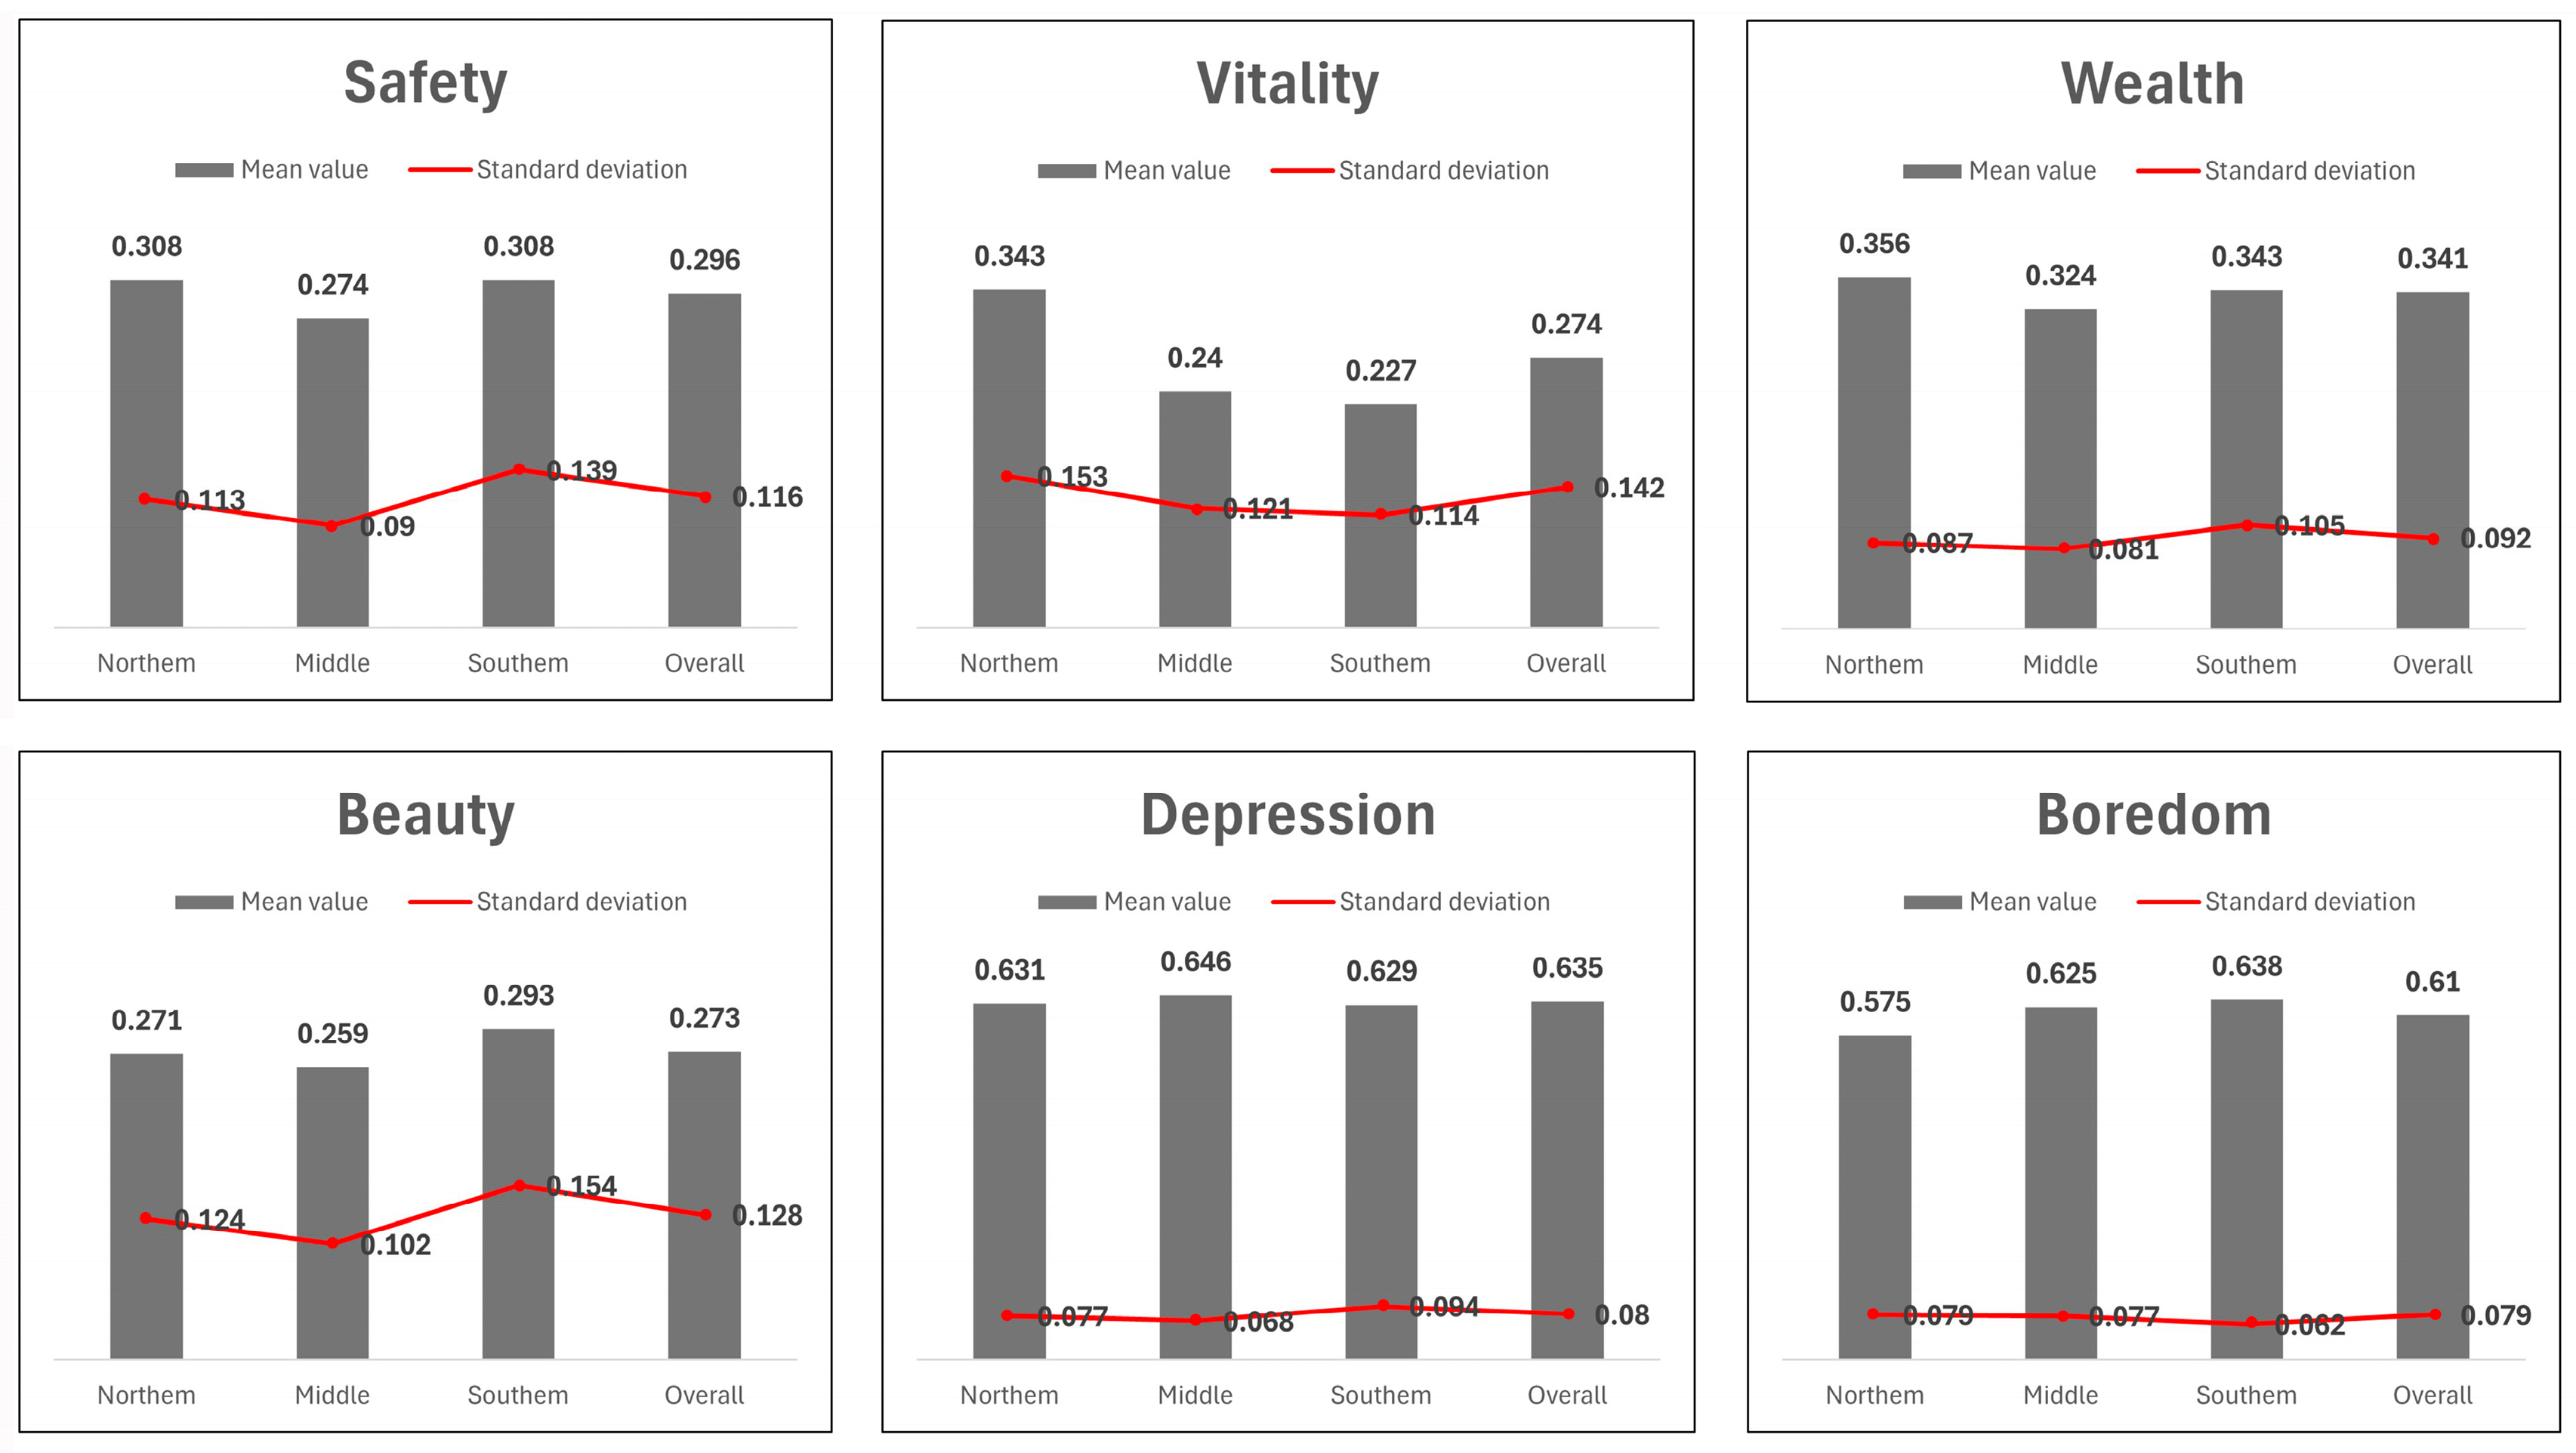
3.1. Spatial Heterogeneity Analysis of Human Perceptions

This study employed a deep learning–based model to predict six human perceptions in the waterfront streets of the Murasaki River (see Table S1). By comparing the six perception results from 327 sample points along the Murasaki River waterfront street in Kitakyushu (Table 3).
We observed the following ranking in the distribution of perceptions: depression > boredom > wealth > safety > vitality > beauty. In the Murasaki River waterfront street, boredom and depression ranked highest overall among the perceptions, with low standard deviations, indicating that the waterfront street generally showed a strong sense of depression and boredom, and they demonstrated a high degree of consistency across the various nodes. The perceptions of wealth and safety scored relatively high, with moderate standard deviations, indicating that the street as a whole showed a notable sense of wealth and safety. The perceptions of vitality and beauty were lower, with higher standard deviations, indicating that the street overall lacked vitality and esthetic appeal, with some streets or nodes showing obvious differences.
In order to study more clearly the distribution of human perceptions, we conducted a comparative analysis of the six human perceptions across three sections of streets. From Figure 5 and Figure 6, the analysis revealed distinct spatial patterns in these perceptions along the Murasaki River waterfront streets. The mean value of safety perception was 0.308 for both the northern and southern sections of the streets, while the central section showed a lower mean value of 0.274. The higher standard deviation in the southern section indicates greater differences in safety perception among the street nodes. By observing the sample images, it can be found that this is related to the low guardrails along certain waterfront spaces that increase pedestrian risks, despite the generally continuous street interfaces and moderate building volumes. In contrast, the central section, dominated by urban expressways and elevated highways, exhibited a low standard deviation, signaling a uniformly poor sense of safety due to high traffic flow and limited pedestrian areas. The northern section displayed a moderate safety perception with relatively stable variations across its nodes.
For vitality, the northern section was the most vibrant (mean: 0.343), though it also exhibited a high standard deviation. This variation stemmed from the presence of landmarks such as Kokura Castle and bustling commercial nodes, contrasted by occasional lower-vitality spots. Samples with high vitality values generally exhibit a higher level of artificiality and more comprehensive street functionality. In comparison, the central (mean: 0.240) and southern (mean: 0.227) sections showed consistently low vitality with relatively small differences across nodes, attributed to their lack of diverse functions, modern amenities, and urban renewal efforts.
Wealth perception was consistently high across all three sections, with low standard deviations. The northern and central sections, as urban cores of Kitakyushu, benefited from dense public infrastructure, cultural landmarks, and mixed-use streetscape elements. The southern section, while quieter, maintained a sense of wealth through its well-maintained architectural style and high greenery coverage, creating an elegant urban atmosphere.
For beauty perception, the southern section scored highest (mean: 0.293), but exhibited a high standard deviation, indicating considerable differences in beauty perception among its street nodes. This was due to the contrast between nodes with rich natural landscapes and harmonious architectural colors and lower-quality areas lacking maintenance. Conversely, the northern (mean: 0.271) and central (mean: 0.259) sections showed poor overall esthetics. By observing the images of samples with low beauty values, it can be identified that their characteristics include insufficient greenery, deteriorated public facilities, monotonous visual environments, and a lack of unity in the streetscape.
Both depression and boredom demonstrated consistent patterns. High levels of depression (northern: 0.631, central: 0.646) and boredom (central: 0.625, southern: 0.638) were observed across all sections. Meanwhile, the standard deviations for these perceptions were generally low, indicating relatively small differences in depression and boredom perceptions among the street nodes within each section. These negative perceptions arose from limited street functionality, neglected urban “grey spaces,” and the overwhelming presence of high-rise buildings or monotonous streetscapes in the southern section. The northern and central sections further suffered from spatial monotony, reducing opportunities for vibrant social interactions.

3.2. Integrated Analysis of Human Perception and Physical Features

This study extracted the proportion of landscape elements along the waterfront streets of the Murasaki River using a semantic segmentation method and calculated their corresponding physical features (see Table S2). By analyzing the mean values of human perceptions and the mean values of physical features (Table 4), an integrated analysis was conducted to explore spatial patterns and their impacts.
In the northern street section, perceptions of boredom and depression were the most pronounced. This was primarily due to the limited greenness, a low natural-to-artificial ratio, and relatively high openness, which together resulted in visually monotonous areas and occasional feelings of dullness. However, the perception of vitality in this area was relatively better than other positive perception dimensions. This improvement can be attributed to the high building visual ratio, a stronger sense of spatial enclosure, and a favorable pedestrian environment. These spatial characteristics collectively fostered dense and accessible streetscapes that promoted consumption, leisure, and tourism activities, thereby enhancing the street’s urban vitality.
In the central street section, perceptions of depression and boredom also remained prominent; however, their causes differed from those in the northern section. The area exhibited low enclosure, poor greenness, and high openness, coupled with an unfavorable pedestrian environment. These factors led to a lack of plant landscapes, blurred spatial boundaries, and a decline in the perception of beauty, resulting in an overall monotonous and tedious street environment. In addition, the limited pedestrian space and the dominance of transportation infrastructure further constrained street vitality, leading to weaker vitality perception in this section.
In the southern street section, boredom perception was the most significant, while depression perception remained at a relatively high level. Nevertheless, this area demonstrated a comparatively higher perception of beauty. Greater greenness and a balanced natural-to-artificial ratio played a crucial role in enhancing the esthetic quality of the street, while diverse and well-maintained plant communities added considerable visual appeal. In contrast, a lower building visual ratio and higher openness weakened the spatial enclosure of the urban environment, resulting in insufficient density and a lack of functional elements, which failed to alleviate the sense of monotony. Moreover, limited pedestrian pathways restricted walking activities, reduced opportunities for social interaction, and further diminished the overall vitality perception in the southern section.

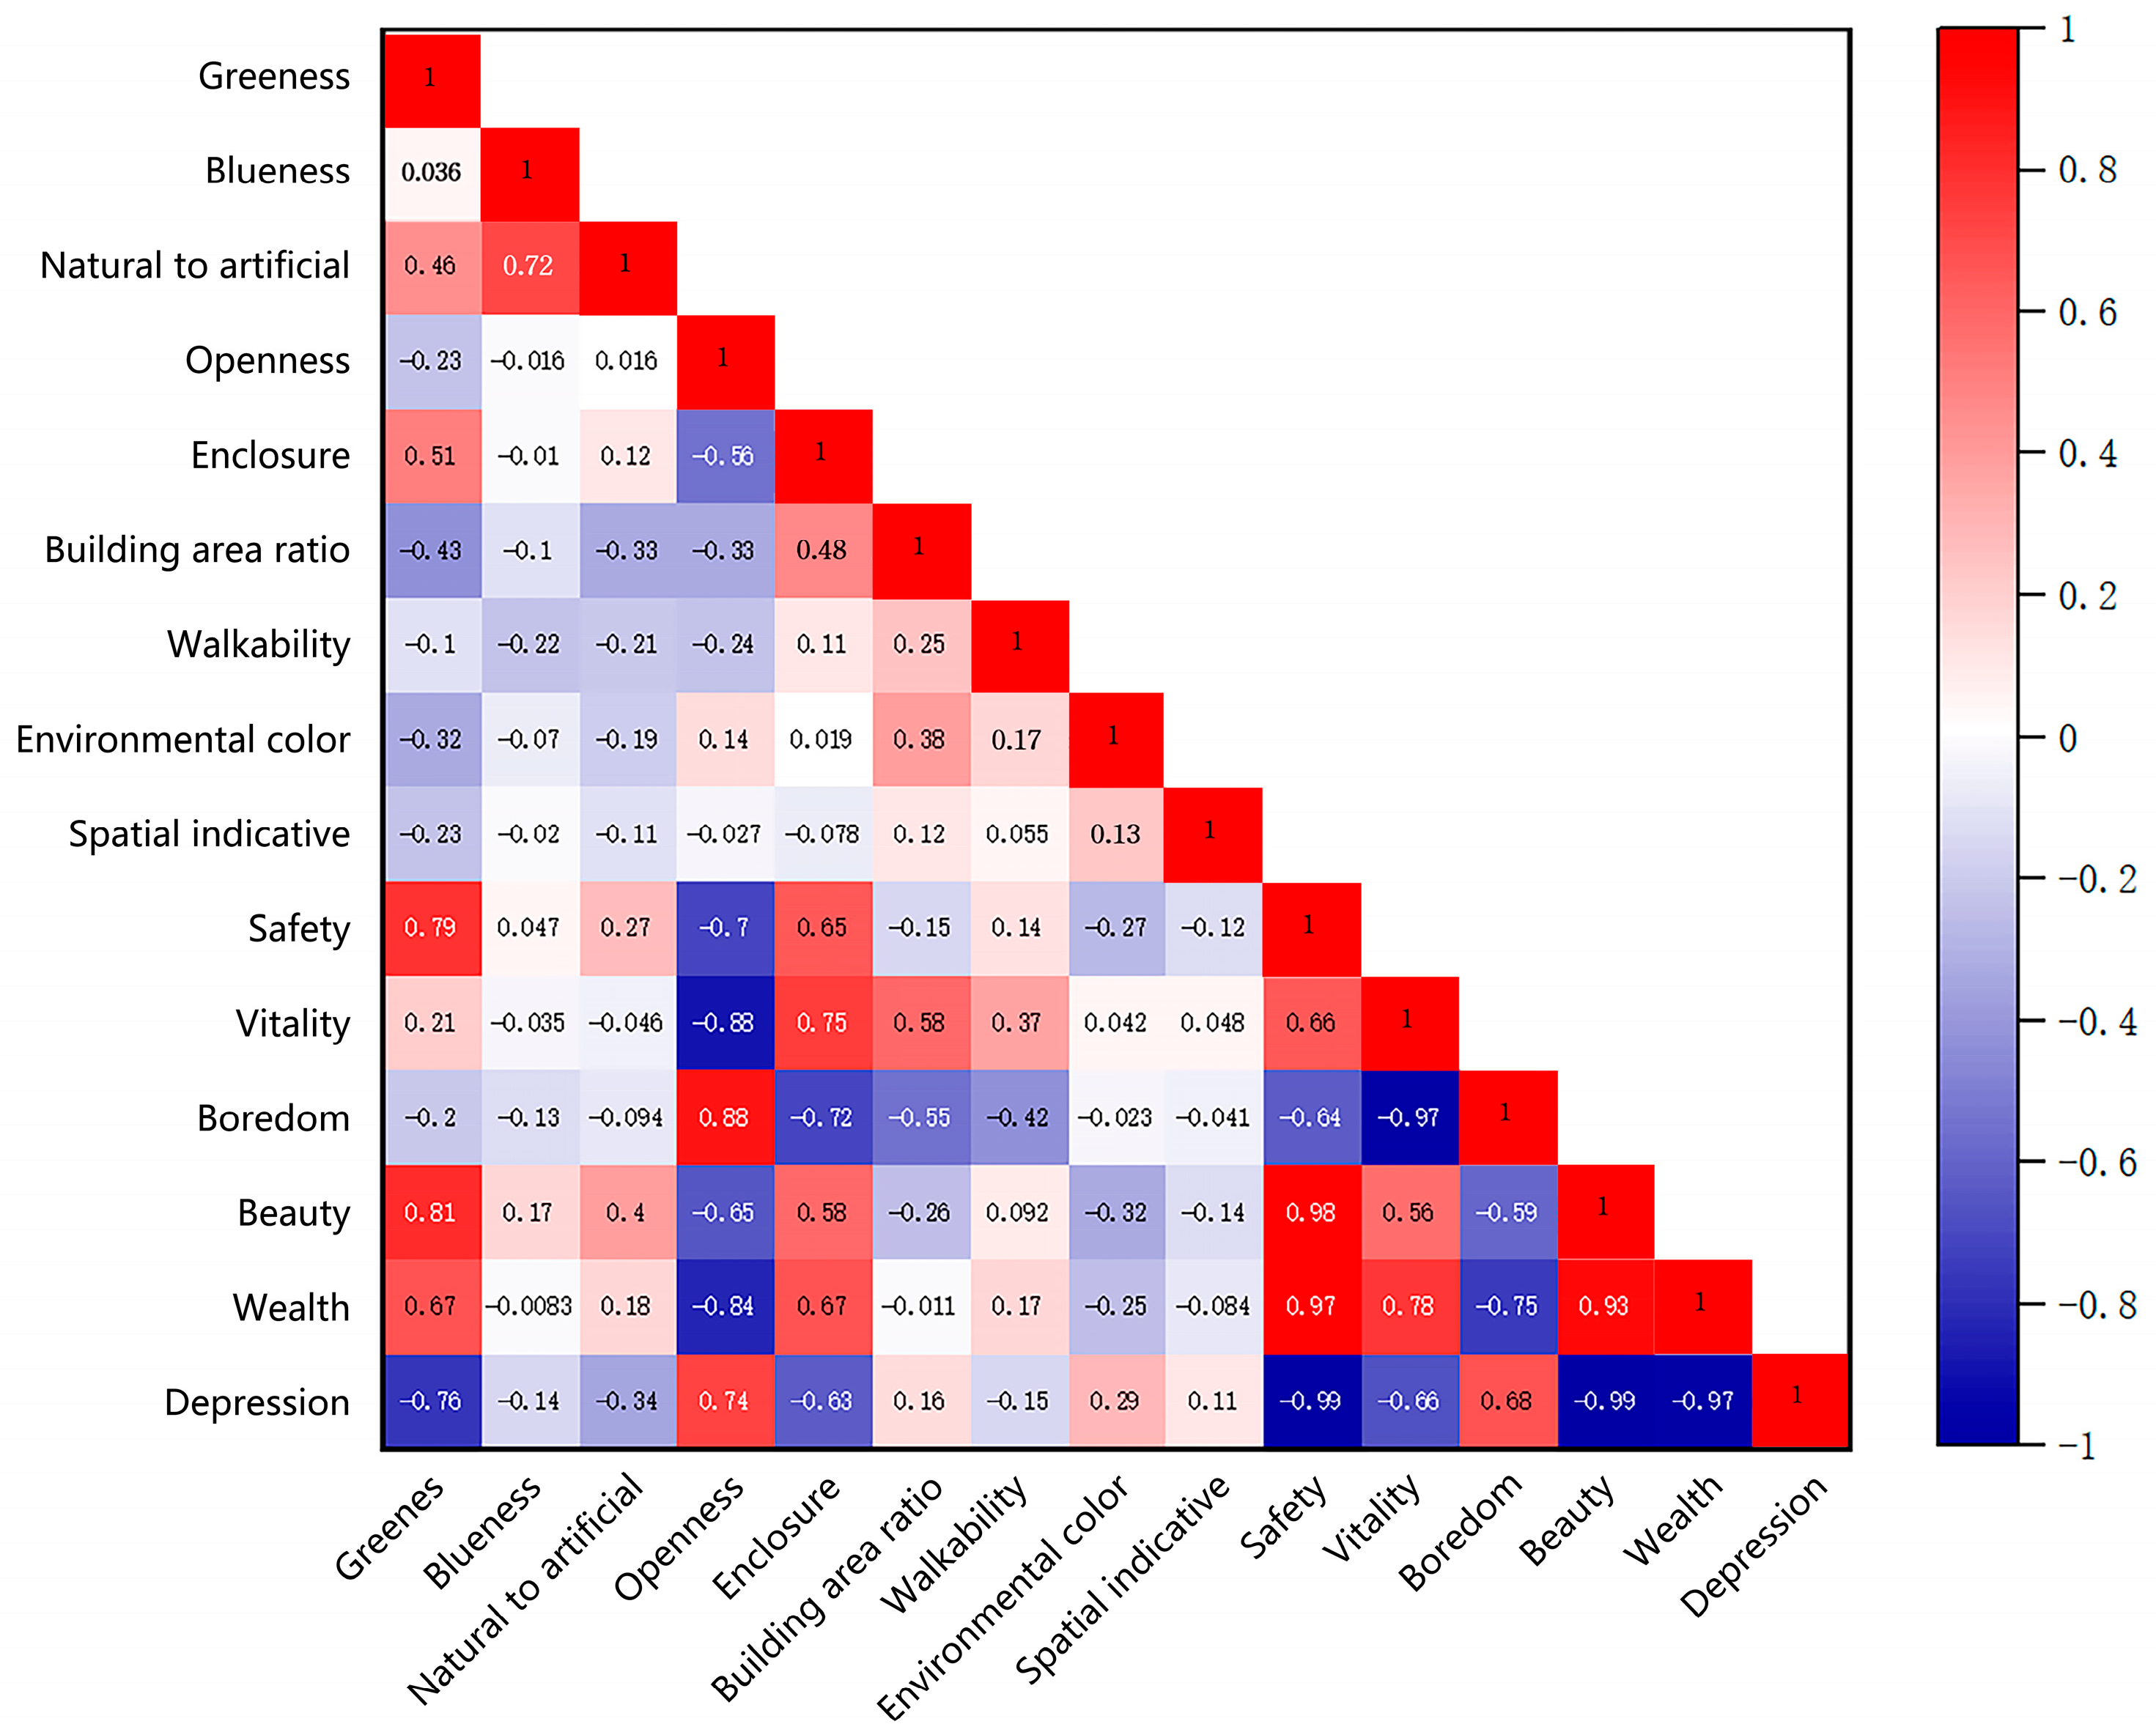
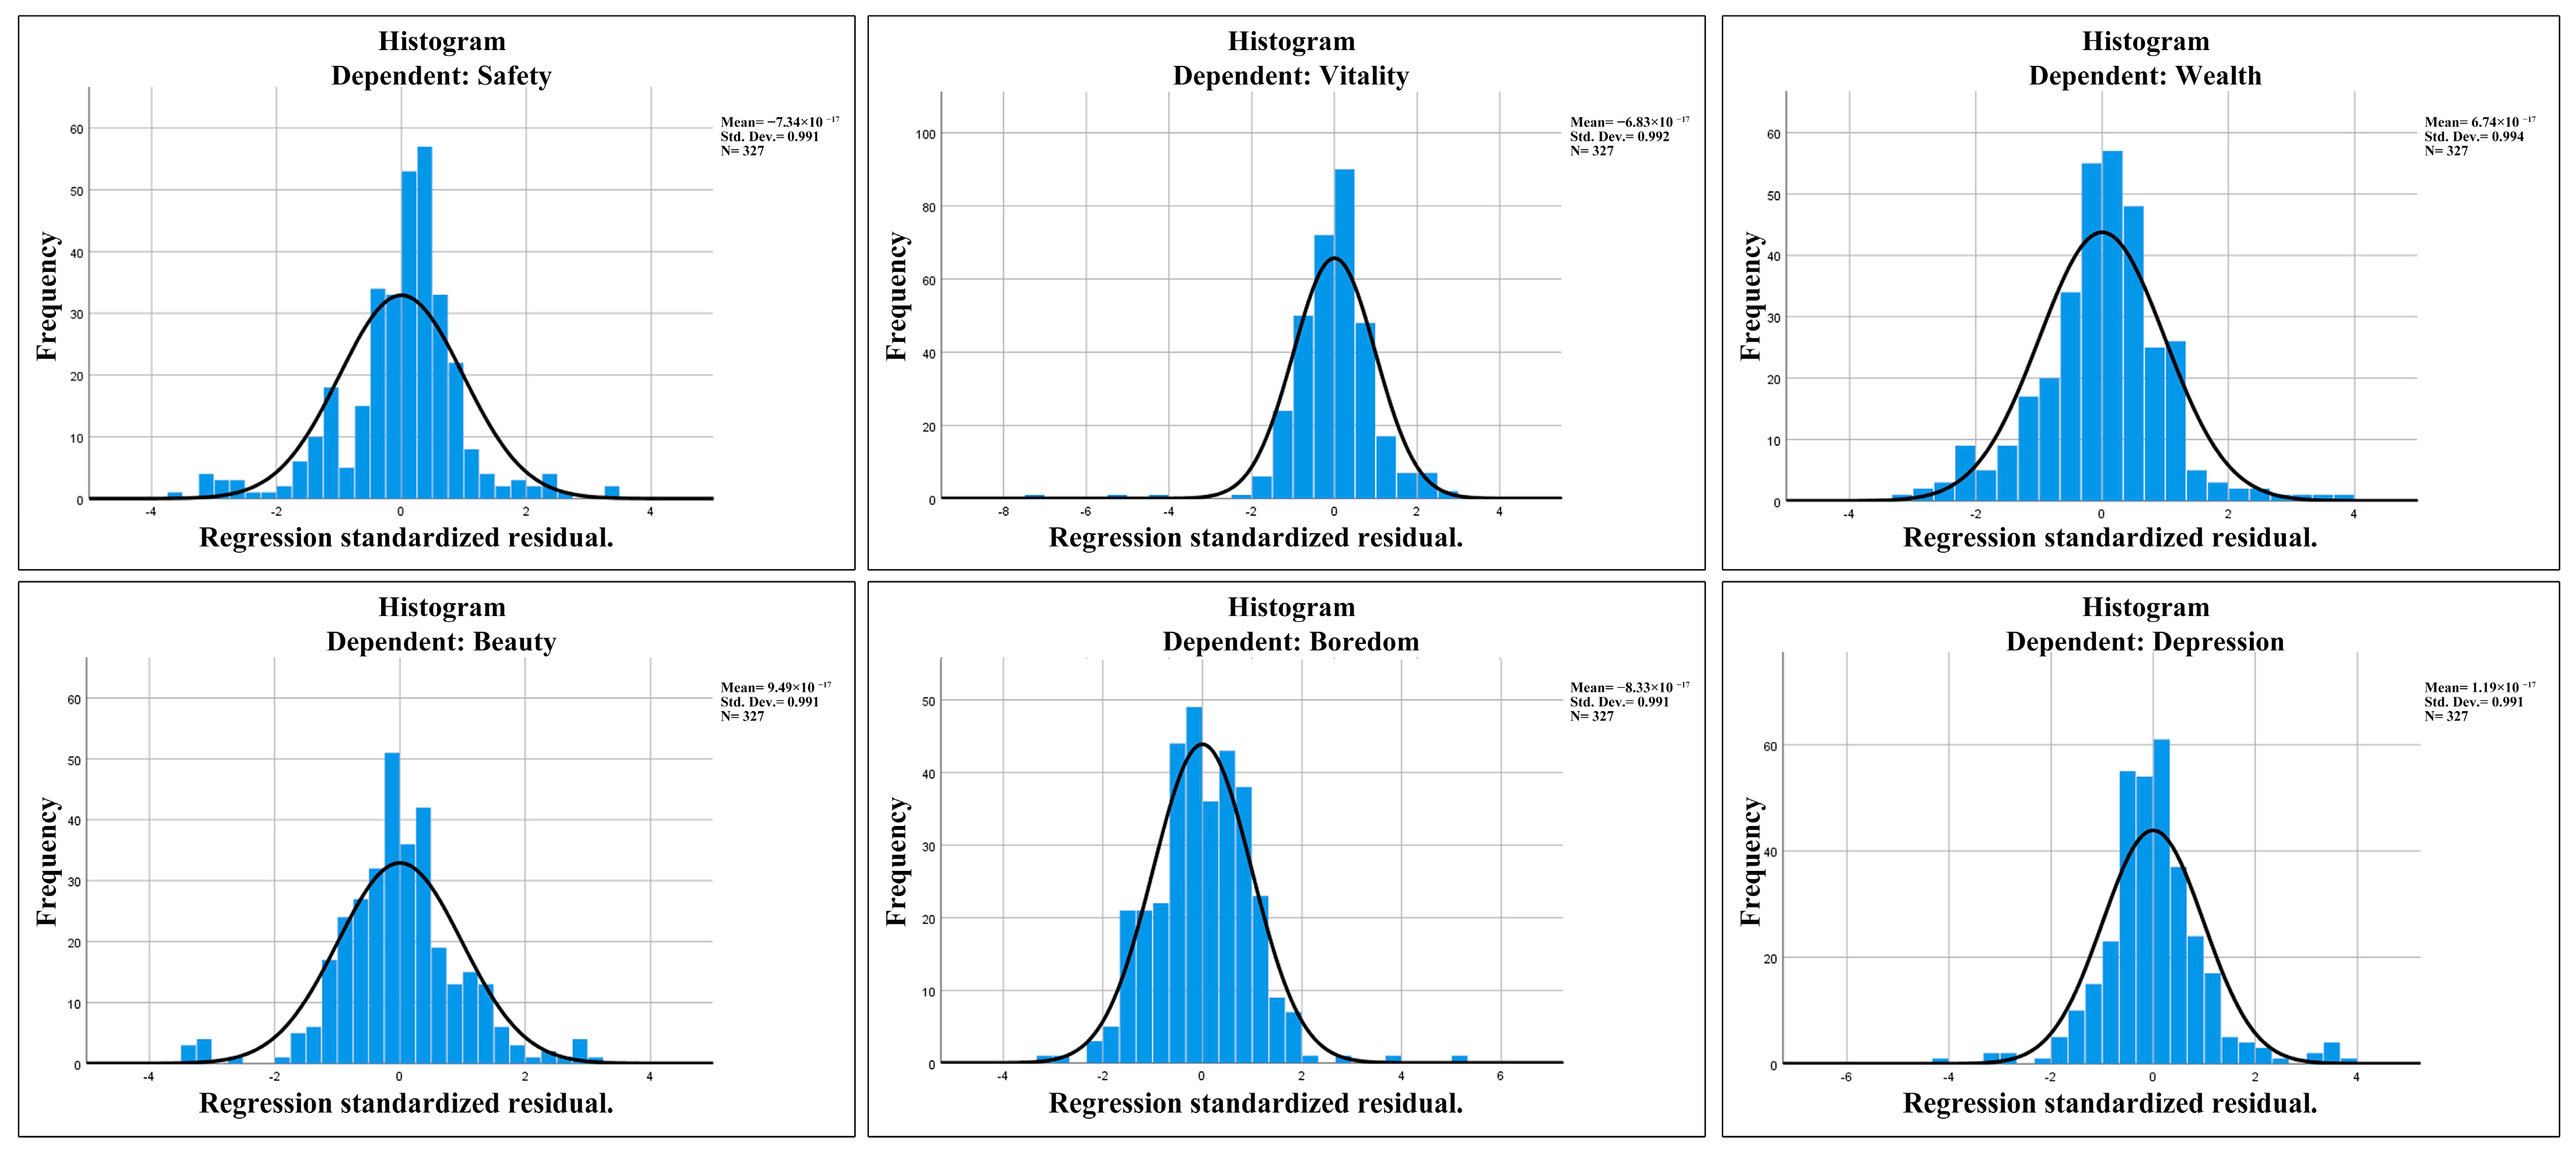
3.3. Correlation and Regression Analysis

This study conducted a correlation analysis between the six human perceptions and the nine physical features using SPSS software, revealing distinct relationships between these variables. Safety, vitality, beauty, wealth, boredom, and depression were selected as dependent variables, and the physical features were selected as independent variables in the correlation analysis. The results are shown in Figure 7.
The correlation analysis results for safety (Figure 7) showed that safety was strongly positively correlated with greenness (0.787), moderately correlated with enclosure (0.652), and weakly correlated with the natural-to-artificial ratio (r = 0.270) and positively correlated with walkability. Safety was significantly negatively correlated with openness (−0.703) and weakly negatively correlated with the building visual ratio (−0.151) and environmental color diversity (−0.268). For vitality, the correlation analysis indicated that vitality was strongly positively correlated with enclosure (0.752) and moderately positively correlated with the building visual ratio (0.581). A weak positive correlation was observed with walkability (0.370) and greenness (0.212). In contrast, vitality was strongly negatively correlated with openness (−0.880). The correlation analysis results for wealth indicated that wealth was strongly positively correlated with greenness (0.665) and enclosure (0.669) and weakly correlated with the natural-to-artificial ratio (0.177) and walkability (0.165), while it was strongly negatively correlated with openness (−0.835) and weakly negatively correlated with environmental color diversity (−0.251). The correlation analysis results for beauty showed that beauty was strongly positively correlated with greenness (0.812), moderately positively correlated with enclosure (0.585) and the natural-to-artificial ratio (0.397), and very weakly positively correlated with blueness (0.169). Beauty was strongly negatively correlated with openness (−0.652), weakly negatively correlated with the building visual ratio (−0.259) and environmental color diversity (−0.322), while the correlation with the spatial indicator (−0.137) was negligible. The correlation analysis results for boredom showed a strongly positive correlation with openness (0.884). It also demonstrated moderate-to-strong negative correlations with enclosure (−0.719) and the building visual ratio (−0.550) and moderate negative correlations with walkability (−0.423). The negative correlations with greenness (−0.201) and blueness (−0.132) were weak. For depression, the analysis revealed a strong positive correlation with openness (0.737) and weak positive correlations with the building visual ratio (0.156), environmental color diversity (0.293), and spatial indicative elements (0.115). It was strongly negatively correlated with greenness (−0.761) and moderately negatively correlated with enclosure (−0.632). The correlations with blueness (−0.143) and walkability (−0.145) were weak.
This study used the physical features selected through the correlation analysis as independent variables and the six human perceptions—safety, wealth, beauty, vitality, boredom, and depression—as dependent variables to conduct a stepwise regression analysis. Stepwise removal of unsuitable physical features resulted in regression models for the six human perceptions (Table 5).
As shown in Figure 8, the standardized residuals from the regression closely follow a normal distribution, indicating that the residuals meet the assumption of normality. These results provide further support for the validity of the model assumptions.
The R2 values of all the six regression models exceeded 0.90, indicating that the models had a good fit and were effective in establishing relationships. In addition, the ANOVA results showed that the F-test significance for the three streets was less than 0.05, demonstrating that the multiple linear regression models fit the data well and the overall regression relationships were significant. The final t-values of each equation were all significant at p < 0.001, and the regression coefficients passed the significance tests. The variance inflation factor (VIF) values remained below 10, confirming the absence of multicollinearity issues among the factors in the model. These tests confirmed that the regression model results were valid and that the regression models effectively fit the original data.

4. Discussion

The physical environment of a place and its perception significantly influence residents’ behavior and health. In recent years, the importance of urban street environments has been explored across multiple disciplines, with studies examining how the objective conditions of urban streets impact pedestrians’ psychological and physiological states. These investigations aim to identify and select environmental factors that enhance human perception. The current research on waterfront street environments has primarily focused on several key areas: accessibility of waterfront zones [101,102], esthetic preferences [103,104], thermal comfort [105,106], and pedestrian service quality and environmental satisfaction in waterfront streets [71]. However, limited studies have explored the impact of waterfront street environments on human perception, and the potential negative influences of specific environmental characteristics remain unclear.
To address this gap, the present study employed SVIs and deep learning techniques to systematically analyze how the unique physical and spatial features of waterfront streets influence six critical dimensions of human perception: safety, wealth, vitality, beauty, boredom, and depression. By integrating this analysis with the existing theoretical frameworks, this research provides a deeper understanding of the role of waterfront streets in shaping urban experiences. Moreover, the findings offer urban planners and designers insights into the key physical features that affect human perception of waterfront streets.

4.1. Positive Human Perceptions

The regression analysis revealed that certain physical features significantly influence positive perceptions, including safety, wealth, vitality, and beauty.
Safety perception is strongly enhanced by greenness and enclosure, as the presence of vegetation combined with well-defined spatial boundaries creates a sense of order and protection [95]. The study by Xiangyuan et al. [107] supports this finding, noting that abundant greenery improves outdoor enclosure, fostering a safer environment. Moreover, enclosure is strongly related to the density of surrounding buildings and trees. High enclosure typically occurs in areas where tall buildings and large trees cluster together, corresponding to urban centers [95]. Social interactions are also encouraged in such spaces [108]. He et al. [109] further indicated that high-quality greenery positively contributes to the livability of the built environment. Enclosure affects residents’ perception of space, which is associated with crime rates: areas with higher levels of enclosure tend to have lower crime rates, whereas areas with lower levels of enclosure are associated with higher crime rates [110,111]. Additionally, walkability and environmental color diversity have a similar impact on safety. Walkable streets not only reduce pedestrian–traffic conflicts, but also improve spatial visibility, making it easier for pedestrians to assess their surroundings [112]. Furthermore, diverse environmental colors enhance familiarity, contributing to perceptions of safety and comfort [113].
Greenness has a significant positive impact on the perception of wealth, serving as a vital element of urban ecosystems that support urban tourism, recreational activities, and economic growth [114]. Since 1975, Japan’s Landscape Ordinances have regulated building heights, pedestrian spaces, outdoor advertisements, and street view design. These measures have successfully preserved the esthetic character of urban streets in Japan, enhancing overall city quality. As a result, communities with a higher perception of wealth, particularly urban centers, benefit from superior public facilities and well-maintained environments [90]. Walkability contributes to wealth by increasing pedestrian comfort through well-designed sidewalks, which attract public activities and economic engagement [115]. For high-traffic streets, the addition of vertical greenery and systematic street planting can further enhance perceptions of wealth.
Vitality perception is significantly influenced by the building visual ratio, enclosure, greenness, and walkability. According to Yuan et al. [111], a higher density of buildings reflects urban vitality. Meanwhile, combining vegetation with functional urban designs can transform monotonous streets into vibrant environments [116]. Yuan et al. also pointed out that buildings can enhance the perception of vitality [111], as they are often associated with metropolitan areas and modernity. Enclosure created by a continuous streetscape attracts more foot traffic and enhances social activities [117]. Additionally, wide pedestrian streets encourage walking behaviors, creating inviting spaces that draw people to gather and interact.
The study found that enclosure and greenness play a significant role in enhancing the perception of beauty, while blueness and environmental color diversity further enrich the esthetic appeal of street environments. Natural environments, including green vegetation and well-maintained river ecosystems, improve landscape appeal and esthetic experiences [118,119,120,121]. Research highlights the role of urban greening elements, such as trees and grass, in shaping perceptions of beauty [122], Previous studies have indicated that the prolonged dwell time in streetscapes with herbaceous plants suggests that the presence of rich visual elements, such as diverse flower colors and species richness, enhances the attractiveness and diversity of the landscape, providing greater visual stimulation and esthetic value [123,124]. Wide and clear water bodies further enhance the attractiveness of waterfront streets [125]. Moreover, diverse environmental colors, created by buildings, vegetation, and streetscape elements, add visual complexity and engage pedestrians [126].

4.2. Negative Human Perceptions

Identifying the factors that contribute to negative perceptions is essential for formulating targeted strategies to enhance the safety, vitality, beauty, and overall quality of waterfront street environments. The results reveal that openness has a strong negative impact on the perceptions of safety, vitality, beauty, and wealth, a finding that contrasts with the study by Long et al. One possible reason is that the uniqueness of Japan’s urban planning, where building heights are generally low, creates a higher degree of sky exposure in most streets. Xu et al. pointed out that urban plots with low levels of enclosure often lack canopy cover and building shelter, leading to a reduced sense of safety and a heightened sense of spatial imbalance [127].
The study also found that buildings have a significantly negative effect on the perceptions of safety and beauty, and the natural-to-artificial ratio has a slight negative influence on wealth. Although an increased number of buildings can enhance street vitality, high-density development diminishes the esthetic appeal of streets, creating a “concrete jungle” effect [67]. Physical disorder in an area, such as litter, graffiti, vandalism, and poorly maintained buildings, leading to dirty streets, can also diminish the perceived sense of safety [128]. Streets with a higher natural-to-artificial ratio tend to feature more natural landscapes; however, when vegetation coverage significantly exceeds building density, it often indicates that the area is located in a suburban zone that has been either underdeveloped or preserved as an ecological reserve [111], which, in turn, decreases the perceived wealth of the street.
The research revealed that the building visual ratio and walkability significantly reduce boredom on streets, while blueness, enclosure, and greenness enhance street interest and alleviate boredom. Previous studies have shown that buildings in street environments can effectively alleviate the boredom that street space brings to the public. As building density increases, streetscapes form highly artificial visual corridors, characterized by rich and diverse patterns, which help reduce boredom [129]. Similarly, the walkability of waterfront streets has been shown to mitigate boredom by encouraging pedestrian activity and engagement [130].
As part of the natural landscape, abundant vegetation and well-maintained water bodies can create a pleasant and enjoyable streetscape [131]. Furthermore, the study found that enclosure, greenness, walkability, and blueness are effective in reducing the feelings of depression in streets. Research by Dempsey et al. highlights the critical role of blue–green spaces in promoting public mental health. Water bodies in urban areas help regulate the physical environment and improve air quality [132,133], while vegetation releases oxygen and negative ions through respiration, which can regulate the cerebral cortex function. High-quality blue–green spaces energize the public, eliminate fatigue, alleviate oppressive emotions, and improve work efficiency [134,135,136].
However, increased openness exacerbates perceptions of boredom and depression in the streets. Excessive sky exposure creates a broad and monotonous visual experience, contributing to these negative emotions, as reported in previous studies [67]. Similarly, a higher building view ratio can intensify depression. Previous research has shown that as building density and the number of high-rise buildings increase, pedestrians may experience a “concrete jungle” effect, where overly compact street spaces trigger negative emotions such as anxiety and depression [137].

4.3. Spatial Optimization Strategies

The spatial heterogeneity analysis of human perception along the Murasaki River waterfront street revealed that feelings of boredom and depression are relatively high overall, while perceptions of vitality and beauty remain low. A possible reason for this may be the combined effects of Japanese architectural styles, function-oriented street planning, conservative use of colors, and cultural tendencies towards restraint and moderation. Additionally, safety and wealth perceptions are moderate and require further improvement.
Significant variations in human perceptions are observed across different street sections. In the northern and central sections, boredom and depression are particularly pronounced. To address these issues, increasing green areas should be prioritized during street construction and renovation. Particularly in the central section street, which experiences heavy traffic flow, street planting elements can help alleviate boredom [67]. For instance, the construction of vertical greenery along the street not only mitigates depression, but also enhances the street’s esthetic appeal [138]. Moreover, systematic planning of traffic lights and landscape facilities can improve the sense of order, thereby enhancing safety. At the same time, widening walkable streets would improve spatial dimensions and pedestrian comfort.
In the southern section, where vitality is notably weak, increasing the quantity and diversity of plant landscapes is essential. Planting designs should focus on enhancing the variety of street vegetation to create a more dynamic and visually engaging streetscape. Furthermore, expanding the openness of blue spaces and maintaining regular upkeep of the Murasaki River can effectively reduce feelings of depression [95]. In both the central and southern sections, the variety and number of buildings, such as commercial and multifunctional mixed-use structures, should be increased to promote vitality effectively [139]. These improvements would create a more balanced and vibrant street environment while addressing the identified perception gaps.

4.4. Limitations and Future Research

Although this study discusses the impact of physical features of waterfront streets on human perception, the limitations of the study are also worth discussing. Firstly, the SVIs used in this research represent only specific moments in time, which may not fully reflect the current state of the street environment. This temporal limitation could lead to biased or outdated conclusions. Future studies should focus on collecting the most recent SVI data or utilizing technologies such as real-time panoramic mapping and drone imagery to ensure a more dynamic and up-to-date representation of the environment. Moreover, integrating crowd-sourced images or videos from users might further enhance the temporal and spatial resolution of the data.
Second, while this study utilized semantic segmentation to effectively identify elements such as street signs and traffic signals, features such as graffiti and commercial signage remain challenging due to their diverse forms and ambiguous semantics. Moreover, the analysis focused on the availability rather than the quality of facilities. Future research could address these gaps by adopting image preprocessing, higher-resolution Street View images, and deep learning-based quality assessment models to enhance the accuracy of facility condition detection and improve perception prediction reliability.
Thirdly, the physical features of the streets examined in this study are not comprehensive. Factors such as building facade details, storefront displays, street furniture, vegetation density, and even seasonal changes significantly influence human perception. These variables were excluded due to challenges in quantification and data collection. Future research should prioritize the inclusion of such variables by developing advanced data collection methods, such as AI-driven image analysis, to achieve a more holistic understanding of environmental influences on perception.
Fourth, this study did not address potential variations in human perceptions across different ages, genders, socioeconomic statuses, or cultural backgrounds. As these social attributes significantly influence environmental perceptions, their omission may constrain the explanatory power and generalizability of the results. Future studies are encouraged to integrate surveys, demographic data, or large-scale labeled datasets to systematically investigate perception heterogeneity among diverse social groups. This would provide a more nuanced understanding of urban spatial perception and enhance the applicability of research findings in urban design and policymaking.
Fifth, the scope of the study was limited to the Murasaki River waterfront street in Kitakyushu, Japan, which possesses distinctive cultural, social, and urban characteristics. The spatial morphology, streetscape design, and human–environment interactions in Japanese cities often differ markedly from those in other countries, influenced by unique historical, esthetic, and social norms. This specificity restricts the generalizability of the findings to other urban contexts. To enhance external validity, future research should expand the sample scope to include multiple waterfront streets across diverse cities and regions, incorporating cross-cultural comparisons that can reveal universal principles as well as local particularities.
Finally, this study primarily adopted a static analysis approach and lacked consideration of human interaction with the space over time, such as pedestrian flow dynamics, temporal activity patterns, or subjective longitudinal experiences. Future studies could adopt longitudinal or mixed-method approaches, combining machine learning with qualitative data collection, to delve deeper into the dynamic relationship between urban waterfront spaces and human perception.

5. Conclusions

The built environment of waterfront streets significantly affects human perceptions. Evaluating human perceptions of urban waterfront streets and their influencing factors plays a crucial role in guiding urban waterfront street planning and redevelopment. This study highlights the limitations of traditional methods, such as slow data collection and narrow research scope, and emphasizes the potential of advanced mapping services and computer technologies for achieving more efficient and spatially detailed analyses. Using the Place Pulse 2.0 dataset and the SVIs, this study focused on the Murasaki River waterfront street in Kitakyushu, Japan, to evaluate six dimensions of human perception: safety, wealth, beauty, vitality, boredom, and depression. Through semantic segmentation techniques, street landscape elements such as vegetation, buildings, and roads were quantified to analyze their influence on human perceptions. The study identified significant spatial variations in perceptions along the street and provided targeted improvement strategies.
The findings reveal that boredom and depression are prominent issues along the Murasaki River waterfront street. Low perceptions of beauty are notable in the northern section, vitality is low in the southern section, and the central section experiences low perceptions of safety, vitality, and beauty. Specific improvement measures are needed for these sections. In response to the above problems, the specific street areas need to be improved. Enhancing the natural landscape, particularly with vegetation, can effectively reduce depression and boredom while improving perceptions of wealth, beauty, and safety. Increasing building presence can improve perceived vitality, but excessive density may lead to pressure. Walkability enhances perceptions of wealth, safety, and beauty, but excessive openness can increase boredom and depression while weakening safety.
The findings regarding human perceptions of waterfront streets and their physical features offer valuable insights that can be applied across various stages of urban street development and management. These results provide critical reference points for informing future urban planning strategies. Meanwhile, the study’s results can guide the design of more targeted and effective urban environments tailored to specific human perception needs. Future research should integrate a broader spectrum of multivariate urban data, alongside historical street view imagery, to enhance the spatial and temporal dimensions of human perception analysis in urban waterfront streets. This approach would improve the generalizability and practical applicability of the findings.

Supplementary Materials

The following supporting information can be downloaded at: https://www.mdpi.com/article/10.3390/buildings15101678/s1, Table S1: standardized predicted scores of six human perception; Table S2: Computation Results of Waterfront Street Physical Features.

Author Contributions

Conceptualization, Y.Y., G.H. and D.B.; data curation, Y.Y. and G.H.; formal analysis, Y.Y. and G.H.; investigation, Y.Y., G.H. and M.L.; methodology, Y.Y., G.H., D.S. and M.L.; project administration, Y.Y. and M.L.; resources, Y.Y., G.H. and D.S.; software, Y.Y. and G.H.; supervision, Y.Y., M.L. and D.B.; validation, Y.Y., G.H. and M.L.; visualization, G.H.; writing—original draft preparation, Y.Y. and G.H.; writing—review and editing, Y.Y., G.H., D.S., M.L. and D.B. All authors have read and agreed to the published version of the manuscript.

Funding

This research received no external funding.

Data Availability Statement

Interview transcripts and interpreted statements supporting this study’s findings and the smart contract codes are available from the corresponding author upon reasonable request.

Acknowledgments

We would like to thank the journal experts who edited this paper. We also appreciate the constructive suggestions and comments on the manuscript from the reviewers and editors.

Conflicts of Interest

The authors declare no conflicts of interest.

References

  1. Jiang, Y.; Sun, Y.; Liu, Y.; Li, X. Exploring the correlation between waterbodies, green space morphology, and carbon dioxide concentration distributions in an urban waterfront green space: A simulation study based on the carbon cycle. Sustain. Cities Soc. 2023, 98, 104831. [Google Scholar] [CrossRef]
  2. Sieweke, J. River. Space. Design. Planning Strategies, Methods and Projects for Urban Rivers. J. Landsc. Archit. 2013, 8, 84–85. [Google Scholar] [CrossRef]
  3. Gan, Z.X. Discussion on several problems of waterfront development. City Plan. Rev. 1998, 2, 42–45. [Google Scholar]
  4. Wang, Y.; Dewancker, B.J.; Qi, Q. Citizens’ preferences and attitudes towards urban waterfront spaces: A case study of Qiantang riverside development. Environ. Sci. Pollut. Res. 2020, 27, 45787–45801. [Google Scholar] [CrossRef]
  5. Vian, F.D.; Izquierdo, J.J.P.; Martínez, M.S. River-city recreational interaction: A classification of urban riverfront parks and walks. Urban For. Urban Green. 2021, 59, 127042. [Google Scholar] [CrossRef]
  6. Hagerman, C. Shaping neighborhoods and nature: Urban political ecologies of urban waterfront transformations in Portland, Oregon. Cities 2007, 24, 285–297. [Google Scholar] [CrossRef]
  7. Sepe, M. Urban history and cultural resources in urban regeneration: A case of creative waterfront renewal. Plan. Perspect. 2013, 28, 595–613. [Google Scholar] [CrossRef]
  8. Follmann, A. Urban mega-projects for a ‘world-class’ riverfront—The interplay of informality, flexibility and exceptionality along the Yamuna in Delhi, India. Habitat Int. 2015, 45, 213–222. [Google Scholar] [CrossRef]
  9. Desfor, G.; Jørgensen, J. Flexible urban governance. The case of Copenhagen’s recent waterfront development. Eur. Plan. Stud 2004, 12, 479–496. [Google Scholar] [CrossRef]
  10. Che, Y.; Yang, K.; Chen, T.; Xu, Q. Assessing a riverfront rehabilitation project using the comprehensive index of public accessibility. Ecol. Eng. 2012, 40, 80–87. [Google Scholar] [CrossRef]
  11. Feldman, M. Urban waterfront regeneration and local governance in Tallinn. Eur.-Asia Stud. 2000, 52, 829–850. [Google Scholar] [CrossRef]
  12. Samant, S. Manifestation of the urban public realm at the water edges in India—A case study of the ghats in Ujjain. Cities 2004, 21, 233–253. [Google Scholar] [CrossRef]
  13. Yan, C.; Cai, X.; Wu, Y.; Tang, X.; Zhou, Y.; Yang, Q.; Li, F.; Lan, S.; Lin, L. How Do Urban Waterfront Landscape Characteristics Influence People’s Emotional Benefits? Mediating Effects of Water-Friendly Environmental Preferences. Forests 2024, 15, 25. [Google Scholar] [CrossRef]
  14. Harvey, C. Measuring Streetscape Design for Livability Using Spatial Data and Methods; The University of Vermont and State Agricultural College: Burlington, VT, USA, 2014. [Google Scholar]
  15. Lyu, M.; Meng, Y.; Gao, W.; Yu, Y.; Ji, X.; Li, Q.; Huang, G.; Sun, D. Measuring the perceptual features of coastal streets: A case study in Qingdao, China. Environ. Res. Commun. 2022, 4, 115002. [Google Scholar] [CrossRef]
  16. Huang, L.S.; Han, Y.; Ye, Y. Coastal Waterfront Vibrancy: An Exploration from the Perspective of Quantitative Urban Morphology. Buildings 2022, 12, 1585. [Google Scholar] [CrossRef]
  17. Sairinen, R.; Kumpulainen, S. Assessing social impacts in urban waterfront regeneration. Environ. Impact Assess. Rev. 2006, 26, 120–135. [Google Scholar] [CrossRef]
  18. Vich, G.; Magadán, J.D.; Miralles-Guasch, C. The composition of green spaces and levels of physical activity of older people in Barcelona. Congr. Int. Ciudad Y Territ. Virtual (CTV) 2019. [Google Scholar] [CrossRef]
  19. Ewing, R.; Cervero, R. Travel and the built environment: A meta-analysis. J. Am. Plan. Assoc. 2010, 76, 265–294. [Google Scholar] [CrossRef]
  20. Bin, J.; Li, L.; Zhang, T. Exploring relationship between urban spatial elements and public health: Using ‘the image of city’ theory as a research framework. Shanghai Urban Plan. Rev. 2017, 3, 63–68. [Google Scholar]
  21. Liu, W.; Zheng, S.; Hu, X.; Wu, Z.; Chen, S.; Huang, Z.; Zhang, W. Effects of spatial scale on the built environments of community life circles providing health functions and services. Build. Environ. 2022, 223, 109492. [Google Scholar] [CrossRef]
  22. Nogueira, H.; Ferrão, M.; Gama, A.; Mourão, I.; Rosado Marques, V.; Pedez, C. Perceptions of neighborhood environments and childhood obesity: Evidence of harmful gender inequities among Portuguese children. Health Place 2013, 1, 69–73. [Google Scholar] [CrossRef] [PubMed]
  23. Ruijsbroek, A.; Droomers, M.; Groenewegen, P.P.; Hardyns, W.; Stronks, K. Social safety, self-rated general health and physical activity: Changes in area crime, area safety feelings and the role of social cohesion. Health Place 2015, 31, 39–45. [Google Scholar] [CrossRef] [PubMed]
  24. Ahuja, C.; Ayers, C.; Hartz, J.; Adu-Brimpong, J.; Thomas, S.; Mitchell, V.; Peters-Lawrence, M.; Sampson, D.; Brooks, A.T.; Wallen, G.; et al. Examining relationships between perceptions and objective assessments of neighborhood environment and sedentary time: Data from the Washington, DC Cardiovascular Health and Needs Assessment. Prev. Med. Rep. 2018, 9, 42–48. [Google Scholar] [CrossRef] [PubMed]
  25. Li, Y.; Miller, H.J.; Root, E.D.; Hyder, A.; Liu, D. Understanding the role of urban social and physical environment in opioid overdose events using found geospatial data. Health Place 2022, 75, 102792. [Google Scholar] [CrossRef]
  26. Zeng, Q.; Bao, X.; Dewancker, B.J. Association between built environment on transport and recreational walking in Japan: The case of Kitakyushu. City Built Environ. 2023, 1, 10. [Google Scholar] [CrossRef]
  27. Villagra, P.; Rojas, C.; Rojas, O.; Alves, S. Spatial interactions between perceived biophilic values and neighborhood typologies in urban wetlands. City Built Environ. 2024, 2, 3. [Google Scholar] [CrossRef]
  28. Harding, J.; Pribram, E.D. The power of feeling: Locating emotions in culture. Eur. J. Cult. Stud. 2002, 5, 407–426. [Google Scholar] [CrossRef]
  29. Jacobs, J. The Death and Life of Great American Cities; Random House: New York, NY, USA, 1961. [Google Scholar]
  30. Alexander, C.; Ishikawa, S.; Silverstein, M. A pattern. Language 1977, 14, 80–81. [Google Scholar] [CrossRef]
  31. Moniruzzaman, M.; Páez, A. A model-based approach to select case sites for walkability audits. Health Place 2012, 18, 1323–1334. [Google Scholar] [CrossRef]
  32. Lynch, K. The Image of the City; The MIT Press: Cambridge, MA, USA, 1960; ISBN 0-262-62001-4. [Google Scholar]
  33. Zhou, H.; He, S.; Cai, Y.; Wang, M.; Su, S. Social inequalities in neighborhood visual walkability: Using street view imagery and deep learning technologies to facilitate healthy city planning. Sustain. Cities Soc. 2019, 50, 101605. [Google Scholar] [CrossRef]
  34. Li, X.; Wang, X.; Jiang, X.; Han, J.; Wang, Z.; Wu, D.; Lin, Q.; Li, L.; Zhang, S.; Dong, Y. Prediction of riverside greenway landscape aesthetic quality of urban canalized rivers using environmental modeling. J. Clean. Prod. 2022, 367, 133066. [Google Scholar] [CrossRef]
  35. Chen, Y.; Yuan, Y. The neighborhood effect of exposure to blue space on elderly individuals’ mental health: A case study in Guangzhou, China. Health Place 2020, 63, 102348. [Google Scholar] [CrossRef] [PubMed]
  36. Wu, W.; Guo, J.; Ma, Z.; Zhao, K. Data-driven approach to assess street safety: Large-scale analysis of the microscopic design. ISPRS Int. J. Geo-Inf. 2022, 11, 537. [Google Scholar] [CrossRef]
  37. Li, Y.; Yabuki, N.; Fukuda, T. Integrating GIS, deep learning, and environmental sensors for multicriteria evaluation of urban street walkability. Landsc. Urban Plan. 2023, 230, 104603. [Google Scholar] [CrossRef]
  38. Santosa, H.; Ernawati, J.; Wulandari, L.D. Visual quality evaluation of urban commercial streetscape for the development of landscape visual planning system in provincial street corridors in Malang, Indonesia. IOP Conf. Ser. Earth Environ. Sci. 2018, 126, 012202. [Google Scholar] [CrossRef]
  39. Sun, D.; Ji, X.; Gao, W.; Zhou, F.; Yu, Y.; Meng, Y.; Yang, M.; Lin, J.; Lyu, M. The relation between green visual index and visual comfort in Qingdao coastal streets. Buildings 2023, 13, 457. [Google Scholar] [CrossRef]
  40. Oliveira, V.; Oliveira, V. The elements of urban form. In Urban Morphology: An Introduction to the Study of the Physical Form of Cities; Springer: Cham, Switzerland, 2016; pp. 7–30. [Google Scholar]
  41. Moura, F.; Cambra, P.; Gonçalves, A.B. Measuring walkability for distinct pedestrian groups with a participatory assessment method: A case study in Lisbon. Landsc. Urban Plan. 2017, 157, 282–296. [Google Scholar] [CrossRef]
  42. Zhao, Q.; Li, J.; Cuan, Y.; Zhou, Z. The evolution response of ecosystem cultural services under different scenarios based on system dynamics. Remote Sens. 2020, 12, 418. [Google Scholar] [CrossRef]
  43. Tennant, R.; Hiller, L.; Fishwick, R.; Platt, S.; Joseph, S.; Weich, S.; Parkinson, J.; Secker, J.; Stewart-Brown, S. The warwick-edinburgh mental well-being scale (WEMWBS): Development and UK validation. Health Qual Life Outcomes 2007, 5, 63. [Google Scholar] [CrossRef]
  44. Furukawa, T.A.; Kawakami, N.; Saitoh, M.; Ono, Y.; Nakane, Y.; Nakamura, Y.; Tachimori, H.; Iwata, N.; Uda, H.; Nakane, H.; et al. The performance of the Japanese version of the K6 and K10 in the World Mental Health Survey Japan. Int. J. Methods Psychiatr. Res. 2008, 17, 152–158. [Google Scholar] [CrossRef]
  45. Fernández-Gavilanes, M.; Costa-Montenegro, E.; García-Méndez, S.; González-Castaño, F.J.; Juncal-Martínez, J. Evaluation of online emoji description resources for sentiment analysis purposes. Expert Syst. Appl. 2021, 184, 115279. [Google Scholar] [CrossRef]
  46. Ahanin, Z.; Ismail, M.A. A multi-label emoji classification method using balanced pointwise mutual information-based feature selection. Comput. Speech Lang. 2022, 73, 101330. [Google Scholar] [CrossRef]
  47. Chen, Z. Assessing the impact of high-density high-heterogeneity urban district landscape on psychological health and optimizing via evidence-based design. Landsc. Archit. 2018, 25, 106–111. [Google Scholar]
  48. Sv, P.; Ittamalla, R. Analyzing Indian citizen’s perspective towards government using wearable sensors to tackle COVID-19 crisis—A text analytics study. Health Policy Technol. 2021, 10, 100521. [Google Scholar] [CrossRef]
  49. Wang, X.; Li, A.F. The influence of buildt environment on residents’s positive emotions in high-density urban blocks: A case study of Beijing. Urban Dev. Stud. 2023, 30, 89–96. [Google Scholar]
  50. Lynch, K. The Image of the City. Publication of the Joint Center for Urban Studies; MIT Press: Cambridge, MA, USA, 2008. [Google Scholar]
  51. Montello, D.R.; Goodchild, M.F.; Gottsegen, J.; Fohl, P. Where’s downtown?: Behavioral methods for determining referents of vague spatial queries. In Spatial Vagueness, Uncertainty, Granularity; Psychology Press: London, UK, 2017; pp. 185–204. [Google Scholar]
  52. Cao, J.; Wang, J.; Wu, X.; Ding, C.; Wang, W.; Wang, H. Post-evaluation of urban river open space landscape restoration: A case study of the eastern part of the Inner Qinhuai River in Nanjing. J. Nanjing For. Univ. 2020, 44, 195. [Google Scholar]
  53. Li, Y.; Yabuki, N.; Fukuda, T. Measuring visual walkability perception using panoramic street view images, virtual reality, and deep learning. Sustain. Cities Soc. 2022, 86, 104140. [Google Scholar] [CrossRef]
  54. Biljecki, F.; Ito, K. Street view imagery in urban analytics and GIS: A review. Landsc. Urban Plan. 2021, 215, 104217. [Google Scholar] [CrossRef]
  55. Liu, Y.; Liu, X.; Gao, S.; Gong, L.; Kang, C.; Zhi, Y.; Chi, G.; Shi, L. Social sensing: A new approach to understanding our socioeconomic environments. Ann. Assoc. Am. Geogr. 2015, 105, 512–530. [Google Scholar] [CrossRef]
  56. Ewing, R.; Cervero, R. Travel and the built environment: A synthesis. Transp. Res. Rec 2001, 1780, 87–114. [Google Scholar] [CrossRef]
  57. Sun, D.; Li, Q.; Gao, W.; Huang, G.; Tang, N.; Lyu, M.; Yu, Y. On the relation between visual quality and landscape characteristics: A case study application to the waterfront linear parks in Shenyang, China. Environ. Res. Commun. 2021, 3, 115013. [Google Scholar] [CrossRef]
  58. Xu, L.; Kang, Q. The relationship between pedestrian behaviors and the spatial features along the ground-floor commercial street: The case of West Nanjing road in Shanghai. Urban Plan. Forum 2014, 3, 104–111. [Google Scholar]
  59. Long, Y.; Zhou, Y. Quantitative evaluation on street vibrancy and its impact factors: A case study of Chengdu. New Archit. 2016, 1, 52–57. [Google Scholar]
  60. Wu, C.; Peng, N.; Ma, X.; Li, S.; Rao, J. Assessing multiscale visual appearance characteristics of neighbourhoods using geographically weighted principal component analysis in Shenzhen, China. Comput. Environ. Urban Syst. 2020, 84, 101547. [Google Scholar] [CrossRef]
  61. Ye, Y.; Richards, D.; Lu, Y.; Song, S.; Zhuang, Y.; Zeng, W.; Zhong, T. Measuring daily accessed street greenery: A human-scale approach for informing better urban planning practices. Landsc. Urban Plan. 2019, 191, 103434. [Google Scholar] [CrossRef]
  62. Zhang, F.; Zhou, B.; Liu, L.; Liu, Y.; Fung, H.H.; Lin, H.; Ratti, C. Measuring human perceptions of a large-scale urban region using machine learning. Landsc. Urban Plan. 2018, 180, 148–160. [Google Scholar] [CrossRef]
  63. Gupta, J.; Pathak, S.; Kumar, G. Deep learning (CNN) and transfer learning: A review. J. Phys. 2022, 2273, 012029. [Google Scholar] [CrossRef]
  64. Gao, F.; Chen, X.; Liao, S.; Chen, W.; Feng, L.; Wu, J.; Zhou, Q.; Zheng, Y.; Li, G.; Li, S. Crafting a jogging-friendly city: Harnessing big data to evaluate the runnability of urban streets. J. Transp. Geogr. 2024, 121, 104015. [Google Scholar] [CrossRef]
  65. Gonzalez, D.; Rueda-Plata, D.; Acevedo, A.B.; Duque, J.C.; Ramos-Pollán, R.; Betancourt, A.; García, S. Automatic detection of building typology using deep learning methods on street level images. Build. Environ. 2020, 177, 106805. [Google Scholar] [CrossRef]
  66. Nagata, S.; Nakaya, T.; Hanibuchi, T.; Amagasa, S.; Kikuchi, H.; Inoue, S. Objective scoring of streetscape walkability related to leisure walking: Statistical modeling approach with semantic segmentation of google street view images. Health Place 2020, 66, 102428. [Google Scholar] [CrossRef]
  67. Wang, L.; Han, X.; He, J.; Jung, T. Measuring residents’ perceptions of city streets to inform better street planning through deep learning and space syntax. ISPRS J. Photogramm. Remote Sens. 2022, 190, 215–230. [Google Scholar] [CrossRef]
  68. Huang, Z.; Wang, B.; Luo, S.; Wang, M.; Miao, J.; Jia, Q. Integrating Streetscape Images, Machine Learning, and Space Syntax to Enhance Walkability: A Case Study of Seongbuk District, Seoul. Land 2024, 13, 1591. [Google Scholar] [CrossRef]
  69. Jeon, J.; Woo, A. Deep learning analysis of street panorama images to evaluate the streetscape walkability of neighborhoods for subsidized families in Seoul, Korea. Landsc. Urban Plan. 2023, 230, 104631. [Google Scholar] [CrossRef]
  70. Fan, R.; Chen, Y.; Yocom, K.P. A New Approach to Landscape Visual Quality Assessment from a Fine-Tuning Perspective. Land 2024, 13, 673. [Google Scholar] [CrossRef]
  71. Sun, D.; Ji, X.; Lyu, M.; Fu, Y.; Gao, W. Evaluation and diagnosis for the pedestrian quality of service in urban riverfront streets. J. Clean. Prod. 2024, 452, 142090. [Google Scholar] [CrossRef]
  72. Adams, M.A.; Ryan, S.; Kerr, J.; Sallis, J.F.; Patick, K.; Frank, L.D.; Norman, G.J. Validation of the Neighborhood Environment Walkability Scale (NEWS) items using geographic information systems. J. Phys. Act. Health 2009, 6, S113–S123. [Google Scholar] [CrossRef]
  73. Zhang, Y.; Li, S.; Dong, R.; Deng, H.; Fu, X.; Wang, C.; Yu, T.; Jia, T.; Zhao, J. Quantifying physical and psychological perceptions of urban scenes using deep learning. Land Use Policy 2021, 111, 105762. [Google Scholar] [CrossRef]
  74. Dubey, A.; Naik, N.; Parikh, D.; Raskar, R.; Hidalgo, C.A. Deep learning the city: Quantifying urban perception at a global scale. In Proceedings of the Computer Vision–ECCV 2016: 14th European Conference, Amsterdam, The Netherlands, 11–14 October 2016; Proceedings, Part I 14. Springer International Publishing: Berlin/Heidelberg, Germany, 2016; pp. 196–212. [Google Scholar]
  75. Wang, Z.; Ito, K.; Biljecki, F. Assessing the equity and evolution of urban visual perceptual quality with time series street view imagery. Cities 2024, 145, 104704. [Google Scholar] [CrossRef]
  76. Rossetti, T.; Lobel, H.; Rocco, V.; Hurtubia, R. Explaining subjective perceptions of public spaces as a function of the built environment: A massive data approach. Landsc. Urban Plan. 2019, 181, 169–178. [Google Scholar] [CrossRef]
  77. Yang, C.; Xu, F.N.; Jiang, L.; Wang, R.F.; Yin, L.; Zhao, M.W.; Zhang, X.X. Approach to quantify spatial comfort of urban roads based on street view images. Geo-Inf. Sci 2021, 23, 785–801. [Google Scholar]
  78. Lu, Y.; Chen, H.M. Using google street view to reveal environmental justice: Assessing public perceived walkability in macroscale city. Landsc. Urban Plan. 2024, 244, 104995. [Google Scholar] [CrossRef]
  79. Ma, Z. Deep exploration of street view features for identifying urban vitality: Acase study of Qingdao city. Int. J. Appl. Earth Obs. Geoinf. 2023, 123, 103476. [Google Scholar] [CrossRef]
  80. Moreno-Vera, F.; Lavi, B.; Poco, J. Urban Perception: Can we understand why a street is safe? In Mexican International Conference on Artificial Intelligence; Springer International Publishing: Cham, Switzerland, 2021; pp. 277–288. [Google Scholar]
  81. Qiu, W.; Zhang, Z.; Liu, X.; Li, W.; Li, X.; Xu, X.; Huang, X. Subjective or objective measures of street environment, which are more effective in explaining housing prices? Landsc. Urban Plan. 2022, 221, 104358. [Google Scholar] [CrossRef]
  82. Zhang, F.; Zu, J.; Hu, M.; Zhu, D.; Kang, Y.; Gao, S.; Zhang, Y.; Huang, Z. Uncovering inconspicuous places using social media check-ins and street view images. Comput. Environ. Urban Syst. 2020, 81, 101478. [Google Scholar] [CrossRef]
  83. Larkin, A.; Gu, X.; Chen, L.; Hystad, P. Predicting perceptions of the built environment using GIS satellite and street view image approaches. Landsc. Urban Plan. 2021, 216, 104257. [Google Scholar] [CrossRef]
  84. Wang, R.; Liu, Y.; Lu, Y.; Yuan, Y.; Zhang, J.; Liu, P.; Yao, Y. The linkage between the perception of neighbourhood and physical activity in Guangzhou, China: Using street view imagery with deep learning techniques. Int. J. Health Geogr. 2019, 18, 18. [Google Scholar] [CrossRef]
  85. Ordonez, V.; Berg, T.L. Learning high-level judgments of urban perception. In Proceedings of the Computer Vision–ECCV 2014: 13th European Conference, Zurich, Switzerland, 6–12 September 2014; Proceedings, Part VI 13. Springer International Publishing: Berlin/Heidelberg, Germany, 2014; pp. 494–510. [Google Scholar]
  86. Yao, Y.; Wang, J.; Hong, Y.; Qian, C.; Guan, Q.; Liang, X.; Dai, L.; Zhang, J. Discovering the homogeneous geographic domain of human perceptions from street view images. Landsc. Urban Plan. 2021, 212, 104125. [Google Scholar] [CrossRef]
  87. Lyu, M.; Lin, J.; Zhou, F.; Niu, J.; Sun, D.; Meng, Y.; Ji, X. A method for evaluating the visual quality of wetland park landscapes: A case study of qianlu lake wetland park in Wuping, China. Environ. Res. Commun. 2024, 6, 105024. [Google Scholar] [CrossRef]
  88. Gong, F.Y.; Zeng, Z.C.; Zhang, F.; Li, X.; Ng, E.; Norford, L.K. Mapping sky, tree, and building view factors of street canyons in a high-density urban environment. Build. Environ. 2018, 134, 155–167. [Google Scholar] [CrossRef]
  89. He, T.; Li, X. Image quality recognition technology based on deep learning. J. Vis. Commun. Image Represent. 2019, 65, 102654. [Google Scholar] [CrossRef]
  90. Wang, R.; Liu, Y.; Lu, Y.; Zhang, J.; Yao, Y.; Grekousis, G. Perceptions of built environment and health outcomes for older Chinese in Beijing: A big data approach with street view images and deep learning technique. Comput. Environ. Urban Syst. 2019, 78, 101386. [Google Scholar] [CrossRef]
  91. He, N.; Li, G. Urban neighbourhood environment assessment based on street view image processing: A review of research trends. Environ. Chall. 2021, 4, 100090. [Google Scholar] [CrossRef]
  92. Zhou, B.; Zhao, H.; Puig, X.; Xiao, T.; Fidler, S.; Barriuso, A.; Torralba, A. Semantic understanding of scenes through the ade20k dataset. Int. J. Comput. Vis. 2019, 127, 302–321. [Google Scholar] [CrossRef]
  93. Zhou, B.; Zhao, H.; Puig, X.; Fidler, S.; Barriuso, A.; Torralba, A. Scene parsing through ade20k dataset. In Proceedings of the IEEE Conference on Computer Vision and Pattern Recognition, Honolulu, HI, USA, 21–26 July 2017; pp. 633–641. [Google Scholar]
  94. Ewing, R.; Handy, S. Measuring the unmeasurable: Urban design qualities related to walkability. J. Urban Des. 2009, 14, 65–84. [Google Scholar] [CrossRef]
  95. Dai, L.; Zheng, C.; Dong, Z.; Yao, Y.; Wang, R.; Zhang, X.; Ren, S.; Zhang, J.; Song, X.; Guan, Q. Analyzing the correlation between visual space and residents’ psychology in Wuhan, China using street-view images and deep-learning technique. City Environ. Interact. 2021, 11, 100069. [Google Scholar] [CrossRef]
  96. Zhou, L.; Hsieh, C.M. A multiscale walkability assessment approach creating walkable streets: A case study of high-density city, Macau. Res. Transp. Bus. Manag. 2024, 57, 101217. [Google Scholar] [CrossRef]
  97. Chen, Y.; Huang, X.; White, M. A study on street walkability for older adults with different mobility abilities combining street view image recognition and deep learning-The case of Chengxianjie Community in Nanjing (China). Comput. Environ. Urban Syst. 2024, 112, 102151. [Google Scholar] [CrossRef]
  98. Zhou, H.; Liu, L.; Lan, M.; Zhu, W.; Song, G.; Jing, F.; Zhong, Y.; Su, Z.; Gu, X. Using Google Street View imagery to capture micro built environment characteristics in drug places, compared with street robbery. Comput. Environ. Urban Syst. 2021, 88, 101631. [Google Scholar] [CrossRef]
  99. Keralis, J.M.; Javanmardi, M.; Khanna, S.; Dwivedi, P.; Huang, D.; Tasdizen, T.; Nguyen, Q.C. Health and the built environment in United States cities: Measuring associations using Google Street View-derived indicators of the built environment. BMC Public Health 2020, 20, 215. [Google Scholar] [CrossRef]
  100. Wang, R.; Lu, Y.; Zhang, J.; Liu, P.; Yao, Y.; Liu, Y. The relationship between visual enclosure for neighbourhood street walkability and elders’ mental health in China: Using street view images. J. Transp. Health 2019, 13, 90–102. [Google Scholar] [CrossRef]
  101. Othman, A.; Al-Hagla, K.; Hasan, A.E. The impact of attributes of waterfront accessibility on human well-being: Alexandria Governorate as a case study. Ain Shams Eng. J. 2021, 12, 1033–1047. [Google Scholar] [CrossRef]
  102. Zhou, S.; Chen, F.; Xu, Z. Evaluating the accessibility of urban parks and waterfronts through online map services: A case study of Shaoxing, China. Urban For. Urban Green. 2022, 77, 127731. [Google Scholar] [CrossRef]
  103. Zhou, X.; Cen, Q.; Qiu, H. Effects of urban waterfront park landscape elements on visual behavior and public preference: Evidence from eye-tracking experiments. Urban For. Urban Green. 2023, 82, 127889. [Google Scholar] [CrossRef]
  104. Ji, G.; Sun, H. Assessing urban river landscape visual quality with extreme learning machines: A case study of the yellow river in ningxia hui autonomous region, China. Ecol. Indic. 2024, 165, 112173. [Google Scholar] [CrossRef]
  105. Zhou, Y.; Lu, Y.; Zhou, X.; An, J.; Yan, D. Numerical study on the coupling effect of river attributes and riverside building forms on the urban microclimate: A case study in Nanjing, China. Sustain. Cities Soc. 2024, 107, 105459. [Google Scholar] [CrossRef]
  106. Jiang, J.; Pan, W.; Zhang, R.; Hong, Y.; Wang, J. Thermal comfort study of urban waterfront spaces in cold regions: Waterfront skyline control based on thermal comfort objectives. Build. Environ. 2024, 256, 111515. [Google Scholar] [CrossRef]
  107. Ma, X.; Ma, C.; Wu, C.; Xi, Y.; Yang, R.; Peng, N.; Zhang, C.; Ren, F. Measuring human perceptions of streetscapes to better inform urban renewal: A perspective of scene semantic parsing. Cities 2021, 110, 103086. [Google Scholar] [CrossRef]
  108. Naik, N.; Philipoom, J.; Raskar, R.; Hidalgo, C. Streetscore-predicting the perceived safety of one million streetscapes. In Proceedings of the IEEE Conference on Computer Vision and Pattern Recognition Workshops, Columbus, OH, USA, 23–28 June 2014; pp. 779–785. [Google Scholar]
  109. He, J.; Zhang, J.; Yao, Y.; Li, X. Extracting human perceptions from street view images for better assessing urban renewal potential. Cities 2023, 134, 104189. [Google Scholar] [CrossRef]
  110. Deng, M.; Yang, W.; Chen, C.; Liu, C. Exploring associations between streetscape factors and crime behaviors using Google Street View images. Front. Comput. Sci. 2022, 16, 164316. [Google Scholar] [CrossRef]
  111. Yuan, M.; Yin, C.; Sun, Y.; Chen, W. Examining the associations between urban built environment and noise pollution in high-density high-rise urban areas: A case study in Wuhan, China. Sustain. Cities Soc. 2019, 50, 101678. [Google Scholar] [CrossRef]
  112. Gore, N.; Dave, S.; Shah, J.; Jain, M.; Rathva, D.; Garg, V. Comparative analysis of pedestrian walking speed on sidewalk and carriageway. In Transportation Research: Proceedings of CTRG 2017; Springer: Singapore, 2020; pp. 65–76. [Google Scholar]
  113. Nasar, J.L. Urban design aesthetics: The evaluative qualities of building exteriors. Environ. Behav. 1994, 26, 377–401. [Google Scholar] [CrossRef]
  114. Li, F.; Wang, R.; Paulussen, J.; Liu, X. Comprehensive concept planning of urban greening based on ecological principles: A case study in Beijing, China. Landsc. Urban Plan. 2005, 72, 325–336. [Google Scholar] [CrossRef]
  115. Aghaabbasi, M.; Moeinaddini, M.; Shah, M.Z.; Asadi-shekari, Z. A new assessment model to evaluate the microscale sidewalk design factors at the neighbourhood level. J. Transp. Health 2017, 5, 97–112. [Google Scholar] [CrossRef]
  116. Held, D. Urban Landscape Entomology; Academic Press: Cambridge, MA, USA, 2019. [Google Scholar]
  117. Ye, Y.; Li, D.; Liu, X. How block density and typology affect urban vitality: An exploratory analysis in Shenzhen, China. Urban Geogr. 2018, 39, 631–652. [Google Scholar] [CrossRef]
  118. Kaplan, R.; Kaplan, S. The Experience of Nature: A Psychological Perspective; Cambridge University Press: Cambridge, UK, 1989. [Google Scholar]
  119. Wohlwill, J.F. Environmental aesthetics: The environment as a source of affect. Hum. Behav. Environ. Adv. Theory Res. 1976, 1, 37–86. [Google Scholar]
  120. Kerebel, A.; Gélinas, N.; Déry, S.; Voigt, B.; Munson, A. Landscape aesthetic modelling using Bayesian networks: Conceptual framework and participatory indicator weighting. Landsc. Urban Plan. 2019, 185, 258–271. [Google Scholar] [CrossRef]
  121. Poledniková, Z.; Galia, T. Photo simulation of a river restoration: Relationships between public perception and ecosystem services. River Res. Appl. 2021, 37, 44–53. [Google Scholar] [CrossRef]
  122. Row, A.T. The Death and Life of Great American Cities; Cape: London, UK, 1962. [Google Scholar]
  123. Rahnema, S.; Sedaghathoor, S.; Allahyari, M.S.; Damalas, C.A.; El Bilali, H. Preferences and emotion perceptions of ornamental plant species for green space designing among urban park users in Iran. Urban For. Urban Green. 2019, 39, 98–108. [Google Scholar] [CrossRef]
  124. Tomitaka, M.; Uchihara, S.; Goto, A.; Sasaki, T. Species richness and flower color diversity determine aesthetic preferences of natural-park and urban-park visitors for plant communities. Environ. Sustain. Indic. 2021, 11, 100130. [Google Scholar] [CrossRef]
  125. Steinwender, A.; Gundacker, C.; Wittmann, K.J. Objective versus subjective assessments of environmental quality of standing and running waters in a large city. Landsc. Urban Plan. 2008, 84, 116–126. [Google Scholar] [CrossRef]
  126. Park, K.; Ewing, R.; Sabouri, S.; Larsen, J. Street life and the built environment in an auto-oriented US region. Cities 2019, 88, 243–251. [Google Scholar] [CrossRef]
  127. Xu, J.; Xiong, Q.; Jing, Y.; Xing, L.; An, R.; Tong, Z.; Liu, Y.; Liu, Y. Understanding the nonlinear effects of the street canyon characteristics on human perceptions with street view images. Ecol. Indic. 2023, 154, 110756. [Google Scholar] [CrossRef]
  128. Taylor, R.B.; Gottfredson, S.D.; Brower, S. Block crime and fear: Defensible space, local social ties, and territorial functioning. J. Res. Crime Delinq. 1984, 21, 303–331. [Google Scholar] [CrossRef]
  129. Han, J. The visual quantitative analysis and empirical research of commercial pedestrian streetscape. J. Theor. Appl. Inf. Technol. 2013, 50, 76–83. [Google Scholar]
  130. Ding, J.; Luo, L.; Shen, X.; Xu, Y. Influence of built environment and user experience on the waterfront vitality of historical urban areas: A case study of the Qinhuai River in Nanjing, China. Front. Archit. Res. 2023, 12, 820–836. [Google Scholar] [CrossRef]
  131. Van Herzele, A.; De Vries, S. Linking green space to health: A comparative study of two urban neighbourhoods in Ghent, Belgium. Popul. Environ. 2012, 34, 171–193. [Google Scholar] [CrossRef]
  132. Grote, R.; Samson, R.; Alonso, R.; Amorim, J.H.; Cariñanos, P.; Churkina, G.; Fares, S.; Le Thiec, D.; Niinemets, Ü.; Mikkelsen, T.N.; et al. Functional traits of urban trees: Air pollution mitigation potential. Front. Ecol. Environ. 2016, 14, 543–550. [Google Scholar] [CrossRef]
  133. Mei, S.J.; Hu, J.T.; Liu, D.; Zhao, F.Y.; Li, Y.; Wang, Y.; Wang, H.Q. Wind driven natural ventilation in the idealized building block arrays with multiple urban morphologies and unique package building density. Energy Build. 2017, 155, 324–338. [Google Scholar] [CrossRef]
  134. Shi, G.Y.; Zhou, Y.; Sang, Y.Q.; Huang, H.; Zhang, J.S.; Meng, P.; Cai, L.L. Modeling the response of negative air ions to environmental factors using multiple linear regression and random forest. Ecol. Inform. 2021, 66, 101464. [Google Scholar] [CrossRef]
  135. Jiang, B.; Li, D.; Larsen, L.; Sullivan, W.C. A dose-response curve describing the relationship between urban tree cover density and self-reported stress recovery. Environ. Behav. 2016, 48, 607–629. [Google Scholar] [CrossRef]
  136. Pouso, S.; Borja, A.; Fleming, L.E.; Gómez-Baggethun, E.; White, M.P.; Uyarra, M.C. Maintaining contact with blue-green spaces during the COVID-19 pandemic associated with positive mental health. Sci. Total Environ. 2020, 20, 143984. [Google Scholar]
  137. Asgarzadeh, M.; Koga, T.; Hirate, K.; Farvid, M.; Lusk, A. Investigating oppressiveness and spaciousness in relation to building, trees, sky and ground surface: A study in Tokyo. Landsc. Urban Plan. 2014, 131, 36–41. [Google Scholar] [CrossRef]
  138. Perini, K.; Ottelé, M. Vertical greening systems: Contribution to thermal behaviour on the building envelope and environmental sustainability. WIT Trans. Ecol. Environ. 2012, 165, 239–250. [Google Scholar]
  139. Xia, C.; Yeh, A.G.O.; Zhang, A. Analyzing spatial relationships between urban land use intensity and urban vitality at street block level: A case study of five Chinese megacities. Landsc. Urban Plan. 2020, 193, 103669. [Google Scholar] [CrossRef]
Figure 1. Research framework.
Buildings 15 01678 g001
Figure 2. Study area.
Buildings 15 01678 g002
Figure 3. Panoramic image collection.
Buildings 15 01678 g003
Figure 4. Extracting streetscape elements by semantic segmentation.
Buildings 15 01678 g004
Figure 5. The results of human perception for different sections of the waterfront streets.
Buildings 15 01678 g005
Figure 6. Spatial distributions of different human perceptions.
Buildings 15 01678 g006
Figure 7. Correlation analysis between human perception and physical features.
Buildings 15 01678 g007
Figure 8. Regression standardized residual of the six human perceptions.
Buildings 15 01678 g008
Table 1. Correlation of the predicted scores and the subjective perception scores.
Safety (P)Vitality (P)Boredom (P)Beauty (P)Wealth (P)Depression (P)
Safety (S)0.720 **0.521 **−0.533 **0.681 **0.714 **−0.711 **
Vitality (S)0.564 **0.843 **−0.814 **0.461 **0.681 **−0.555 **
Boredom (S)−0.490 **−0.677 **0.727 **−0.443 **−0.547 **0.505 **
Beauty (S)0.713 **0.462 **−0.572 **0.749 **0.680 **−0.759 **
Wealth (S)0.731 **0.728 **−0.700 **0.655 **0.781 **−0.717 **
Depression (S)−0.573 **−0.443 **0.510 **−0.560 **−0.579 **0.594 **
Note: p < 0.01 indicates significance. ** Significant at the 0.01 level.
Table 2. Physical features of street space.
Physical
Features
Formula or SourceExpressionDefinition
Greenness G i = 1 n i = 1 n T n + 1 n i = 1 n P 1 n + 1 n i = 1 n G n { i ( 1,2 , , n ) } T n   represents the proportion of tree pixels, P 1 n represents the proportion of plant pixels, and G n represents the proportion of grass pixels.It refers to the ratio of tree, plant, and grass pixels to the overall pixels.
Building view ratio B i = 1 n i = 1 n B 1 n { i ( 1,2 , , n ) } B 1 n represents the proportion of building pixels.It refers to the ratio of building pixels to the overall pixels.
Blueness B 2 i = 1 n i = 1 n W n { i ( 1,2 , , n ) } W n represents the proportion of water pixels.It refers to the ratio of water pixels to the overall pixels.
Openness O i = 1 n i = 1 n S 1 n { i ( 1,2 , , n ) } S 1 n represents the proportion of sky pixels.It refers to the ratio of sky pixels to the overall pixels.
Walkability W i = 1 n i = 1 n P 2 n + 1 n i = 1 n F n 1 n i = 1 n R n { i ( 1,2 , , n ) } P 2 n is the percentage of pavement pixels, F n is the percentage of street fence pixels,
and R n is the percentage of road pixels.
It refers to the ratio of walkable street pixels to the overall pixels.
Enclosure E i = 1 n i = 1 n B 1 n + 1 n i = 1 n T n { i ( 1,2 , , n ) } B 1 n represents the proportion of building pixels and T n   represents the proportion of tree pixels.It refers to the extent to which street space is enclosed by street elements in a vertical interface.
Spatial indicator S I i = 1 n i = 1 n L n + 1 n i = 1 n S 2 n { i ( 1,2 , , n ) } l n represents the proportion of traffic light pixels and S n   represents the proportion of traffic sign pixels.It refers to the ratio of light and traffic sign pixels to the overall street space pixels.
Environmental color diversity C E I I = 1 1 n i = 1 n P i j i = 1 j P i j 2 P i j represents the number of j street element color pixels in an i image and j represents the total number of environment colors in an i image.It refers to the richness degree of the environment colors that be observed in the streets.
Natural-to-artificial ratio N A R i = 1 n i = 1 n T n + 1 n i = 1 n G n + 1 n i = 1 n P 1 n + 1 n i = 1 n W n 1 n i = 1 n B 1 n + 1 n i = 1 n R n + 1 n i = 1 n P 2 n { i ( 1,2 , , n ) } T n represents the proportion of tree pixels, P 1 n represents the proportion of plant pixels, G n represents the proportion of grass pixels, W n represents the proportion of water pixels, B n is the percentage of building pixels, R n is the percentage of road pixels, and P 2 n   is the percentage of pavement pixels.It refers to the ratio of the natural pixels to the artificial pixels in the overall pixels.
Table 3. The results of human perceptions for the overall Murasaki River waterfront street.
SafetyVitalityWealthBeautyBoredomDepression
Mean value0.2960.2740.3410.2730.6100.635
Standard deviation0.1160.1420.0920.1280.0790.080
Table 4. The mean values of human perception and physical features.
Overall Murasaki River Waterfront StreetNorthern Street SectionCentral Street SectionSouthern Street Section
Safety0.2960.3080.2740.308
Vitality0.2740.3430.2400.227
Wealth0.3410.3560.3240.343
Beauty0.2730.2710.2590.293
Boredom0.6100.5750.6250.638
Depression0.6350.6310.6460.629
Greenness0.0740.0590.0610.112
Blueness0.0950.0930.1040.090
Natural-to-artificial ratio0.5760.4240.5570.817
Openness0.3620.3340.3670.388
Enclosure0.1440.1680.1160.147
Building visual ratio0.0750.1100.0630.044
Walkability0.0410.0740.0250.018
Environmental color diversity11.04012.27510.3789.872
Spatial indicator0.0010.0020.0010.001
Table 5. Regression analysis results of safety, vitality, wealth, beauty, boredom, and depression.
ModelUnstandardized CoefficientsStandardized
Coefficients
Sig.VIFR2F. Sig
BStd. ErrorBetat
Safety(Constant)0.0050.014 0.3390.735 0.9360
Greenness0.3130.0370.3148.43807.042
Openness−0.540.018−0.54−30.18501.635
Walkability0.0960.0150.0966.45101.135
Building visual
ratio
−0.4150.037−0.416−11.12307.121
Enclosure0.3770.0390.3789.61607.868
Environmental
color diversity
0.0440.0160.0442.7120.0071.319
Vitality(Constant)0.0030.014 0.2010.841 0.9350
Openness−0.6170.017−0.616−35.40201.522
Enclosure0.170.040.174.29307.867
Building visual
ratio
0.3210.0370.328.6606.875
Walkability0.1390.0150.1389.29601.115
Greenness0.1360.0370.1363.6407.042
Wealth(Constant)0.0080.014 0.5920.555 0.9370
Openness−0.6970.015−0.702−46.95601.149
Greenness0.5240.0160.52832.3501.369
Walkability0.0440.0150.0443.0050.0031.116
Natural-to-
artificial ratio
−0.0440.016−0.044−2.7530.0061.321
Beauty(Constant)0.0030.014 0.2530.8 0.9390
Greenness0.310.0370.318.46907.141
Openness−0.5450.017−0.545−31.91601.544
Building visual
ratio
−0.4740.037−0.474−12.89607.212
Enclosure0.350.0390.359.08707.921
Blueness0.1060.0140.1067.62201.037
Environmental
color diversity
0.0350.0160.0352.2620.0241.295
Boredom(Constant)0.0190.01 2.0080.045 0.9660
Openness0.5790.0120.61648.76601.531
Building visual ratio−0.2810.025−0.299−11.04807.006
Enclosure−0.130.027−0.138−4.80107.955
Walkability−0.2310.01−0.246−22.27201.166
Blueness−0.1920.01−0.204−19.27901.079
Greenness−0.1270.026−0.136−4.96507.142
Depression(Constant)0.020.01 1.9550.051 0.9620
Greenness−0.2440.027−0.261−9.01607.142
Openness0.5450.0130.58243.43601.531
Blueness−0.1040.011−0.111−9.84601.079
Walkability−0.1190.011−0.128−10.89701.166
Building visual
ratio
0.4040.0270.43215.04607.006
Enclosure−0.3440.029−0.368−12.03507.955
Disclaimer/Publisher’s Note: The statements, opinions and data contained in all publications are solely those of the individual author(s) and contributor(s) and not of MDPI and/or the editor(s). MDPI and/or the editor(s) disclaim responsibility for any injury to people or property resulting from any ideas, methods, instructions or products referred to in the content.

