1. Introduction
Indoor environmental quality (IEQ) has been increasingly recognised as a critical factor influencing human health, productivity, and well-being within various built environments [
1,
2]. Among its components, thermal comfort remains a primary determinant of occupant satisfaction, affecting physiological responses and cognitive performance [
3,
4]. Defined by ASHRAE 2019 [
5] as the condition of mind expressing satisfaction with the thermal environment, thermal comfort is modulated by a complex interplay of environmental variables such as air temperature, humidity, air velocity, and radiant temperature and personal factors like clothing and metabolic activity [
6].
Achieving thermal comfort in large commercial spaces, particularly hypermarkets, presents unique challenges due to the heterogeneous nature of internal heat loads, spatial zoning, and fluctuations in occupant density. Traditional HVAC systems, typically designed with static setpoints, often fail to accommodate the dynamic requirements of such environments [
7]. Adaptive thermal comfort frameworks, which allow for contextual variability in indoor conditions and are designed to adjust to changing environmental and occupancy conditions, have thus gained prominence, especially in tropical regions where year-round high temperatures and humidity levels complicate indoor environmental control [
8].
Alongside thermal comfort, indoor air quality (IAQ) has emerged as a critical domain within IEQ, influencing respiratory health, cognitive functions, and overall well-being [
9,
10]. IAQ parameters, which encompass concentrations of carbon dioxide (CO
2), total volatile organic compounds (TVOC), particulate matter (PM2.5 and PM10), and biological contaminants, are significantly affected by ventilation effectiveness, indoor sources, and occupant behaviour. Studies in commercial settings, including grocery stores and hypermarkets, have consistently highlighted challenges related to elevated pollutant concentrations arising from human activity and operational processes [
11,
12].
Various ventilation strategies have been explored to address IAQ challenges, from mechanical systems to passive and hybrid approaches [
13,
14]. Technological advances, particularly the advent of IoT-based sensor networks, AI-driven environmental management systems, and cloud-integrated monitoring platforms, have enabled real-time adaptive control of IAQ in complex environments [
15,
16]. Moreover, linking occupancy monitoring with environmental management systems has demonstrated promise in optimising ventilation efficiency and improving indoor conditions in dynamic spaces [
17,
18].
Hypermarkets, characterised by large floor areas and multifunctional spaces, present a particularly intricate setting for achieving integrated control over thermal comfort and IAQ [
19]. In tropical climates, these challenges are magnified by high ambient humidity and temperatures, resulting in significant spatial variations in thermal loads and pollutant concentrations [
20]. The unique challenges of the hypermarket setting and the complexities of the tropical climate make this study particularly complex and insightful. Recent studies confirm that thermal and IAQ parameters fluctuate widely across different zones within commercial environments such as malls, department stores, and grocery outlets [
11,
21]. However, few have comprehensively addressed these variations under actual operational conditions in tropical hypermarkets.
While substantial research has explored thermal comfort or IAQ independently, integrated assessments remain rare, especially for large commercial buildings in tropical regions. Most existing studies have been conducted in temperate climates, focusing on office buildings [
22], educational facilities [
23], or public infrastructures like airports [
24]. Research into hypermarkets and grocery stores, such as that by Martellotta et al. [
4] and Baptista et al. [
11], primarily addresses temperate environments, emphasising the scarcity of comprehensive field data from tropical commercial settings.
Table 1 summarises a selected literature review since 2000, highlighting the significant research gap regarding integrated IAQ and thermal comfort evaluations in tropical commercial spaces. The literature review underscores the critical need for field studies on hypermarkets in tropical rainforest climates. Building upon these identified gaps, the present study investigates a hypermarket located in Gombak, Selangor, Malaysia, a region characterised by a tropical rainforest climate. The hypermarket spans diverse functional zones, including fresh food courts, dry goods retail, and cafeteria areas, each imposing different thermal and IAQ demands. Given the persistent high temperatures, substantial humidity levels, and diurnal climate variations typical of Gombak, this site offers a representative and challenging case study for examining real-world environmental management strategies in tropical commercial environments [
25].
Figure 1 shows a satellite view of the hypermarket that was selected for the field study. The present case study integrates multi-zone real-time thermal comfort and IAQ monitoring within an operational hypermarket under tropical conditions. The findings not only enrich the understanding of indoor environmental dynamics in large-scale commercial settings but also provide practical insights that can inform the optimisation of ventilation strategies, enhance thermal comfort standards, and guide the development of adaptive, occupant-centred HVAC systems tailored to the specific challenges of hot-humid tropical environments [
29]. By addressing a critical gap in integrated environmental assessments for commercial spaces in tropical regions, this work aspires to contribute meaningfully toward more sustainable, health-centric, and performance-optimised building design practices.
2. Project Background
This study focuses on a hypermarket located in the Gombak district of Selangor Darul Ehsan, Malaysia. Malaysia lies within a humid tropical climate zone, characterised by persistently high temperatures and humidity levels throughout the year [
30,
31]. The hypermarket serves as a major commercial centre, attracting many customers and staff daily.
Maintaining an optimal indoor environmental quality in such settings is essential, as it directly influences occupant health, comfort, and operational efficiency [
32,
33]. The hypermarket reflects the typical challenges encountered by commercial buildings operating under tropical conditions, particularly in managing thermal comfort and indoor air quality (IAQ).
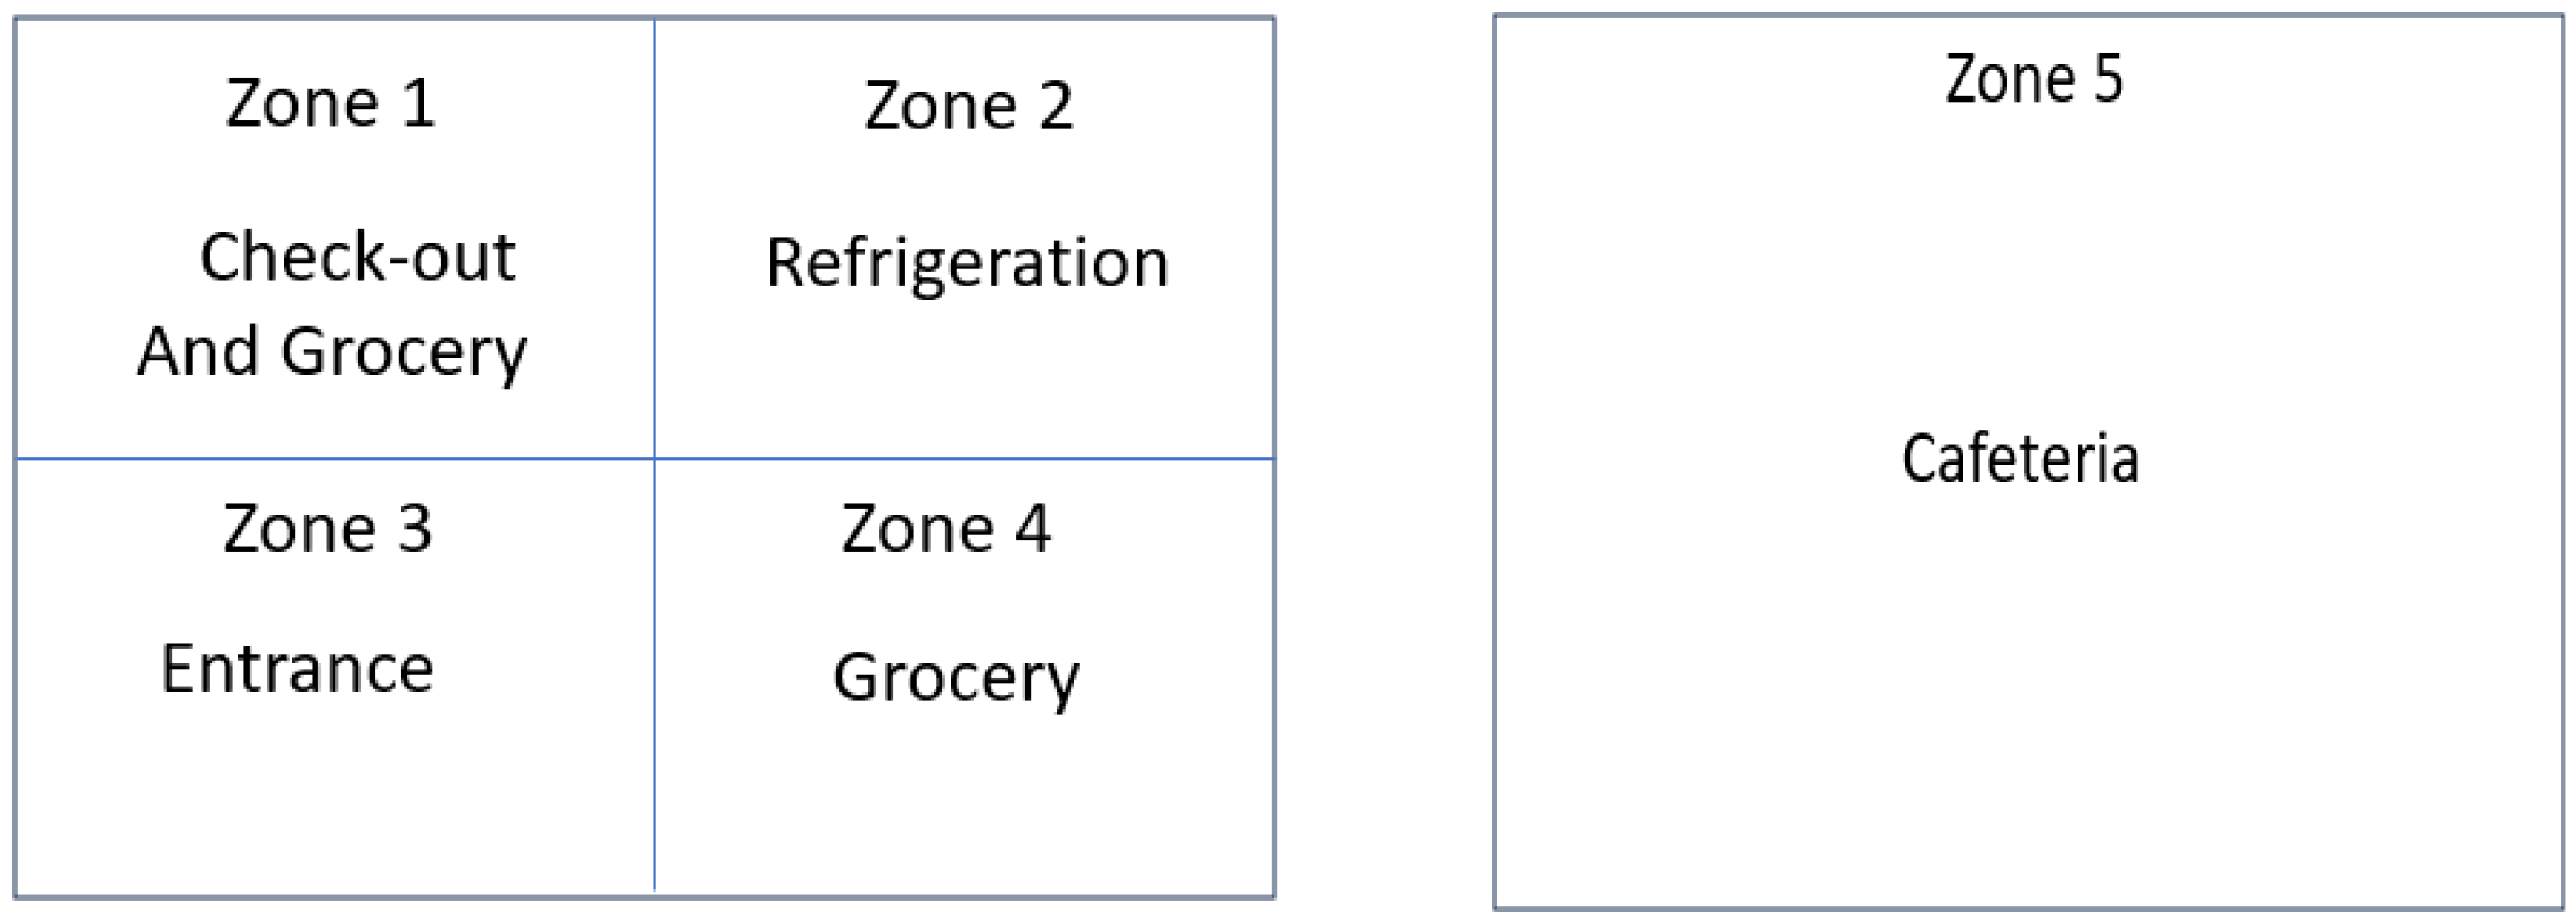
The building has two floors and a total built-up area of approximately 50,000 square meters. Environmental monitoring was conducted across five distinct zones: Zones 1 to 4 include the retail areas, while Zone 5 houses the cafeteria. These zones were selected to capture a representative range of environmental conditions within the hypermarket under actual operational scenarios.
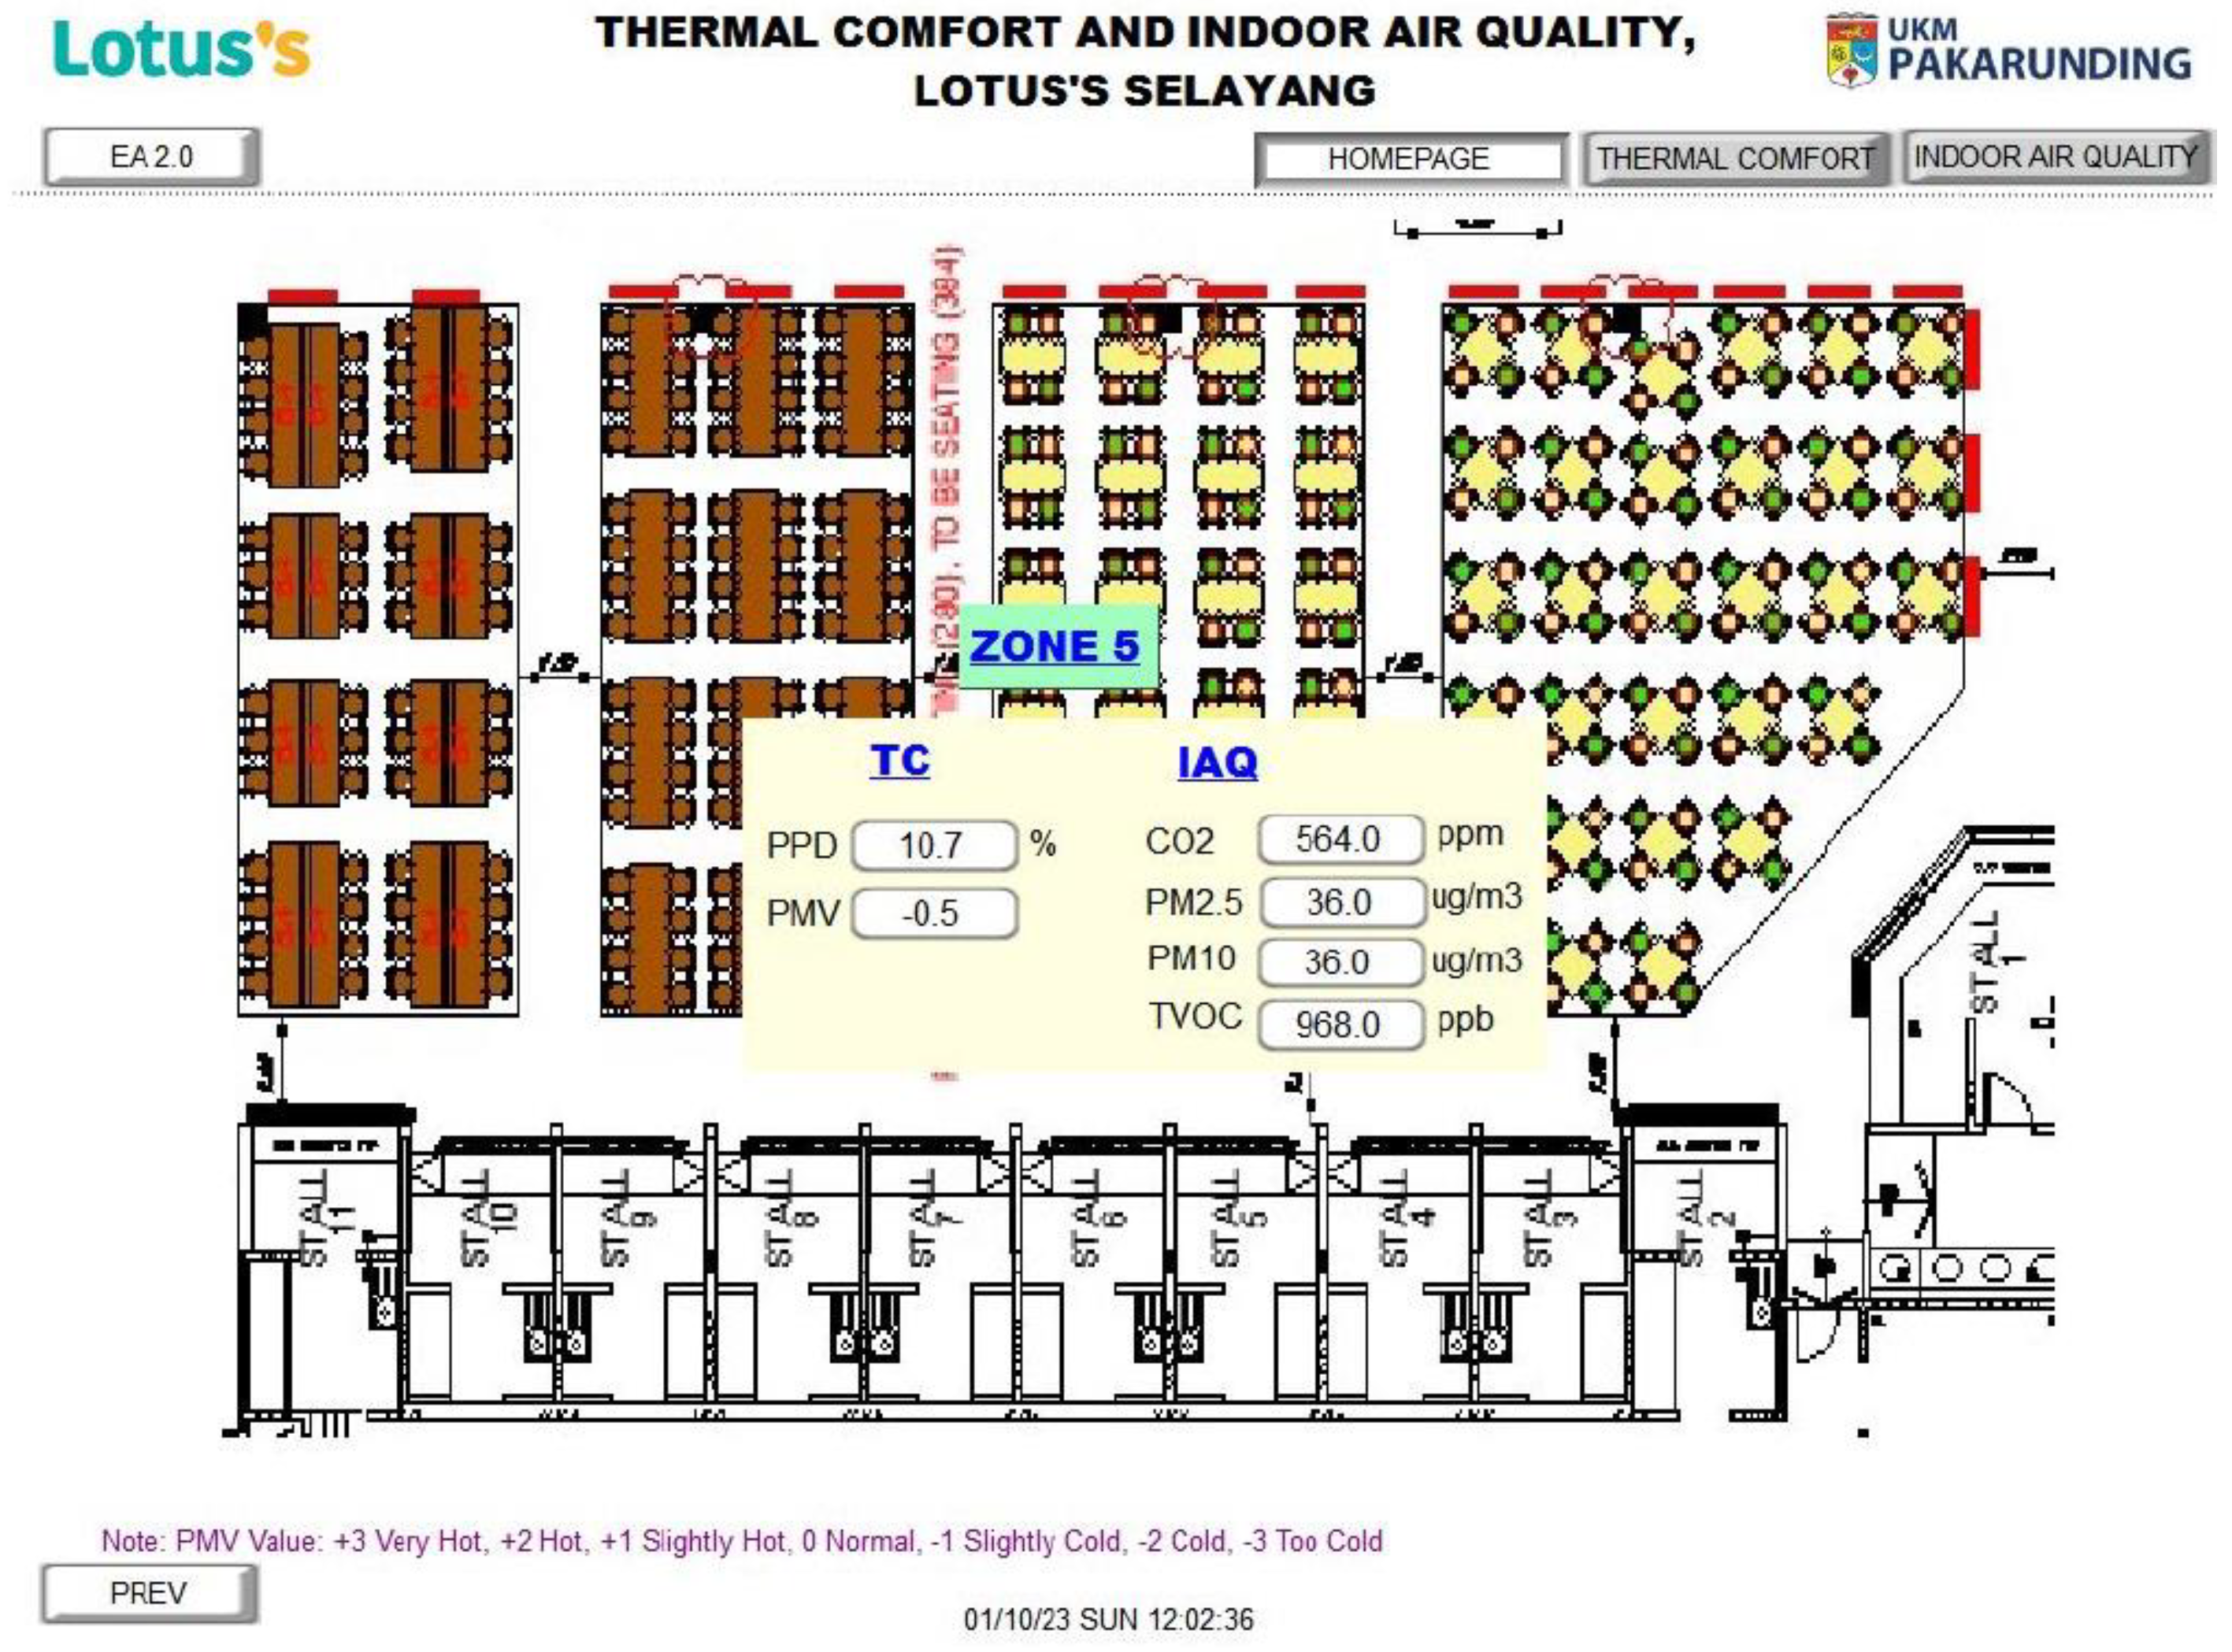
Figure 2 displays the monitoring dashboard illustrating the ground floor plan for Zones 1, 2, 3 and 4, while
Figure 3 presents the monitoring dashboard for Zone 5.
3. Research Objectives
This study aims to expand the current understanding of indoor environmental quality (IEQ) management in large-scale tropical commercial environments through four interconnected objectives:
To analyse the thermal comfort and indoor air quality (IAQ) parameters under real operational conditions using a multi-zone approach in a hypermarket in a tropical rainforest climate zone.
To characterise zone-specific spatial variations in environmental conditions, including retail areas, cafeterias, and rear zones, using parametric assessments of PMV, PPD, CO2, TVOC, PM2.5, and PM10.
To benchmark thermal comfort and IAQ performance against internationally recognised standards such as ASHRAE 55 and WHO guidelines, within the context of tropical climatic conditions classified under the Köppen–Geiger system.
To generate empirical insights that can inform the optimisation of adaptive HVAC strategies, focusing on developing occupant-centred, zone-responsive ventilation, and comfort management approaches tailored to the specific challenges of hot-humid commercial environments.
By integrating zone-specific environmental mapping with dynamic operational monitoring, this research addresses a critical knowledge gap in tropical commercial building performance, providing a foundation for future data-driven, sustainable HVAC system design improvements.
4. Methodology
4.1. Design Study
This study implemented an integrated real-time environmental monitoring framework to assess thermal comfort and indoor air quality (IAQ) parameters within a large-scale hypermarket in a tropical rainforest climate. Recognising the heterogeneous spatial and operational characteristics of such commercial environments, the hypermarket was segmented into five functional zones, each representing distinct internal loads, ventilation behaviours, and occupancy profiles. A multi-zone empirical monitoring strategy was employed to capture spatial variations dynamically, enabling a detailed analysis of the indoor environmental dynamics influenced by real-world operations [
22,
24].
The monitoring approach combined the evaluation of thermal comfort indicators (Predicted Mean Vote [PMV] and Percentage of People Dissatisfied [PPD]) and IAQ parameters (carbon dioxide [CO2] concentrations, total volatile organic compounds [TVOC], and particulate matter [PM2.5 and PM10]). Continuous data logging was employed instead of isolated spot measurements, providing a temporal resolution to capture diurnal and operational fluctuations under normal business conditions.
4.2. Study Site
The study was conducted in a hypermarket in Gombak, Malaysia, a region characterised by a tropical rainforest climate (a classification under the Köppen–Geiger system) [
34]. The building includes diverse operational zones, such as main retail aisles, peripheral shopping sections, intermediate merchandise areas, a cafeteria with active food preparation, and rear storage-linked spaces. The hypermarket consists of two stories with a gross floor area of approximately 50,000 square meters, featuring a typical wall-ceiling height of about 4 m and air conditioning ducts positioned around 3.7 m above the floor. These architectural and mechanical features contribute to localised environmental variations across different functional zones. The cafeteria, in particular, poses unique challenges due to internal heat gains and pollutant emissions associated with cooking activities.
Figure 4 below illustrates the multi-zone approach, indicating each of the zones’ functions within the study site.
4.3. Sensors and Data Acquisition
International standards and best practices for indoor environmental quality assessment guided the selection of environmental parameters and sensor technologies. Carbon dioxide (CO
2) concentration was monitored as a primary indicator of ventilation effectiveness, in accordance with ASHRAE Standard 62.1 and WHO guidelines [
2,
5]. Total volatile organic compounds (TVOCs) and particulate matter (PM2.5 and PM10) were measured to capture chemical and particulate pollutant loads, which are critical for assessing indoor air quality impacts on occupant health [
2].
Air temperature and relative humidity were recorded as essential variables for calculating thermal comfort indices such as PMV and PPD, consistent with ASHRAE Standard 55 and ISO 7730 [
5,
35]. IoT-enabled sensors were prioritised to simultaneously facilitate continuous, real-time monitoring across multiple zones, thereby enabling spatial profiling of environmental conditions within complex commercial layouts [
22]. This approach supports emerging best practices in innovative building environmental management and dynamic HVAC optimisation [
24].
A grid of calibrated IoT-enabled sensors was deployed across five functional zones to monitor selected environmental parameters. Each sensor array measured air temperature, relative humidity, CO2 concentration, TVOC, PM2.5, and PM10. Sensors were strategically positioned 1.5 m above the finished floor level to approximate the human breathing zone, as recommended by ASHRAE Standard 55.
Data acquisition was conducted continuously over 5 days, covering morning and evening operational hours. Environmental conditions were recorded at 30-min intervals to facilitate data handling, enhance trend clarity, and ensure consistency in temporal pattern analysis across operational periods. Sensor placements were strategically chosen to avoid obstructions, direct airflow impacts, and potential tampering, particularly in high-traffic customer areas.
All sensors used in this study were factory-calibrated prior to deployment and underwent verification checks to ensure measurement consistency across units. The accuracy specifications were as follows: air temperature (±0.5 °C), relative humidity (±3% RH), CO
2 concentration (±50 ppm or ±5% of the reading, whichever is greater), TVOC (±15% of the reading), PM2.5 (±10% of the reading), and PM10 (±10% of the reading). To enhance data reliability, initial field validation was carried out by co-locating sensors in a controlled indoor environment for 24 h before installation, verifying consistency within acceptable tolerance ranges. During the monitoring period, routine data inspections were conducted to identify anomalies, sensor drifts, or missing values. Data points exhibiting extreme outliers or obvious hardware errors were excluded based on predefined statistical thresholds.
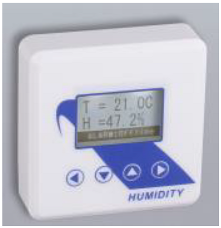
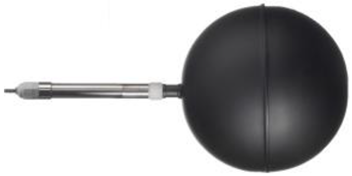
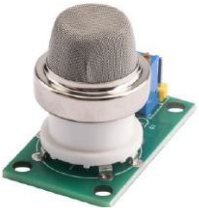
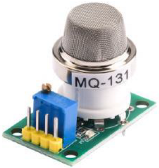
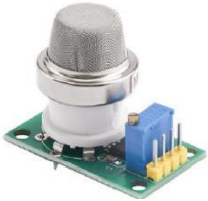
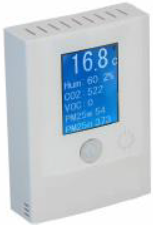
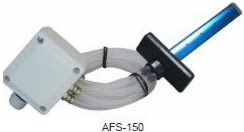
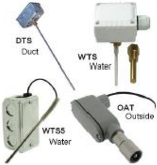
Table 2 provides a detailed list of the instruments and sensors used in the field study, along with their respective model specifications and accuracy parameters.
4.4. Data Collection
Environmental parameters were continuously monitored over 5 days, capturing diurnal variations under consistent outdoor conditions characterised by high humidity and elevated temperatures, which reflect the region’s tropical rainforest classification under the Köppen–Geiger system [
34]. Selangor’s humid tropical climate significantly influences hypermarket operations by increasing the HVAC loads necessary to maintain thermal comfort and prevent pollutant buildup. The elevated moisture levels necessitate enhanced ventilation strategies to sustain indoor air quality. Seasonal variations in external conditions further highlight the importance of adaptive HVAC control to balance energy efficiency with occupant comfort.
Measurements collected included thermal comfort metrics: PMV and PPD values recorded at 30-min intervals, along with IAQ parameters such as CO2 (ppm), TVOC (ppb), PM2.5 (µg/m3), and PM10 (µg/m3), captured at multiple sampling locations within each designated zone.
Thermal comfort indices (PMV and PPD) were computed based on ISO 7730 and ASHRAE 55 formulations, utilising concurrently measured temperature, humidity, and air velocity data [
5,
35]. IAQ parameters were assessed against benchmark thresholds established by ASHRAE Standard 62.1 and the World Health Organization (WHO) Indoor Air Quality Guidelines [
2,
5].
Data analysis focused on identifying spatial variability and temporal patterns of thermal comfort and pollutant concentrations across the monitored zones. Special attention was given to peak occupancy periods, transitions between morning and afternoon operational loads, and zones with food preparation activities. Findings were contextualised within the specific climatic stresses of Malaysia’s tropical rainforest environment, characterised by persistently high temperatures and humidity levels.
Figure 5 illustrates the real-time data collection dashboard interface used during the monitoring period.
4.5. Data Analysis and Benchmarking
Thermal comfort indices (PMV and PPD) were calculated based on ISO 7730 and ASHRAE 55 formulations, utilizing concurrently measured temperature, humidity, and air velocity data [
5,
35]. IAQ parameters were assessed against benchmark thresholds established by ASHRAE Standard 62.1 and the World Health Organization (WHO) Indoor Air Quality Guidelines [
5].
Data analysis focused on identifying spatial variability and temporal patterns of thermal comfort and pollutant concentrations across the monitored zones. Special attention was given to peak occupancy periods, transitions between morning and afternoon operational loads, and zones with food preparation activities. Findings were contextualised within the specific climatic stresses of Malaysia’s tropical rainforest environment, characterised by persistently high temperatures and humidity levels. The following
Table 3 shows the thermal comfort and IAQ parameters measurement and standards.
4.6. Sensor Deployment Strategy
A designed sensor deployment strategy was adopted to ensure accurate environmental characterisation across the hypermarket. Each of the five monitored zones was systematically equipped with multiple environmental sensors, covering key parameters such as temperature, relative humidity, carbon dioxide (CO2) concentration, total volatile organic compounds (TVOC), and particulate matter (PM2.5 and PM10).
In Zone 1, four sensor units were deployed and positioned along the main retail aisles near the checkout counters. Zone 2 was outfitted with three sensor units placed strategically around the outer retail perimeter to capture thermal and air quality conditions at the building edges. Similarly, Zone 3 had three sensors distributed within the central merchandise areas, ensuring balanced coverage of spaces with moderate activity levels. In Zone 4, three sensors were installed in rear storage-linked retail areas where ventilation challenges were anticipated. Zone 5, representing the cafeteria dining area and adjacent kitchen entrance, had four sensor units to monitor the complex indoor environment affected by cooking activities and high occupant density.
All sensors were installed at a uniform height of 1.5 m above the finished floor level. This installation height was selected following ASHRAE Standard 55 [
5], which recommends that measurements be taken within the human breathing zone, typically between 0.6 m and 1.8 m above the floor. Positioning the sensors at 1.5 m ensured that measurements accurately reflected occupant exposure and minimized the risk of vandalism or accidental interference from merchandise, carts, or other retail equipment.
This deployment strategy provided a robust dataset representing real-time thermal comfort and indoor air quality conditions throughout the hypermarket under typical operational scenarios.
4.7. Limitations
Although this study offers valuable insights into the spatial and temporal variations of indoor environmental conditions within a hypermarket, certain limitations must be acknowledged. Data collection was confined to a single hypermarket case study, so the results may not be generalizable to all commercial retail environments. Variations in building design, mechanical system configurations, and operational practices across different facilities could influence environmental performance outcomes. Nevertheless, the integrated, zone-based real-time monitoring framework presented herein provides a replicable empirical approach that can inform future investigations and the development of more adaptive and occupant-centred environmental control strategies in tropical commercial settings.
5. Thermal Comfort Models: PMV and PPD
The Predicted Mean Vote (PMV) and Predicted Percentage of Dissatisfied (PPD) models were employed to assess thermal comfort in the hypermarket. These models, rooted in ASHRAE Standard 55 [
5], provide a quantitative framework for evaluating the thermal environment. The PMV model considers key parameters, including air temperature, air velocity, relative humidity, mean radiant temperature, metabolic rate, and clothing insulation. By balancing these variables, PMV predicts the average thermal sensation of occupants on a scale from −3 (cold) to +3 (hot).
The PPD model complements PMV by estimating the percentage of occupants likely to feel dissatisfied under the given thermal conditions. This dual approach ensures a comprehensive thermal comfort analysis, allowing the study to identify zones with significant deviations from optimal conditions. The thermal comfort or PMV and PPD equations are as follows:
The ASHRAE 55 standard provides an alternative formula for calculating the Predicted Mean Vote (PMV) that differs slightly from the original PMV formula. The formula based on ASHRAE 55 is as follows:
where:
M is the metabolic rate in met units
T_a is the dry bulb air temperature in °C
v_a is the air velocity in m/s
f_cl is the clothing insulation in clo units
t_cl is the average surface temperature of the clothing in °C
t_s is the mean radiant temperature in °C
f_c is the convective heat exchange coefficient in W/(m2∙K)
The Percentage of People Dissatisfied (PPD) equation is derived from PMV readings. The PPD equation is as follows:
PPD measures the number of people likely to feel uncomfortably warm or cool in each environment, i.e., the number of people voting −3, −2, +2, or +3 within the PMV scale.
The PPD index predicts the number of thermally dissatisfied people in a large group. The rest of the group would vote −1, 0 or +1 on the PMV scale. The minimum PPD is 5%.
Figure 6 shows the PMV and PPD% thermal comfort scale and range.
6. IAQ Assessment
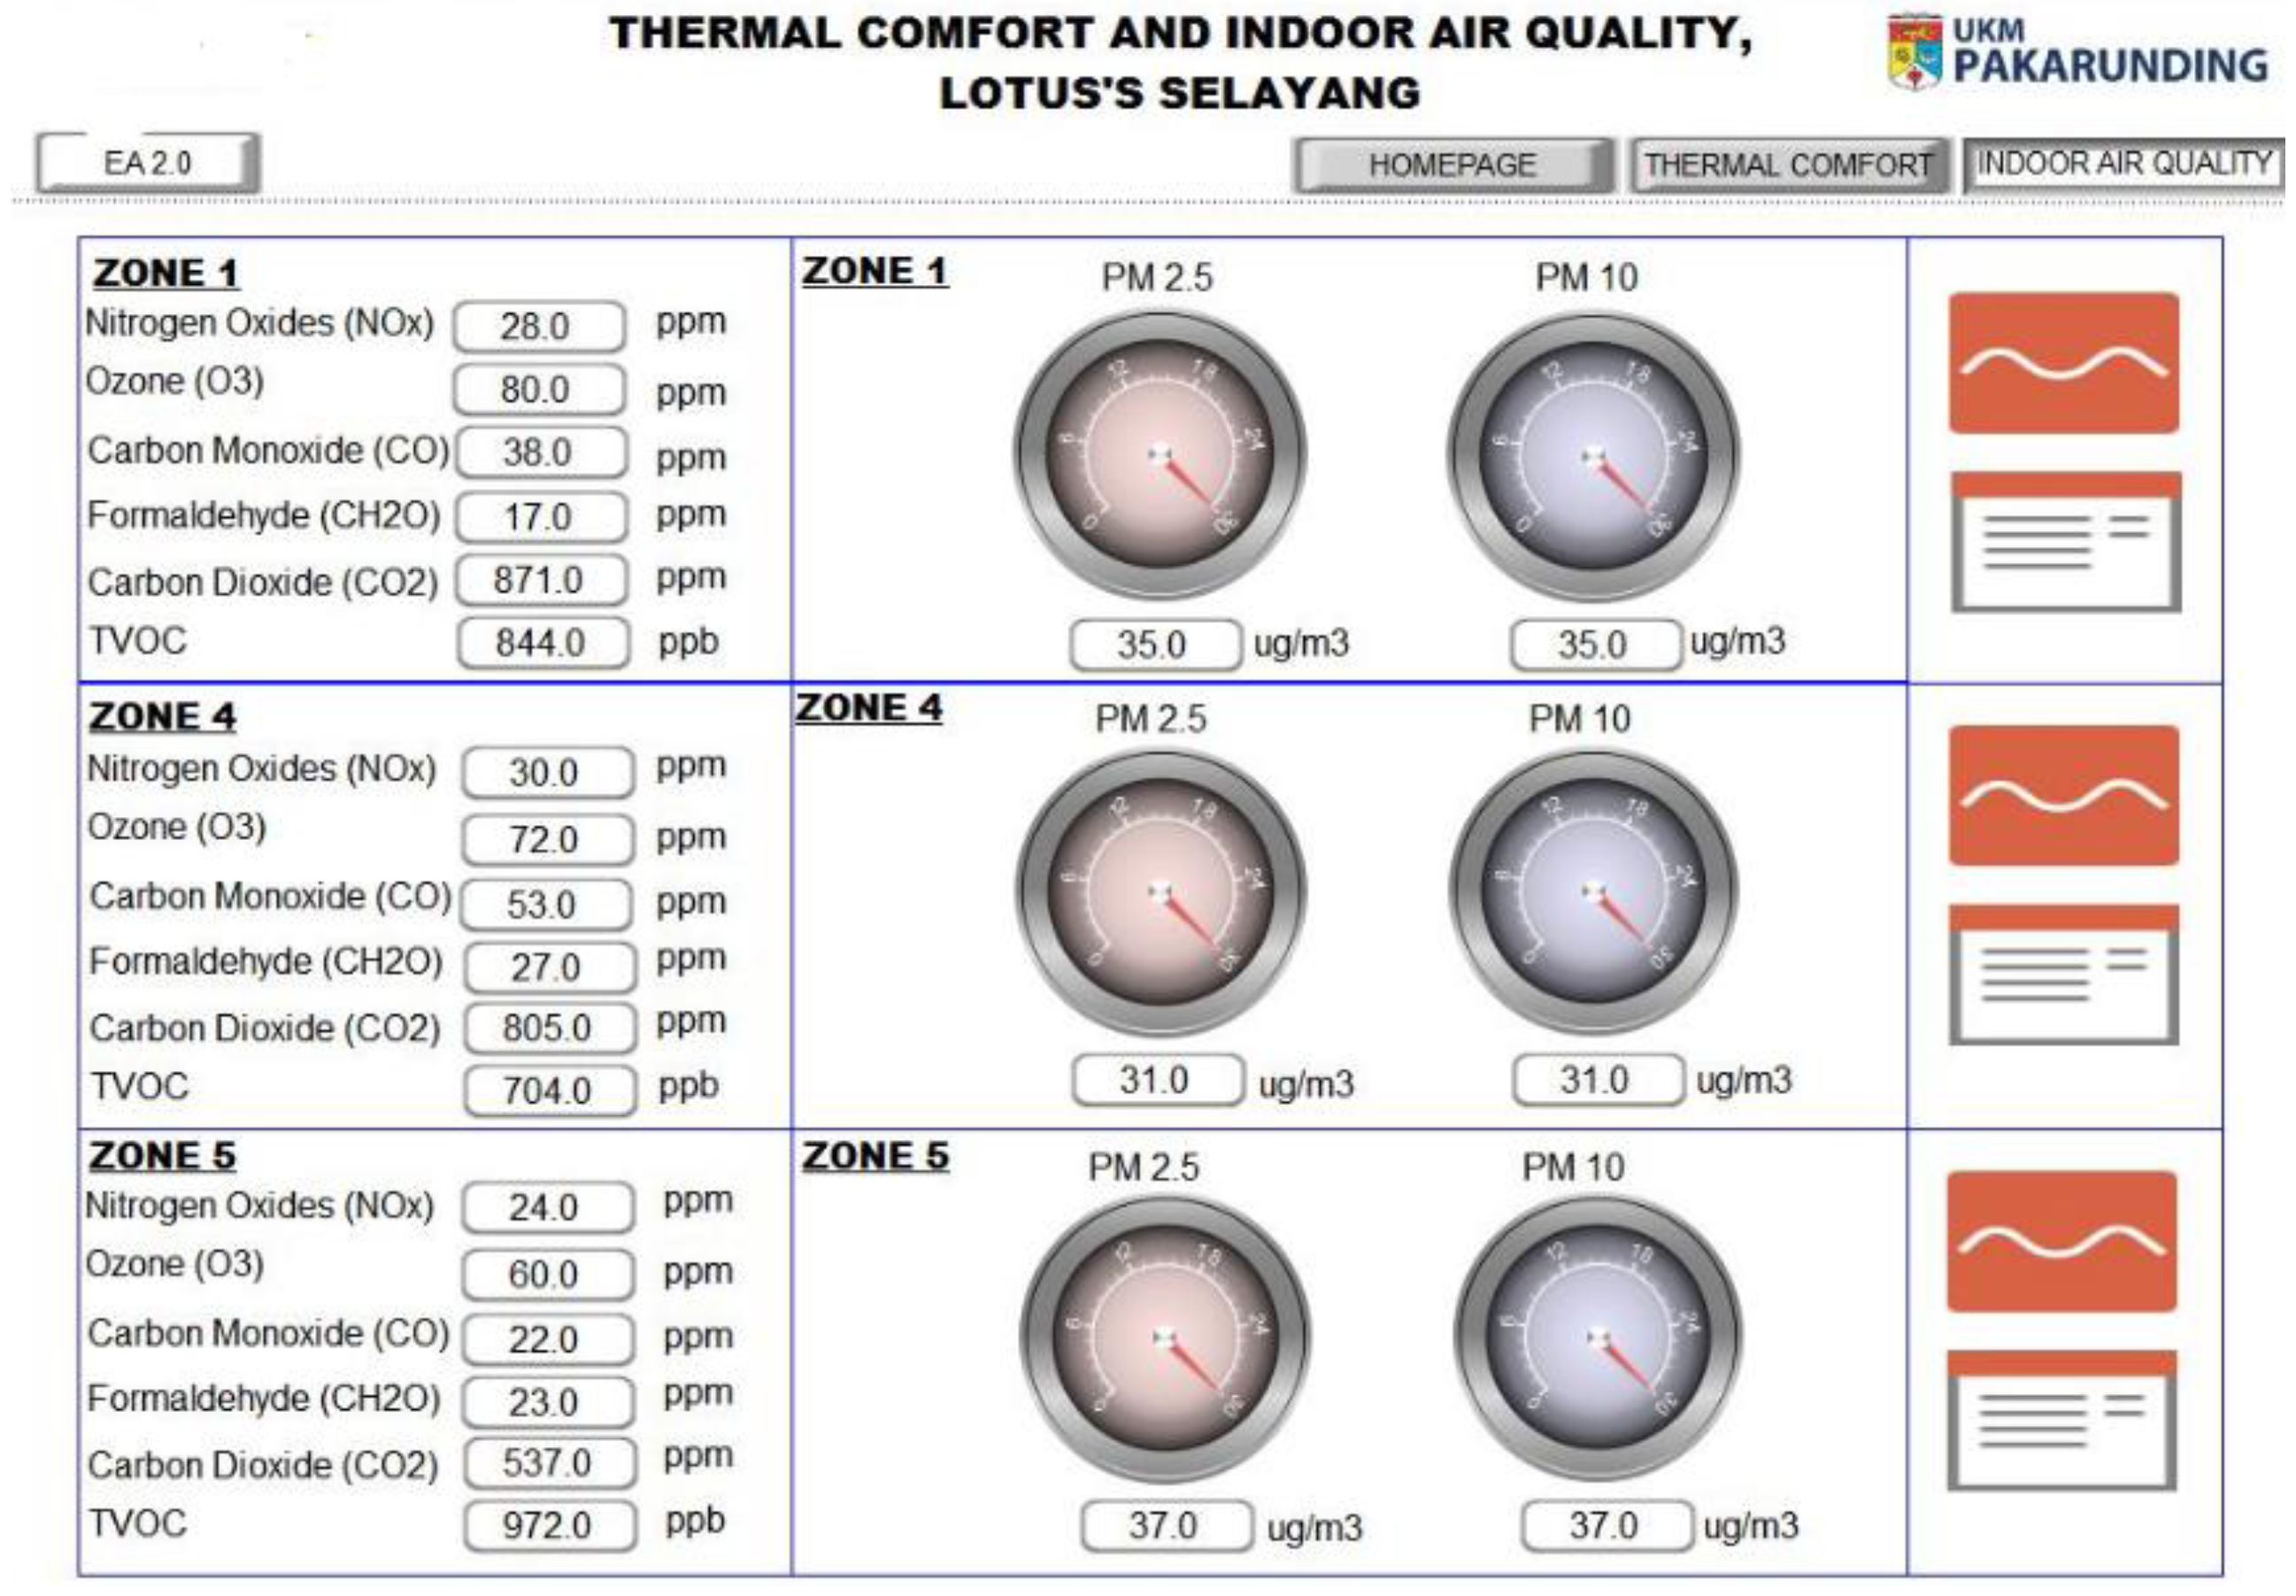
Indoor air quality was assessed through carbon dioxide, total volatile organic compounds and particulate matter (PM2.5 and PM10) measurements. The hypermarket’s IAQ parameters, namely CO2, TVOC, PM2.5, and PM10, were measured across the diverse zones, and the findings were compared against the ASHRAE 62 and WHO guidelines.
The study’s comprehensive analysis of the hypermarket’s thermal comfort and IAQ revealed distinct challenges across the various zones.
Key IAQ metrics and their calculations:
PM2.5 and PM10 concentrations:
7. Benchmarking Against ASHRAE 55 and ASHARE 62 Standards
Statistical analyses were conducted to identify prevailing trends, detect anomalies, and elucidate interrelationships between thermal comfort parameters and indoor air quality (IAQ) metrics. To ensure methodological rigor, the findings were benchmarked against internationally recognised standards, including ASHRAE 55 [
5] for thermal comfort criteria, ASHRAE 62 [
37] for IAQ benchmarks, and the Köppen–Geiger climate classification [
43] to account for regional climatic influences.
Building on established protocols, the evaluation of thermal comfort conditions utilised the Predicted Mean Vote (PMV) and Percentage of People Dissatisfied (PPD) indices, as recommended by ISO 7730. These indices provided a robust analytical framework for quantifying subjective thermal perceptions across diverse indoor environments [
43]. Comparative analyses with existing empirical studies were conducted to validate the observed patterns and enhance the reliability of the results.
Consistent with prior research, discrepancies in thermal comfort, particularly within Zone 5, highlight the ongoing challenges of aligning IAQ audit protocols with occupant-centric thermal management practices, especially in tropical office environments [
44]. The targeted recommendations developed herein aim to address these localised discrepancies and contribute to a broader discourse on optimising thermal and air quality parameters in climate-sensitive built environments.
8. Results and Discussion
The results and discussion presented in this section are structured to provide a comprehensive analysis of the thermal comfort and indoor air quality (IAQ) performance across the hypermarket zones. Emphasis is placed on understanding the variations observed during the monitoring period from 4 to 8 October 2023. To establish a baseline trend and contextualise subsequent zone-specific analyses, the following graph illustrates the overall Predicted Mean Vote (PMV) trend recorded throughout the study duration, offering initial insights into the fluctuations in thermal performance over time.
8.1. Thermal Comfort and IAQ Performance Across Zones
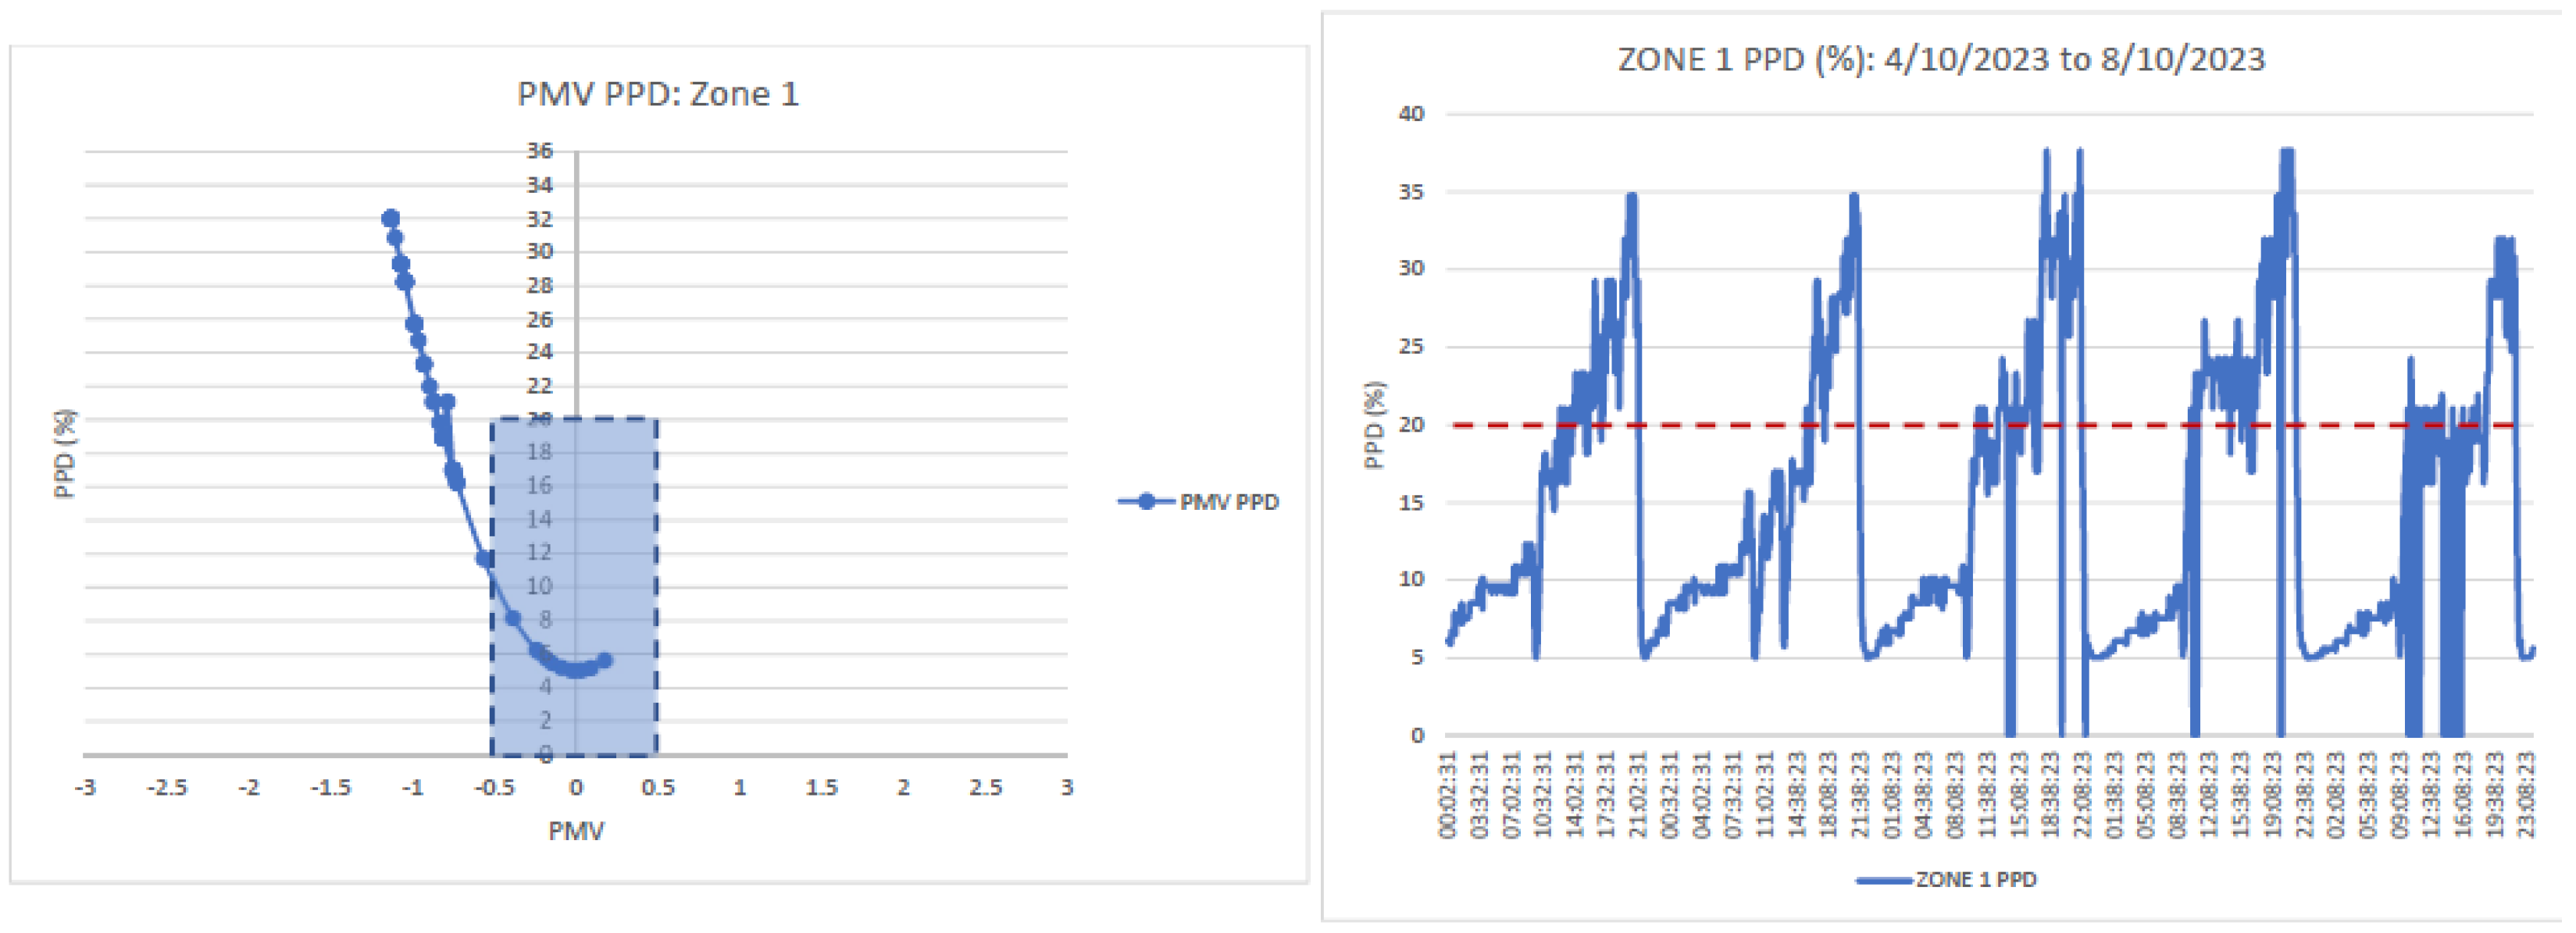
Figure 7 shows the Zone 1 PMV vs. PPD graphs. Zone 1 exhibited PMV values ranging from −1.25 to 0.5, indicating fluctuations from slightly cool to slightly warm conditions. Cooling was excessive during the early operating hours when occupancy was low, leading to PMV values below −0.5 and PPD peaks of up to 37%.
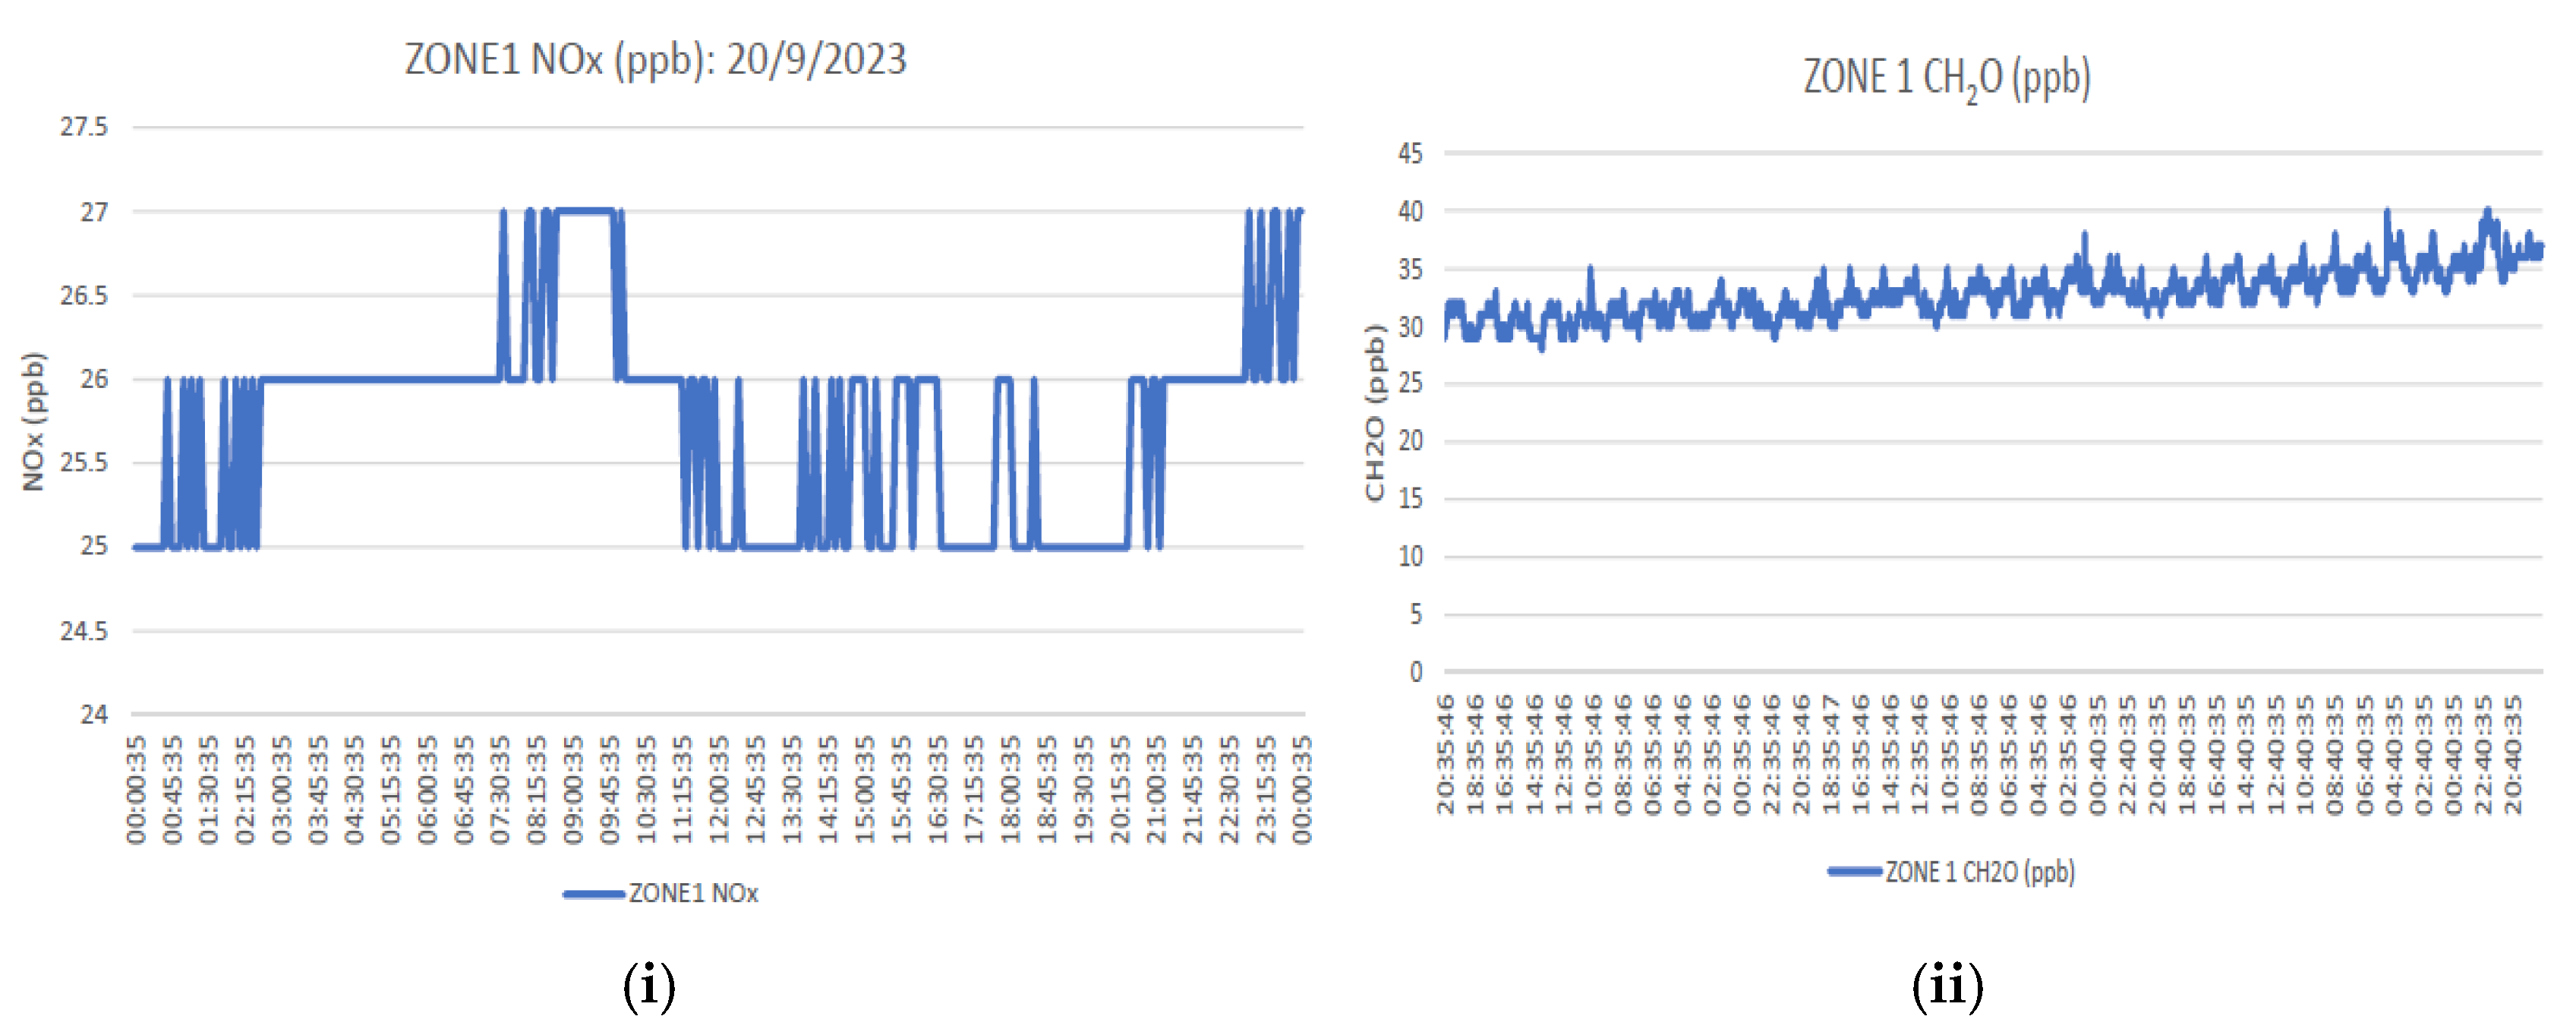
IAQ parameters, however, remained satisfactory, with CO2 concentrations averaging 500 ppm and TVOC levels around 820 ppb. PM2.5 and PM10 levels were within acceptable thresholds. The daily NOx readings fluctuate between 25 ppb and 27 ppb, remaining within the recommended National Ambient Air Quality Standard of 53 ppb. As for Formaldehyde, CH2O readings are within the recommended OSHA Standard of 750 ppb for 8-h time exposure. Nevertheless, the slight overheating during peak shopping periods indicates a need for adaptive thermal regulation.
Figure 8i shows CO
2 levels and
Figure 8ii displays TVOC concentrations within Zone 1. Both parameters showed noticeable fluctuations throughout the day, reflecting ventilation effectiveness and occupant activity. Additionally,
Figure 9i,ii illustrate the levels of NOx and formaldehyde (CH
2O), respectively, which remained within permissible limits.
As illustrated in
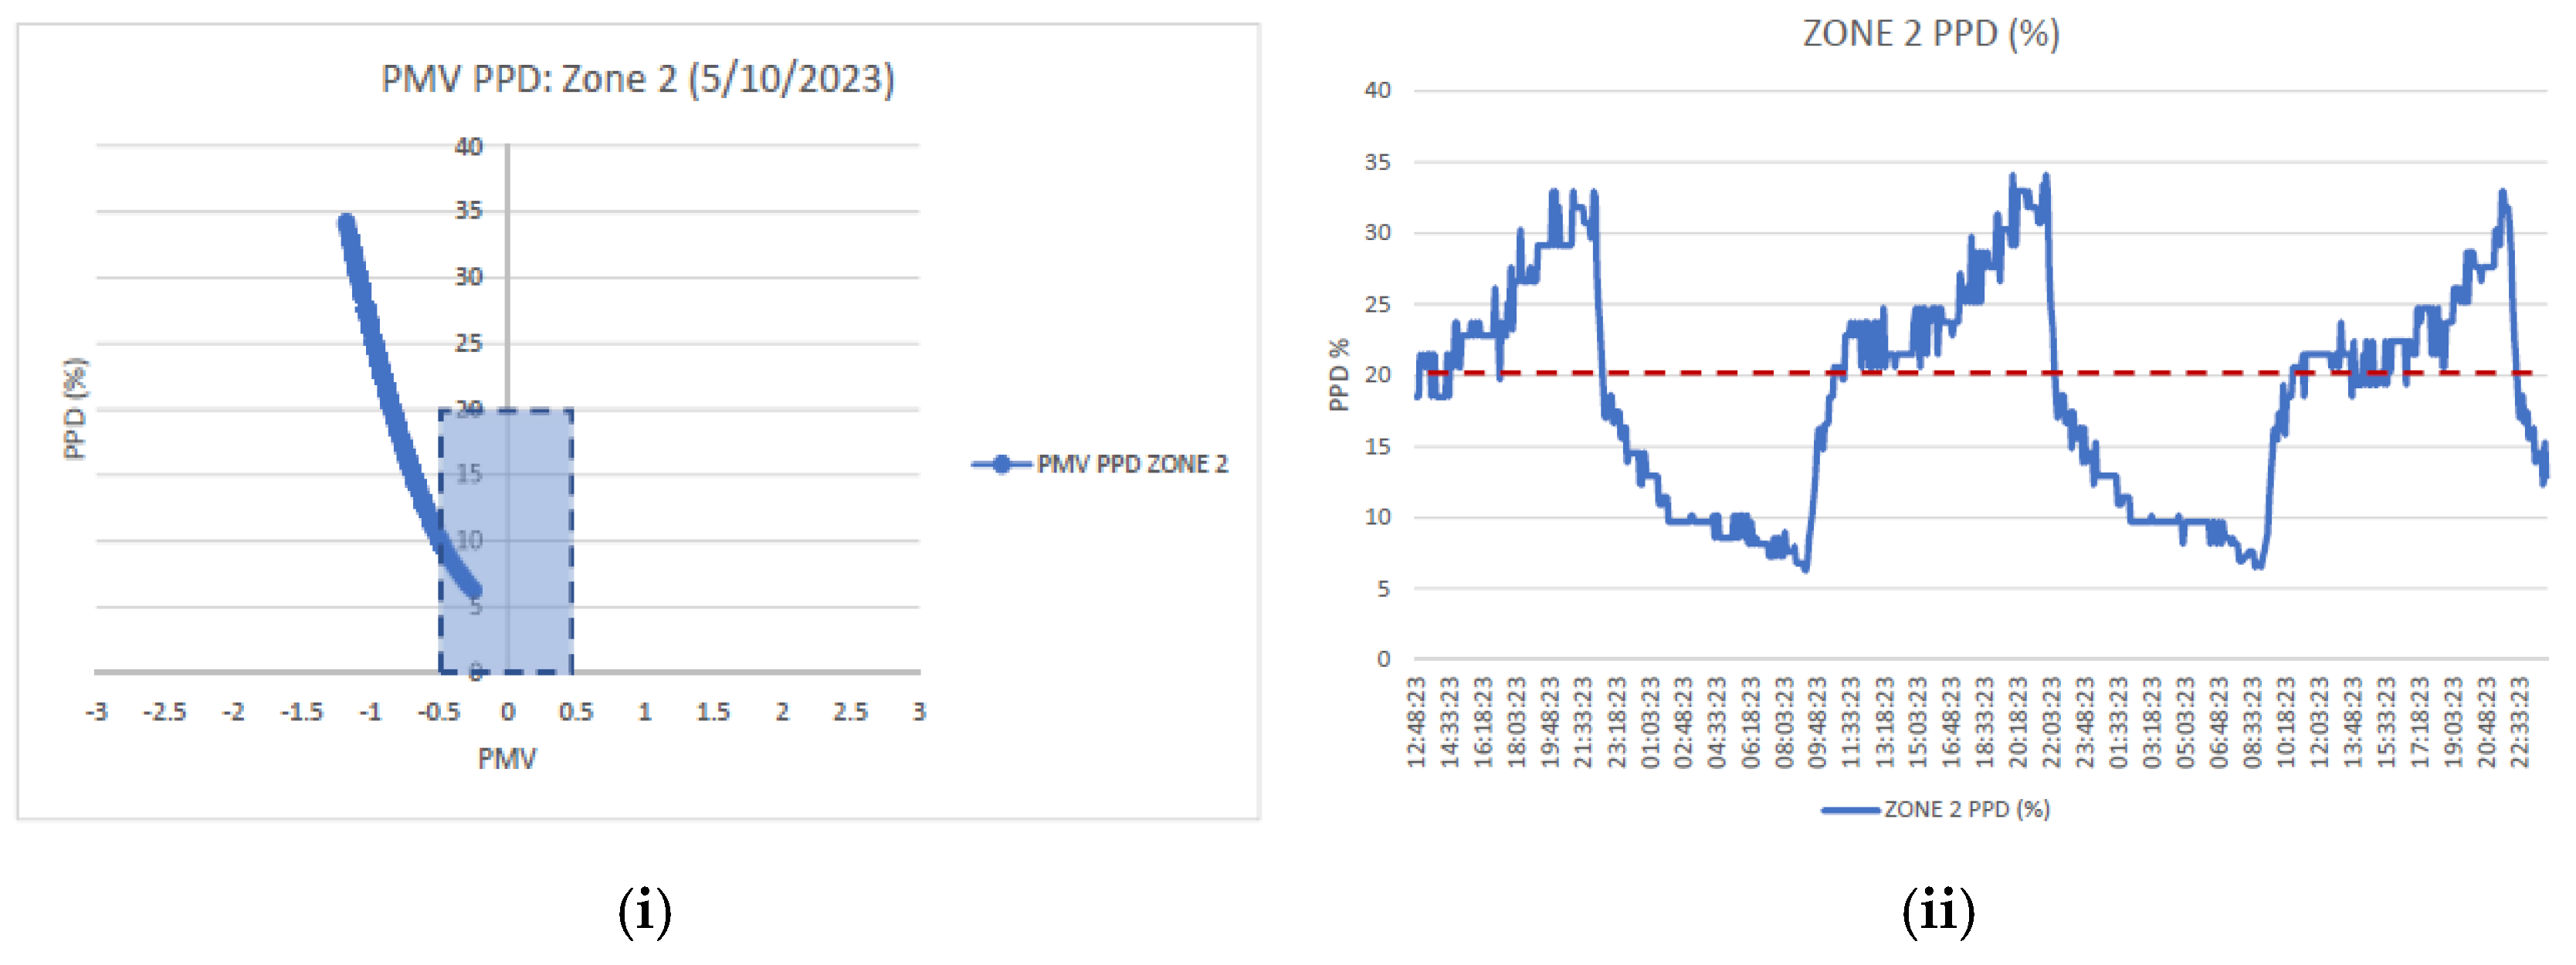
Figure 10i, thermal comfort in Zone 2 leaned consistently towards the cooler side, with PMV values ranging from −1.15 to −0.2. PPD fluctuated between 6.5% and 32.5%, frequently exceeding the 20% threshold during midday.
Figure 10i, with PMV values ranging from −1.15 to −0.2.
Figure 10ii shows that PPD fluctuated between 6.5% and 32.5%, frequently exceeding the 20% discomfort threshold during midday. IAQ indicators demonstrated effective ventilation, with CO
2 levels at 450 ppm and lower pollutant concentrations (TVOC 700 ppb; PM2.5 20 µg/m
3; PM10 25 µg/m
3). However, persistent overcooling suggested that the HVAC system was not effectively modulated to the relatively lower occupancy rates in this zone.
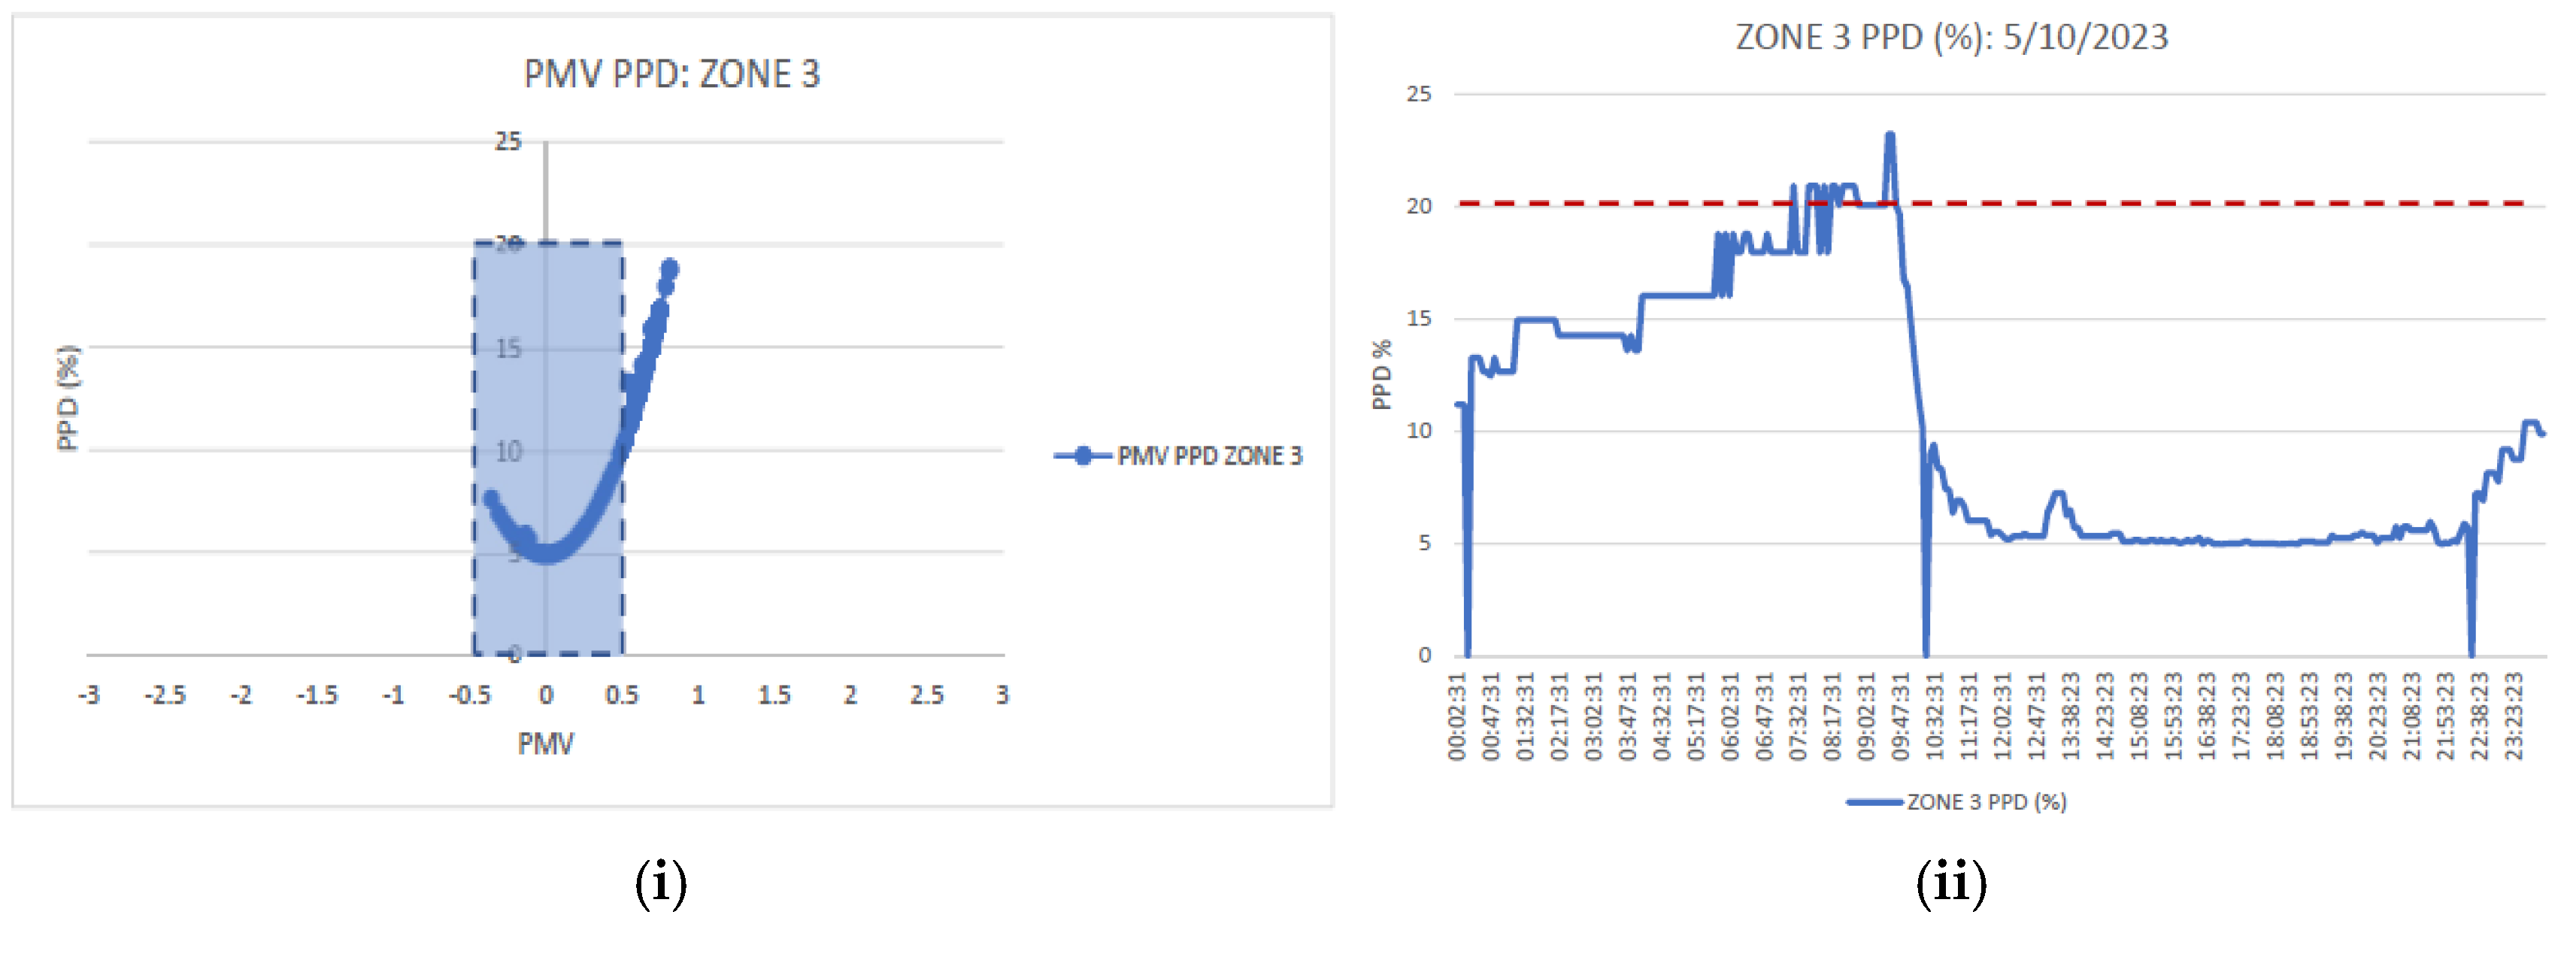
In contrast to Zone 2, Zone 3 demonstrated the most stable thermal comfort conditions among all monitored retail zones. As shown in
Figure 11i, Zone 3 recorded PMV values between −0.35 and 0.8, representing the most stable thermal comfort conditions across all retail zones. PPD remained below 18%, consistent with ASHRAE standards. IAQ performance was similarly favourable, with CO
2 concentrations at 470 ppm and pollutant levels within acceptable ranges (TVOC 750 ppb; PM2.5 21 µg/m
3; PM10 27 µg/m
3). Moderate traffic levels and balanced HVAC operations contributed to this zone’s relatively superior environmental conditions.
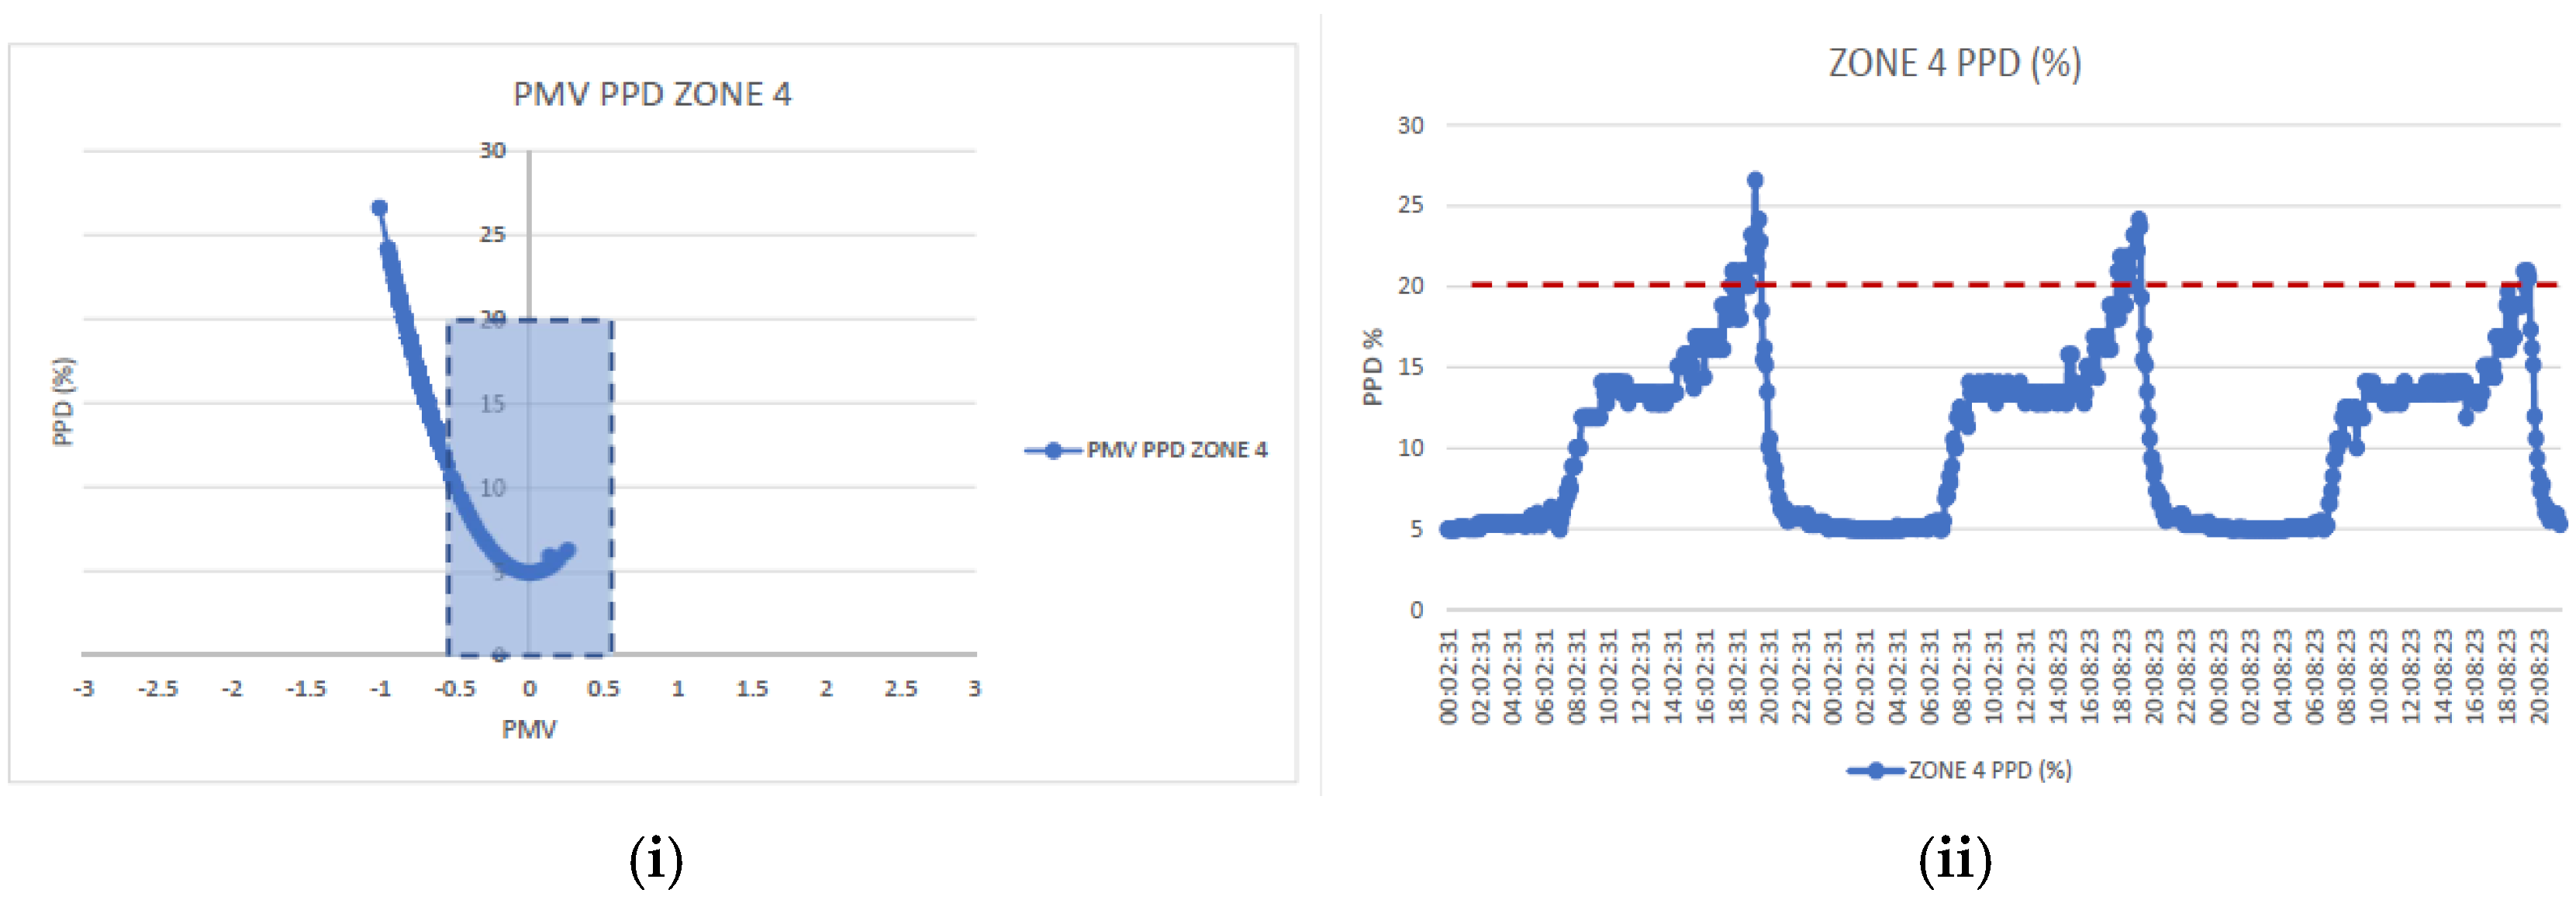
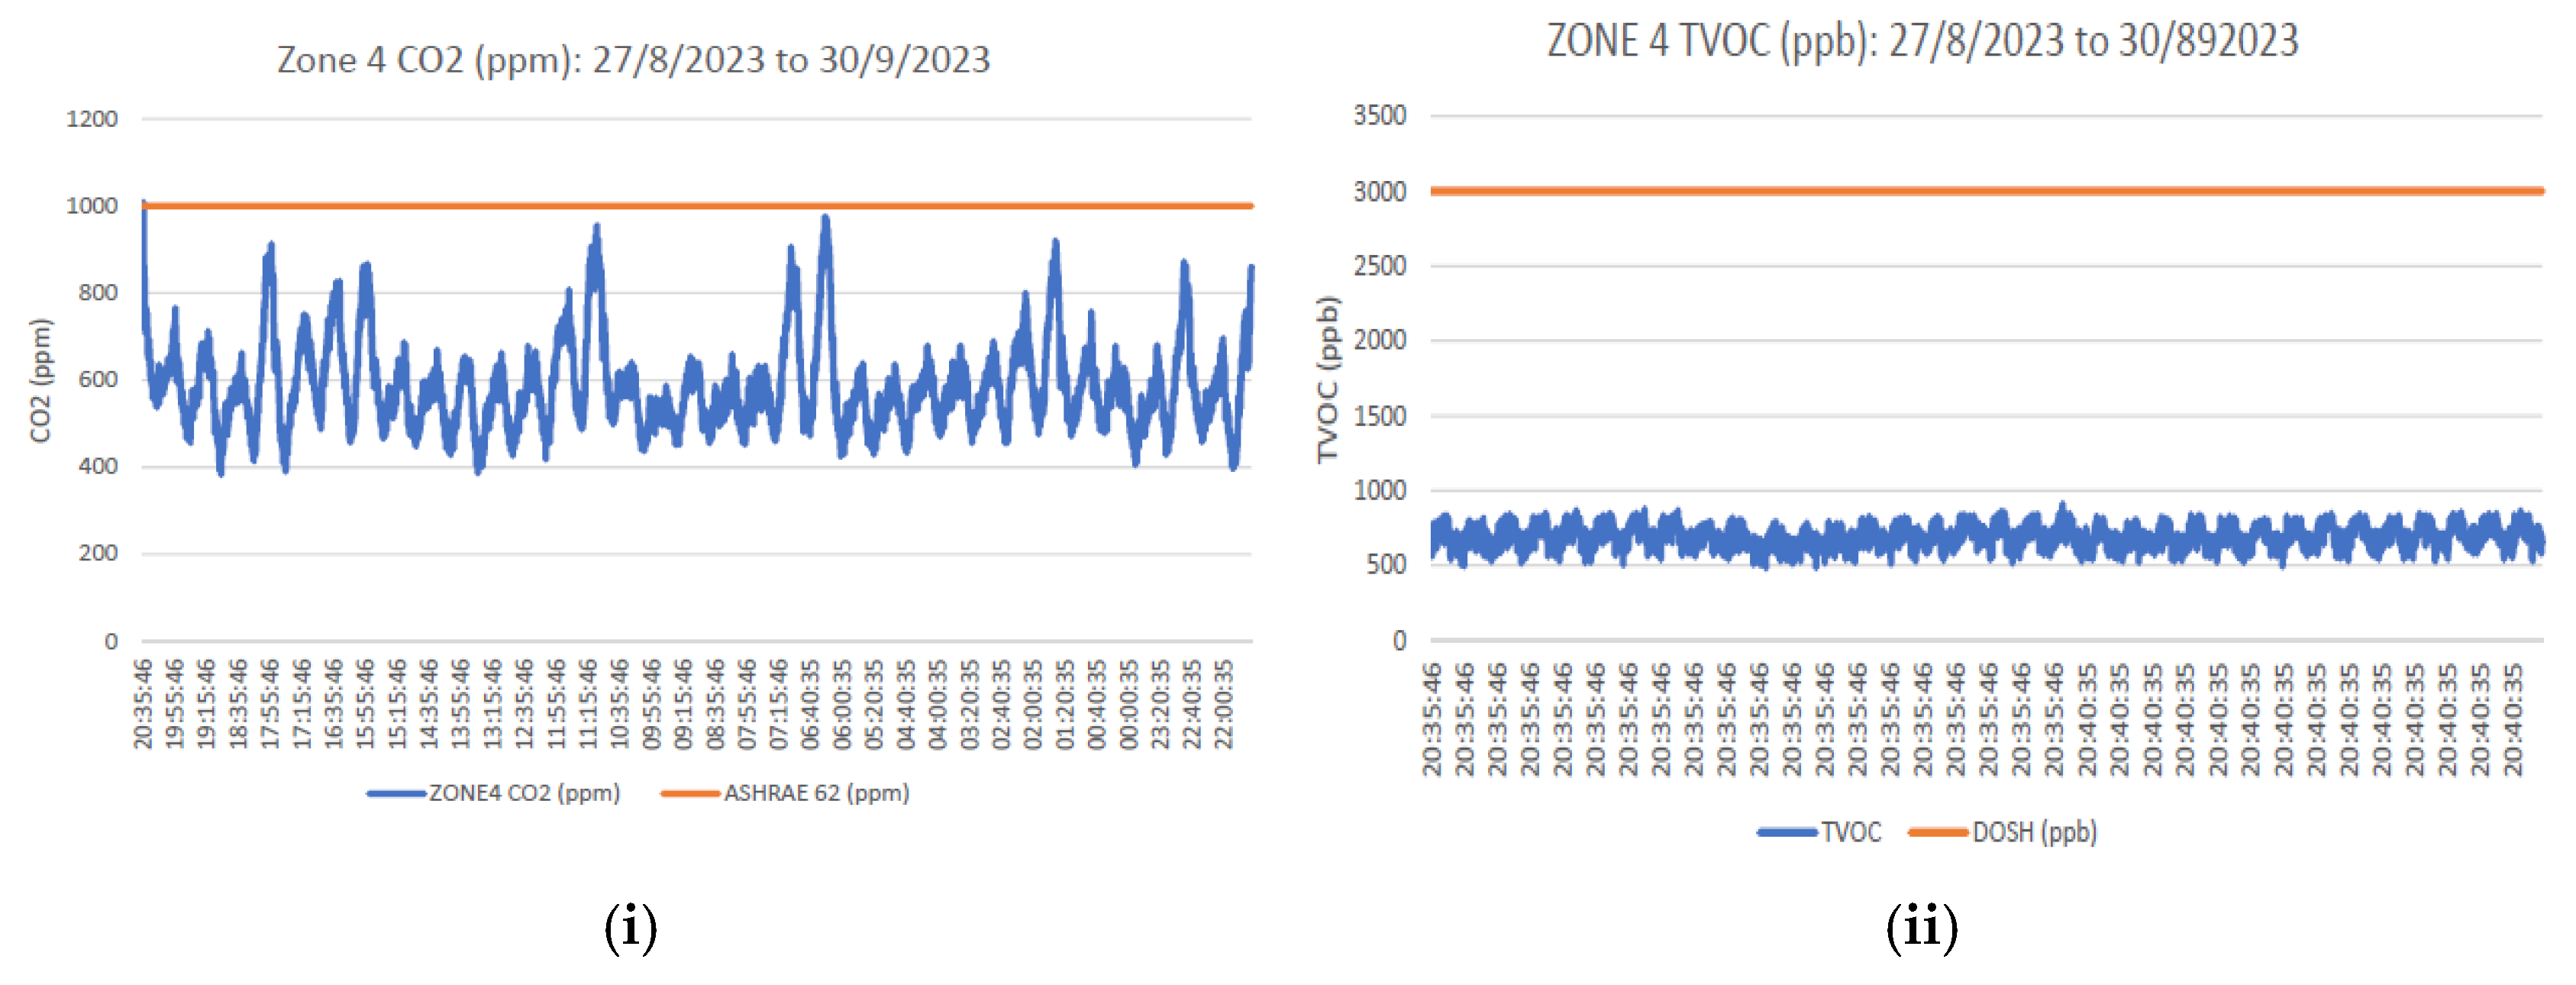
Zone 4 displayed PMV values from −0.8 to 0.3, as depicted in
Figure 12i, indicating a slightly cooler tendency. However, PPD values fluctuated between 5% and 24%, occasionally exceeding the 20% discomfort threshold during periods of peak cooling or sudden shifts in occupancy (
Figure 12ii).
To begin with IAQ, PM2.5 and PM10 levels were within acceptable thresholds. From
Figure 13i, although CO
2 levels (520 ppm) and particulate concentrations remained within health-based guidelines, slightly elevated TVOC levels (850 ppb) (
Figure 13ii) pointed to local pollutant sources, possibly from stored goods. The thermal discomfort, particularly during peak cooling hours, suggested a need for better HVAC zoning and localised air distribution control.
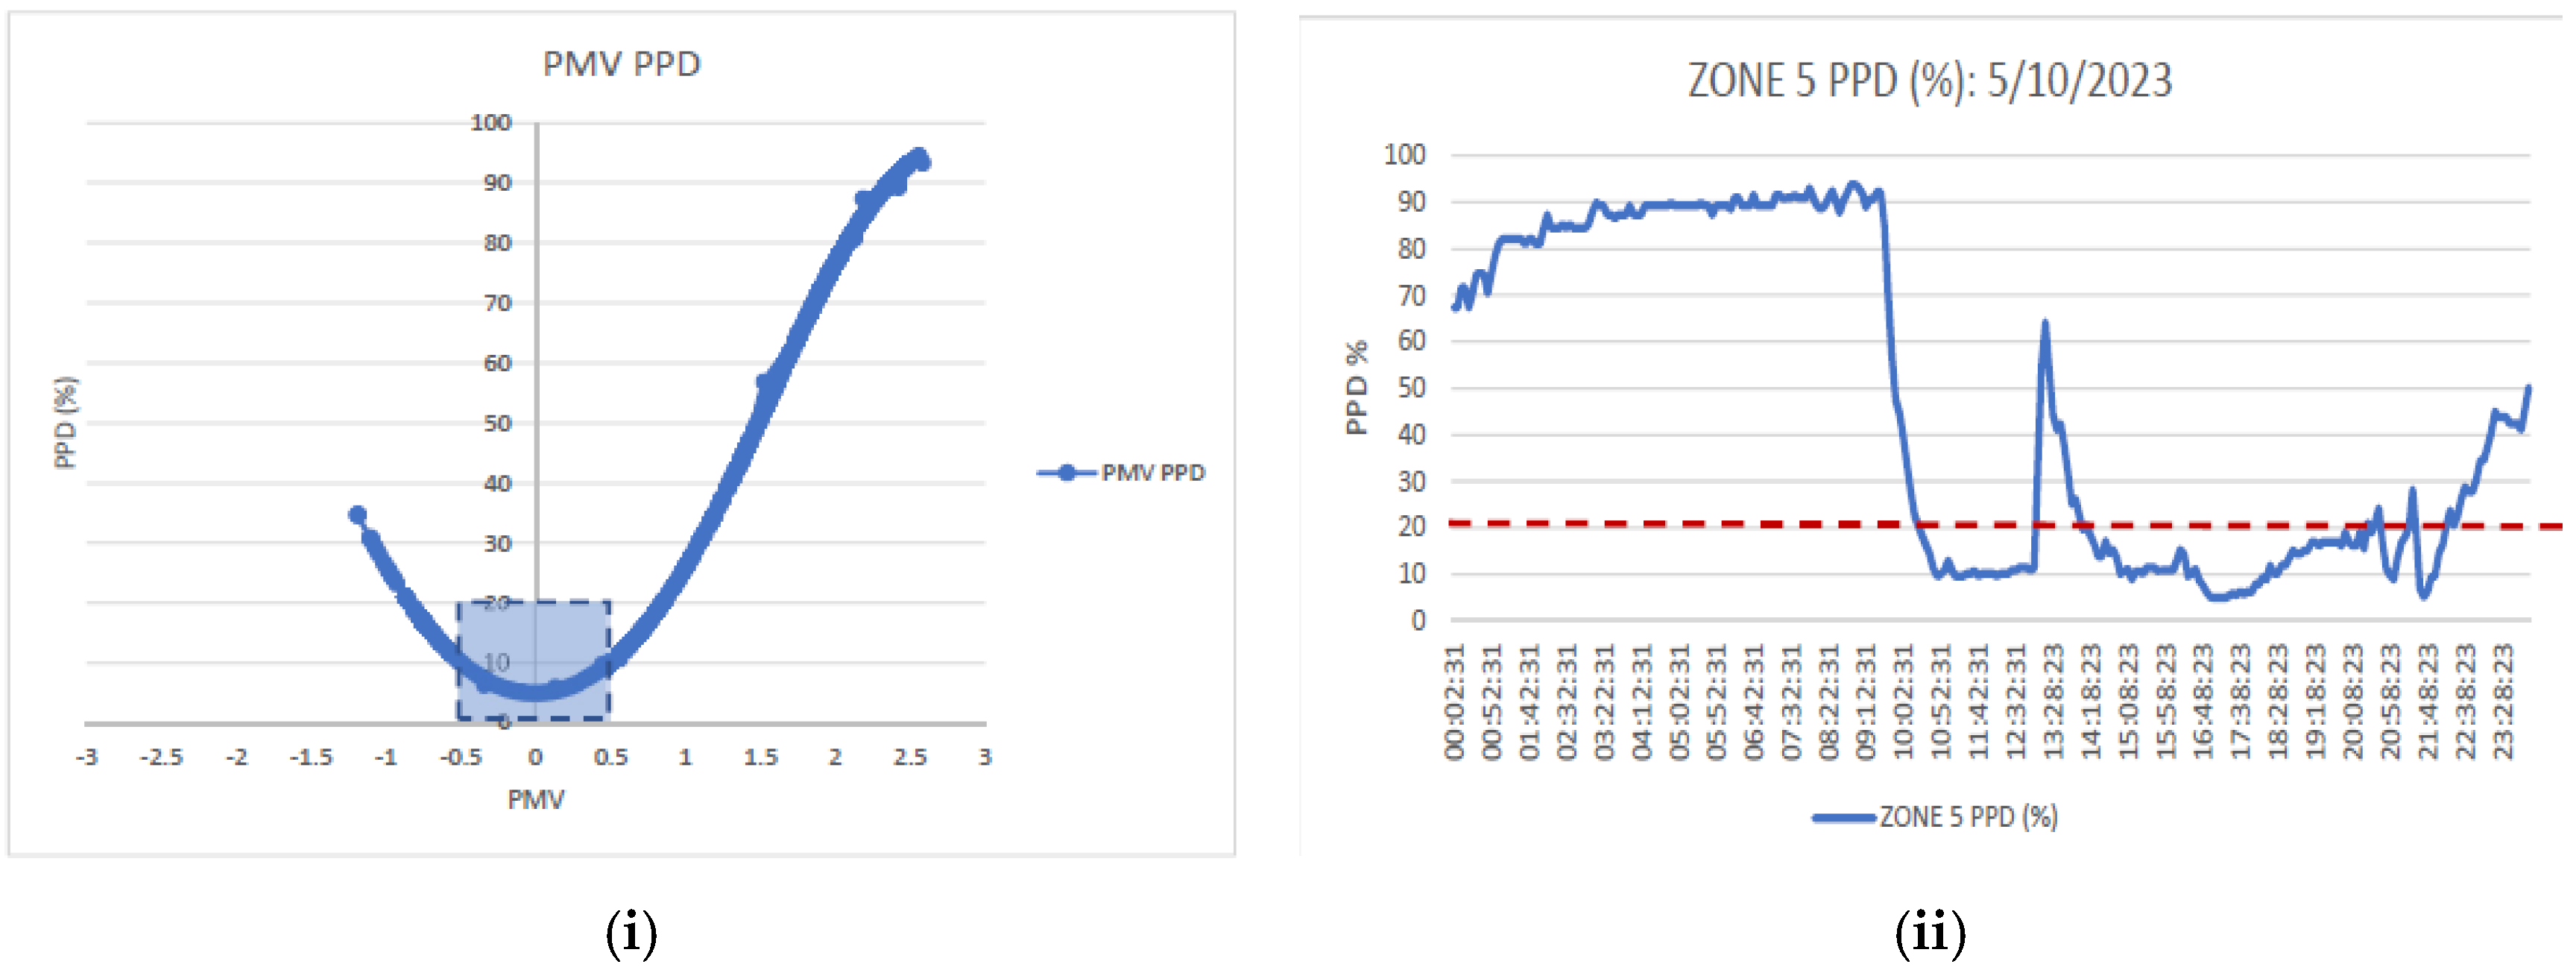
Zone 5 demonstrated the most pronounced thermal and indoor air quality challenges among all monitored zones. This cafeteria zone encompasses a food preparation area and a communal dining space, introducing complex and overlapping thermal microenvironments. As depicted in
Figure 14i, the PMV values recorded ranged between −1.1 and 2.5, revealing substantial deviations from thermal neutrality and indicating fluctuating conditions that oscillate between discomfort from cold drafts to excessive heat accumulation. Correspondingly, the PPD values peaked at an alarming 93%, as shown in
Figure 14ii, far surpassing the ASHRAE Standard 55 acceptability threshold of 20%, thus reflecting widespread thermal dissatisfaction.
The primary sources of thermal discomfort in Zone 5 stem from internal heat gains from cooking equipment, elevated occupant density, and suboptimal ventilation design. The absence of thermal zoning between the kitchen and seating areas further exacerbates the heat distribution disparity.
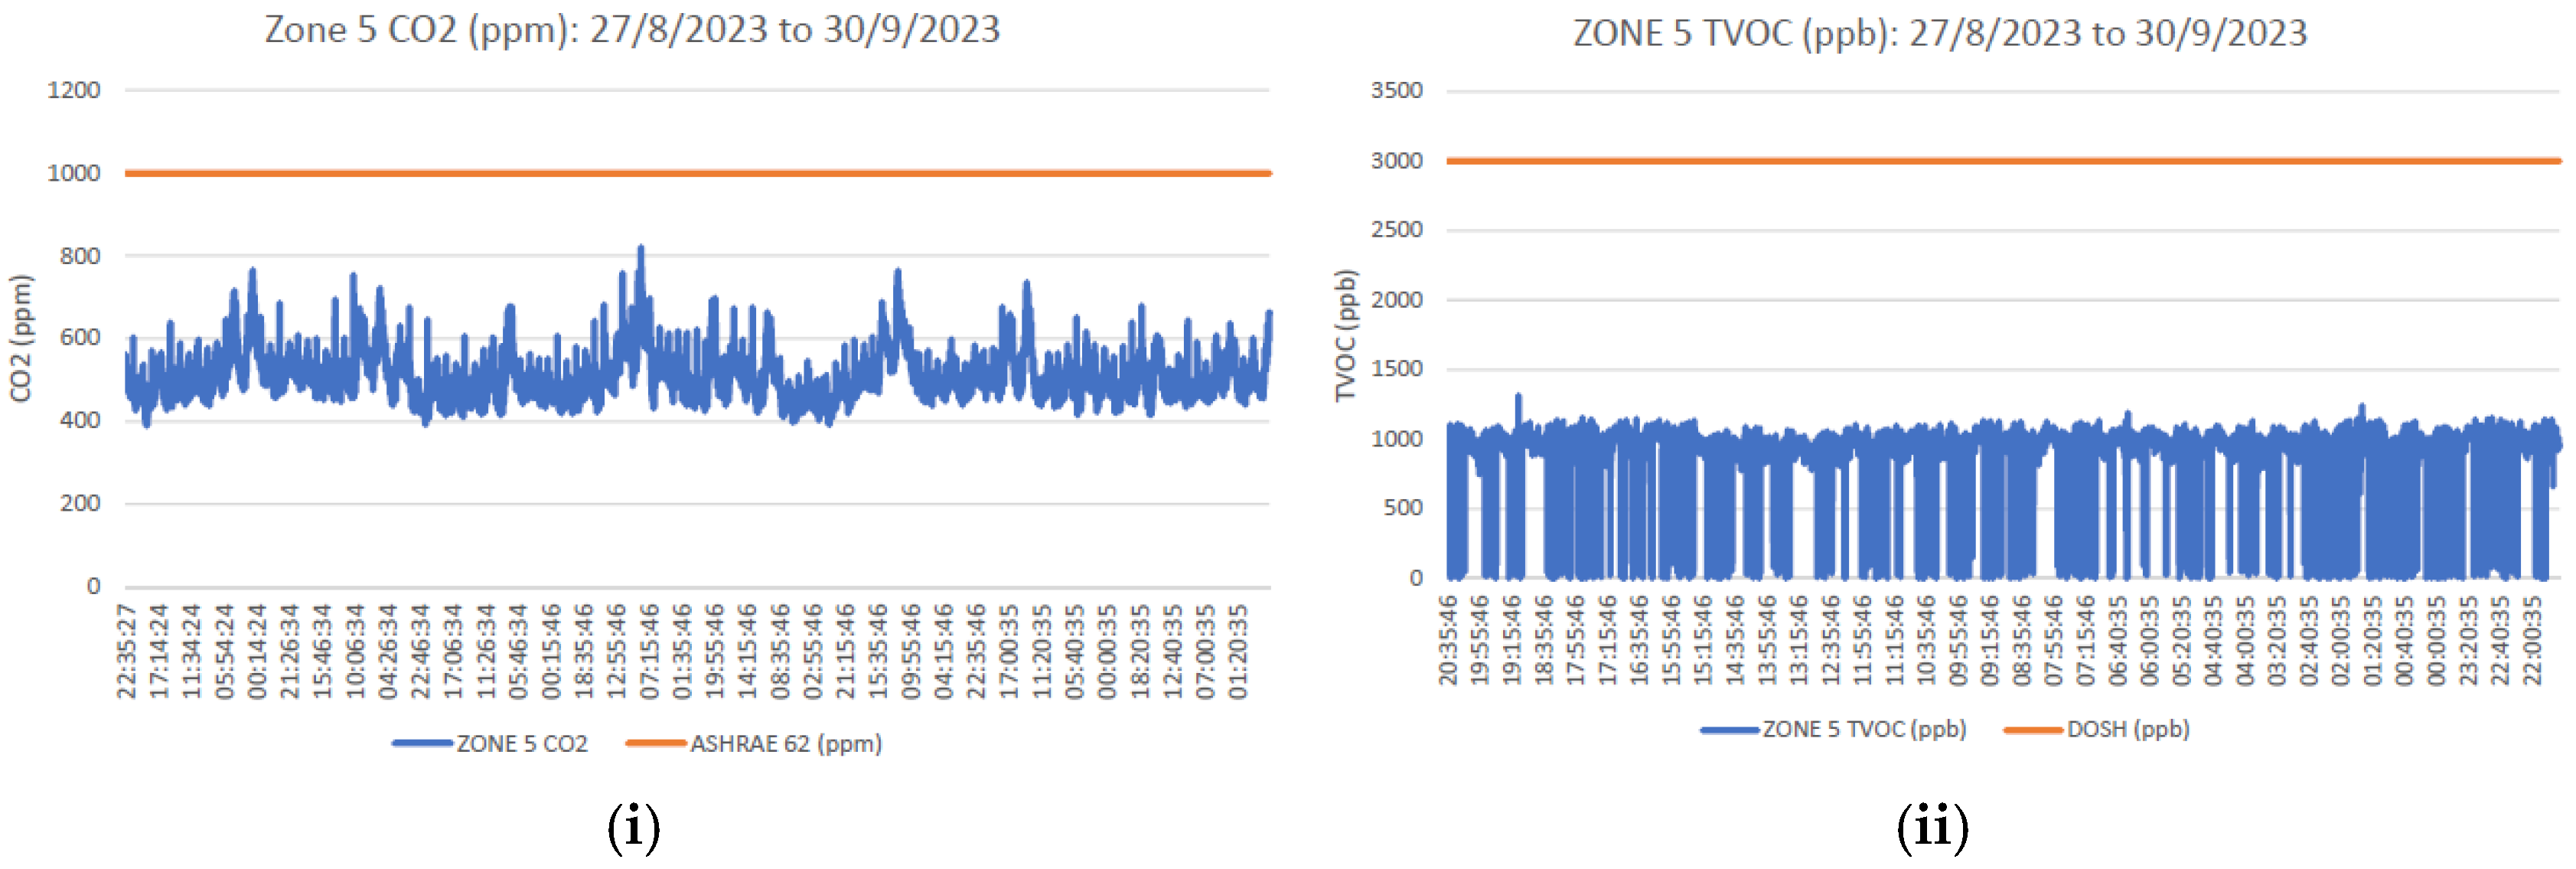
The indoor air quality (IAQ) indicators reinforce this concern. As illustrated in
Figure 15, CO
2 concentrations peaked at 900 ppm (
Figure 15i), accompanied by TVOC levels of 1100 ppb (
Figure 15ii). PM2.5 and PM10 concentrations of 40 µg/m
3 and 60 µg/m
3 exceeded the WHO and Malaysian ambient air standards.
Air change rates were only 4 air changes per hour (ACHs), significantly lower than the recommended 10–12 ACHs for food preparation areas. The inadequate exhaust rate (~800 CFM) resulted in ineffective pollutant removal. To rectify this, upgrading to 1600–2000 CFM and integrating make-up air units is necessary. A higher ACH value indicates frequent air replacement, contributing to better ventilation, thermal comfort, and indoor air quality [
5]. HEPA and carbon filtration systems are also recommended to address particulate and gaseous pollutants.
Adaptive thermal controls, demand-controlled ventilation (DCV), and real-time IAQ monitoring should be incorporated to enhance environmental stability. Architectural interventions, such as thermal barriers between kitchen and dining areas, would further mitigate cross-contamination and improve comfort.
8.2. Observation of Environmental Deviations and Performance Gaps
Field monitoring revealed notable environmental deviations across several hypermarket zones, with inconsistencies between thermal comfort indices (PMV/PPD) and indoor air quality (IAQ) parameters.
In Zone 1, thermal discomfort was pronounced during periods of high occupancy despite IAQ readings remaining within acceptable limits. This suggests that transient internal heat gains, induced by crowd density, were not sufficiently offset by real-time HVAC modulation. Similarly, Zone 4 demonstrated persistently cooler conditions than intended, with PMV values leaning toward the negative range even though IAQ remained stable. This indicates localised overcooling is likely to result from system inefficiencies rather than ventilation shortfalls.
Zone 5 presented the most critical environmental performance gaps. The cafeteria area accommodates food preparation and dining activities and records substantial thermal and pollutant load fluctuations. Air change rates were measured at approximately 4 ACHs, significantly below the ASHRAE 62.1 recommended range of 10–12 ACHs for food service areas. Correspondingly, exhaust airflow was recorded at approximately 800 CFM, which is inadequate for effective pollutant removal and thermal regulation under peak loads.
Table 4 summarises the indoor airflow parameters alongside their recommended targets, serving as a reference for evaluating ventilation adequacy and thermal conditions.
Although IAQ concentrations (CO2, TVOC, PM2.5, PM10) varied by zone, localised pollutant accumulations, particularly in Zone 5, exceeded WHO and Malaysian ambient air quality standards during peak operations. The combined thermal and IAQ challenges indicate a critical need for environmental management improvements focused on high-occupancy and high-activity areas.
Comparisons between ideal unoccupied room conditions and occupied operational periods further highlighted performance discrepancies. While unoccupied zones maintained stable temperature and IAQ levels close to modelled baselines, occupied zones experienced significant deviations due to occupant-driven thermal loads, cooking activities, and ventilation inefficiencies. This divergence underscores the limitations of static HVAC design assumptions in dynamic, high-density commercial environments.
These findings collectively reveal that achieving sustained indoor environmental quality (IEQ) in tropical hypermarkets requires adaptive control mechanisms capable of responding to variable occupancy, operational practices, and climatic influences in real time.
9. Köppen–Geiger Climate Analysis
The regional climate for the hypermarket’s location in Gombak, Selangor Darul Ehsan, Malaysia, falls under the Köppen–Geiger classification “Cfa” (Humid Subtropical), characterised by hot, humid summers and mild winters. Within this climatic framework, the study’s findings revealed notable discrepancies between observed indoor environmental conditions and expected adaptive responses based on outdoor Köppen–Geiger parameters. In particular, Zone 5, which encompasses the cafeteria and food preparation areas, exhibited elevated temperature and humidity levels, reflecting insufficient adaptation of mechanical ventilation and cooling systems to the external summer conditions. Conversely, Zones 1 and 2 demonstrated evidence of overcooling during non-peak occupancy hours, suggesting inefficiencies in HVAC control strategies and unnecessary energy consumption.
These findings align with the adaptive thermal comfort models advocated by de Dear and Brager [
7], who emphasise the need for climate-responsive approaches, including occupant-controlled systems such as operable windows and ceiling fans, to enhance adaptability and resilience in built environments. Their research highlights the potential for localised interventions to mitigate thermal discomfort, particularly in high-activity zones where overheating persists. Furthermore, the necessity for seasonal calibration of HVAC operations is reinforced, ensuring that indoor environments dynamically align with prevailing climatic conditions, thereby balancing energy efficiency with occupant comfort.
A comprehensive heatmap analysis, as shown in
Figure 16, was developed to visualise these spatial mismatches between indoor conditions and climate-appropriate comfort targets. The heatmap analysis conducted in this study visually illustrates spatial deviations in thermal comfort levels and air quality benchmarks across the hypermarket. Areas such as Zone 5 displayed pronounced misalignments, underscoring critical gaps in environmental performance. Targeted strategies, including refined HVAC zoning, adaptive cooling systems, and localised ventilation enhancements, can be proposed to improve environmental alignment with regional climatic needs by systematically identifying these discrepancies. This integrated approach offers a pathway toward optimising indoor environmental quality in large-scale commercial facilities operating within hot-humid climates.
Heatmap linking Köppen–Geiger climate classification expectations with observed indoor conditions to identify adaptation gaps.
10. Recommendations
In response to the identified environmental deviations and system performance gaps, several key strategies are recommended to enhance thermal comfort, indoor air quality (IAQ), and energy efficiency within the hypermarket environment.
First, improvements to the ventilation system are crucial, particularly in high-demand zones such as the cafeteria. Upgrading the exhaust airflow from approximately 800 CFM to between 1600 and 2000 CFM is necessary to achieve the ASHRAE 62.1 recommended range of 10–12 air changes per hour (ACHs) for food preparation areas [
45]. Balancing the supply airflow accordingly and incorporating high-efficiency particulate air (HEPA) filters alongside activated carbon filtration systems will further mitigate pollutant concentrations and support healthier indoor air quality during periods of high occupancy [
46,
47].
Second, adaptive environmental control strategies should be prioritised to address the dynamic indoor conditions driven by occupancy and operational activities. Implementing demand-controlled ventilation (DCV) linked to real-time carbon dioxide and volatile organic compound (VOC) monitoring can enable dynamic adjustments of ventilation rates based on actual occupant presence and pollutant loads [
48]. Furthermore, predictive HVAC scheduling, informed by occupancy patterns and external climatic conditions, is recommended to optimise energy consumption and indoor environmental stability [
49].
Third, dynamic zoning should be introduced within complex functional spaces, particularly in the cafeteria area. Spatial separation between food preparation and dining areas, supported by localised thermal zoning and independent airflows, can help prevent thermal load mixing and cross-contamination [
50]. Deploying IoT-enabled environmental monitoring systems across operational zones will further allow real-time assessments and facilitate proactive HVAC adjustments in response to emerging environmental challenges [
51,
52].
Considering the tropical rainforest climate classification, HVAC calibration must also align with seasonal and diurnal variations, considering the Köppen–Geiger climate classification. This approach ensures that ventilation and cooling operations dynamically respond to external temperature and humidity fluctuations, thereby achieving a balance between occupant comfort and energy efficiency.
Finally, integrating periodic occupant feedback into environmental management practices is essential. Regular surveys designed to capture occupant perceptions of thermal comfort and air quality can validate empirical findings from PMV and PPD models and identify operational areas requiring continuous improvement [
53]. Collectively, these recommendations aim to support the development of an adaptive, occupant-centred indoor environmental management framework suitable for large-scale commercial facilities operating in tropical climates.
11. Conclusions
This study comprehensively assessed the thermal comfort and indoor air quality (IAQ) performance of a hypermarket located in Gombak, Selangor Darul Ehsan, Malaysia, revealing zone-specific variations in environmental conditions. The results highlight the need to implement tailored strategies to address the challenges the region’s tropical climate poses.
By integrating quantitative assessments, including Predicted Mean Vote (PMV), Percentage of People Dissatisfied (PPD), and key IAQ indicators, with qualitative insights from occupant feedback, the study offers a comprehensive evaluation of indoor environmental performance. While Zones 1 to 4 generally aligned with acceptable comfort and air quality thresholds, Zone 5 exhibited significant deviations, characterised by elevated PMV and PPD values and increased concentrations of CO2 and TVOCS. These findings highlight the critical need for targeted interventions to enhance ventilation effectiveness and overall indoor environmental quality, particularly in zones with intensive operational activities.
In response, this study recommends integrating advanced HVAC strategies, including IoT-enabled environmental monitoring and dynamic real-time system adjustments, to achieve energy-efficient and occupant-centric building operations. Adaptive cooling techniques [
54], localised environmental controls, and enhanced ventilation systems are necessary to align indoor conditions with global benchmarks such as ASHRAE Standard 55 [
5] and WHO Indoor Air Quality Guidelines [
55]. These interventions are particularly crucial for high-demand areas such as Zone 5, where cooking significantly exacerbates environmental stressors.
Moreover, applying climate-adaptive strategies informed by the Köppen–Geiger classification framework illustrates the potential for systemic improvements across diverse commercial settings. Seasonal calibrations of HVAC systems, continuous integration of occupant feedback, and adopting advanced air filtration technologies collectively contribute to achieving long-term sustainability goals. The interplay between energy efficiency, indoor air quality, and occupant comfort must be carefully managed to ensure operational resilience in tropical commercial environments.
The hypermarket studied faced notable operational challenges, including maintaining consistent IAQ in the cafeteria zone due to high pollutant loads from food preparation activities, and managing thermal loads in storage areas characterised by inadequate ventilation. Addressing these challenges requires deploying targeted, zone-specific HVAC and air quality interventions to optimise environmental conditions across distinct operational areas.
The implications of this research extend beyond the hypermarket setting, offering a replicable framework for future investigations seeking to balance thermal comfort, IAQ, and energy efficiency in large-scale commercial environments. By integrating PMV, PPD, and IAQ metrics with climate-responsive HVAC strategies informed by Köppen–Geiger classifications, this study contributes to the advancement of sustainable indoor environmental management practices. Ultimately, this holistic approach promotes healthier, more energy-efficient commercial spaces while enhancing occupant satisfaction and supporting compliance with international indoor environmental standards [
56,
57].


