
The Fatigue Life Prediction of Welded Joints in Orthotropic Steel Bridge Decks Considering Weld-Induced Residual Stress and Its Relaxation Under Vehicle Loads


Abstract
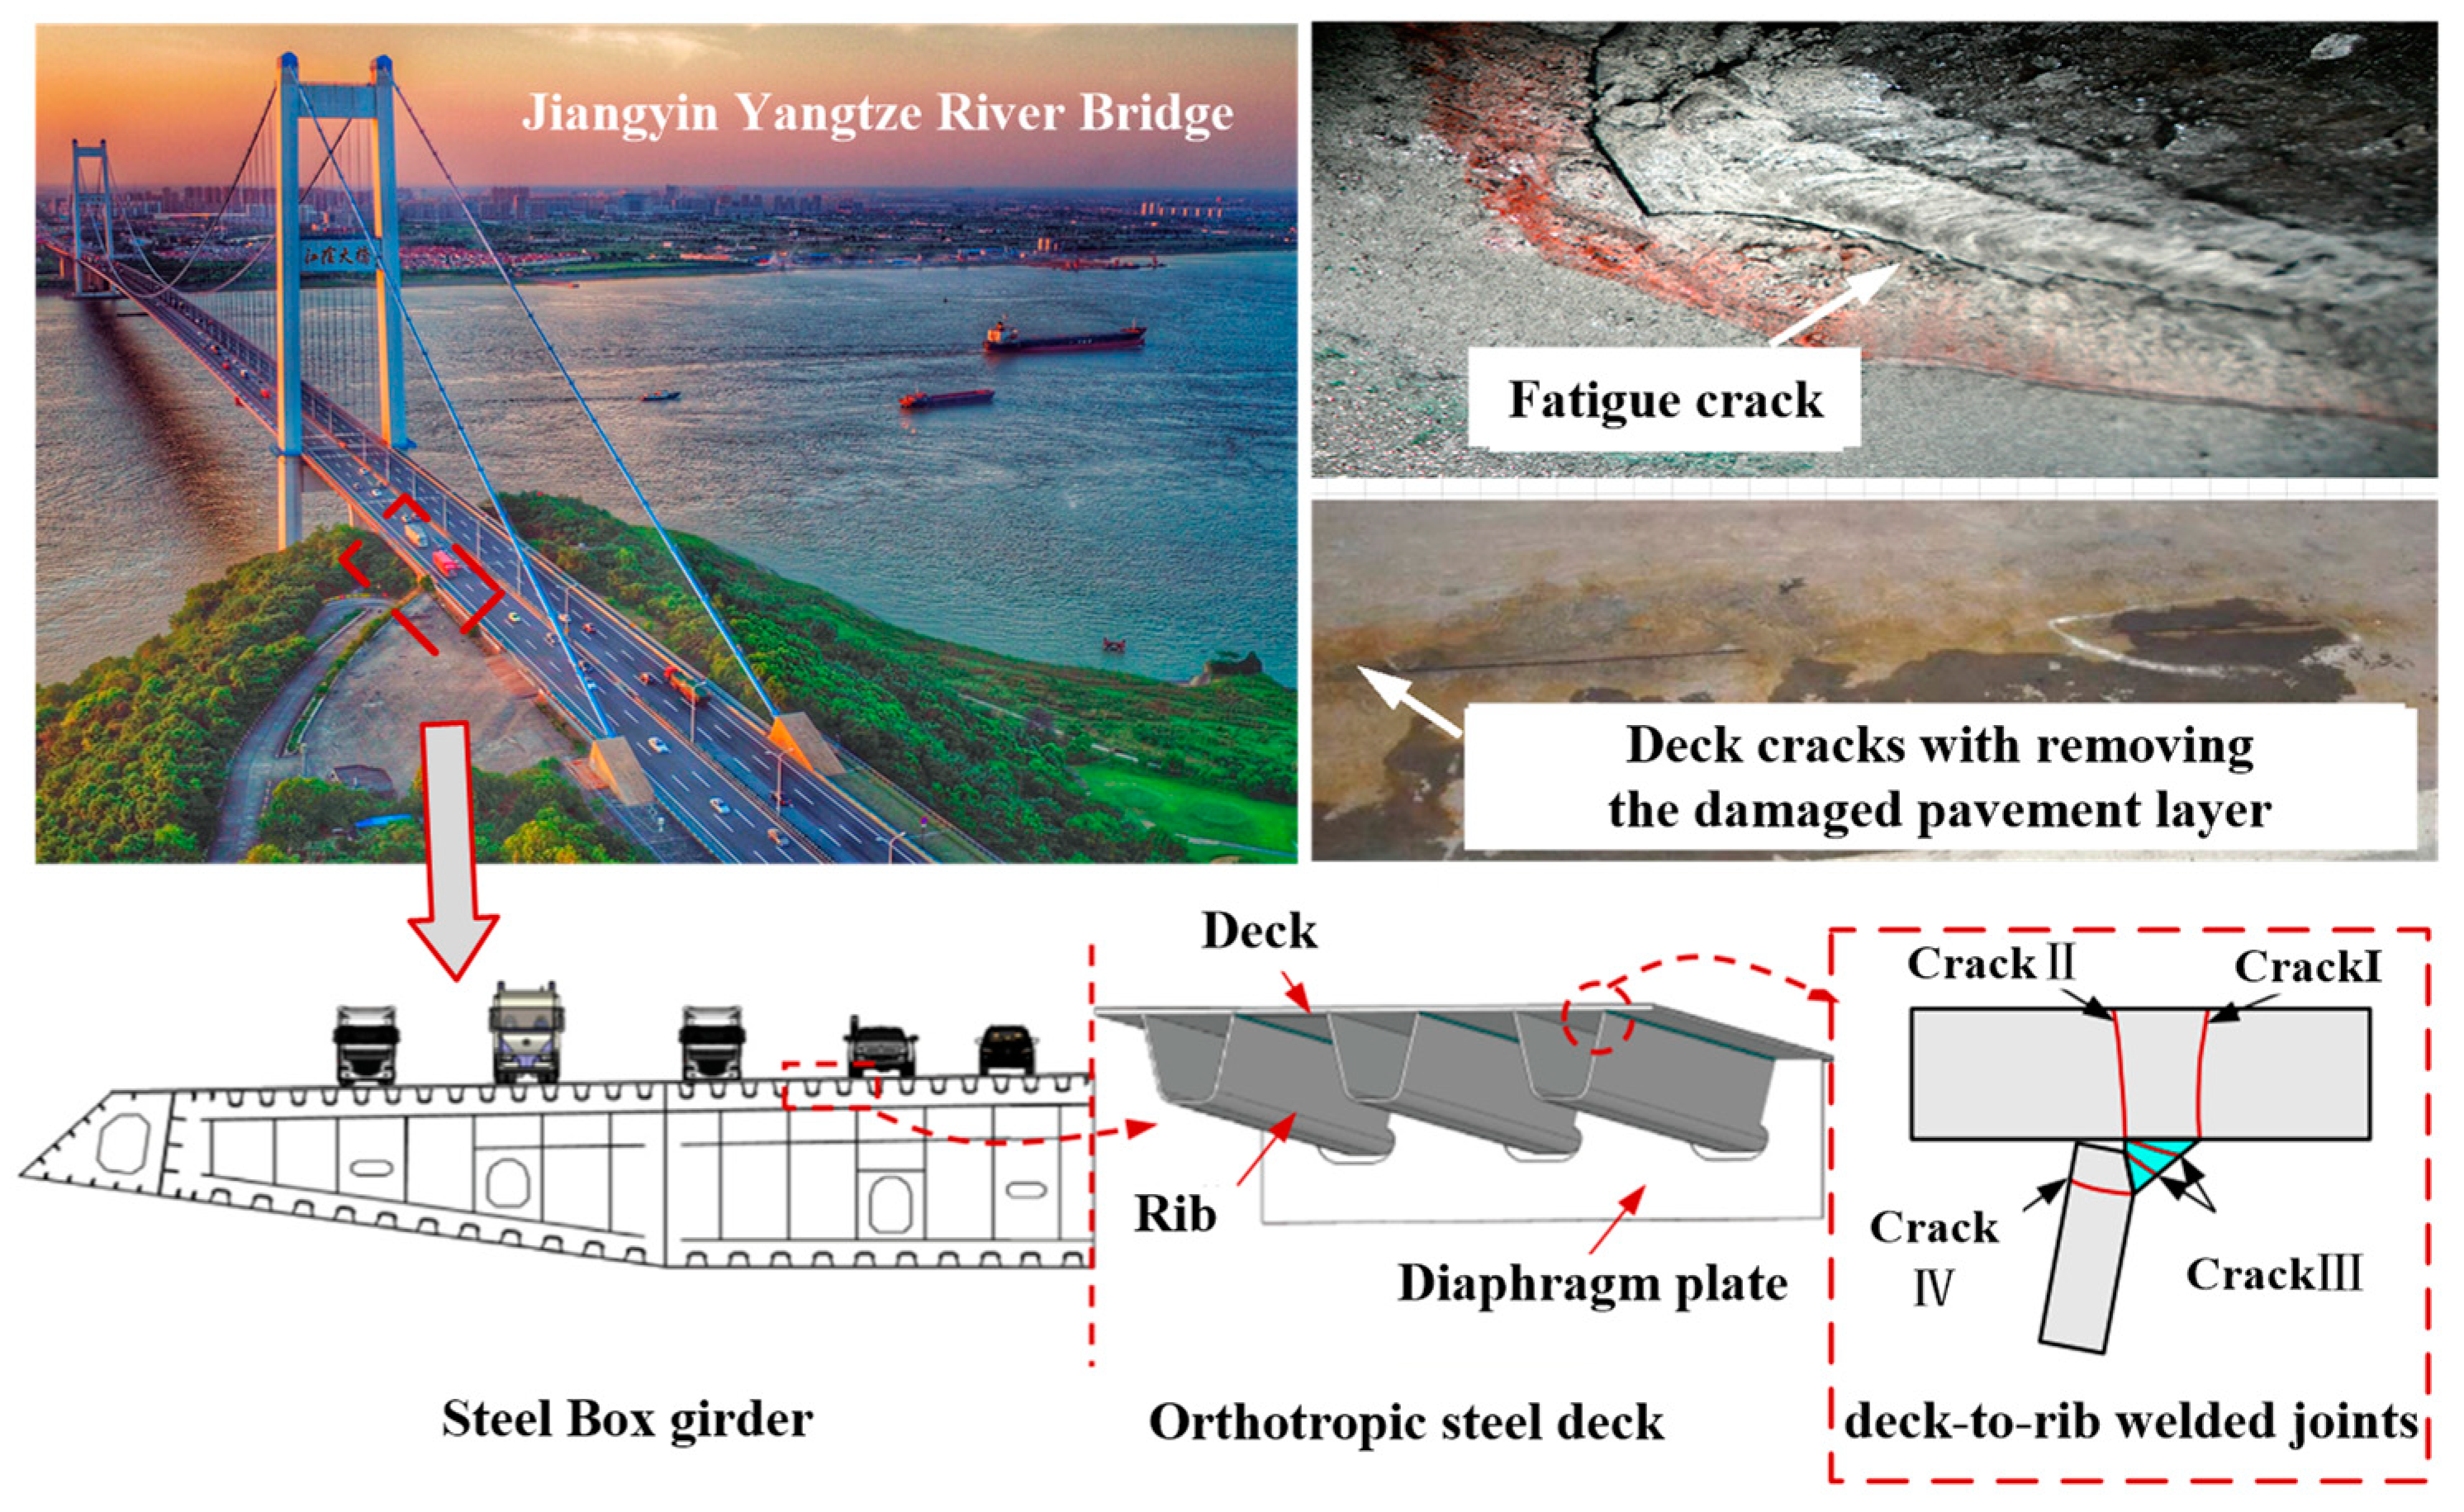
1. Introduction
2. Fatigue Life Assessment Method Considering Impact of Welding Residual Stress Relaxation
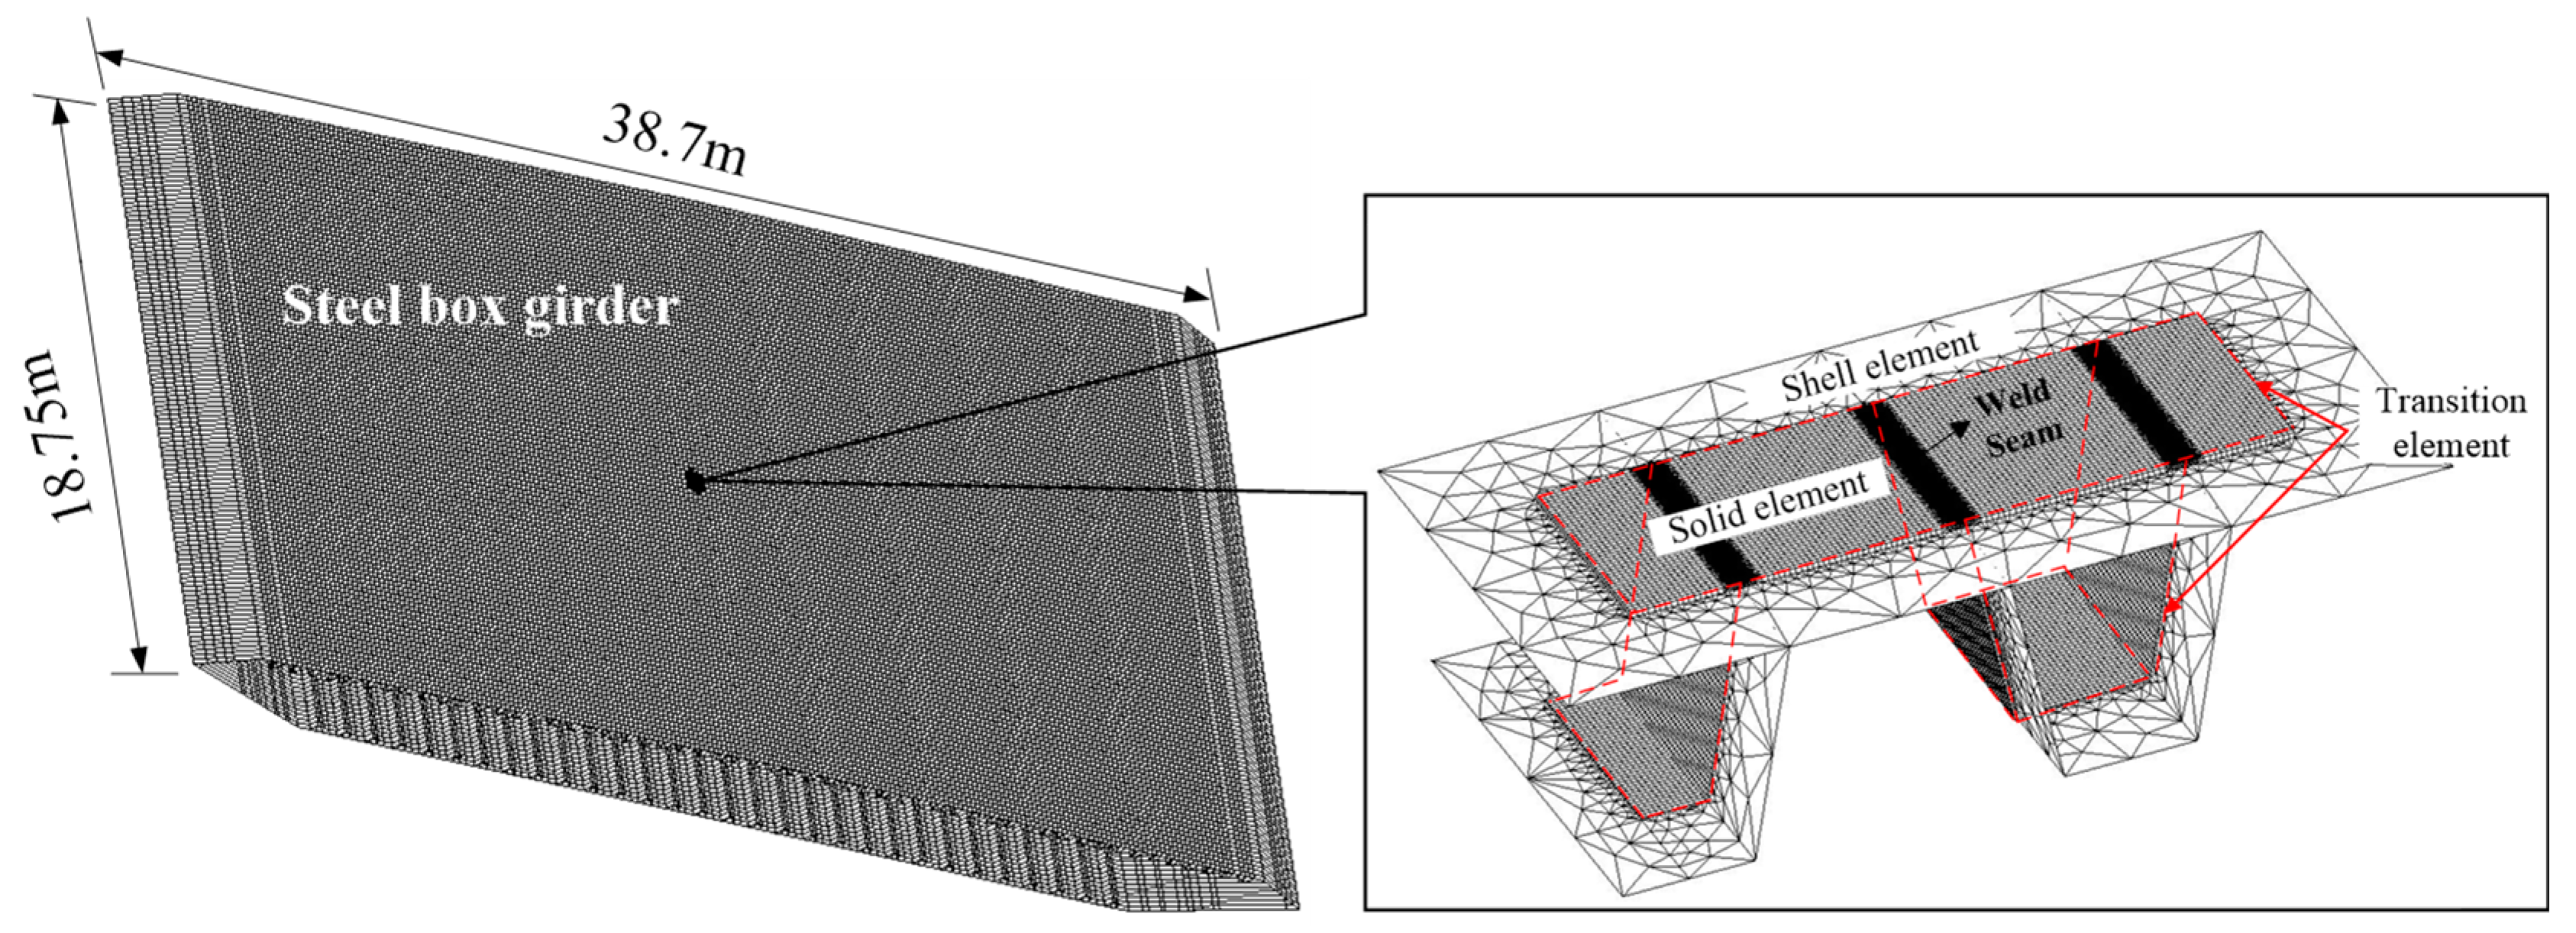
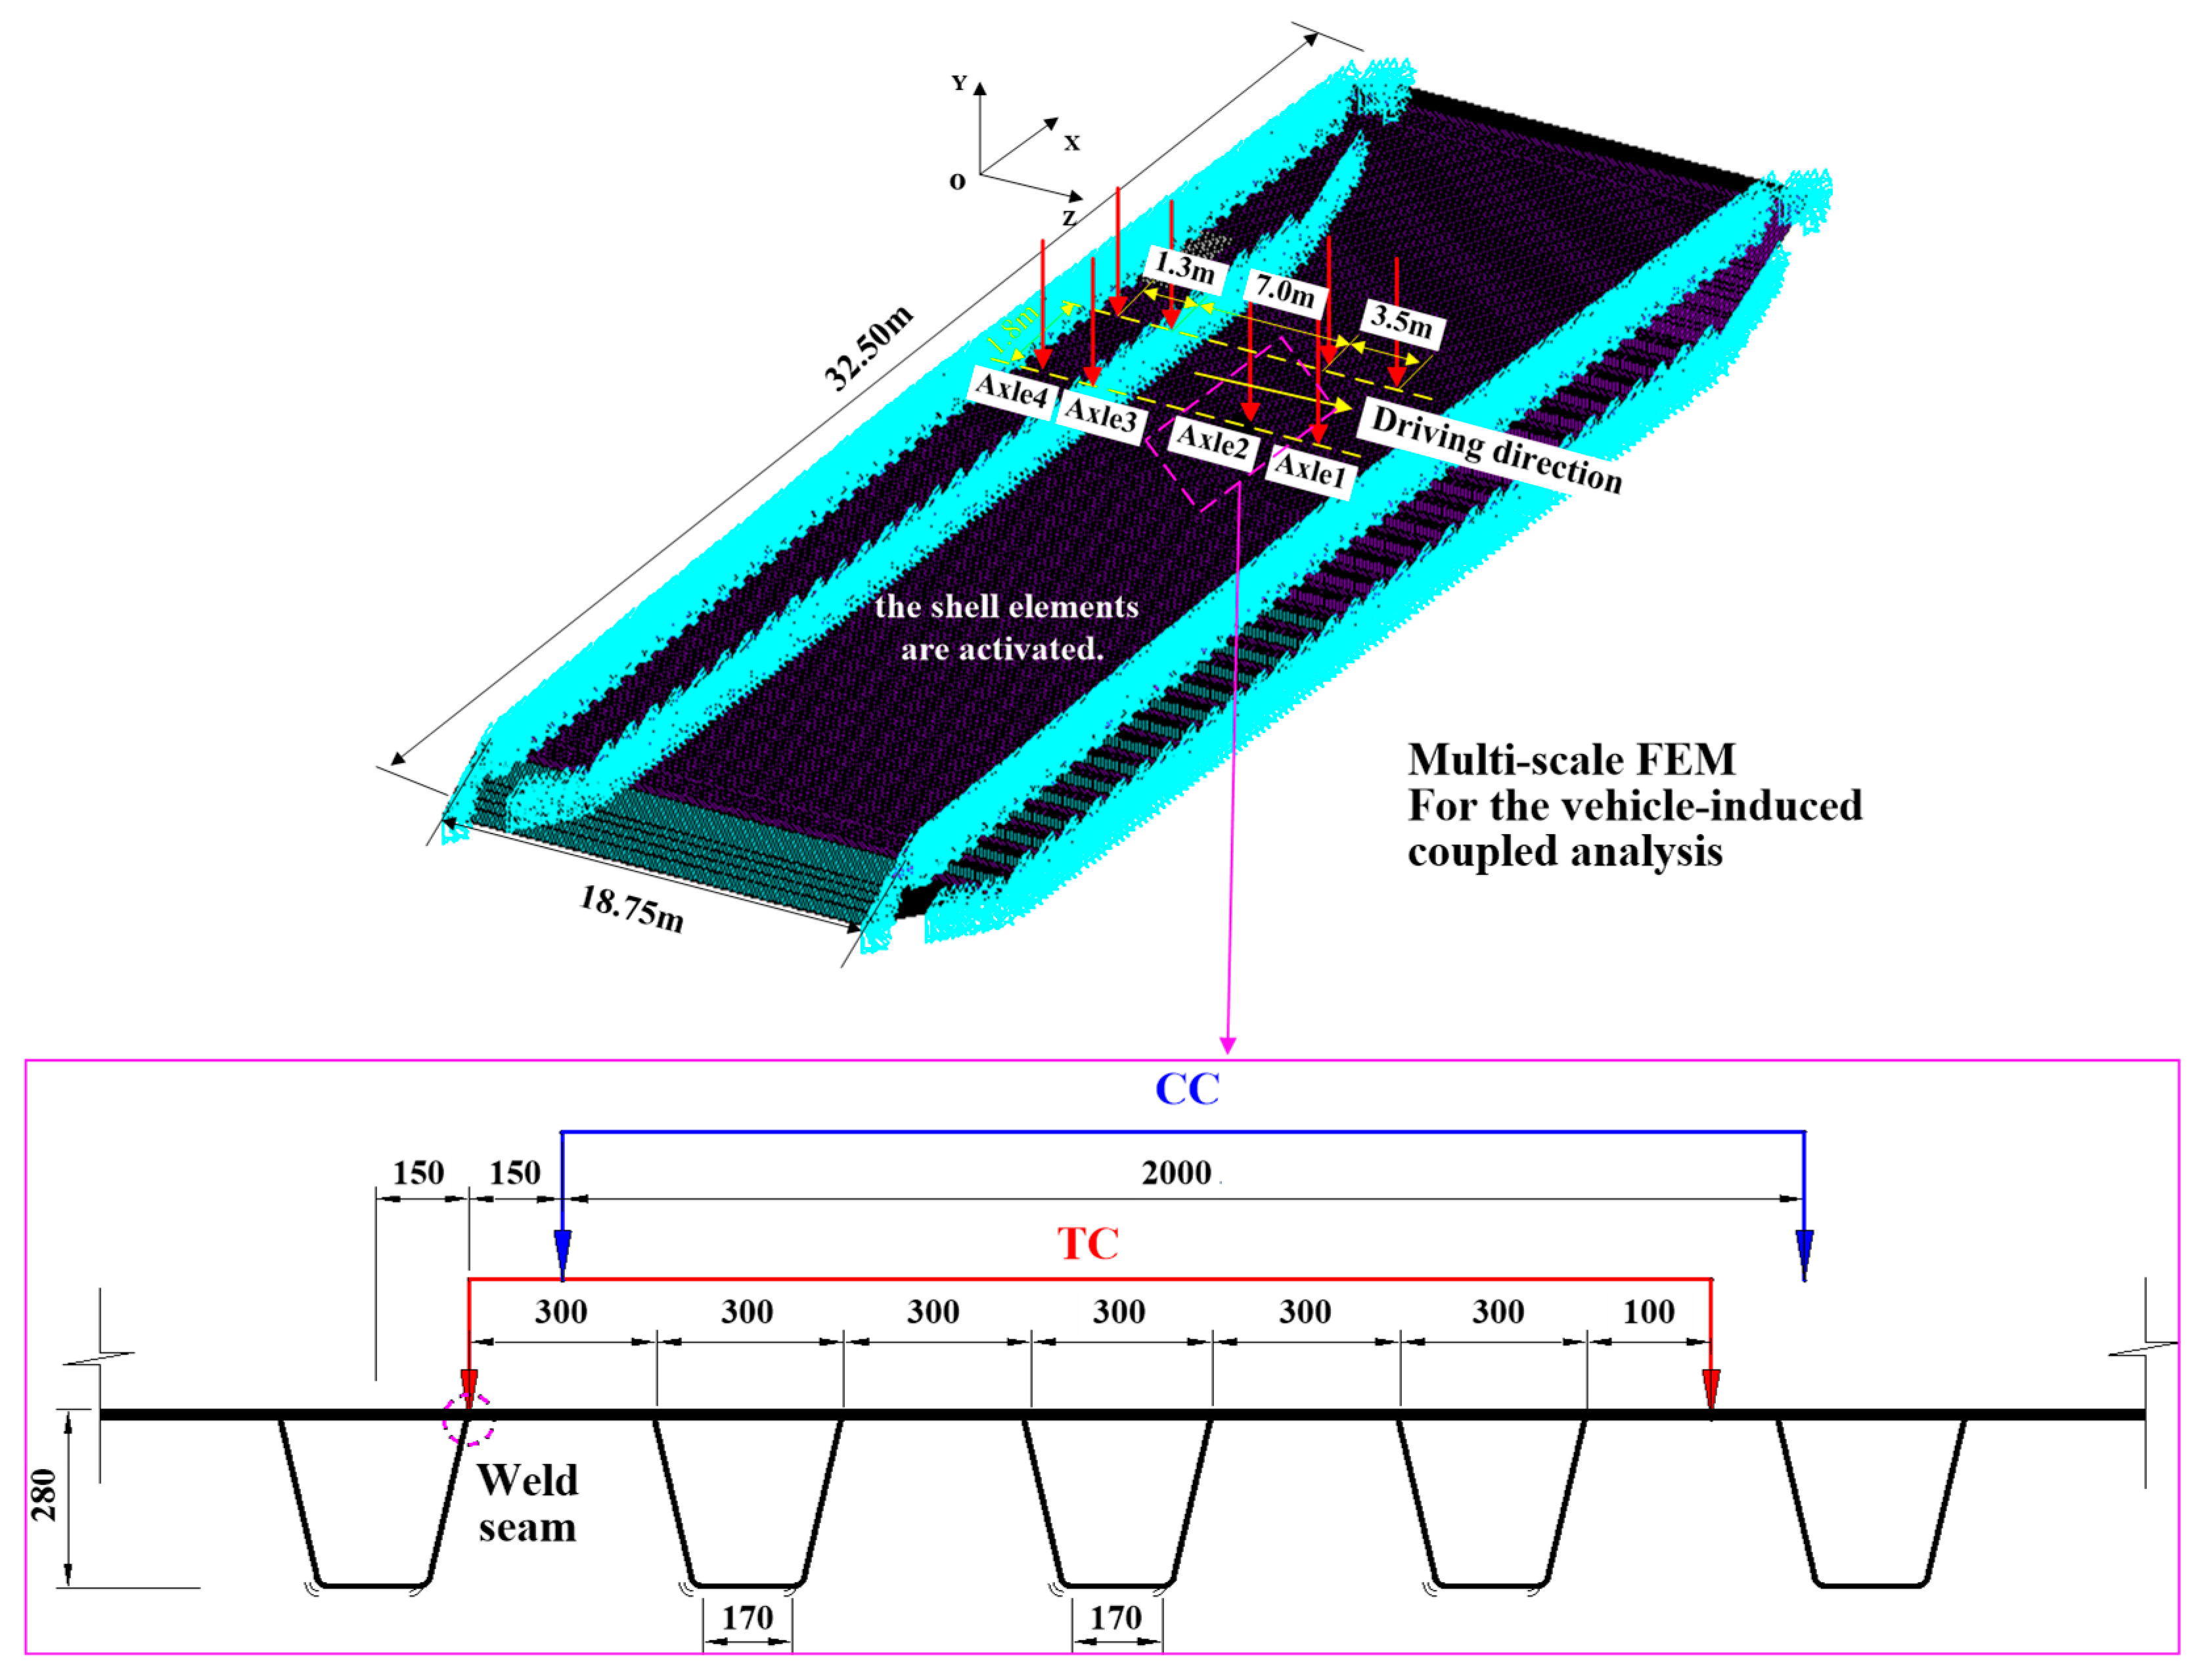
2.1. Multi-Scale Finite Element Model (FEM) for Vehicle-Induced Coupled Analysis
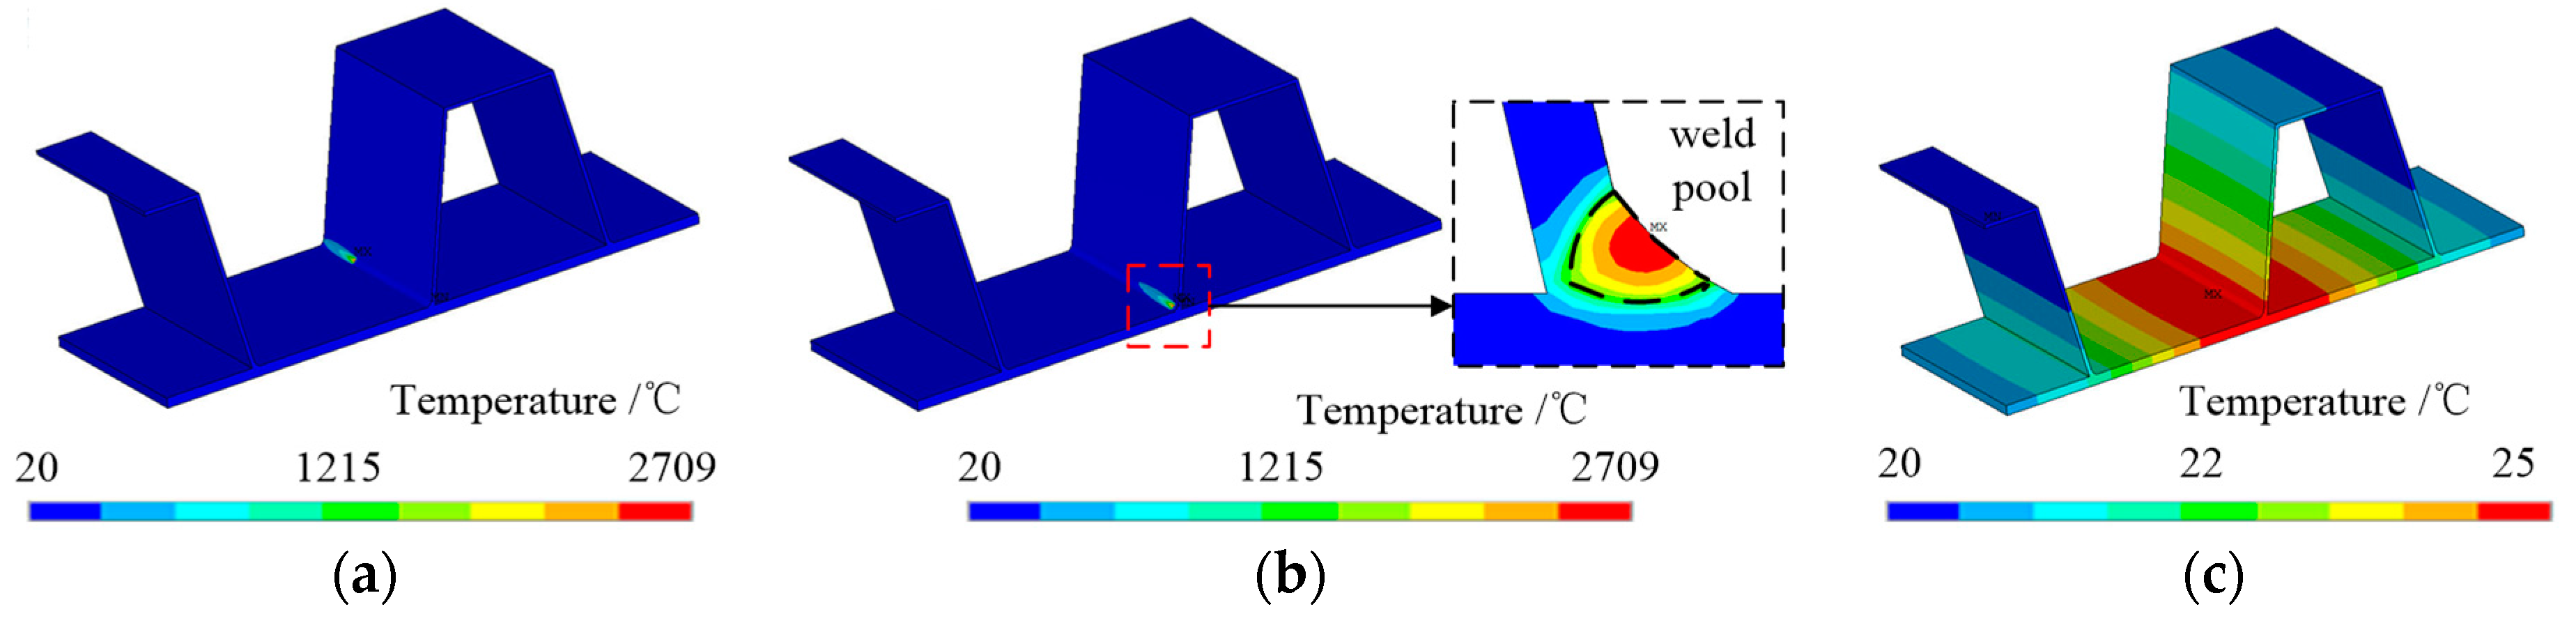
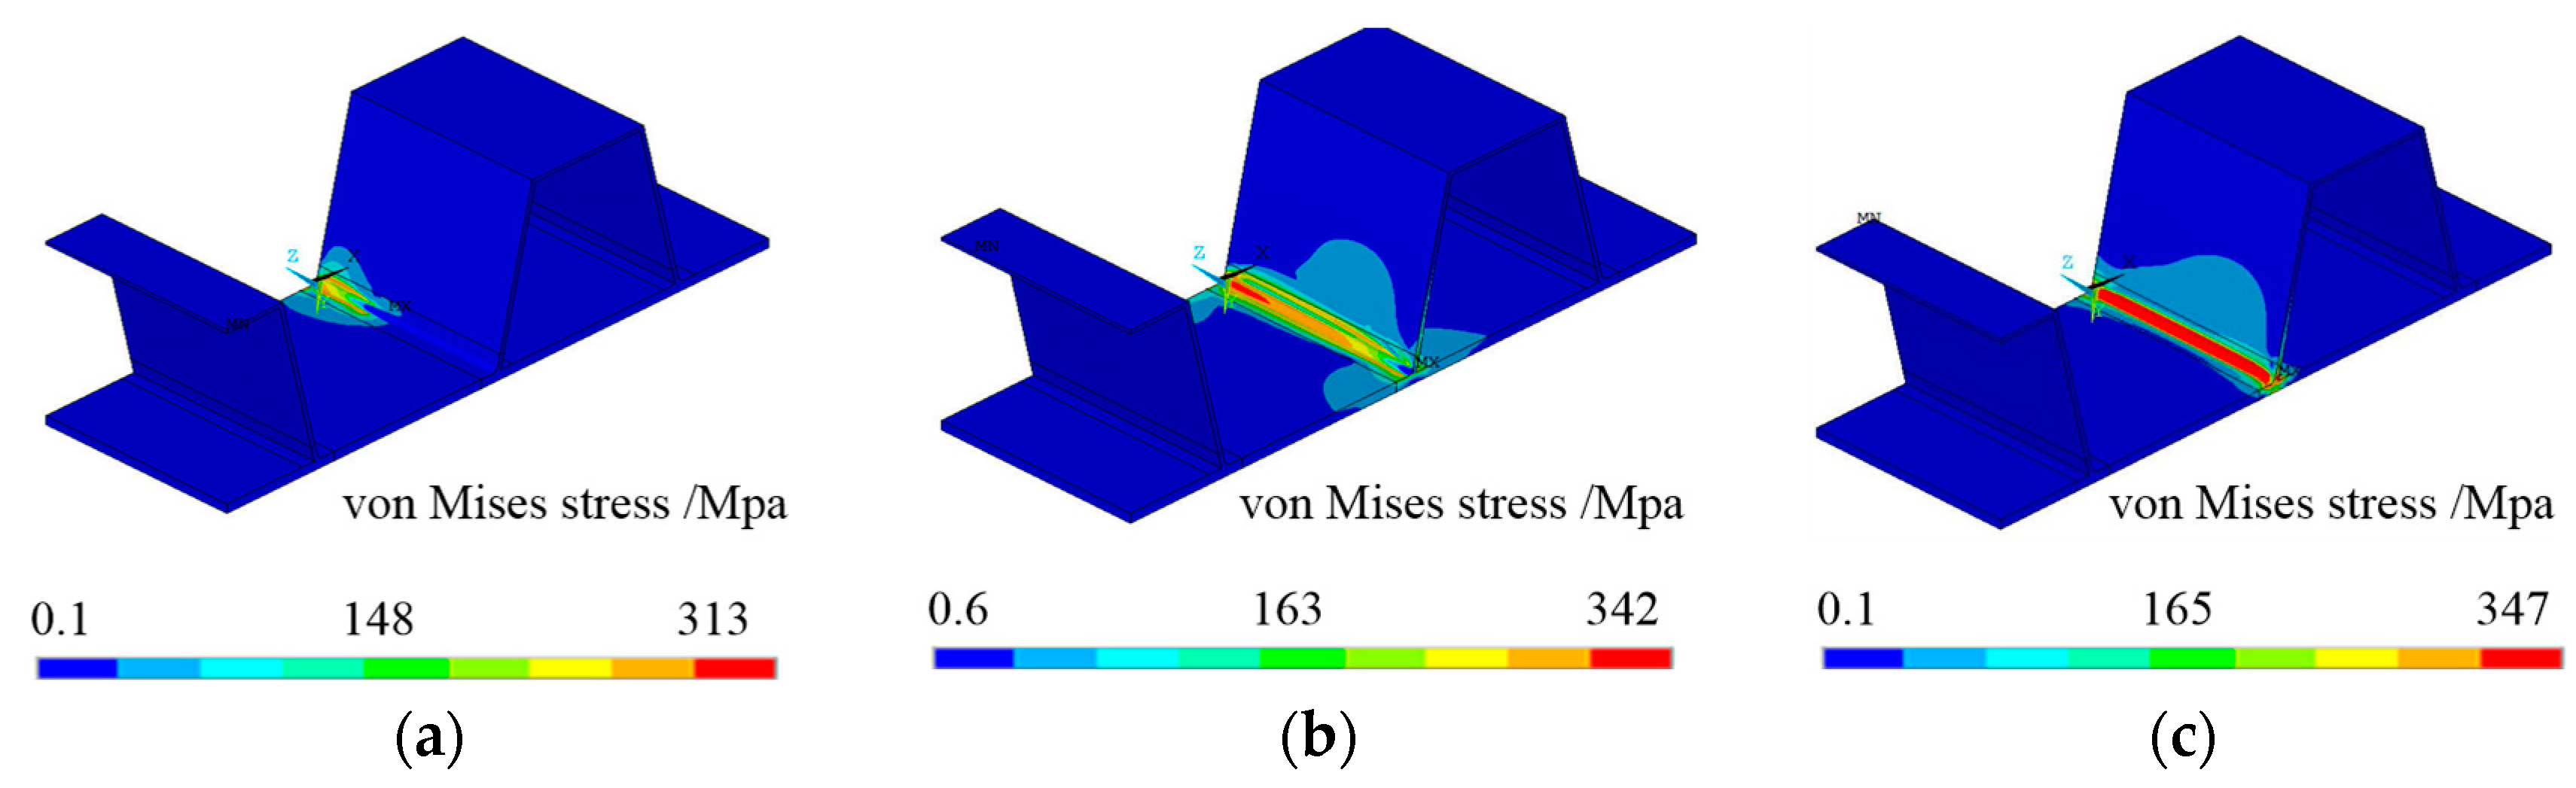
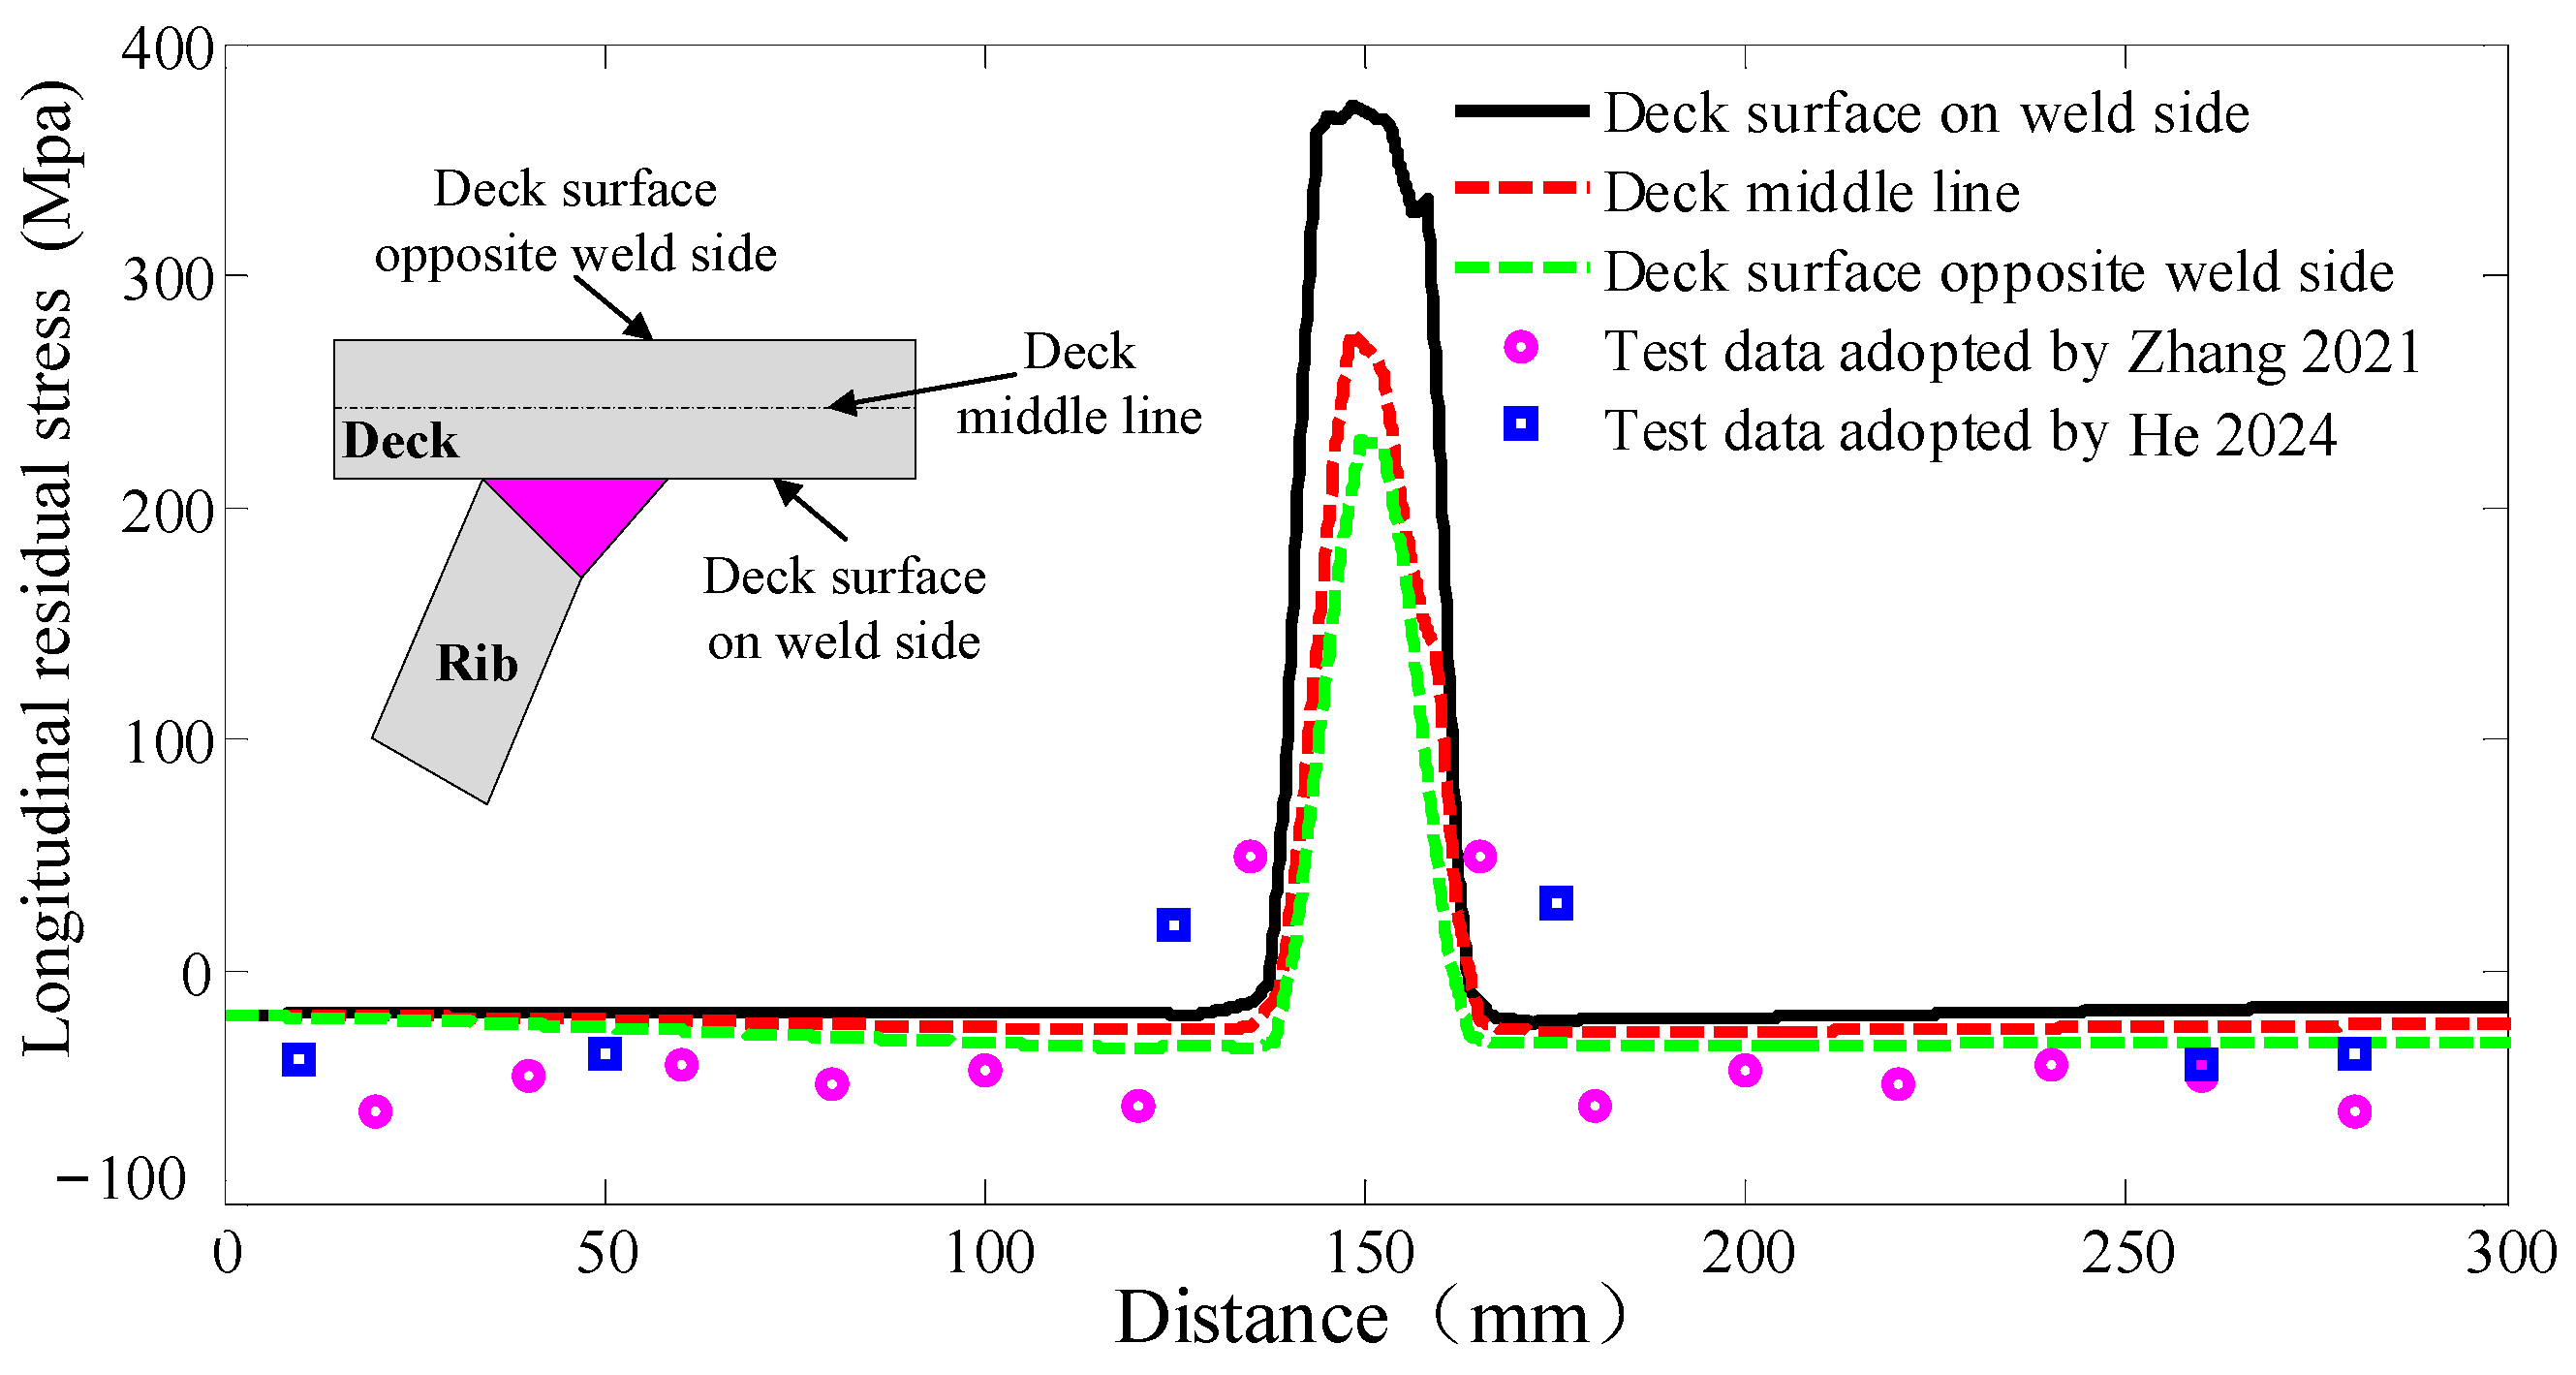
2.2. Weld-Induced Residual Stress Distribution of Local Solid FEM
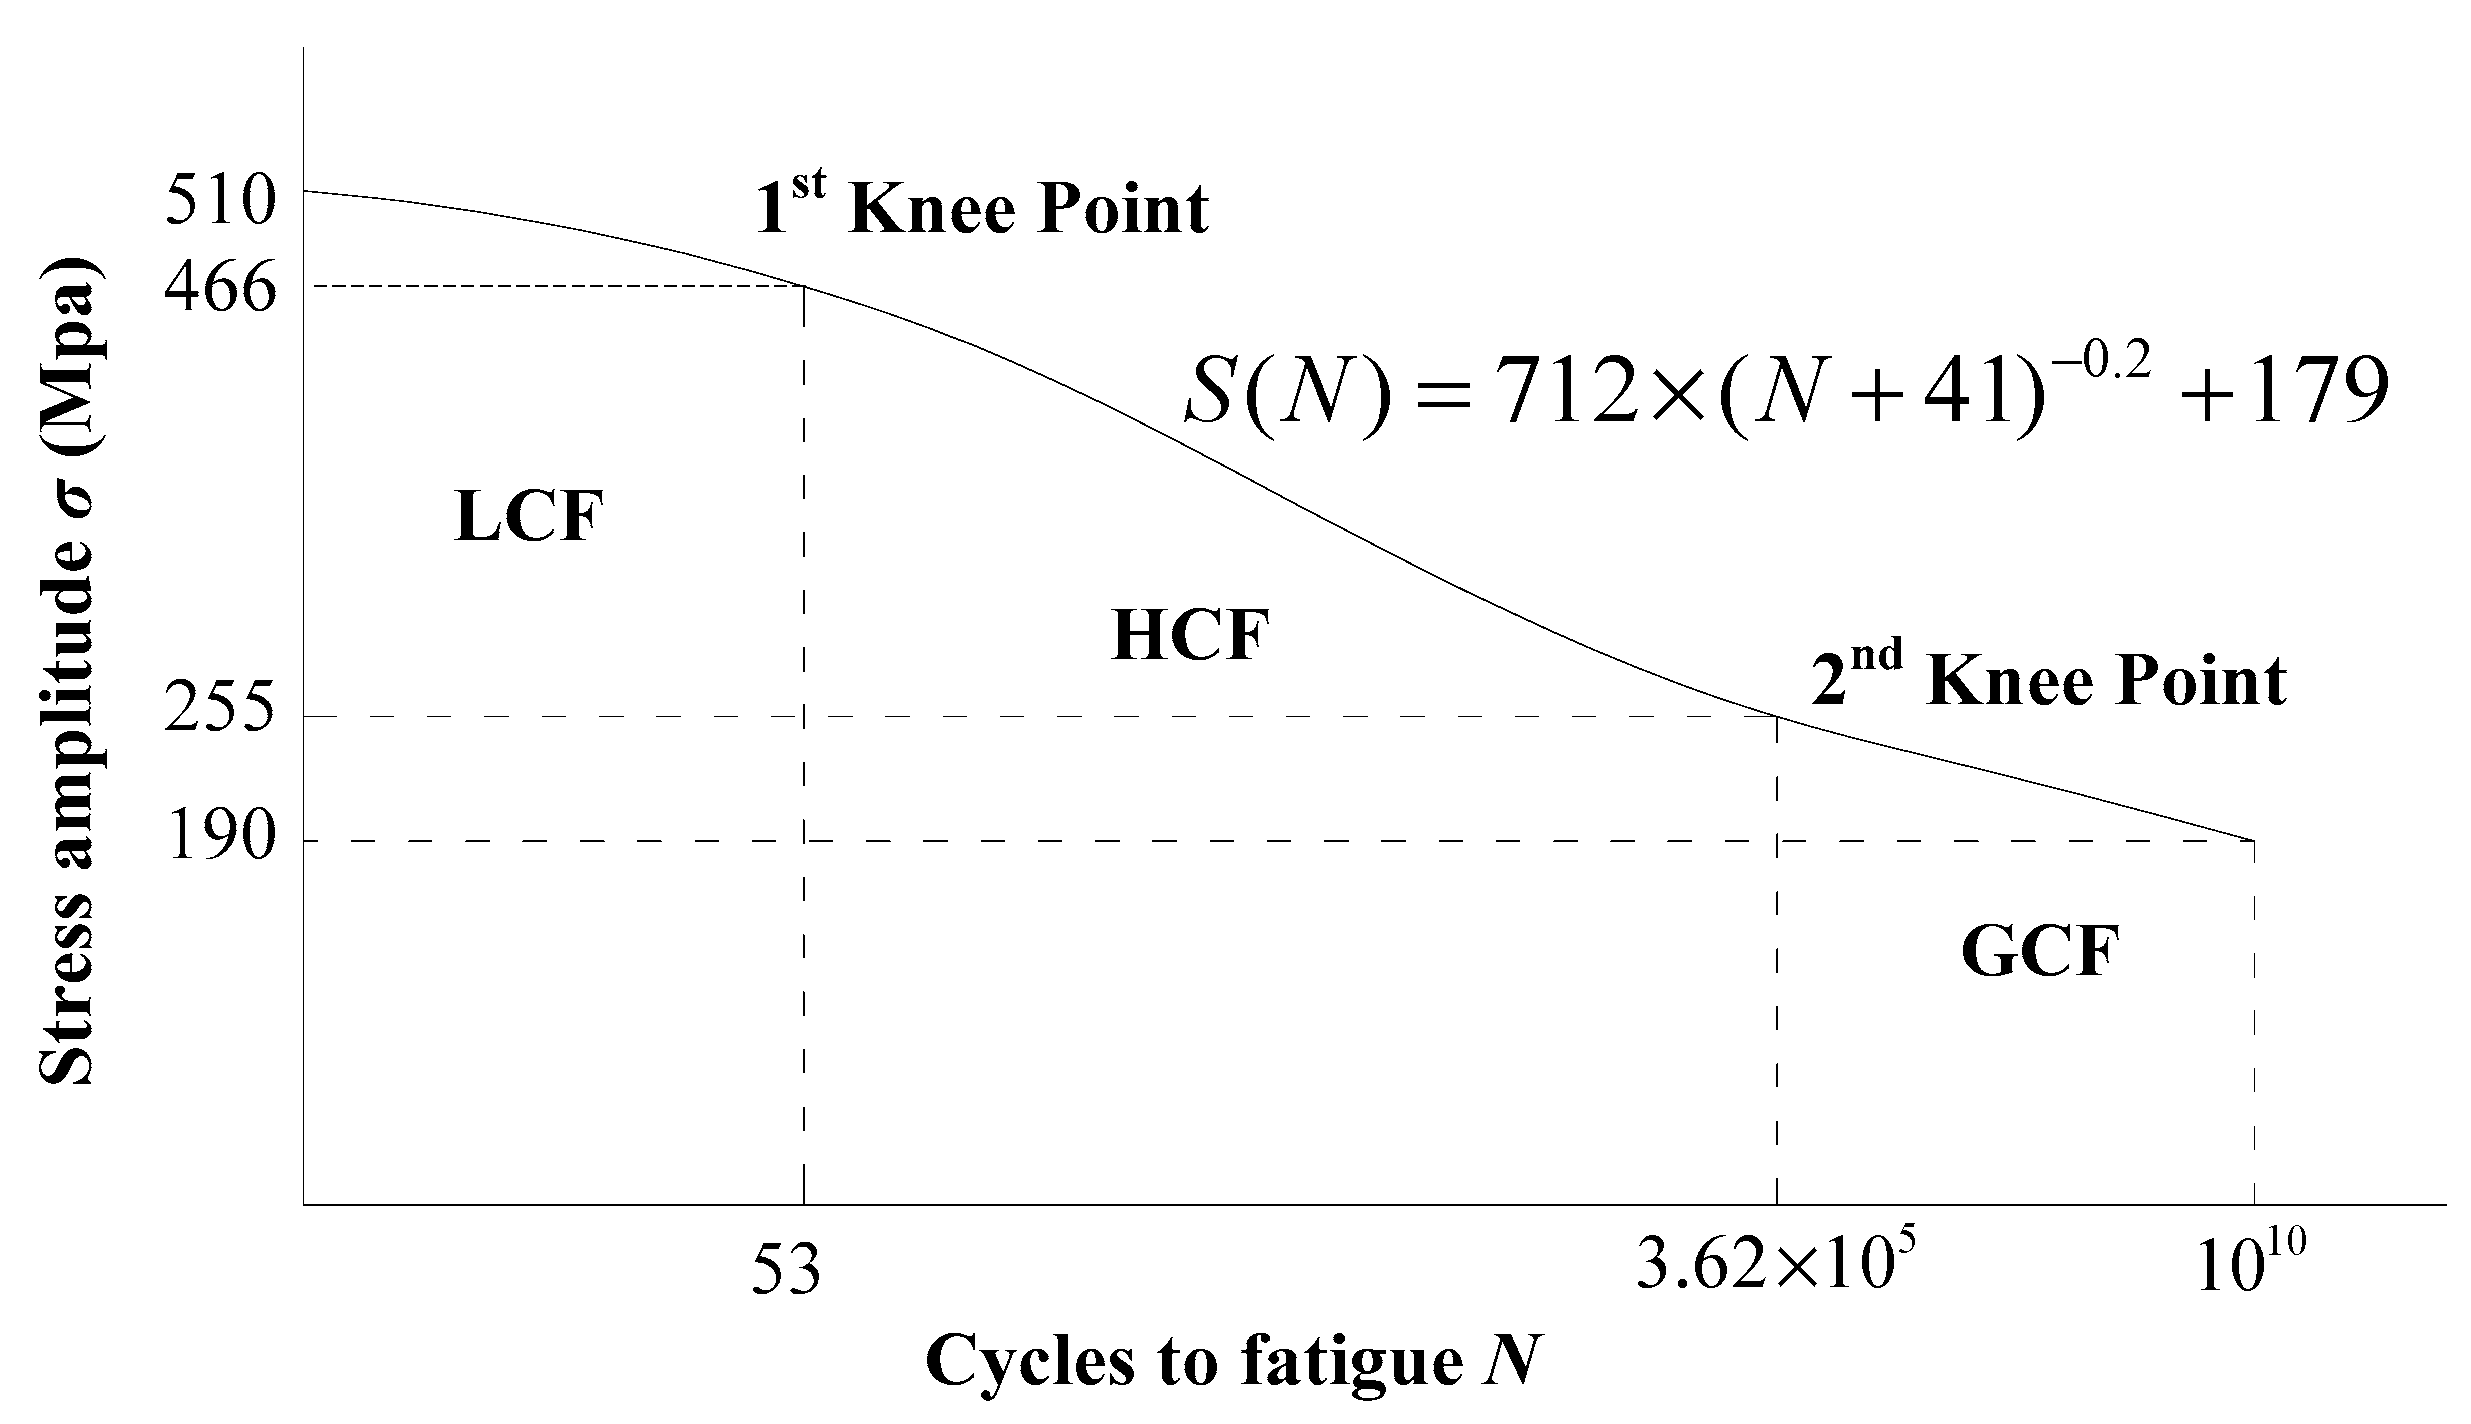
2.3. Fatigue Strength S–N Curves Considering Weld-Induced Residual Stress and Its Relaxation
3. Fatigue Damage Considering Weld-Induced Residual Stress and Its Relaxation Under Typical Vehicle Loadings
3.1. The Welding Residual Stress Relaxation Effect of Welded Joints Under Typical Vehicle Loadings
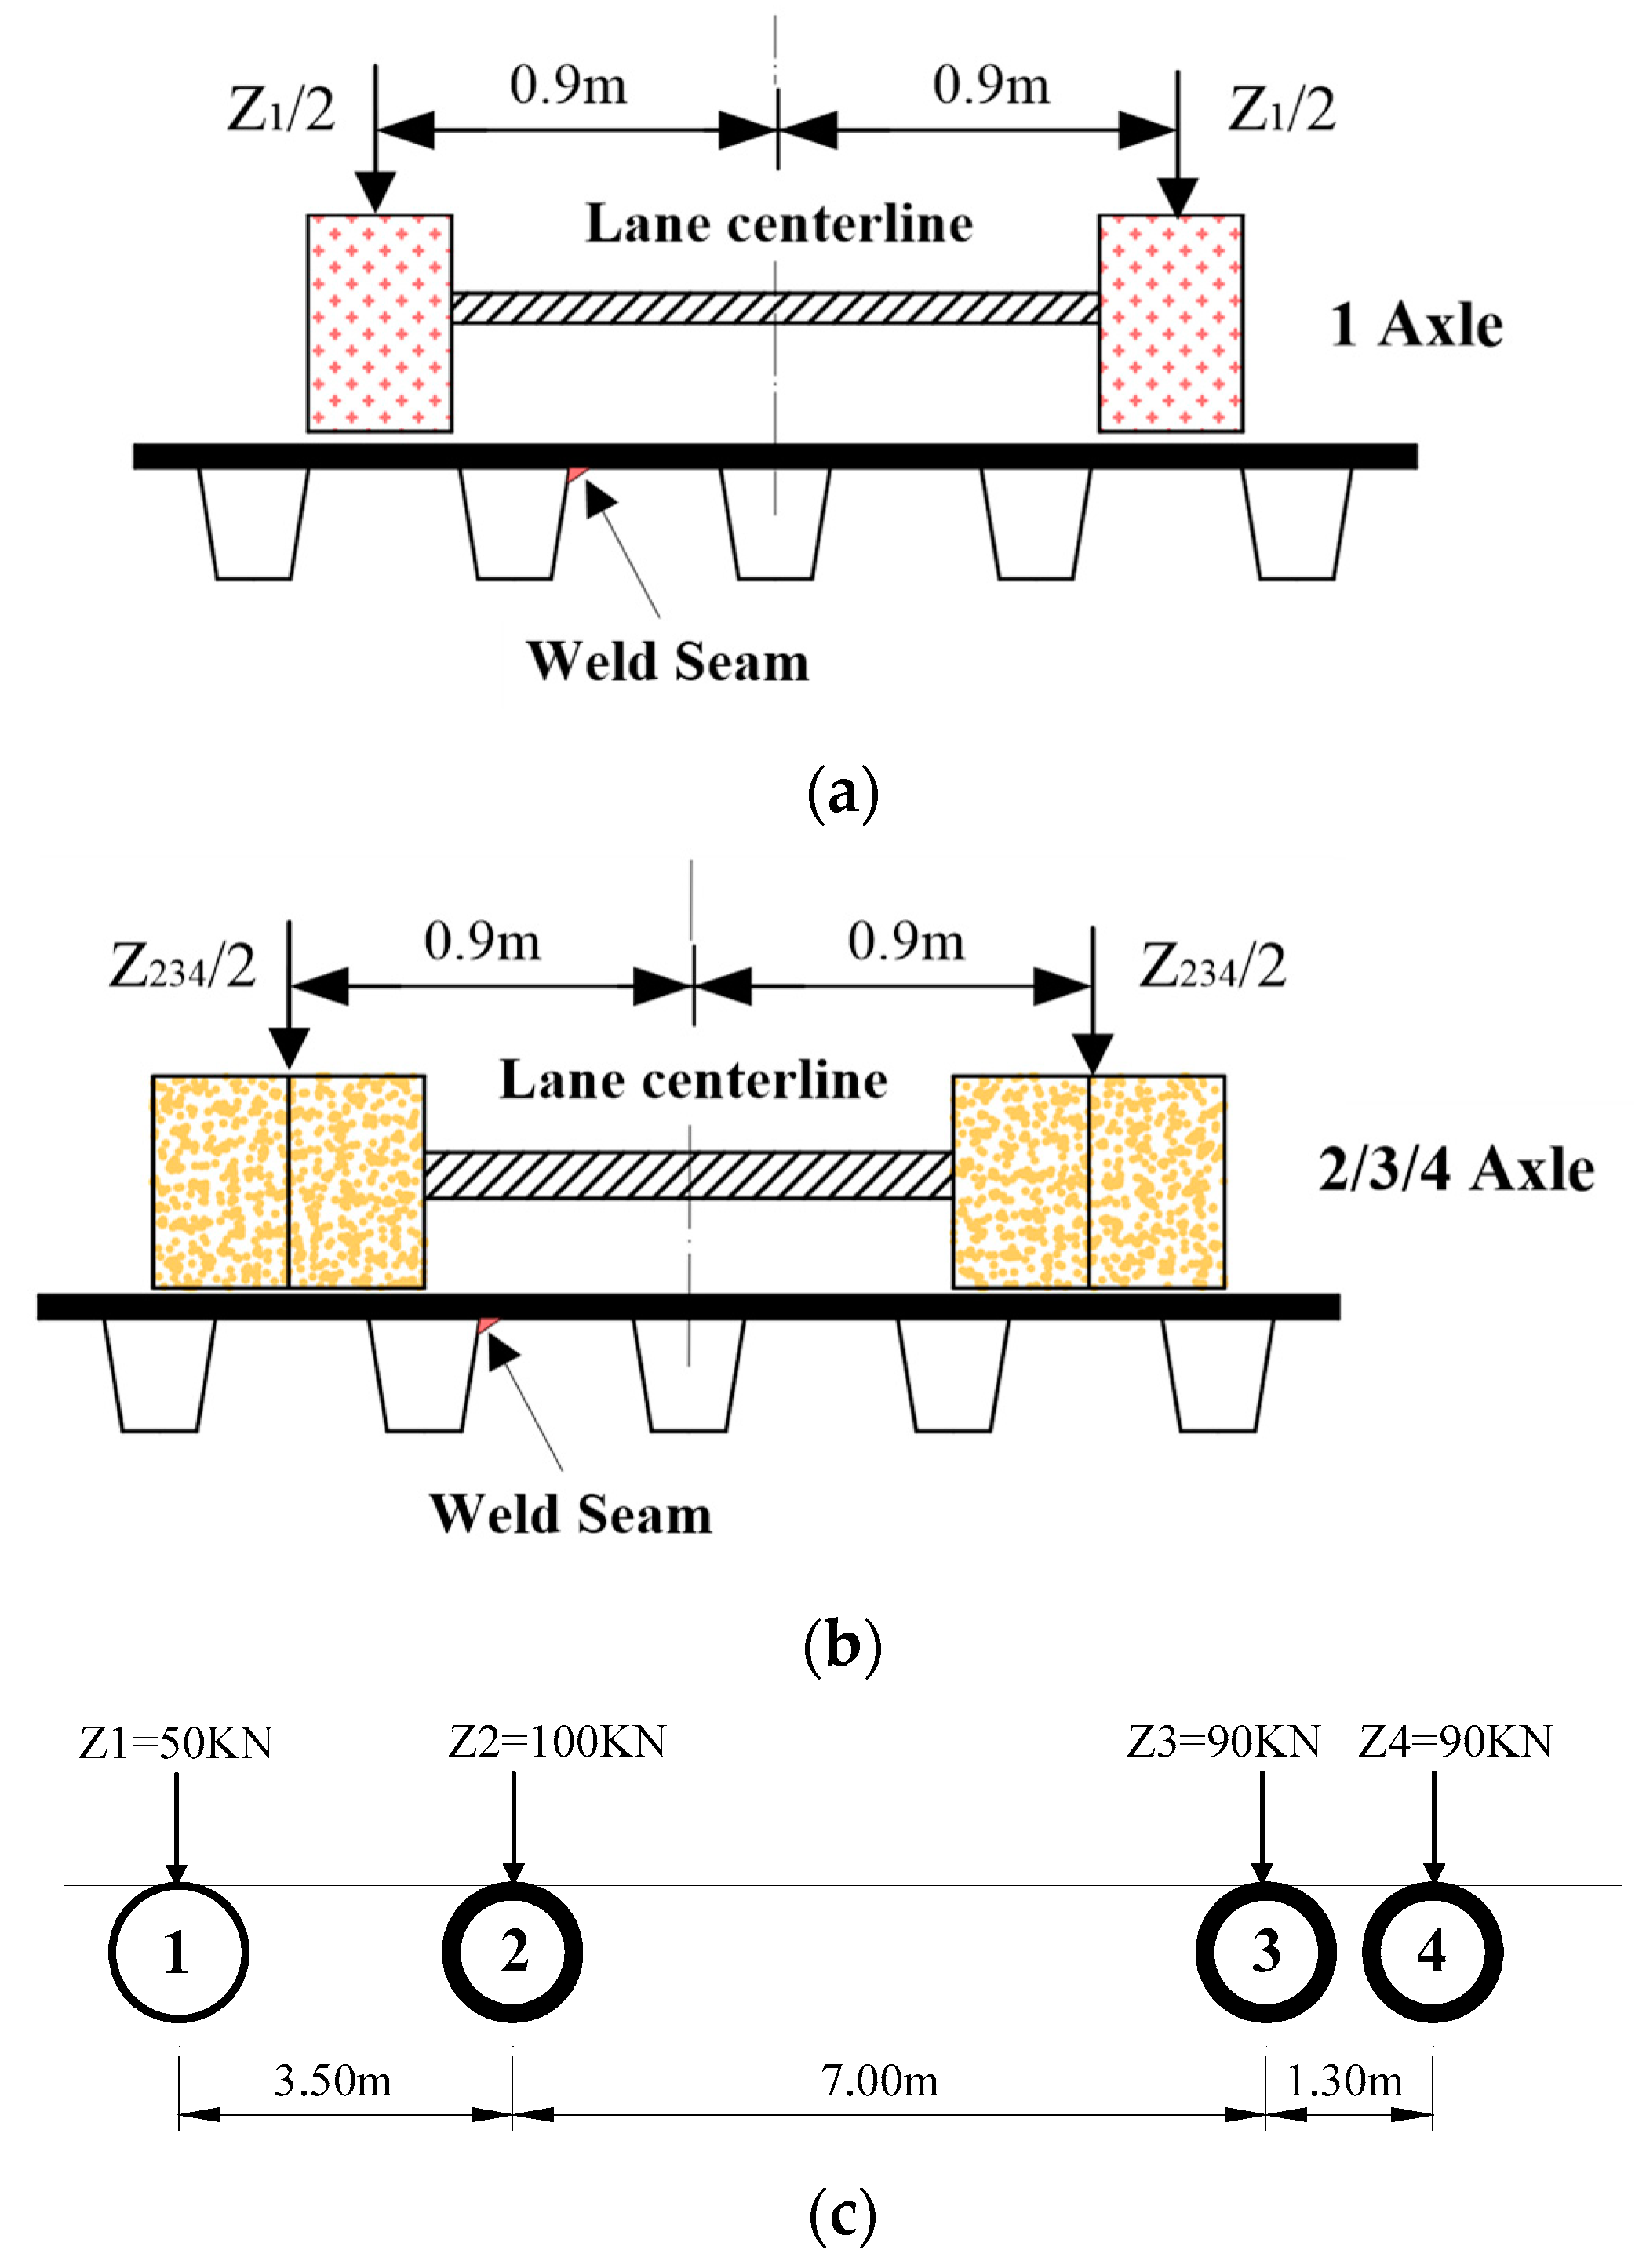
3.1.1. Fatigue Vehicle Load
3.1.2. The True Stress Time–History Curve Under Tension/Compressive Stress Working Conditions
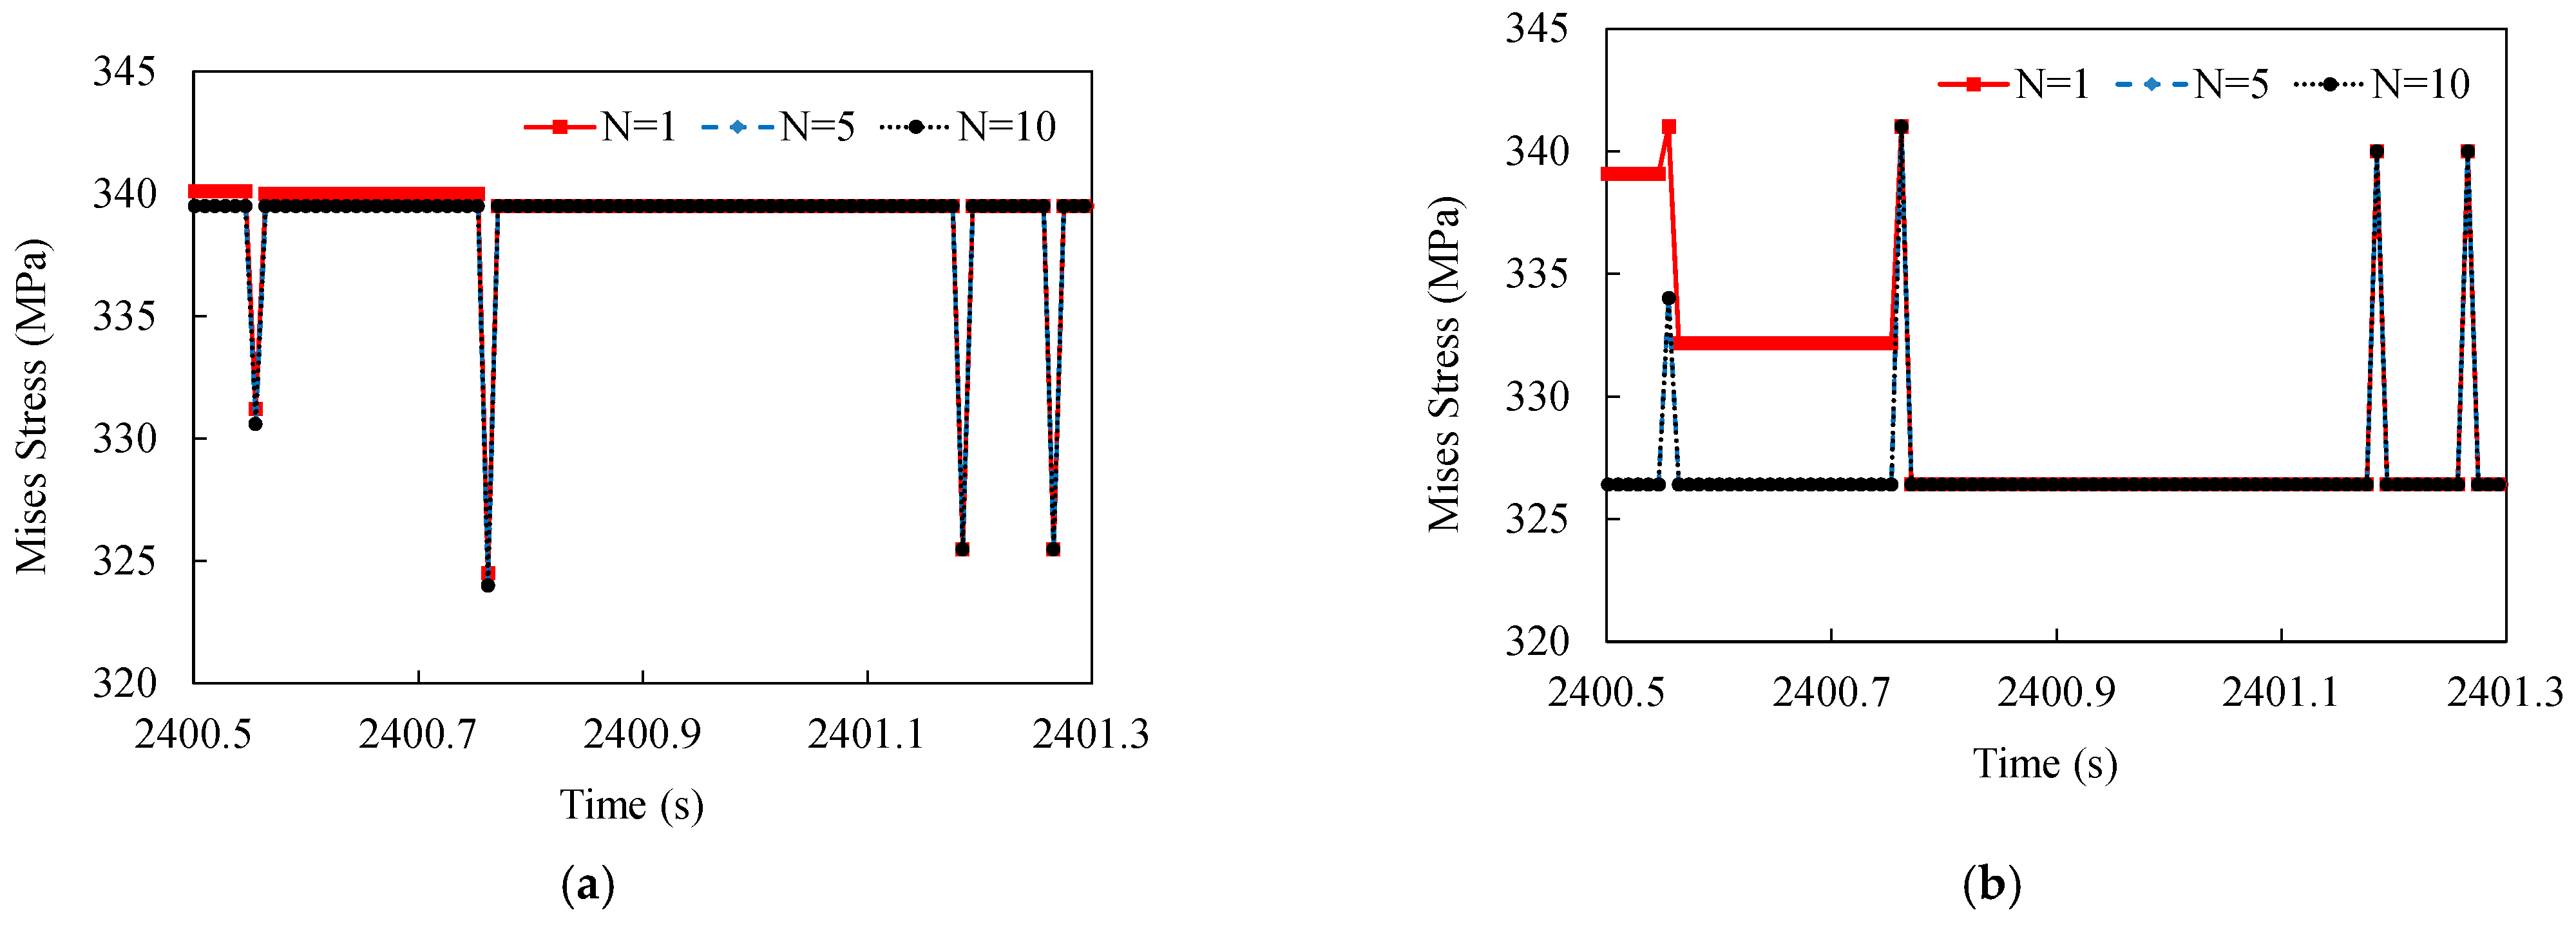
3.2. The Fatigue Damage Results of Welded Joints Considering Weld-Induced Residual Stress and Its Relaxation
4. Fatigue Life Prediction Considering Variations in Traffic Loads
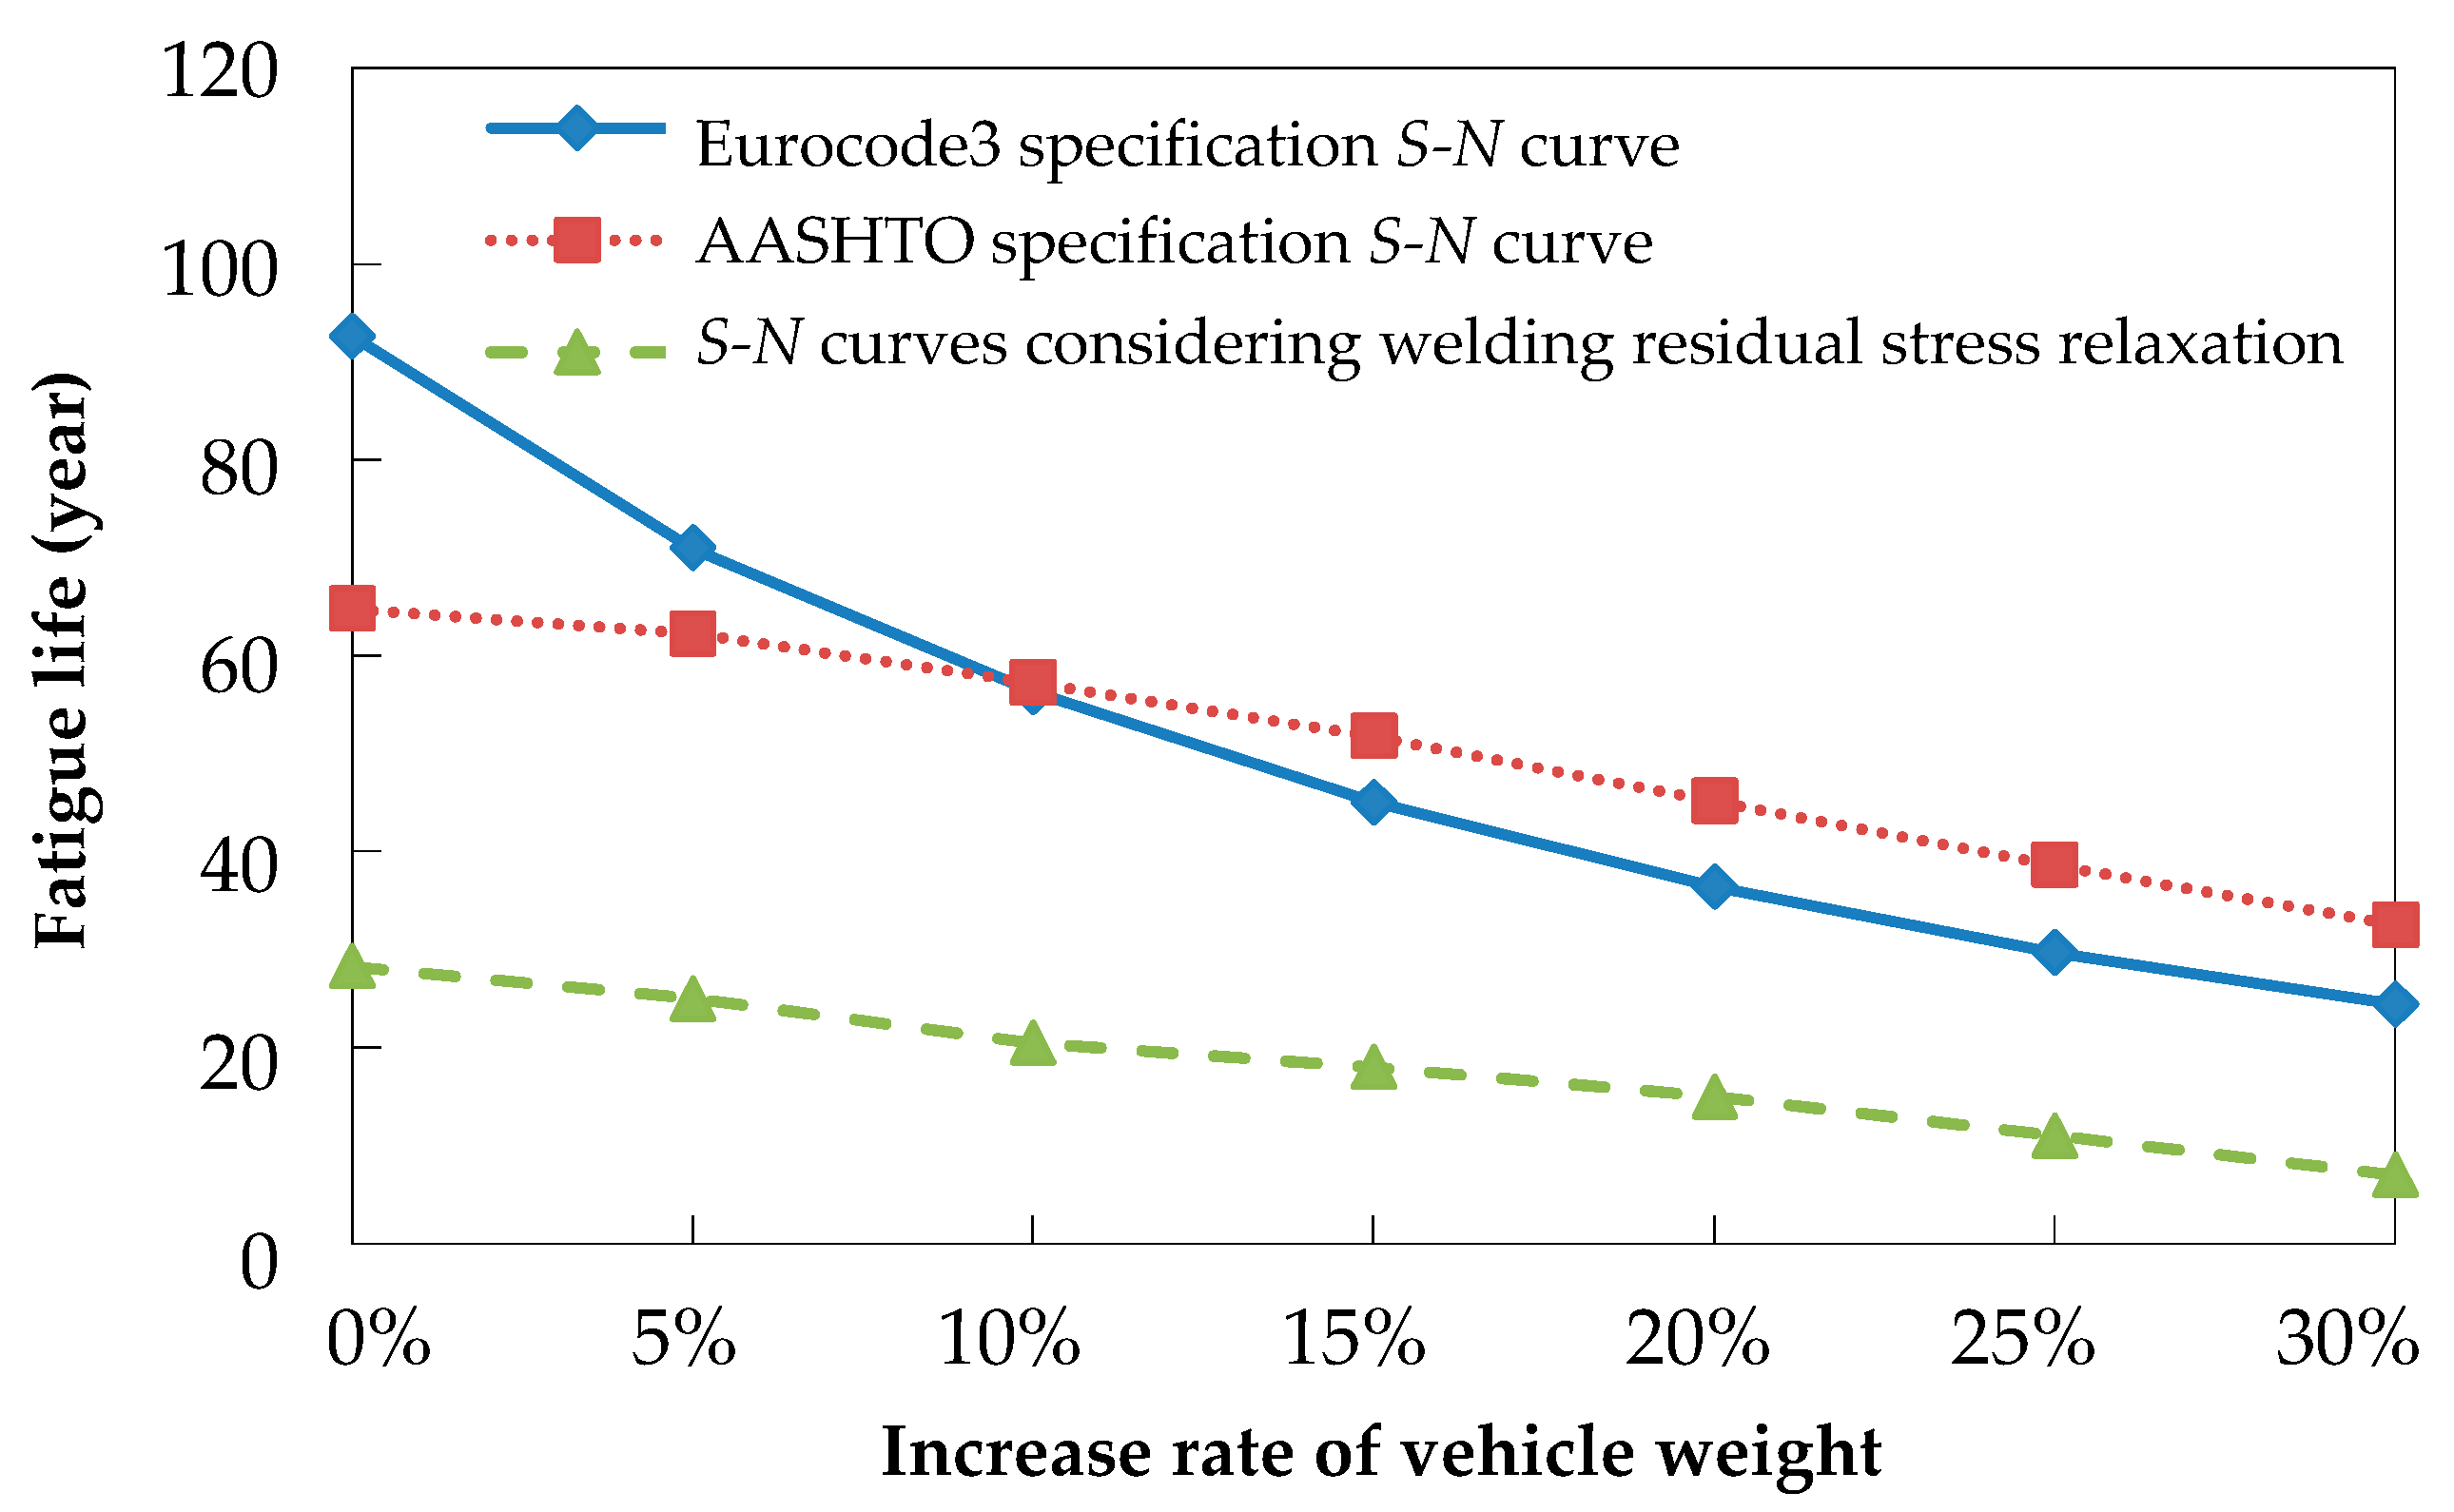
4.1. Influence of Vehicle Weight Increase on Fatigue Life
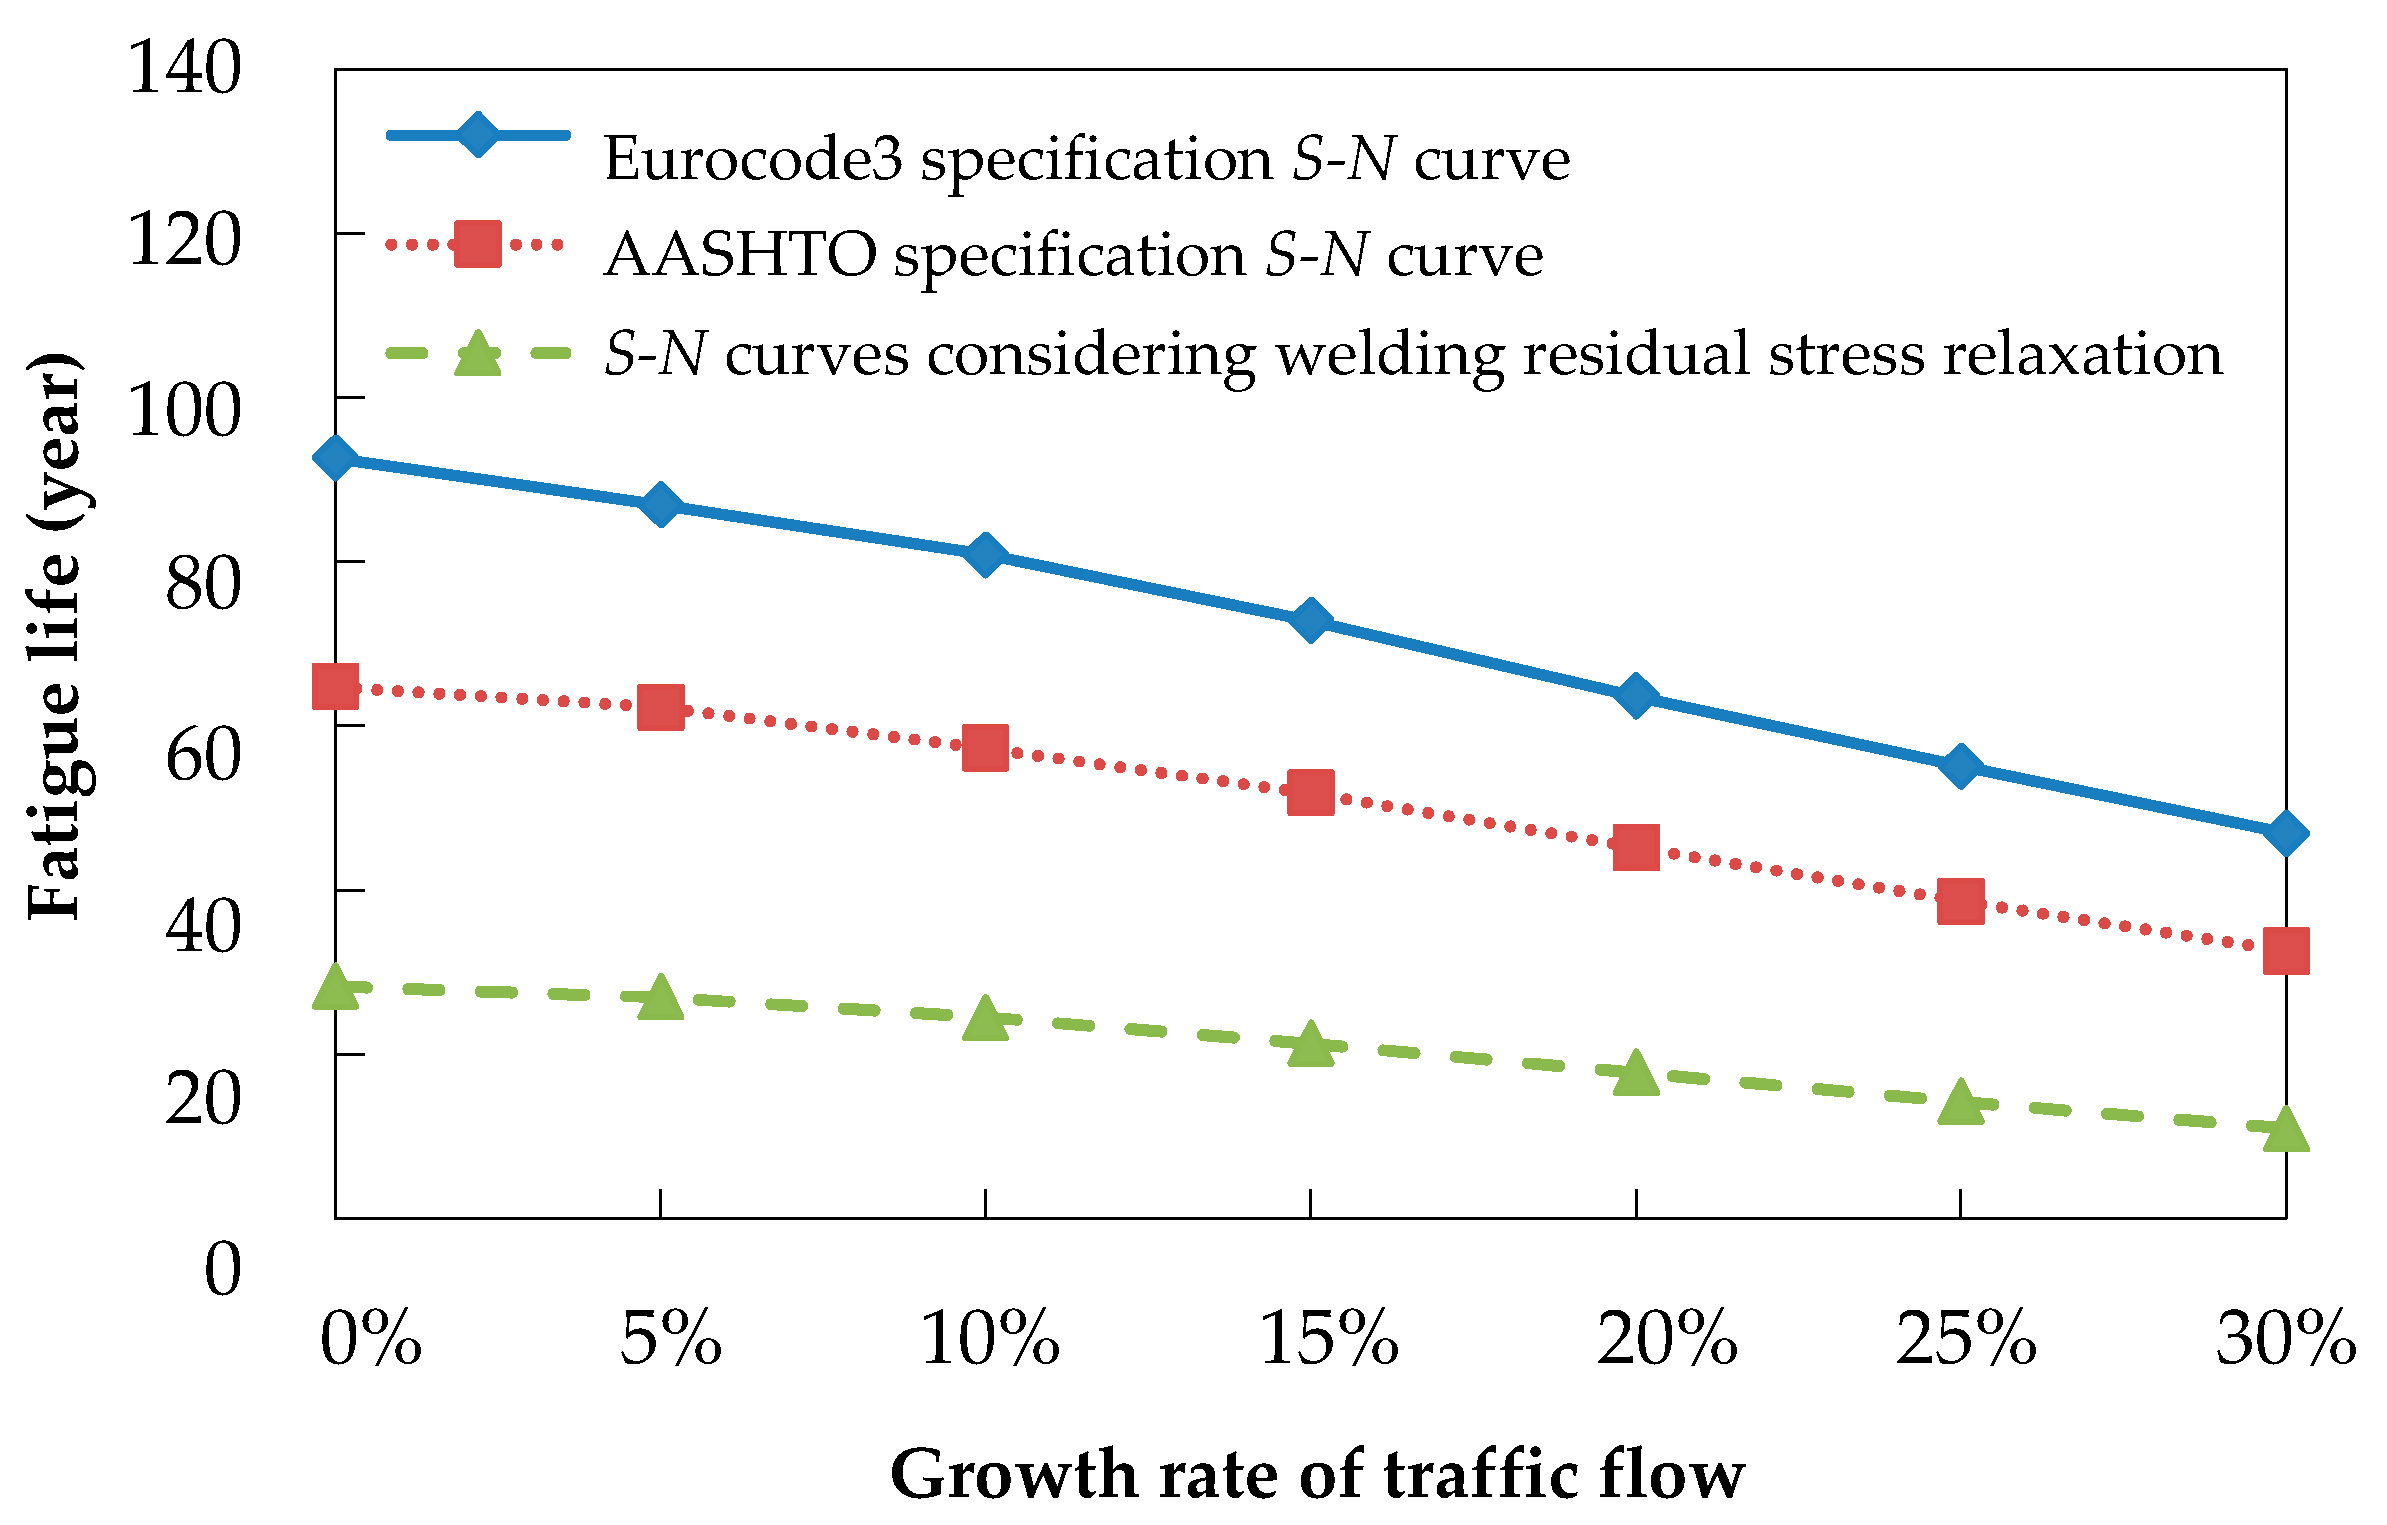
4.2. Influence of Traffic Flow Growth on Fatigue Life
5. Conclusions
- (1)
- The state of tension or compression in vehicle load stress notably impacts the residual stress relaxation effect observed in welded joints. When subjected to compressive stress working conditions (CC), the relaxation phenomenon at the weld position is minimal. However, when exposed to tensile stress working conditions (TC), the relaxation magnitude of the von Mises stress amounts to 81.2% of the average vehicle load stress value, indicating the notable impact of relaxation.
- (2)
- The welding residual stress and its relaxation effect alter the stress ratio (R) when subjected to vehicle load stress, thereby influencing the fatigue life of welded joints. For instance, the transverse stress ratio R transitions from negative infinity to positive under CC conditions, resulting in a shift from a compressive to a tensile fatigue stress state. Conversely, the mean stress (σm) at the weld position significantly rises under TC conditions, leading to non-zero fatigue damage and a reduction in fatigue life from infinite to finite.
- (3)
- Under TC conditions, the fatigue damage determined using the S–N curves from the Eurocode 3 and AASHTO specifications indicates an infinite lifespan. However, when calculated using the S–N curves considering weld-induced residual stress and its relaxation, the results align with the order of magnitude observed under CC conditions.
- (4)
- Based on traffic data from Jiangyin Bridge, the fatigue life of deck-to-rib welding details is 28.26 years, calculated using the method considering the impact of welding residual stress relaxation proposed in this paper. Moreover, when the vehicle weight increases by 30%, the fatigue life significantly drops to just 9.25 years. Similarly, a 30% increase in the traffic volume leads to a fatigue life of 12.13 years. These assessment results demonstrate the accuracy of the fatigue assessment method described in this paper, which accurately determined a value close to the monitored fatigue cracking life of Jiangyin Bridge, i.e., approximately 9 years.
Author Contributions
Funding
Data Availability Statement
Conflicts of Interest
References
- Zhu, A.Z.; Ouyang, S.J.; Chen, Y.K.; Sun, Y. Fatigue test and life evaluation of rib-to-deck connections in orthotropic steel bridge decks. J. Constr. Steel Res. 2022, 197, 107442. [Google Scholar] [CrossRef]
- Ruan, X.; Zhang, Y.H.; Jin, Z.R.; Wang, Q.D. Dynamic Vehicle Model for Accommodating Fatigue Based on Axle Load Effects in Orthotropic Steel Bridge Decks. J. Bridge Eng. 2025, 30, 04025002. [Google Scholar] [CrossRef]
- Liao, X.W.; Wei, H.L.; Pan, H.Y.; Li, H.-T.; Sun, B.; Xin, H.H. Fatigue resistance of rib-to-bimetallic steel deck welded joints in orthotropic steel bridge decks. Thin-Walled Struct. 2024, 194, 111318. [Google Scholar] [CrossRef]
- Chen, Y.J.; Lin, Y.Z.; Zong, Z.H.; Wan, S.Y.; Liu, G.; Chen, S.Y. Fatigue performance of innovative open-rib orthotropic steel deck for super-long suspension bridge. J. Constr. Steel Res. 2024, 222, 108984. [Google Scholar] [CrossRef]
- Song, Y.S.; Ding, Y.L.; Wang, G.X.; Li, A.Q. Fatigue-life evaluation of a high-speed railway bridge with an orthotropic steel deck integrating multiple factors. J. Perform. Constr. Facil. 2016, 30, 04016036. [Google Scholar] [CrossRef]
- Cheng, X.H.; Fisher, J.W.; Prask, H.J.; Gnäupel-Herold, T.; Yen, B.T.; Roy, S. Residual stress modification by post-weld treatment and its beneficial effect on fatigue strength of welded structures. Int. J. Fatigue 2003, 25, 1259–1269. [Google Scholar] [CrossRef]
- Cui, C.; Bu, Y.Z.; Bao, Y. Strain energy-based fatigue life evaluation of deck-to-rib welded joints in OSD considering combined effects of stochastic traffic load and welded residual stress. J. Bridge Eng. 2017, 23, 04017127. [Google Scholar] [CrossRef]
- Gales, C.; Conle, A.; Pineault, J. Relaxation of residual stress in welded plates during long life fatigue loading. Int. J. Fatigue 2024, 189, 108568. [Google Scholar] [CrossRef]
- Liu, Y.; Tsang, K.S.; Subramaniam, N.A.; Pang, J.H.L. Structural fatigue investigation of thermite welded rail joints considering weld-induced residual stress and stress relaxation by cyclic load. Eng. Struct. 2022, 235, 112033. [Google Scholar] [CrossRef]
- EN 1993-2; Eurocode 3—Design of Steel Structures—Part 2: Steel Bridges. CEN: Brussels, Belgium, 2012.
- American Association of State Highway and Transportation of Officials. LRFD Bridge Design Specifications, 3rd ed.; AASHTO: Washington, DC, USA, 2012. [Google Scholar]
- Ministry of Transport of the People’s Republic of China. Specifications for Design of Highway Steel Bridge; China Communications Press: Beijing, China, 2015.
- Zhang, W.Y.; Jiang, W.C.; Zhao, X.; Tu, S.-T. Fatigue life of a dissimilar welded joint considering the weld residual stress: Experimental and finite element simulation. Int. J. Fatigue 2018, 109, 182–190. [Google Scholar] [CrossRef]
- Bandara, C.S.; Siriwardane, S.C.; Dissanayake, U.I.; Dissanayake, R. Developing a full range S–N curve and estimating cumulative fatigue damage of steel elements. Comput. Mater. Sci. 2015, 96, 96–101. [Google Scholar] [CrossRef]
- Syahroni, N.; Berge, S. Fatigue Assessment of Welded Joints Taking into Account Effects of Residual Stress. J. Offshore Mech. Arct. Eng. 2012, 134, 021405. [Google Scholar] [CrossRef]
- Campbell, F.C. Fatigue and Fracture: Understanding the Basics; Materials Park, ASM International: Washington, DC, USA, 2012; Chapter 5; pp. 147–202. [Google Scholar]
- Kollár, D.; Völgyi, I.; Joó, A.L. Development of residual stress model of orthotropic steel decks using measurements. Structures 2023, 58, 105601. [Google Scholar] [CrossRef]
- Zhang, Q.H.; Ma, Y.; Cui, C.; Chai, X.-Y.; Han, S.-H. Experimental investigation and numerical simulation on welding residual stress of innovative double-side welded rib-to-deck joints of orthotropic steel decks. J. Constr. Steel Res. 2021, 179, 106544. [Google Scholar] [CrossRef]
- He, Y.; Ma, Y.F.; Huang, K.; Wang, L.; Zhang, J.R. Digital twin Bayesian entropy framework for corrosion fatigue life prediction and calibration of bridge suspender. Reliab. Eng. Syst. Saf. 2024, 252, 110456. [Google Scholar] [CrossRef]
- Peng, A.Y.; Ma, Y.F.; Huang, K.; Wang, L. Digital twin-driven framework for fatigue life prediction of welded structures considering residual stress. Int. J. Fatigue 2024, 181, 108144. [Google Scholar] [CrossRef]
- Li, L.B.; Zhang, J.X.; Zhang, Y.W.; Wan, Z.Q.; Li, Y.Q. Residual Stress Release and Its Effects on the Fatigue Strength of Typical Welded Joints in Cone-Cylinder Pressure Structures. Appl. Ocean Res. 2021, 111, 102673. [Google Scholar] [CrossRef]
- Li, L.B.; Jia, Q.Q.; Wan, Z.Q.; Zhang, Y.W.; Qian, P.; Li, J.C. Experimental and numerical investigation of effects of residual stress and its release on fatigue strength of typical FPSO-unit welded joint. Ocean Eng. 2020, 196, 106858. [Google Scholar] [CrossRef]
- Lee, C.H.; Chang, K.H.; Van Do, V.N. Finite element modeling of residual stress relaxation in steel butt welds under cyclic loading. Eng. Struct. 2015, 103, 63–71. [Google Scholar] [CrossRef]
- Cui, C.; Zhang, Q.H.; Bao, Y.; Han, S.H.; Bu, Y.Z. Residual stress relaxation at innovative both-side welded rib-to-deck joints under cyclic loading. J. Constr. Steel Res. 2019, 156, 9–17. [Google Scholar] [CrossRef]
- Sepe, R.; De Luca, A.; Greco, A.; Armentani, E. Numerical evaluation of temperature fields and residual stresses in butt weld joints and comparison with experimental measurements. Fatigue Fract. Eng. Mater. Struct. 2021, 44, 182–198. [Google Scholar] [CrossRef]
- Zhong, W.; Ding, Y.L.; Song, Y.S.; Geng, F.F.; Wang, Z.W. Residual Stress Relaxation of DRWDs in OSDs under Constant/Variable Amplitude Cyclic Loading. Appl. Sci. 2021, 11, 253. [Google Scholar] [CrossRef]
- Zhao, Q.; Wu, C. Numerical Analysis of Welding Residual Stress of U-rib Stiffened Plate. Eng. Mech. 2012, 29, 262–268. (In Chinese) [Google Scholar]
- Gu, Y. Research on Welding Residual Stresses and Deformations in Steel Bridge Deck Stiffened with U-Shaped Ribs. Ph.D. Thesis, Southwest Jiaotong University, Chengdu, China, 2011. (In Chinese). [Google Scholar]
- Mesmacque, G.; Garcia, S.; Amrouche, A.; Rubio-Gonzalez, C. Sequential law in multiaxial fatigue, a new damage indicator. Int. J. Fatigue 2005, 27, 461–467. [Google Scholar] [CrossRef]
- Ding, Y.L.; Song, Y.S.; Cao, B.Y.; Wang, G.X.; Li, A.Q. Full-range S-N fatigue-life evaluation method for welded bridge structures considering hot-spot and welding residual stress. J. Bridge Eng. 2016, 21, 04016096. [Google Scholar] [CrossRef]
- Nishijima, S. Basic Fatigue Properties of JIS Steels for Machine Structural Use; NRIM Special Report No. SR 93-02; National Research Institute for Metals: Tokyo, Japan, 1993. [Google Scholar]
- Lopez-Jauregi, A.; Esnaola, J.A.; Ulacia, I.; Urrutibeascoa, I.; Madariaga, A. Fatigue analysis of multipass welded joints considering residual stresses. Int. J. Fatigue 2015, 79, 75–85. [Google Scholar] [CrossRef]
- Kumbhar, S.V.; Tayade, R.M. A case study on effect of mean stress on fatigue life. Int. J. Eng. Res. 2014, 2, 304–309. [Google Scholar]
- CCCC Highway Consultants Co., Ltd.; China Academy of Railway Sciences. Guidelines for Design and Maintain of Orthotropic Steel Deck; China Railway Publishing House: Beijing, China, 2010. [Google Scholar]
- China Railway Major Bridge Reconnaissance and Design Institute Co., Ltd. TB 10091-2017 and Code for Design of Steel Structure of Railway Bridge; China Railway Publishing House: Beijing, China, 2017. [Google Scholar]
- Liu, Y.; Xiao, X.H.; Lu, N.W.; Deng, Y. Fatigue Reliability Assessment of Orthotropic Bridge Decks under Stochastic Truck Loading. Shock Vib. 2016, 2016, 4712593. [Google Scholar] [CrossRef]
- Fu, H.W.; Zhou, X.H.; Zhou, Q.S.; Xiang, P.; Zhou, Z.B.; Fu, Q. An Improved Model for Design Fatigue Load of Highway Bridges Considering Damage Equivalence. Buildings 2022, 12, 217. [Google Scholar] [CrossRef]
- Juan, F.Y.; Wu, H. Vehicle load simulation for long-span bridge based on merging real monitored data and cellular automat on model. J. Railw. Sci. Eng. 2014, 11, 14–18. (In Chinese) [Google Scholar]
- Deng, Y.; Ding, Y.L.; Li, A.Q.; Zhou, G.D. Fatigue reliability assessment for bridge welded details using long-term monitoring data. Sci. China Technol. Sci. 2011, 54, 3371–3381. [Google Scholar] [CrossRef]
- Deng, L.; Nie, L.; Zhong, W.J.; Wang, W. Developing Fatigue Vehicle Models for Bridge Fatigue Assessment under Different Traffic Conditions. J. Bridge Eng. 2021, 26, 04020122. [Google Scholar] [CrossRef]
- Peng, X.; Wang, K.; Yang, Q.; Xu, B.; Di, J. Fatigue load model of orthotropic steel deck for port highway in China. Front. Mater. 2023, 10, 1–14. [Google Scholar] [CrossRef]
- Pan, Y.; Wang, D.; Dong, Y.Q. A Novel Vision-Based Framework for Identifying Dynamic Vehicle Loads on Long-Span Bridges: A Case Study of Jiangyin Bridge, China. IEEE Trans. Intell. Transp. Syst. 2022, 23, 10441–10457. [Google Scholar] [CrossRef]


| Working Condition | CC | TC | ||
|---|---|---|---|---|
| Stress | True stress amplitude σreal/Mpa | Only considering vehicle loadings | 73.86 | 20.52 |
| Considering welding residual stress and its relaxation effect | 67.68 | 14.92 | ||
| Mean stress σm/Mpa | Only considering vehicle loadings | −41.53 | 11.55 | |
| Considering welding residual stress and its relaxation effect | 172.8 | 249.51 | ||
| Equivalent stress amplitude Sa(R = −1)/Mpa | Only considering vehicle loadings | 65.92 | 21.23 | |
| Considering welding residual stress and its relaxation effect | 135.59 | 53.91 | ||
| Stress ratio R | Only considering vehicle loadings | −∞ | 0 | |
| Considering welding residual stress and its relaxation effect | 0.62~0.81 | 0.89~0.96 | ||
| Condition | Fatigue Design Curve | Stress Time-Course Curves | Fatigue Parameters | Number of Cycles | Fatigue Damage | ||
|---|---|---|---|---|---|---|---|
| CC | Eurocode 3 specification S–N curve | Figure 10a | 35.45 | −17.73 | 0.5 | 1.086 × 10⁹ | 4.0871 × 10⁻⁸ |
| 35.45 | −17.73 | 0.5 | 1.086 × 10⁹ | ||||
| 67.45 | −33.73 | 0.5 | 4.356 × 10⁷ | ||||
| 61.31 | −30.65 | 1 | 7.024 × 10⁷ | ||||
| 61.31 | −30.65 | 1 | 7.024 × 10⁷ | ||||
| 67.45 | −33.73 | 0.5 | 4.356 × 10⁷ | ||||
| AASHTO specification S–N curve | Figure 10a | 35.45 | −17.73 | 0.5 | 2.585 × 10⁹ | 5.7193 × 10⁻⁸ | |
| 35.45 | −17.73 | 0.5 | 2.585 × 10⁹ | ||||
| 67.45 | −33.73 | 0.5 | 3.753 × 10⁷ | ||||
| 61.31 | −30.65 | 1 | 4.999 × 10⁷ | ||||
| 61.31 | −30.65 | 1 | 4.999 × 10⁷ | ||||
| S–N curves considering weld-induced residual stress and its relaxation | Figure 11a | 4.39 | 335.59 | 1 | ∞ | 8.002 × 10⁻⁸ | |
| 7.26 | 331.95 | 1 | 4.341 × 10⁹ | ||||
| 7.71 | 332.30 | 0.5 | 6.888 × 10⁹ | ||||
| 7.36 | 331.86 | 0.5 | 2.915 × 10⁷ | ||||
| 7.36 | 331.86 | 0.5 | 2.916 × 10⁷ | ||||
| 7.36 | 331.86 | 0.5 | 2.934 × 10⁷ | ||||
| TC | Eurocode 3 specification S–N curve | Figure 10a | 9.53 | 4.77 | 0.5 | ∞ | 0 |
| 9.53 | 4.77 | 0.5 | ∞ | ||||
| 18.16 | 9.09 | 0.5 | ∞ | ||||
| 16.24 | 8.12 | 1 | ∞ | ||||
| 16.24 | 8.12 | 1 | ∞ | ||||
| 18.16 | 9.09 | 0.5 | ∞ | ||||
| AASHTO specification S–N curves | Figure 10a | 9.53 | 4.77 | 0.5 | ∞ | 0 | |
| 9.53 | 4.77 | 0.5 | ∞ | ||||
| 18.16 | 9.09 | 0.5 | ∞ | ||||
| 16.24 | 8.12 | 1 | ∞ | ||||
| 16.24 | 8.12 | 1 | ∞ | ||||
| 18.16 | 9.09 | 0.5 | ∞ | ||||
| S–N curves considering weld-induced residual stress and its relaxation | Figure 11b | 3.92 | 336.08 | 0.5 | ∞ | 1.316 × 10⁻⁸ | |
| 3.92 | 336.08 | 0.5 | ∞ | ||||
| 6.80 | 333.20 | 0.5 | 1.008 × 10⁸ | ||||
| 6.80 | 333.20 | 0.5 | 1.008 × 10⁸ | ||||
| 7.25 | 332.85 | 0.5 | 4.633 × 10⁸ | ||||
| 7.25 | 332.85 | 0.5 | 4.633 × 10⁸ | ||||
| 7.25 | 332.85 | 0.5 | 4.633 × 10⁸ | ||||
Disclaimer/Publisher’s Note: The statements, opinions and data contained in all publications are solely those of the individual author(s) and contributor(s) and not of MDPI and/or the editor(s). MDPI and/or the editor(s) disclaim responsibility for any injury to people or property resulting from any ideas, methods, instructions or products referred to in the content. |
© 2025 by the authors. Licensee MDPI, Basel, Switzerland. This article is an open access article distributed under the terms and conditions of the Creative Commons Attribution (CC BY) license (https://creativecommons.org/licenses/by/4.0/).
Share and Cite
Zhong, W.; Ding, Y.; Song, Y.; Liu, S.; Xu, M.; Wang, X. The Fatigue Life Prediction of Welded Joints in Orthotropic Steel Bridge Decks Considering Weld-Induced Residual Stress and Its Relaxation Under Vehicle Loads. Buildings 2025, 15, 1644. https://doi.org/10.3390/buildings15101644
Zhong W, Ding Y, Song Y, Liu S, Xu M, Wang X. The Fatigue Life Prediction of Welded Joints in Orthotropic Steel Bridge Decks Considering Weld-Induced Residual Stress and Its Relaxation Under Vehicle Loads. Buildings. 2025; 15(10):1644. https://doi.org/10.3390/buildings15101644
Chicago/Turabian StyleZhong, Wen, Youliang Ding, Yongsheng Song, Sumei Liu, Mengyao Xu, and Xin Wang. 2025. "The Fatigue Life Prediction of Welded Joints in Orthotropic Steel Bridge Decks Considering Weld-Induced Residual Stress and Its Relaxation Under Vehicle Loads" Buildings 15, no. 10: 1644. https://doi.org/10.3390/buildings15101644
APA StyleZhong, W., Ding, Y., Song, Y., Liu, S., Xu, M., & Wang, X. (2025). The Fatigue Life Prediction of Welded Joints in Orthotropic Steel Bridge Decks Considering Weld-Induced Residual Stress and Its Relaxation Under Vehicle Loads. Buildings, 15(10), 1644. https://doi.org/10.3390/buildings15101644