
Axial Tensile Experiment of the Lap-Type Asymmetric K-Shaped Square Tubular Joints with Built-In Stiffeners

Abstract
1. Introduction
2. Materials and Methods
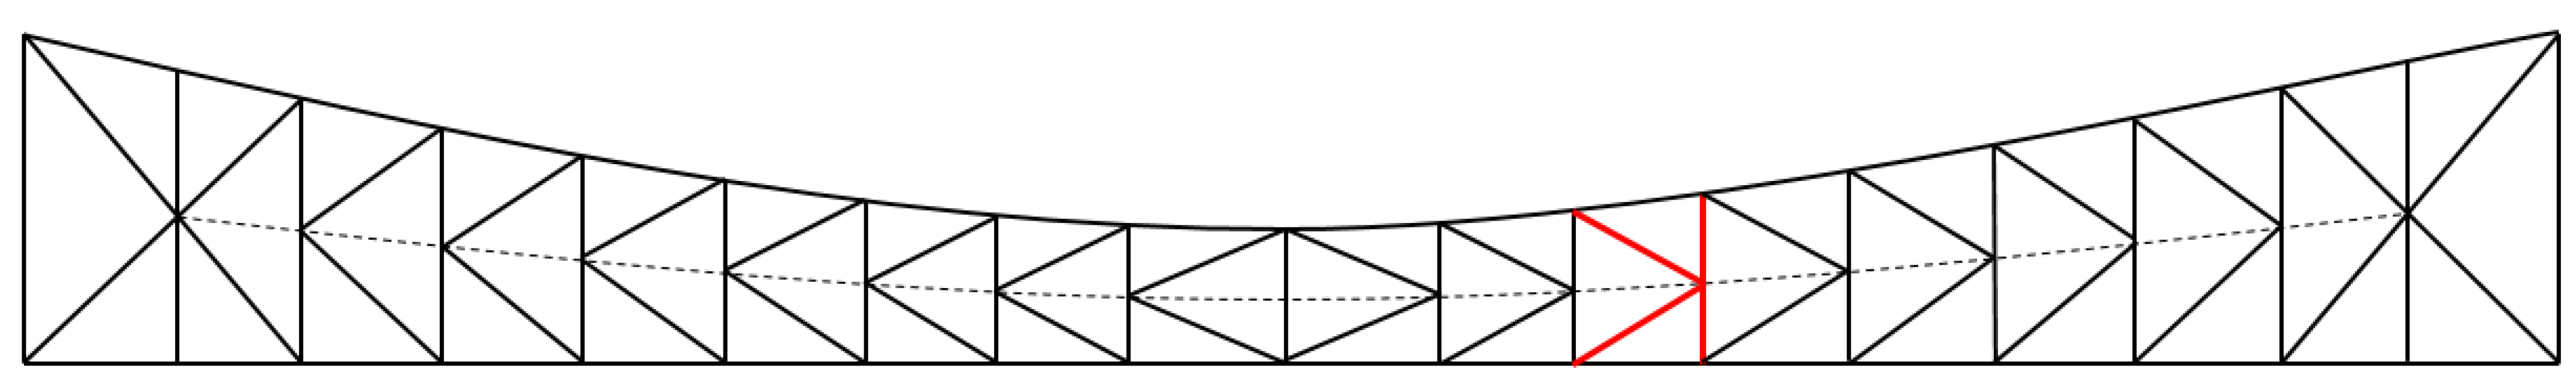
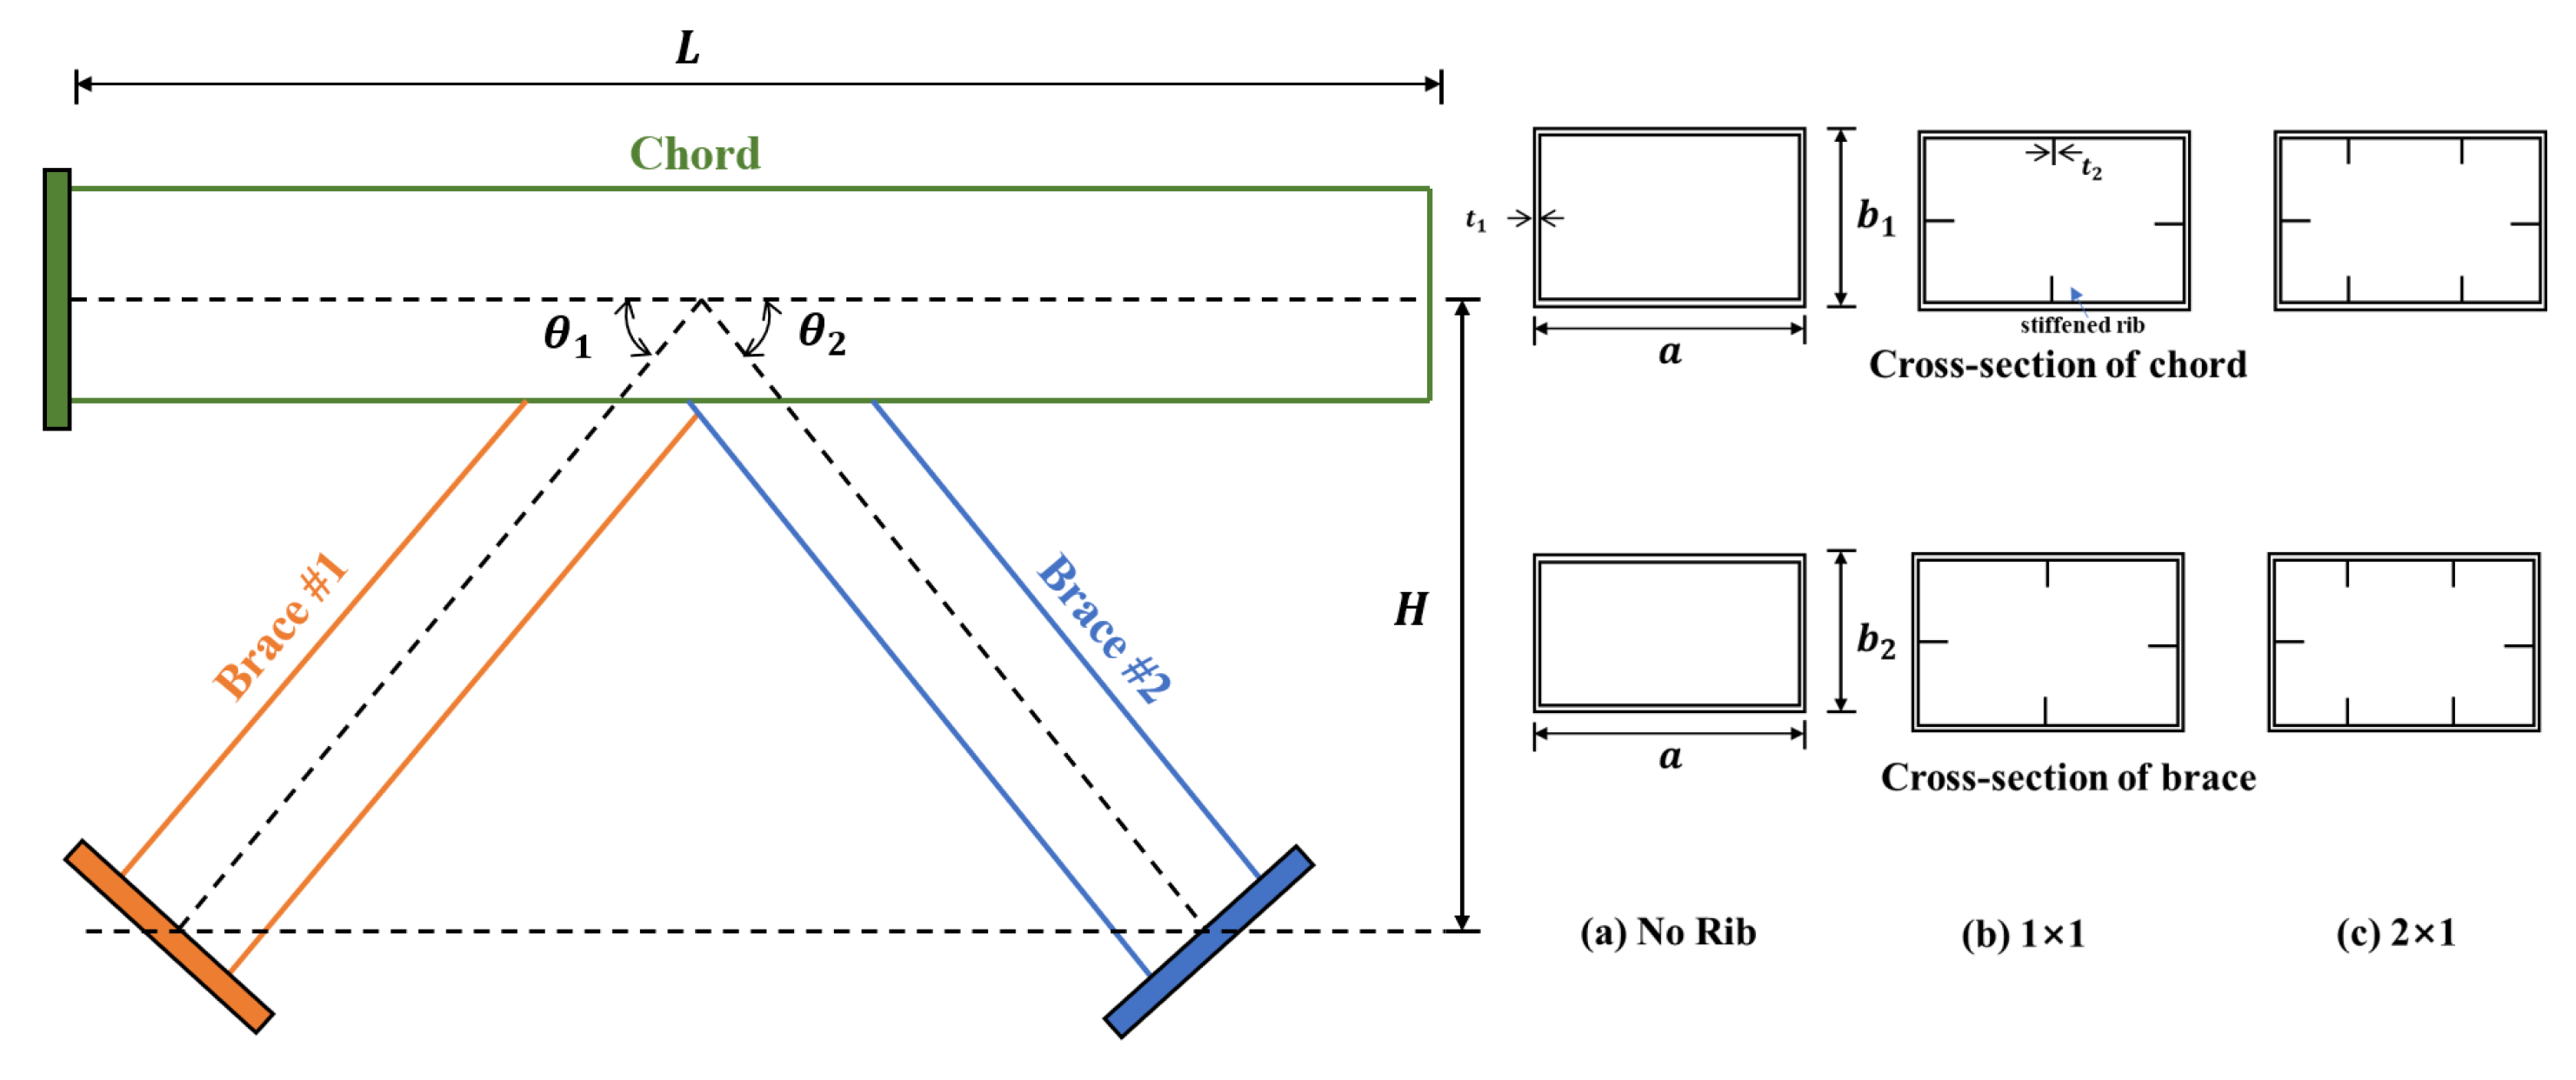
2.1. Test Specimen
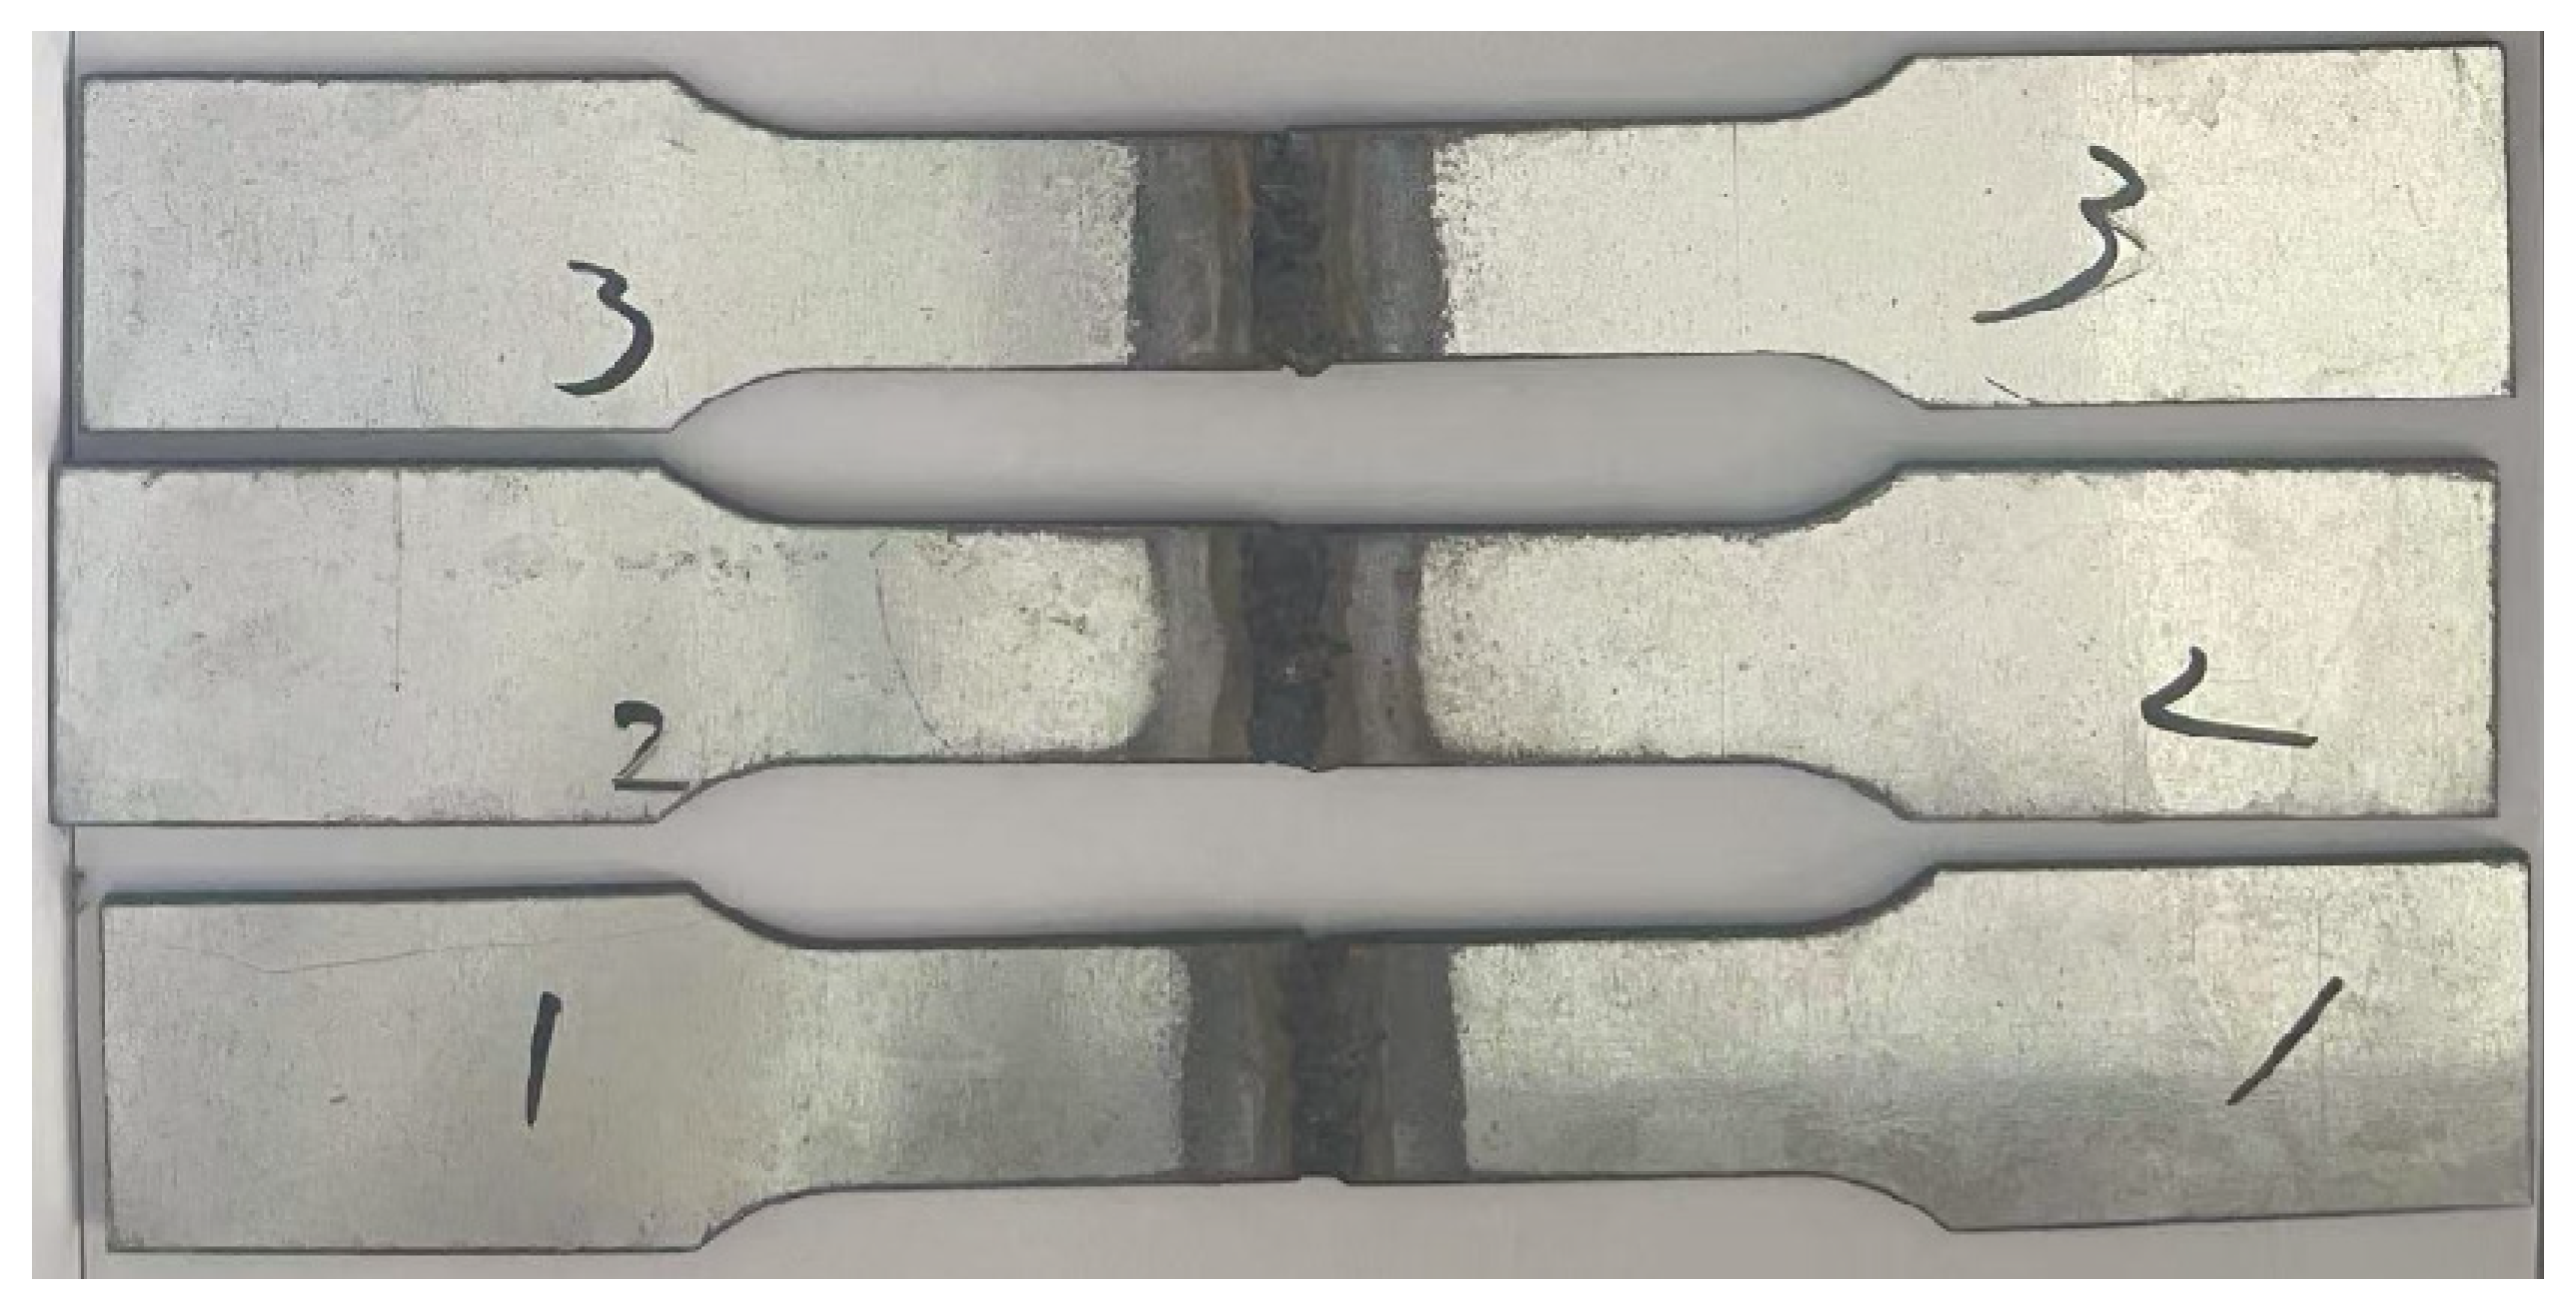
2.2. Raw Materials
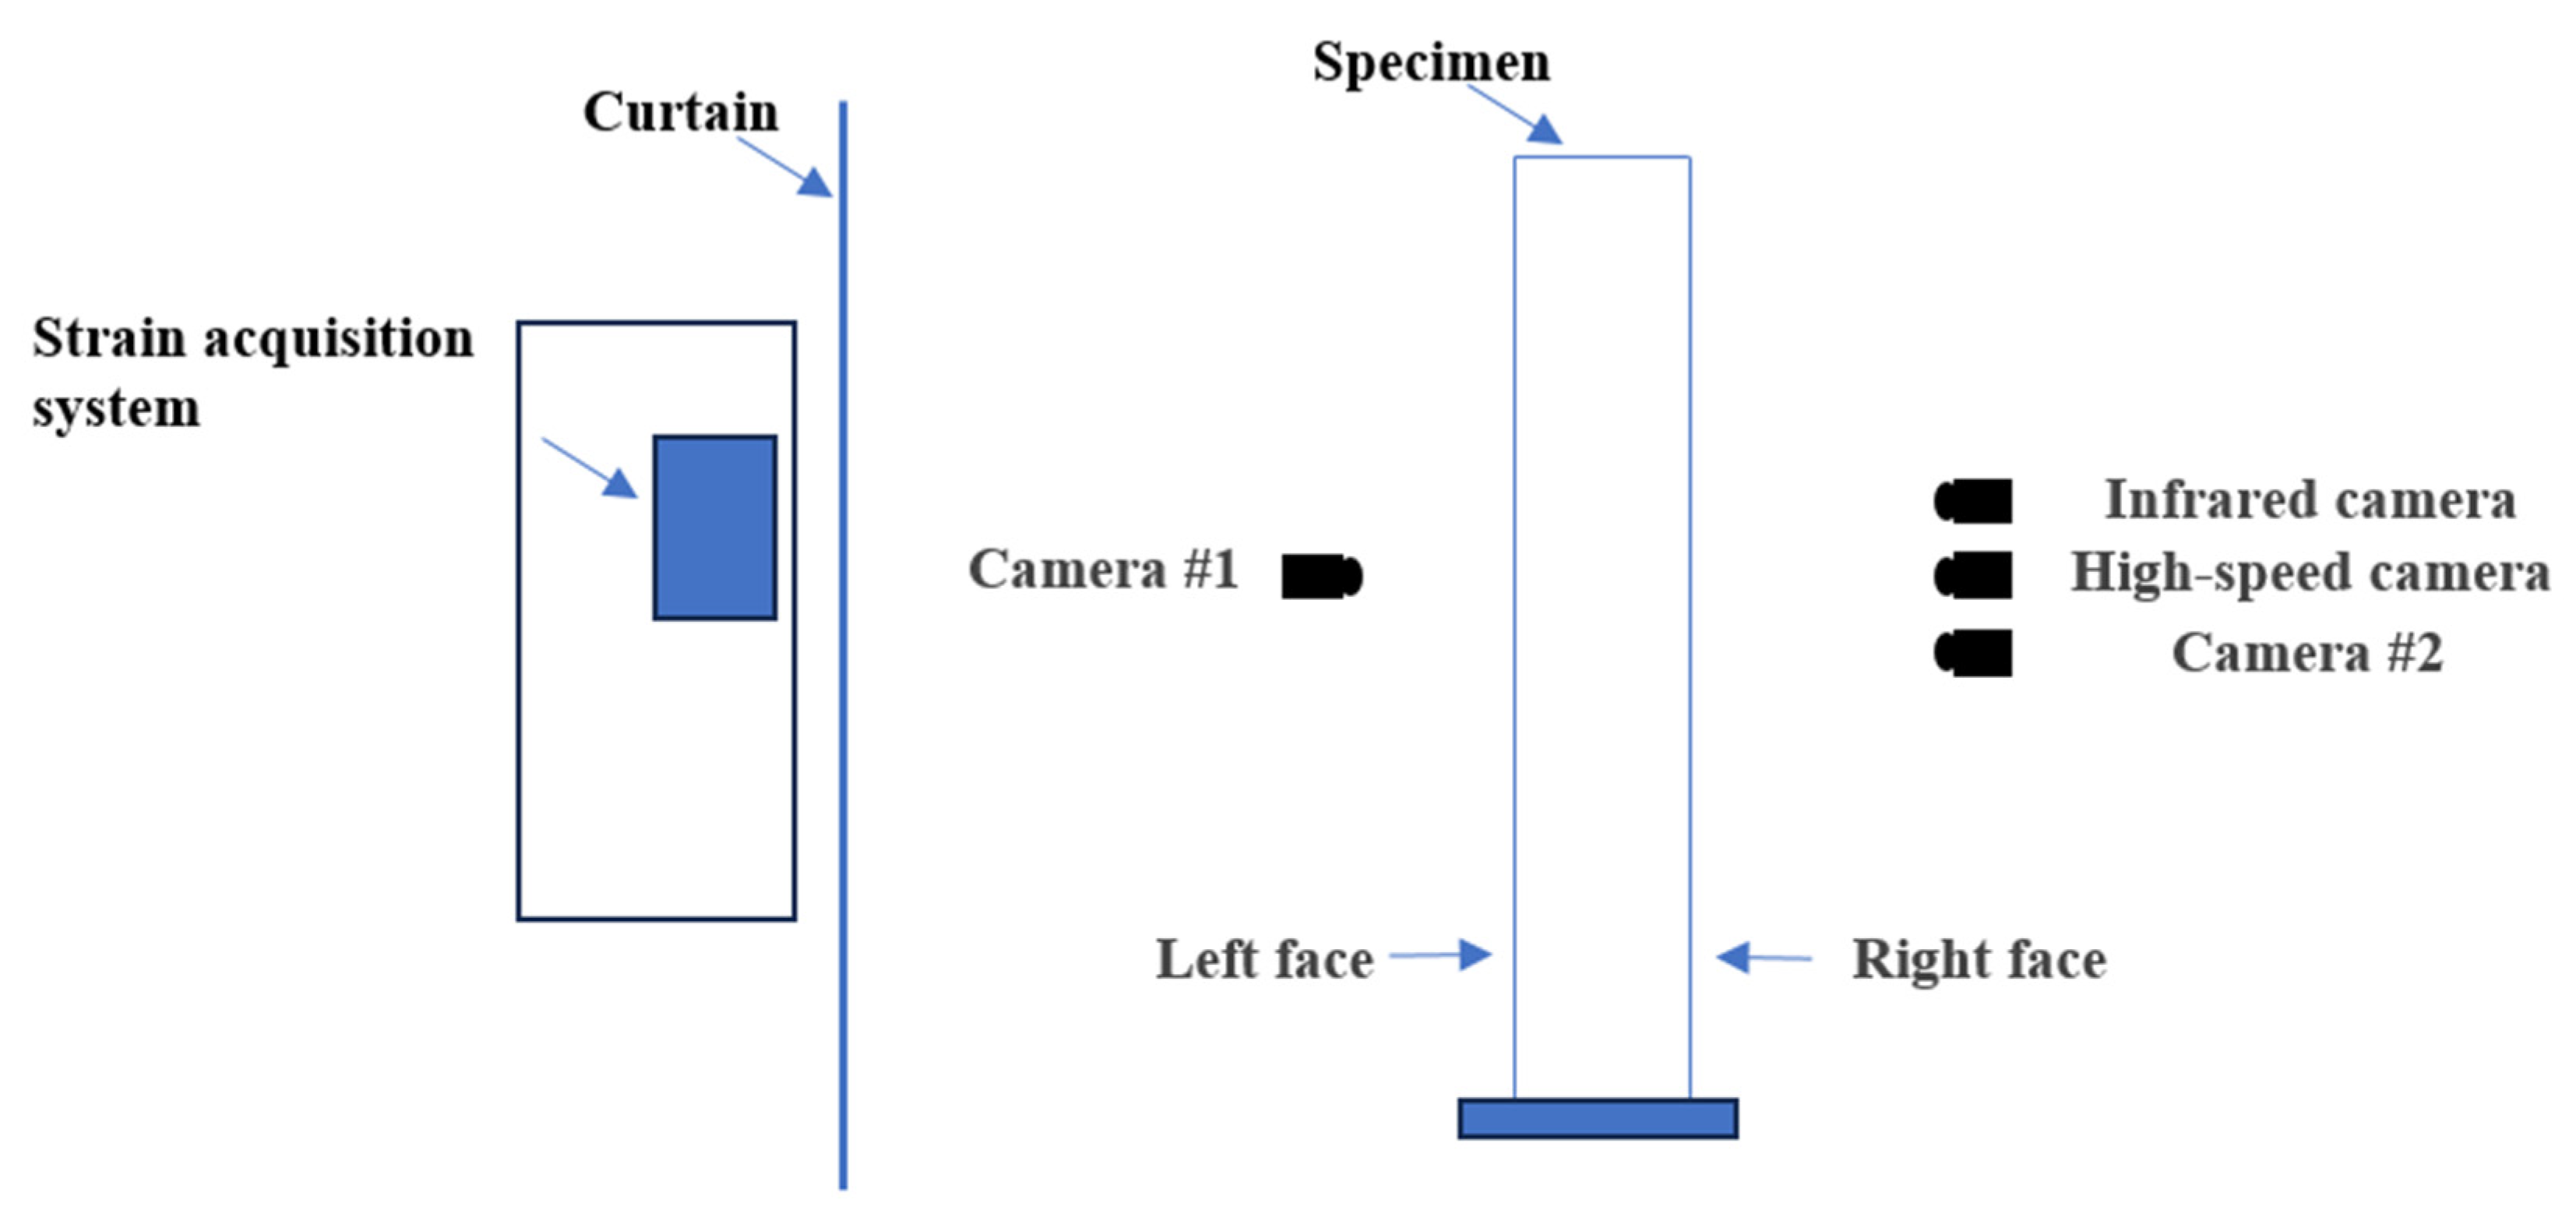
2.3. Tensile Test
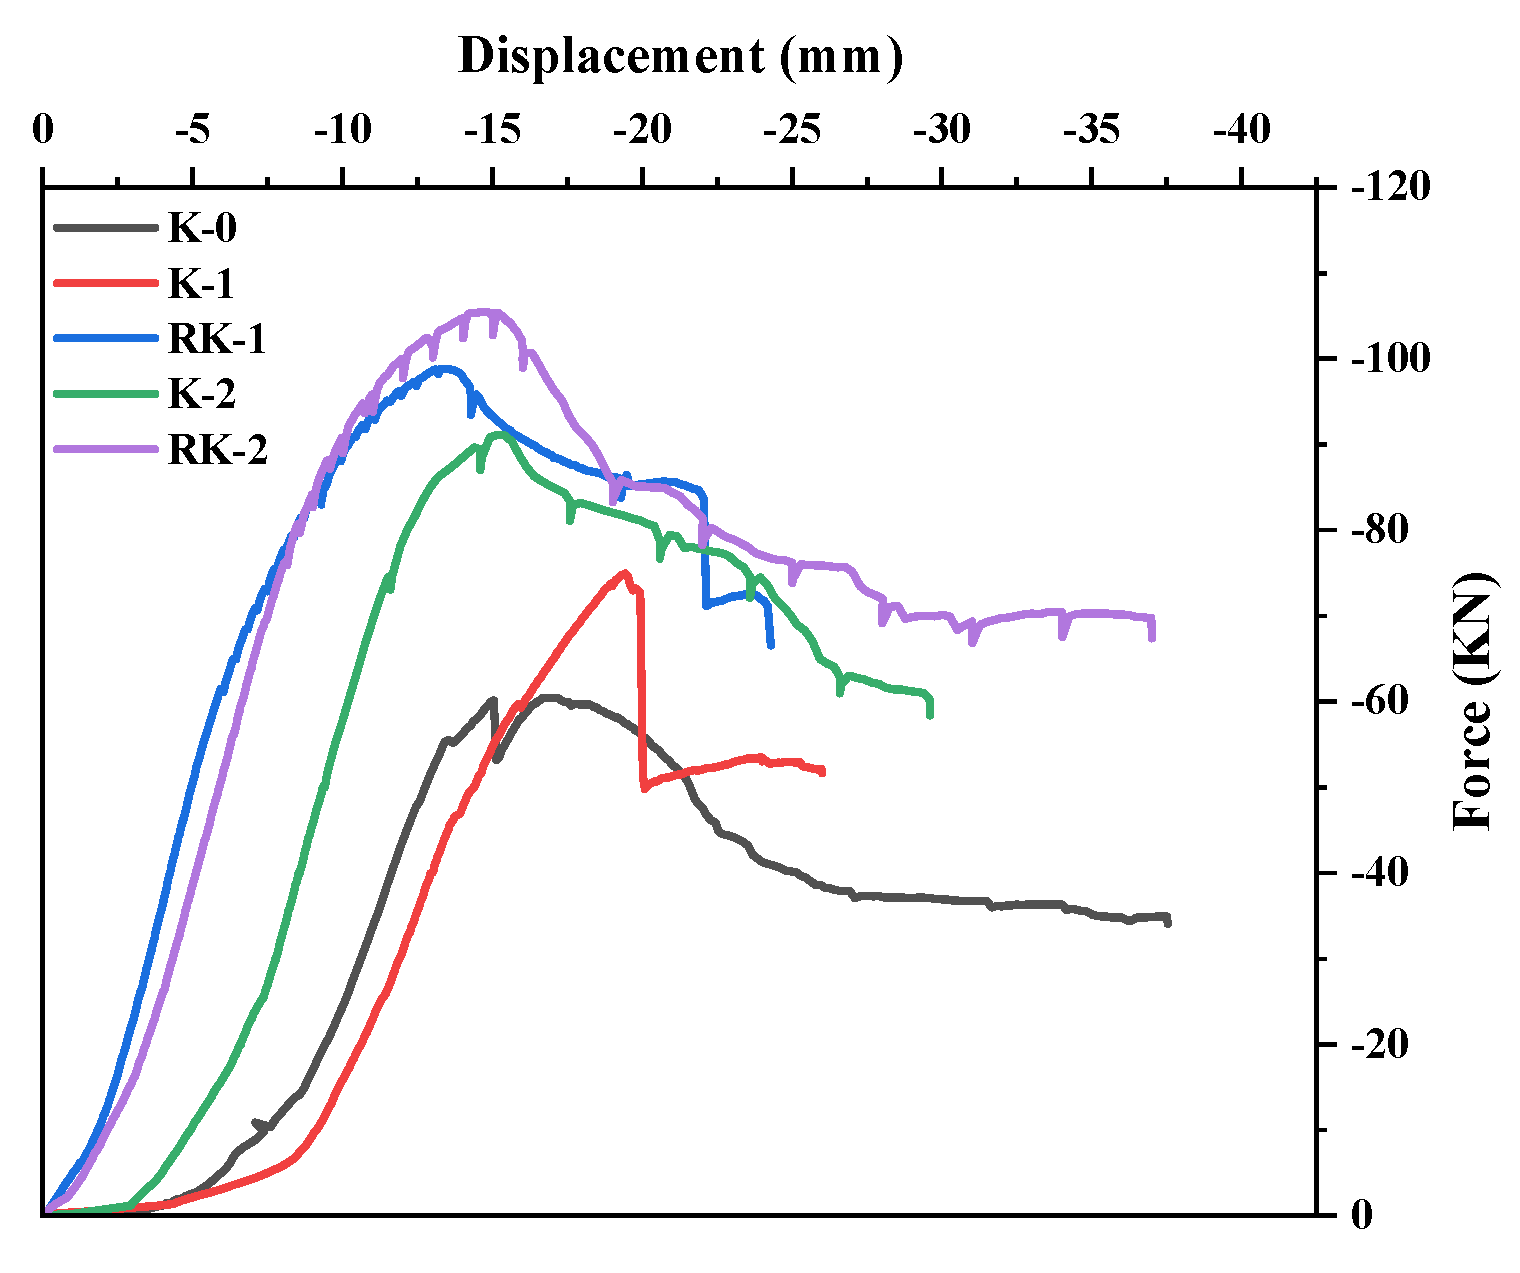
3. Results and Discussion
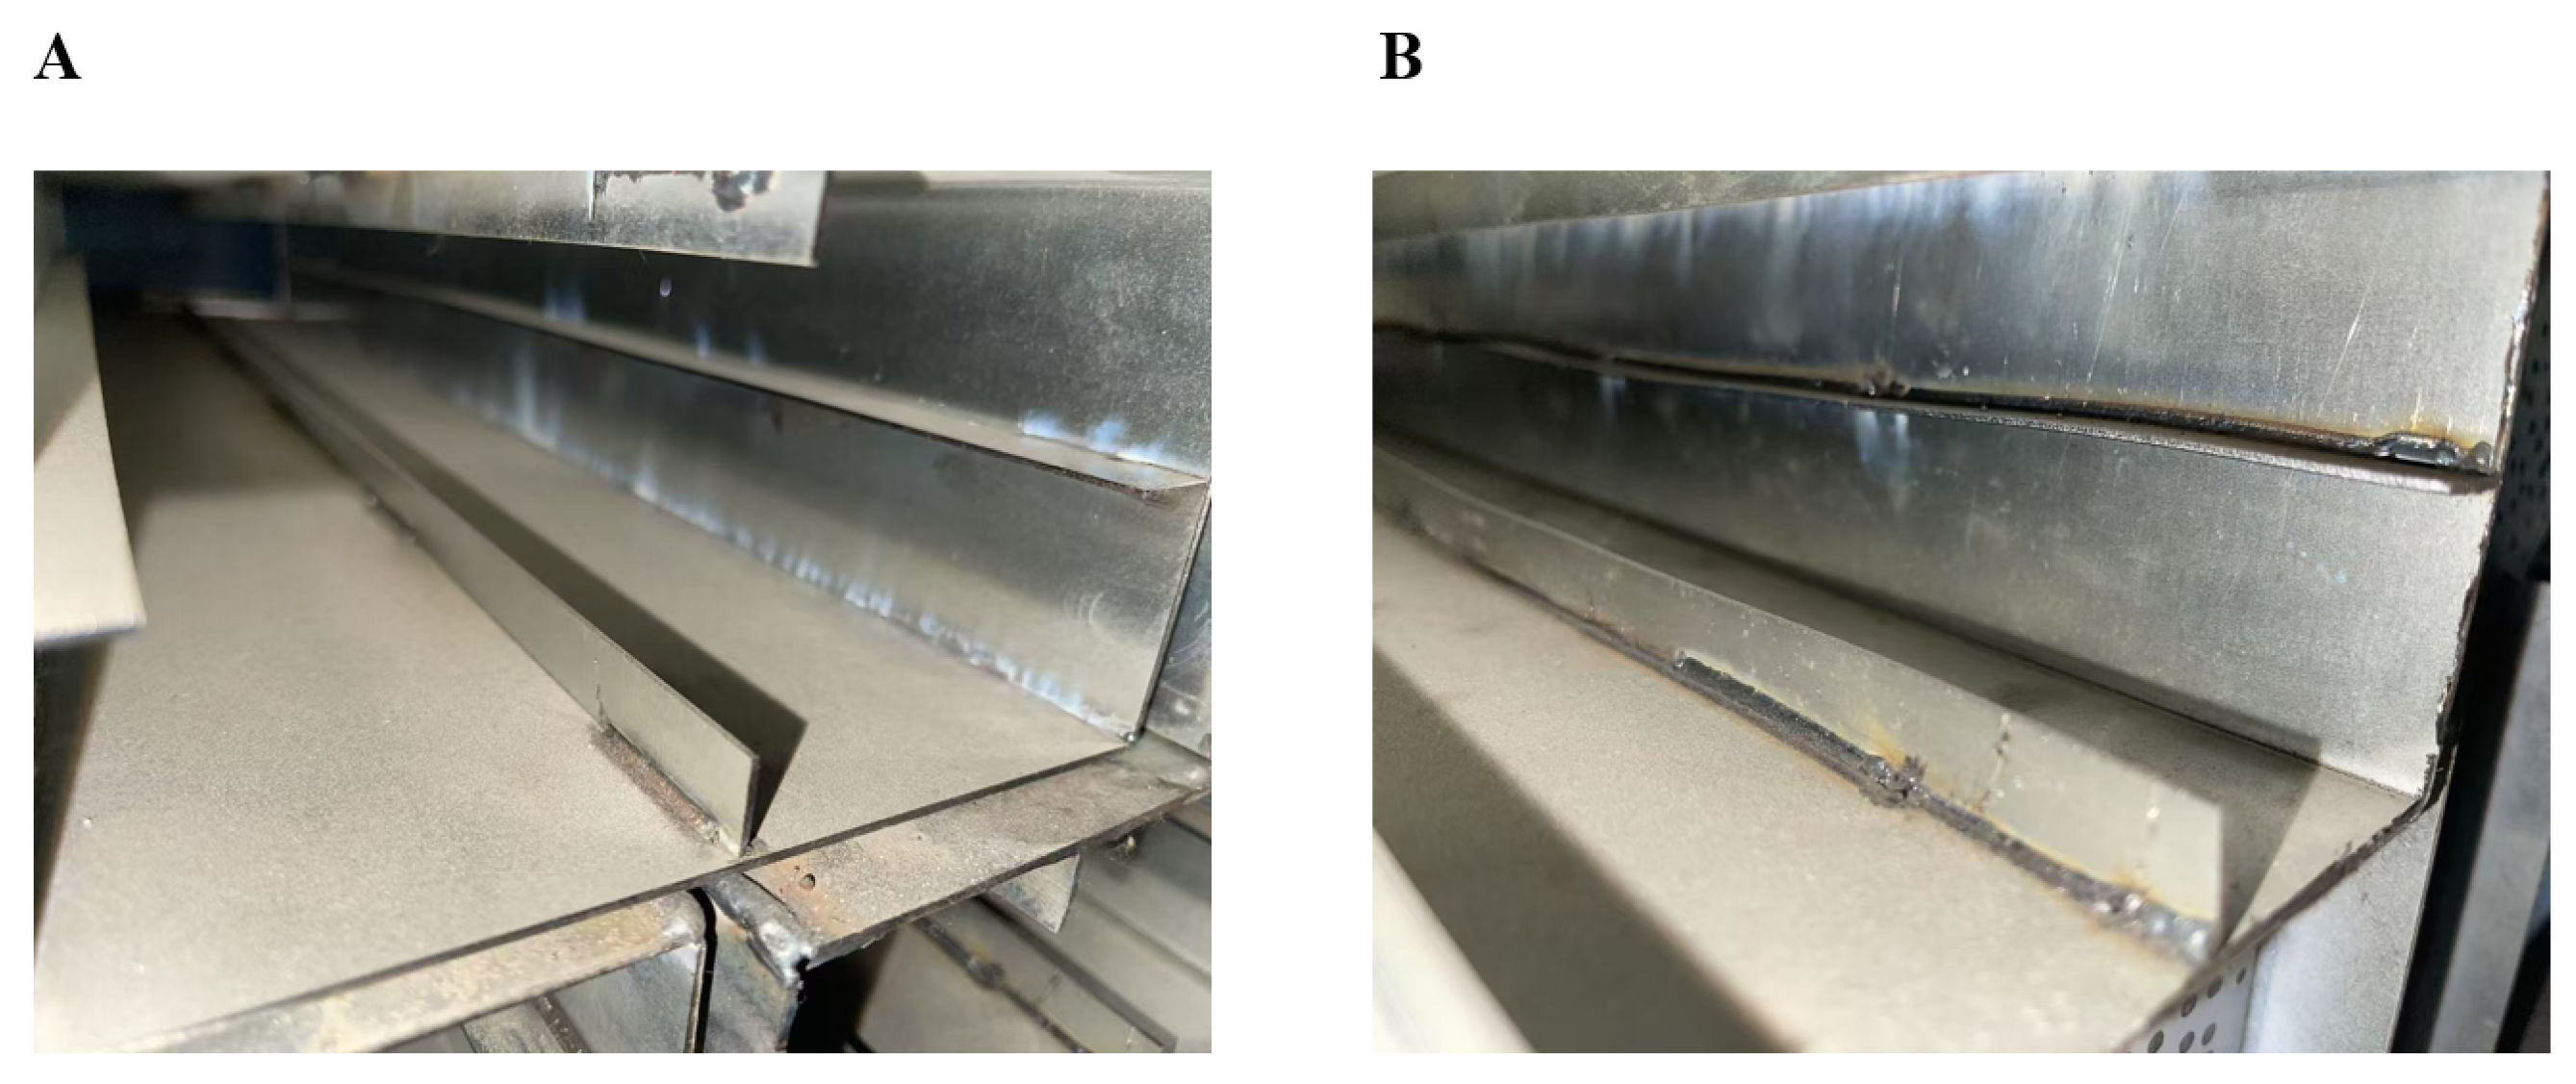
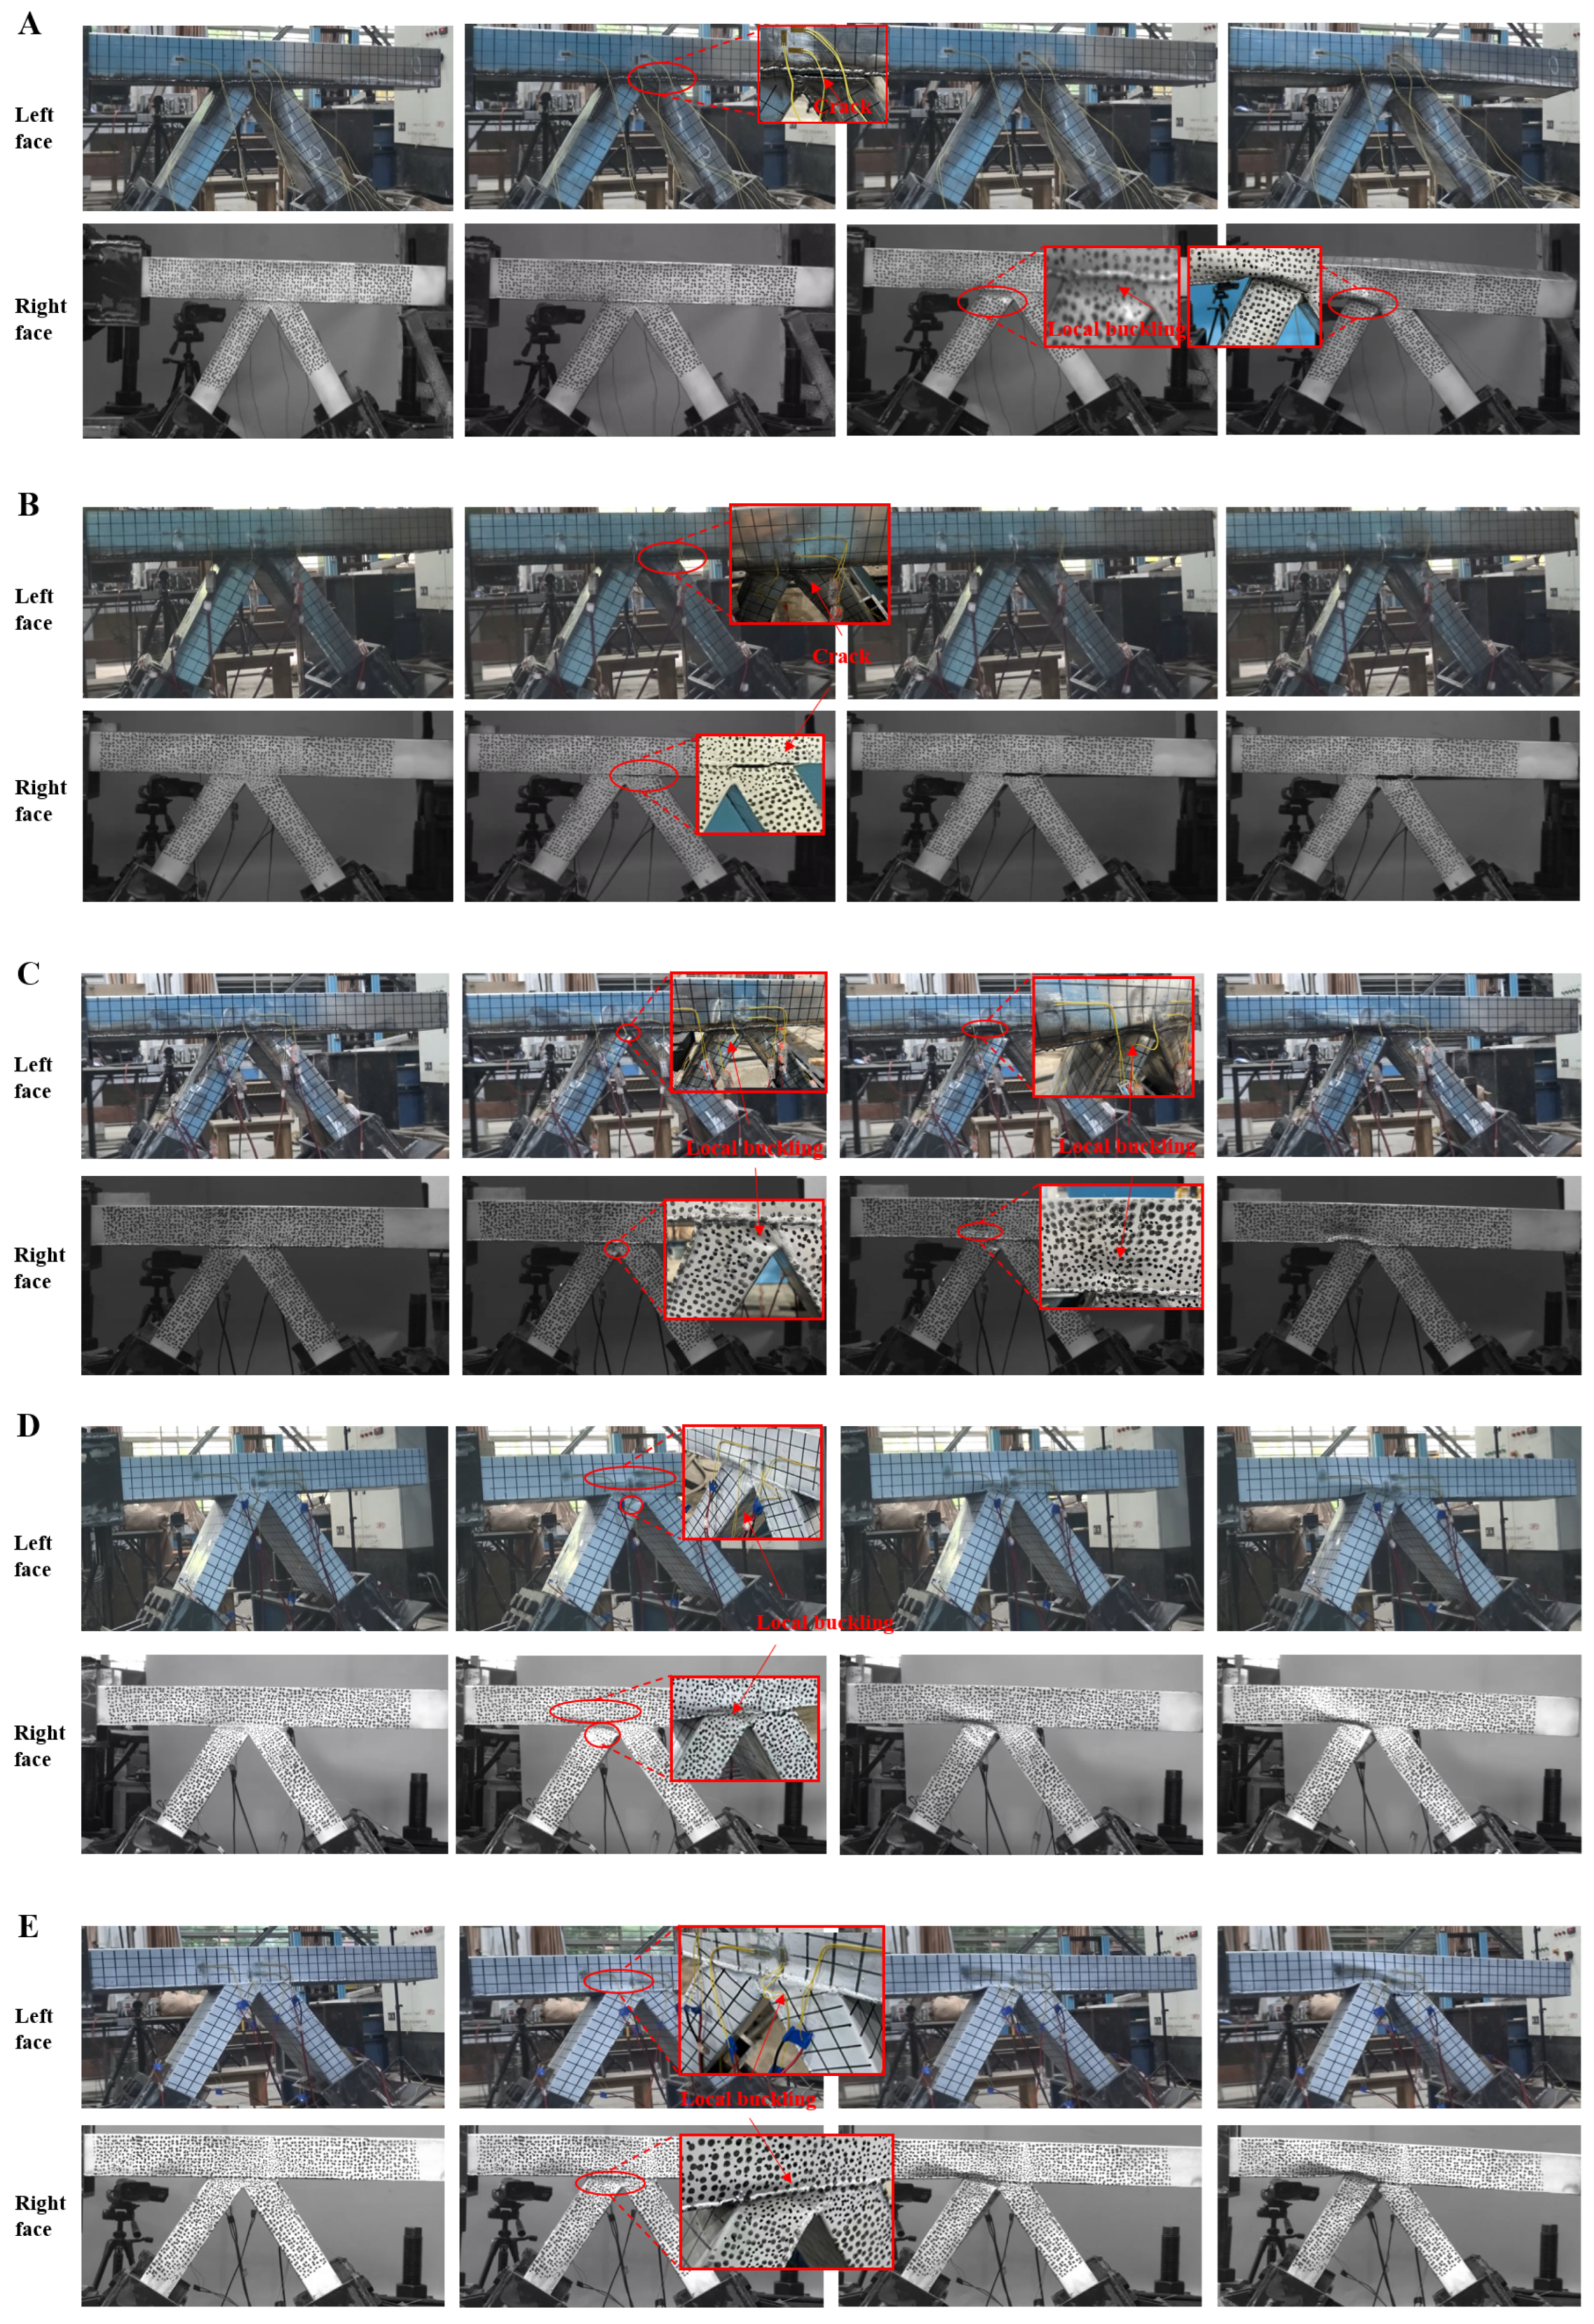
3.1. Failure Mode
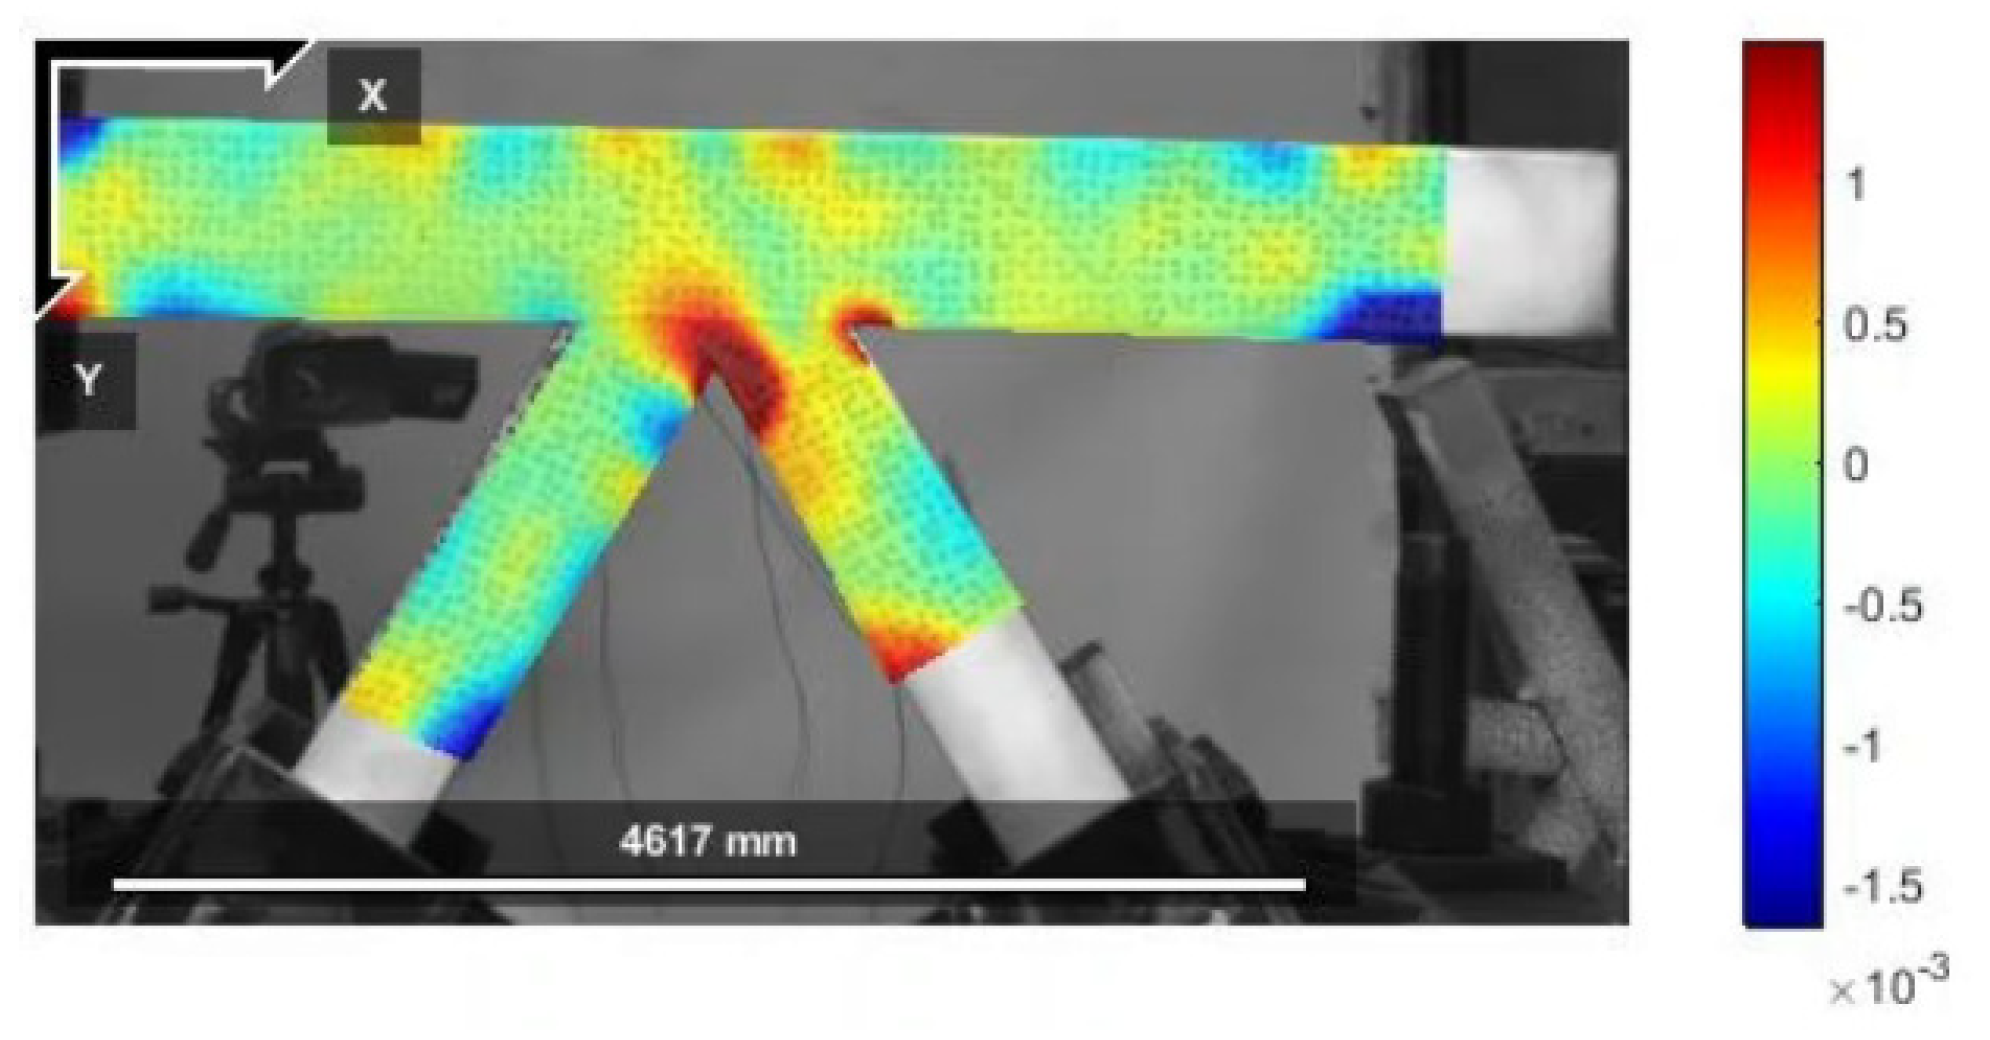
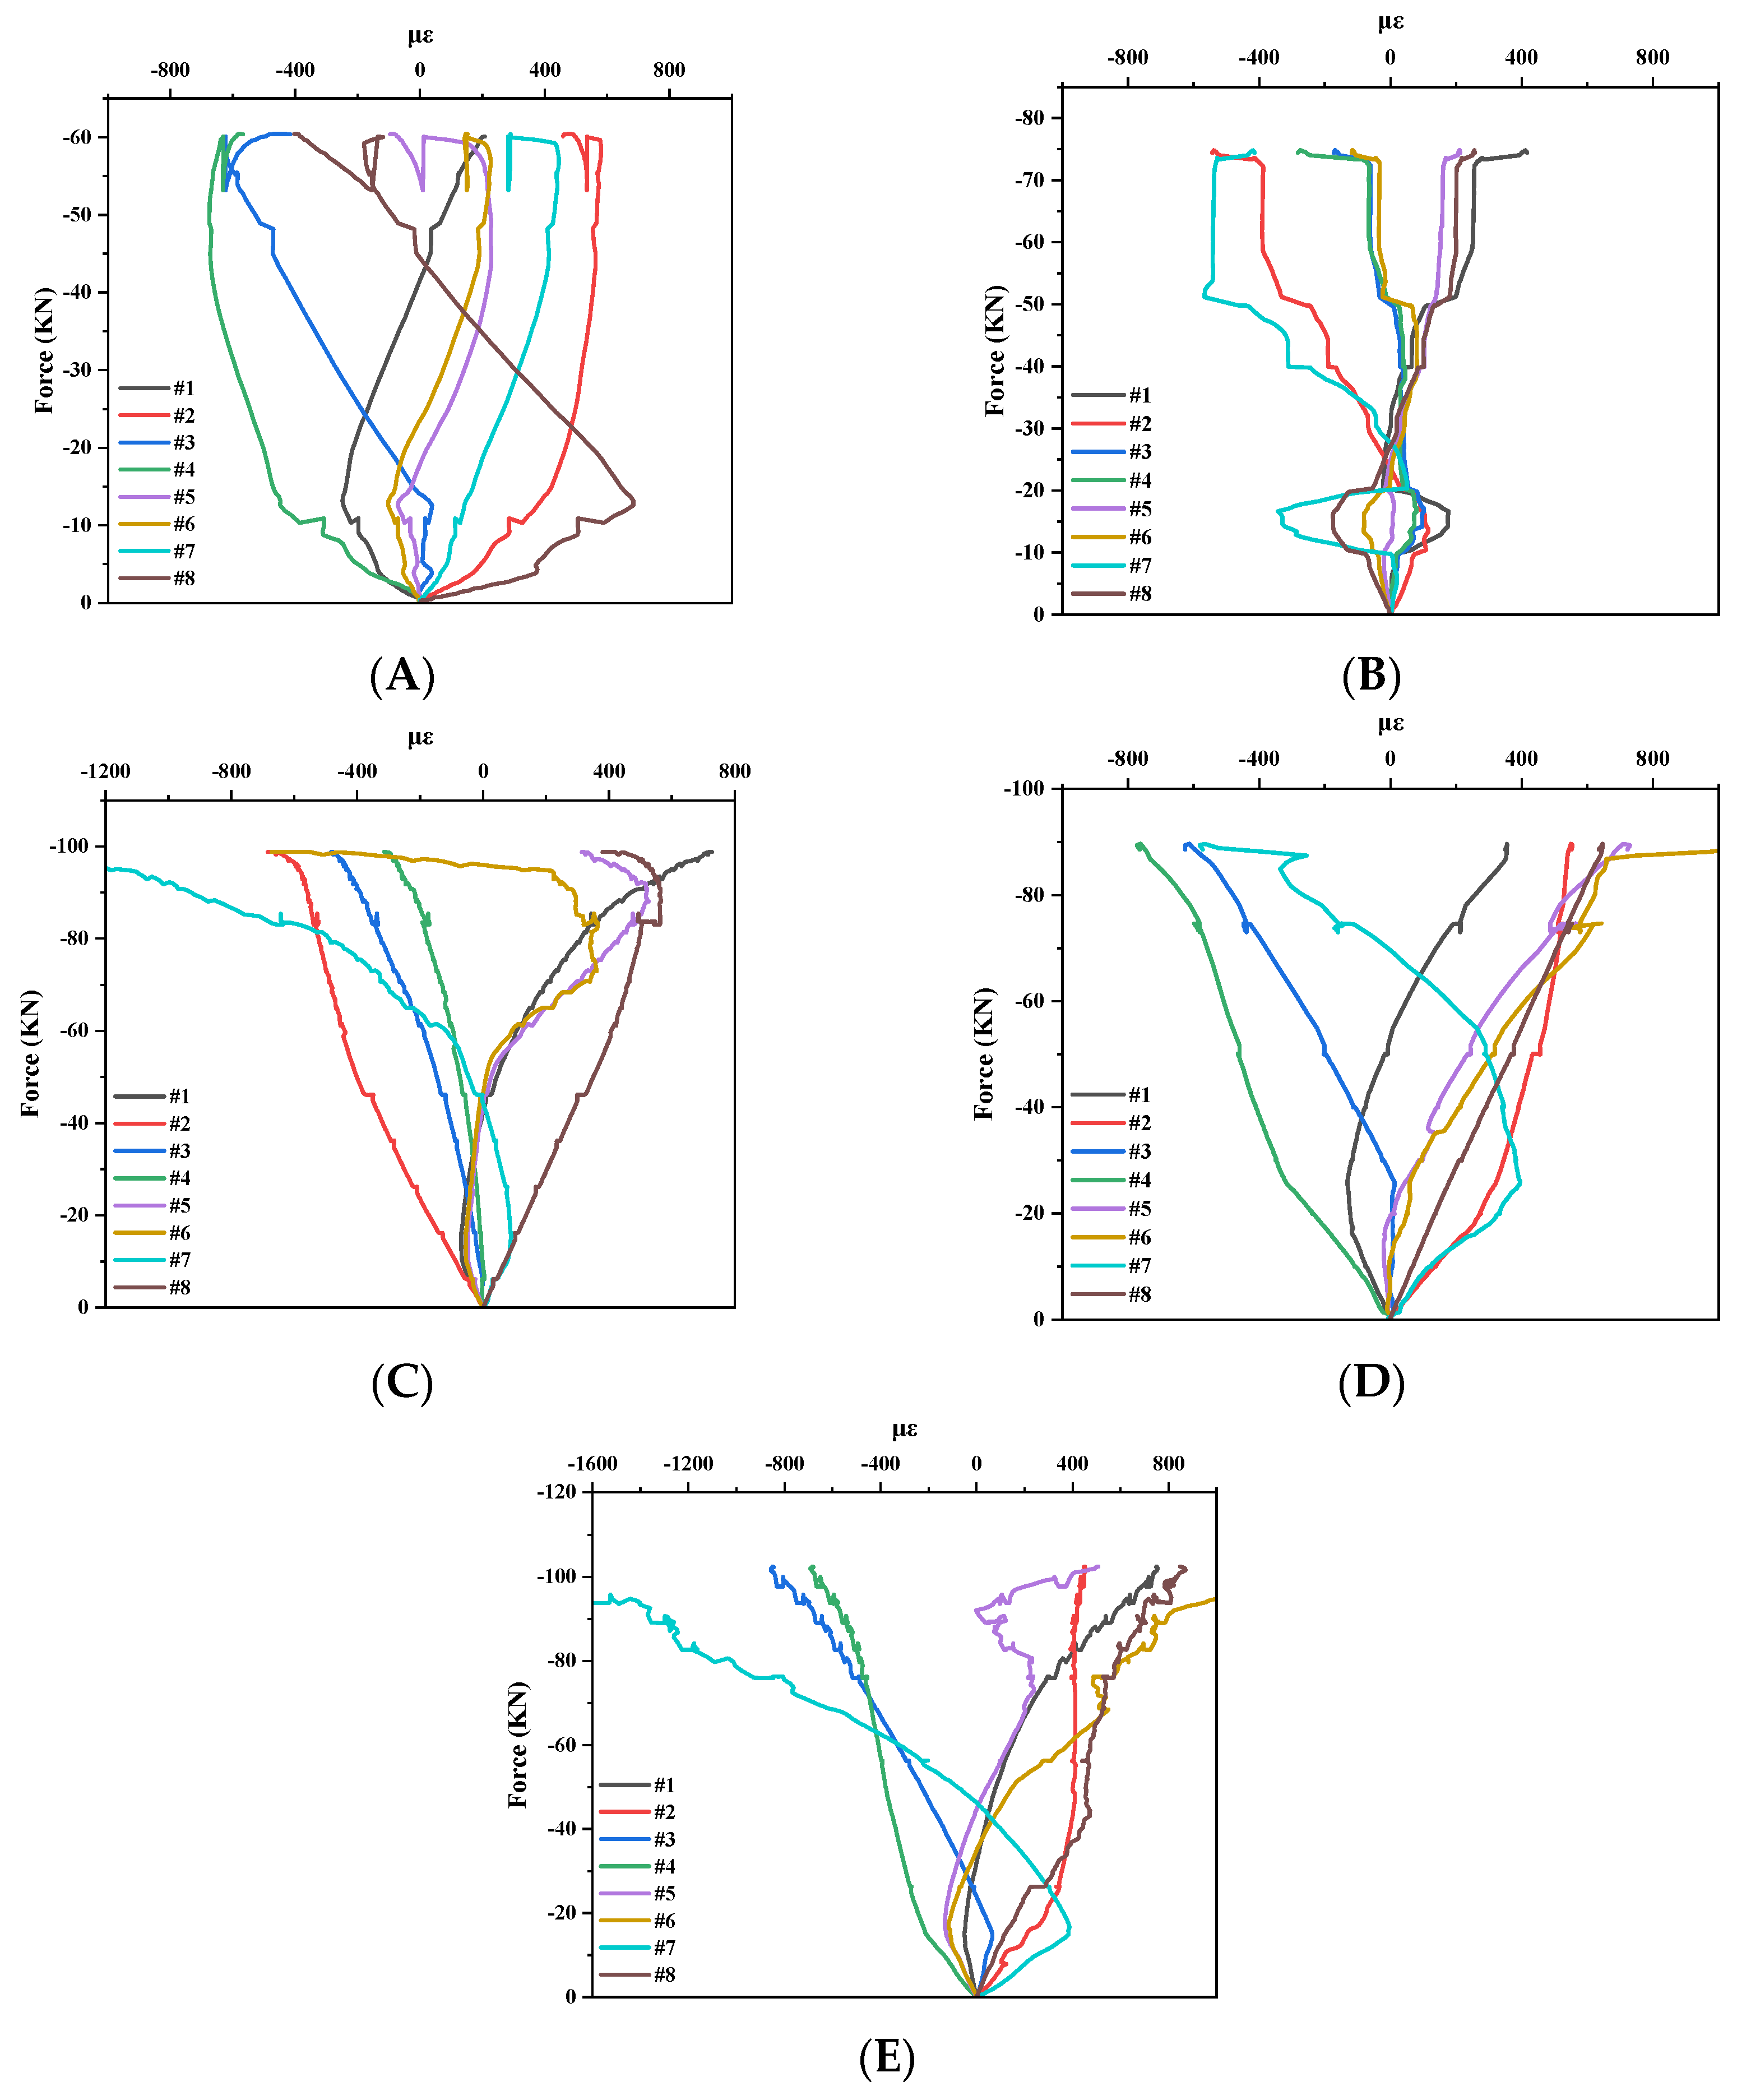
3.2. Strain Distribution
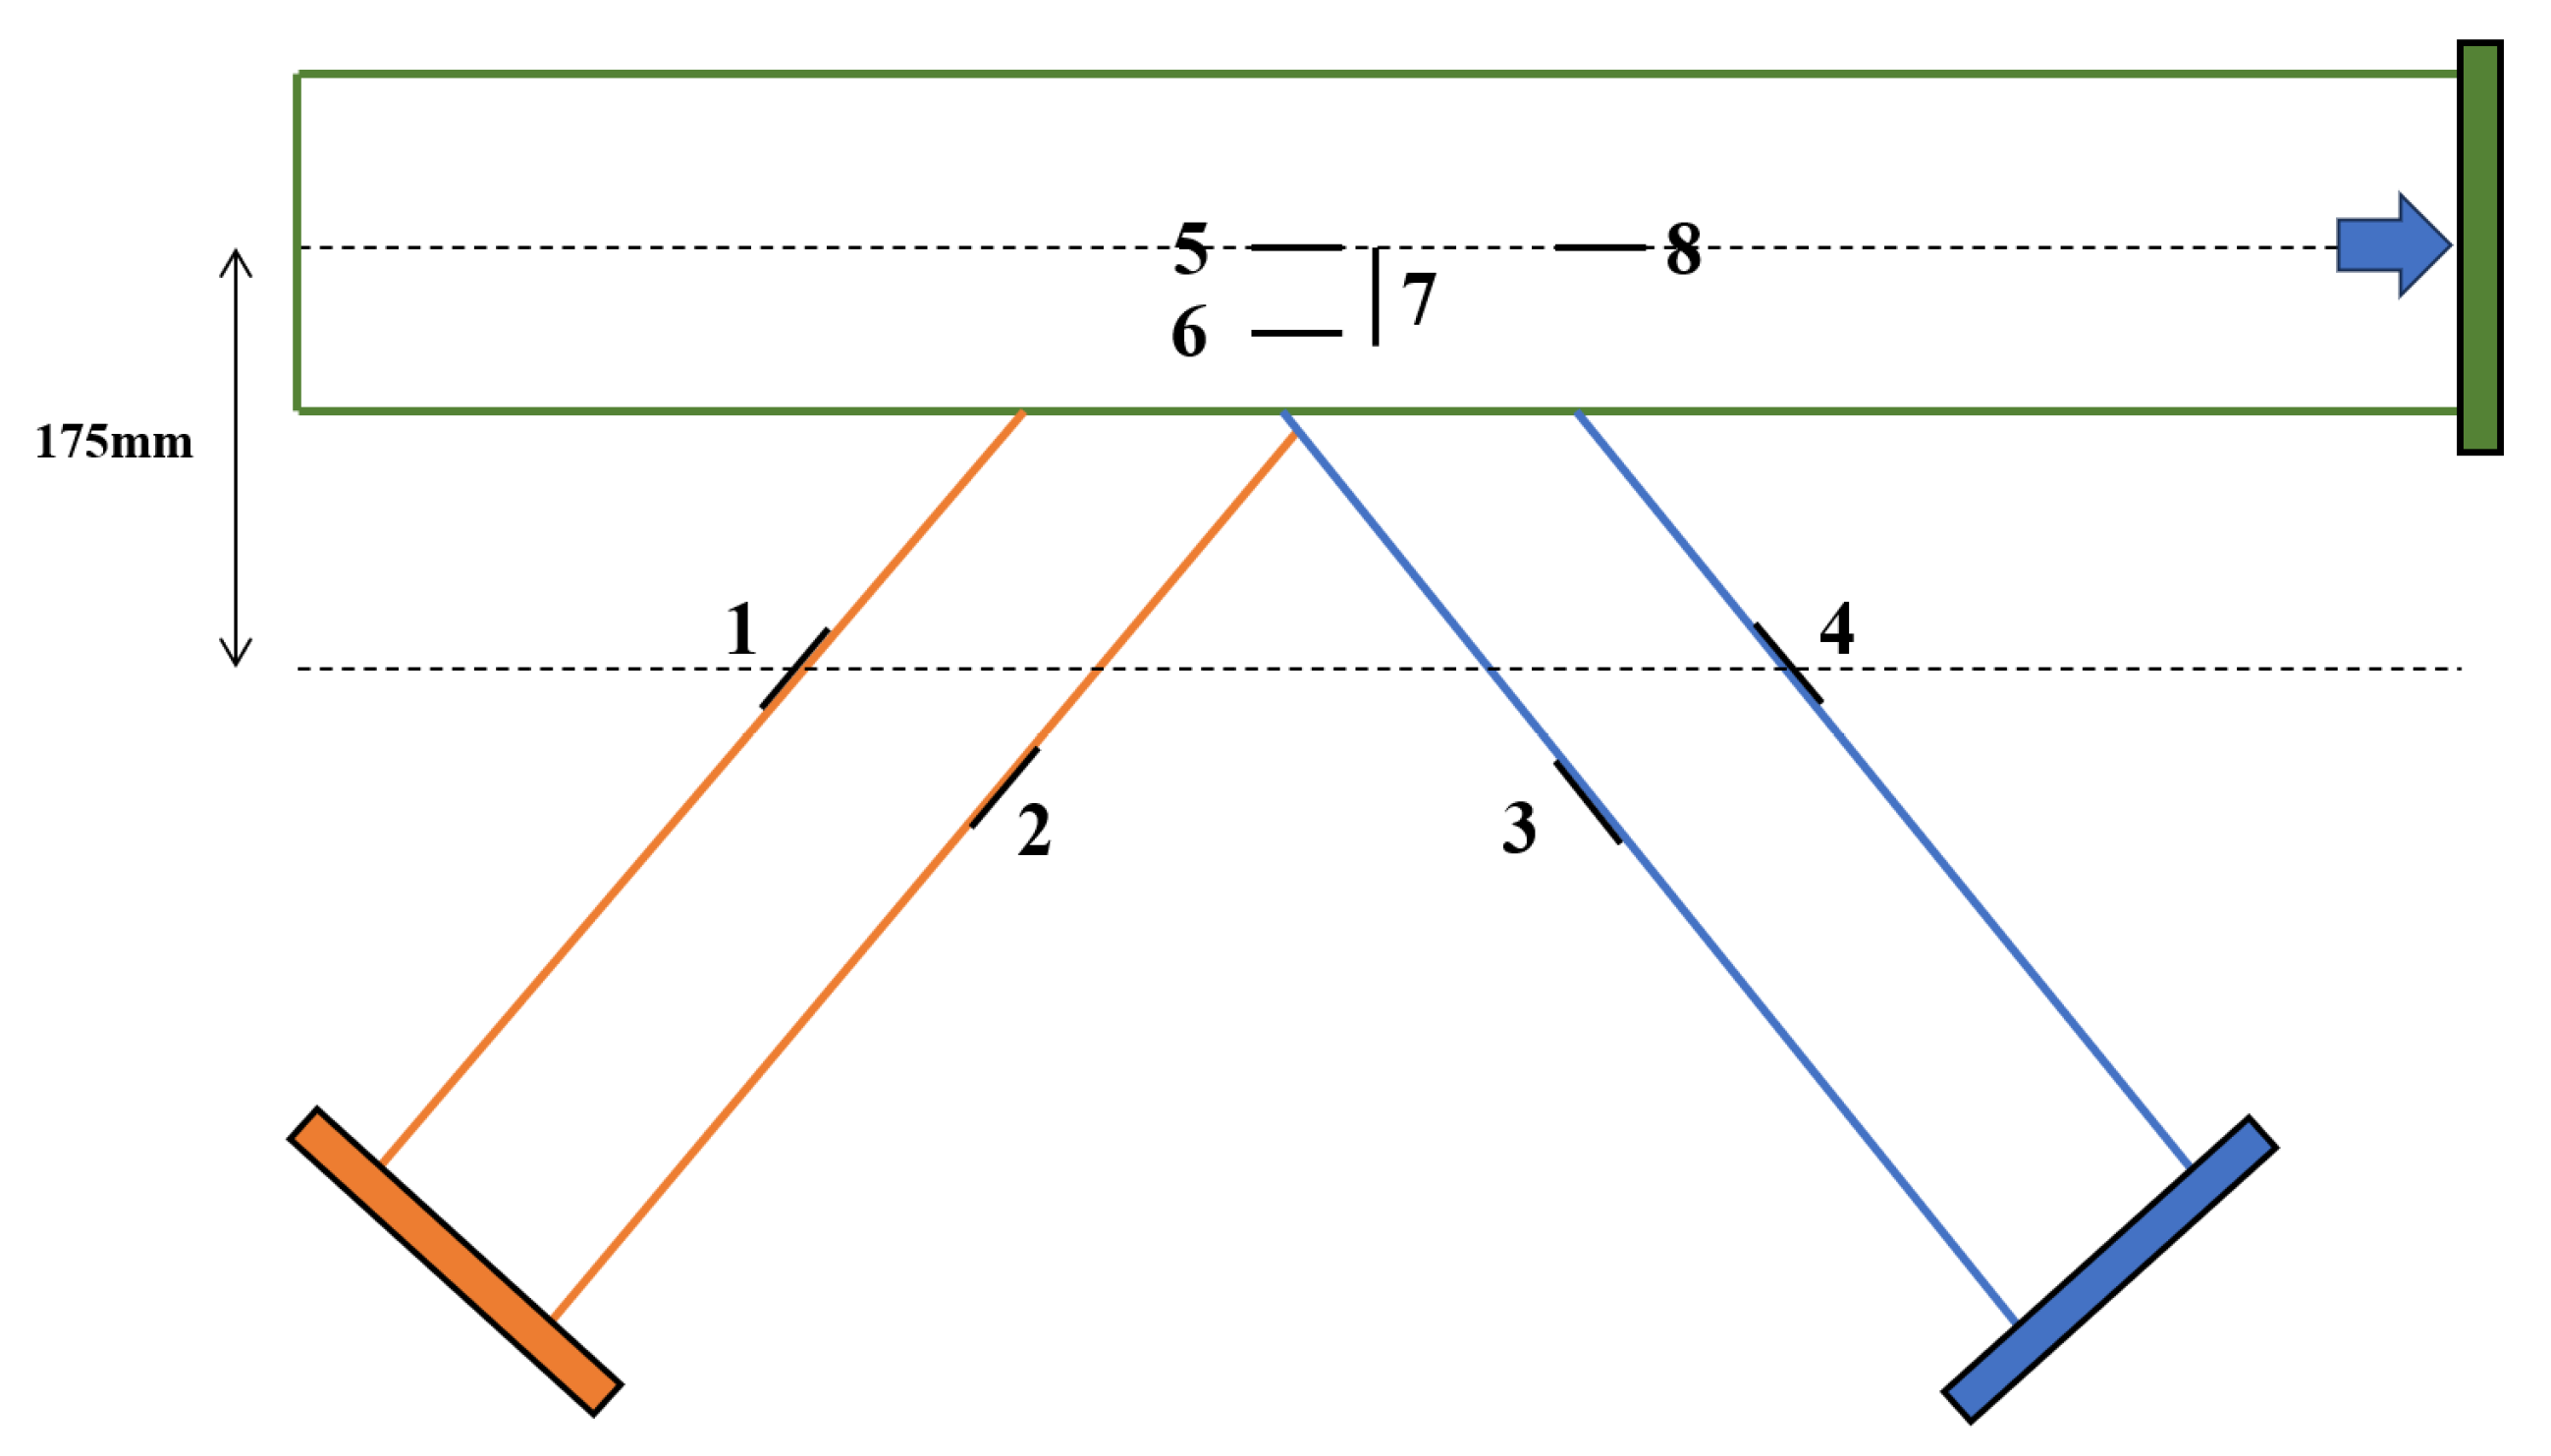
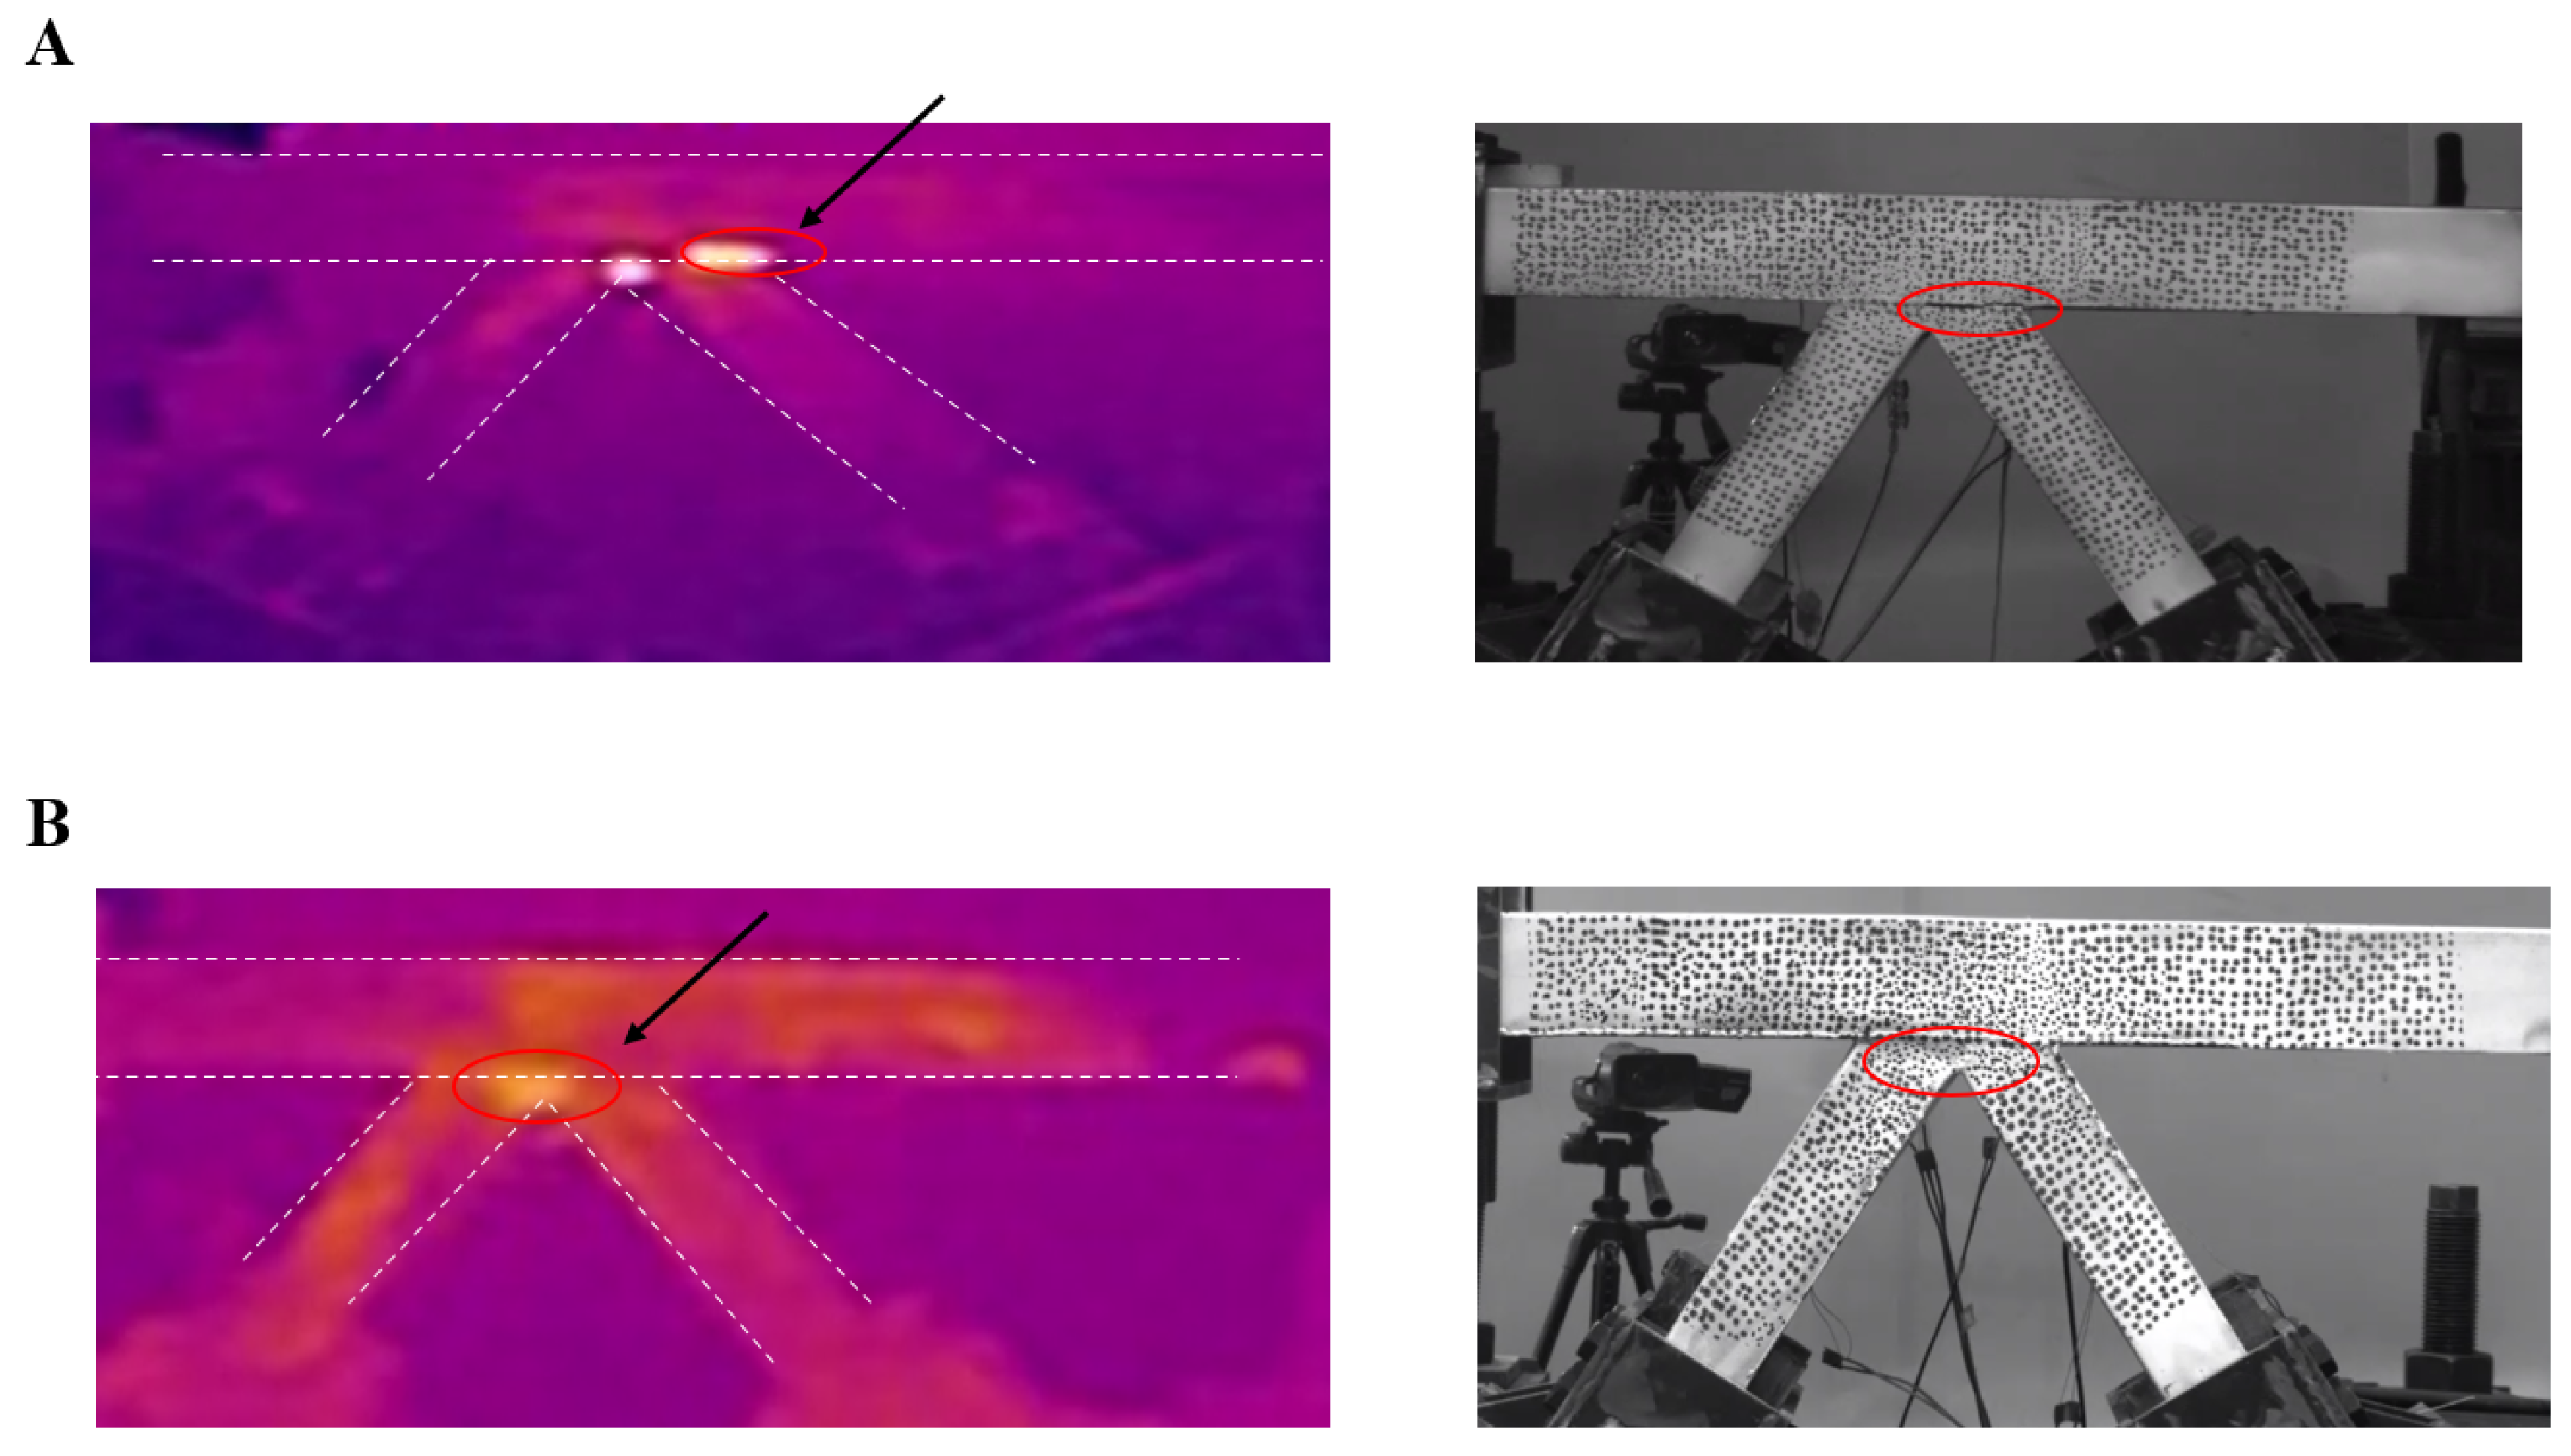
3.3. Temperature Distribution
3.4. Finite Element Analysis
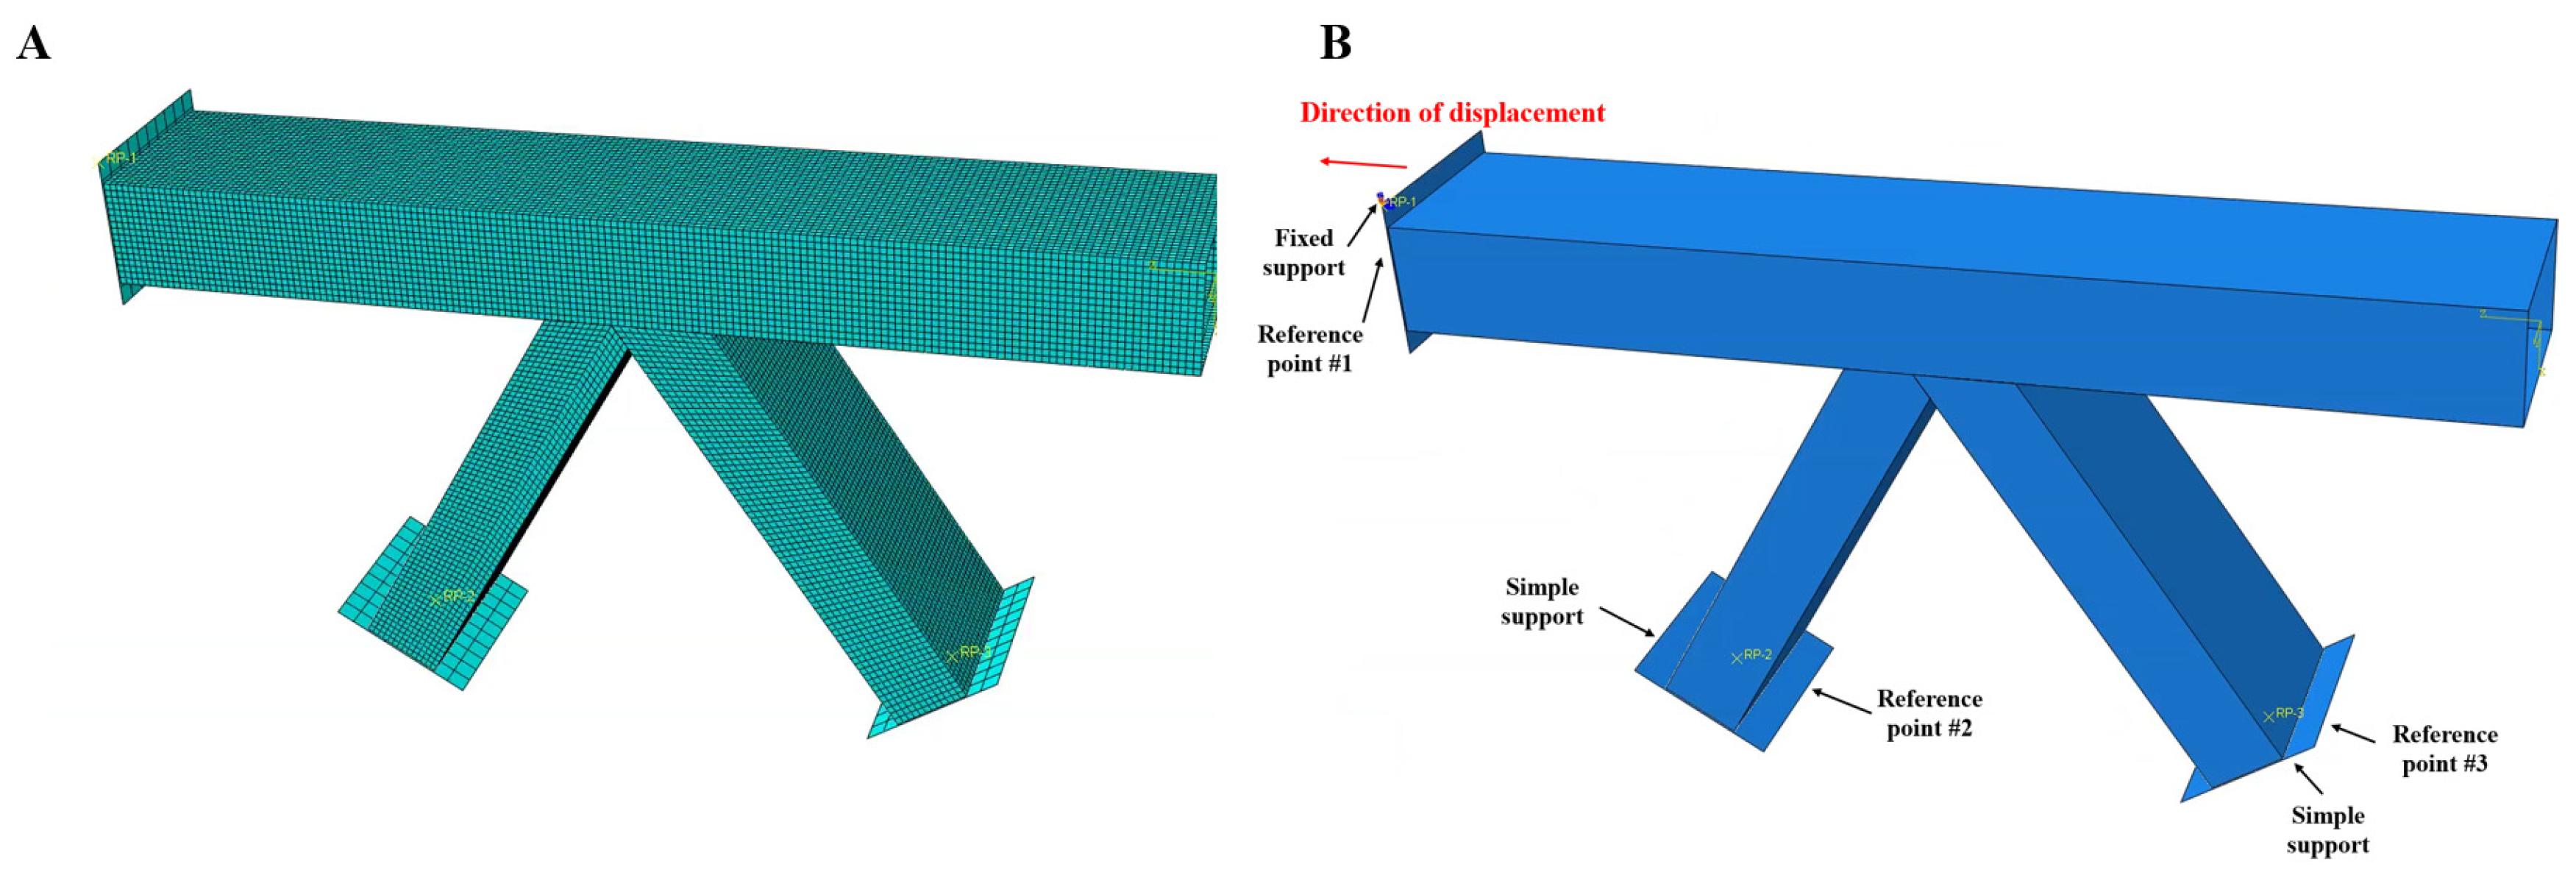
3.4.1. Finite Element Model
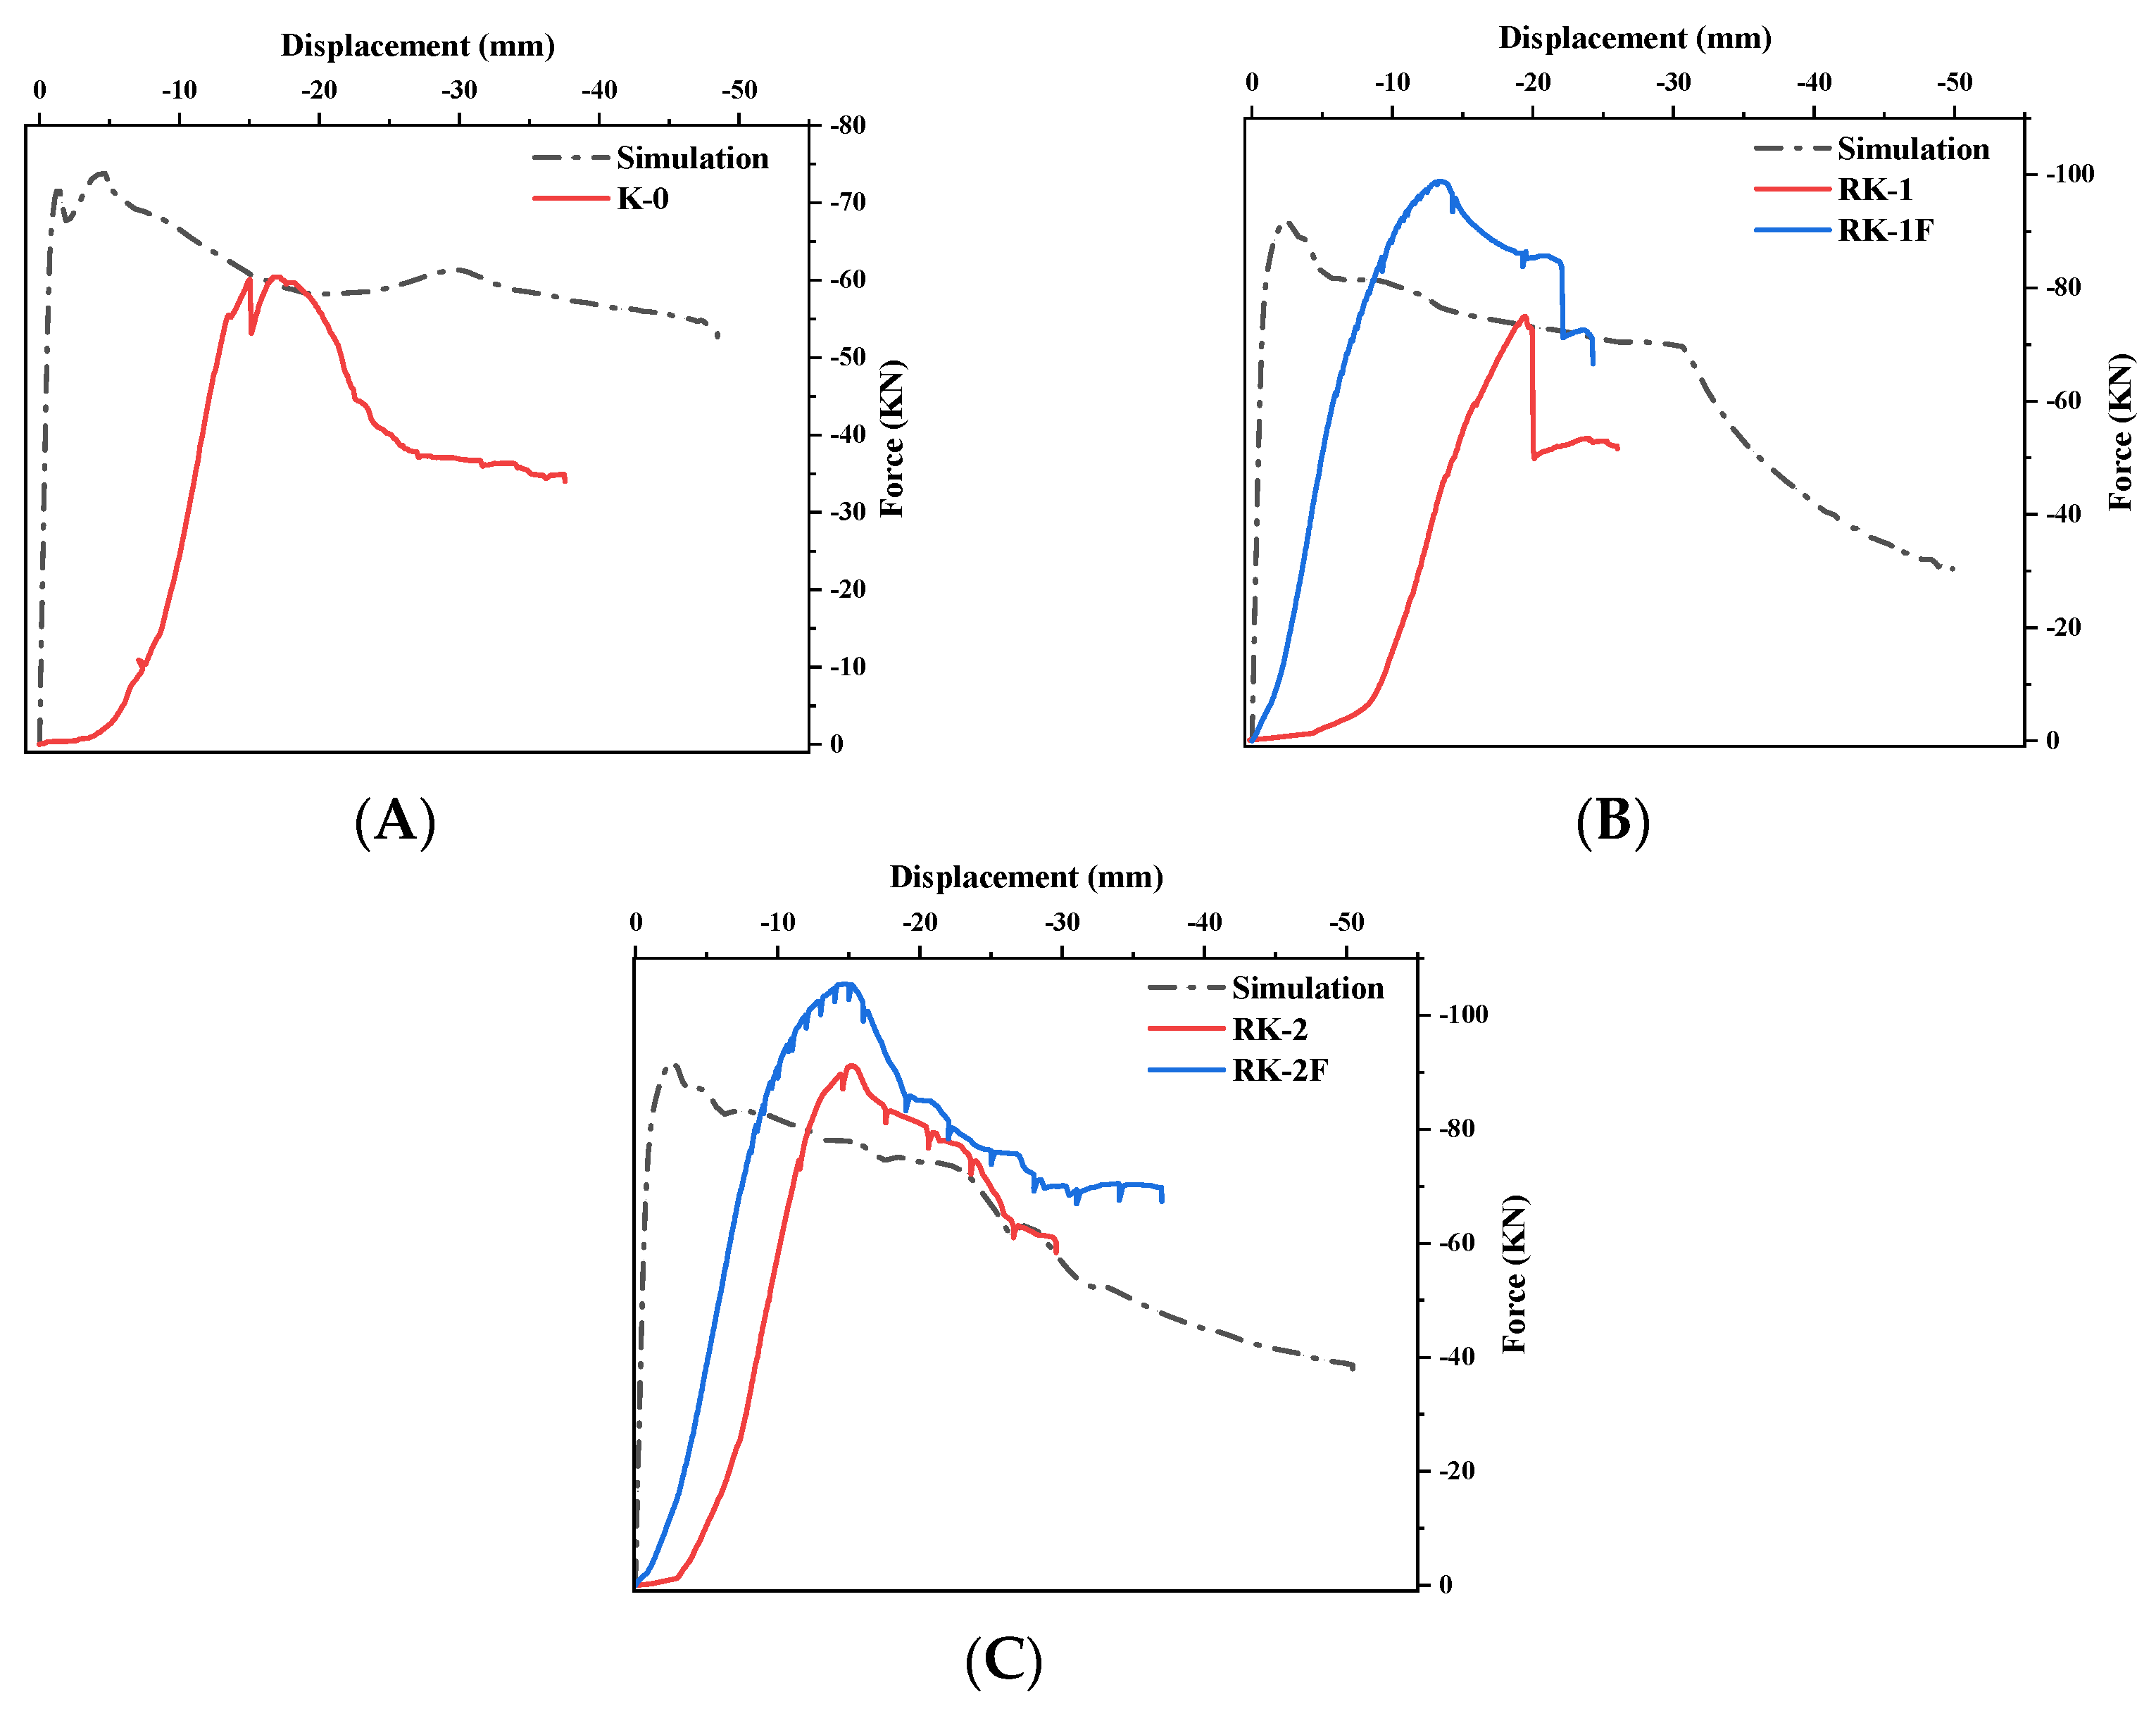
3.4.2. Finite Element Verification
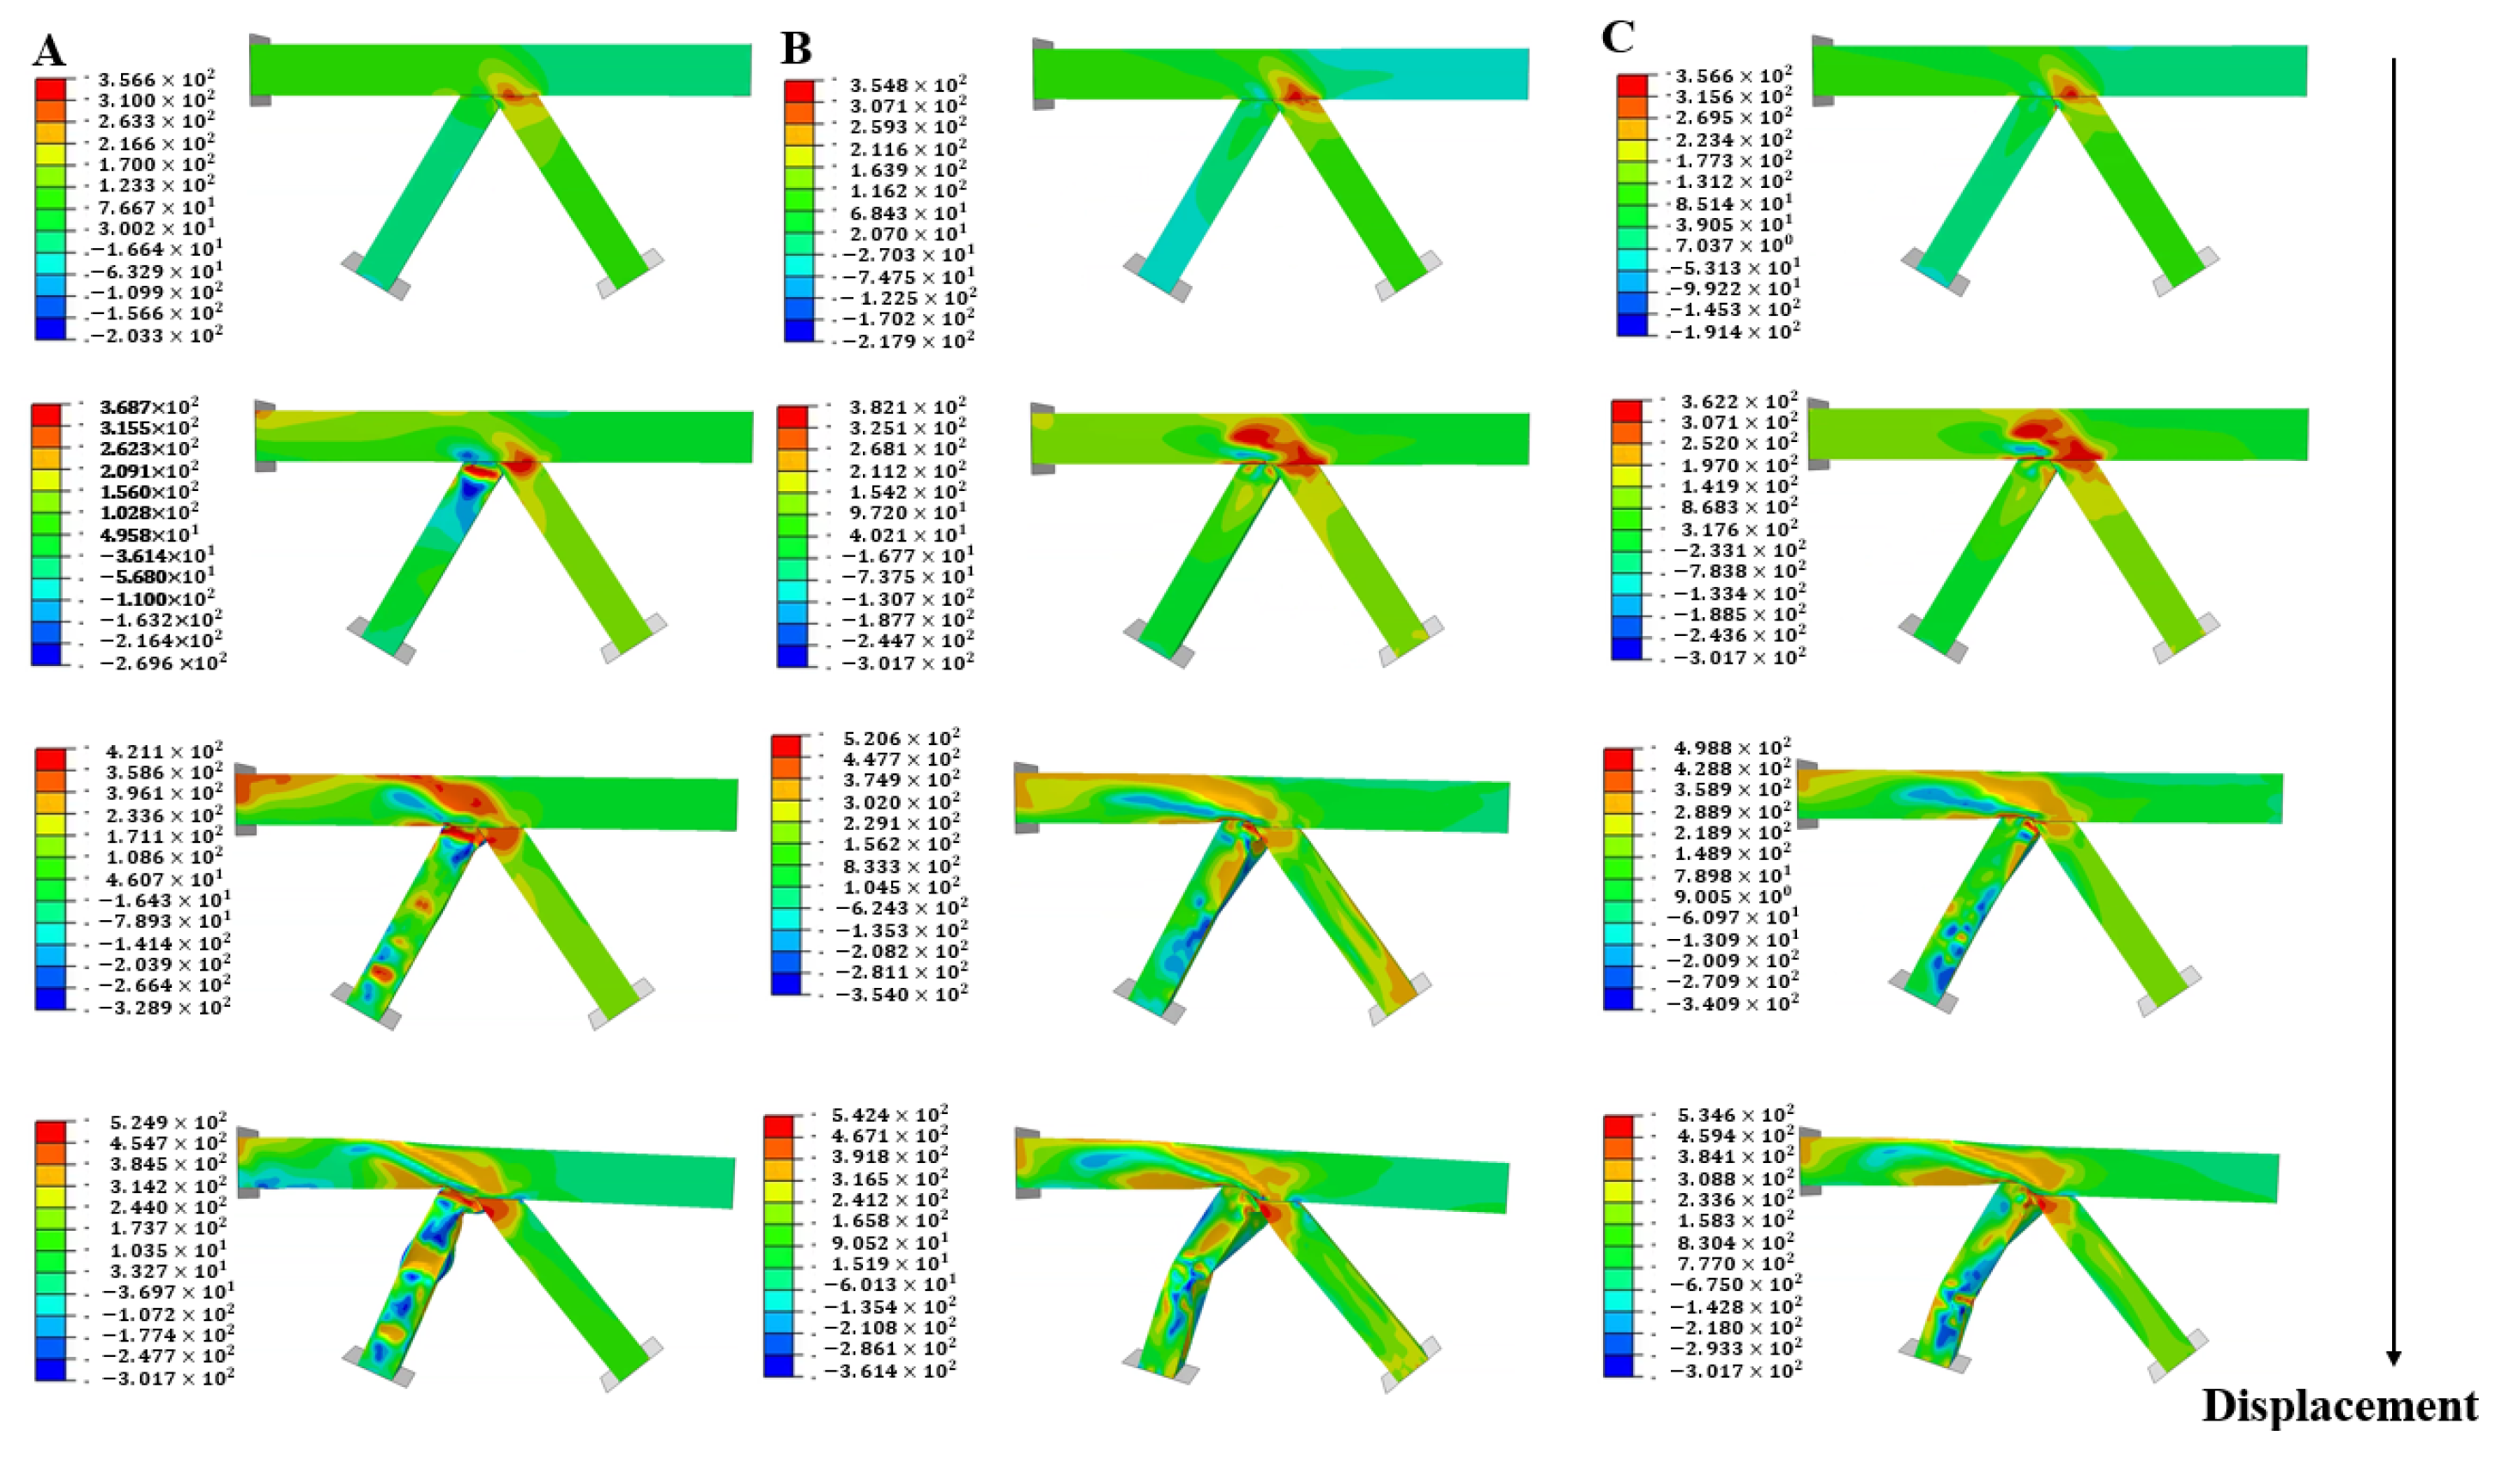
3.4.3. Finite Element Results
4. Conclusions and Future Direction
- (1)
- The addition of transverse reinforcement ribs and more complete welds share the squeezing effect of the brace on the chord. Arranging more reinforcing ribs in the fittings makes the chord more uniformly stressed and absorbs more energy while increasing the flexural load capacity of the fittings’ side plates.
- (2)
- The appearance of a crack gives a short-lived temperature increase in the area around the crack, and the buckling of the structure causes the surface temperature in the buckling area to continue to increase for a period of time. The change in temperature successfully localized where the structure was deforming and creating cracks.
- (3)
- The addition of reinforcing ribs resulted in a change in the deformation pattern of the model: The unribbed model flexes first in the brace and later in the chord under tension in the main tube, whereas the ribbed model first experiences flexion at the location of the chord, and flexion occurs after the brace. The difference occurs because the flexural bearing capacity of the additional reinforced ribbed brace is greater than the bearing capacity of the side plate in flexure.
Author Contributions
Funding
Data Availability Statement
Conflicts of Interest
References
- Sakai, Y.; Hosaka, T.; Isoe, A.; Ichikawa, A.; Mitsuki, K. Experiments on concrete filled and reinforced tubular K-joints of truss girder. J. Constr. Steel Res. 2004, 60, 683–699. [Google Scholar] [CrossRef]
- Huang, B.; Liao, L.; Ren, Q.; Cui, X.; Zhang, J.; Zhu, B. Fragility analysis of the box-girder coastal bridge with different connections subjected to extreme random waves. Ocean Eng. 2022, 245, 110580. [Google Scholar] [CrossRef]
- Fang, Z.; Fang, H.; Huang, J.; Jiang, H.; Chen, G. Static behavior of grouped stud shear connectors in steel-precast UHPC composite structures containing thin full-depth slabs. Eng. Struct. 2022, 252, 113484. [Google Scholar] [CrossRef]
- Shi, X.; Zhou, Z.; Ma, H.; Emadi, S.; Cao, Z. Failure mechanism and design method for box girder bridge with interior hinged supports under eccentrically vertical loads. Structures 2023, 48, 438–449. [Google Scholar] [CrossRef]
- Li, J.; Xu, L. Seismic Responses and Damage Control of Long-Span Continuous Rigid-Frame Bridges Considering the Longitudinal Pounding Effect under Strong Ground Motions. J. Bridge Eng. 2023, 28, 04022140. [Google Scholar] [CrossRef]
- Xu, B.; Lang, W.; Liu, Q.; Wang, R.; Kong, B.; Xu, B. A Method for the Coefficient Superposition Buckling Bearing Capacity of Thin-Walled Members. Buildings 2024, 14, 3236. [Google Scholar] [CrossRef]
- van der Vegte, G.J.; Wardenier, J.; Puthli, R.S. FE analysis for welded hollow-section joints and bolted joints. Proc. Inst. Civ. Eng.-Struct. Build. 2010, 163, 427–437. [Google Scholar] [CrossRef]
- Qu, H.; Hu, Y.; Huo, J.; Liu, Y.; Jiang, Y. Experimental study on tubular K-joints under impact loadings. J. Constr. Steel Res. 2015, 112, 22–29. [Google Scholar] [CrossRef]
- Qu, S.; Wu, X.; Sun, Q. Experimental study and theoretical analysis on the ultimate strength of high-strength-steel tubular K-Joints. Thin-Walled Struct. 2018, 123, 244–254. [Google Scholar] [CrossRef]
- Qu, S.; Wu, X.; Sun, Q. Experimental and numerical study on ultimate behaviour of high-strength steel tubular K-joints with external annular steel plates on chord circumference. Eng. Struct. 2018, 165, 457–470. [Google Scholar] [CrossRef]
- Mahmoudi, A.; Nasrollahzadeh, K.; Jafari, M.A. Probabilistic failure analysis of 400 kV transmission tower-line system subjected to wind and ice hazards. Wind. Struct. Int. J. 2021, 33, 251–264. [Google Scholar] [CrossRef]
- Nassiraei, H.; Lotfollahi-Yaghin, M.A.; Ahmadi, H.; Zhu, L. Static strength of doubler plate reinforced tubular T/Y-joints under in-plane bending load. J. Constr. Steel Res. 2017, 136, 49–64. [Google Scholar] [CrossRef]
- Nassiraei, H. Local joint flexibility of CHS X-joints reinforced with collar plates in jacket structures subjected to axial load. Appl. Ocean Res. 2019, 93, 101961. [Google Scholar] [CrossRef]
- Xie, K.; Wang, H.; Pang, J.; Zhou, J. Study of the Ultimate Bearing Capacity of Concrete-filled Steel Tube K-Joints. KSCE J. Civ. Eng. 2019, 23, 2254–2262. [Google Scholar] [CrossRef]
- Forti, N.C.S.; Requena, J.A.V.; Forti, T.L.D. Parametric study of tubular KK multiplanar steel connections. J. Constr. Steel Res. 2015, 114, 188–195. [Google Scholar] [CrossRef]
- Lan, X.; Wang, F.; Ning, C.; Xu, X.; Pan, X.; Luo, Z. Strength of internally ring-stiffened tubular DT-joints subjected to brace axial loading. J. Constr. Steel Res. 2016, 125, 88–94. [Google Scholar] [CrossRef]
- Azari-Dodaran, N.; Ahmadi, H. A numerical study on the ultimate load of offshore two-planar tubular TT-joints reinforced with internal ring stiffeners at fire-induced elevated temperatures. Ocean Eng. 2021, 230, 108797. [Google Scholar] [CrossRef]
- Yuan, D.; Cui, C.; Zhang, Q.; Li, Z.; Ye, Z. Fatigue damage evaluation of welded joints in steel bridge based on meso-damage mechanics. Int. J. Fatigue 2022, 161, 106898. [Google Scholar] [CrossRef]
- Yu, S.; Li, D.; Ou, J. Digital twin-based structure health hybrid monitoring and fatigue evaluation of orthotropic steel deck in cable-stayed bridge. Struct. Control Health Monit. 2022, 29, e2976. [Google Scholar] [CrossRef]
- Xiang, C.; Wang, D.; Wang, B.; Chen, A.; Ma, R. Numerical simulation of root-deck crack propagation of orthotropic steel bridge deck. Struct. Infrastruct. Eng. 2022, 18, 1076–1090. [Google Scholar] [CrossRef]
- Liao, F.; Zhang, K.; Wang, W.; Chen, Y.; Tang, S.; Xue, X.; Li, C. Fracture analysis of high-strength steel beam-column connections with initial defects. J. Constr. Steel Res. 2022, 194, 107301. [Google Scholar] [CrossRef]
- Han, S.; Cui, C.; Zheng, Q.-S.; Zhang, Q.-H.; Bu, Y.-Z. Effect of ultrasonic impact treatment on welding residual stress and fatigue resistance of doubly-welded rib-to-deck joints in OSD. J. Constr. Steel Res. 2023, 211, 108157. [Google Scholar] [CrossRef]
- Fan, C.; Da, L.; Wang, K.; Song, S.; Chen, H. Fatigue Tests and Failure Mechanism of Rib-to-Deck Welded Joints in Steel Bridge. Sustainability 2023, 15, 2108. [Google Scholar] [CrossRef]
- Jiang, X.; Cao, D.; Qiang, X.; Xu, C. Study on fatigue performance of steel bridge welded joints considering initial defects. J. Constr. Steel Res. 2024, 212, 108309. [Google Scholar] [CrossRef]
- Gao, S.; Yang, J.; Hou, Q. Performance degradation evaluation of square steel tubes with local penetration damage. Eng. Struct. 2024, 319, 118798. [Google Scholar] [CrossRef]
- Xu, B.; Wang, L.; Liu, Q.; Wang, R.; Xu, B.; Kong, B.; Zhang, D. Effect of Boundary Conditions and Angles on the Compressive Performance of the Corner Element. Buildings 2025, 15, 121. [Google Scholar] [CrossRef]
- Feng, R.; Lin, J.; Mou, X. Experiments on hybrid tubular K-joints with circular braces and square chord in stainless steel. Eng. Struct. 2019, 190, 52–65. [Google Scholar] [CrossRef]
- Feng, R.; Lin, J. Numerical study of hybrid tubular K-joints with circular braces and square chord in stainless steel. Thin-Walled Struct. 2019, 145, 106390. [Google Scholar] [CrossRef]
- Feng, R.; Tang, C.; Chen, Z.; Roy, K.; Chen, B.; Lim, J.B. A numerical study and proposed design rules for stress concentration factors of stainless steel hybrid tubular K-joints. Eng. Struct. 2021, 233, 111916. [Google Scholar] [CrossRef]
- GB/T 228.1-2021; Metallic Materials—Tensile Testing—Part 1: Method of Test at Room Temperature. National Standard of the People’s Republic of China: Beijing, China, 2021.
- EN 1993-1-8:2005; Eurocode 3: Design of Steel Structures—Part 1–8: Design of Joints. European Committee for Standardization (CEN): Brussels, Belgium, 2005.
- Xu, B.; Wang, R.; Zhou, K.; Zhou, X.; Xu, T.; Bian, Q. Research on the physical characteristics of a novel modified foamed cement slurry with non-foamed PVA material. Constr. Build. Mater. 2025, 459, 15. [Google Scholar] [CrossRef]
- Xu, B.; Wang, L.; Chen, Y.; Gu, J.; Fu, M.; Zhang, D. Study on Axial Load Mechanical Behavior of Square Concrete-Filled Tubular Steel Stub Column with Gap. Iran. J. Sci. Technol.-Trans. Civ. Eng. 2023, 47, 741–751. [Google Scholar] [CrossRef]
- AISC Steel Construction Manual; American Institute of Steel Construction: Chicago, IL, USA, 2011.
- Yao, R.Y.; Pang, T.; He, S.; Li, Q.; Zhang, B.; Sun, G. A bio-inspired foam-filled multi-cell structural configuration for energy absorption. Compos. Part B-Eng. 2022, 238, 109801. [Google Scholar] [CrossRef]
- Yao, R.; Yin, G.; Li, X. Quasi-static response analysis of reinforced concrete member based on explicit finite element method. Chin. J. Appl. Mech. 2018, 35, 609–615+693. (In Chinese) [Google Scholar]


Disclaimer/Publisher’s Note: The statements, opinions and data contained in all publications are solely those of the individual author(s) and contributor(s) and not of MDPI and/or the editor(s). MDPI and/or the editor(s) disclaim responsibility for any injury to people or property resulting from any ideas, methods, instructions or products referred to in the content. |
© 2025 by the authors. Licensee MDPI, Basel, Switzerland. This article is an open access article distributed under the terms and conditions of the Creative Commons Attribution (CC BY) license (https://creativecommons.org/licenses/by/4.0/).
Share and Cite
Zhong, Z.; Peng, P.; Zhu, Z.; Ao, X.; Xiong, S.; Huang, J.; Zhou, L.; Bai, X. Axial Tensile Experiment of the Lap-Type Asymmetric K-Shaped Square Tubular Joints with Built-In Stiffeners. Buildings 2025, 15, 1634. https://doi.org/10.3390/buildings15101634
Zhong Z, Peng P, Zhu Z, Ao X, Xiong S, Huang J, Zhou L, Bai X. Axial Tensile Experiment of the Lap-Type Asymmetric K-Shaped Square Tubular Joints with Built-In Stiffeners. Buildings. 2025; 15(10):1634. https://doi.org/10.3390/buildings15101634
Chicago/Turabian StyleZhong, Zhihua, Peiyu Peng, Zheweng Zhu, Xiang Ao, Shiwei Xiong, Jinkun Huang, Lihong Zhou, and Xiaochuan Bai. 2025. "Axial Tensile Experiment of the Lap-Type Asymmetric K-Shaped Square Tubular Joints with Built-In Stiffeners" Buildings 15, no. 10: 1634. https://doi.org/10.3390/buildings15101634
APA StyleZhong, Z., Peng, P., Zhu, Z., Ao, X., Xiong, S., Huang, J., Zhou, L., & Bai, X. (2025). Axial Tensile Experiment of the Lap-Type Asymmetric K-Shaped Square Tubular Joints with Built-In Stiffeners. Buildings, 15(10), 1634. https://doi.org/10.3390/buildings15101634