Abstract
The use of recycled rubber particles, in the form of crumb rubber (CR), in concrete is gaining momentum due to its environmental benefits and potential for enhancing ductility. However, the strength degradation associated with CR incorporation remains a concern. This study investigates the compressive and axial behavior of reinforced concrete columns incorporating CR and hybrid steel fibers, comprising recycled steel fibers (RSFs) and copper-coated micro steel fibers (MSFs). Sixteen circular columns with varying CR contents (0–20%) and a constant fiber dosage (0.7% RSF and 0.3% MSF by volume) were cast and tested under axial compression. The results showed that CR reduced compressive strength, while the addition of hybrid fibers significantly improved strength, ductility, and energy absorption. Columns with up to 8% CR and fibers demonstrated comparable or superior load-bearing capacity to conventional concrete. Finite element modeling using ABAQUS software (Version 6.9) validated the experimental results, with numerical predictions closely matching load–displacement behavior and failure modes. This study highlights the potential of using CR and hybrid steel fibers in structural concrete to promote sustainability without compromising performance.
1. Introduction
Rubber recycling, often referred to as waste tire recycling, involves reusing tires that are no longer suitable for vehicle use. Many tires are made each year, and their strong materials and harmful parts make it hard to manage their waste properly [1]. Environmental groups and scientists are worried about recycling “end-of-life tires”. A huge amount of tire waste is created each year, around 5 million metric tons, which is 2% of all solid waste [2]. A popular way to deal with old waste tires is by using their components in making concrete and asphalt instead of using the natural components. Scrap tire particles known as crumb rubber (CR) can replace some of the fine aggregates in concrete mixes, helping the construction industry use waste tires effectively [3]. This strategy helps in lowering the global issue of waste tire buildup due to increased vehicle use. The main downside of adding CR to concrete is that it may weaken the overall compressive strength of the produced concrete [3]. The bond between CR particles and cement paste is weak, which leads to a decrease in the mechanical and potential durability properties of rubberized concrete (RuC). However, adding CR can enhance some aspects of the concrete, such as toughness, while still meeting basic strength standards [4]. Concrete with tire rubber waste is recommended for railway sleepers and concrete structures in earthquake-prone areas. Although the properties of this RuC have been the subject of numerous studies [5,6], there has been little research into its long-term durability, which calls for more studies in this area.
Researchers are exploring methods to improve the bonding performance and mechanical durability of RuC by analyzing the effects of rubber particle size and content percentage [7,8]. In Batayan et al.’s study [9], concrete compressive strength showed a progressive decline with increasing CR replacement percentages, revealing a limitation in the maximum feasible percentage of fine aggregate that can be substituted by rubber in plain concrete. Conversely, other studies showed that replacing 10 to 15% of fine aggregate with CR resulted in cohesive integration with the remaining concrete constituents, resulting in the most favorable outcome [10,11]. To enhance CR–concrete component bonding, CR particles have been coated with pozzolanic materials such as silica fume, fly ash, and cement [8,12,13]. This CR coating enhanced the concrete strength and the overall beam’s capacity and behavior. In ref. [14], the authors proposed a new technique to minimize the CR effect on beam capacity, which would help in decreasing CR’s environmental impacts with limited negative effects on concrete structural members.
Adding metal fibers (natural or recycled) to concrete is another way to enhance its weak spots by the use of waste material. There have been lots of studies carried out on the effect of including metal fibers in concrete [13,14,15]. Additionally, the amount of recycled steel fibers added to concrete has an impact on its toughness and post-cracking performance; higher amounts of fibers lead to improved ductility and energy absorption capacities for the concrete structural members [13,14,16]. Song et al. [17] studied how steel fiber affected high-strength concrete. They found that adding steel fibers, especially in larger amounts, greatly improved the compressive strength, splitting tensile strength, and modulus of elasticity. An experimental study by Wang et al. [18] looked at how the addition of steel fibers of different lengths to concrete affected its properties. The study found that longer fiber lengths reduced the strength, stiffness, and toughness of the concrete. However, these longer fibers also helped control cracks better. The authors suggested that the best amount of fiber to use depends on the needed balance between strength and crack control. A review of over 130 studies shows that using tire rubber as a partial replacement for traditional aggregates in concrete can lower the concrete’s density by up to 20%. It also improves the material’s ductility and impact resistance. However, this method may lead to a reduction in compressive strength of up to 30% [19]. Notably, increasing the RSF content can improve the specimen’s post-peak strength and ability to absorb energy [20].
Using steel fibers in concrete makes it stronger and more flexible. It enhances properties like compressive strength, flexural strength, ductility, and toughness [21]. Fiber-reinforced concrete has many positive effects due to the fibers, which help fill cracks and improve the concrete’s ability to resist cracks. The strength, flexibility at peak load, and toughness of this type of concrete increase with a higher fiber reinforcing index [22]. Recycled steel fibers from construction waste offer a sustainable alternative to new steel fibers. Research shows that these fibers can improve concrete’s mechanical properties, including strength and toughness [22]. Recycled steel fiber-reinforced concrete performs better after cracking, making it a good choice for various uses in construction. Steel fibers are frequently utilized to improve concrete’s tensile properties and manage cracking because they offer a means of converting the matrix’s behavior from brittle to plastic after an initial crack appears [23]. Because of its superior flexural strength, ductility, and capacity to stop crack propagation, steel fiber-reinforced concrete is a superior material [24,25].
To overcome the bad effect of CR or recycled waste aggregate on concrete columns’ capacity, resulting from the reduction in concrete strength, several methods have been explored [26,27,28]. The use of EB-CFRP laminates [27], welded wire mesh [27], metal casings [26], and fibers [28] could minimize the effect of the RuC or waste aggregate concrete on a column’s capacity. As confirmed in ref. [28], the properties of hybrid columns made with recycled steel fibers of different lengths, maintaining a fixed volume ratio and consistent contents of CR at 0.0, 6.0, and 15%, were examined. Adding steel fibers to the columns resulted in a compressive strength increase of about 12% and a tensile strength increase of around 14% compared to reference samples. This improvement is linked to the strong bonding ability of recycled steel fibers with microcracks in the material. A study examining the mechanical properties of short columns made with recycled steel fiber-reinforced concrete was performed [29]. The study found that the strength of the concrete and the amount of steel greatly affected how the columns failed, while different amounts of recycled steel fiber had little effect. The axial compressive capacity and overall elasticity of the columns improved with higher concrete strength, more recycled steel fiber, and increased steel content.
Based on an extensive literature review, some tests were conducted on beams integrated with different contents of RSFs and CR. However, there are limited studies that have examined the behavior of columns cast with RuC with or without fibers. The use of CR and RSFs in concrete reduces their environmental impact, but CR decreases concrete strength as its content increases. Moreover, many studies deal with rectangular columns with waste materials, while limited studies deal with circular columns, although the two column sections have dissimilar confinement conditions. Circular sections have lower circumferences than rectangular ones with the same dimensions. The effect of fibers on enhancing the lateral deformation of circular columns should be studied. The current study highlights the characteristic behavior of concrete circular columns including a fixed ratio of 1% fiber by volume of concrete (0.7% RSF at lengths ranging from 20 to 60 mm and 0.3% industrial micro copper steel fiber (MSF)) at different ratios of CR (4, 12, and 20%) replacements of sand aggregate. The primary objective of this research was to evaluate the effects of these material combinations on the performance of the circular concrete columns. Additionally, the study determines the crack patterns and characteristic behavior of the circular concrete columns across multiple models.
2. Experimental Program
2.1. Materials
Crushed stone aggregates with a maximum nominal size of 12 mm and natural sand with a specified fineness modulus of 3.0 were utilized as the coarse and fine aggregate components in the concrete mixtures, respectively. All the concrete mixtures were prepared using Super Portland Pozzolanic Cement with a compressive strength of 52.5 N (Al Madinah Saudi Company, Riyadh, Saudi Arabia). To enhance the workability of the concrete, a Superplasticizer (Conplast SP430 [30]) with a specific gravity of 1.06 was added to the mixture. The circular columns were reinforced with steel bars of 10 mm in diameter, a yield strength of 460 MPa, an ultimate strength of 610 MPa, and a Young’s modulus of 200 GPa, as was experimentally obtained. These materials were used in the casting of normal reinforced circular concrete columns. CR powder (Figure 1a) and recycled steel fibers (RSFs, Figure 1b) obtained from a local factory in Saudi Arabia (Kenzi Rubber factory, Jeddah, Saudi Arabia) were used. The CR had a maximum particle size of 4.75 mm. The calculated specific gravity and water absorption values for the coarse aggregate were 1.26 and 1.03, respectively. The RSFs exhibited a straight configuration, with lengths ranging from 30 to 60 mm and diameters between 0.2 and 0.3 mm, as shown in Figure 1b. The specific gravity of the RSF was determined experimentally to be 2.08, while its strength was 2140 MPa according to the supplier’s data. Figure 1c shows the MSFs obtained from a Chinese company (Shandong Federal Fibre Co., Ltd., City Binzhou, Shandong, China ) with different aspect ratios of 28 and 45, respectively, and with their properties summarized in Table 1. The MSFs consisted of 50% MSF1 and 50% MSF2, which were used in this study. The grading curves of the CR and aggregates were obtained using standard sieves according to [31] and are described in Figure 2. The grading of the sand and basalt followed the ASTM C33-2003 limitation, while that of the CR did not. The CR particles were separated using standard sieves and mixed to follow the fine aggregate limitations [31] to be suitable for replacing sand. The RSF length ranged between 20 and 60 mm. So, the use of 10–16 mm fibers could be suitable to close microcracks.
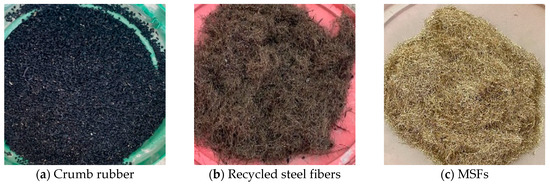
Figure 1.
The crumb rubber and fibers.

Table 1.
Steel fiber properties.
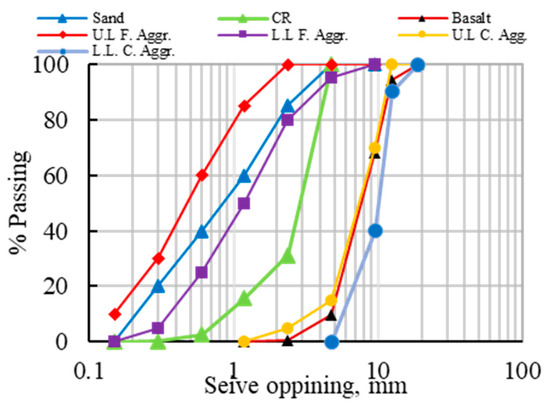
Figure 2.
Grading curves obtained experimentally using standard sieves for sand, basalt, and CR.
2.2. Concrete Mixture Proportioning
The normal concrete mixture was designed to attain a target compressive strength of 30 MPa at 28 days, following the ACI specification [32], as illustrated in Table 2. The test program included 16 columns with cross-sections of 200 mm in diameter and heights of 600 mm, 48 cube specimens measuring 100 × 100 × 100 mm3, and 32 cylindrical samples with diameters of 150 mm and heights of 300 mm. The cube and cylinder molds were manufactured from hard steel, so the tolerance of the prepared cube or cylinder dimensions was about ±2 mm. The cubic compressive strength and Brazilian splitting strength were experimentally obtained according to BS EN 12390-3 [33] and ASTM C496/C496 M–17 [34], respectively. The study involved the preparation of a control mix (R00) and three concrete mixes (R04, R12, and R20) incorporating CR into the normal concrete mix by replacing the fine aggregate at three different percentage levels: 4, 12, and 20%, respectively, by volume. To improve the concrete properties, 0.7% recycled steel fiber (RSF) and 0.3% micro copper-coated steel fiber (MSF) were added by volume to the total mix. The weight percentage of fiber in 1 m3 of concrete was calculated using the following equation:
where represents the fiber volume fraction, denotes the fiber density, indicates the matrix density, and represents the matrix volume fraction ( = 100 − ). The three mixes (R04F, R12F, and R20F) included crumb rubber as a partial replacement of sand at 4, 12, and 20%, respectively, and fibers (0.7% RSF and 0.3% MSF) by volume fraction. The choice of 1% was dependent on previous results related to the effect of fiber content on concrete capacity, which recommended 1 to 2.0% as the fiber content that could achieve the maximum concrete strength for dissimilar fiber shapes and materials [26,27,35,36,37].
Table 2.
Mix proportions for 1.0 m3.
The dry components, comprising the aggregates and cement, were initially blended. After that, water was introduced to the mixture and thoroughly mixed for an additional one minute. Subsequently, the chemical admixture, either CR or fibers, was gradually incorporated, followed by a further minute of mixing. The resulting concrete mixtures were then employed to cast the columns, cubes, and cylinders at room temperature (ref. [38], T = 25 ± 2 °C). The concrete cubes and cylinders were submerged in water for 28 days to facilitate curing (ref. [38], T = 25 ± 2 °C), after which they were stored in the ambient air at room temperature until the time of testing.
2.3. Preparation of Structural Columns
Sixteen reinforced circular concrete columns with cross-sections of 200 mm in diameter and lengths of 600 mm were investigated (Figure 3). The columns were longitudinally reinforced with six steel bars of 10 mm in diameter distributed throughout the cross-sections of the columns, with a 25 mm cover to the main reinforcement. The shear reinforcements were six stirrups (8 mm in diameter) spaced at 90 mm center-to-center (Figure 3a,b). The bars and stirrups were carefully added to a wooden mold, and plastic spacers were installed to accommodate the concrete cover (Figure 3c). the columns were gradually cast and compacted using a mechanical vibrator. The columns were demolded 24 h later and cured using water as described in Figure 3d. Water was added two times a day to keep the specimens wet. The mixing, casting, curing, and testing of all the circular columns were performed at room temperature (25 ± 2 °C). The dimension tolerance of the column section was ± 3.0 mm, while the columns’ height tolerance was ± 5.0 mm. Sixteen RC columns were fabricated using different mixes and were categorized into eight groups based on the experimental parameters under investigation (Table 3). Two columns (C00) were cast with normal concrete, and the others were cast with RuC with and without fibers. The two columns prepared from the R00 mix were tested as control columns. Moreover, three groups of RC columns (C04, C12, and C20) were prepared from RuC mixture R04, R12, and R20, respectively, and tested to investigate the influence of CR content on the columns’ response and capacity. Another group of columns (C00F) consisted of two columns prepared from the fiber-reinforced mix (R00F) to study the effect of hybrid fibers on the columns’ response and capacity.
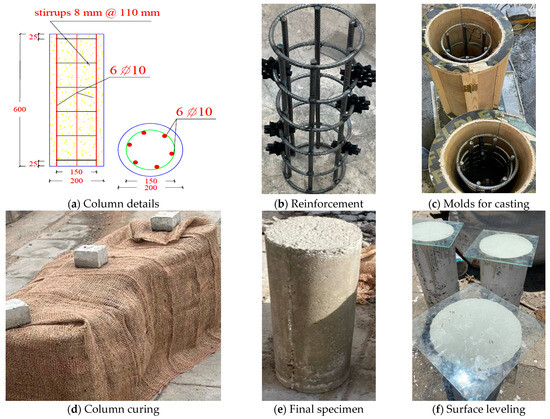
Figure 3.
Preparation of RC columns.
Table 3.
The columns‘ details and test parameters.
Finally, the last three groups (C04F, C12F, and C20F) were cast from RuC containing fibers. Two columns were prepared in each group with dissimilar CR contents and a fixed steel fiber content. The C04F columns were prepared from mix R04F (4% CR, 0.7% RSF, and 0.3% MSF). The C12F columns were prepared from mix R12F (12% CR, 0.7% RSF, and 0.3% MSF). The C20F columns were prepared from mix R20F (20% CR, 0.7% RSF, and 0.3% MSF). After 28 days of curing, the columns were kept in air (Figure 3e), then the column surfaces were smoothed using Gypsum, as in Figure 3f.
2.4. Experimental Set-Up and Instrumentation
A hydraulic universal testing machine was utilized to apply compressive loads to the columns. Two steel plates were positioned on the upper and lower surfaces of the columns to distribute the axial load evenly across the column surfaces Figure 4. The load was gradually applied to the columns at a displacement rate of 0.5 mm per minute until failure. The machine was programmed to automatically cease once the load dropped to 50% of the maximum capacity of the loaded column. To obtain the load–contraction of the columns, a Linear Variable Differential Transformer (LVDT) was installed, as in Figure 4, to collect the contraction of the columns at each loading value. All column data were recorded through a computerized system connected to the machine.
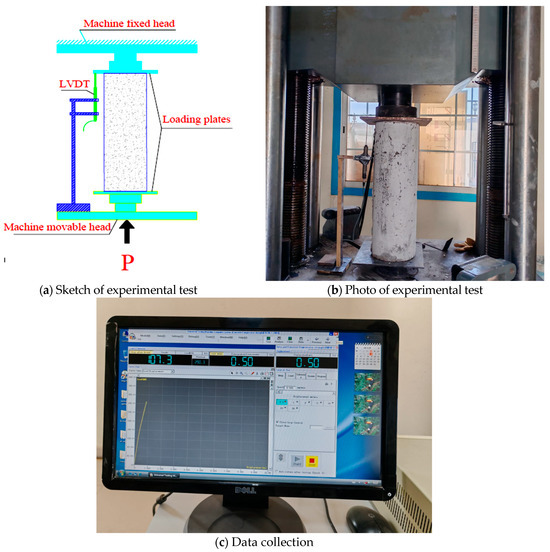
Figure 4.
Column set-up and instrumentation.
3. Experimental Results
3.1. Concrete Properties
3.1.1. Compressive Strength
The compressive strengths of the prepared concrete are listed in Table 4, reporting a 28-day concrete strength of the reference mix to equal 30.7 MPa. Cubes at the age of 28 days were investigated to determine their compressive strength. The strengths of three cubes cast for each mix were averaged to obtain the average concrete strength for that mix. The cube strengths showed good correlation, with standard deviation ranging between ±0.5 and ±1.8. Adding CR at 4% as a sand replacement (by volume) in the mix decreased the concrete strength to 26.5 MPa (about 20.7% reduction). Moreover, increasing the CR to 12% in the mix reduced the concrete strength to 20.3 MPa (about a 39.2% reduction). Furthermore, the extra addition of CR content to 20% decreased the concrete strength by about 48.2% (compressive strength = 17.3 MPa). This reduction in concrete strength was owed to the lower stiffness and surface smoothness of the CR particles. When the sand, as a hard material, was replaced by a soft material like CR with a lighter weight, this led to a reduction in the compressive strength of the concrete [39]. On the other hand, the weak bonding between the CR and the concrete ingredients, especially the cement, led to the creation of cracks around the CR particles, which led to a reduction in compressive strength [40].
Table 4.
Compressive and tensile strengths of concrete with and without CR and fibers.
The R00F mix, which contained fibers (0.7% RSF and 0.3% MSF) but was without CR, showed a 180.5% increase in compressive strength compared to the R00 mix. The incorporation of 4% CR to the R00F mix (R04F) diminished the concrete strength compared to R00F, while the compressive strength of the R04F was enhanced by 127.5% compared to R00. The increment of CR in the R12F mix with integrated fibers (0.7% RSF and 0.3% MSF) showed a 112.9% increment in strength compared to R00, while adding 20% CR to the R00F mix (R20F) resulted in a concrete compressive strength of 84.7% of the R00 mix. The same effect of fibers on enhancing concrete strength was also reported by [41].
3.1.2. Split Tensile Strength
To obtain the concretes’ splitting tensile strengths, the average of three cylindrical specimens (300 mm height and 150 mm diameter) was calculated after testing at 28 days, as per ASTM C496/C496 M-17 [34]. The cylinder strengths showed good correlation, with standard deviation ranging between ±0.08 and ±0.12. The R00 mix showed a 3.1 MPa tensile strength (Table 4). The integration of 4, 12, and 20% CR into the concrete mixes to replace the sand (by volume) reduced the tensile strength by 13.5, 24.3, and 51.4%, respectively. With the addition of fibers to the control mix (R00), the tensile strength of the concrete mix with fibers (R00F) increased by 113.5% compared to R00. The addition of CR to the mixes with fibers to replace the sand by 4, 12, and 20% reduced the tensile strength by 8.1, 13.5, and 24.3%, respectively, compared to R00. Comparing the results cast with CR with those cast with both CR and fibers showed the effect of fibers on enhancing the concrete tensile strength by decreasing the negative effect of CR (Table 4).
3.2. Behavior of Tested Columns
As discussed above, two columns were tested to attain the effect of each factor on the columns’ performance. The two columns’ results were averaged and are listed in Table 5 for comparison with the other columns. The reference columns cast with normal concrete (C00) experienced an average load capacity of 980.5 kN with a standard deviation of ±2.1. The three columns cast with RuC (C04, C12, and C20) experienced load capacities of 900.5, 760.6, and 730.3 kN, respectively (Table 5). The standard deviation of the RuC columns’ capacity increased with the rise in CR content, revealing the irregular distribution of the CR through the mix as the CR content increased. The capacities of the previous three RuC columns were reduced by 8.2, 22.4, and 25.5%, respectively, compared to C00. The effect of the CR content on the columns’ capacity was obvious. When increasing the CR content replacement ratio, the columns’ capacity diminished due to their lower stiffness and strength characteristics, in addition to the higher compressibility of the CR particles compared to sand. Adding 1% steel fibers to the columns (0.7% RSF and 0.3% MSF) to the columns cast with normal concrete or RuC enhanced their load capacity compared to the corresponding columns cast without fibers (Table 5).
Table 5.
The results of the tested circular columns.
The columns cast with 1% fibers and the R00 mix experienced a load capacity of 1623.6 kN (about 165.6%) compared to C00. The steel fibers enhanced both the concrete’s tensile and compressive strengths, thus enhancing the columns’ capacity. Besides the role of the fibers in enhancing the concrete strength, they also helped in delaying the columns’ cracking and crack propagation. The fibers might help in confining the columns in the lateral directions, which enhances their load-bearing capacity compared to C00. Moreover, the incorporation of the fibers in the columns cast with RuC also enhanced their capacity compared to those without fibers, depending on the CR content. The MSFs with small lengths could help in closing the concrete microcracks formed at lower loading levels. As the load increased, the crack propagation was arrested by the RSFs with longer lengths than the MSFs. The sound of crack cutting was heard during the loading stages, while no fiber debonding was observed, as in Figure 5. The load capacity enhancement was 128.6 and 116.6% for the two C05F and C12F columns, respectively, compared to C00, while the C20F columns retained about 97% of the C00 columns’ capacity.
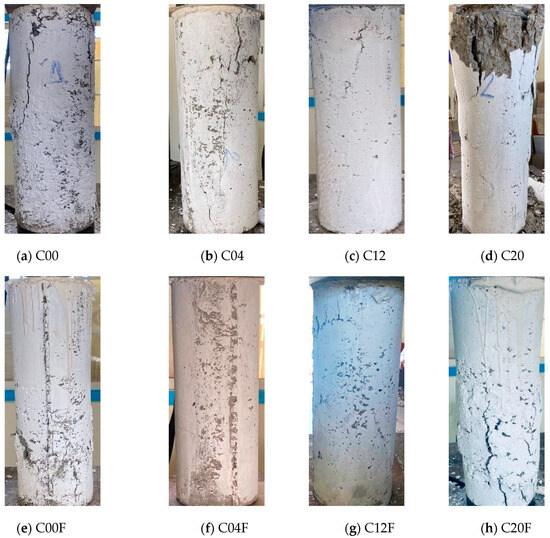
Figure 5.
Failure of RC circular columns under axial loads.
To highlight the fibers’ effects on enhancing the RuC columns, the results of the three C04, C12, and C20 columns were compared to the C04F, C12F, and C20F columns, respectively. The load capacities of the C04F, C12F, and C20F columns were enhanced by 40.0, 50.4, and 30.3% over those cast without fibers (C04, C12, and C20), respectively. The hybrid steel fibers reduced the effects of CR on the column capacity by closing the cracks caused by the CR particles and enhancing the columns’ lateral confinement, in addition to their enhancement of concrete strength (Table 5). All the columns failed due to longitudinal cracking rather than concrete splitting due to lateral tensile stress (Figure 5). Increasing the CR content increased the columns’ lateral deformations and decreased the columns’ capacities. During the loading of the columns, narrow cracks formed along the columns’ surfaces near the loading end and propagated towards the middle height of the columns (Figure 5a–c). At 20% CR content, the concrete column crashed near its upper end due to the low concrete strength of the R20 mix (Figure 5d). For the columns with fibers, a sound was heard during loading, revealing the crack cutting. No fiber debonding was observed for all the columns integrating fibers (Figure 5e–h). As the CR content in the columns with fibers increased to 20%, the cracks became wider, and more fibers were cut than in the other columns with fibers and low CR contents (Figure 5h).
3.3. Column Toughness
The toughness was calculated by summing all the areas enclosed by the P-Δ curve for all the columns until failure (Table 5). The toughness of any column was the summation of the two regions’ areas under the P-Δ curve (T1 and T2). T1 is the elastic toughness energy and equals the area of the triangle, while T2 is plastic toughness and equals the area of the parabolic shape (Figure 6a, toughness for C00).
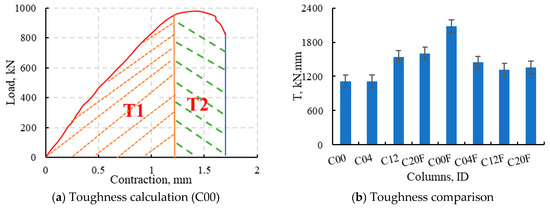
Figure 6.
The toughness of the tested columns.
The C00F column showed the highest toughness among all the columns, while the C04 column showed the lowest (Figure 6b). The toughness values of C00F and C04 were 186.7 and 99.8% compared to C00. Consequently, except for the columns with 4% CR, the columns integrating CR only showed higher toughnesses than the corresponding columns with both fibers and CR (Figure 6b). The integration of CR into the columns increased their contraction under loading, thus increasing the columns’ toughness. The toughness values of C12 and C20 were 138.7 and 143.7% compared to C00, respectively. The addition of fibers to the columns’ concrete decreased the columns’ contraction and increased their load capacity, leading to a diminishing of the columns’ toughness (Figure 6b). The toughness values of C12 and C20 were 85.4 and 84.9% compared to C12F and C20F, respectively, assuring the constant effect of the fibers on the column’s toughness for these two columns.
3.4. Load–Displacement Behavior
The influence of fiber and CR content on the columns’ response is summarized in Figure 7. The presence of CR in the columns’ concrete decreased their stiffness by different values depending on the CR replacement ratio. The 4% CR concrete had the smallest effect on decreasing the columns’ stiffness at the beginning of the loading, but the difference in stiffness between C00 and C04 increased as the load reached 700 kN and went up to failure. The difference in the columns’ stiffness between the C00 and RuC columns rose with CR contents of 12% and 20% (Figure 7a). CR’s low density and compressibility compared to sand allowed the RuC columns to have more contraction compared to C00.
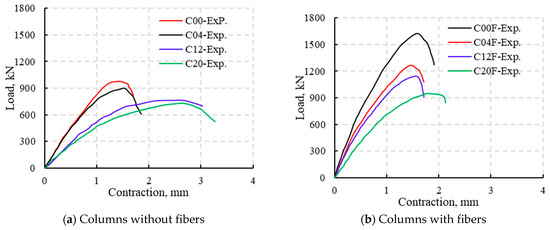
Figure 7.
Effect of CR content and fiber on load–deformation curves of RuC columns.
The difference in stiffness between C12 and C20 was lower than that between C12 and C00 (Figure 7a), which ensured the increment in CR’s effect on column response as its content increased. Conversely, the addition of fibers to concrete enhanced its stiffness and capacity as it enhanced the concrete strength, helped to close cracking, and decreased the column lateral deformation (Figure 7b). The fibers played an essential role in enhancing the RuC column’s stiffness and load capacity. The existence of CR with fibers in the RuC columns also decreased the CR concrete’s stiffness and column load capacity (Figure 7b). The two C04F and C12F columns showed the lowest stiffness difference at all load levels, while the difference increased between C00F and C04F and between C12F and C20F (Figure 7b). This means that the effect of fibers on enhancing the columns’ stiffness lessened as the CR content increased beyond 12% (Figure 7b).
4. Finite Element Modeling
4.1. Material Modeling
The RuC columns’ responses were modeled with the help of ABAQUS software (Version 6.9) [42] to predict their load capacity and failure characteristics when subjected to axial loads under the effect of several CR contents and fibers. The experimental results reported in the previous sections were utilized to ensure the suitability of the FE model to precisely simulate the columns’ behavior. As the simulated columns consisted of concrete and steel reinforcement, a Concrete Damage Plasticity (CDP [43,44,45,46,47]) model and a bi-linear elastic–plastic approach were implemented to simulate their behavior, respectively. The CDP model had better convergence and fewer errors than the smeared crack model. Based on [47], the following equations governing the concrete in compression were used to obtain the required data for the FE model (Equations (2)–(11)).
In refs. [43,47,48], the simulation of concrete under tension was reported. The simple model in ref. [49] was proposed to obtain the concrete tensile envelope curve (Equation (12))
The stress–strain relationship for concrete introduced to the FE modeling is shown in Figure 8. Based on [22,45,46,50], the recommended viscosity (μ) value was zero, while the recommended dilation angle (ψ) was 35° [51,52]. In [47,49,53,54,55,56], the Kc value was in the range of 0.64 and 0.80, while the recommended default value is 0.66 [42]. The stress ratio (fbo/fco) ranged from 1.10 to 1.16, based on [47,49], while [42] recommended 1.16 as the default value. e = 0.1 was adopted in the current model. The compression and tension parameters (dc and dt, respectively) were obtained from the following equations.
where εc is the maximum compressive strain, εcP is the plastic strain, εt is the maximum tensile strain, and εtP is the cracking strain [42]. Young’s modulus (E), Poisson’s ratio (υ), and yield and maximum stresses were the parameters needed to model the steel tension response (Figure 9).
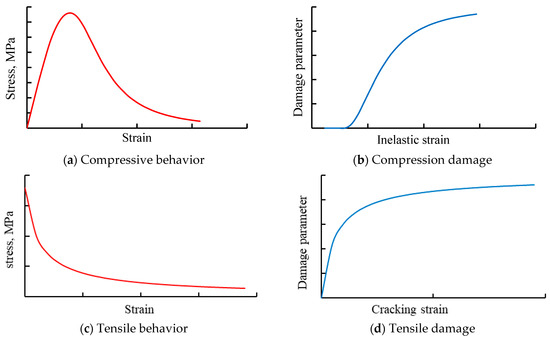
Figure 8.
The concrete data for the CDP model.
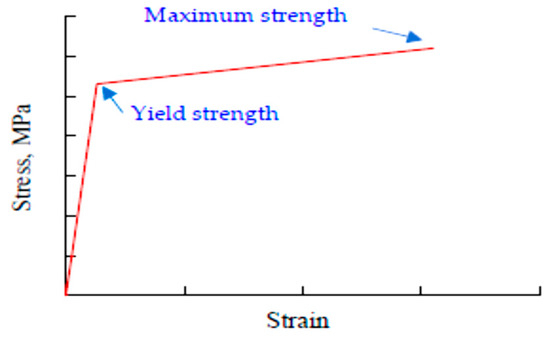
Figure 9.
The steel material model.
4.2. Model and Boundary Conditions
The column’s responses were modeled through a non-linear three-dimensional FE model under axial loading until collapse. A hinged boundary condition was applied at the base of the columns using a reference point linked to the bottom steel plate via a rigid-body constraint. The steel plate was connected to the column’s bottom surface through the tie constraint option. The same approach was followed at the top surface of the column, but the reference point was set to a displacement-loading-controlled scheme. The steel bars and stirrups were connected to the concrete columns through the embedded region constraint (the steel bars and stirrups were the embedded region while the concrete was the host region). The column elements adopted for the model and its mesh are shown in Figure 10a.
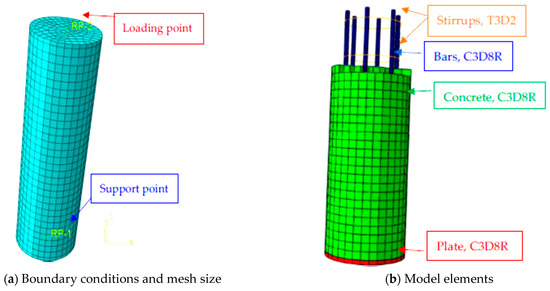
Figure 10.
Modeling of columns.
The concrete, steel bars, and loading plate were simulated as a continuous, three-dimensional, eight-node linear hexahedral solid element with reduced integration (C3D8R), while a two-node linear truss element (T3D2) was used for the stirrups (Figure 10b). The μ, Kc, fbo/fco, and e were chosen to equal the recommended values discussed above. A sensitivity analysis was performed on C00 to adopt the ψ and the mesh size. Through the sensitivity analysis conducted on the C00 column and its experimental results, the ψ value and mesh size were adopted. The ψ value ranged from 34 to 38°, and mesh sizes of 10, 15, 20, 25, and 30 mm were used in this sensitivity analysis. The analysis recommended using a 20 mm mesh size (Figure 10b) and a value of 36º for ψ. The chosen values allowed the model to obtain the nearest column capacities and load deflection curves to the experimental ones at the lowest processing time. To find the CR content and fiber effect on the column’s response, the f’c was changed depending on the experimental data.
4.3. FE Model Verification
The FE columns’ results showed good agreement with those found in the experiments in terms of load capacity (Table 6), load–contraction curves (P-Δ, Figure 11), and cracking maps (Figure 12). From Table 6, the average of the FE/experimental load ratios was 101.4, with 0.7 standard deviations. The maximum error between the experimental and FE findings was 3.2%, which assured the accuracy of the FE model and increased its independence to gain more data about the behavior of the experimental tested columns. Moreover, Figure 10 compares the experimental P-Δ curves and the corresponding FE ones. The figure assures the capability of the FE model to obtain, with good precision, the effect of the CR content and fibers on the columns’ stiffness under all loading stages when compared with the experiments. Consequently, Figure 11 also explains the failure of the FE-simulated columns through the tension damage (DAGAGET) and compression damage (DAMAGEC) options available in Abaqus. All the columns suffered from tension cracking, and the cracks increased as the CR content increased and decreased when fibers were used. The tension and compression damage spread along larger areas for columns cast without fibers and decreased as fibers were added, which revealed the role of fibers in arresting the cracks and delaying the columns’ failure.
Table 6.
Comparison between FE and experimental results of columns.
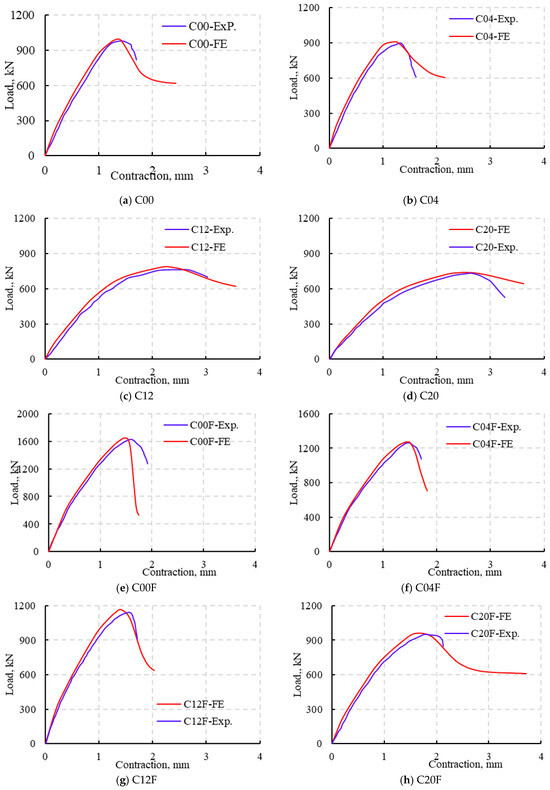
Figure 11.
FE versus experimental load–deformation curves.
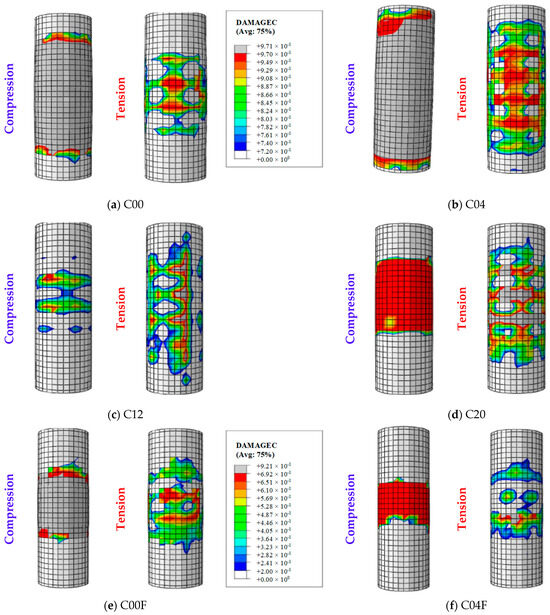
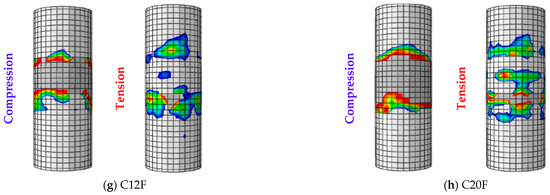
Figure 12.
FE damage of specimens in tension and compression.
Figure 13 explains the FE strain distribution along the column height at different contractions. As is well known, at the same contraction, columns experience dissimilar capacity loads based on their concrete characteristics. The recorded strain in the concrete and steel was identical. The strain at the load ends was lower than their values at the columns’ full height and the columns had higher lateral expansions at their middle parts than ends; the two C00 and C04 columns attained the same strain distribution until failure at the same contraction values (Figure 13a,b), which means the strain in C00 was lower than that in C04 at the same load level. The higher the CR content, the higher the ductility of the columns. The C20 column failed at a higher contraction value than C12, with lower load-bearing capacity. So, the recorded strain along the C20 height was higher than for C12 (Figure 13c,d). The addition of fibers to the columns’ concrete allowed the columns to bear more load capacity and experience lower steel and concrete strain compared to those with CR only. The fibers decreased the lateral and longitudinal deformation of the columns (Figure 13). The previous discussion assures the experimental findings and the effect of both CR and fibers on the columns’ response and capacity.
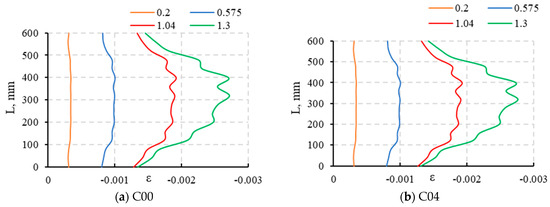
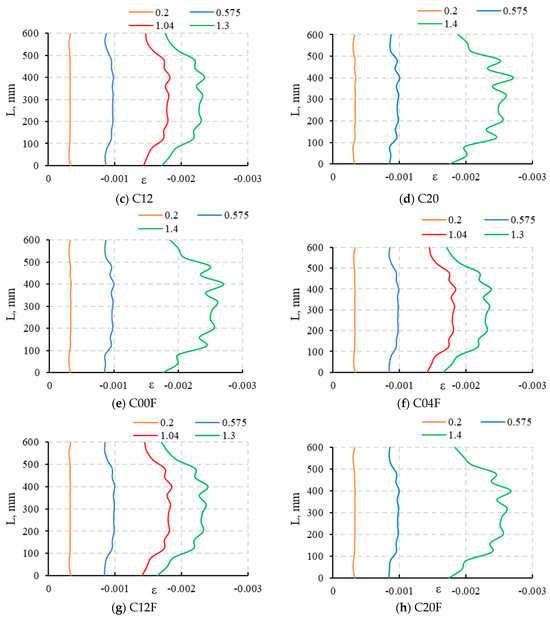
Figure 13.
Strain along columns’ height.
5. Conclusions
The study aimed to examine concrete column behavior with rubber waste as a substitute for fine aggregates with and without fiber. The fibers (0.7% recycled steel fibers and 0.3% micro copper-coated fibers) were added to the rubberized concrete mixes. Different crumb rubber amounts were used as fine aggregate replacements. The study presents its key findings from the tested and FE-simulated columns as follows:
- The addition of CR to concrete to substitute sand diminished the concrete’s compressive and tensile strengths, while the addition of hybrid fibers to the normal and RuC mixes generally enhanced their strength.
- The columns cast with RuC mixes experienced lower load capacities than those cast with normal concrete (C00). The incorporation of fibers into the columns’ concrete mixes reduces the CR effect on the columns’ capacity by enhancing their lateral and longitudinal deformation capacities.
- The columns cast with 1% hybrid fibers and CR content, ranging from 0 to 20%, had their capacity enhanced by 97 to 165.6% compared to C00. The column toughness increased as the CR increased, or when hybrid fibers were added.
- The FE model could predict the columns’ responses and capacities with good agreement with the experimental results, and helped to clarify the effect of the CR and hybrid fibers on the columns’ responses through the comparison of strain distribution along the columns’ heights.
- The incorporation of CR to columns could reduce the environmental impact of car tire waste. To minimize the CR’s effects on columns’ capacity, recycled steel tire fibers should be added to the concrete mixes, increasing the columns’ capacities at CR contents up to 12%. Moreover, the columns with CR and fibers failed in a more ductile manner compared to those cast with normal concrete.
Author Contributions
Conceptualization, I.A.S.; Data Curation, A.S.E.; Formal Analysis, A.E.-Z.; Investigation, H.A.A. and A.S.E.; Methodology, H.A.A., A.S.E. and A.E.-Z.; Project Administration, I.A.S.; Resources, A.E.-Z.; Software, H.A.A. and A.S.E.; Supervision, I.A.S.; Validation, H.A.A. and A.E.-Z.; Writing—Original Draft, H.A.A., I.A.S. and A.S.E.; Writing—Review and Editing, A.E.-Z. All authors have read and agreed to the published version of the manuscript.
Funding
This research was funded by Taif University, Saudi Arabia, project No. (TU-DSPP-2024-196).
Data Availability Statement
The data presented in this study are available on request from the corresponding author.
Acknowledgments
The authors extend their appreciation to Taif University, Saudi Arabia, for supporting this work through project number (TU-DSPP-2024-196).
Conflicts of Interest
The authors declare no conflicts of interest.
Abbreviations
| Ec | tangent modulus of elasticity |
| Esec | secant modulus of elasticity |
| f’c | specified concrete compressive strength |
| n | material parameter |
| n1 | modified material parameter in the ascending branch |
| n2 | modified material parameter in the descending branch |
| εc | axial concrete strain |
| ε’c | tensile strain corresponding to tensile strength |
| εtc | cracking strain |
| εtp | plastic strain |
| εt | maximum tensile strain |
| σc | concrete stress in general |
| σt | concrete tensile stress in general |
References
- Thomas, B.S.; Gupta, R.C. A Comprehensive Review on the Applications of Waste Tire Rubber in Cement Concrete. Renew. Sustain. Energy Rev. 2016, 54, 1323–1333. [Google Scholar] [CrossRef]
- Candra, P.R.; Siswanto, H. Marshall Characteristics of Asphalt Concrete Wearing Course Using Crumb Rubber Modified of Motorcycle Tire Waste as Additive. Mater. Sci. Forum 2019, 961, 57–61. [Google Scholar] [CrossRef]
- Zhou, M.; Wang, F. Mechanical Performance of Concrete-Encased Prismatic Girders with Corrugated Steel Webs. Eng. Struct. 2024, 303, 117559. [Google Scholar] [CrossRef]
- Ling, T.C.; Nor, H.M.; Lim, S.K. Using Recycled Waste Tyres in Concrete Paving Blocks. Proc. Inst. Civ. Eng.-Waste Resour. Manag. 2010, 163, 37–45. [Google Scholar] [CrossRef]
- Albano, C.; Camacho, N.; Reyes, J.; Feliu, J.L.; Hernández, M. Influence of Scrap Rubber Addition to Portland I Concrete Composites: Destructive and Non-Destructive Testing. Compos. Struct. 2005, 71, 439–446. [Google Scholar] [CrossRef]
- Aslani, F. Mechanical Properties of Waste Tire Rubber Concrete. J. Mater. Civ. Eng. 2016, 28, 04015152. [Google Scholar] [CrossRef]
- Azevedo, F.; Pacheco-Torgal, F.; Jesus, C.; Barroso de Aguiar, J.L.; Camões, A.F. Properties and Durability of HPC with Tyre Rubber Wastes. Constr. Build. Mater. 2012, 34, 186–191. [Google Scholar] [CrossRef]
- Sharaky, I.A. Effect of Particle Size of the Coated and Un-Coated Crumb Rubber on the Mechanical Properties and Water Absorption of Rubberized Concrete. Res. Eng. Struct. Mater. 2024, 10, 771–788. [Google Scholar] [CrossRef]
- Batayneh, M.K.; Marie, I.; Asi, I. Promoting the Use of Crumb Rubber Concrete in Developing Countries. Waste Manag. 2008, 28, 2171–2176. [Google Scholar] [CrossRef]
- Abu Bakar, B.H.; Noaman, A.T.; Md. Akil, H. Cumulative Effect of Crumb Rubber and Steel Fiber on the Flexural Toughness of Concrete. Eng. Technol. Appl. Sci. Res. 2017, 7, 1345–1352. [Google Scholar] [CrossRef]
- Khaloo, A.R.; Dehestani, M.; Rahmatabadi, P. Mechanical Properties of Concrete Containing a High Volume of Tire–Rubber Particles. Waste Manag. 2008, 28, 2472–2482. [Google Scholar] [CrossRef] [PubMed]
- Ahmed, S.; Sharaky, I.A.; El Sayed, S.; Hassan, H.; Abdo, A. Effect of Rubberized Concrete Integrating Uncoated and Coated Crumb Rubber on the Flexural Behavior of the RC Beams Reinforced with Steel and GFRP Bars. Constr. Build. Mater. 2024, 426, 136192. [Google Scholar] [CrossRef]
- Abdo, A.; Sharaky, I.A.; Eisa, A.; Ahmed, S. Flexural Behavior of Steel/GFRP Reinforced Concrete Beams Having Layered Sections Integrated with Normal and Rubberized Concrete. Structures 2024, 70, 107633. [Google Scholar] [CrossRef]
- Sharaky, I.A.; Seleem, M.H.; Elamary, A.S. Minimizing the Crumb Rubber Effects on the Flexural Behaviour of the Layered RC Beams Cast Using Rubberized Concrete with or without Recycled Tire Steel Fibers. Constr. Build. Mater. 2023, 400, 132503. [Google Scholar] [CrossRef]
- Afroughsabet, V.; Biolzi, L.; Cattaneo, S. Evaluation of Engineering Properties of Calcium Sulfoaluminate Cement-Based Concretes Reinforced with Different Types of Fibers. Materials 2019, 12, 2151. [Google Scholar] [CrossRef]
- Park, J.-J.; Yoo, D.-Y.; Park, G.-J.; Kim, S.-W. Feasibility of Reducing the Fiber Content in Ultra-High-Performance Fiber-Reinforced Concrete under Flexure. Materials 2017, 10, 118. [Google Scholar] [CrossRef]
- Song, P.; Hwang, S. Mechanical Properties of High-Strength Steel Fiber-Reinforced Concrete. Constr. Build. Mater. 2004, 18, 669–673. [Google Scholar] [CrossRef]
- Wang, Z.L.; Wu, J.; Wang, J.G. Experimental and Numerical Analysis on Effect of Fibre Aspect Ratio on Mechanical Properties of SRFC. Constr. Build. Mater. 2010, 24, 559–565. [Google Scholar] [CrossRef]
- Saad, A.G.; Sakr, M.A.; Khalifa, T.M.; Darwish, E.A. Structural Performance of Concrete Reinforced with Crumb Rubber: A Review of Current Research. Iran. J. Sci. Technol. Trans. Civ. Eng. 2024. [Google Scholar] [CrossRef]
- Golpasand, G.B.; Farzam, M.; Shishvan, S.S. Behavior of Recycled Steel Fiber Reinforced Concrete under Uniaxial Cyclic Compression and Biaxial Tests. Constr. Build. Mater. 2020, 263, 120664. [Google Scholar] [CrossRef]
- Huo, J.; Bai, X.; Jiang, P.; Xue, Y.; Song, D.; Chu, J. Effect of Different Fiber Content on Mechanical Properties of Recycled Concrete. IOP Conf. Ser. Mater. Sci. Eng. 2018, 439, 042051. [Google Scholar] [CrossRef]
- Shi, X.; Park, P.; Rew, Y.; Huang, K.; Sim, C. Constitutive Behaviors of Steel Fiber Reinforced Concrete under Uniaxial Compression and Tension. Constr. Build. Mater. 2020, 233, 117316. [Google Scholar] [CrossRef]
- Salim, D.; Mohammed, H.; Abdulazeez, A.; Asaad, A.-H. Flexural Strength and Ductility of Ultra High-Performance Cement-Based Composites (UHP-CC). J. Appl. Eng. Sci. 2022, 20, 131–136. [Google Scholar] [CrossRef]
- Gong, J.; Ma, Y.; Fu, J.; Hu, J.; Ouyang, X.; Zhang, Z.; Wang, H. Utilization of Fibers in Ultra-High Performance Concrete: A Review. Compos. Part B Eng. 2022, 241, 109995. [Google Scholar] [CrossRef]
- Hammood, R.A.; Syed Mohsin, S.M. Effect Use of Steel Fiber on Mechanical Properties of Concrete Mixture. IOP Conf. Ser. Earth Environ. Sci. 2019, 365, 012007. [Google Scholar] [CrossRef]
- Ozkilic, Y.O.; Madenci, E.; Mansour, W.; Sharaky, I.A.; Fayed, S. Behavior of Self-Compacting Recycled Concrete Filled Aluminum Tubular Columns under Concentric Compressive Load.Pdf. Steel Compos. Struct. 2024, 51, 243–260. [Google Scholar] [CrossRef]
- Sharaky, I.A.; Elamary, A.S.; Alharthi, Y.M.; Abdo, A. Effect of Normal and Rubberized Concrete Properties on the Behavior of RC Columns Strengthened with EB CFRP Laminates and Welded Wire Mesh under Static Axial Loading. Polymers 2022, 14, 5351. [Google Scholar] [CrossRef]
- Alasmari, H. Influence of Crumb Rubber and Recycled Steel Fibers on Hybrid Layered Reinforced Concrete Columns under Compression Load. Eng. Technol. Appl. Sci. Res. 2024, 14, 13313–13318. [Google Scholar] [CrossRef]
- Wang, B.; Lv, H.; Gao, Y.; Tang, M.; Ding, N.; Zhao, X.; Zhao, H.; Hu, X. Experimental Study on Axial Compressive Performance of Recycled Steel Fiber Reinforced Concrete Short Columns with Steel Pipes. Buildings 2024, 14, 2498. [Google Scholar] [CrossRef]
- Available online: https://www.fosroc.com/product/show/conplast-Sp430 (accessed on 12 April 2025).
- ASTM C33/C33M-18; Standard Specification for Concrete Aggregates. ASTM International: West Conshohocken, PA, USA, 2003.
- ACI 211.1; Standard Practice for Selecting Proportions for Normal, Heavyweight, and Mass Concrete (ACI 211.1-91). American Concrete Institute: Farmington Hills, MI, USA, 2002.
- BS EN 12390-3:2009; Testing Hardened Concrete, Part 3: Compressive Strength of Test Specimens. British Standardisation Institute: London, UK, 2009.
- ASTM C496/C496M-17; Standard Test Method for Splitting Tensile Strength of Cylindrical Concrete Specimens. ASTM International: West Conshohocken, PA, USA, 2011.
- Wang, G.; Zhuang, Y.; Song, L.; He, Z.; Zhang, J.; Zhou, H. Mechanical Properties and Failure Mechanism of Fiber-Reinforced Concrete Materials: Effects of Fiber Type and Content. Constr. Build. Mater. 2025, 465, 140190. [Google Scholar] [CrossRef]
- Ma, J.; Yuan, H.; Zhang, J.; Zhang, P. Enhancing Concrete Performance: A Comprehensive Review of Hybrid Fiber Reinforced Concrete. Structures 2024, 64, 106560. [Google Scholar] [CrossRef]
- Ahmed, H.U.; Faraj, R.H.; Hilal, N.; Mohammed, A.A.; Sherwani, A.F.H. Use of Recycled Fibers in Concrete Composites: A Systematic Comprehensive Review. Compos. Part B Eng. 2021, 215, 108769. [Google Scholar] [CrossRef]
- 192/C 192M; The American Society for Testing Materials Standard Practice for Making and Curing Concrete Test Specimens in the Laboratory. The American Society for Testing Materials: West Conshohocken, PA, USA, 2000.
- Marie, I. Thermal Conductivity of Hybrid Recycled Aggregate-Rubberized Concrete. Constr. Build. Mater. 2017, 133, 516–524. [Google Scholar] [CrossRef]
- Reda Taha, M.M.; El-Dieb, A.S.; Abd El-Wahab, M.A.; Abdel-Hameed, M.E. Mechanical, Fracture, and Microstructural Investigations of Rubber Concrete. J. Mater. Civ. Eng. 2008, 20, 640–649. [Google Scholar] [CrossRef]
- Rossli, S.; Ibrahim, I. Mechanical Properties of Recycled Steel Tire Fibres in Concrete. Fac. Civil Eng. 2012. [Google Scholar]
- Hibbitt, I. ABAQUS Theory Manual, User Manual and Example Manual; Version 6.9; Dassault Systèmes Simulia Corp: Providence, RI, USA, 2009. [Google Scholar]
- El-Mandouh, M.A.; Elsamak, G.; Rageh, B.O.; Hamoda, A.; Abdelazeem, F. Experimental and Numerical Investigation of One-Way Reinforced Concrete Slabs Using Various Strengthening Systems. Case Stud. Constr. Mater. 2023, 18, e01691. [Google Scholar] [CrossRef]
- Ahmed, S.; Sharaky, I.; Ibrahim, Y.; Abdo, A. Flexural Response of GFRP RC Beams Strengthened with Side and Bottom NSM GFRP Bars. Case Stud. Constr. Mater. 2023, 18, e01858. [Google Scholar] [CrossRef]
- Sharaky, I.; Elamary, A.; Alharthi, Y. Experimental and Numerical Investigation on the Flexural Performance of RC Slabs Strengthened with EB/NSM CFRP Reinforcement and Bonded Reinforced HSC Layers. Eng. Struct. 2023, 289, 116338. [Google Scholar] [CrossRef]
- Abdo, A.; Sharaky, I.; Ahmed, S. Shear Performance of Reinforced Concrete Beams Strengthened in Shear Using NSM Bars and Reinforced HSC Layers. Struct. Concr. 2023, 24, 7295–7313. [Google Scholar] [CrossRef]
- Carreira, C. Stress-Strain Relationship for Plain Concrete in Compression. ACI J. Proc. 1985, 82, 797–804. [Google Scholar] [CrossRef]
- Nataraja, M.C.; Dhang, N.; Gupta, A.P. Stress–Strain Curves for Steel-Fiber Reinforced Concrete under Compression. Cem. Concr. Compos. 1999, 21, 383–390. [Google Scholar] [CrossRef]
- Yuan, F.; Wei, W.; Hu, R. Shear Strengthening of Reinforced Concrete Beams with High-Strength Steel Wire and Engineered Cementitious Composites. Adv. Struct. Eng. 2022, 25, 158–170. [Google Scholar] [CrossRef]
- Seleem, M.; Megahed, F.; Badawy, A.; Sharaky, I. Performance of NSM and EB Methods on the Flexural Capacity of the RC Beams Strengthened with Reinforced HSC Layers. Structures 2023, 56, 104950. [Google Scholar] [CrossRef]
- Jahani, Y.; Baena, M.; Barris, C.; Torres, L.; Sena-Cruz, J. Effect of Fatigue Loading on Flexural Performance of NSM CFRP-Strengthened RC Beams under Different Service Temperatures. Eng. Struct. 2022, 273, 115119. [Google Scholar] [CrossRef]
- Sharaky, I.; Baena, M.; Barris, C.; Sallam, H.; Torres, L. Effect of Axial Stiffness of NSM FRP Reinforcement and Concrete Cover Confinement on Flexural Behaviour of Strengthened RC Beams: Experimental and Numerical Study. Eng. Struct. 2018, 173, 987–1001. [Google Scholar] [CrossRef]
- Ci, J.; Kong, L.; Ahmed, M.; Liang, Q.; Hamoda, A.; Chen, S.; Wu, C. Experimental and Numerical Studies of Axially Loaded Square Concrete-encased Concrete-filled Large-diameter Steel Tubular Short Columns. Struct. Concr. 2022, 23, 2748–2769. [Google Scholar] [CrossRef]
- Ci, J.; Ahmed, M.; Liang, Q.; Chen, S.; Chen, W.; Sennah, K.; Hamoda, A. Experimental and Numerical Investigations into the Behavior of Circular Concrete-Filled Double Steel Tubular Slender Columns. Eng. Struct. 2022, 267, 114644. [Google Scholar] [CrossRef]
- Ayough, P.; Ibrahim, Z.; Sulong, N.; Hsiao, P.; Elchalakani, M. Numerical Analysis of Square Concrete-Filled Double Skin Steel Tubular Columns with Rubberized Concrete. Structures 2021, 32, 1026–1047. [Google Scholar] [CrossRef]
- Yu, K.; Wang, Y.; Yu, J.; Xu, S. A Strain-Hardening Cementitious Composites with the Tensile Capacity up to 8%. Constr. Build. Mater. 2017, 137, 410–419. [Google Scholar] [CrossRef]
Disclaimer/Publisher’s Note: The statements, opinions and data contained in all publications are solely those of the individual author(s) and contributor(s) and not of MDPI and/or the editor(s). MDPI and/or the editor(s) disclaim responsibility for any injury to people or property resulting from any ideas, methods, instructions or products referred to in the content. |
© 2025 by the authors. Licensee MDPI, Basel, Switzerland. This article is an open access article distributed under the terms and conditions of the Creative Commons Attribution (CC BY) license (https://creativecommons.org/licenses/by/4.0/).