Article

Research on Outdoor Thermal Comfort Strategies for Residential Blocks in Hot-Summer and Cold-Winter Areas, Taking Wuhan as an Example

School of Civil Engineering, Architecture and Environment, HuBei University of Technology, Wuhan 430068, China
*
Author to whom correspondence should be addressed.
Buildings 2025, 15(10), 1615; https://doi.org/10.3390/buildings15101615
Submission received: 14 April 2025 / Revised: 3 May 2025 / Accepted: 7 May 2025 / Published: 11 May 2025
(This article belongs to the Section Building Energy, Physics, Environment, and Systems)

Abstract

With the intensification of climate challenges driven by rapid urbanization, the microclimate and thermal comfort of residential blocks have attracted increasing attention. Current research predominantly focuses on isolated morphological factors—such as building orientation, layout patterns, and height-to-width ratios—while neglecting the synergistic effects of multifactorial spatial configurations on outdoor thermal comfort. This study addresses this gap by analyzing 36 residential block samples in Wuhan, a representative city in a hot-summer and cold-winter (HSCW) region. Utilizing the Honeybee plugin in Grasshopper (GH) alongside the Universal Thermal Climate Index (UTCI), we simulate outdoor thermal environments to identify critical influencing elements. The results reveal how multifactor interactions shape thermal performance, providing evidence-based design strategies to optimize microclimate resilience in high-density urban contexts. This work advances the understanding of spatial morphology–thermal dynamics and offers practical insights for sustainable residential planning. This study systematically investigates the thermal performance of residential blocks through parametric prototyping and seasonal simulations. Sixteen morphological prototypes were developed by combining four building layout typologies (arrayed, staggered, enclosed, and hybrid) with three critical variables: the height-to-width ratio (HWR), building orientation deviation angle (θ), and sky visibility factor (SVF). Key findings reveal the following: (1) the hybrid layout demonstrates superior annual thermal adaptability when integrating fixed orientation (θ = 0°), moderate H/W = 1, and SVF = 0.4; (2) increased H/W ratios enhance thermal comfort levels across all layout configurations, particularly in winter wind protection; and (3) moderate orientation deviations (15° < θ < 30°) significantly improve microclimate performance in modular layouts by optimizing solar penetration and aerodynamic patterns. These evidence-based insights provide actionable guidelines for climate-responsive residential design in transitional climate zones, effectively balancing summer heat mitigation and winter cold prevention through spatial configuration optimization.

1. Introduction

Global population projections indicate a rise to 9.7 billion by 2050, with nearly 70% residing in urban areas [1]. Urban systems currently account for 76% of global primary energy consumption and 43% of CO2 emissions [2], positioning urban-scale studies as critical to sustainable built environment strategies. Notably, buildings alone represent 30% of global final energy use, of which 70% is attributed to residential settlements [3]. Urbanization fundamentally reshapes rural–urban socio-spatial dynamics while altering the energy equilibrium of cities. Built environment densification—characterized by narrowed streetscapes with impervious surfaces, vegetation reduction, and pollution intensification—amplifies sensible heat storage, traps shortwave radiation in street canyons, and disrupts evaporative/convective cooling mechanisms. These synergistic effects drive longwave heat retention and exacerbate urban heat island (UHI) formation [4], underscoring the urgency of climate-responsive urban design interventions.
According to the statistics of the National Economic and Social Development Statistics Bulletin of the People’s Republic of China in 2022, China’s urban resident population was 920.71 million at the end of 2022, and the urbanization rate reached 65.22%, which was 0.50 percentage points higher than that at the end of the previous year, meaning that the urban population continued to climb [
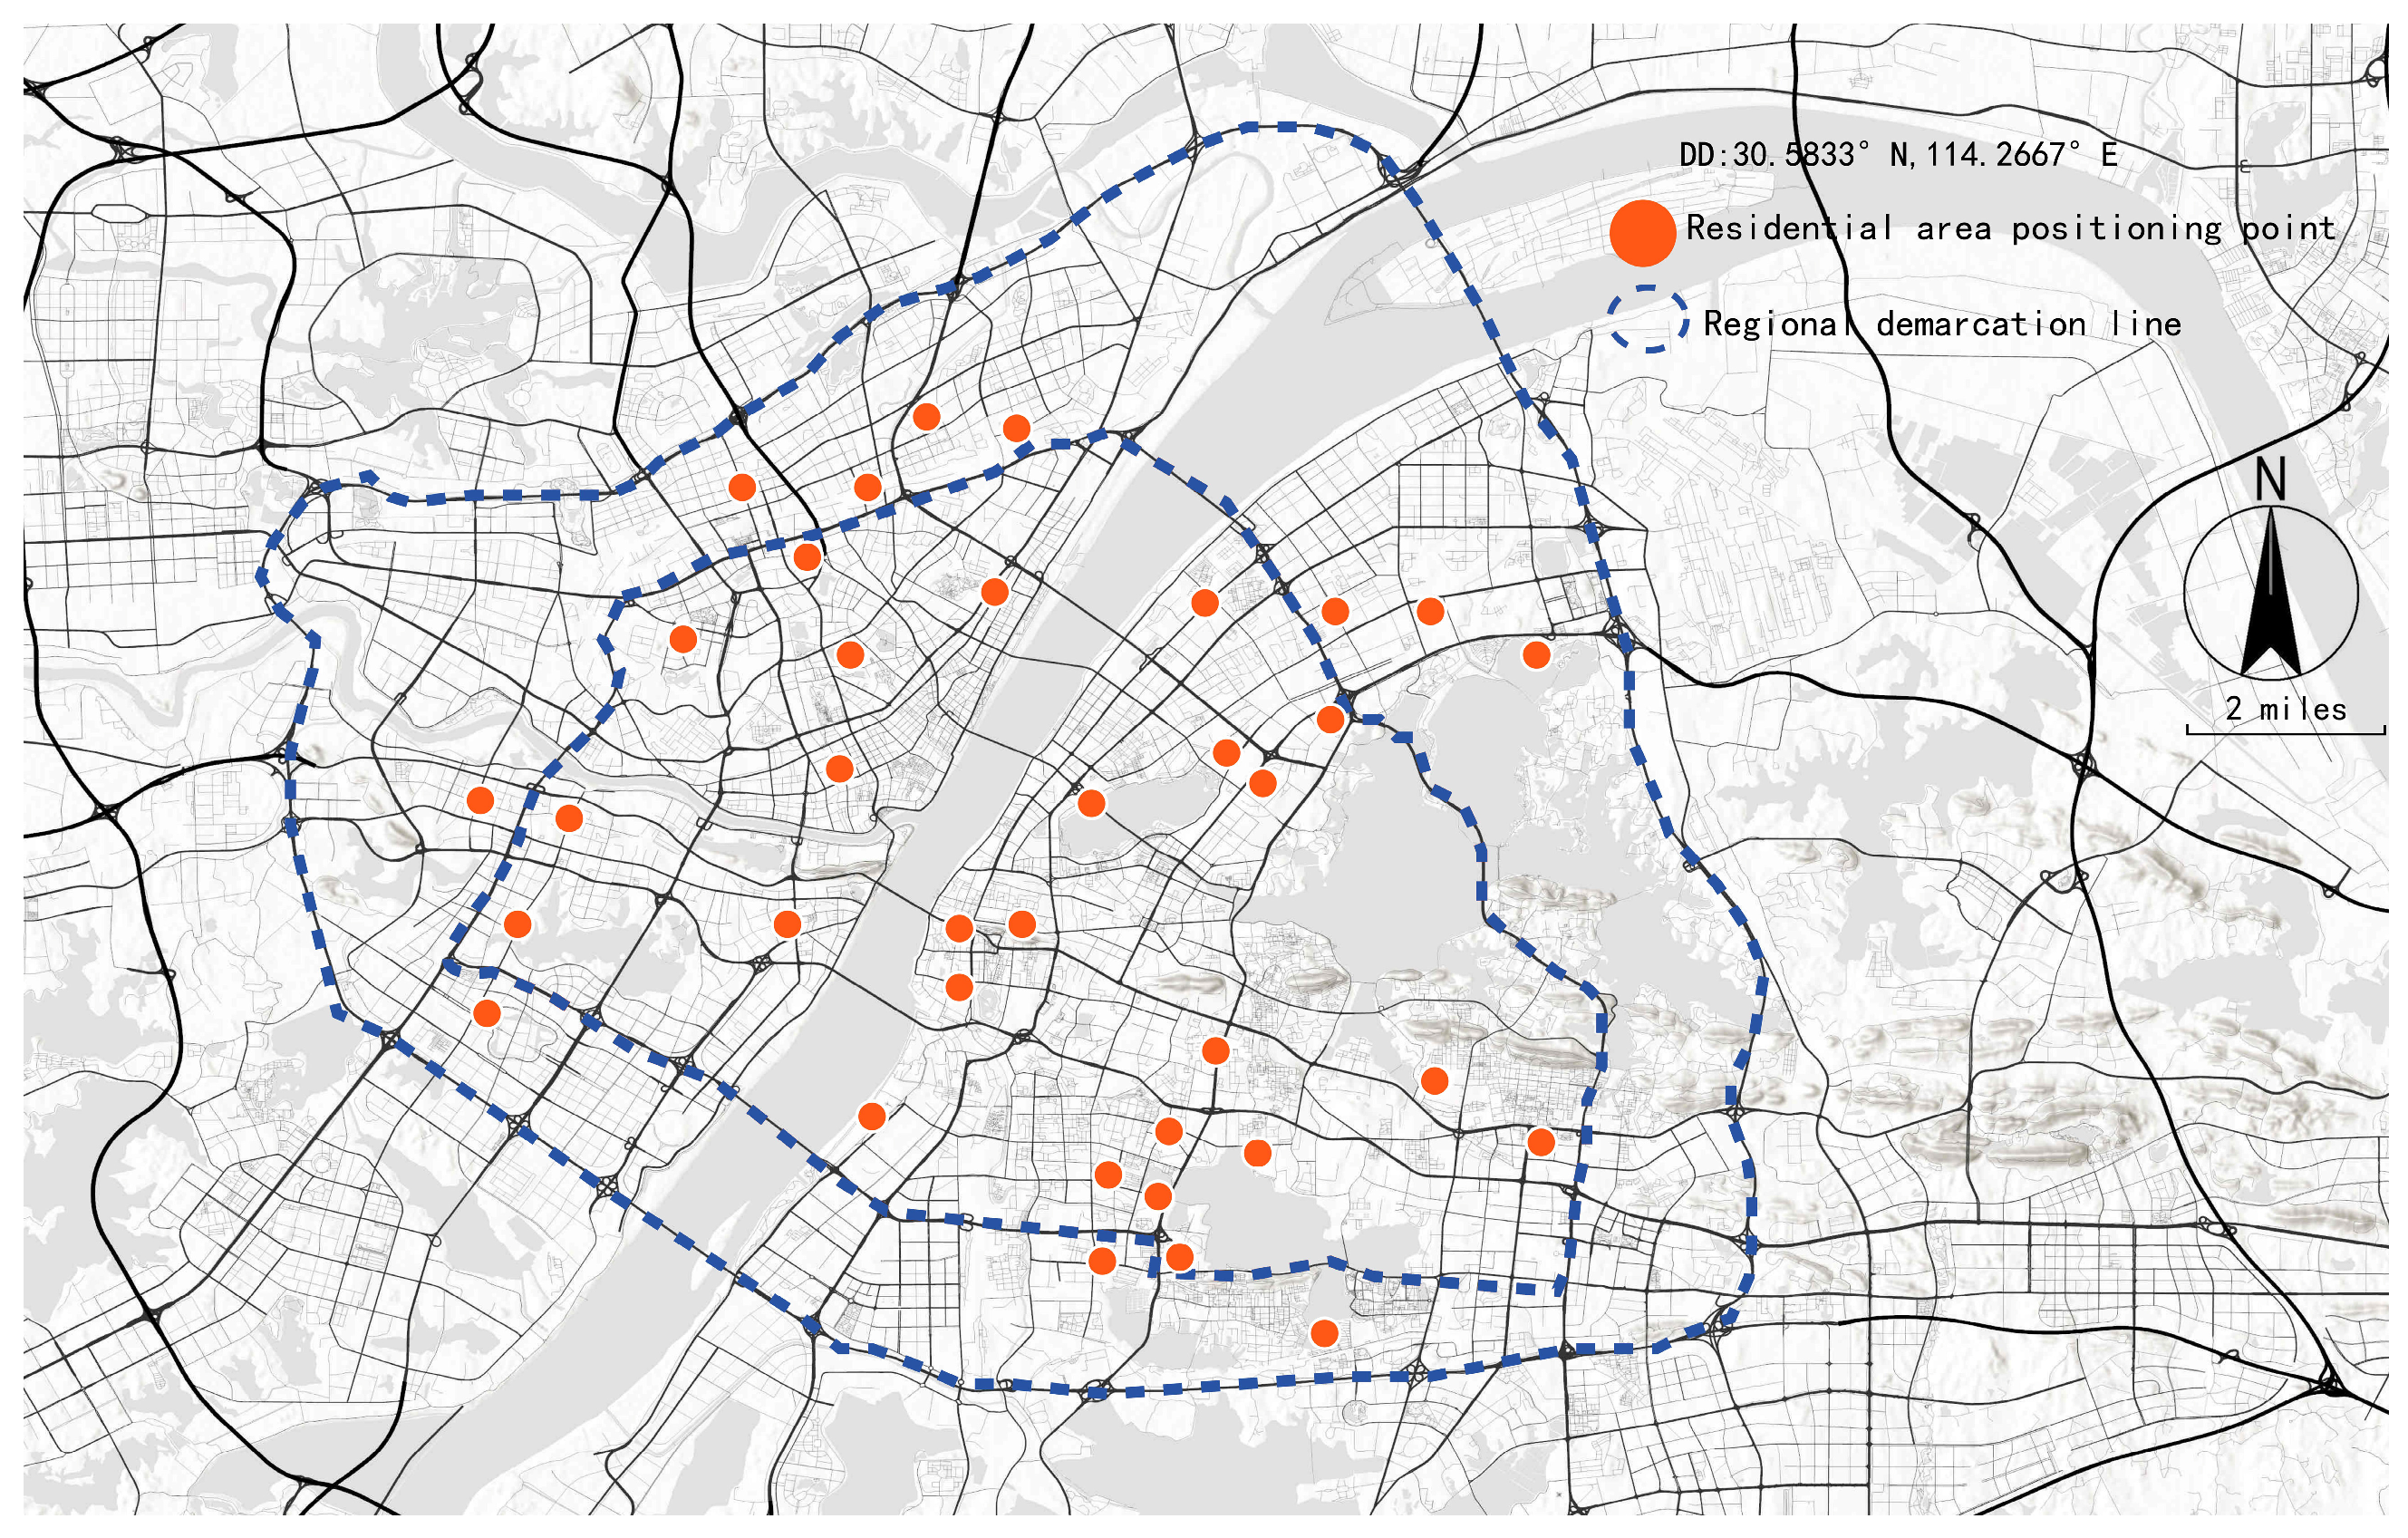
1]. Wuhan exemplifies this trend, achieving 84.66% urbanization—the highest among Chinese megacities [5]. While urban expansion drives economic growth and residential construction demands, the prioritization of rapid large-scale development has often overlooked environmental quality in residential zones. These high-density housing clusters, characterized by diverse morphological configurations and energy consumption patterns, represent both the predominant urban residential typology and a critical frontier for sustainable urban reform. The inherent tension between quantitative expansion and qualitative optimization in residential block development underscores the urgency of reconciling urbanization efficiency with human-centric habitat design. Current residential block planning exhibits significant limitations, including homogeneous spatial configurations and inadequate consideration of urban heat island mitigation strategies. This oversight leads to deteriorated thermal conditions and diminished resident mobility preferences. As fundamental units of urban living and governance systems, residential blocks demand urgent methodological innovation in outdoor thermal comfort optimization. Residential blocks are the basic unit of urban residents’ life and urban governance, and the planning and design methods oriented toward enhancing the outdoor thermal comfort of residential blocks deserve more in-depth discussion.
Several indices integrating thermal environment factors and human body heat balance are applied to obtain thermal comfort, such as predicted mean vote (PMV), standard effective temperature (SET*), OUT_SET * (outdoor standard effective temperature), physiological equivalent temperature (PET), etc. The corresponding thermal sensory temperature values of the thermal comfort indices are shown in Table 1. According to relevant studies at home and abroad, different thermal evaluation indexes have their own application scenarios—for example, PMV and SET* indexes are mainly applicable to indoor scenarios and provide a reference for the development of many thermal comfort indexes, while OUT_SET * and PET indexes are mainly designed for outdoor use [6].
From Table 1, it can be seen that WCI/WCT is suitable for colder climates, while WBGT, DI, Humidex, HI, and SET * are suitable for hotter climates. PET, PT, PST, and UTCI have a wider range of thermal sensations in comparison and contain more detailed thermal sensation ratings. In addition, the earlier thermal comfort indexes cover a smaller temperature range and are not applicable to climates with large seasonal temperature differences. In contrast, the ET, PET, PT, PST, and UTCI indexes are more detailed in describing thermal sensations and are more practical [7]. In this study, the UTCI was calculated using Rhino-Grasshopper, and the inputs were the geographic location, air diffuse reflectance index, infrared radiation index, temperature, and other basic climatic data, which are the most important factors for calculating the UTCI.
In this study, we refer to the experimental setting of Noguchi and Givoni for the clo value, which is 0.65 in summer, when short sleeves and long pants are commonly worn. The human body’s state of dress is described by the clo value, which is defined as the level of clothing on a human body that maintains a comfortable state of dress at a room temperature of 20 °C or 21 °C, a relative humidity of no more than 50%, and an air flow speed of no more than 0.1 m/s, representing the thermal resistance of the human body to heat. In addition, four human demographic parameters including height (H), weight (W), age (A), and gender (G) need to be introduced in the calculation of UTCI, taking into account their effects on the sweat rate and basal metabolism.
In order to explain subjective thermal perceptions at different UTCIs, it is important to define the range of UTCIs at which local people are comfortable, i.e., the “thermal comfort range” of UTCIs. Previous studies examining thermal adaptation have shown that occupants’ thermal sensations and preferences vary widely due to differences in behavioral adjustments, physiological adaptations, and psychological habits or expectations, which may result in different thermal comfort ranges. That is, the thermal comfort range in one climate region may not be applicable to another region.
Outdoor thermal comfort refers to the degree of human satisfaction with the environment in a dynamically changing outdoor thermal environment [8,9]. The 2020 Lancet Countdown to China report noted that the number of deaths in China due to climatic factors such as high-temperature heatwaves quadrupled from 1990 to 2019, which shows that poorer levels of outdoor thermal comfort threaten human lives [10]. Wuhan publicly released the Opinions on Further Strengthening the Management of Construction Intensity of Residential Land in Wuhan in December 2022, focusing on the requirement for residential land in Wuhan to “reduce population density, promote the improvement of the living environment and the quality of housing, promote the construction of a healthy city and the modernization of the governance of megacities, and strive to build a new home for a better life” [5]. A better level of outdoor thermal comfort in residential blocks improves outdoor space utilization and has a positive impact on residents’ attendance, location choice, and length of stay in residential blocks [5]. Therefore, future residential blocks need to be scientifically planned with the aim of improving the level of outdoor thermal comfort.
The influence of building configurations on outdoor thermal comfort within residential blocks has been extensively documented. Critical morphological parameters—including building height (H), width (W), height-to-width ratio (HWR), and sky view factor (SVF)—are universally recognized as determinants of urban microclimate performance [11,12]. Building orientation further modulates seasonal energy demands [13] and comfort variations [14], while district-scale analyses incorporate additional metrics such as floor area ratio (FAR), surface-to-volume ratio (S/V), building coverage ratio (BCR), and open space ratio (OSR) [15]. Martins et al. [16] investigated the effect of eight morphometric parameters on the availability of solar radiation in a generalized decentralized layout of Maceió, Brazil, using CitySim, and found that albedo, HWR, and distance between buildings together accounted for 80% of the impact of the west façade and roof of buildings. A recent study proposed a new satellite-based extraction method for morphological parameters, namely, BCR, H, SVF, as well as building bulk density (BVD), frontal area index (FAI), and roughness length [17]. Empirical evidence from 192 townhouse simulations in Bangkok demonstrated substantial PET reductions, specifically, 8.6 °C via tree shading and 14.2 °C through building shading [18], underscoring the critical role of shadow optimization in tropical climates. Zhifeng Wu et al. [19] systematically evaluated thermal comfort determinants in high-density urban contexts, identifying building layout configurations, vegetation coverage, and latitude-specific solar exposure as critical factors, with shading strategies proving particularly impactful for thermal environment regulation. Cheng Sun’s empirical study in severe cold regions [20] identified optimal thermal performance in north–south-oriented streets with an HWR below 1.5. Hongguang Zhang et al. [21] established quantifiable relationships between green space distribution patterns and microclimate outcomes, demonstrating positive correlations with cooling efficiency/thermal comfort and inverse relationships with wind attenuation. Focusing on Wuhan’s hot-summer/cold-winter climate, Zhang Li [22] determined that arboreal arrangements with height-to-width ratios < 1 and native species selection maximize outdoor thermal comfort enhancement. Collectively, these studies demonstrate methodological maturation in single-factor analysis while highlighting the need for integrated multi-parameter frameworks in climate-responsive urban design.
Among the existing studies, Europe and the United States started earlier, and significant morphological discrepancies exist between Western and Chinese contexts regarding settlement scales, building heights, and density patterns, attributable to divergent demographic profiles, climatic conditions, and urban development trajectories. Nevertheless, decades of international investigations have established robust methodological frameworks and quantitative assessment metrics for built environment analysis, providing valuable references for subsequent studies. In China, urban-scale investigations of outdoor thermal comfort and energy efficiency have gained momentum recently, with a predominant focus on cold regions and hot-summer/warm-winter zones. The hot-summer/cold-winter (HSCW) regions—characterized by extreme summer humidity (July RH > 80%) and winter chill (January temperature < 5 °C)—present unique research challenges. These areas demand the simultaneous optimization of heat mitigation and cold prevention strategies, compounded by high humidity levels (>75% annual average) and distinct seasonal variations (ΔT > 25 °C), necessitating innovative approaches to address coupled hygrothermal stressors.
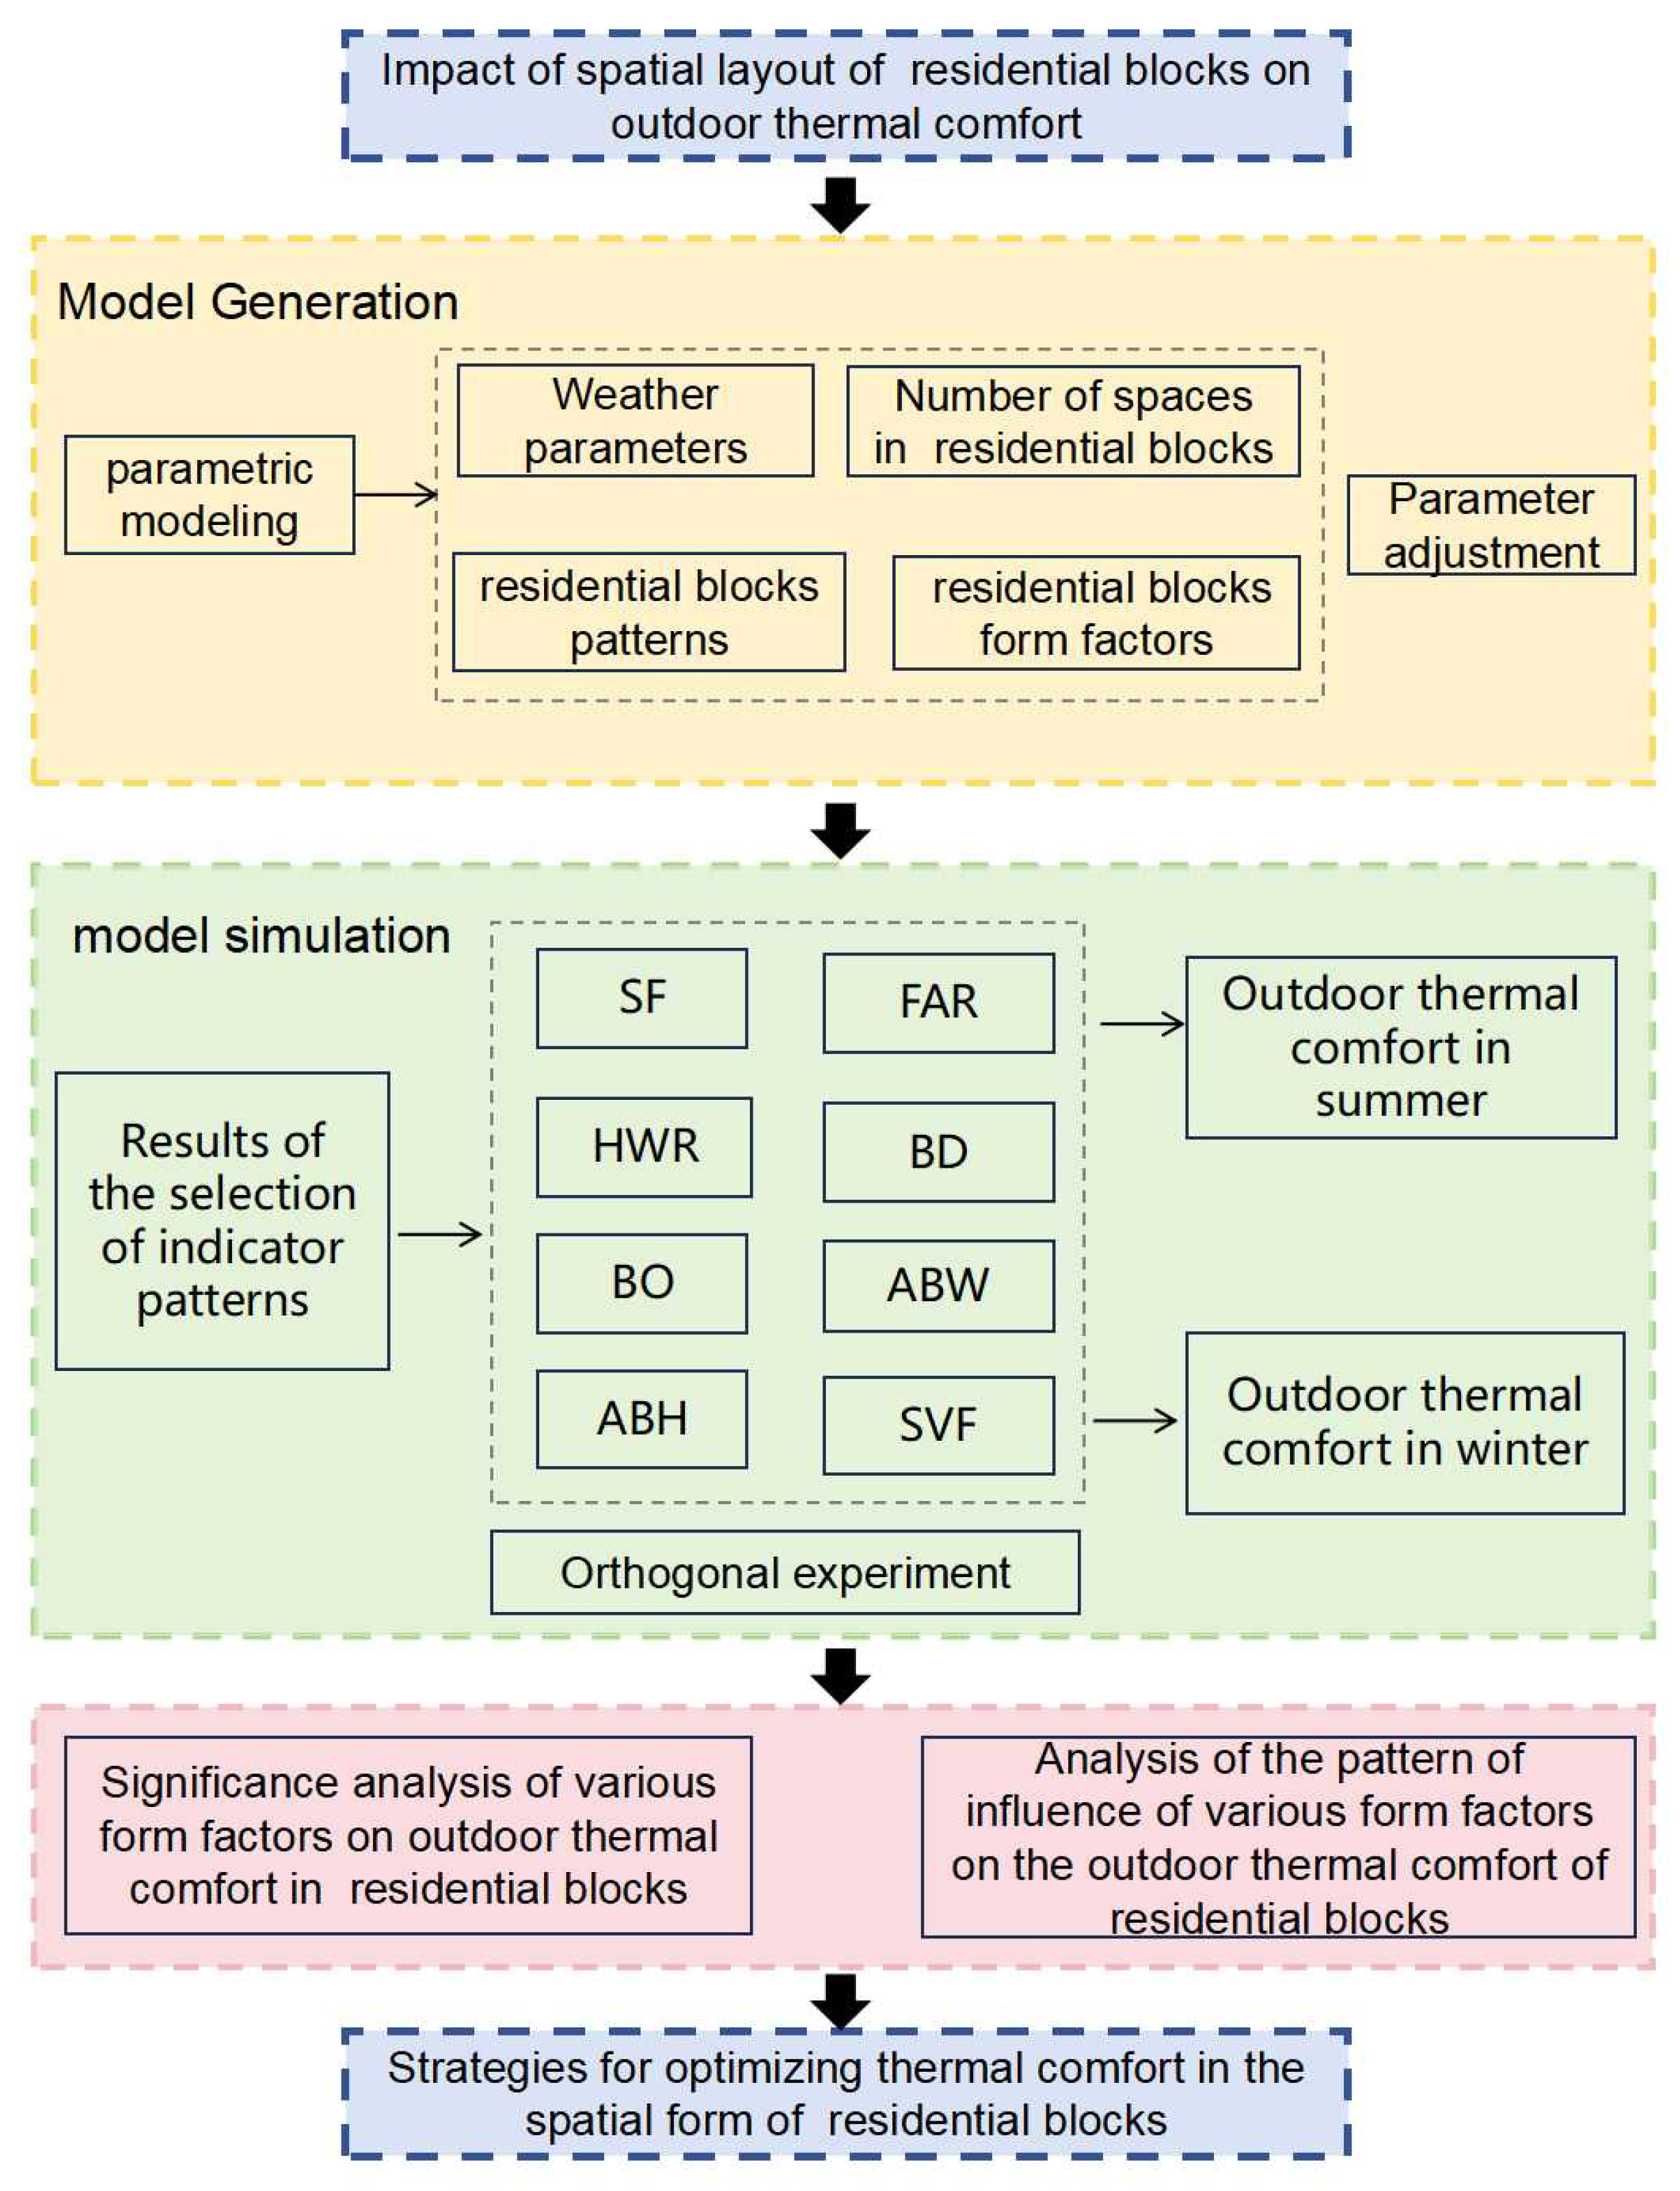
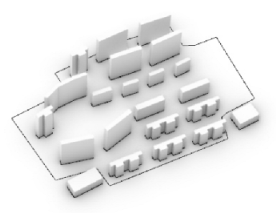
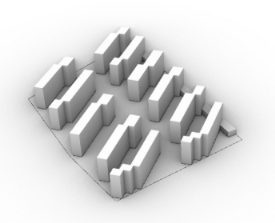
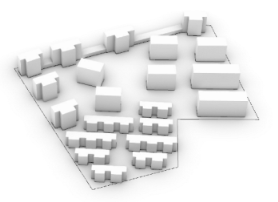
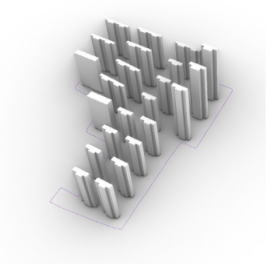
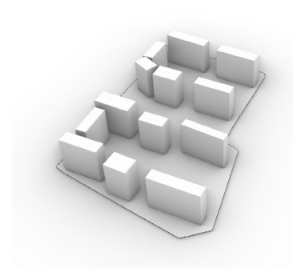
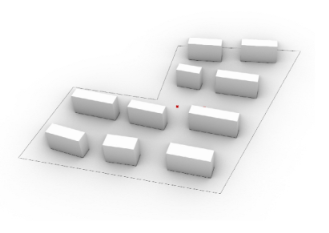
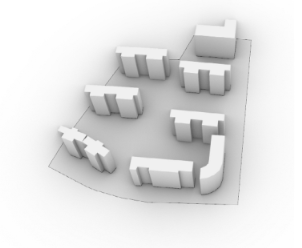
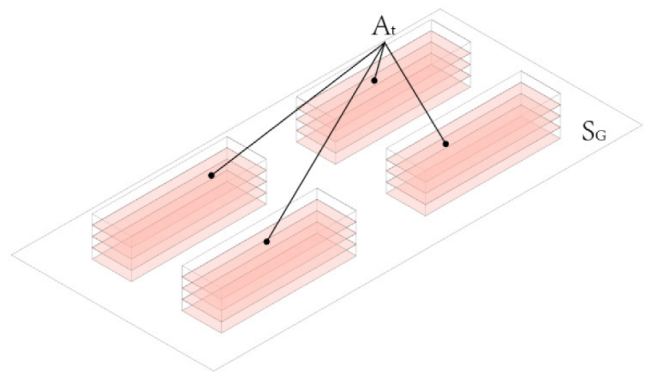
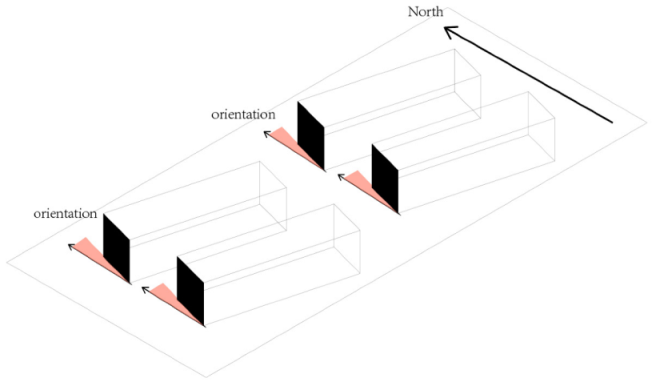
In this study, the thermal environment of residential blocks in the HSCW climate zone of Wuhan was modeled for outdoor thermal comfort in summer and winter. Using the Ladybug tool, a parametric environmental analysis platform integrated with Rhino-Grasshopper, we performed residential plot-scale modeling of 36 prototypes of residential blocks investigated in the field and measured the thermal comfort of the residential blocks through the UTCI. By quantifying the variation in thermal comfort of the UTCI in summer and winter across different residential blocks spaces, this study identifies the key impacts of different residential block form factors on outdoor thermal comfort. Subsequently, orthogonal experiments were conducted to establish matrix factors for HWR, SF, SVF, BO, residential block morphology, sky visibility, and building orientation to derive a multifactorial way of influencing the combination of different residential block morphologies to achieve a combined residential block morphology that minimizes thermal comfort in summer and maximizes thermal comfort in winter. These findings provide empirically based guidance for optimizing climate-responsive design strategies for the HSCW region, addressing the dual challenges of summer heat relief and winter adaptation to cold.
  • We present a comprehensive review of the existing research literature on outdoor thermal comfort in residential blocks and research methods that integrate building planning and design with the optimization of the physical properties of the environment.
  • We summarize the basic characteristics of Wuhan’s climate through the analysis of meteorological data and establish a typical model of Wuhan’s residential blocks through field research and the use of network data.
  • We design controlled experiments using the L16 (45) orthogonal matrix, treating urban form parameters (site coverage, axial orientation, SVF, HWR, vegetation index) as independent variables. Dependent variables included seasonal UTCI averages and extreme value duration, enabling the identification of parametric sensitivity thresholds.
  • We conduct qualitative and quantitative analyses to critically analyze the search results. The qualitative analysis focuses on the overall layout of the residential blocks space, while the quantitative analysis scrutinizes the morphological elements of the residential blocks space.

2. Thinking and Methodologies

2.1. Research Framework and Methodology

According to the Köppen climate classification system, the global climate can be divided into five basic types and their subclasses: a tropical climate (Class A) is characterized by year-round warmth and humidity, with the mean temperature of the coldest month being no lower than 18 °C and there being no winter; a dry climate (Class B) is characterized by evaporation consistently exceeding precipitation, and is further subdivided into desert (BW) and steppe (BS); a temperate climate (Class C) is characterized by mild winters (with the mean temperature of the coldest month ranging from −3 °C to 18 °C) and warm summers, with uniformly distributed or seasonal differences in precipitation patterns, and is typified by Mediterranean climates (Cs) and humid subtropical climates (Cfa); continental climates (D) are characterized by a combination of severe winters (mean coldest monthly temperature below −3 °C) and warm summers, and are mainly found in inland areas in the Northern Hemisphere; and polar and mountain climates (E) are defined by a hottest monthly mean temperature of less than 10 °C and cover tundra (ET), ice field (EF), and alpine climates. Within this classification framework, Wuhan’s climatic characteristics are highly compatible with a temperate climate (Class C), specifically, a Cfa-type humid subtropical climate: its core indicators include an average temperature of 1–8 °C (actual average of 3–4 °C) in the coldest month (January), an average temperature of 28–31 °C in the hottest months (July–August), and annual precipitation of 1200–1300 mm, with a high concentration in summer and fall. Although winter precipitation is relatively low (about 10–15% of the year), the average monthly precipitation remains above 30 mm, which meets the criteria of the Cfa subtype of “warm winters and hot summers, with no obvious dry season for precipitation”.
Although climate zoning is important for outdoor thermal comfort applications, there is no consensus on which climate zoning method should be used, and the climate zones applicable to outdoor thermal comfort should be investigated, as the climate in the HSCW zone in China is complex and diverse [23]. In order to better study the outdoor thermal comfort of residential areas in the HSCW zone, it is suggested that the HSCW zone be subdivided into subclimatic zones. Subclimatic zoning aims to capture the climate change within the HSCW zone more accurately, which can help in designing building technologies and settlement planning strategies tailored to different climatic conditions [24]. As a typical city in the HSCW climate zone [25], the research framework in Wuhan follows the Urban Land Use Classification and Planning Standards [26,27] and strategically delineates the study area within the main urban area through a systematic analysis of residential patterns in fifteen-minute neighborhoods [28,29]. This investigation used a dual approach consisting of urban form typology classification and software simulation, specifically targeting high-density residential configurations characteristic of transitional climate regions.
Representative residential block prototypes were extracted from the cases of Wuhan residential blocks, their outdoor thermal comfort levels were simulated by software, and the influence of morphology on each prototype model residential block was analyzed. The type induction method was used to extract the prototypes of Wuhan residential block building assemblage layouts through building typology, so that the samples reflected the morphological characteristics of typical residential blocks in Wuhan. Firstly, research and searches were conducted within the urban center of Wuhan to obtain 36 community samples. Based on the 36 samples, the influence of settlement-morphology-related factors on outdoor thermal comfort was summarized, and 16 representative combinations of factors were derived through orthogonal implementation for in-depth analysis. Finally, based on the statistical results, a representative building mix layout of Wuhan residential blocks was identified and corresponding strategy recommendations were provided, as shown in Figure 1.
The simulation process used an aggregated bottom–up approach to validate the inputs and outputs of the software engine, EnergyPlus 8.8.0 [30], by linking the inputs and outputs of the software engine through the Ladybird tool [31] (a plug-in for Grasshopper). EnergyPlus, validated through the ASHRAE 1052RP test and BESTEST [32], was shown to be applicable to residential-block-scale analyses, similar to those studied here. The Ladybug component was used for the visualization of environmental data and results, and a full description of the equations controlling the model can be found in Ibrahim et al. [33], while Evola et al. [34] present a detailed graphical representation of the Grasshopper component used. The workflow described above was validated against the ENVI-met5.6 software, which in turn was validated against field measurements in Cairo [35]. The results show that the two models are in considerable agreement with respect to the MRT and the UTCI throughout the day (R2 of 0.94 and 0.96, respectively) and are more accurate during the daytime hours [36,37], which allowed the workflow to be adequately adapted for the purposes of this study.

2.2. Sample Selection and Analysis

The research objects of this paper included typical residential areas in seven districts of Wuhan city, so the research sample needed to meet the following characteristics: first, the principle of typicality of sample size, meaning that residential districts contained at least one residential group and the number of buildings was not less than six; second, the principle of diversity of morphological characteristics, according to the General Principles of Civil Building Design, meaning that the samples were mixed residential districts with multistory and high-rise residences; and thirdly, the principle of balanced spatial distribution—in the literature review, it was found that the construction time of commercial housing in Wuhan is mainly concentrated after 2000, and so the construction time was taken into account when choosing the samples for re-study. Through ArcGIS data crawling and a field survey, 36 multistory residential blocks in 7 districts of Wuhan were selected as the study samples, and the distribution of these 36 samples is shown in Figure 2 and Table 2. These 7 districts are Wuchang district, Qiaokou district, Hanyang district, Hongshan district, Qingshan district, Jiangan district, and Jianghan district.

2.3. Definition of Impact Factor

Combining the spatial studies of existing residential blocks [18] and field research data, morphological elements such as residential blocks layout patterns, floor area ratio levels, and greening configurations have significant characteristics. In order to accurately demonstrate the influence mechanism of residential block district morphology on outdoor thermal comfort, this study selected eight indicators of residential district morphology for analysis and established a classification model of residential block layout morphological indicators based on the spatial characteristics of Wuhan residential block samples. These indicators included building density (BD), floor area ratio (FAR), average building height (ABH), average building width (ABW), height-to-width ratio (HWR), residential blocks orientation (BO), sky visibility (SVF), and building layout (LF) (see Table 3 and Table 4). The quantitative correlation law between each morphological element and outdoor thermal comfort was clarified through parametric analysis.
According to the methodology for the measurement of the residential block pattern indicators, the results were factored into the selection and categorization of cases.
Table 4. Morphological factor data for 36 types of residential blocks.
Residential Block NumberBDFARABHABWHWRBOSVFLF
10.171.974867.610.7115°48.04Encircling
20.121.577554.031.388043.95Encircling
30.142.829026.013.46−3041.78Encircling
40.081.99952.111.9−951.96Staggered layout
50.153.3799501.98−1562.13Determinant
60.131.063063.830.47061.88Determinant
70.133.469943.042.3−3061.06Determinant
80.171.874554.870.82034.67Combinatorial
90.162.989943.042.3048.64Determinant
100.152.8999601.65−1046.01Determinant
110.172.4645251.8062.32Combinatorial
120.171.2630251.2052.72Encircling
130.161.343032.250.93−2648.34Combinatorial
140.141.142436.360.66042.71Determinant
150.191.362155.260.381740.14Staggered layout
160.171.3724480.52333.14Determinant
170.21.3815200.75−2632.68Combinatorial
180.21.39212112449.22Determinant
190.231.446030.931.942047.21Determinant
200.251.481834.620.52042.27Staggered layout
210.162.376437.211.722038.74Combinatorial
220.181.9368322.1251434.72Staggered layout
230.172.284223.071.82033.31Determinant
240.111.6924300.8630.55Combinatorial
250.282.3743.526.041.67035.78Determinant
260.32.32726.211.03037.64Encircling
270.272.1911447.12.422740.14Combinatorial
280.352.118181−333.14Determinant
290.092.6811755.182.12−2832.88Determinant
300.182.747442.041.763031.84Encircling
310.113.8412551.022.453042.61Determinant
320.153.87117.567.921.733838.23Determinant
330.252.6828.533.920.84038.75Encircling
340.282.83627.911.29937.9Encircling
350.283.163318.961.74042.41Determinant
360.253.546.540.081.162448.18Determinant

2.4. Parameter Settings

Each layout pattern in the parametric analysis meets the relevant requirements of the document “Wuhan Construction Engineering Planning and Management Technical Provisions” 248 and “Wuhan Residential Daylight Spacing Code”. These requirements cover various aspects, including building fire protection, daylight availability, and other planning and design conditions. The process involved GIS locating the residential area, mapping the area, and then importing it into Rhinoceros. The residential neighborhood model was measured in meters with uniform floor heights. All buildings had a uniform floor height of 3 m. The distribution of building heights followed the principle of minimizing obstructions between buildings.
Numerical simulation methods were used to model, simulate, and visualize the results of extracted prototypes through GH in the software Rhinoceros7.0. GH is a visualization platform for scripting and is an integrated feature of Rhino 3D [38], which allows architects, designers, and others without programming knowledge to develop their own generative algorithmic designs via a user-friendly graphical interface. Developed in 2007 by David Rutten of McNeel & Associates [32], Grasshopper allows users to seamlessly and repetitively manipulate their input parameters in a flowchart-like work program with real-time feedback as well as an integrated post-processing platform. Thanks to these features, together with bi-directional data flow (looping) plugins, e.g., Hoopsnake and Anemone, parametric analysis of regenerative urban designs with multiple iterations has become feasible [39]. More interestingly, using the Rhino7.0 Universal Software Development Kit (SDK), Grasshopper integrates with popular scripting platforms such as Python 3.0 and VB.NET, giving designers the opportunity to develop their own components or, more precisely, to modify existing ones. In addition, Grasshopper includes components for single-objective (Galapagos Islands) and multi-objective (Octopus) evolutionary optimization [40]. There is no doubt that the use of open-source plugins in Grasshopper has made it popular among designers and has facilitated the use of optimization research in practice.
In RH and GH, Honeybee_UTCI Comfort Map [41] was used to call Open studio to calculate the UTCI values. Firstly, the epw file of the weather in Wuhan was obtained from the U.S. Department of Internal Sources website, and then the data were imported into the EPW battery. In this paper, the time periods chosen for the calculation were 8:00–20:00 for a typical week in summer and winter, namely, 22–28 June and 22–28 December, respectively, and the Pcriod battery was accessed to filter out the time intervals needed for the calculation. Then, the data were filtered using the Import EPW (Energy Plus Weather) battery, which allowed for parsing of the EPW file to determine the location, dry bulb temperature, humidity, wind speed, and wind direction, and we imported the corresponding values into the Honeybee_UTCI Comfort Map to calculate the UTCI values. Here, the temperature and humidity values were imported, while the values of MRT, wind speed, and wind direction were simulated and imported by other modules [42]. EPW is the format used by EnergyPlus in the process of verifying the accuracy and completeness of weather data files; EPW synthesis is the process of generating or editing EPW files to meet specific building performance modeling requirements.
After importing the 3D model into Grasshopper, the next step was to generate the computational grids and building surfaces required for Honeybee calculations. This was achieved using the Fcae cell and the Model cell [41], which convert the Brep and surfaces into digital models compatible with Honeybee’s calculation tools. The GenPts, Sensor Grid, and AssignGridViews cells divide the site into n grids, with each grid corresponding to a specific simulation value. The geometry input is linked to the building’s surface, and the grid_size determines the grid resolution. A smaller grid size increases the number of grids and the level of detail, though it may demand more computing power. The Sensor Grid can be considered as a sensor, with its position defined by the points generated by the GenPts module. The Assign Grid Views cell connects the model to the grid and routes the results to the UTCI calculation module.
For thermal environment simulation, the Honeybee_UTCI Comfort Map battery was used. It requires connections to the model, the EPW file, the DD file, and the specified calculation time. A key advantage of this battery is its run_settings_input port, which allows additional CPU resources to be allocated, thus enhancing computational efficiency. On the output side, the UTCI value and environmental conditions (env_conds) are produced. The UTCI value is processed through the Thermal Mtx battery before being input into the visual display module. The env_conds output includes parameters such as solar radiation, air temperature, and humidity, and can be connected to the EnvMtx battery for further analysis. If the input value is “0”, the corresponding output is the MRT value [42].

2.5. Outdoor Thermal Comfort Analysis

Outdoor thermal comfort evaluation metrics can be classified into three main categories. The first category includes thermal risk metrics derived from regression analysis, such as wet bulb globe temperature (WBGT). The second category consists of thermal comfort metrics based on steady-state heat transfer models, like PET and PST [43]. The third category includes metrics based on dynamic heat transfer models, such as the UTCI. WBGT is widely used to assess thermal conditions in industrial settings and outdoor areas of buildings. Thermal comfort indicators based on steady-state models are developed from indoor thermal comfort studies. These models account for deviations between indoor and outdoor conditions, make necessary adjustments to indoor indicators, and incorporate factors like thermoregulation, heat exchange between the human body and the environment, and the body’s heat transfer characteristics during physical activity, leading to indicators like PET and PST [44,45]. However, these models assume stable environmental conditions and long-term exposure, which may not reflect the constantly changing conditions of outdoor environments or the varying thermal load on the human body. The UTCI, in contrast, evaluates outdoor thermal comfort by simulating the human body’s response to dynamic climatic conditions [6]. Similarly to the predicted mean vote (PMV) used for indoor environments, the UTCI uses an iterative thermoregulation model to determine the dynamic equivalent temperature of a person in a reference environment, offering a more accurate reflection of thermal sensation in changing outdoor conditions.
There are several reasons for adopting the UTCI [45] to represent outdoor thermal comfort. The UTCI has been widely used in all climatic environments and validated by field surveys and other thermal indices. The UTCI was proposed by the International Society for Biological Meteorology (ISB) in 2002 and is a Fiala human-body-based multi-node model and adaptive clothing model, providing a one-dimensional physical quantity. In addition, the UTCI presents a detailed classification of thermal sensations in extreme cold and hot conditions, where the equivalent temperature of the sensation is provided in degrees Celsius, which makes it easier for designers to perceive. Lam et al. [46] validated the comparison of the UTCI between Melbourne and Hong Kong using measurements in these two locations, defining different thermal sensation thresholds for the UTCI scale based on different climatic zones to better predict the thermal comfort of different outdoor thermal comfort of urban populations. Di Napoli, Claudia [46] and others demonstrated the potential of the UTCI as an indicator of heat-related health risks, using Europe as an example. Since outdoor environments are non-stationary, the influence of non-physical factors must be taken into account when selecting an indicator. Given that Wuhan is located in a region with hot summers and cold winters, microclimate assessment indicators need to consider both summer and winter thermal comfort. The International Generalized Thermal Climate Index (IGTCI) involves physiological dynamics and meteorological data, including both summer and winter values. Therefore, the UTCI is a suitable metric for assessing outdoor thermal comfort in this paper, and Table 5 shows the range of UTCI values corresponding to thermal sensation and thermal stress on a 10-level scale [47].

3. Results and Analyses

3.1. Outdoor Thermal Comfort Analysis

Combining the actual research data and the relevant regulations on the plot ratio and green space rate in the Planning and Design Standards for Urban Residential Areas (GB50180-2018) [48], as well as the provisions of the Thermal Environment Design Standards for Urban Residential Areas JGJ286-2013 [
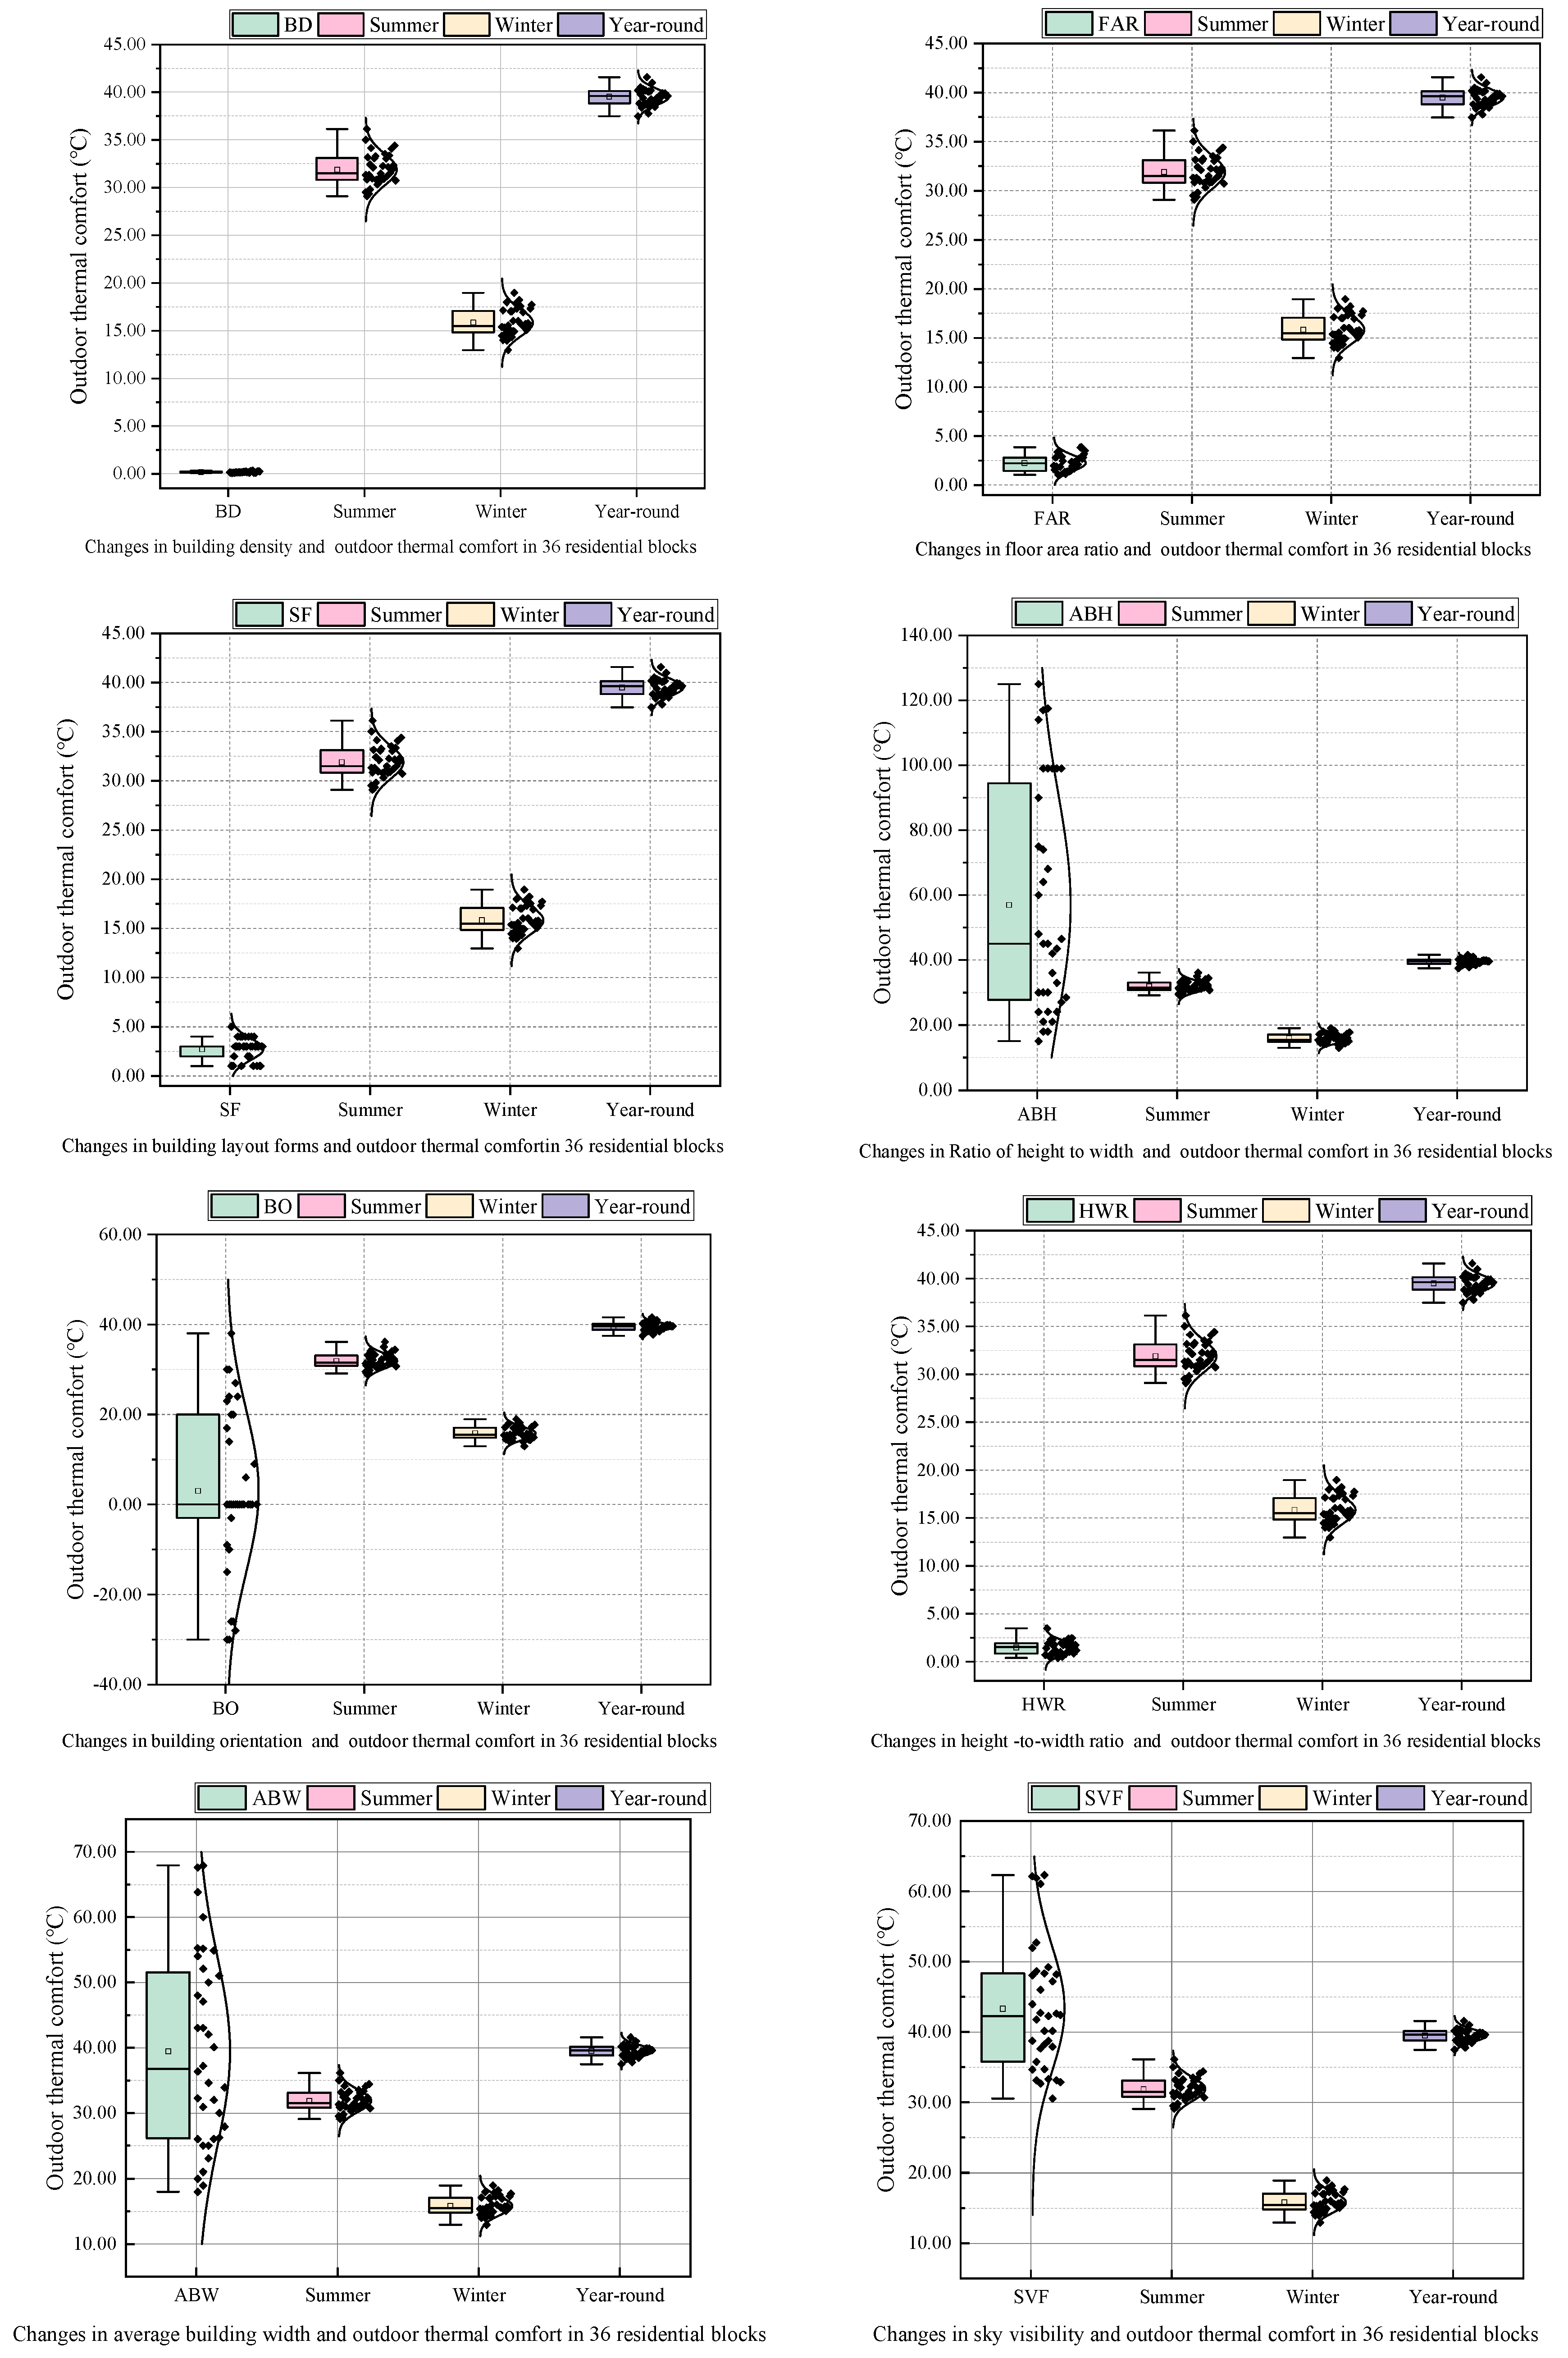
49] that stipulate that the intensity of heat islands is an evaluation index of the design of the thermal environment of a residential area, we selected various factors for a single-factor analysis, including the building density, plot ratio, building layout, sky visibility, average building height, average building width, building orientation, residential block aspect ratio, and other related factors.
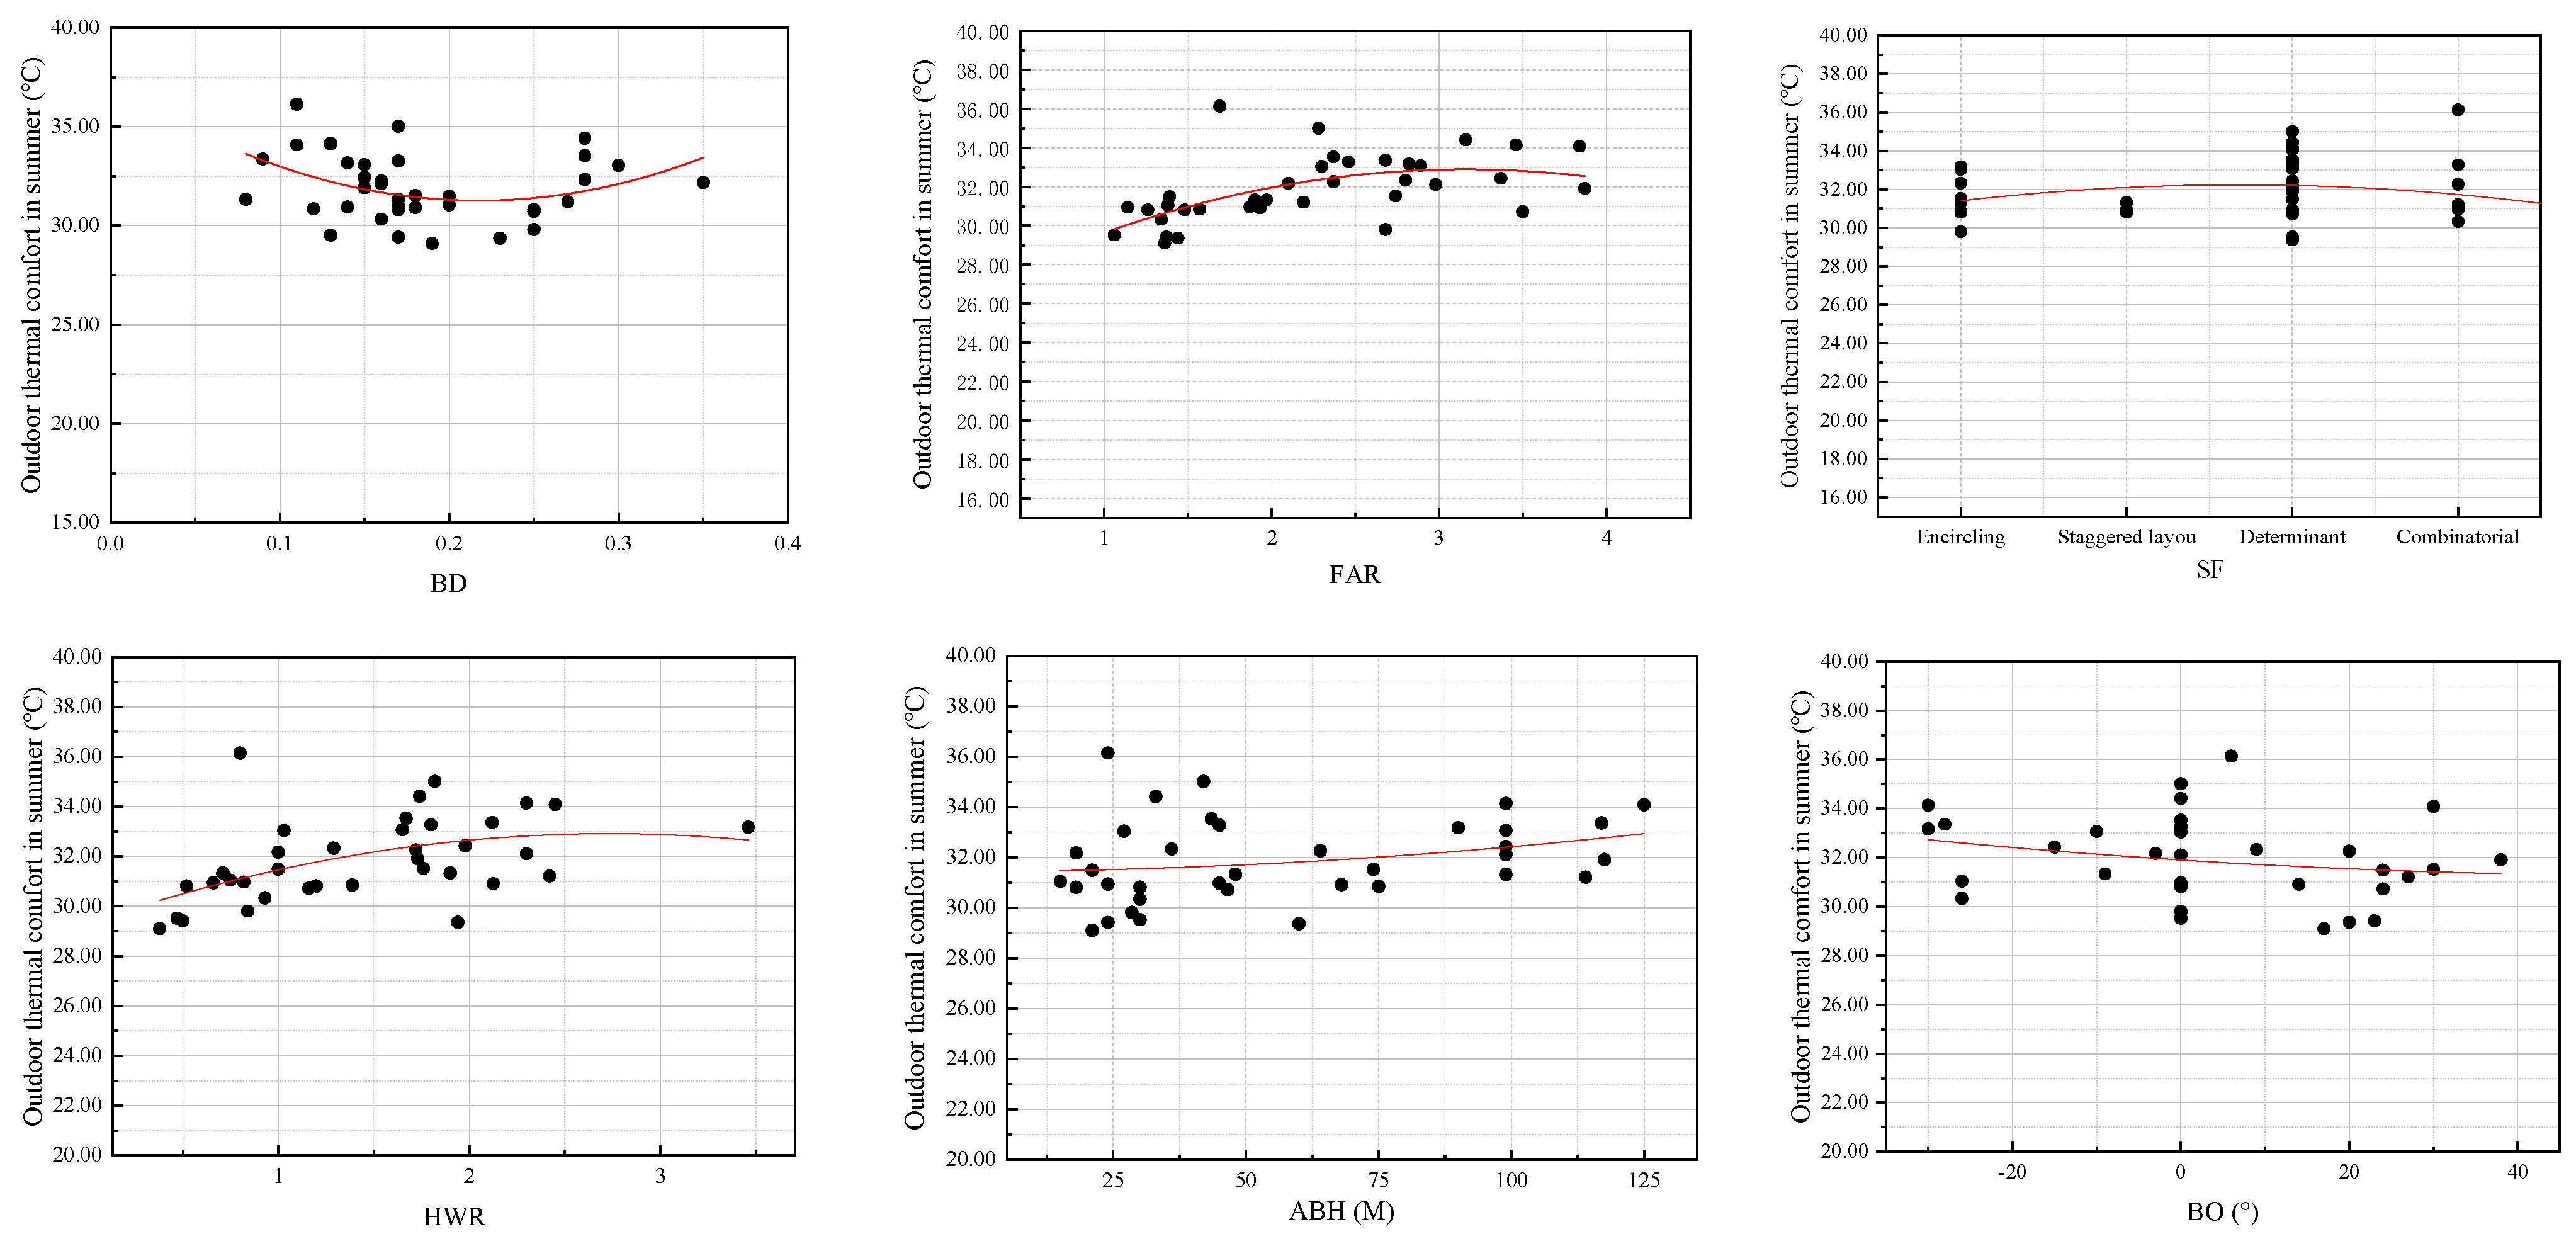
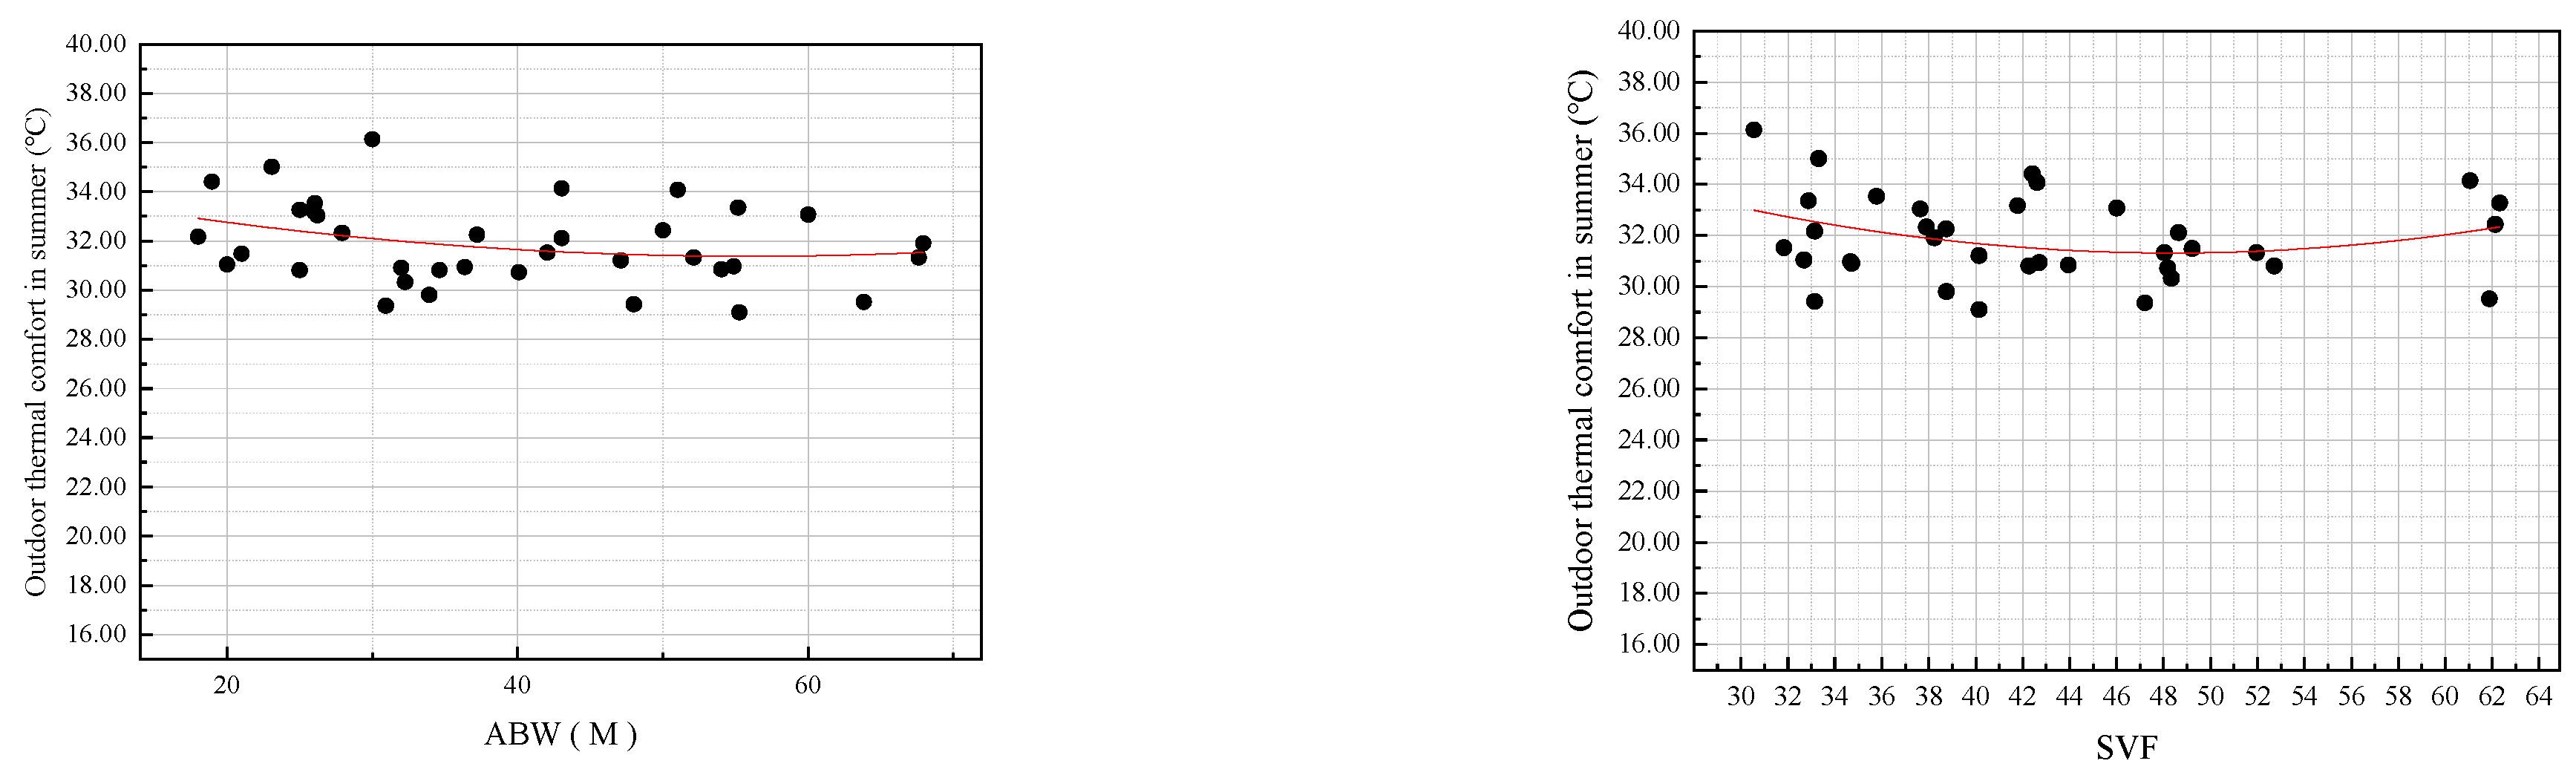
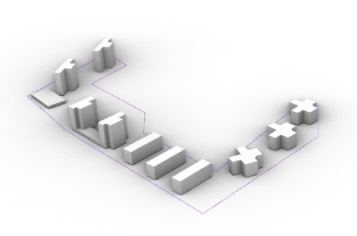
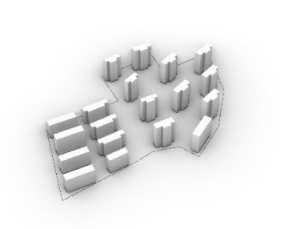
The results shown in Figure 3 indicate that the aspect ratio and orientation of residential blocks affect outdoor thermal comfort in summer and winter more significantly than other morphological indicators. The evaluation of thermal comfort indicators such as the UTCI reveals that the UTCI values of compact residential block layouts are lower than those of open residential blocks layouts, indicating that the shading effect is greater than the wind effect. Therefore, in summer, the urban thermal environment of compact residential block spaces is better than that of open residential block spaces, but in winter, the situation is different. Compact settlement patterns, although favorable for thermal comfort in summer, are not conducive to thermal comfort in winter. More solar radiation is needed in winter, and open residential blocks spaces are more comfortable. When designing urban forms for outdoor thermal comfort, the balance between the hot and cold seasons should be considered according to the regional climate.
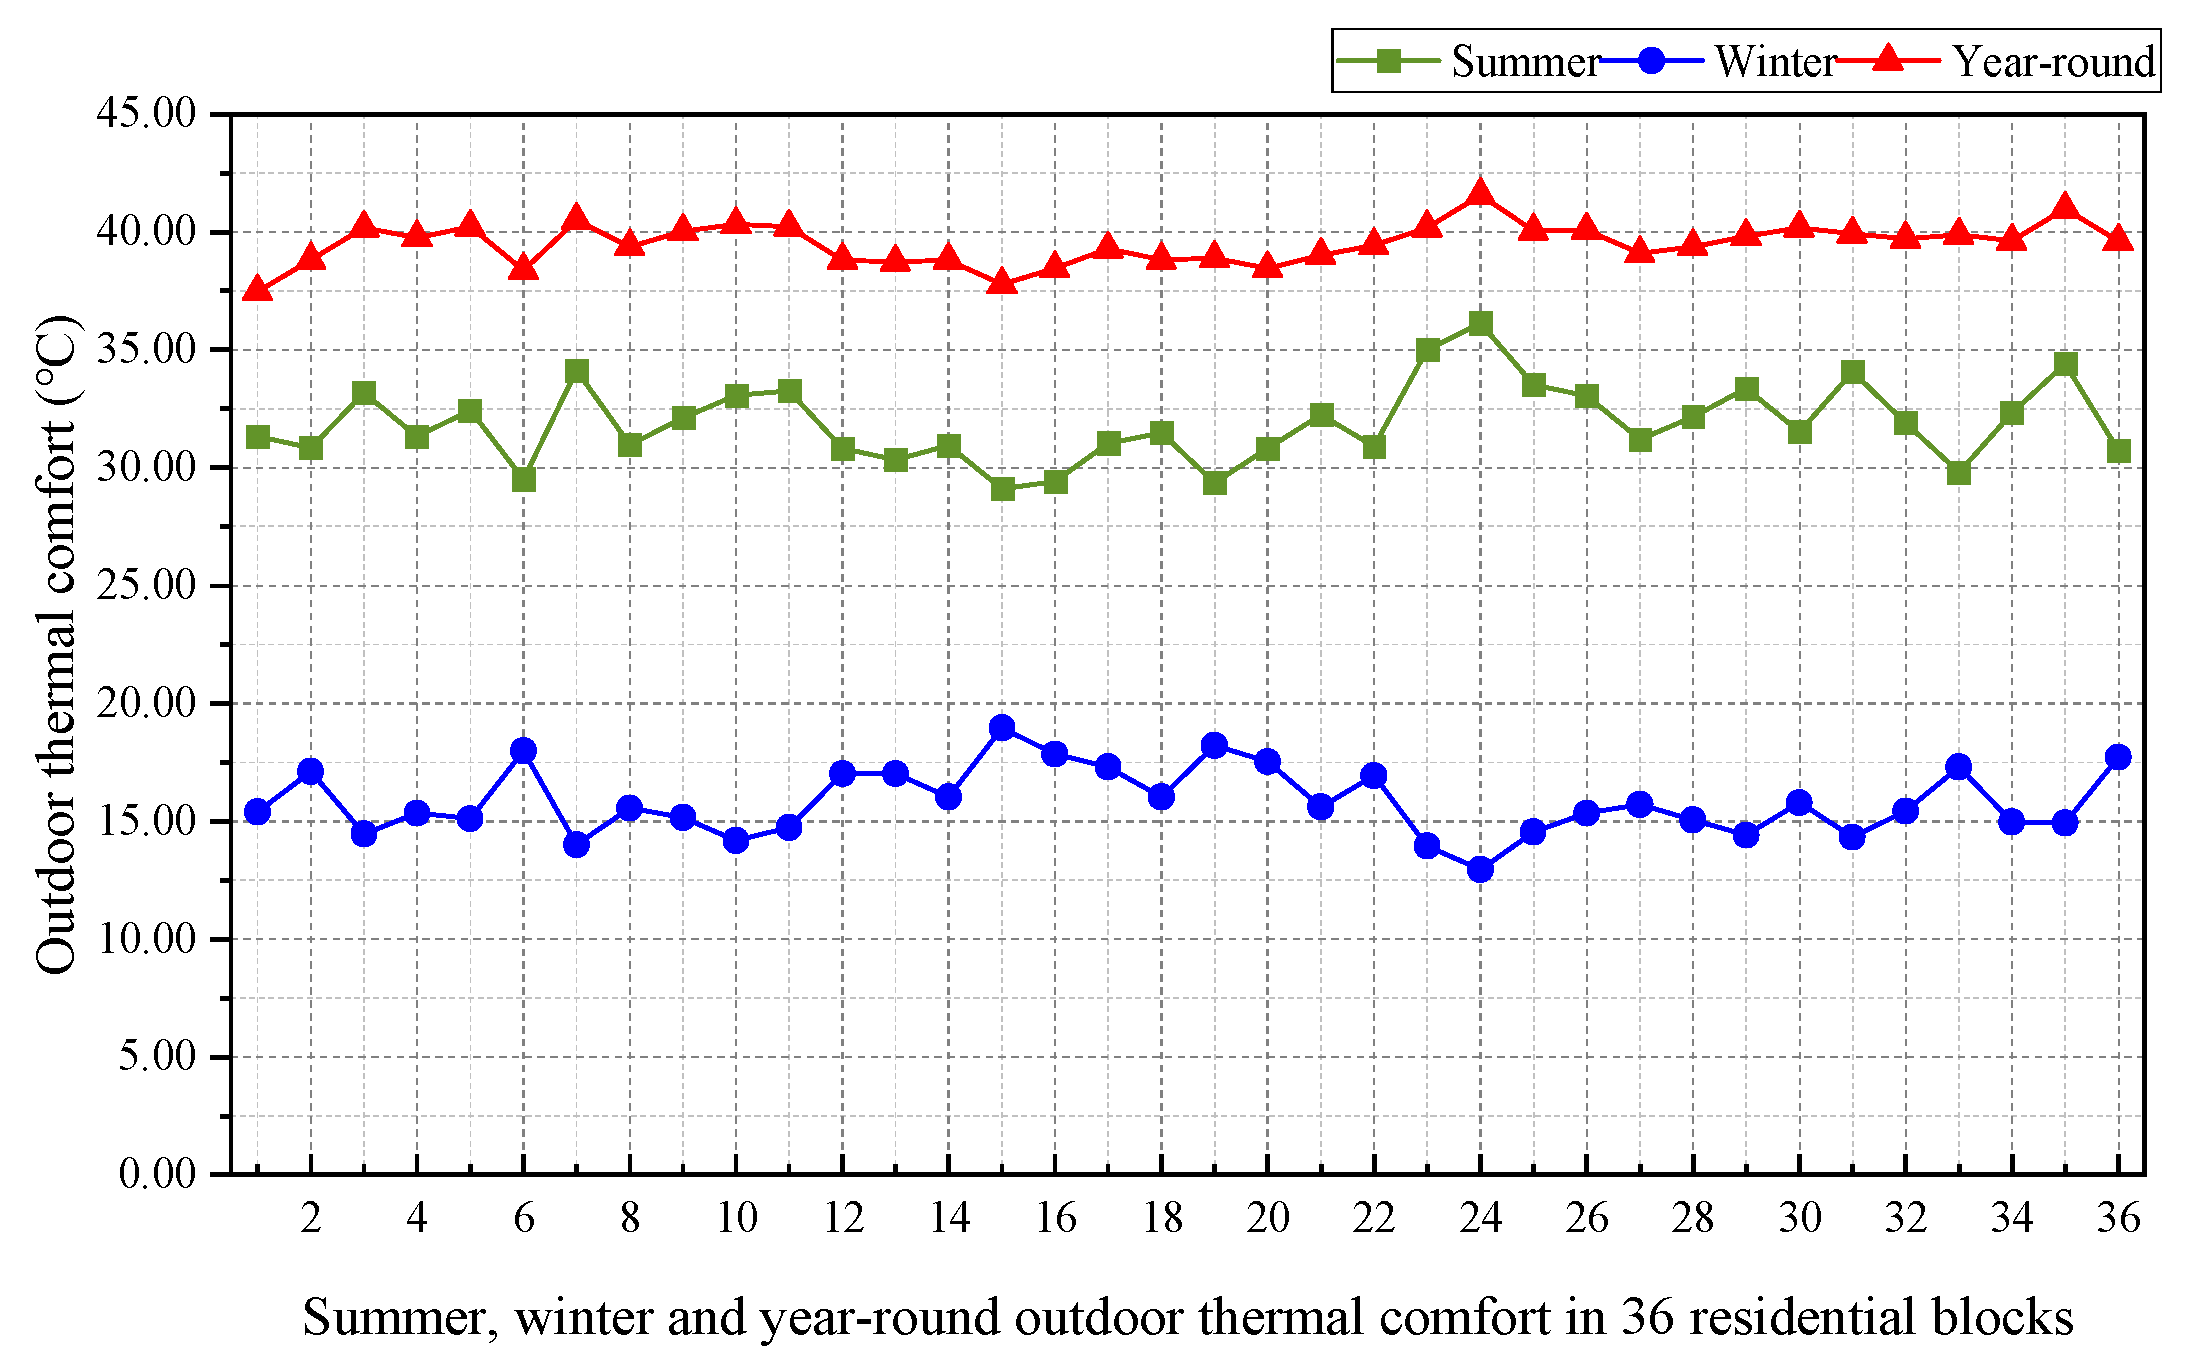
From the pattern in Figure 4, the data analysis shows that the outdoor thermal comfort in summer shows significant parameter sensitivity. In Case 32, the thermal comfort of a row-type layout with 11% building density and a plot ratio of 3.84 reaches a peak of 34.07 °C under the conditions of 30° building orientation and an aspect ratio of 2.45, which corresponds to a thermal stress level of “strong”. Meanwhile, when the building density is increased to 13% and the plot ratio is decreased to 1.06 for the same type of residential block, and a 0° building orientation and an aspect ratio of 0.47 are adopted, thermal comfort is optimized at 29.52 °C, which corresponds to a “moderate” thermal stress level. The comparative results show that the construction of high-density residential blocks increases the load on the outdoor thermal environment in summer.
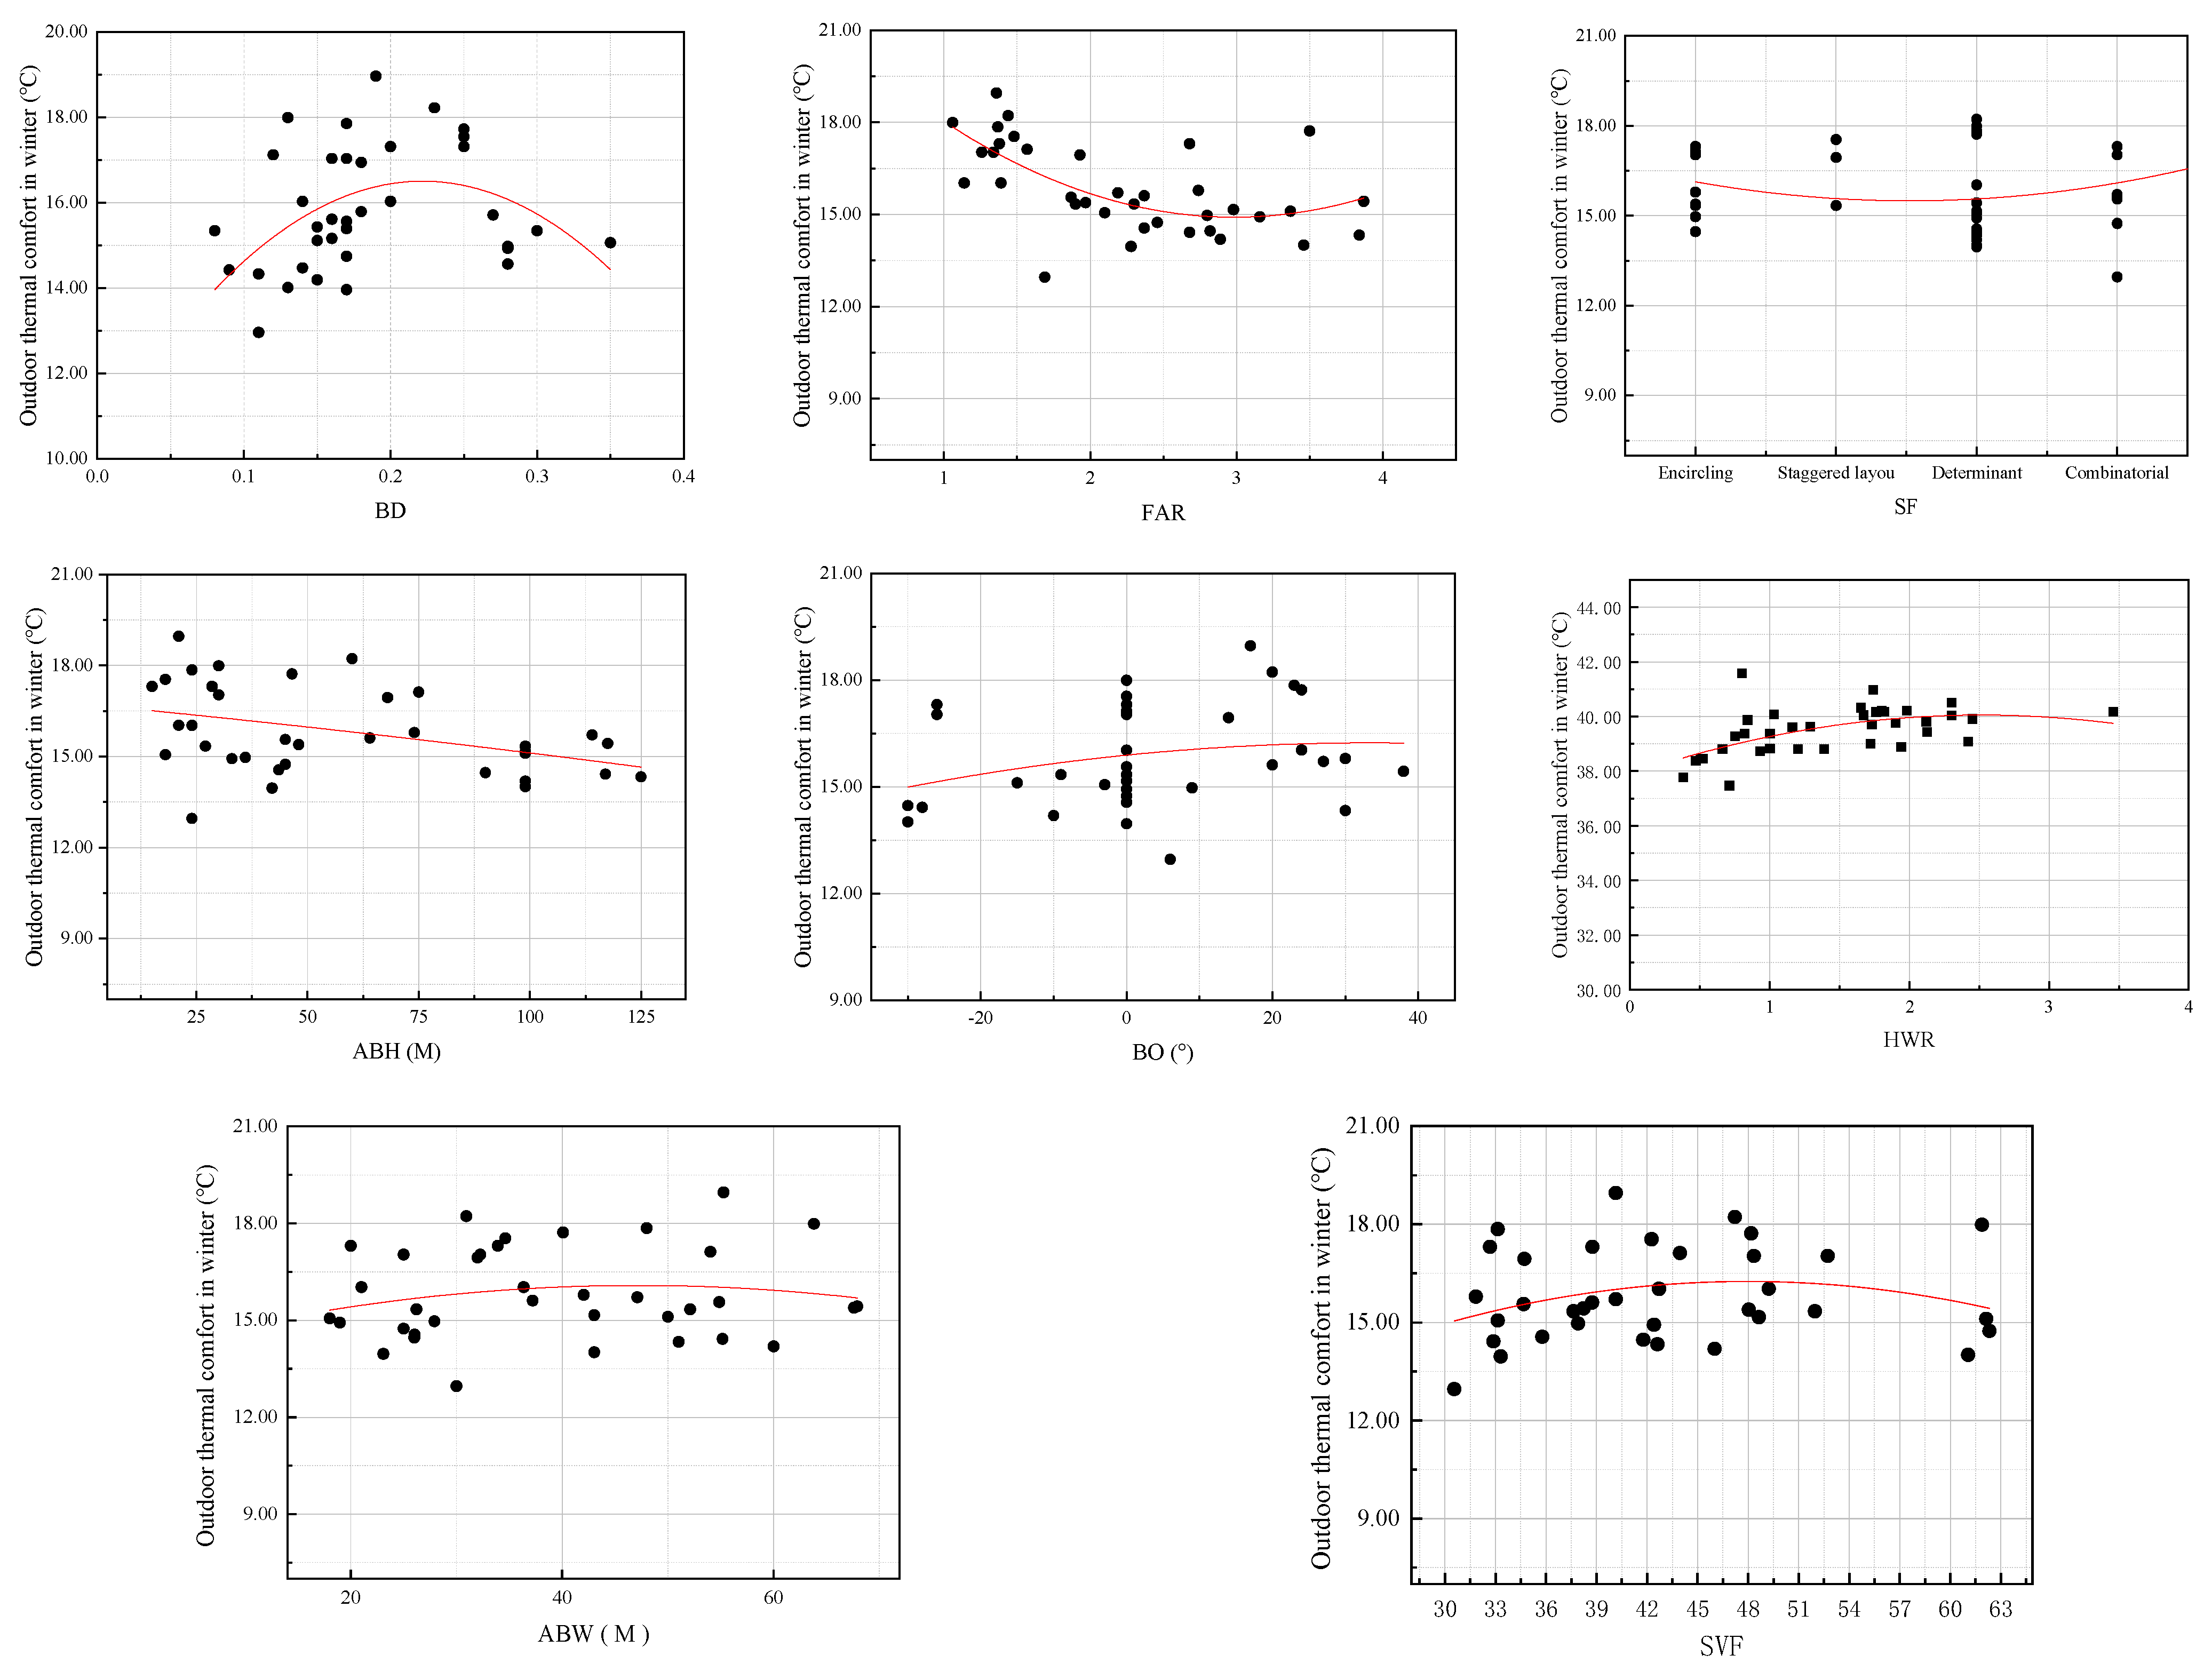
The comparative analysis shows that outdoor thermal comfort in winter shows a specific correlational pattern with morphological parameters. When the building density is 19% and the floor area ratio is 1.36 in the staggered-row type residential blocks with 17° building orientation and an aspect ratio of 0.38, the thermal comfort value reaches 18.95 °C, which is in the interval of “no thermal stress” in the thermal stress assessment system. Meanwhile, in the row–row-type layout residential blocks with 13% building density and a floor area ratio of 3.46, when the building orientation is −30° and the aspect ratio is 2.3, the thermal comfort value decreases to 14.01 °C, maintaining a state of “no heat stress”. Comparing these results with the summer data, the fluctuation in thermal comfort in winter is significantly narrowed, which verifies that the influence of morphological factors on the thermal environment in winter is significantly weaker than that in summer.
Analysis of the annual thermal comfort data reveals that there are significant differences in different spatial form combinations. In a row-type layout with a building density of 28% and a floor area ratio of 3.1, the peak annual thermal comfort value reaches 40.99 °C, with a 0° building orientation and an aspect ratio of 1.74, corresponding to a thermal stress level of “very strong”. Meanwhile, in a perimeter-type layout with a building density of 17% and a floor area ratio of 1.97, the highest summer thermal comfort value reaches 37.47 °C, with a 15° orientation and an aspect ratio of 0.71, corresponding to a thermal stress level of “strong”. This comparison reveals that different combinations of spatial form parameters have different effects on thermal comfort.
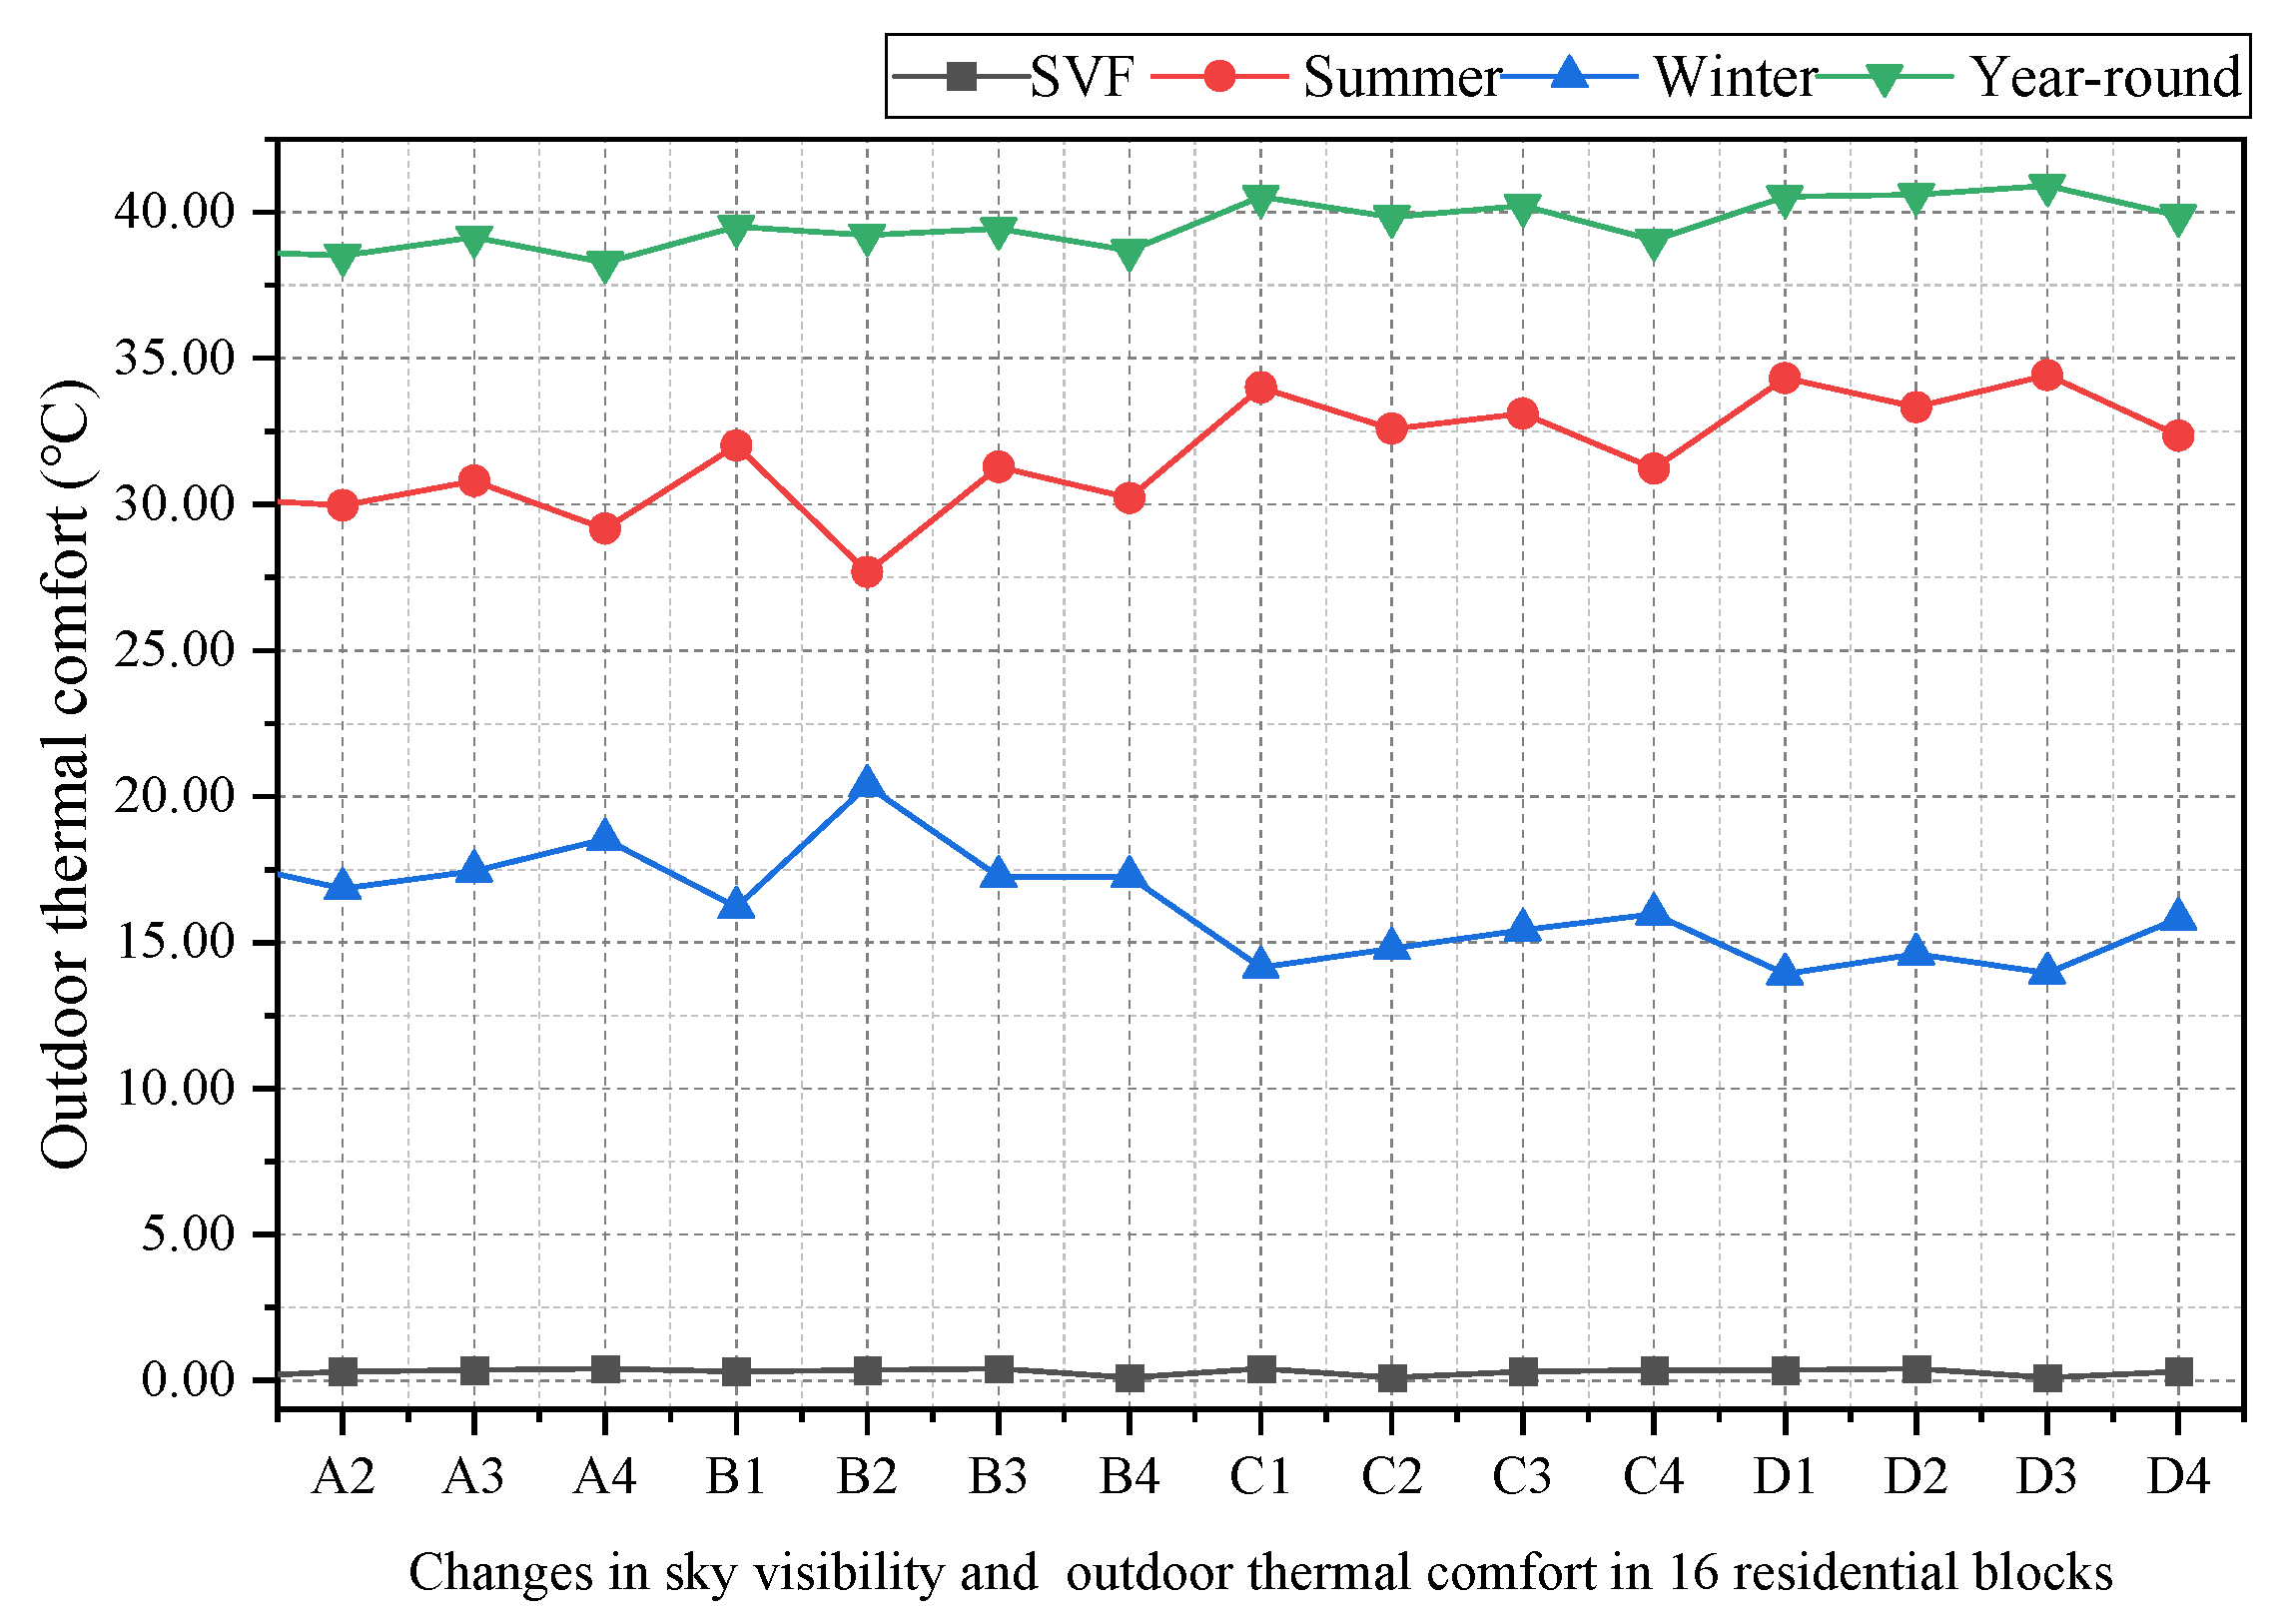
Comparative analysis shows that the spatial form of settlements correlates with thermal comfort in summer and winter and that the spatial visibility of residential blocks affects the thermal environment through the aspect ratio of residential blocks, which enhances ventilation and heat dissipation in summer but accelerates heat loss in winter. In summer, the spatial layout of residential blocks needs to find a balance between the spatial visibility and orientation of settlements, and empirical evidence shows that the spatial layout of settlements with a preferred orientation between 0° and 15° ensures the efficiency of ventilation in summer and creates a wind barrier in winter and that the space on the west and north sides of residential blocks is suitable for use as a buffer zone for the thermal environment. This strategy provides spatial guidelines for optimizing the thermal environment of residential blocks.

3.2. Analyze Statistics

The relationship between urban form factors and outdoor thermal comfort in summer and outdoor thermal comfort in winter was investigated using IBM SPSS Statistics 30.0.0 statistical analysis software. Pearson’s correlation test was used to parameterize the study to establish the strength and significance of the correlation between urban form factors and outdoor thermal comfort. The “p-value” is used to detect the significance of the difference between the variables, which is the prerequisite for the correlation test. The correlation coefficient r is used to determine the degree of linear correlation between the variables. When r = 0, it indicates no correlation; when 0 < |r| < 0.3, it indicates a weak correlation; when 0.3 < |r| < 0.5, it indicates a low correlation; when 0.5 < |r| < 0.8, it indicates a significant correlation; when 0.8 < |r| < 1, it indicates a high correlation; and when 0.8 < |r| < 1, it indicates full linear correlation. In addition, the direction of positive correlation between variables is judged according to whether the correlation coefficient r is greater than zero. If r > 0, it indicates a positive correlation between the variables. The difference in correlation is first determined by the p-value, and then the numerical magnitude of the effect is determined by the correlation coefficient R.
Figure 5 and Figure 6 depict the relationships between thermal comfort in summer and winter and the various influencing factors. The floor area ratio (FAR) is the ratio of gross floor area to site area, and a high FAR usually means denser buildings, which may affect ventilation and solar radiation absorption. Higher densities may result in more shaded areas but may also impede air flow. The HWR is the ratio of building height to building width and is an important measure of the degree of road openness in residential blocks. In general, the greater the HWR, the more compact the space, and the lower the HWR, the more open the area. Residential blocks with a high HWR provide more shade, which can reduce solar radiation and improve thermal comfort in summer but is detrimental to thermal comfort in winter.
PETS = 1.2 × FAR − 0.21 × SF + 0.18 × BD + 0.82 × BO + 2.5 × HWR + 0.22 × SVF
The multiple regression analysis results presented in Table 6 indicate that HWR, FAR, BO, BD, and SF have a significant effect on PETS. The HWR, FAR, BO, and BD are positively correlated with PETS, and when HWR exceeds 1.5, the street canyon effect leads to an increase in PETS by 2.5 °C; for every 0.1 units of FAR, PETS increases by 1.2 °C; for every 0.1 units of BO, when the angle between BO and the dominant wind direction is less than 30°, the heat island effect leads to a 25% increase in PETS; for every 0.05 units of BD, the shading coverage increases by 12%, but the ventilation efficiency decreases by 18%; for every 0.1 units of SVF, the shading coverage increases by 12%, but the ventilation efficiency decreases by 18%; and for every 0.1 units of SVF, the ventilation efficiency increases by 18%. BD increases by 12% for every 0.05 units of BD, but the ventilation efficiency decreases by 18%; for every 0.1 units of SVF, the direct solar radiation is enhanced by 18%, and the longwave heat dissipation radiation is reduced by 12%; SF is negatively correlated with PETS, and every 0.01 unit increase in SF reduces PETS by 0.21 °C. The influence of the standardized coefficient on PETS is in the order of the strength of the effect. In the order of normalized coefficients, HWR (2.5) > FAR (1.2) > BO (0.82) > BD (0.18) > SF (−0.21). The critical threshold analysis shows that when FAR > 2.5 and HWR > 2.0, the ventilation corridor should be mandatory; when BD is controlled at 25%~30% and the orientation angle θ is 15°~30°, the PETS can be reduced by 3~4 °C. The layout form is prioritized as staggered rows rather than enclosures, rows, or columns, and in terms of the sky visibility, the recommended range is 0.4~0.6 or 0.6~0.8 for residential blocks.
PETW = −0.6 × FAR + 0.25 × SF + 1.2 × BD − 0.21 × BO + 1.8 × HWR − 0.3 × SVF
Multiple regression analysis shows that HWR, FAR, BD, SF, and BO have significant effects on PETw. Among them, HWR, FAR, BD, SF, and PETw are positively correlated: when HWR is greater than 1.2, the street canyon effect leads to an increase of 1.8 °C in PETw; for every 0.1 unit increase in FAR, PETw decreases by 0.6 °C; for every 0.06 unit increase in BD, the wind speed attenuation rate increases by 20%, and PETw increases by 1.2 °C; and for every 0.1 unit increase in SF, the PETw increases by 2.5 °C, SVF decreases by 0.1 unit, and longwave radiation decreases by 2.5 °C. For every 0.1 unit decrease in SVF, the longwave radiation is reduced by 15%, and the thermal storage efficiency is increased by 10%, while BO is negatively correlated with PETw. When the angle between BO and the dominant wind direction is less than 15°, the heat island effect leads to an increase in PETw by 30%. The order of impact in terms of normalized coefficients is as follows: HWR (1.8) > BD (1.2) > FAR (0.6) > SF (0.25) > BO (−0.21). The critical threshold analysis shows that when FAR < 1.8 and HWR < 1.0, additional sunlight reflective surfaces are needed; when the building density is controlled at 30%~35% and the orientation angle θ is 10°~23°, the PETw can be increased by 2~3 °C, and the layout form is prioritized as perimeter-type over column-type or staggered-type. In terms of sky visibility, it is recommended to be between 0.2 and 0.4 or between 0.4 and 0.6 for residential blocks.

3.3. Orthogonal Experiment

The outdoor thermal comfort of a settlement is measured by several factors, including climatic, physical, and occupant factors. In this paper, building density, floor area ratio, building layout, building orientation, and residential blocks’ aspect ratio are selected as the key factors for study. With the other seven factors fixed, each of the factors is varied, and the range and gradient of the variation are set. Using this method, the degree of influence of these factors on outdoor thermal comfort, the effect of their influence, and the quantitative relationship between them were investigated.
Single-factor analysis can only be used to study and analyze the effect of one factor on outdoor thermal comfort; however, outdoor thermal comfort is affected by many factors. Therefore, subsequently, orthogonal experiments were designed to study the residential block morphology factors affecting outdoor thermal comfort, and their optimized combinations were analyzed. If there are four levels for each factor, 44 experiments would be required, which would be very time consuming and difficult to complete. Orthogonal experiments are among the most commonly used optimization methods to perform experiments quickly and efficiently; therefore, in this study, a table of orthogonal experiments with four factors and four levels was created, which represents the complete experiment after only 16 sets of experiments, as shown in Table 7.
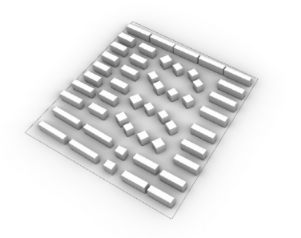
According to the Wuhan Municipal Planning and Management Technical Regulations [50], the minimum net site area of a multistory residential block should be 10,000 m
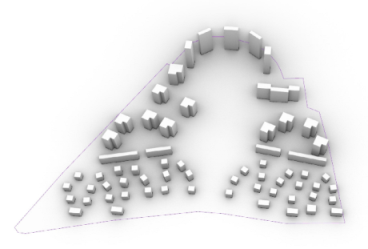
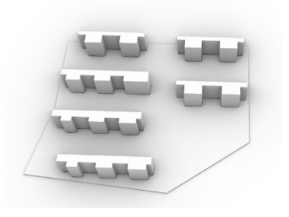
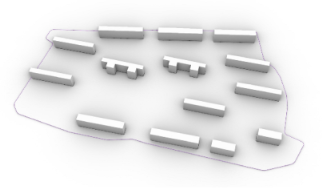
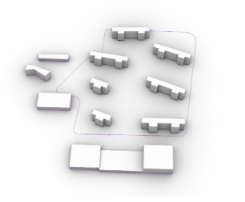
2, the spacing of parallel buildings should be greater than or equal to 1.1 times the height of the building, and the minimum spacing of the building’s walls should be 7 m. The ideal model of this project is determined as having a plot area of 250 m × 200 m and an overall building size of 13.8 m × 52 m. The building spacing and orientation are adjusted according to the orthogonal experimental data. The height of the building is 10 floors, with a story height of 3 m. The final model is shown in Table 8.
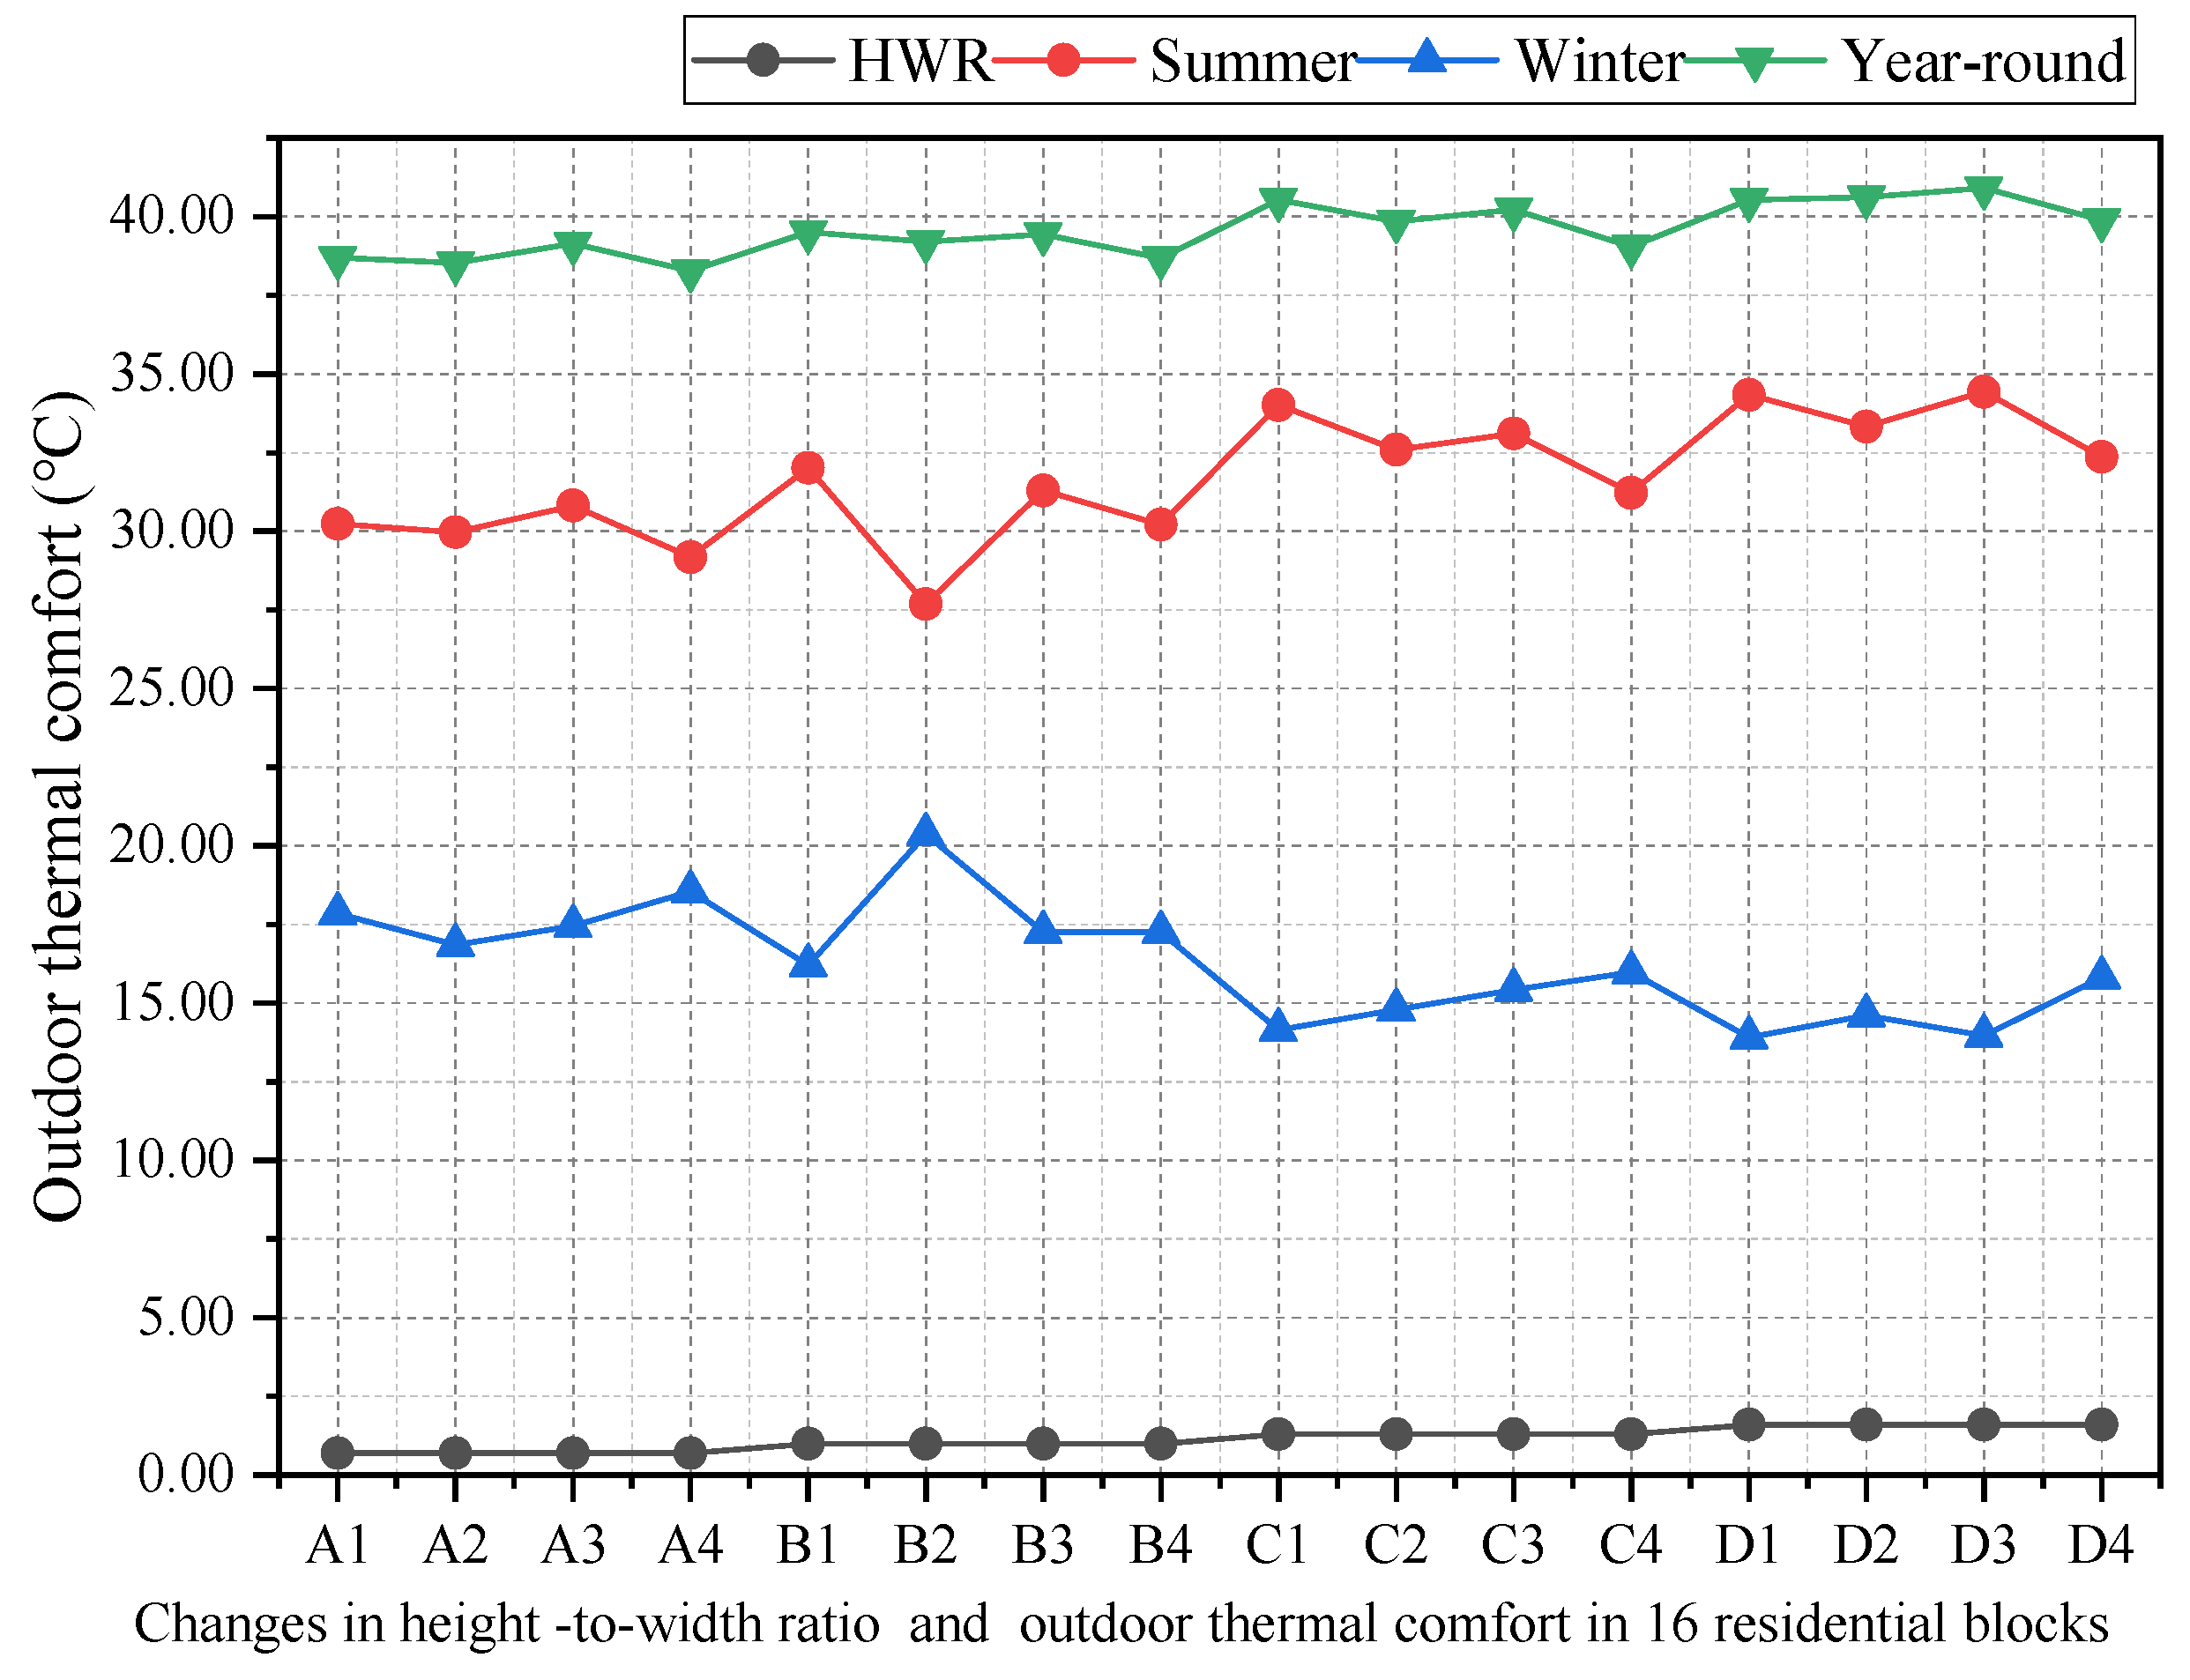
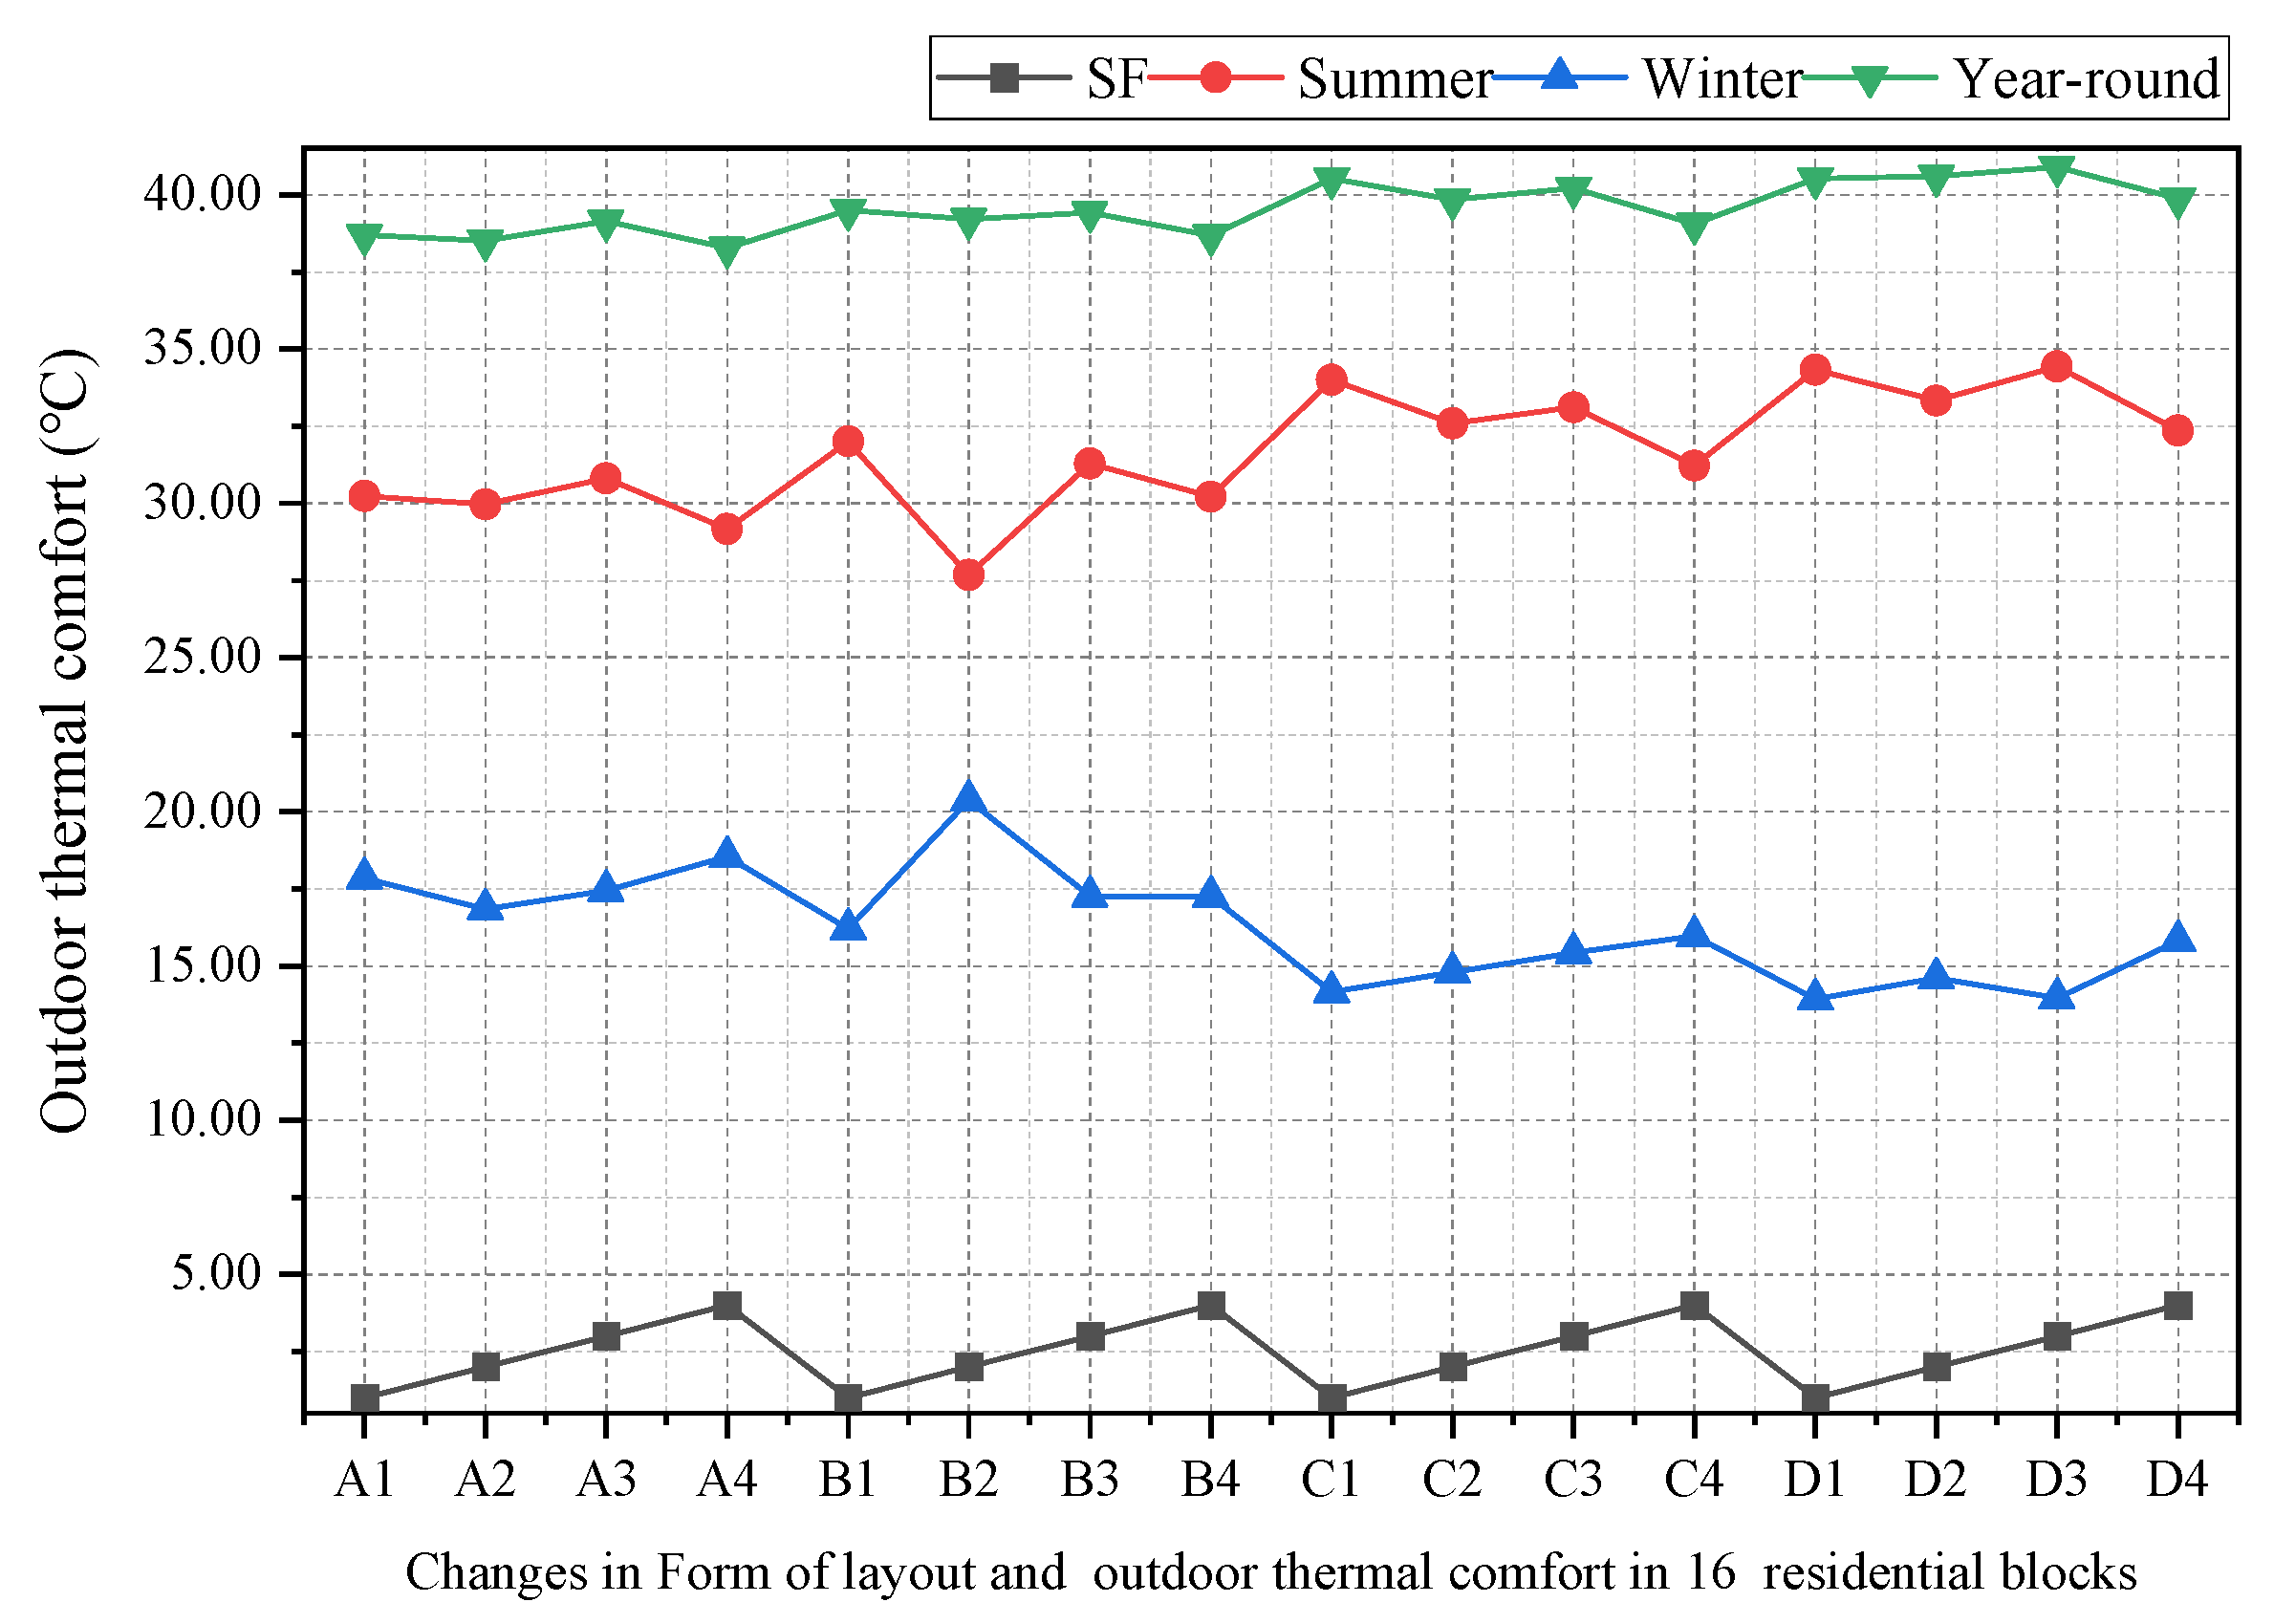
Overall, the summer, winter, and year-round outdoor thermal comfort performances of the 16 prototypes of multifactor combination forms for residential blocks are shown in Figure 7, Figure 8, Figure 9 and 
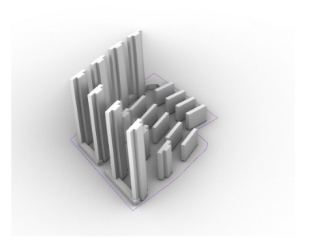
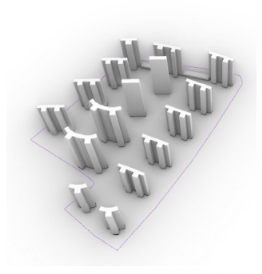
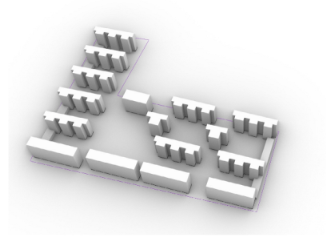
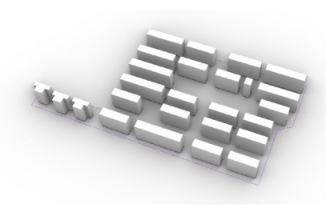
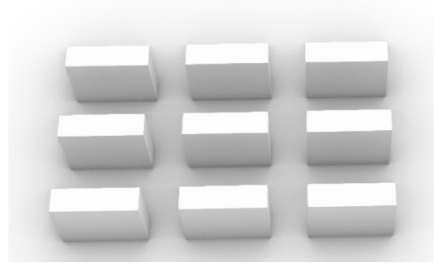
Figure 10. The mean UTCI of each of the 16 prototypes of building morphology was calculated separately to obtain a comparison of outdoor thermal comfort levels in the summer, winter, and year-round. For the four building layout patterns, in terms of the average UTCI in summer, the lowest value was 30.78 °C for the modular pattern, and the highest value was 32.67 °C for the row pattern, and in terms of average UTCI in winter, the highest value was 16.89 °C for the modular pattern and 15.53 °C for the row pattern. It is evident that the combined layout is more suitable as a residential block form to enhance outdoor thermal comfort in summer. As a whole, B2 has the lowest summer UTCI and the highest winter UTCI among the 16 prototypes, i.e., the best level of outdoor thermal comfort, with a UTCI value of 27.68 °C when the building form is staggered-row, SVF = 0.4, and HWR = 1.
As shown in Figure 7, the UTCI values of row-type, staggered-type, enclosed-type, and combined-type blocks at HWR = 0.7, 1.0, 1.3, and 1.6, respectively, were obtained by averaging the building layout patterns under different residential block aspect ratios. The comparison reveals that the larger the height-to-width ratio of the residential blocks and the narrower the north–south spacing of the buildings for a certain control building height, the lower the UTCI value and the more comfortable it is outdoors in summer. This result reflects the importance of sunlight radiation for outdoor thermal comfort in summer—the narrower the building spacing, the smaller the area exposed to sunlight in the residential blocks, thus enhancing people’s outdoor thermal comfort. With the change in the residential block street aspect ratio among the 16 types of residential blocks with a multifactorial combination of morphological archetypes, the UTCI shows significant differences, in which the four types of settlement layout with HWR = 1 have the lowest outdoor thermal comfort in summer and the highest outdoor thermal comfort in winter.
In addition, the reduction in the residential block aspect ratio has an effect on the distribution of UTCI in the internal space of the four building layouts, as shown in Table 4. For the row-type building layout, as the residential block aspect ratio decreases, the less comfortable area inside each residential blocks gradually decreases; for the staggered building layout, as the residential block aspect ratio decreases, the outdoor thermal comfort level gradually develops from very strong thermal stress to strong thermal stress; for the enclosed building layout, the smaller the residential block aspect ratio is, the higher the degree of enclosure is in the residential blocks, and consequently, the more comfortable area inside the corner of the building continuously increases.
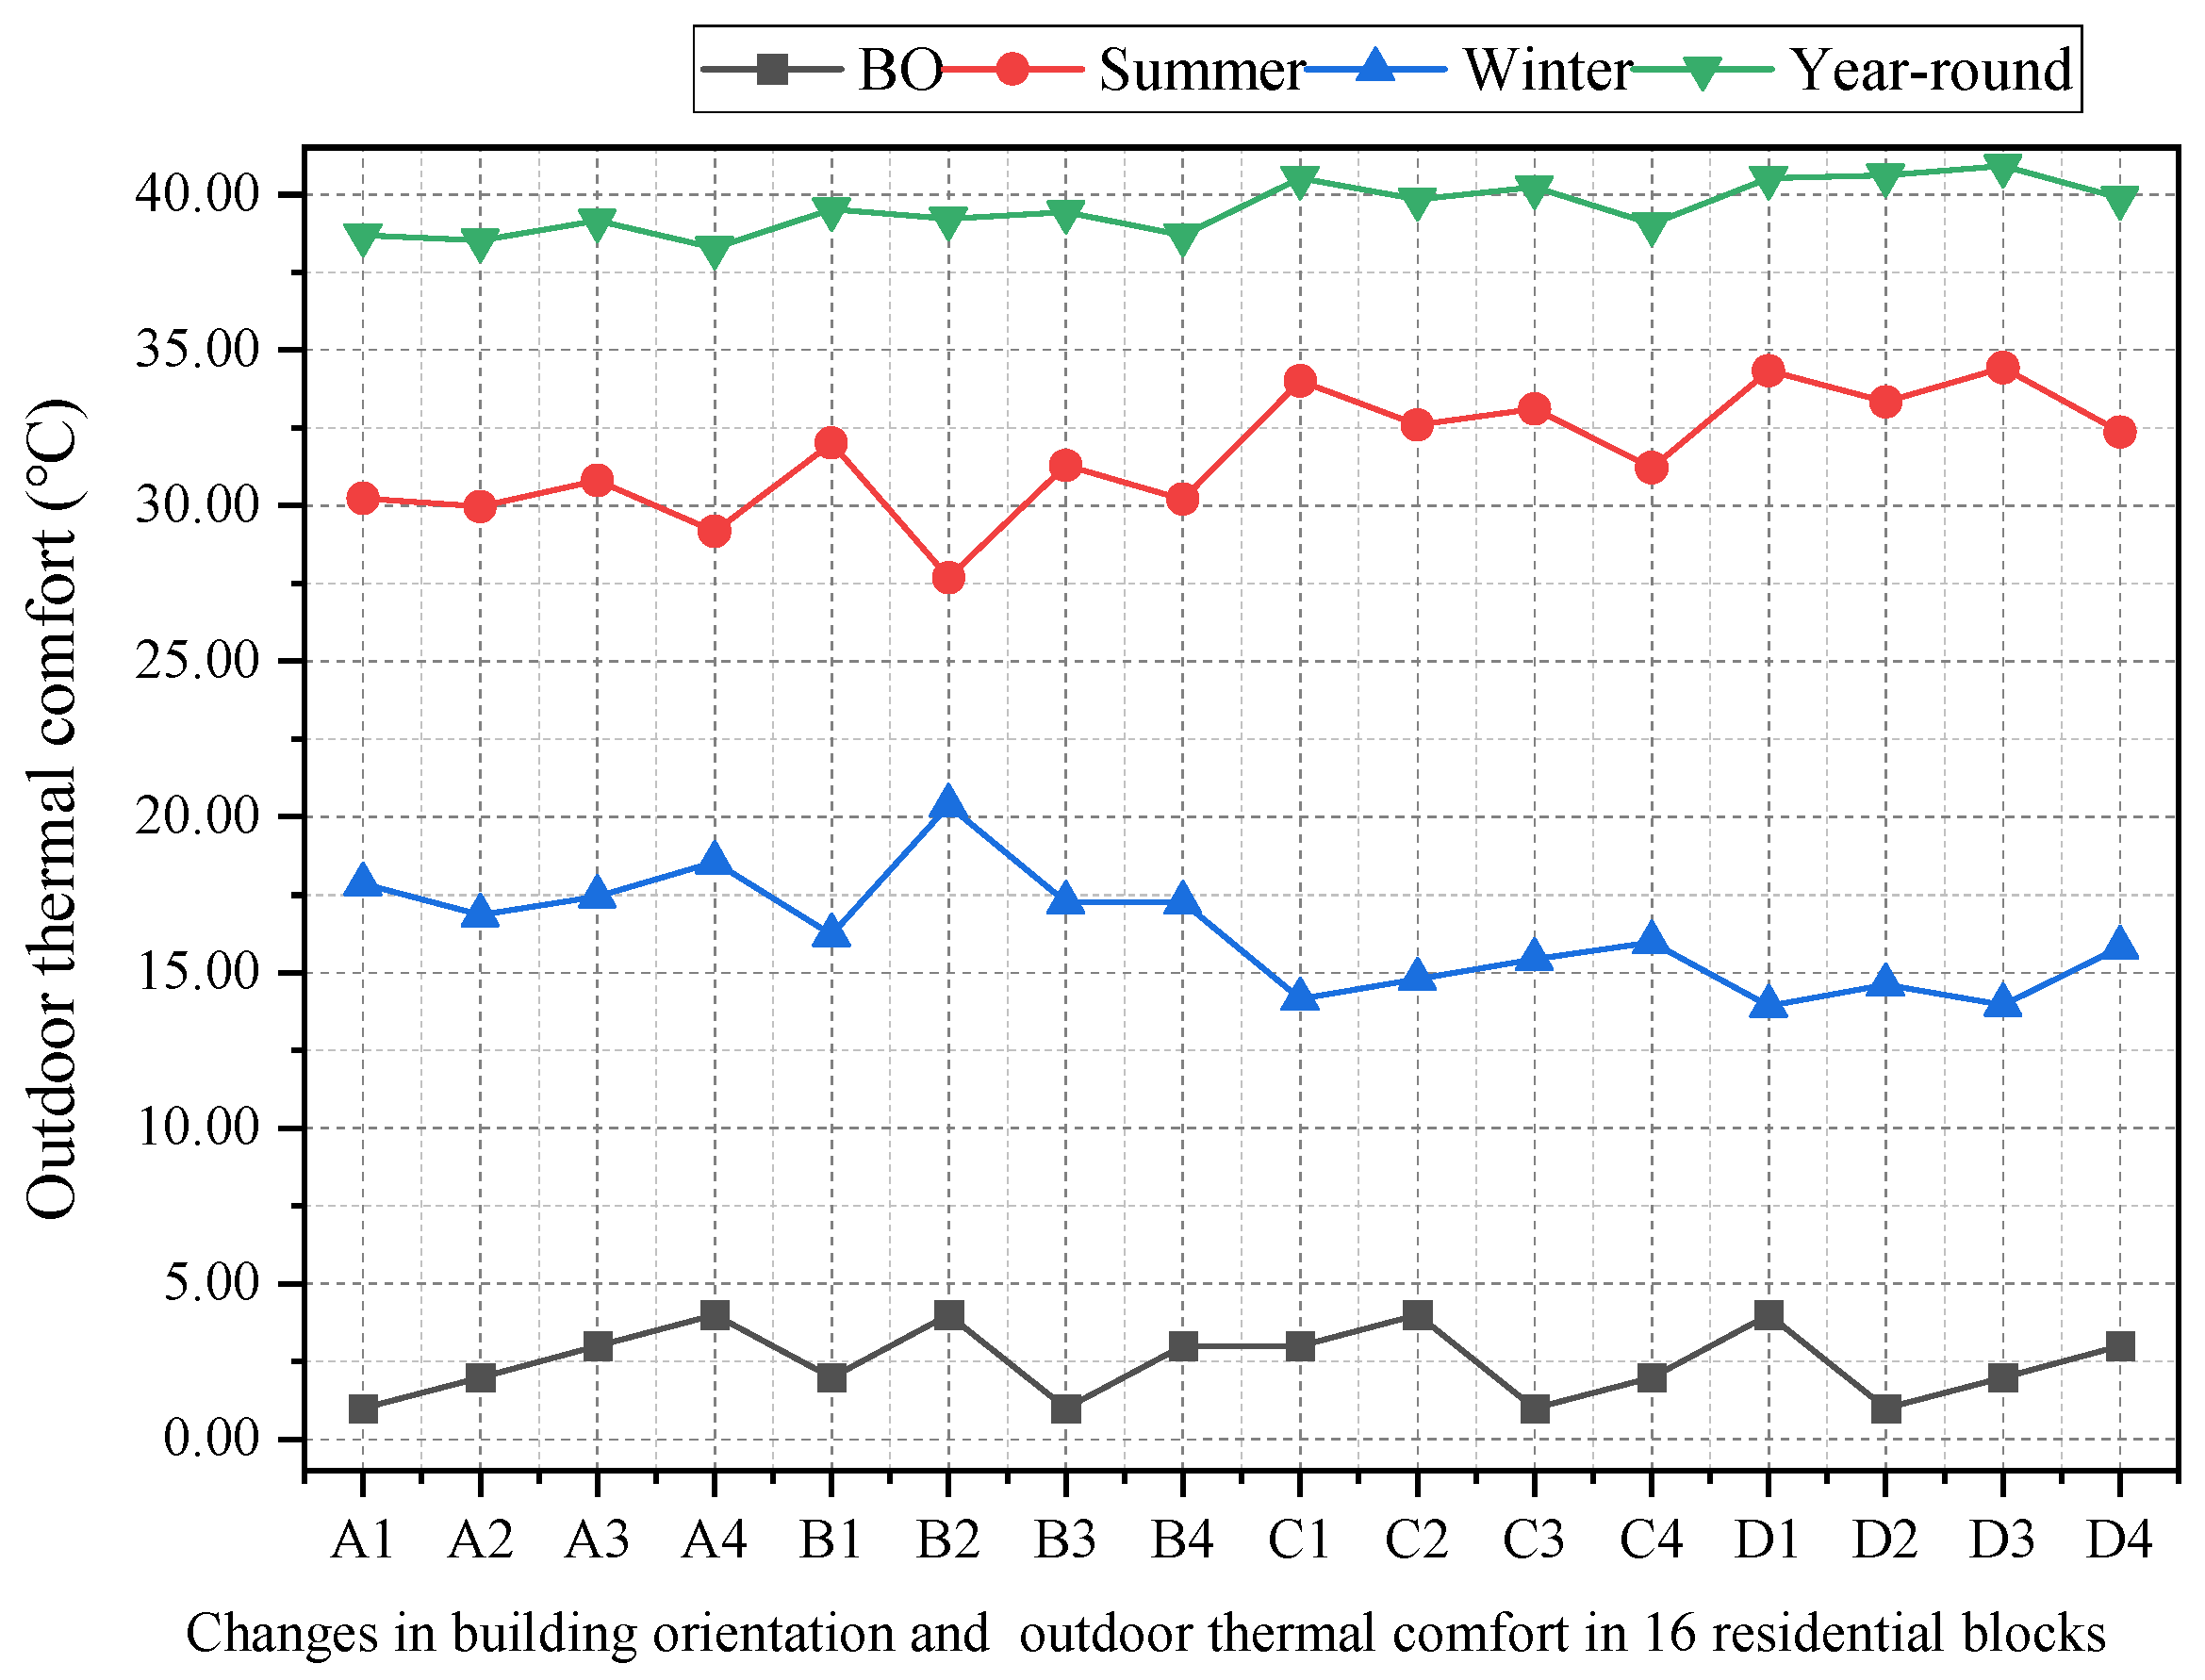
The thermal comfort of the four building layout morphologies presents a more obvious advantage in winter at BO = 0°. As shown in the figure, the mean value is calculated in the same way, and it is found by comparison that the outdoor thermal comfort levels of the four building layout patterns all decrease with the change in the residential blocks’ orientation, with the greatest influence on the row–row type, with a UTCI value of 27.68 °C in the staggered row–row layout in the summer when the BO of the residential blocks = 0° and a UTCI value of 34.43 °C when the BO of the residential blocks = 30°, with a difference of 6.75 °C between the front and the back, which demonstrates the importance of the orientation of the residential blocks for their outdoor thermal comfort.

4. Conclusions

China’s 14th Five-Year Plan (2021–2025), as a national development blueprint, prioritizes high-quality development, premium living standards, and efficient governance mechanisms, positioning enhanced living quality as a central policy objective—within this framework, enhancing outdoor thermal comfort emerges as a critical pathway for upgrading residential environments. This study innovatively bridges urban planning and environmental physics by conducting morphological analysis of 36 Wuhan residential prototypes through parametric simulations (Ladybug/UTCI) and multivariate regression, quantifying the impact of eight urban form parameters—BD, FAR, ABW, ABH, BO, HWR, LF, and SVF—on seasonal thermal performance differentials. Subsequent orthogonal experimental design (L16 orthogonal array) distilled 16 optimal configurations via ANOVA sensitivity analysis, and suggestions for multifactor form planning and design of Wuhan residential blocks were put forward, which provide new perspectives and comprehensive planning references for upgrading the quality of Wuhan residential blocks. Through the analysis of the above simulation results, the following multielement form planning and design strategies for Wuhan residential blocks can be obtained:
(1)
Among the four types of building layout forms, the combined layout has the lowest average UTCI value in summer and the highest average UTCI value in winter, and the outdoor thermal comfort level of the residential blocks orientation is more pronounced for the row layout, so it is recommended that the row layout be selected as the building layout form for the residential blocks and that the planting of trees and other greenery be increased appropriately.
(2)
For Wuhan residential blocks, open spaces such as streets and squares are mostly used as public activity places for residents, and it is recommended to minimize the street height-to-width ratio to ensure the reduction in insolation radiation received in these open spaces and to promote the formation of a favorable wind environment.
(3)
The difference in the influence of residential blocks’ orientation on the UTCI values of different prototypes reaches 6.75 °C. Therefore, in terms of residential blocks’ orientation, it is found that the thermal condition of streets oriented in the east–west direction is the worst, while the thermal condition of those oriented in the north–south direction is better. This is because east–west-oriented streets are exposed to sunlight longer in the summer than north–south-oriented streets. In addition, for low-rise buildings, a north–south orientation is recommended, but for high-rise buildings, there is no preferred orientation. In addition, green space can significantly reduce the UTCI value inside the residential blocks through its shading effect and cooling and humidifying effect, and it is recommended to increase the green coverage on both sides of the streets, squares, and other public spaces in the residential blocks in order to enhance the level of thermal comfort for outdoor leisure activities around residential blocks.
This paper analyzes the impact of public space layout elements on the thermal environment of multistory residential blocks in hot-summer and cold-winter regions. Due to the complexity of residential blocks patterns and the differences between different climate zones, the results of this study are only relevant to the design of residential blocks under specific conditions. In future research, the optimization of more residential block types under different climate zones can be considered.
This study is based on multifactor morphology planning at the residential block scale, but in order to fully assess the impact of the morphology of these factors on outdoor thermal comfort, elements such as greening, plazas, etc. could be added to the analysis. It is necessary to include the effects of different elements on outdoor thermal comfort, such as building spatial patterns, road network density, green space layout patterns, etc., so as to strengthen the significance of guiding the planning and design of multielement morphology in Wuhan city.

5. Discussion

China’s 14th Five-Year Plan puts forward the requirements for high-quality development, a high quality of life, and high-efficiency governance, and points out that creating a high of quality life is the fundamental purpose of these efforts. Comprehensively improving the level of outdoor thermal comfort is an important aspect of promoting residents’ high quality of life. Based on the four types of building layouts in Wuhan residential blocks, this study extracted 36 combined form prototypes and explored the influence of SF, HWR, BO, and SVF on outdoor thermal comfort through numerical simulation and statistical analysis. Based on the results of this study, multielement morphology planning and design proposals for Wuhan at the residential block level are supplied, which provide new perspectives and comprehensive planning references for improving the quality of Wuhan residential blocks.
This study has some limitations that need to be addressed in future research. First, in terms of the scope of this study, this paper only examines the seven main urban areas in Wuhan. Although there are various types of residential areas, there are few studies on high-rise residential areas and multifunctional residential areas, along with other areas. Secondly, in terms of technical software, this paper adopts the LB toolset embedded in GH to perform the simulation. Open studio was used in performing the thermal environment simulation. However, a Python program, Envi-met, could be developed to improve the accuracy of the calculations. Thirdly, regarding the design variables, this study focused on only a few independent variables, namely, the number, location, and area of residential block spaces, as well as the HWR, BO, SVF, and SF. However, outdoor thermal comfort is affected by intricate environmental factors, such as subfloor materials and space height, which deserve further investigation. Fourthly, in terms of the research objectives, the geographical area of interest is an area with hot summers and cold winters, where thermal comfort in summer and winter is the research objective. If the area is a cold region or a region with a unique climate, different objectives have to be selected based on their respective climatic characteristics.

Author Contributions

Conceptualization, Y.L. and G.L.; methodology, Y.L., G.L., and G.A.; software, Y.L. and W.T.; formal analysis, W.T.; investigation, Y.L.; resources, Y.Z.; data curation, Y.Z.; writing—original draft preparation, Y.L. and G.A.; writing—review and editing, Y.L.; visualization, Y.L. and Y.Z.; supervision, G.A.; funding acquisition, G.L. All authors have read and agreed to the published version of the manuscript.

Funding

This study was supported by the International Science and Technology Cooperation Program of Hubei Province: “The research on multi scenario simulation and early warning system for urban disaster resilience: A case study of Wuhan” (2023EHA032).

Data Availability Statement

Data are contained within the article.

Conflicts of Interest

The authors declare no conflicts of interest. The funders had no role in the design of the study; in the collection, analyses, or interpretation of data; in the writing of the manuscript; or in the decision to publish the results.

References

  1. United Nations Department of Economic and Social Affairs Population Division. World Urbanization Prospects: The 2018 Revision; United Nations: New York, NY, USA, 2018; p. 126. [Google Scholar]
  2. Seto, K.C.; Dhakal, S.; Bigio, A.; Blanco, H.; Delgado, G.C.; Dewar, D.; Huang, L.; Inaba, A.; Kansal, A.; Lwasa, S. Human settlements, infrastructure and spatial planning. In Climate Change 2014: Mitigation of Climate Change. Contribution of Working Group III to the Fifth Assessment Report of the Intergovernmental Panel on Climate Change; Cambridge University Press: Cambridge, UK, 2014. [Google Scholar]
  3. IEA. Energy Technology Perspectives 2020; IEA: Paris, France, 2020. [Google Scholar]
  4. Oke, T. The heat island of the urban boundary layer: Characteristics, causes and effects. In Wind Climate in Cities; Springer: Berlin/Heidelberg, Germany, 1995; pp. 81–107. [Google Scholar]
  5. General Office of the Municipal People’s Government on the Issuance of the Fourteenth Five-Year Plan for National Economic and Social Development of Wuhan City and the Social Development Plan for the Fourteenth Five-Year Plan and 2035 Outline of the Visionary Goals of Wuhan Municipality. Wuhan Municipal People’s Government Bulletin; 2022; pp. 27–42. Available online: https://english.wuhan.gov.cn/GR_12797/202110/t20211011_1792729.shtml (accessed on 12 April 2025).
  6. Lin, T.-P.; Matzarakis, A.; Hwang, R.-L. Shading effect on long-term outdoor thermal comfort. Build. Environ. 2010, 45, 213–221. [Google Scholar] [CrossRef]
  7. Wei, Z.; Zhi, G.; Wovo, D. Research progress of outdoor thermal comfort index. Environ. Health Misc. J. 2015, 32, 836–841. [Google Scholar]
  8. Solano, J.C.; Caamaño-Martín, E.; Olivieri, L.; Almeida-Galárraga, D. HVAC systems and thermal comfort in buildings climate control: An experimental case study. Energy Rep 2021, 7, 269–277. [Google Scholar] [CrossRef]
  9. Han, S.; Song, D.; Xu, L.; Ye, Y.; Yan, S.; Shi, F.; Zhang, Y.; Liu, X.; Du, H. Behaviour in public open spaces: A systematic review of studies with quantitative research methods. Build. Environ. 2022, 223, 109444. [Google Scholar] [CrossRef]
  10. Statistical Communiqué of the People’s Republic of China on the 2022 National Economic and Social Development. National Bureau of Statistics of China, 28 February 2023.
  11. Johansson, E. Influence of urban geometry on outdoor thermal comfort in a hot dry climate: A study in Fez, Morocco. Build. Environ. 2006, 41, 1326–1338. [Google Scholar] [CrossRef]
  12. Ali-Toudert, F. Dependence of Outdoor Thermal Comfort on Street Design in Hot and Dry Climate; Institutes der Universität Freiburg: Freiburg, Germany, 2005. [Google Scholar]
  13. Futcher, J.A.; Kershaw, T.; Mills, G. Urban form and function as building performance parameters. Build. Environ. 2013, 62, 112–123. [Google Scholar] [CrossRef]
  14. Elnahas, M. The effects of urban configuration on urban air temperatures. Archit. Sci. Rev. 2003, 46, 135–138. [Google Scholar] [CrossRef]
  15. Rode, P.; Keim, C.; Robazza, G.; Viejo, P.; Schofield, J. Cities and energy: Urban morphology and residential heat-energy demand. Environ. Plan. B Plan. Des. 2014, 41, 138–162. [Google Scholar] [CrossRef]
  16. Martins, T.; Adolphe, L.; Bastos, L.; Martins, A. Sensitivity analysis of urban morphology factors regarding solar energy potential of buildings in a Brazilian tropical context. Sol. Energy 2016, 137, 11–24. [Google Scholar] [CrossRef]
  17. Xu, Y.; Ren, C.; Ma, P.; Ho, J.; Wang, W.; Lau, K.K.-L.; Lin, H.; Ng, E. Urban morphology detection and computation for urban climate research. Landsc. Urban Plan. 2017, 167, 212–224. [Google Scholar] [CrossRef]
  18. Srivanit, M.; Jareemit, D. Modeling the influences of layouts of residential townhouses and tree-planting patterns on outdoor thermal comfort in Bangkok suburb. J. Build. Eng. 2020, 30, 101262. [Google Scholar] [CrossRef]
  19. Wu, Z.; Dou, P.; Chen, L. Comparative and combinative cooling effects of different spatial arrangements of buildings and trees on microclimate. Sustain. Cities Soc. 2019, 51, 101711. [Google Scholar] [CrossRef]
  20. Sun, C.; Lian, W.; Liu, L.; Dong, Q.; Han, Y. The impact of street geometry on outdoor thermal comfort within three different urban forms in severe cold region of China. Build. Environ. 2022, 222, 109342. [Google Scholar] [CrossRef]
  21. Zhang, H.; Gao, Z.; Ding, W.; Zhang, W. Numerical Study of the Impact of Green Space Layout on Microclimate. Procedia Eng. 2017, 205, 1762–1768. [Google Scholar] [CrossRef]
  22. Li, Z. Research on Optimization Strategy of Green Space Planning and Design for Residential Communities in Hot Summer and Cold Winter Areas. Ph.D. Thesis, Wuhan University, Wuhan, China, 2018. [Google Scholar]
  23. Walsh, A.; Cóstola, D.; Labaki, L.C. Review of methods for climatic zoning for building energy efficiency programs. Build. Environ. 2017, 112, 337–350. [Google Scholar] [CrossRef]
  24. Wang, Z.; Chen, Y.; Zhou, M.; Wu, J.; Zhang, M. A clustering method with target supervision for the thermal climate division of residential buildings in the Hot Summer and Cold Winter Area of China. J. Build. Eng. 2021, 43, 103156. [Google Scholar] [CrossRef]
  25. Li, Y.; Li, X. Preliminary study on heating energy consumption distribution of dwellings in hot summer and cold winter climate region of China. Indoor Built Environ. 2019, 28, 950–963. [Google Scholar] [CrossRef]
  26. Liu, H.; Lim, J.Y.; Thet, B.W.H.; Lai, P.Y.; Koh, W.S. Evaluating the impact of tree morphologies and planting densities on outdoor thermal comfort in tropical residential precincts in Singapore. Build. Environ. 2022, 221, 109268. [Google Scholar] [CrossRef]
  27. GB50352-2019; Uniform Standards for Civil Building Design. China Architecture & Building Press: Beijing, China, 2019.
  28. GB50137-2011; Urban Land Use Classification and Standard Specifications for Planned Construction Land Use. National Standards of the People’s Republic of China: Beijing, China, 2012.
  29. Wei, W.; Rhyme, H.M.; Bo, X. Delineation and spatial optimization of 15-minute living area in Wuhan based on supply and demand matching. Planner 2019, 35, 11–17. [Google Scholar]
  30. Crawley, D.B.; Lawrie, L.K.; Winkelmann, F.C.; Buhl, W.F.; Huang, Y.J.; Pedersen, C.O.; Strand, R.K.; Liesen, R.J.; Fisher, D.E.; Witte, M.J. EnergyPlus: Creating a new-generation building energy simulation program. Energy Build. 2001, 33, 319–331. [Google Scholar] [CrossRef]
  31. Roudsari, M.S.; Pak, M.; Smith, A. Ladybug: A parametric environmental plugin for grasshopper to help designers create an environmentally-conscious design. In Proceedings of the 13th International IBPSA Conference, Lyon, France, 25–30 August 2013. [Google Scholar]
  32. Witte, M.J.; Henninger, R.H.; Glazer, J.; Crawley, D.B. Testing and Validation of a New Building Energy Simulation Program. In Proceedings of the 7th IBSPA Conference, Rio de Janeiro, Brazil, 13–15 August 2001; International Building Performance Simulation Association: Rio de Janeiro, Brazil, 2001; pp. 353–359. [Google Scholar]
  33. Ibrahim, Y.; Kershaw, T.; Shepherd, P. Improvement of the Ladybug-tools microclimate workflow: A verification study. In Building Simulation and Optimization 2020; Loughborough University: Loughborough, UK, 2020. [Google Scholar]
  34. Evola, G.; Costanzo, V.; Magrì, C.; Margani, G.; Marletta, L.; Naboni, E. A novel comprehensive workflow for modelling outdoor thermal comfort and energy demand in urban canyons: Results and critical issues. Energy Build. 2020, 216, 109946. [Google Scholar] [CrossRef]
  35. Elnabawi, M.H.; Hamza, N.; Dudek, S. Use and Evaluation of the ENVI-Met Model for Two Different Urban Forms in Cairo, Egypt: Measurements and Model Simulations. In Proceedings of the 13th Conference of International Building Performance Simulation Association, Chambéry, France, 26–28 August 2013; pp. 2800–2806. [Google Scholar]
  36. Ibrahim, Y.; Kershaw, T.; Shepherd, P. A methodology For Modelling Microclimate: A Ladybug-tools and ENVI-met Verification Study. In Proceedings of the 35th PLEA Conference Sustainable Architecture and Urban Design: Planning Post Carbon Cities, A Coruña, Spain, 1–3 September 2020. [Google Scholar]
  37. Xu, M.; Hong, B.; Jiang, R.; An, L.; Zhang, T. Outdoor thermal comfort of shaded spaces in an urban park in the cold region of China. Build. Environ. 2019, 155, 408–420. [Google Scholar] [CrossRef]
  38. Natanian, J.; Auer, T. Beyond nearly zero energy urban design: A holistic microclimatic energy and environmental quality evaluation workflow. Sustain. Cities Soc. 2020, 56, 102094. [Google Scholar] [CrossRef]
  39. McNeel, R. Rhinoceros 3D. Available online: https://www.rhino3d.com/ (accessed on 20 April 2021).
  40. Rutten, D. Grasshopper3D. Available online: https://www.grasshopper3d.com/ (accessed on 20 April 2021).
  41. Soflaei, F.; Shokouhian, M.; Tabadkani, A.; Moslehi, H.; Berardi, U. A simulation-based model for courtyard housing design based on adaptive thermal comfort. J. Build. Eng. 2020, 31, 101335. [Google Scholar] [CrossRef]
  42. Ladybug. Ladybug Tool. 2012. Available online: https://www.ladybug.tools/index.html (accessed on 1 January 2012).
  43. Huang, T.; Li, J.; Xie, Y.; Niu, J.; Mak, C.M. Simultaneous environmental parameter monitoring and human subject survey regarding outdoor thermal comfort and its modelling. Build. Environ. 2017, 125, 502–514. [Google Scholar] [CrossRef]
  44. Yang, W.; Wong, N.H.; Zhang, G. A comparative analysis of human thermal conditions in outdoor urban spaces in the summer season in Singapore and Changsha, China. Int. J. Biometeorol. 2013, 57, 895–907. [Google Scholar] [CrossRef] [PubMed]
  45. Bröde, P.; Fiala, D.; Błażejczyk, K.; Holmér, I.; Jendritzky, G.; Kampmann, B.; Tinz, B.; Havenith, G. Deriving the operational procedure for the Universal Thermal Climate Index (UTCI). Int. J. Biometeorol. 2012, 56, 481–494. [Google Scholar] [CrossRef]
  46. Lam, C.; Lau, K. Effect of long-term acclimatization on summer thermal comfort in outdoor spaces: A comparative study between Melbourne and Hong Kong. Int. J. Biometeorol. 2018, 62, 1311–1324. [Google Scholar] [CrossRef]
  47. Ma, Q.; Shi, L.; Shi, J.; Liu, S.; Chen, M.; Zhang, F. Study on the Layout of Public Space in Multistory Settlements Based on Outdoor Thermal Environment in Hot-Summer and Cold-Winter Regions of China. Atmosphere 2023, 14, 1070. [Google Scholar] [CrossRef]
  48. GB50180-2018; Planning and Design Standards for Urban Residential Areas. National Standards of the People’s Republic of China: Beijing, China, 2018.
  49. JGJ286-2013; Thermal Environment Design Standard for Urban Residential Areas. National Standards of the People’s Republic of China: Beijing, China, 2013.
  50. Di Napoli, C.; Pappenberger, F.; Cloke, H.L. Assessing heat-related health risk in Europe via the Universal Thermal Climate Index (UTCI). Int. J. Biometeorol. 2018, 62, 1155–1165. [Google Scholar] [CrossRef]
Figure 1. Research framework of ideas.
Buildings 15 01615 g001
Figure 2. Distribution of typical residential blocks in Wuhan.
Buildings 15 01615 g002
Figure 3. Relationships between eight residential block form factors and outdoor thermal comfort in summer and winter and throughout the year.
Buildings 15 01615 g003
Figure 4. Outdoor thermal comfort in summer, winter, and year-round in 36 residential blocks.
Buildings 15 01615 g004
Figure 5. Relationship between outdoor thermal comfort in summer and influencing factors.
Buildings 15 01615 g005aBuildings 15 01615 g005b
Figure 6. Relationship between outdoor thermal comfort in winter and influencing factors.
Buildings 15 01615 g006
Figure 7. Changes in height-to-width ratio and outdoor thermal comfort in 16 residential blocks.
Buildings 15 01615 g007
Figure 8. Changes in form of layout and outdoor thermal comfort in 16 residential blocks.
Buildings 15 01615 g008
Figure 9. Changes in sky visibility and outdoor thermal comfort in 16 residential blocks.
Buildings 15 01615 g009
Figure 10. Changes in building orientation and outdoor thermal comfort in 16 residential blocks.
Buildings 15 01615 g010
Table 1. Table of commonly used thermal comfort index intervals.
NormThermal Sensory Temperature Range
Quite ColdColdHerbalBleakComfortsMildly WarmGenialHeat UpVery Hot
WCT (°C)<−55−54~−40−39~−28−27~−10>−10////
WBGT (°C)////<1818~2424~1828~30>30
DI (°C)////<2121~2727~2929~32>32
Humidex (°C)////20~3030~4040~4545~55>55
ET (°C)/<11~99~1717~2121~2323~27>27/
HI (°C)/////27~3232~4141~54>54
SET * (°C)///<1717~3030~3434~37>37/
PET (°C)<44~8 8~1318~2323~2929~3535~41>41
PT (°C)/−39~−26−26~−13−13~00~2020~2626~3232~28>38
PST (°C)<−36−36~−16−16~44~1414~2424~3434~4444~54>54
UTCI (°C)<−27−27~−13−13~00~99~2626~3232~3838~46>46
PMV/<−3−3~−2−2~−1−1~11~22~3>3/
COMFA (W/m2)//<−150−150~−50−50~−50−50~150>150//
Table 2. Sample of 36 residential blocks.
Type of Residential Blocks
Buildings 15 01615 i001Buildings 15 01615 i002Buildings 15 01615 i003Buildings 15 01615 i004Buildings 15 01615 i005Buildings 15 01615 i006
Buildings 15 01615 i007Buildings 15 01615 i008Buildings 15 01615 i009Buildings 15 01615 i010Buildings 15 01615 i011Buildings 15 01615 i012
Buildings 15 01615 i013Buildings 15 01615 i014Buildings 15 01615 i015Buildings 15 01615 i016Buildings 15 01615 i017Buildings 15 01615 i018
Buildings 15 01615 i019Buildings 15 01615 i020Buildings 15 01615 i021Buildings 15 01615 i022Buildings 15 01615 i023Buildings 15 01615 i024
Buildings 15 01615 i025Buildings 15 01615 i026Buildings 15 01615 i027Buildings 15 01615 i028Buildings 15 01615 i029Buildings 15 01615 i030
Buildings 15 01615 i031Buildings 15 01615 i032Buildings 15 01615 i033Buildings 15 01615 i034Buildings 15 01615 i035Buildings 15 01615 i036
Table 3. Illustration of 8 residential block form morphological indicators.
Block Impact FactorDefinitionIllustration
BD      At the parcel scale, the ratio of the base area of the building to the area of the occupied land.Buildings 15 01615 i037
FAR      The ratio of the sum of the floor area (A) to the base area (SG) within a parcel.Buildings 15 01615 i038
ABH      The overall average height of buildings in an area, calculated by weighted averaging.Buildings 15 01615 i039
ABW      The average width of the buildings in the area, obtained by weighted average calculation.Buildings 15 01615 i040
HWR      The ratio between the height and depth of a building.Buildings 15 01615 i041
BO      The orientation of the layout of a building or residential block with respect to a due north direction.Buildings 15 01615 i042
SVF      Expressed by the relationship between the visible sky area and the overall field of view area.Buildings 15 01615 i043
LF      Categorized into rows and columns, staggered rows, enclosures, and combined layouts.Buildings 15 01615 i044
Table 5. UTCI comfort level classification.
UTCI(°C)Thermal StressUTCI(°C)Thermal Stress
>+46Extreme thermal stress>0~9Microcold stress
+38~+46Very strong thermal stress>−13~0Moderate cold stress
+32~+38Intense thermal stress>−27~−13Intense cold stress
+26~+32Moderate thermal stress>−40~−27Very strong cold stress
+9~+26No thermal stress<−40Extreme cold stress
Table 6. The p-value of linear regression relationship between morphological parameters and outdoor thermal comfort in summer and winter months.
Influencing Factor SummerWinter
FARp-value0.000.00
R20.120.63
BDp-value0.010.01
R20.180.19
ABHp-value0.020.03
R2−0.50−0.69
BOp-value0.080.03
R20.82−0.21
HWRp-value0.000.00
R20.251.80
SFp-value0.050.02
R2−0.210.06
ABWp-value0.000.07
R20.12−0.26
SVFp-value0.050.02
R20.22−0.30
Table 7. Orthogonal experimental design factors and levels.
NumberHWRSFSVFBO
A10.7Determinant0.30−15°
A20.7Staggered layout0.40−15°
A30.7Encircling0.50−15°
A40.7Combinatorial0.60−15°
B11Determinant0.300
B21Staggered layout0.400
B31Encircling0.500
B41Combinatorial0.600
C11.3Determinant0.3015°
C21.3Staggered layout0.4015°
C31.3Encircling0.5015°
C41.3Combinatorial0.6015°
D11.6Determinant0.3030°
D21.6Staggered layout0.4030°
D31.6Encircling0.5030°
D41.6Combinatorial0.6030°
Table 8. Orthogonal experimental design of residential block models.
Residential Block Models
Buildings 15 01615 i045Buildings 15 01615 i046Buildings 15 01615 i047Buildings 15 01615 i048
A1A2A3A4
Buildings 15 01615 i049Buildings 15 01615 i050Buildings 15 01615 i051Buildings 15 01615 i052
B1B2B3B4
Buildings 15 01615 i053Buildings 15 01615 i054Buildings 15 01615 i055Buildings 15 01615 i056
C1C2C3C4
Buildings 15 01615 i057Buildings 15 01615 i058Buildings 15 01615 i059Buildings 15 01615 i060
D1D2D3D4
Disclaimer/Publisher’s Note: The statements, opinions and data contained in all publications are solely those of the individual author(s) and contributor(s) and not of MDPI and/or the editor(s). MDPI and/or the editor(s) disclaim responsibility for any injury to people or property resulting from any ideas, methods, instructions or products referred to in the content.

