Article

Coupling Analysis of “Demand–Satisfaction” for Rural Public Service Facilities Based on the Kano Model with Importance–Performance Analysis: A Case Study of Gaoqing County, Zibo City

1
School of Human Settlement and Civil Engineering, Xi’an Jiaotong University, Xi’an 710049, China
2
School of Humanities and Social Science, Xi’an Jiaotong University, Xi’an 710049, China
*
Author to whom correspondence should be addressed.
Buildings 2025, 15(10), 1614; https://doi.org/10.3390/buildings15101614
Submission received: 5 April 2025 / Revised: 4 May 2025 / Accepted: 7 May 2025 / Published: 10 May 2025

Abstract

:
In the context of people-oriented and high-quality development, improving the quality of rural public service facilities is an important way to promote rural revitalization. However, at present, there are problems such as imbalanced resource allocation, single service functions, and low service quality in regard to rural public service facilities in general, and the contradiction between supply and demand is becoming increasingly prominent. Only by effectively grasping the correlation between residents’ needs and their satisfaction with such facilities can the precise allocation of service facilities be carried out. In this study, Gaoqing County, Zibo City, Shandong Province, is selected as the empirical case. By applying the Kano model and Importance–Performance Analysis (IPA) through the use of questionnaire surveys and expert interviews, we develop an integrated “demand–satisfaction” analytical framework to propose targeted optimization strategies for rural public service facilities. Based on the Kano model, the essential, desired, and attractive needs of rural residents for various types of facilities were identified. Combining the IPA model, the coupling and coordination relationship between demand and satisfaction was further analyzed, and rural public service facilities were analyzed and categorized accordingly. The research results show that educational institution facilities, healthcare facilities, and market facilities have the highest demand, while cultural, sports, and technological facilities have relatively low demand. Based on the analysis results, this study proposes an optimization strategy for the classification and grading of the “demand–satisfaction” coupling relationship of public service facilities. It provides a scientific basis for the layout optimization of rural public service facilities, and also provides an effective reference for the sustainable development and service quality improvement and upgrading of rural areas.

1. Introduction

1.1. Research Background

In 2017, China proposed a rural revitalization strategy for the first time, as a major task in the great rejuvenation of the Chinese nation. In the context of contemporary construction trends in both urban and rural areas, there is an increasing emphasis on “people-oriented” and “high-quality development” requirements. Achieving a convenient and precise configuration of service systems is not only a current focal point of research on rural planning in China, but also serves as a critical starting point for achieving rural revitalization. In recent years, China has proposed a series of important strategic guidelines that can be used to guide the construction of rural public service facilities. In this context, it is necessary to further establish a method that starts with the characteristics of villagers’ facility use, explores the relationship between villagers’ facility demands, satisfaction, and their priorities in terms of facility construction and renovation, so as to achieve the optimal allocation of service facilities. Although some progress has been made in promoting rural development, the problem of insufficient rural public services remains prominent, which are unable to meet the needs of rural modernization and restrict further rural development.
Currently, due to the top-down decision-making mechanism for the provision of rural public services in China [1], the supply and demand ends of public service facilities are not well-connected, resulting in information asymmetry between the demand and supply sides. The supply side cannot truly and accurately determine the demand preferences of rural residents, resulting in a deviation between supply and demand, low supply efficiency, and an imbalance between supply and demand. In this context, it is vital to establish a method that starts with how villagers use facilities. This method should be used to explore their demands, satisfaction level, and the priorities in terms of the construction and renewal of facilities. The aim is to achieve the best allocation of service facilities. Therefore, this study analyses the coupling and coordination relationship between demand for and satisfaction with public service facilities, using the Kano–IPA model. Based on the constructed evaluation model, a typological analysis of rural public service facilities is carried out and specific optimization strategies for different types of facilities are proposed. This study can provide a scientific basis for the optimization of rural public service facilities in China and can also provide an effective reference for the sustainable development and service quality improvement and upgrading of rural areas.

1.2. Literature Review

The research related to this article can be divided into three topics: the demand characteristics of public service facilities, public service facility satisfaction surveys, and public service facility configuration strategies.

1.2.1. Research on the Demand Characteristics of Public Service Facilities

In terms of demand characteristics, earlier studies are mostly based on objective data analysis and rational judgments made by planners. Zhou et al. [2] took Guangzhou as an example, selected communities with different characteristics in terms of population density and living patterns to conduct empirical surveys, and collected data on residents’ demands for public service facilities in regard to three aspects: travel distance, facility type, and usage evaluation. He et al. [3] obtained weight values for various elderly care-related facilities based on field work and questionnaire surveys, Kano model analysis, the use of the entropy method and the analytic hierarchy process, on the basis of the existing types of public service facilities in cities, and used these weight values to reflect the degree of demand for corresponding facilities among the residents. Wan et al. [4] analyzed the willingness to demand different types of public service facilities from the perspective of group characteristics, such as gender, age, income, education level, and location of the villagers. Zeng et al. [5] proposed the characteristics of changes in the needs of “people” in the context of rural contraction and, on this basis, the characteristics of the demand for public services in regard to the living circles of rural communities at all levels and of all types. Conducting surveys on the characteristics of public service facility demands based on users’ subjective preferences has gradually gained attention from scholars. Wei et al. [6] focused on the demand preferences of different groups, such as children, women, and the elderly, including demographic factors, such as socioeconomic status and ethnicity, in order to explore the demand characteristics of different groups for public service facilities. Gao et al. [7] proposed a framework for functional types of menu-style facilities, based on a database of rural characteristics, which included “basic items + characteristic items”, in order to address the diverse characteristics of rural areas and the needs of villagers. Li et al. [8] used on-site surveys, discussions, and exchanges to investigate the facility needs of rural residents and, on this basis, identified the main factors affecting the construction and management of facilities, concluding that the demand for public service facilities is mainly focused on the convenience and service quality of the facilities. Wang et al. [9] summarized the demand characteristics of villagers in regard to two aspects: the utilization characteristics of facilities at the “village–township–county” levels and the configuration strategies for village facilities.

1.2.2. Research on Satisfaction with Public Service Facilities

In terms of residents’ satisfaction, many scholars have identified the key factors affecting satisfaction with public service facilities and have established a satisfaction evaluation system. Some studies use traditional questionnaires as their research method. Qiu et al. [10] distinguished between rural and non-rural facilities and used the Kano model to assess residents’ hypothetical satisfaction with the provision or lack of facilities. Metwally et al. [11] used stratified sampling to select respondents in order to obtain data on residents’ satisfaction with major urban services in Sharm el-Sheikh, as well as used stratified sampling to select respondents and a Likert scale questionnaire with a combination of closed and open-ended questions to obtain additional feedback. Hong et al. [12] verified that the layout of facility locations, the quantity of supply, and the quality of services have a significant positive impact on residents’ satisfaction through the intermediary effect of residents’ perceptions in terms of safety, convenience, comfort, and aesthetics. Some studies use new technology applications as their research methods. Shen et al. [13] used GIS software to analyze the construction of public service facilities and a questionnaire survey to collect data on the satisfaction of local residents and workers with public services. In addition, some scholars have used social media to investigate residents’ satisfaction. Li et al. [14] employed social media data sets to quantify public satisfaction via the long short-term memory model. Huai et al. [15] used social media data from Ctrip and Dianping and survey data from a local government agency with park visits statistics and park satisfaction surveys to understand the public’s visitation behavior and satisfaction in regard to such parks. Shan et al. [16] collected Weibo user text data, used the Tencent Cloud NLP sentiment analysis module to measure sentiment probability, and translated these data into a resident sentiment value to reflect the degree of positivity or negativity in the sentiment.

1.2.3. Research on the Configuration Strategies for Public Service Facilities

In terms of configuration strategies for public service facilities, the typical research method used focuses on the specific spatial layout of the facilities, often with the help of a GIS model and other tools to study the optimization of the spatial layout of the facilities. Abdelghany et al. [17] proposed a modeling framework for planning spatially distributed public service facilities, which helps to determine the location and capacity of public facilities in different situations, including in regard to urban planning, architectural design, and special events. Su et al. [18] studied the layout optimization of public sports service facilities for the elderly by establishing a geographical database and, based on the research results, proposed policy directions and measures to improve the current planning and supply system in Seoul. Chen [19] introduced node centrality measures, such as intermediacy in regard to the spatial syntax and social network analysis, into the analysis method in order to consider people’s potential activity paths and mobility at the community scale to assist in the planning of public service facility layouts. Barbara et al. [20] explored the theme of the 15 min city through the use of a GIS-based model to obtain data on the accessibility of community facilities for pedestrians and used the findings to guide the layout and renewal of facilities. Setyono et al. [21] used a grid/pixel method to measure the service supply capacity of primary schools in Malang City to guide the construction and renewal of educational facilities. In addition, there are also studies focusing on the level of the local economy, supply and demand, and satisfaction surveys to clarify the impact of relevant factors on the level of construction of public service facilities, and this is also an important research trend. Cho et al. [22] explored the impact of population mobility and geospatial mobility on public service facilities from a human–land relationship perspective and proposed optimization strategies. Yang et al. [23] proposed an optimization strategy for public service facilities in regard to a community living circle, based on the characteristics of the correlation between the service levels of various facilities and residents’ satisfaction and the potential influencing factors. Hu et al. [24] used Nanjing as an example, to analyze the supply characteristics of public service facilities in Nanjing’s communities from the perspectives of full-cycle, whole-area spatial governance and multi-scenario risk governance, in order to address the practical problems of community development. Xiang et al. [25] proposed the direction of optimization of the whole life cycle public service facility supply system from the perspective of improving the effectiveness of top-down vertical implementation and perfecting the bottom-up coordinated feedback path, providing new ideas and methods for solving the dilemmas faced when implementing public service facilities.
In summary, there have been many rich studies conducted both domestically and abroad on the demand for and satisfaction with public service facilities. The main research methods used are questionnaires, evaluation scales, and interviews, as well as the application of some new technologies, such as big data and GPS. For the study of facility demand characteristics and user satisfaction, it has been found that group characteristics, facility quality, facility cost, and spatial layout, etc., all affect residents’ attitudes towards public service facilities. However, existing surveys are mostly based on objective data analysis and rational judgments made by planners. There is insufficient data from subjective willingness surveys of villagers, and current research has not gone far enough in terms of how to quantify the demand for facilities and combine residents’ satisfaction to comprehensively determine the “demand–satisfaction” coupling relationship of various types of facilities. In studies related to the renewal of public service facilities, scholars have identified the impact of relevant factors on the construction level of public service facilities by studying influencing factors such as the local economic level, supply and demand, and user satisfaction. However, before proposing renewal strategies, the existing studies do not classify and grade facilities in a detailed and sufficient manner, resulting in insufficient practicality and implementation of the strategies.
This paper addresses the current situation in regard to the existing research, where the subjective willingness of villagers is not adequately investigated and quantified. The Kano–IPA model is used to analyze the coupling and coordination between the demand for public service facilities and user satisfaction. To address the current situation wherein the classification and grading of facilities is not detailed and sufficient, the classification and grading of rural public service facilities is carried out based on the constructed evaluation model, and a list of configuration priorities for rural public service facilities is provided. Specific optimization strategies are proposed, according to different types of facilities and construction priorities, which can provide effective references for the sustainable development and service quality improvement and upgrading of rural areas.

2. Methods

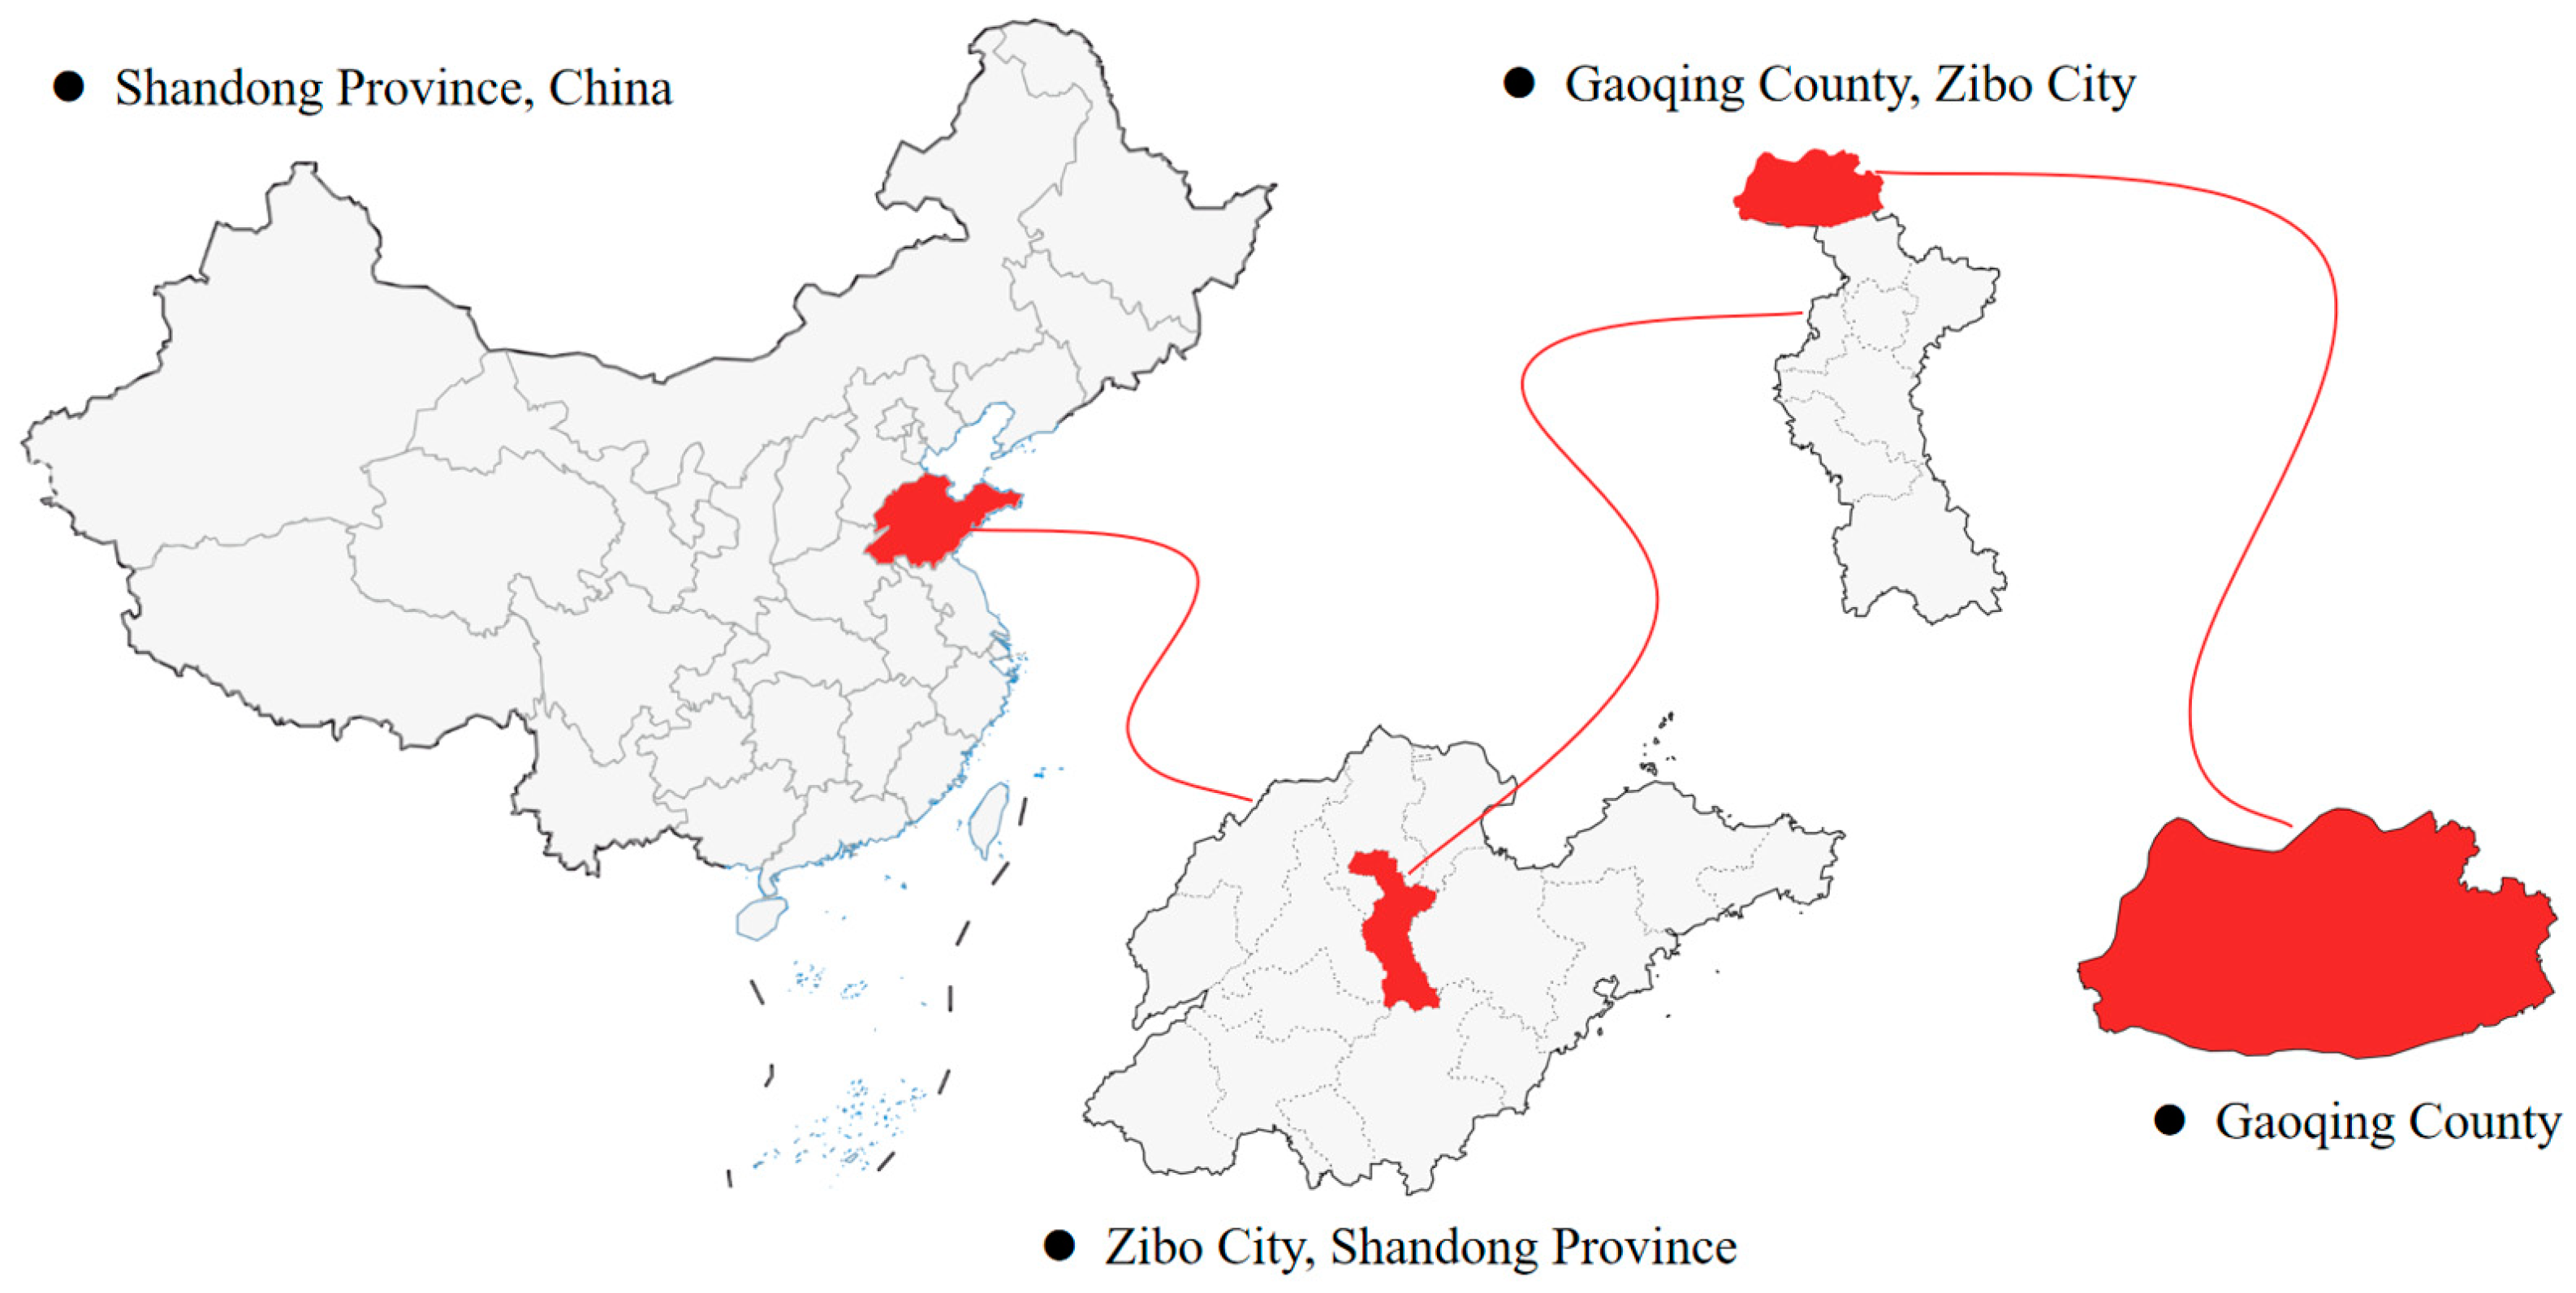
2.1. Research Object
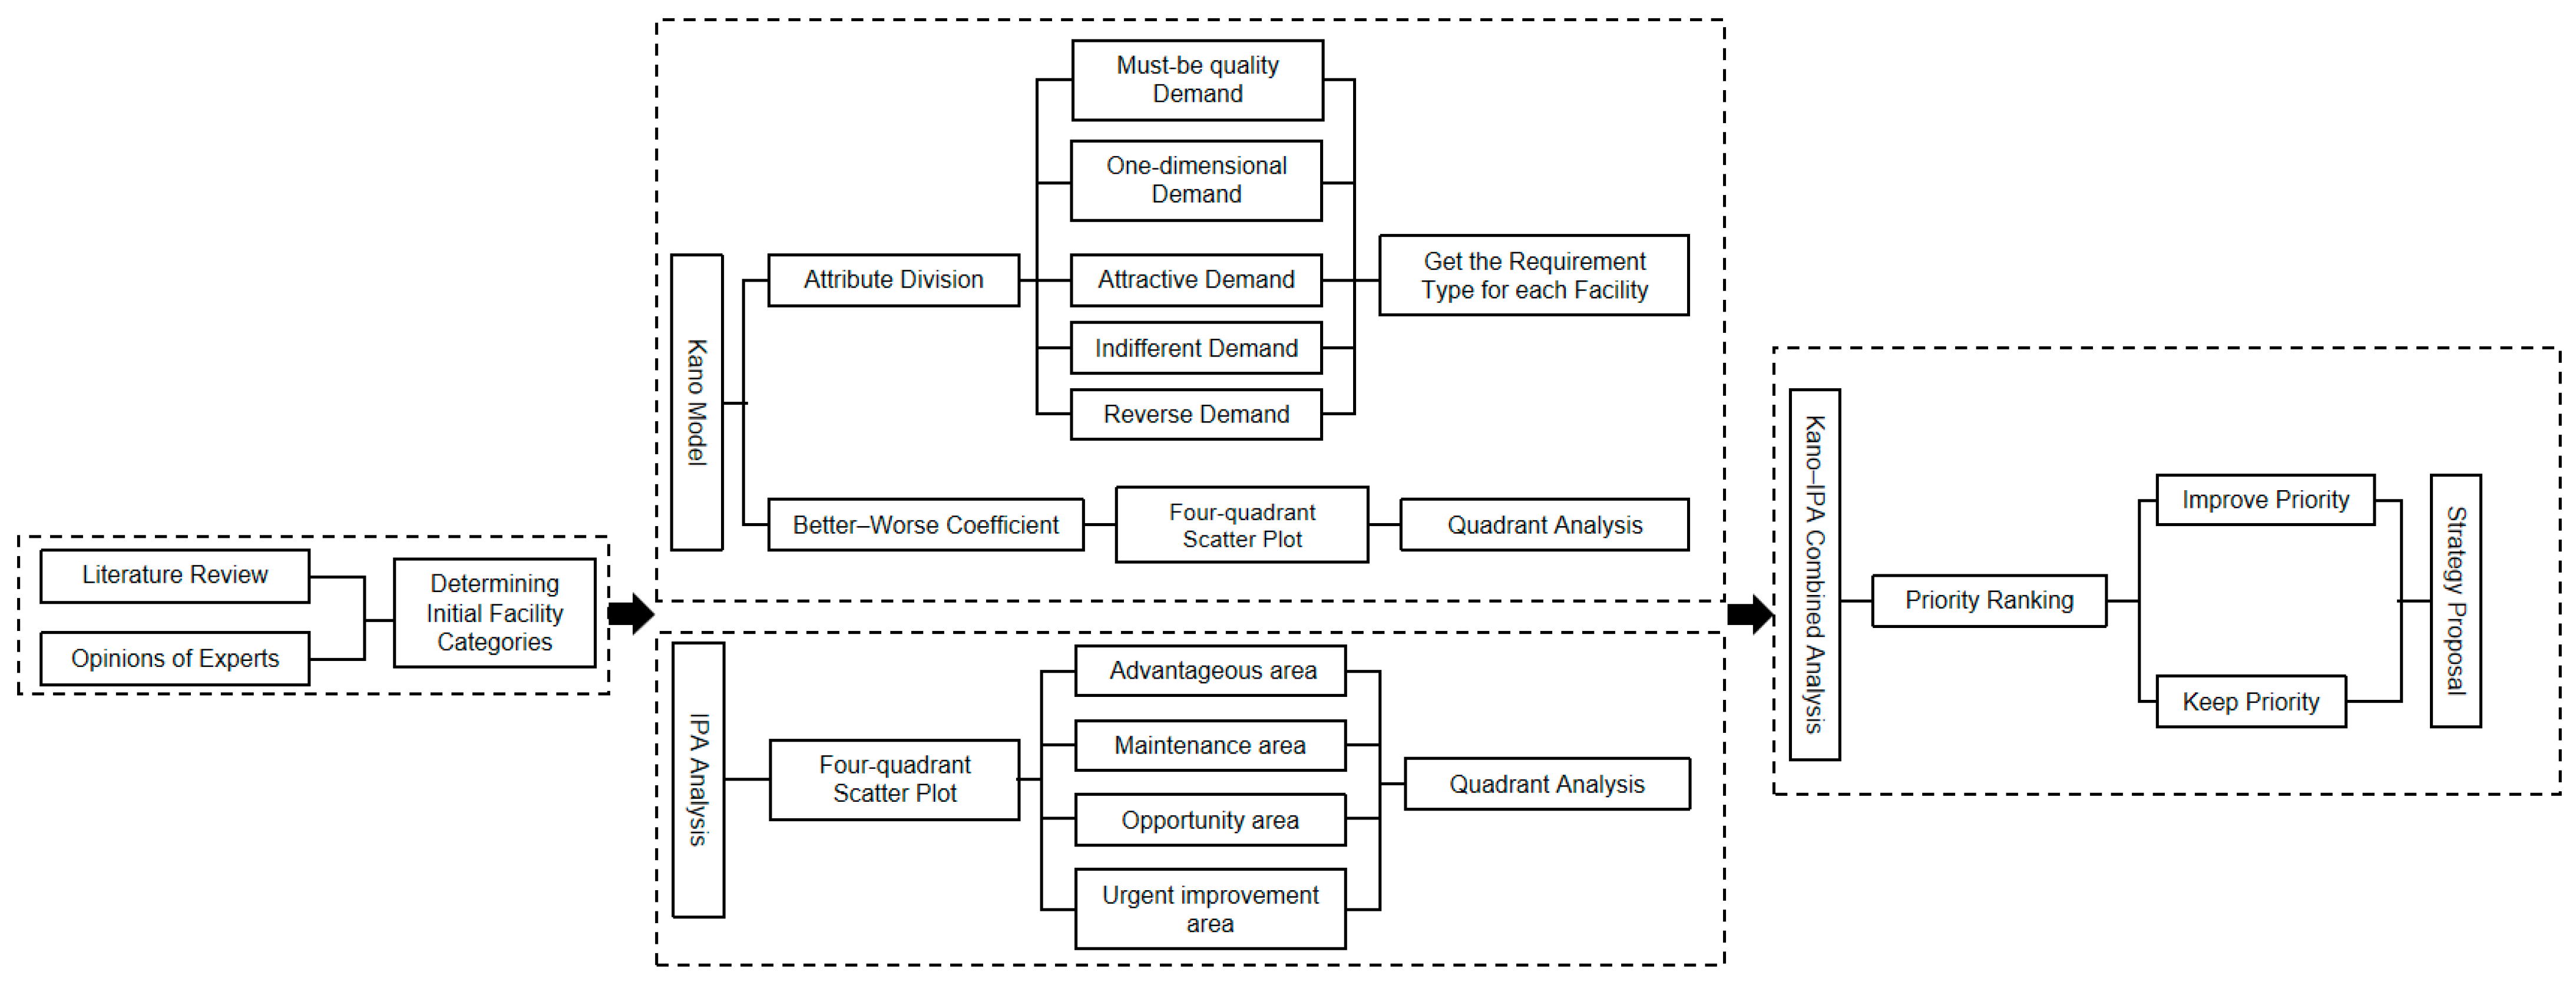
This study takes Gaoqing County, Zibo City, Shandong Province (Figure 1) as the research object and focuses on the rural public service facilities in the area. According to the relevant information, it is known that Gaoqing County has a topography typical of northern Shandong Province, with a relatively flat terrain and villages distributed relatively evenly, showing the relevant development characteristics along roads and rivers. The current distribution of villages in Gaoqing County reflects the traditional characteristics of the northern plain area, with its extensive agricultural land, scattered settlements, and relatively concentrated town and village centers, which are common in Shandong Province and the northern plain area. As the county’s topography and the distribution of towns and villages are typical of the region, the research results in this paper are of certain reference value for the study of the demand for rural public service facilities in Shandong Province and, even, in the North China Plain region.
Gaoqing County has a total of 7 towns and 309 administrative villages. The total area is 831 square kilometers. The rural registered population in Gaoqing County is 241,200, and the permanent rural population is 207,800. The terrain is relatively flat, and the villages are evenly distributed.

2.2. Methodology

The research route used in this study is shown in Figure 2.

2.2.1. Research on the Type of Demand for Rural Public Service Facilities

(1)
Primary screening of the demand for rural public service facilities
Based on existing research [26,27,28,29], it can be seen that the demand for facilities among the rural population mainly relates to social infrastructure for the public, such as education, medical care, culture, sports, and commerce facilities. This study refers to the “Rural Public Service Facilities Planning Standards” (CECS 354: 2013) [30] and the classification of public service facilities in rural areas on Baidu Maps and AutoNavi Maps, combined with resident interviews and consultations with experts from universities. The research was finally carried out on the 7 major categories of public service facilities, namely administrative facilities; educational institution facilities; cultural, sports, and technological facilities; healthcare facilities; welfare facilities; commerce financial facilities; and market facilities, and 51 facility factors (Appendix A), which basically cover the daily lives of rural people.
(2)
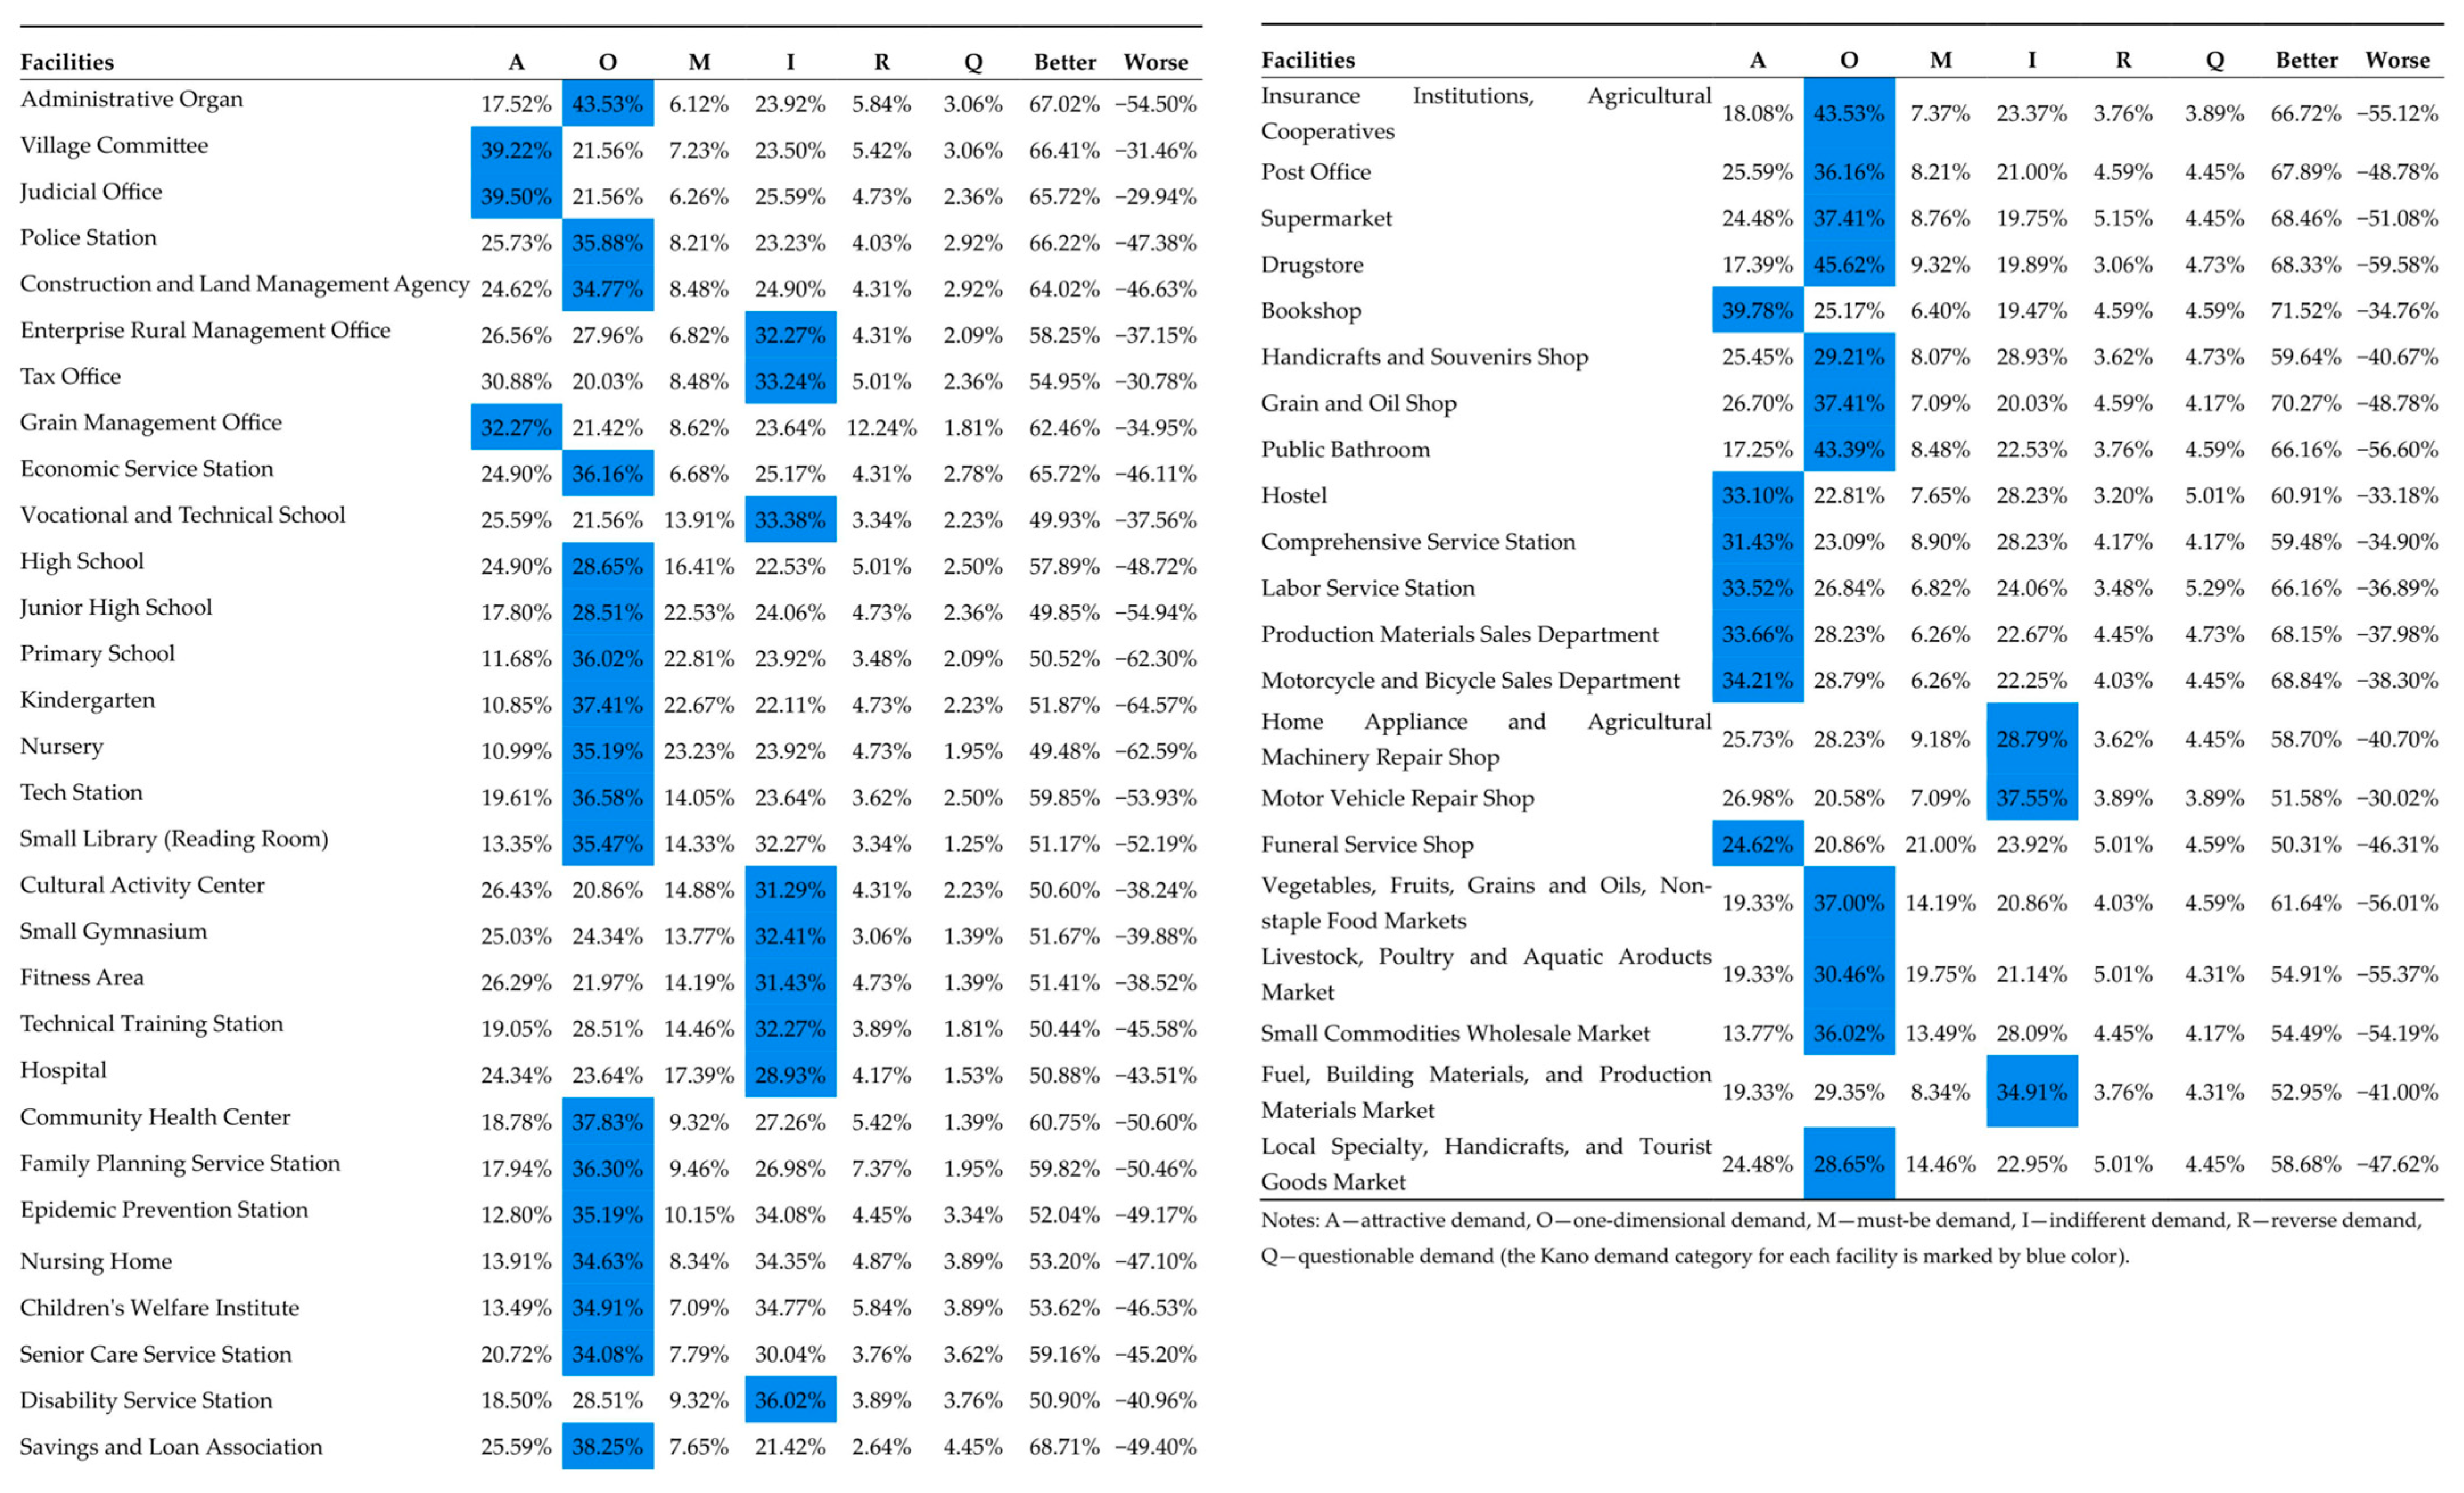
Secondary screening of rural public service facilities based on the Kano model
a.
Kano questionnaire survey
In order to understand the demands and satisfaction levels of rural residents regarding various facilities, the research team randomly distributed 887 copies of the “Public Service Facilities Demand and Satisfaction Survey Questionnaire” in townships and villages across Gaoqing County from July to September 2024, with 719 valid questionnaires completed, equating to a validity rate of 81%. The questionnaire distribution area covered most townships and villages within Gaoqing County, effectively reflecting the facility demand and satisfaction levels within the study area. Among the valid questionnaires received, there were 398 male respondents and 321 female respondents; 8 respondents were aged 0–14, 160 were aged 15–20, 278 were aged 21–30, 144 were aged 31–40, 95 were aged 41–50, 22 were aged 51–60, and 12 were aged 60 or older; 31 respondents have an average monthly household income of less than CNY 1500, 161 respondents have an average monthly household income of CNY 1500–4000, 403 respondents have an average monthly household income of CNY 4001–6000, 89 respondents have an average monthly household income of CNY 6001–10,000, and 35 respondents have an average monthly household income of over CNY 10,000.
The Kano model uses questions that are divided into positive and negative aspects to study the degree of demand for a project. It divides demand into must-be, one-dimensional, attractive, indifferent, and reverse demand [31]. The Kano model can, to some extent, avoid the influence of the degree of completion of public service facilities in the living environment of the respondents on the results of the questionnaire, effectively improving the reliability and validity of the survey results. This paper designs a questionnaire to assess the demand for rural public service facilities based on the Kano model. A total of 51 rural public service facilities that passed the first-level screening are used in the questions in the questionnaire. In order to obtain data on the attitude of rural residents towards each facility, a question needs to be asked about each facility from both a positive and a negative perspective, namely “how do you feel when this facility provides its service” and “how do you feel when this facility is missing”. There are five response options for each of the positive and negative questions for each facility (Appendix B). Each question has 5 × 5 possible answer combinations, each of which corresponds to a Kano category. According to the demand relationship of the combinations, a Kano demands evaluation form can be designed (Appendix C). Among them, M is a must-be demand, O is a one-dimensional demand, A is an attractive demand, I is an indifferent demand, R is a reverse demand, and Q is a questionable demand (Q is a demand that rural residents have doubts about or are not clear about).
b.
Kano demands determination and facility screening
According to the Kano demands evaluation form (Appendix C), the demand for each of the 51 facilities was counted for each rural resident. Then, the total number for each Kano demand category for each facility among all the rural residents was counted, and the category with the largest number was taken as the final Kano category to which the facility belongs (Appendix D). It can be seen from this process that the degree of demand for each facility is different in the minds of different residents. It is also found that most facilities have a low level of questionable and reverse demand, indicating that during the survey process rural residents had a good understanding of the questions and did not have too many doubts or face expressions that were unclear. The statistical results show that a total of 12 facilities were classified as indifferent demand; no items were classified as reverse demand or questionable demand. The indifferent demand category indicates that rural residents do not care about this type of facility in their daily lives at this stage, and they do not have a high demand for them. Therefore, this type of facility is eliminated; the screened facilities are presented in Appendix E.
c.
Importance calculation for the facility types after secondary screening
This paper identifies the importance of the facility types based on the Kano survey results. First, importance is divided into five levels and digitized with reference to the 5-point Likert scale (1 is very unimportant, 2 is not very important, 3 is average, 4 is relatively important, 5 is very important). Second, with reference to the Kano questionnaire and the needs evaluation table, the importance identification table (Table 1) is redesigned to determine the answers to the positive and negative questions. Finally, the importance scores from 912 respondents for 39 facilities (after secondary screening) were identified, and the importance scores for each facility were counted and averaged to calculate the average value, which reflects the degree of demand for the corresponding facility type.

2.2.2. Research on Satisfaction with the Service Quality of Rural Public Service Facilities

This paper statistically analyzes the satisfaction scores for each facility after secondary screening, based on the results of the satisfaction questionnaire (Appendix F), and calculates the average value. The average satisfaction value is used to reflect the users’ satisfaction with the service provided by the corresponding facility.

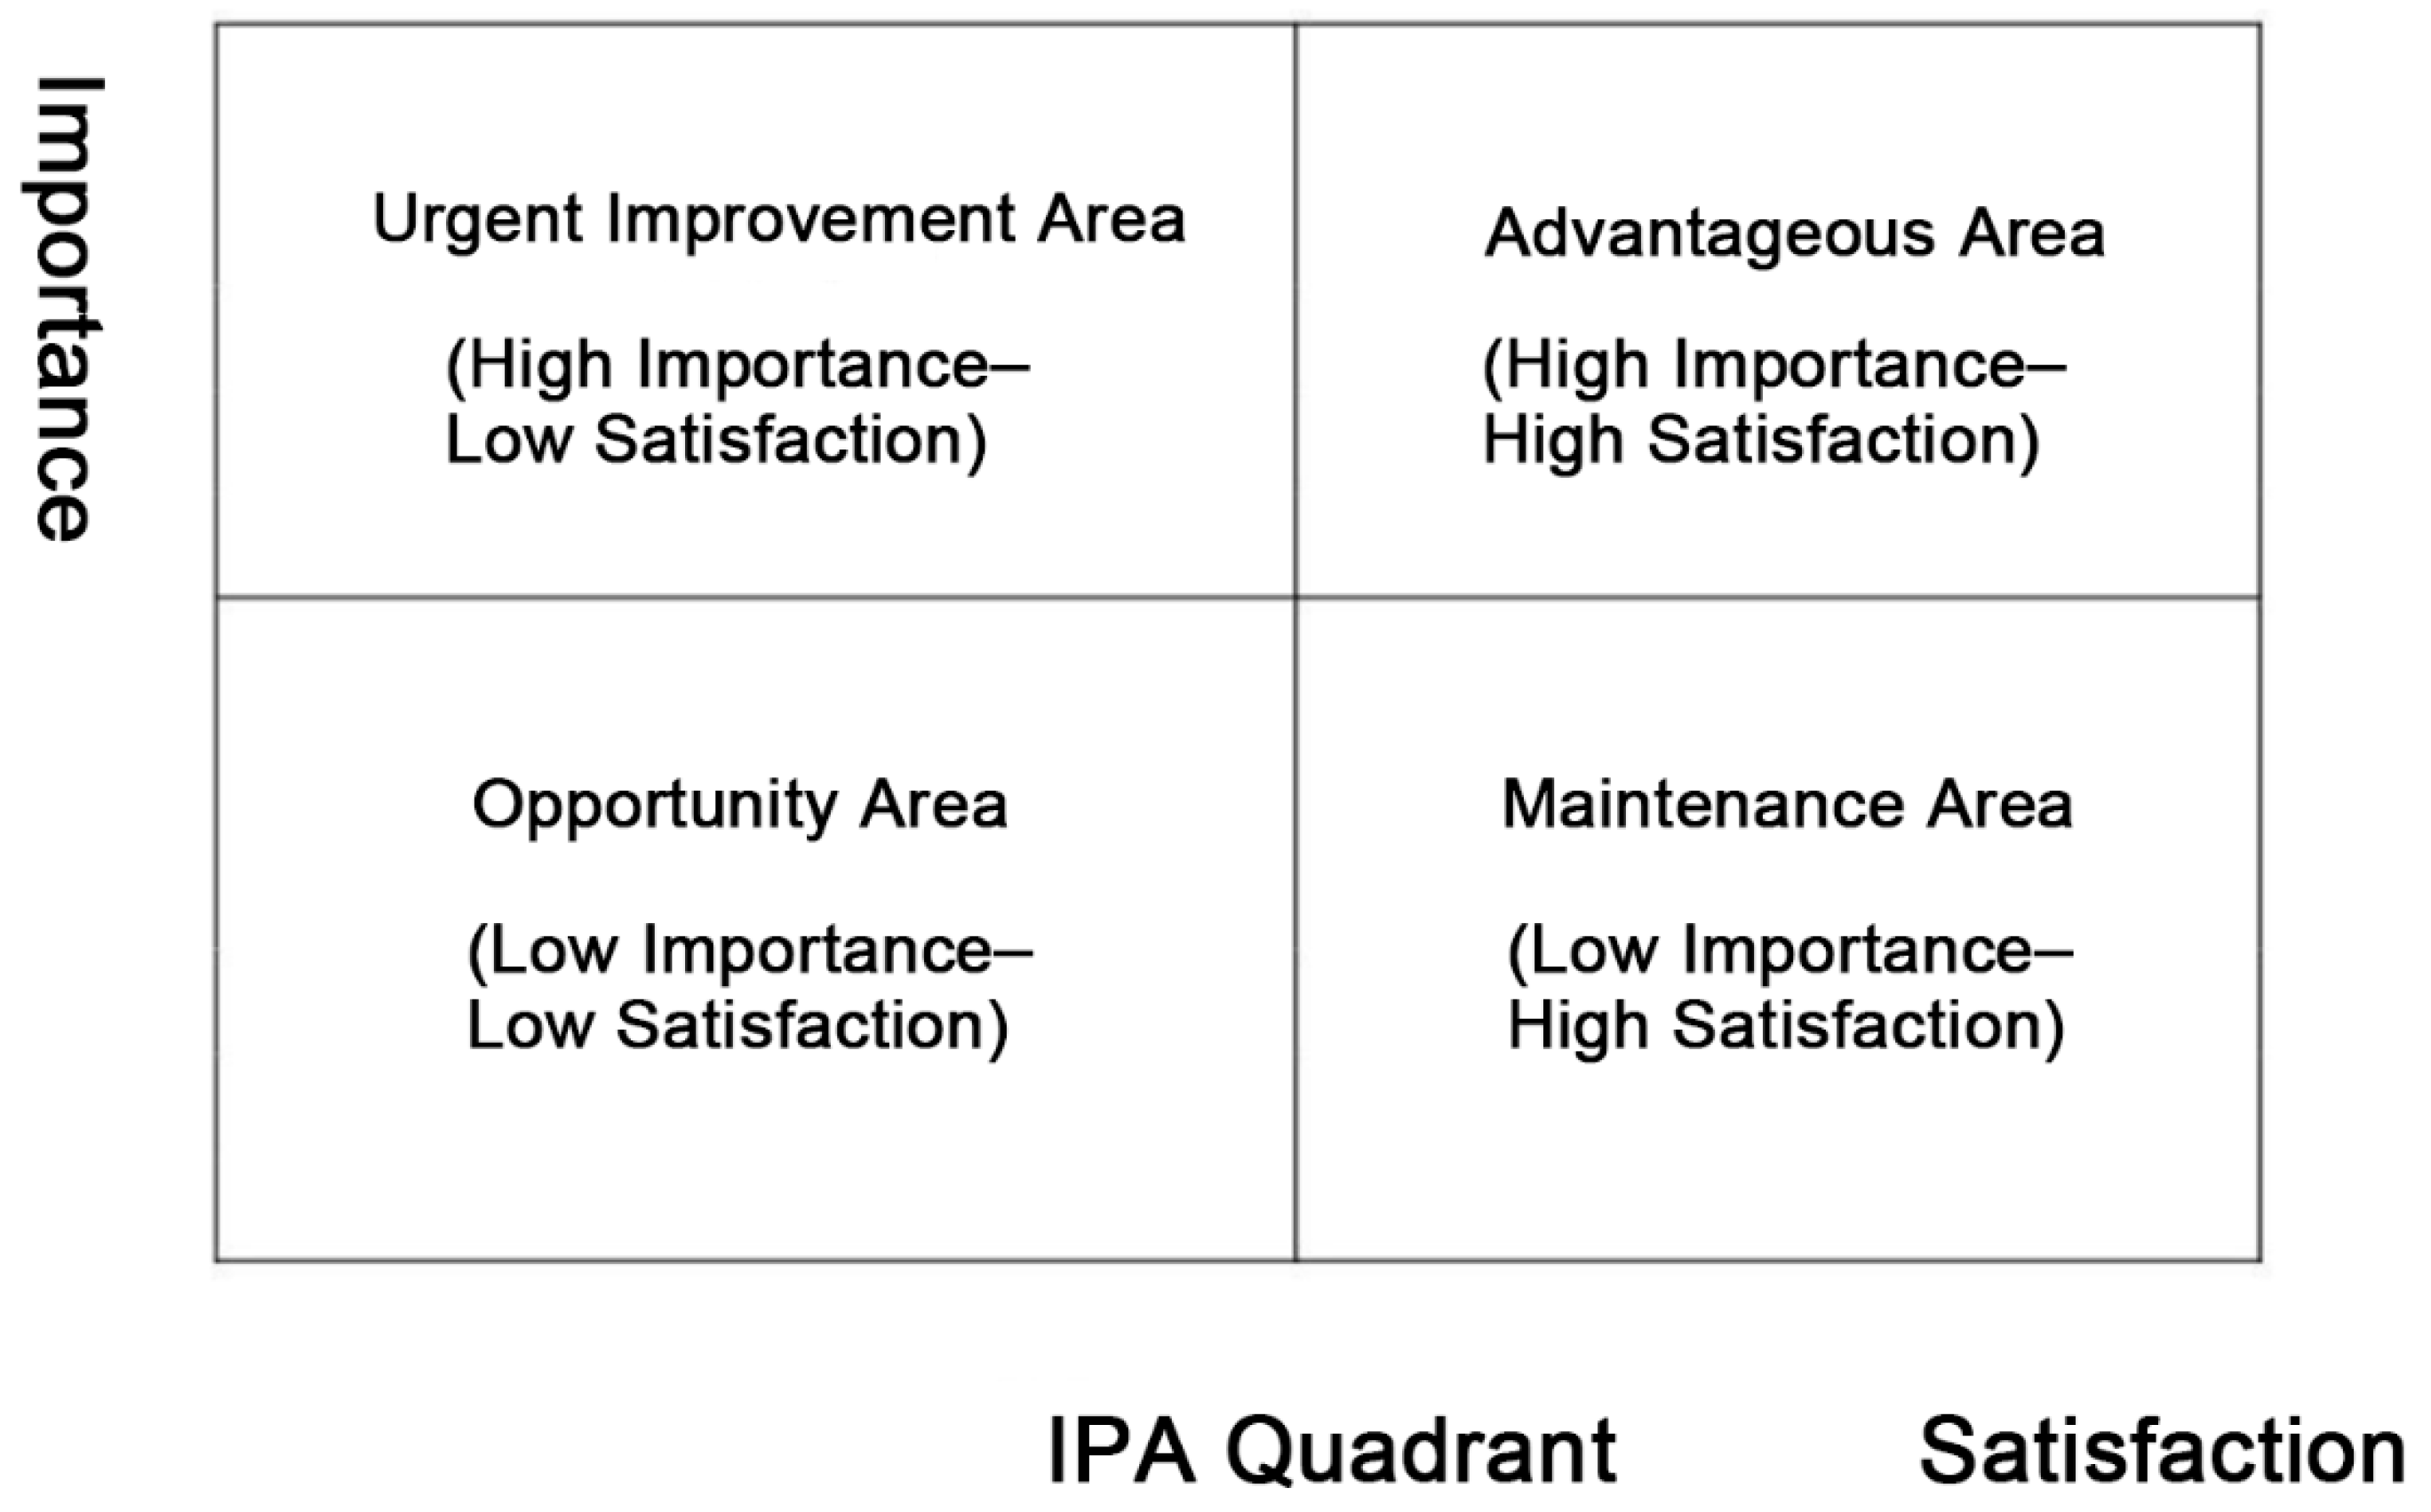
2.2.3. Importance–Performance Analysis (IPA) of the Coupling Relationship Between “Demand and Satisfaction” with Rural Public Service Facilities

Importance–Performance Analysis (IPA) guides decision making by measuring and evaluating two dimensions: importance (I), which measures the level of consumer expectation for a particular indicator; and effectiveness or satisfaction (P), which measures the actual performance of the indicator or the consumers’ actual feelings. As a simple but effective research method, IPA prioritizes service quality improvements by comparing the difference between the importance of each indicator and its actual performance, thereby optimizing the allocation of limited resources. It is highly scientific, reasonable, and practical. This paper uses IPA to explore the optimization of rural public service facilities. Using importance as the vertical axis, satisfaction as the horizontal axis, and the intersection of the mean of these two aspects as the origin, the analysis results are divided into four quadrants (Figure 3).
This study obtained verbal informed consent from all the participants, with no written consent required in order to maintain the anonymity of the participants. As a non-interventional social study, this research involved only non-sensitive demographic data, and did not collect medical, financial, or other private information. In accordance with Article 32 of the Ethical Review of Life Science and Medical Research Involving Human Beings (National Health Commission Order No. 4 [2023]), this study qualifies for an exemption from ethical review [32].

3. Results

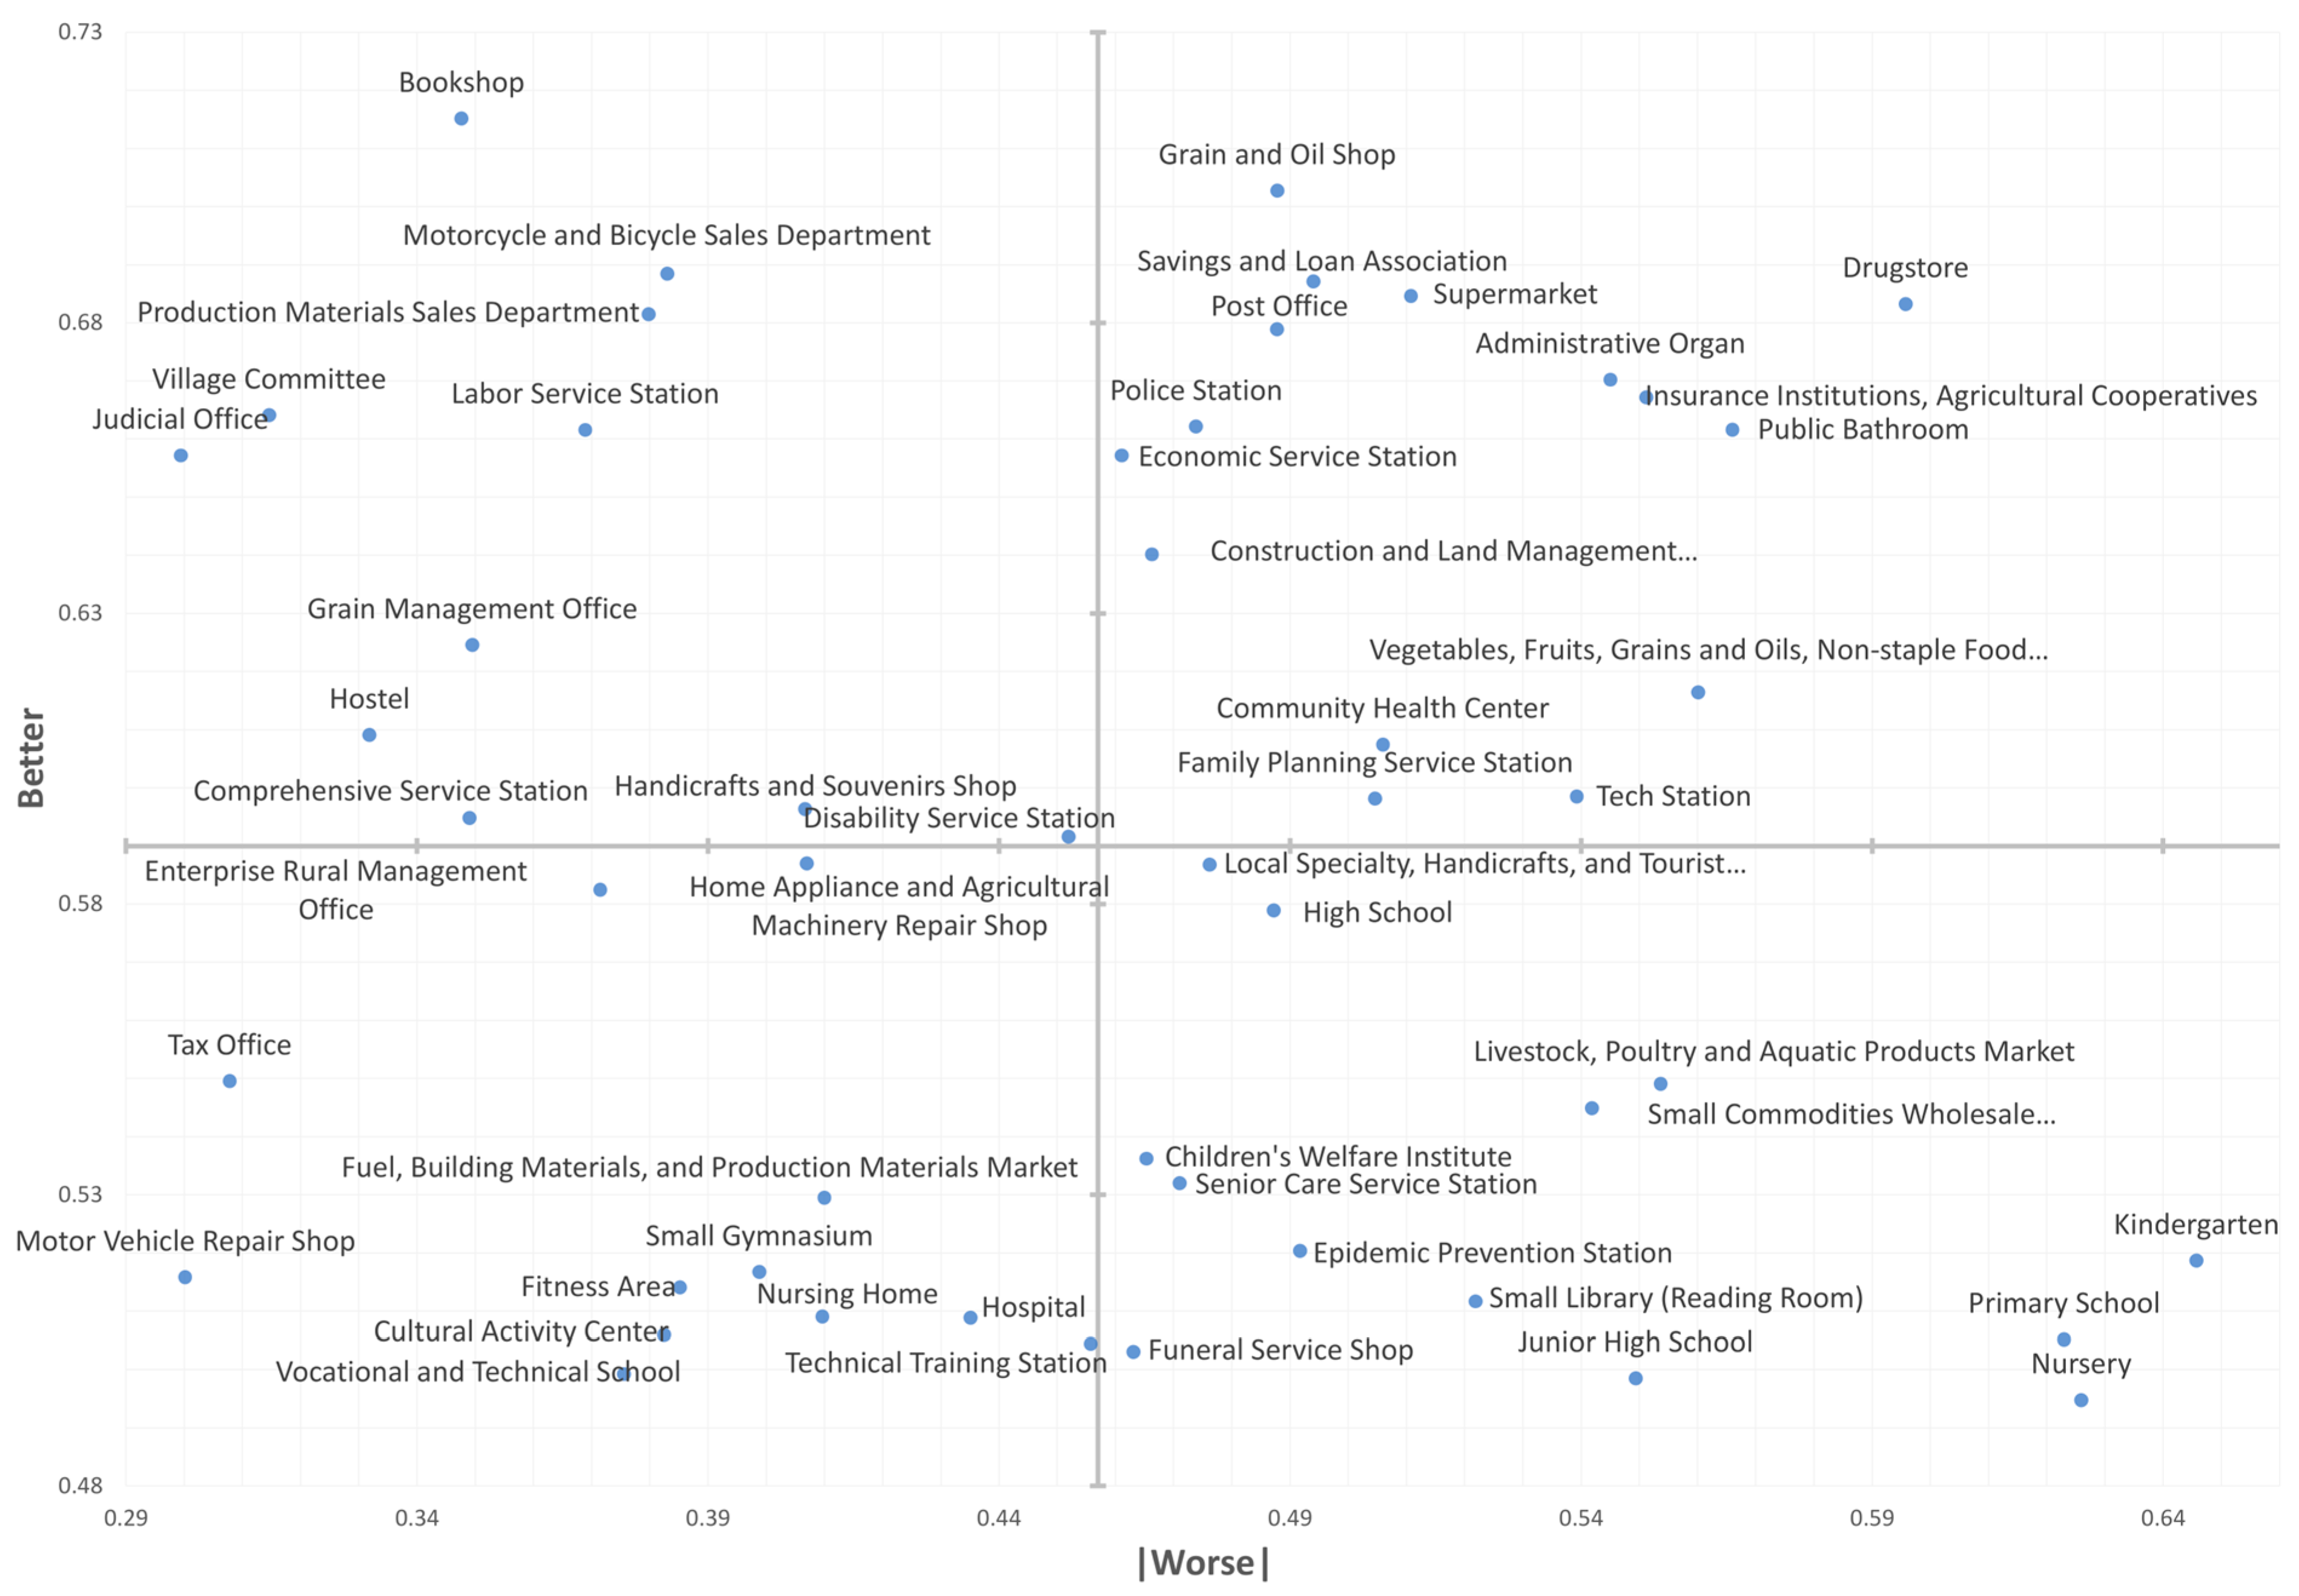
3.1. Differences in Demand for Different Types of Rural Public Service Facilities

This study plots a better–worse coefficient chart (Figure 4), based on the better and worse values for each facility detailed in Appendix D. The abscissa of the better–worse coefficient chart is the absolute value of the worse values and the ordinate is the absolute value of the better values, which can be used to visually display the attributes of all the facilities. The first quadrant represents one-dimensional demand. Most items corresponding to healthcare, welfare, and market facilities are located in this quadrant, as are some items corresponding to commercial and financial facilities. This indicates that rural residents want to enjoy the services provided by the corresponding facilities in their daily lives, portray a high level of demand for them, and place a high priority on their construction and renewal. The second quadrant represents attractive demand. Some items corresponding to commercial and financial facilities are located in this quadrant, indicating that these types of facilities can improve the quality of life of rural residents, are in medium demand, and the priority in terms of construction and renewal is medium. The third quadrant represents indifferent demand, and most of the projects involving cultural, sports, and technology facilities are located in this quadrant, which indicates that in regard to the current rural development situation, residents do not care about this type of facility in terms of their daily lives and do not portray a high demand for them. The priority in terms of construction and renewal is the lowest for this quadrant. The fourth quadrant represents must-be demand, and most of the projects involving educational institution facilities are located in this quadrant, which indicates that rural residents cannot do without this type of facility in their daily lives and there is very high demand for them. In terms of the facility provision priorities, the general order is must-be demand > one-dimensional demand > attractive demand > indifferent demand.
It can be concluded that there are significant differences in the demand for different types of facilities among rural residents. Therefore, guiding principles for classified planning should be adopted for different types of facilities, so that resources can be used more effectively, and the construction and renewal of facilities can be guided efficiently. For example, most educational institution facilities, such as kindergartens and primary schools, are categorized as must-be demand, which indicates that rural residents believe that the demand for such facilities should be met as a matter of course, so they are classified as basic guaranteed facilities. A breakdown of the demand for facilities by rural residents of different ages also shows that the demand for educational institution facilities ranks among the highest. This shows that both the school-age population and their parents, as well as grandparents who are the main carers of children left behind in rural areas, want to ensure the supply of basic public educational services. However, in the face of the current trends in the size and structure of the rural population, there is already a structural imbalance in the supply of public educational services in rural areas. With the declining birth rate and the continuous outflow of the rural population, the fluctuation in the number of school-age children has resulted in certain development challenges in regard to the provision of compulsory education in rural areas. In rural areas with a declining student population, schools may find it difficult to maintain a high level of educational quality due to funding cuts. In rural areas with a large number of left-behind children, it is urgent to increase investment in educational institution facilities and teachers. However, due to the ongoing trend of a year-on-year decline in the rural population, there is instability in regard to the funding for improved education. Therefore, the configuration of educational institution facilities should focus on meeting the basic needs of the rural population, and it is necessary to plan accurately and take into account demographic trends to avoid wasting construction resources.
Most of the items corresponding to healthcare, welfare, and market facilities categories, as well as some items corresponding to the commercial and financial facilities category, are categorized as one-dimensional demand, indicating that rural residents believe that the availability of such facilities will affect their quality of life. Therefore, they are classified as quality-enhancing facilities. The guiding principle for planning such facilities is to invest as much as possible in the construction and renewal of such facilities, while meeting basic public service needs. Similarly, some items corresponding to commercial and financial facilities, which belong to the attractive demand category, mean that if this facility is not provided, residents’ satisfaction will not be significantly reduced, but if it is provided, residents’ satisfaction will increase. Therefore, it is classified as a quality-seeking facility and should be considered later on when resources are limited. Most of the items corresponding to cultural, sports, and technology facilities are categorized as indifferent demand. At the current stage of rural development, they should be appropriately abandoned when resources are limited.

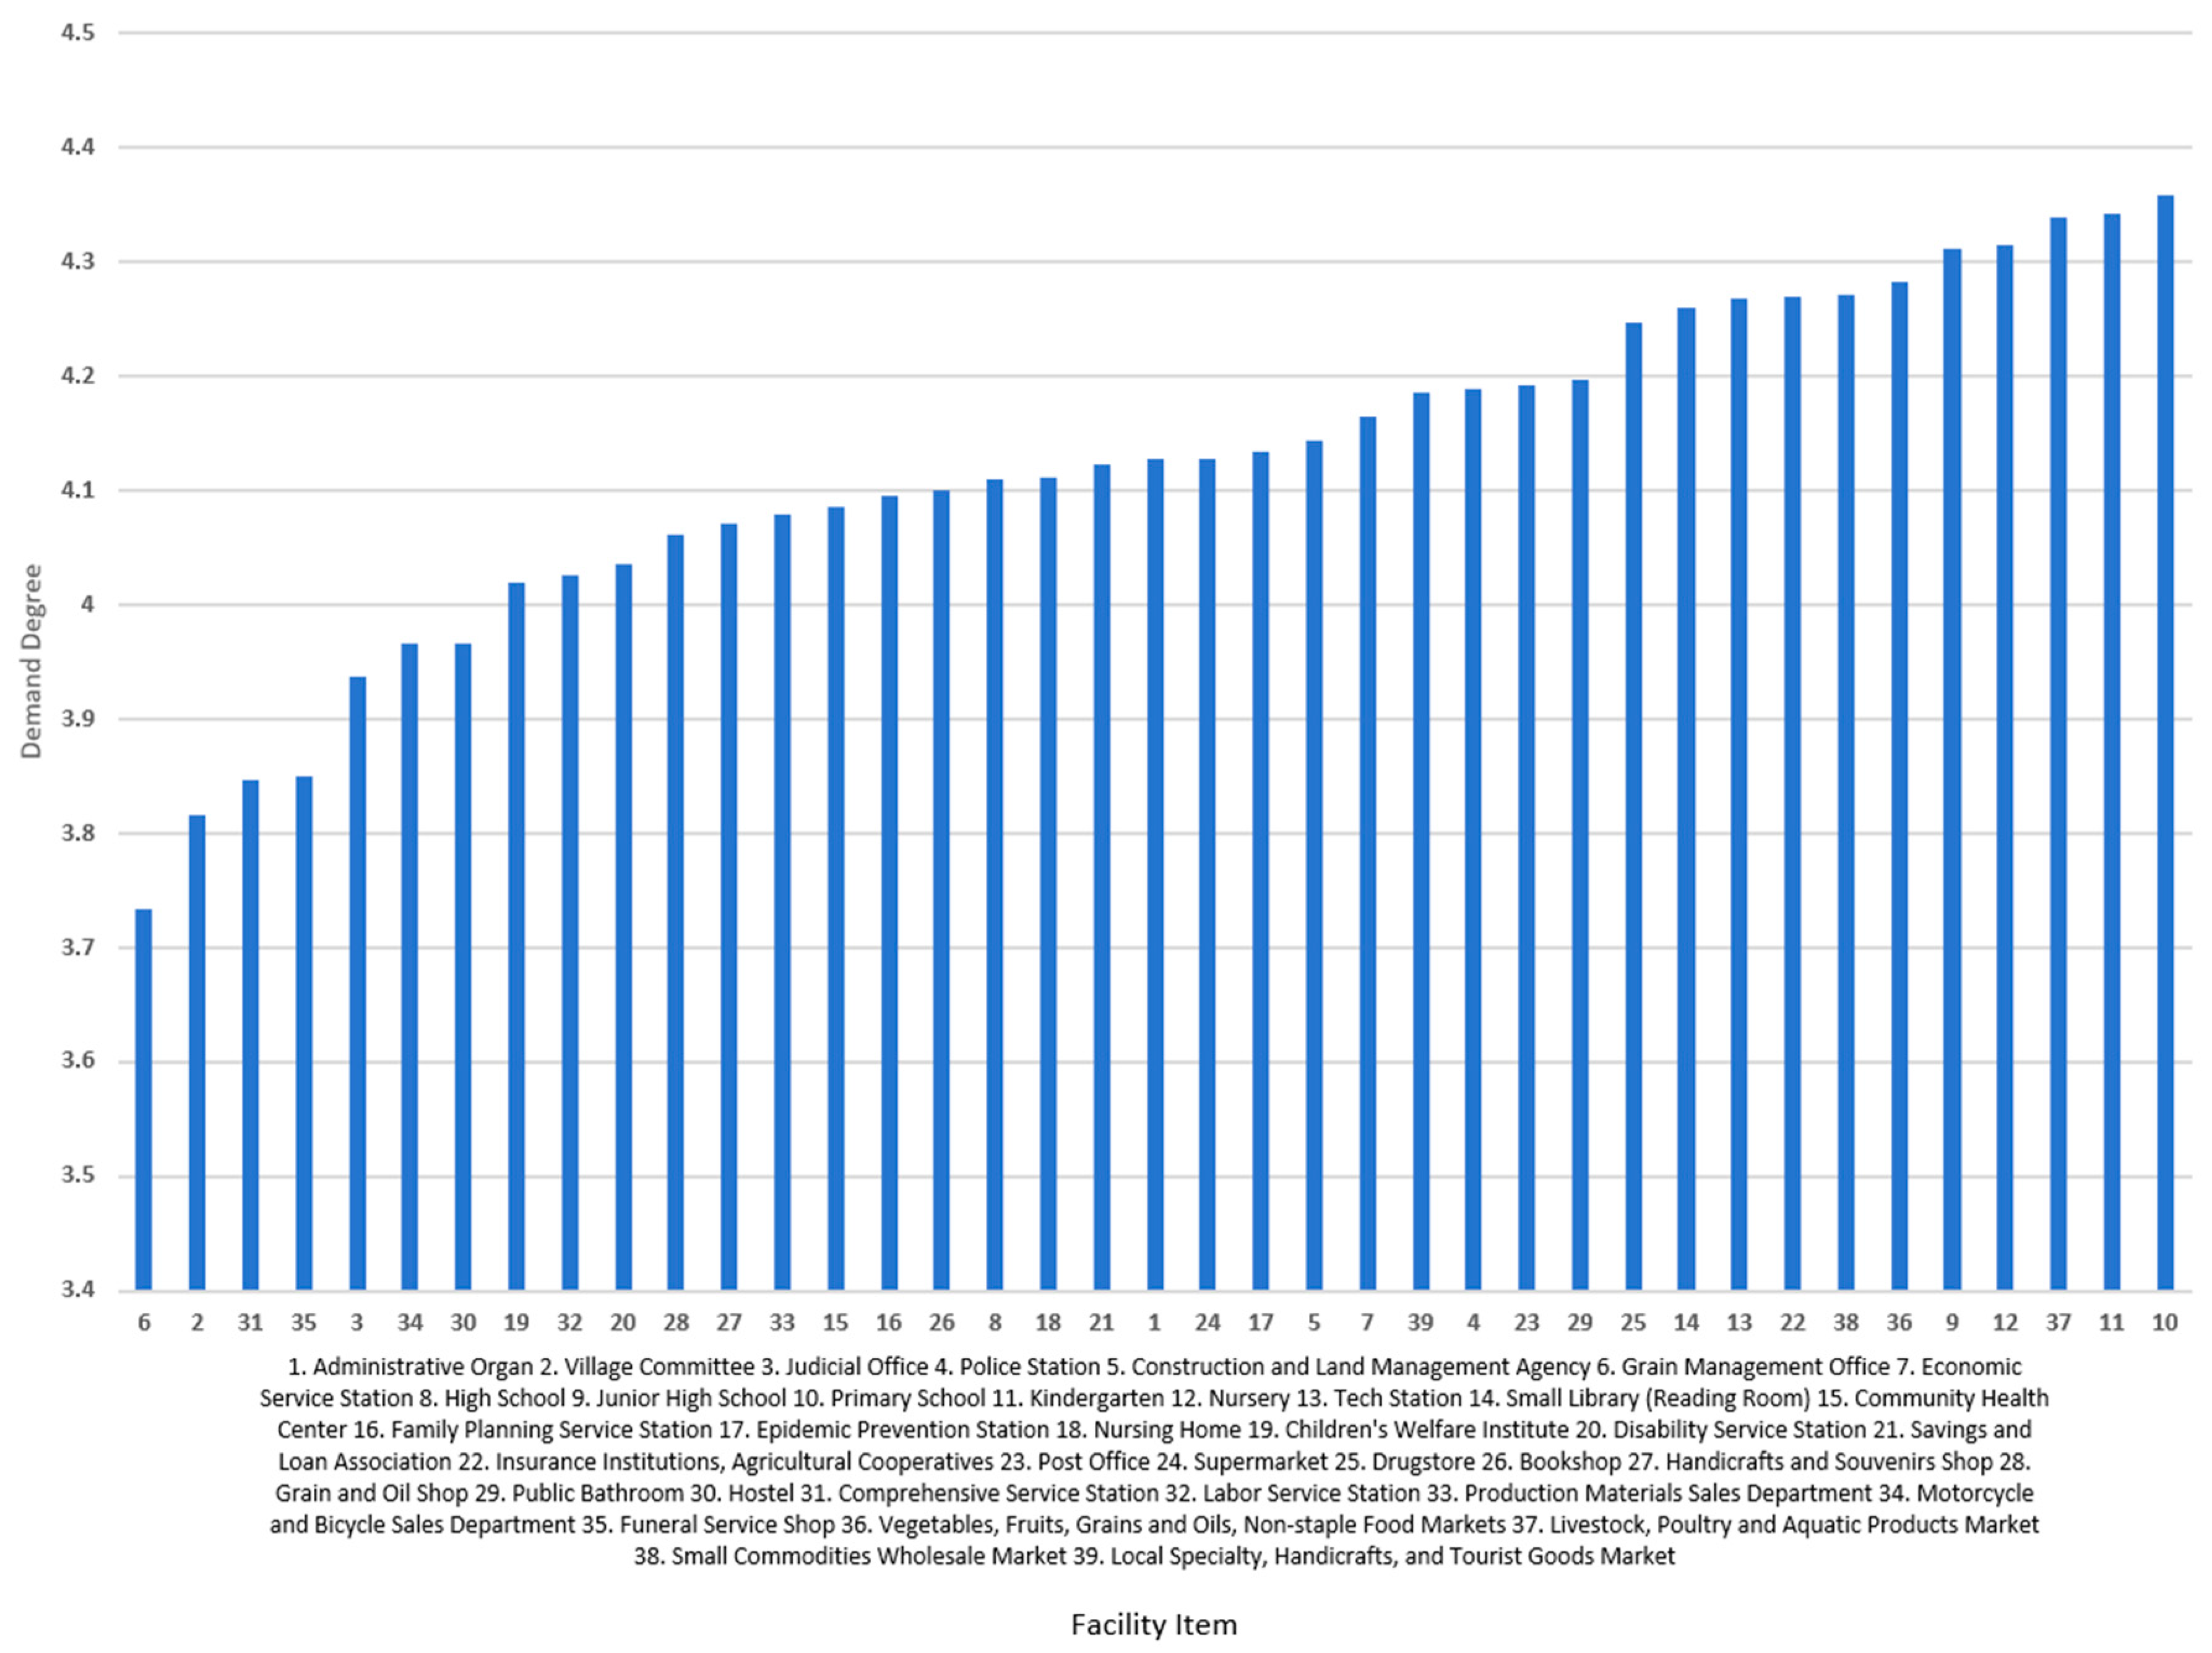
3.2. Degree of Demand for Rural Public Service Facilities

The facility items remaining after the secondary screening are sorted according to the degree of demand, as shown in Figure 5, and the facility numbering is shown in Appendix E. The facilities with the highest demand are primary schools and kindergartens, followed by livestock and poultry, aquatic product markets, and nurseries; the facilities with the lowest demand are grain management offices, village committees, and comprehensive service stations. Classifying and summarizing by facility type, the overall importance of educational institution facilities is the highest, indicating that rural residents cannot do without this type of facility in their daily lives, and that the demand for them is extremely high, showing the highest priority in terms of their construction and renewal. The overall importance of healthcare facilities, welfare facilities, and market facilities is relatively high, indicating that rural residents want to enjoy the services provided by the corresponding facilities in their daily lives, and that the demand for them is relatively high, with a relatively high priority in terms of their construction and renewal.

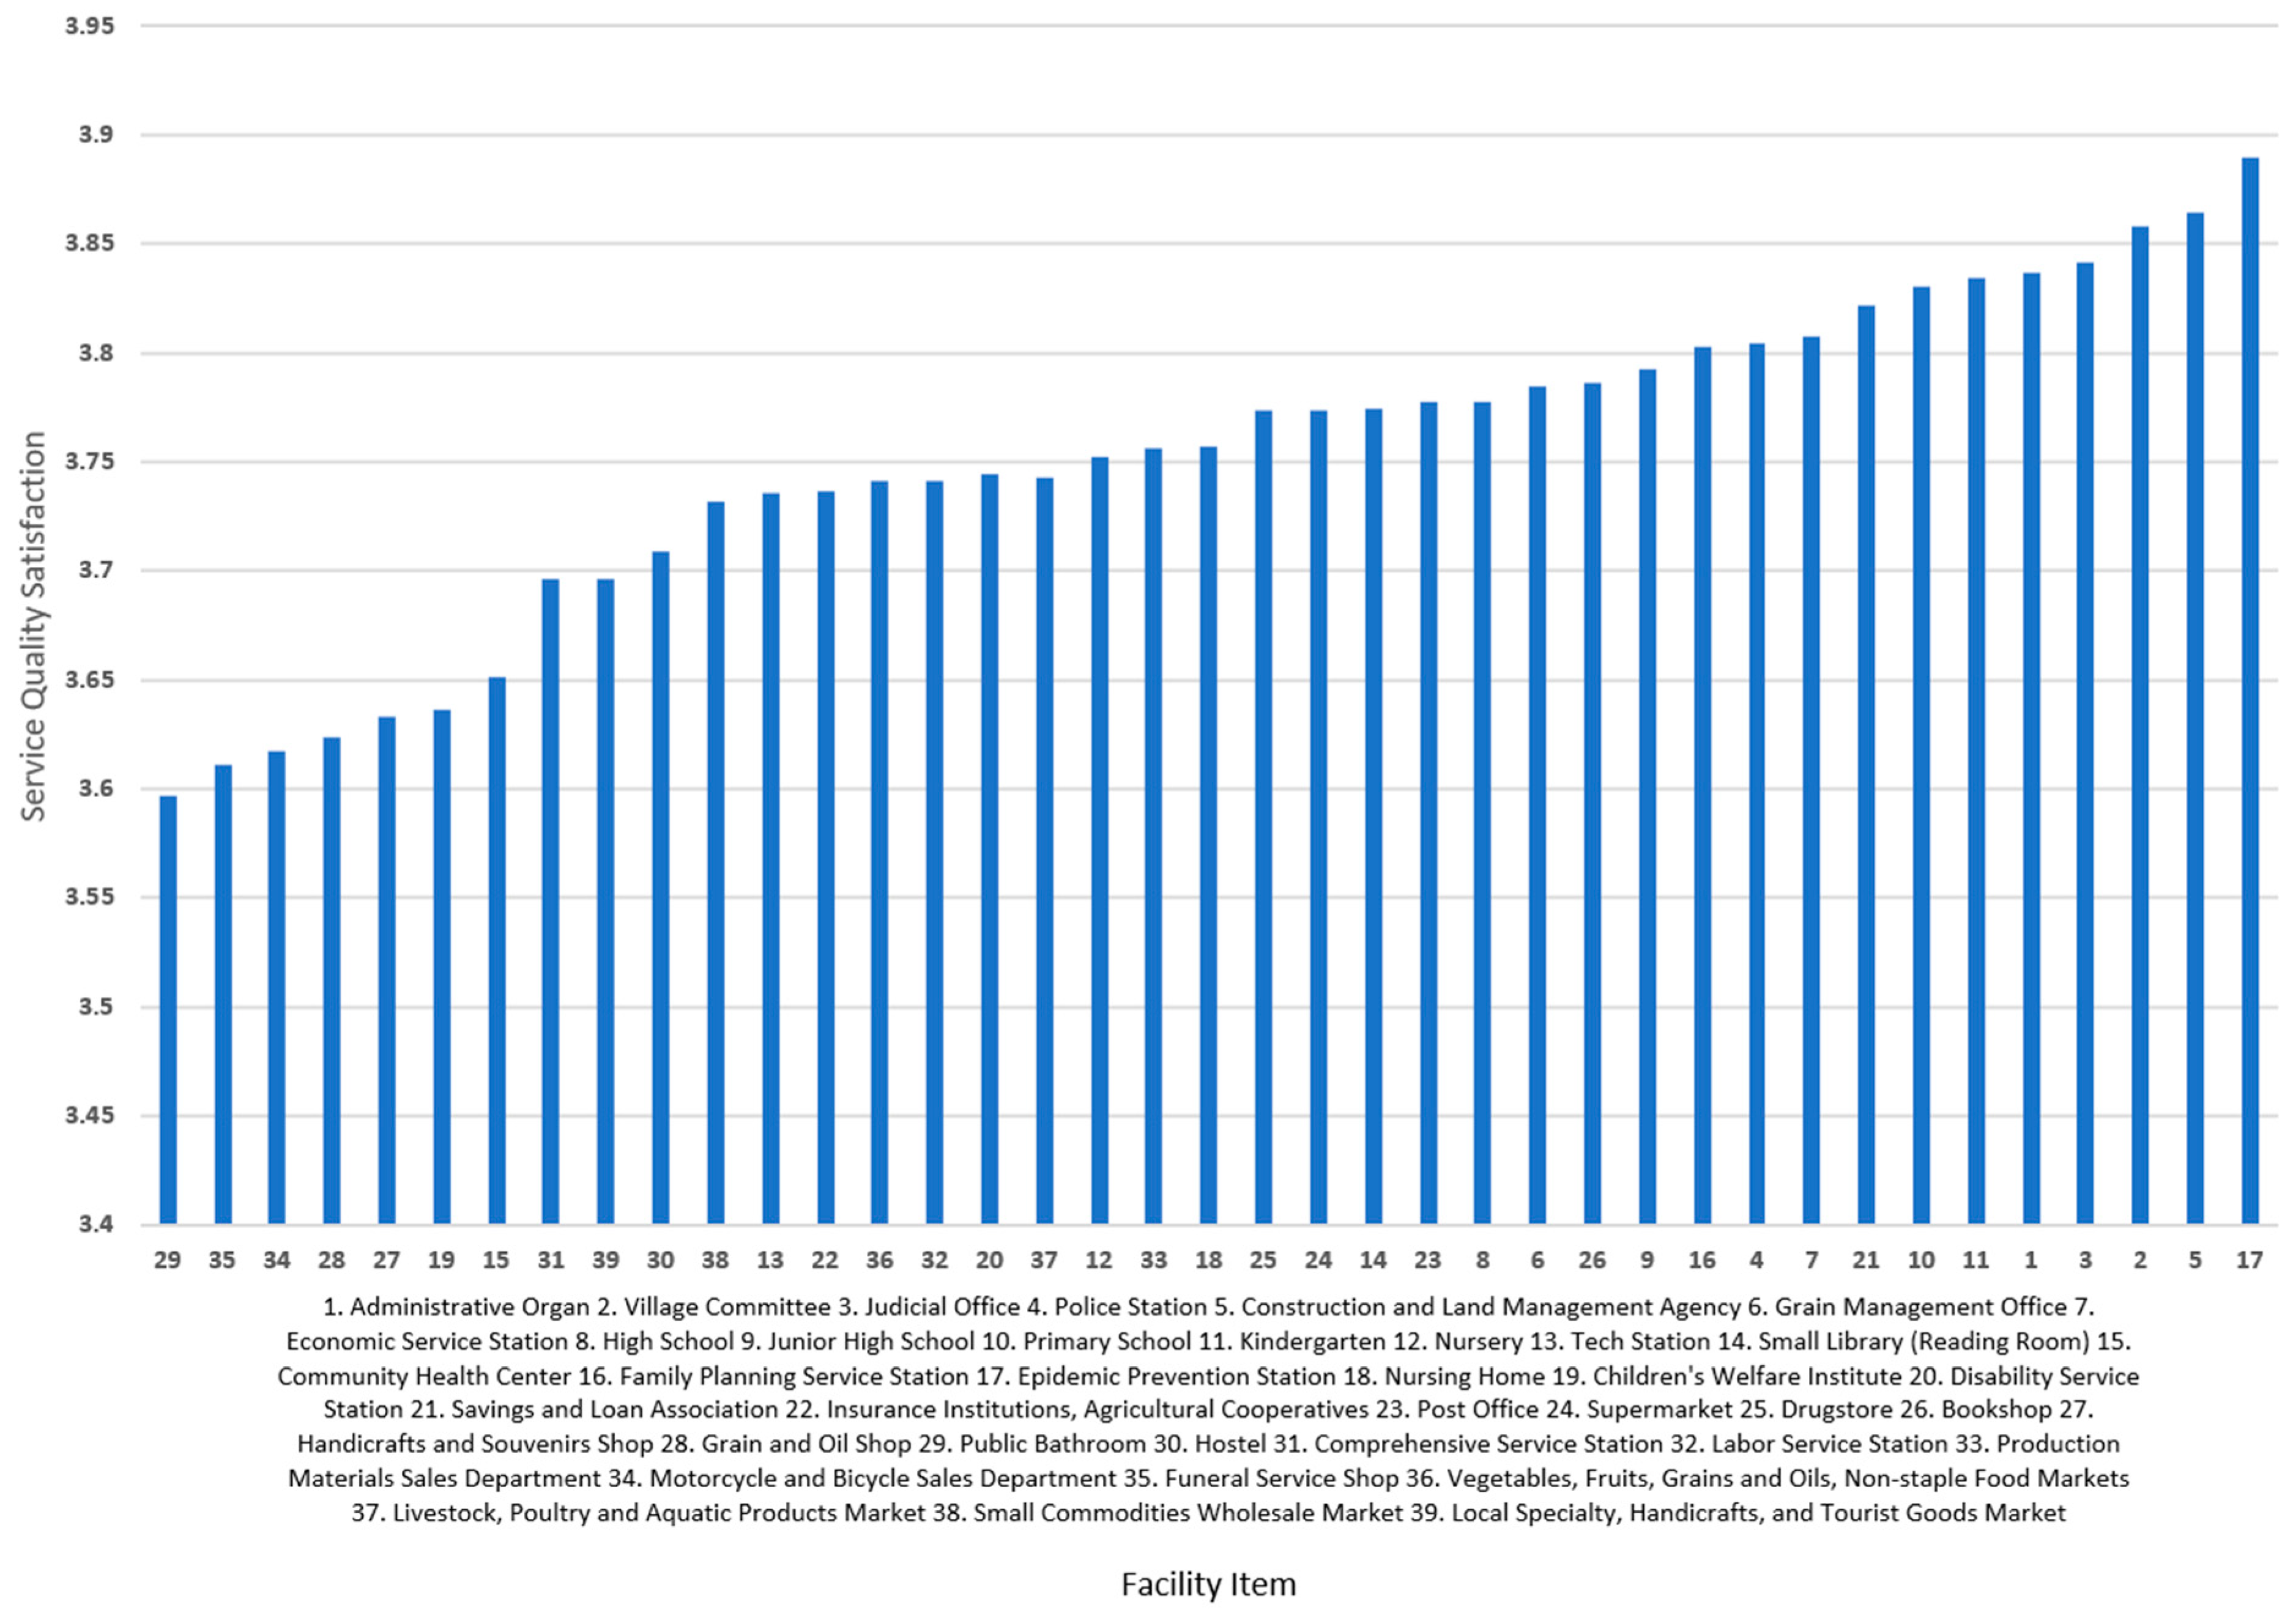
3.3. Satisfaction with the Services Provided by Rural Public Service Facilities

The satisfaction with public service facilities after the secondary screening is ranked in order of value, as shown in Figure 6, and the facility numbering is shown in Appendix E. The highest satisfaction is with the epidemic prevention station, construction and land management agencies, village committees, and judicial offices; the lowest satisfaction is with public bathrooms, funeral service shops, and motorcycle and bicycle sales departments. Summarized by the type of facility, the overall satisfaction of rural residents with the quality of public service facilities is at a medium-to-high level, and there is still lots of room for improvement. The overall satisfaction with administrative facilities and educational institution facilities is relatively high, while the overall satisfaction with commercial and financial facilities and market facilities is relatively low. Consequently, specific construction and upgrading strategies need to be proposed in combination with facility demand.

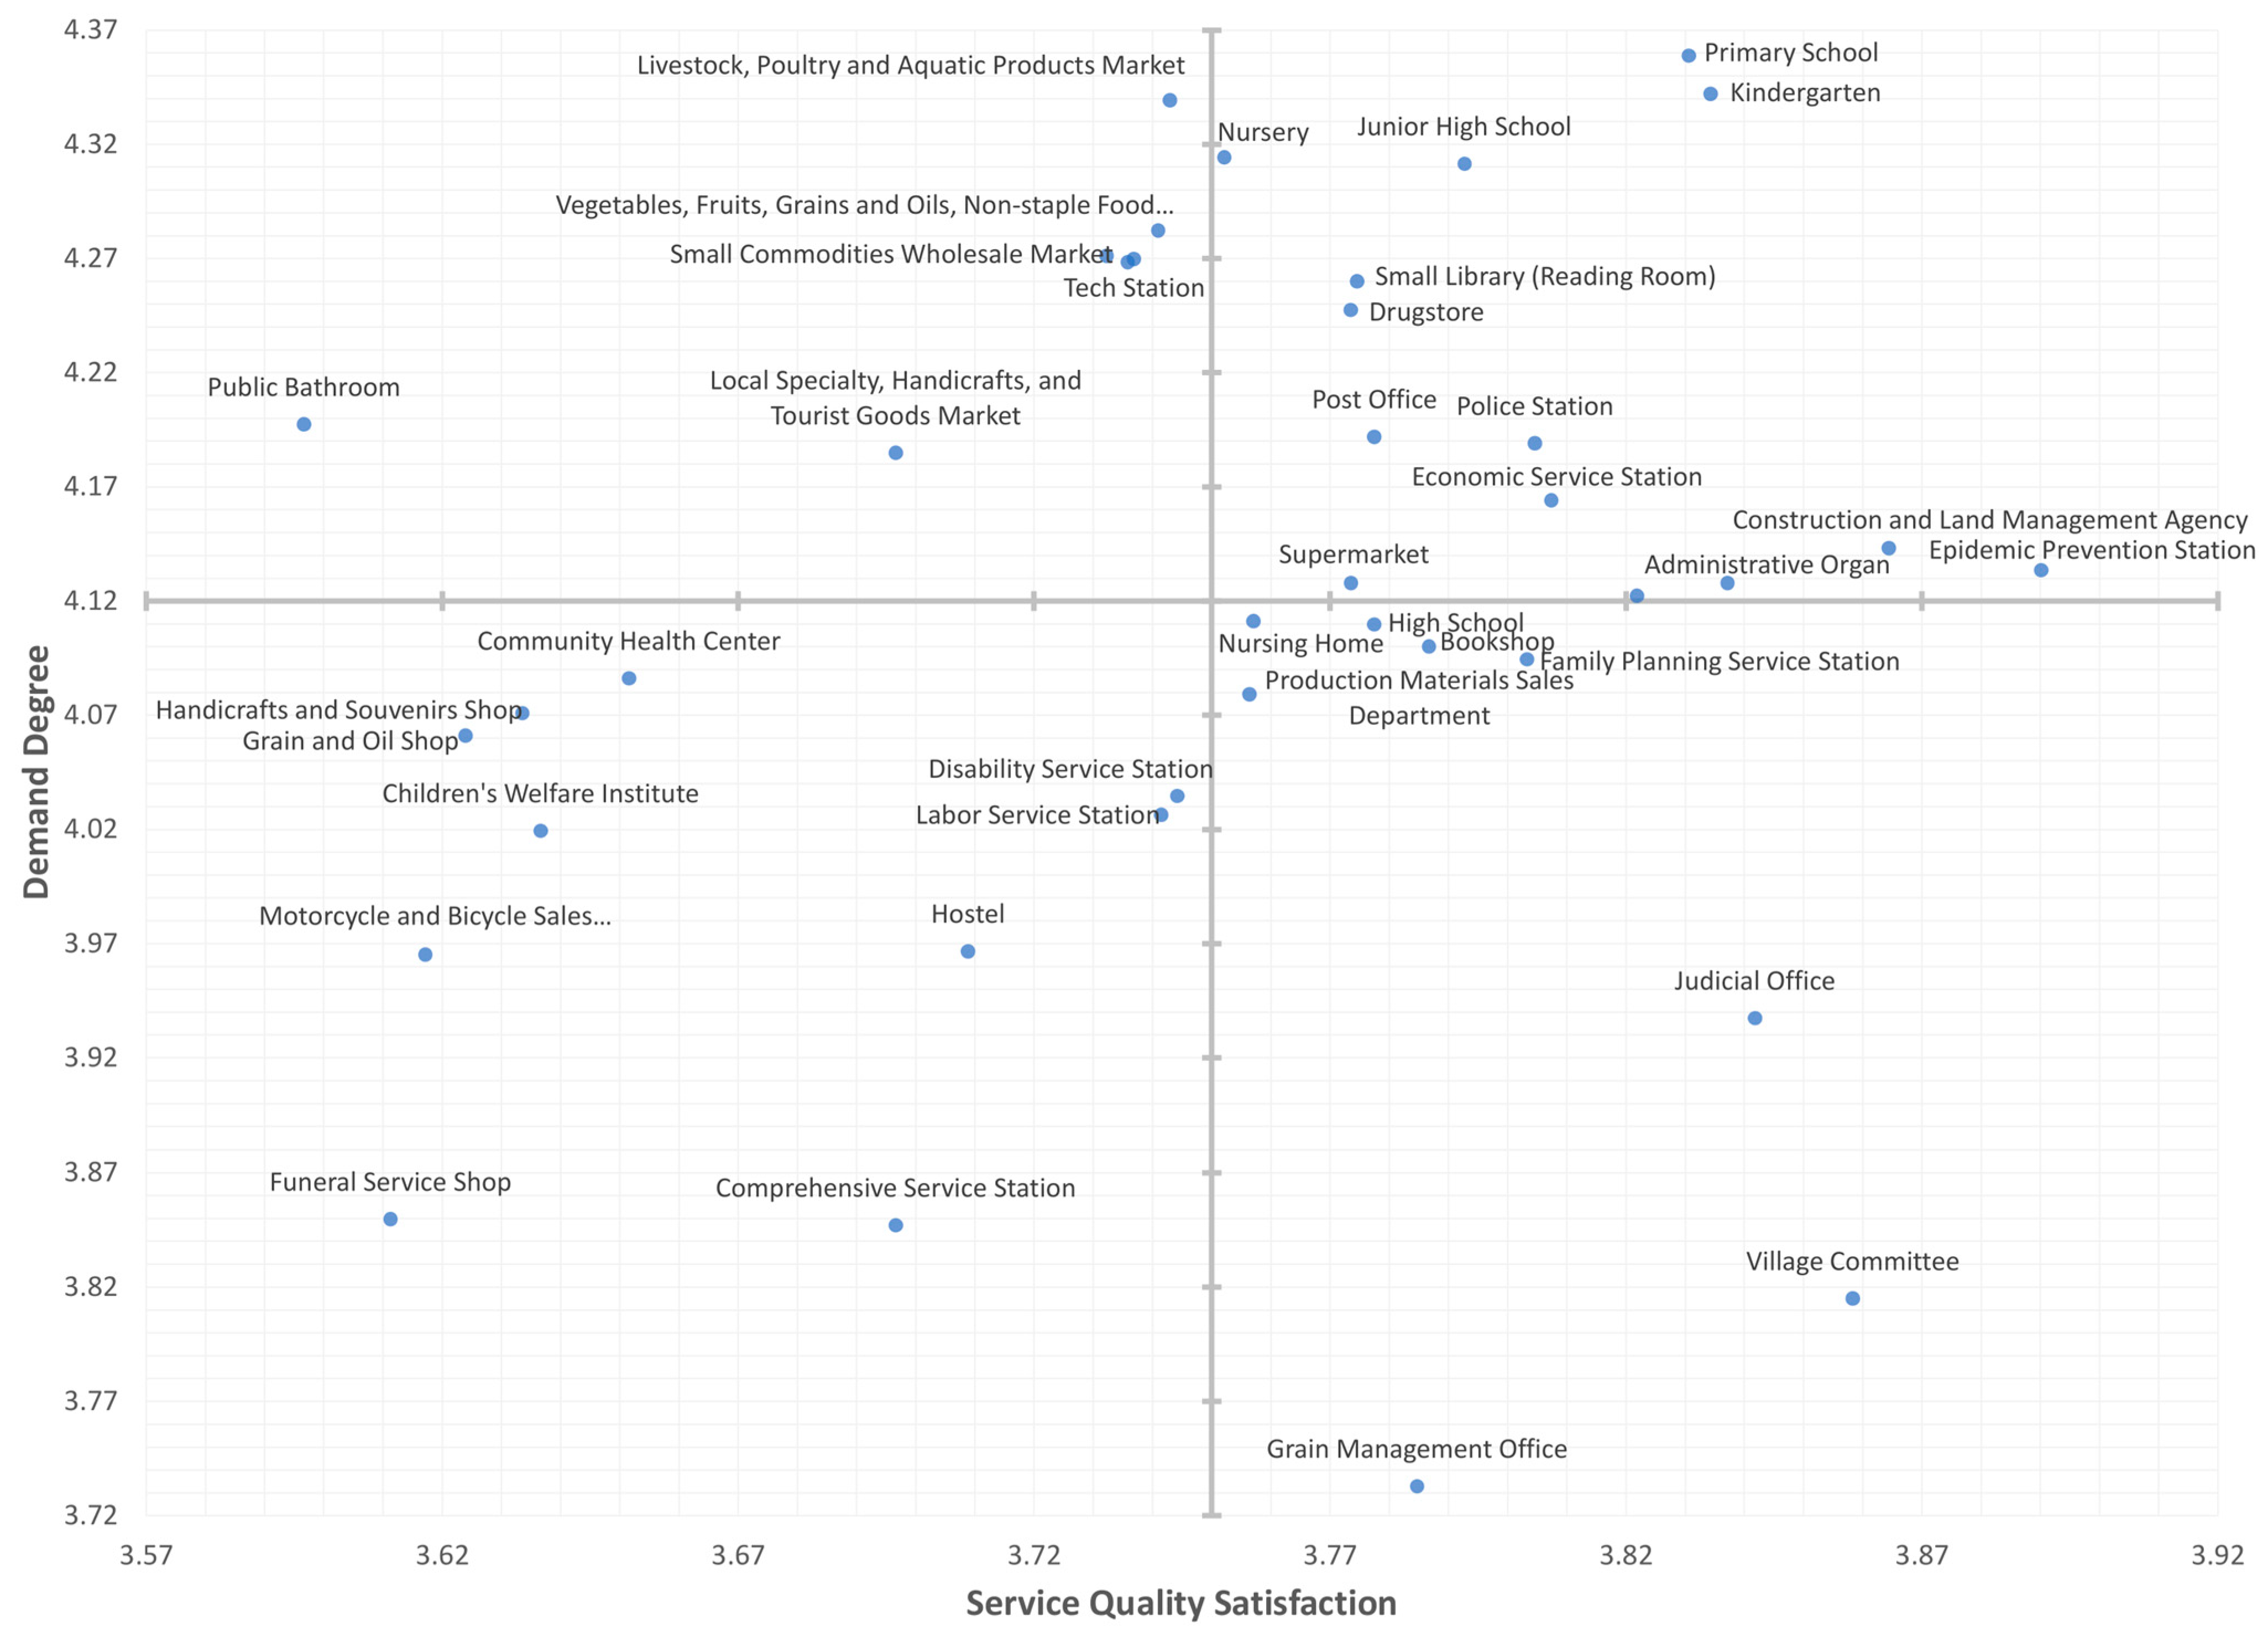
3.4. IPA of the Coupling Relationship Between “Demand and Satisfaction” with Rural Public Service Facilities

The IPA quadrant diagram (Figure 7) of rural public service facilities shows the coordinates for each facility. The abscissa is service quality satisfaction and the ordinate is the degree of demand for the different types of facilities, which can be used to visually display the demand type for all the facility items. The first quadrant is the advantage enhancement area. Facilities in this quadrant, such as primary schools and kindergartens, have high importance and satisfaction ratings and should be maintained and further improved. The second quadrant is the urgent improvement area. Facilities in this quadrant, such as some items corresponding to market facilities, have high importance, but low satisfaction ratings, such as some items corresponding to market trading facilities, which require immediate attention and allocation of resources to improve service quality. The third quadrant is the follow-up opportunity area, which includes facilities with both low importance and satisfaction ratings, such as some items corresponding to cultural, sports, and technological facilities, which should be considered for future development as and when resources permit. The fourth quadrant is the continue-to-maintain area, which includes facilities with low importance, but acceptable satisfaction ratings, such as some items corresponding to administrative facilities, which should be maintained at the current level.

3.5. Rural Public Service Facility Configuration Strategies

Integrating the KANO model and IPA analysis matrix, the 39 rural public service facilities (see Appendix E for facility numbering) that were prioritized according to the results of the data analysis are listed in Table 2.
Table 2 shows that facilities 9, 10, 11, 14, 17, 8, 18, 1, 4, 5, 7, 21, 23, 24, 25, 16, 2, 3, 6, 26, and 33 are in the range that means that they need to be maintained. With the following order of priority: (9, 10, 11, 14, 17) > (8, 18) > (1, 4, 5, 7, 21, 23, 24, 25) > 16 > (2, 3, 6, 26, 33). Services provided by educational institution facilities, such as junior high schools, primary schools, and kindergartens, are the basic functions that rural residents expect to be guaranteed. Next in order of importance are high schools, nursing homes, and some administrative facilities, such as administrative organs, as well as some commercial and financial facilities, such as savings and loan associations. A certain amount of resources also needs to be invested to maintain them. If conditions permit, facilities such as family planning service stations, village committees, judicial offices, and grain management offices, can be considered for investment.
Facilities 12, 37, 38, 39, 19, 35, 13, 22, 29, 36, 15, 28, 20, 27, 30, 31, 32, and 34 are facilities that need improvement. The order of priority is as follows: (12, 37, 38, 39) > (19, 35) > (13, 22, 29, 36) > (15, 28) > (20, 27, 30, 31, 32, 34). Nurseries, livestock and poultry, aquatic product markets, and small commodity wholesale markets are the main concern of rural residents. Funeral service shops, tech stations, insurance agencies, and agricultural cooperatives are in demand, but need improvement. However, the upgrading of facilities such as community health centers, grain and oil stores, disability service stations, and handicrafts and souvenir shops, is not a high priority and should be considered later on when resources are limited.

4. Discussion

Among the existing relevant academic research results, there are many academic studies that use the Kano model or IPA analysis to analyze the demand for services or target products [33,34,35,36,37,38,39,40,41], but there are fewer academic studies that use a combination of the two methods. This study focuses on the real needs of rural residents for public service facilities, and uses the Kano–IPA model to determine the degree of demand for different types of facilities and the quality of the services provided by public service facilities in rural Gaoqing County and the coupling relationship between the two. The specific priorities for the construction and renovation of rural public service facilities are also studied, the results of which can be used to more effectively guide the planning of rural public service facilities.
This study found that, in regard to the overall Kano analysis, most of the items corresponding to educational institution, healthcare, welfare, and market facilities were demanded by rural residents, among which the demand for educational institution facilities, such as primary schools and kindergartens, was the highest. This shows that rural residents cannot do without this type of facility in their daily lives and that these facilities should be prioritized for construction and renewal. This finding is consistent with previous research [42] and emphasizes the importance of optimizing the allocation of rural education resources. However, the satisfaction with the service quality of educational institution facilities is at the medium-to-high level, and there is still a lot of room for improvement. Based on field research and questionnaire surveys, the primary causes of this phenomenon are that the educational conditions in rural areas, such as teacher quality and teaching hardware, still fall short of rural residents’ expectations. This finding aligns with the study by Li [43], which indicates that villagers’ satisfaction with basic public services remains at the medium level and, in terms of public basic education, rural areas lag significantly behind urban areas in regard to infrastructure, teacher quality, teaching quality, and graduation rates. Most of the items corresponding to cultural, sports, and technology facilities are not highly valued by rural residents and have a limited impact on their satisfaction. According to the Kano model theory, the classification of demand elements may change with the development of other factors [44]. As user awareness increases, demand elements may move from left to right (I-A-O-M), which means that indifferent demand may become attractive demand, and attractive demand may become one-dimensional demand, and, finally, may become must-be demand, which means that such facilities become more and more important and expected. Therefore, we should keep up with the times, pay close attention to the feedback from rural residents, and adjust our strategies appropriately.
Combined with the IPA four-quadrant diagram analysis, it was found that most of the items corresponding to educational institution facilities are in the first quadrant, which means that the demand and satisfaction with most of the items corresponding to educational institution facilities are relatively high, and that they belong to the advantage enhancement area. Combined with previous research, it is worth noting that the supply capacity of rural public service facilities is closely related to transportation conditions [29], that is, when the supply conditions of the facilities remain unchanged, the improvement of the transportation conditions can increase the value of the supply of these facilities. The relatively superior transportation conditions and topography of Gaoqing County make it more convenient for rural residents to reach public service facilities, including educational institution facilities, which has a certain degree of impact on residents’ satisfaction. In the second quadrant, the satisfaction with facilities related to residents’ daily shopping and food consumption, such as livestock and poultry, aquatic product markets, and vegetables, fruits, grains, and oils, and non-staple food markets, is not high. This finding also coincides with the view in the study by Cui et al. [29] that the supply of shopping and food consumption facilities is insufficient. In addition, this study also provides a brief construction and renewal strategy for facilities in the third and fourth quadrants that are in relatively low demand.
Combining Kano and IPA analysis, in addition to discovering the characteristics of residents’ demand for and satisfaction with public service facilities compared to previous studies [45,46], this study investigates the specific priorities for the construction and renewal of rural public service facilities. The specific method involved the use of the Kano–IPA model to derive the order of importance for the improvement and maintenance of 39 rural public service facilities. This study proves that the application of the Kano–IPA model in regard to the quality assessment of public service facilities can effectively combine the real needs and satisfaction of rural residents, and is a more systematic, comprehensive, and targeted research approach.
In addition, for future research, after gaining a certain understanding of the demand for public service facilities among rural residents, research methods, such as field research and questionnaire surveys, should be used to investigate and analyze the current situation in terms of rural public service facilities in terms of the type, quantity, distribution, and utilization rate, etc. Through the use of qualitative evaluation methods, such as the analytic hierarchy process and comprehensive evaluation method, an evaluation system for rural public service facilities based on the matching of supply and demand can be constructed. This will allow for a more diverse evaluation and the construction of a more comprehensive evaluation system to evaluate and analyze the current situation in terms of rural public service facilities, and will enable more specific and comprehensive optimization strategies to be proposed based on different types of facilities.

5. Conclusions

The provision of rural public service facilities is part of a complex system. This paper explores a research method to assess the “demand–satisfaction” coupling relationship of rural public service facilities, based on the Kano–IPA model. By introducing the Kano–IPA model, the daily life needs and satisfaction of rural residents with public facilities can be analyzed more scientifically and rationally. Combining qualitative and quantitative methods is a more systematic, comprehensive, and targeted research approach. The main conclusions in this paper are as follows:
(1)
The analysis using the Kano model found that there are 39 public service facilities that are generally in demand in regard to the lives of rural residents. The most in-demand facilities are primary schools and kindergartens, followed by livestock and poultry, aquatic product markets, and nurseries. The least in-demand facilities are grain management offices, village committees, and comprehensive service stations. A breakdown of the results by facility type shows that most items corresponding to educational institution facilities are the most in-demand facilities, reflecting the fundamental role of education in rural communities. Educational facilities, such as primary schools and kindergartens, are considered indispensable, highlighting the need for continued investment and strategic planning to meet basic educational needs. Most items in regard to healthcare, welfare, and market facilities are classified as high priority needs, indicating that rural residents expect to be able to enjoy high-quality healthcare, welfare services, and market facilities. The importance of these facilities highlights the need for targeted resource allocation to improve the quality of rural residents’ daily lives. Some items in regard to commercial and financial facilities are of secondary importance in terms of the urgency of residents’ needs;
(2)
The satisfaction survey found that the overall satisfaction of rural residents with the quality of public service facilities is at a medium-to-high level, and there is still lots of room for improvement. The overall satisfaction with administrative and educational institution facilities is relatively high, indicating that the current efforts in these areas are relatively effective, but continuous improvement is still needed to meet specific challenges, such as demographic changes and resource allocation. The overall satisfaction with commercial and financial facilities and market facilities is relatively low, indicating that there is a significant gap between the current level of supply and residents’ expectations;
(3)
The IPA analysis identified four quadrants, providing a clear direction for prioritizing improvements to and maintenance of facilities. Areas for improvement: This includes facilities with high importance and high satisfaction, such as primary schools and kindergartens, which should be maintained and further optimized. Areas in urgent need of improvement: This involves items with high importance but low satisfaction, such as market facilities, which require investment of resources as a priority to improve the provision of such services. Areas for follow-up opportunities: This covers items of low importance and low satisfaction, such as cultural, sports, and technological facilities, which can be considered for future development when resources are sufficient. Continue to maintain areas: This covers projects with low importance but an acceptable level of satisfaction, such as administrative facilities, which require maintenance of the current situation.
Finally, this study has certain limitations. The study focuses mainly on rural residents in Gaoqing County, Zibo City, Shandong Province, which can be used to represent most of the northern plain. However, since the analysis results are affected by the characteristics of plain areas, and the respective economic and social characteristics, it is not ruled out that the findings may not be applicable to other regions. The study is based on 719 valid questionnaires that were completed and used for the analysis. Although the sample size can provide a certain degree of representativeness, it may not be sufficient to fully cover the needs and opinions of all rural residents, especially the needs of small-scale or special groups, such as ethnic minorities, whose needs may not have been adequately captured. The methodological limitations primarily lie in the failure to account for seasonal demand changes. In future research, other regions such as mountainous areas and minority regions could be selected as study subjects, with a larger sample size, and seasonal dynamic changes incorporated into the research to conduct a comprehensive and in-depth investigation, thereby improving the research.

Author Contributions

Conceptualization, X.W., J.W., J.H. and M.W.; methodology, X.W., J.W., J.H. and M.W.; software, J.W.; validation, J.W.; formal analysis, J.W., J.H. and M.W.; investigation, X.W., Y.Q. and J.W.; resources, X.W., M.W. and Y.Q.; data curation, J.W.; writing—original draft preparation, J.W. and X.W.; writing—review and editing, M.W., J.H. and Y.Q.; visualization, J.W. and K.L.; supervision, Y.Q., D.Z. (Dian Zhou), D.Z. (Dingqing Zhang) and J.D.; project administration, M.W., J.H. and Y.Q.; funding acquisition, M.W. All authors have read and agreed to the published version of the manuscript.

Funding

This research was funded by National Natural Science Foundation of China: No. 52108030, the Natural Science Basis Research Plan in Shaanxi Province, China (Program No. 2023-JC-QN-0622), the Ministry of Education, Chunhui Program (Program No. HZKY20220535), National Natural Science Foundation of China: No. 52408039, and Shaanxi Province Innovation Capability Support Program Project: No. 2024ZC-YBXM-008.

Data Availability Statement

The data used in the study are available from the authors and can be shared upon reasonable request.

Acknowledgments

During the research and preparation stages of this study, the government of Gaoqing County provided invaluable support by offering materials and data free of charge. Additionally, the active participation of the rural residents of Gaoqing County in surveys and interviews was instrumental to this study. The authors would like to express their profound gratitude to the Gaoqing County government and villagers for their exceptional cooperation and assistance.

Conflicts of Interest

The authors declare that there are no conflicts of interest.

Abbreviations

The following abbreviations are used in this manuscript:
IPAImportance–Performance Analysis

Appendix A

Table A1. List of facility items after primary screening.
Facility Items After Primary Screening
Administrative FacilitiesAdministrative Organ
Village Committee
Judicial Office
Police Station
Construction and Land Management Agency
Enterprise Rural Management Office
Tax Office
Grain Management Office
Economic Service Station
Educational Institution
Facilities
Vocational and Technical School
High School
Junior High School
Primary School
Kindergarten
Nursery
Cultural, Sports, and
Technological Facilities
Tech Station
Small Library (Reading Room)
Cultural Activity Center
Small Gymnasium
Fitness Area
Technical Training Station
Healthcare FacilitiesHospital
Community Health Center
Family Planning Service Station
Epidemic Prevention Station
Welfare FacilitiesNursing Home
Children’s Welfare Institute
Senior Care Service Station
Disability Service Station
Commercial Financial FacilitiesSavings and Loan Association
Insurance Institutions, Agricultural Cooperatives
Post Office
Supermarket
Drugstore
Bookshop
Handicrafts and Souvenirs Shop
Grain and Oil Shop
Public Bathroom
Hostel
Comprehensive Service Station
Labor Service Station
Production Materials Sales Department
Motorcycle and Bicycle Sales Department
Home Appliance and Agricultural Machinery Repair Shop
Motor Vehicle Repair Shop
Funeral Service Shop
Market FacilitiesVegetables, Fruits, Grains, and Oils, Non-staple Food Markets
Livestock, Poultry, and Aquatic Products Market
Small Commodities Wholesale Market
Fuel, Building Materials, and Production Materials Market
Local Specialty, Handicrafts, and Tourist Goods Market

Appendix B

Table A2. Example questions from the Kano questionnaire. Administrative Organ.
LikeExpectedIndifferentTolerableIntolerable
How would you feel if such facilities were available in the surrounding area?
How would you feel if such facilities were not available in the surrounding area?

Appendix C

Table A3. Kano demands evaluation form.
FacilityHow Would You Feel If Such Facilities Were Not Available in the Surrounding Area?
IntolerableTolerableIndifferentExpectedLike
How would you feel if such facilities were available in the surrounding area?IntolerableQRRRR
TolerableMIIIR
IndifferentMIIIR
ExpectedMIIIR
LikeOAAAQ
Notes: A—attractive demand, O—one-dimensional demand, M—must-be demand, I—indifferent demand, R—reverse demand, Q—questionable demand.

Appendix D

Figure A1. Statistics on the results of the Kano questionnaire.
Buildings 15 01614 g0a1

Appendix E

Table A4. List of facility items after secondary screening.
Facility Items After Secondary Screening
Administrative Facilities1. Administrative Organ
2. Village Committee
3. Judicial Office
4. Police Station
5. Construction and Land Management Agency
6. Grain Management Office
7. Economic Service Station
Educational Institution
Facilities
8. High School
9. Junior High School
10. Primary School
11. Kindergarten
12. Nursery
Cultural, Sports, and
Technological Facilities
13. Tech Station
14. Small Library (Reading Room)
Healthcare Facilities15. Community Health Center
16. Family Planning Service Station
17. Epidemic Prevention Station
Welfare Facilities18. Nursing Home
19. Children’s Welfare Institute
20. Disability Service Station
Commercial Financial Facilities21. Savings and Loan Association
22. Insurance Institutions, Agricultural Cooperatives
23. Post Office
24. Supermarket
25. Drugstore
26. Bookshop
27. Handicrafts and Souvenirs Shop
28. Grain and Oil Shop
29. Public Bathroom
30. Hostel
31. Comprehensive Service Station
32. Labor Service Station
33. Production Materials Sales Department
34. Motorcycle and Bicycle Sales Department
35. Funeral Service Shop
Market Facilities36. Vegetables, Fruits, Grains and Oils, Non-staple Food Markets
37. Livestock, Poultry and Aquatic Products Market
38. Small Commodities Wholesale Market
39. Local Specialty, Handicrafts, and Tourist Goods Market

Appendix F

Table A5. Example of questions in the satisfaction survey. Administrative Organ.
ExcellentGoodAverageBelow AverageVery PoorNot Sure
Service Quality

References

  1. Hao, Y.G.; Zhang, Q.; Wang, Y.B.; Luo, W.C.; Zhang, X.D.; Ma, L.; Chen, D.L. Thematic Discussion: Current Situation, Problems and Countermeasures of Urban and Rural Public Service Facilities Construction in China. Governance 2024, 3, 59–67. (In Chinese) [Google Scholar]
  2. Zhou, D.L.; Huang, H.M. Study on the Spatial Distribution Characteristics and Influencing Factors of Famous Historical and Cultural Towns and Villages in Fujian Province. Urban Dev. Stud. 2019, 26, 1–5+18. (In Chinese) [Google Scholar]
  3. He, J.; Zhou, D.; Dai, L.H. Study on Evaluation System of Urban Elderly Living Related Facilities Based on Demand Theories. Archit. J. 2020, S2, 37–44. (In Chinese) [Google Scholar]
  4. Wan, C.W.; Yang, G.Q. Declining Villages in Mountainous Areas: Demand Willingness Characteristics, Problems, and Trends of Public Service Facilities and Planning Responses. City Plan. Rev. 2020, 44, 77–86+102. (In Chinese) [Google Scholar]
  5. Zeng, P.; Wang, S.; Zhu, L.H. A Study on the Optimization of Rural Community Living Circles Guided by Shrink Smart Theory: A Case Study of Suning County, Hebei Province. Planners 2021, 37, 34–42. (In Chinese) [Google Scholar]
  6. Wei, W.; Ren, X.W.; Guo, S.Y. Evaluation of Public Service Facilities in 19 Large Cities in China from the Perspective of Supply and Demand. Land 2022, 11, 149. [Google Scholar] [CrossRef]
  7. Gao, M.M.; Wang, Z.; Qiu, Z.; Wang, S.C.; Hua, Y. Review and Prospect of Rural Public Service Facilities Configuration from the Perspective of Dynamic Development. J. Hum. Settl. West China 2023, 38, 129–135. (In Chinese) [Google Scholar]
  8. Li, J.; Gao, X.X.; Li, Y.; Zhang, X.T. Research and Recommended Solutions on Construction Needs of Rural Infrastructure and Public Service Facilities. J. Agric. Resour. Environ. 2023, 40, 1169–1179. (In Chinese) [Google Scholar]
  9. Wang, M.; Zhang, M.; Qi, Y.; Zhang, D.; Wang, C.; Yao, W.; Zhou, D. Developing a Holistic Approach for Constructing Rural Living Circles in the Loess Plateau—Taking Yongning Village as an Example. Buildings 2024, 14, 514. [Google Scholar] [CrossRef]
  10. Qiu, Z.; Wang, Y.; Wang, J.; Wang, Z.; Zhou, Y. Needs Hierarchy for Public Service Facilities and Guidance-Control Programming in Small Chinese Towns Influenced by Complex Urbanization of Residents: The Evidence from Zhejiang. Land 2023, 12, 1205. [Google Scholar] [CrossRef]
  11. Metwally, E.; Samir, E. Assessing Citizen Satisfaction Indicators for Urban Public Services to Enhance Quality of Life in Sharm el-Sheikh. Ain Shams Eng. J. 2024, 15, 102841. [Google Scholar] [CrossRef]
  12. Hong, M.Y.; Wei, W.; Yin, L.; Xia, J. Exploring the Mechanism of the Impact of Basic Public Service Facilities on Residents’ Satisfaction: Based on the “Homo-Urbanicus” Theory. Hum. Geogr. 2023, 38, 107–117. (In Chinese) [Google Scholar]
  13. Shen, Y.; Zhang, X.; Zhu, H.; Yin, Z.; Drianda, R.P. Living in a Chinese Industrial New Town: A Case Study of Chenglingji New Port Area. Land 2023, 12, 790. [Google Scholar] [CrossRef]
  14. Li, J.; Fan, J.; Gao, J.; Zhou, R.; Wang, K.; Zhou, K. Effects of the Spatial Patterns of Urban Parks on Public Satisfaction: Evidence from Shanghai, China. Landsc. Ecol. 2023, 38, 1265–1277. [Google Scholar] [CrossRef]
  15. Huai, S.Y.; Lin, S.; Zhang, T.C.; Van de Voorde, T. Are Social Media Data and Survey Data Consistent in Measuring Park Visitation, Park Satisfaction, and Their Influencing Factors? A Case Study in Shanghai. Urban For. Urban Green. 2023, 81, 1280–1290. [Google Scholar] [CrossRef]
  16. Shan, Z.R.; An, Y.H.; Yuan, M.; Huang, Y.P. Study on Spatial and Temporal Distribution Characteristics and Influencing Factors of Urban Residents’ Sentiment Based on Weibo Data: A Case Study of the Main Urban Area of Wuhan. Urban Dev. Stud. 2022, 29, 69–76+2. (In Chinese) [Google Scholar]
  17. Abdelghany, K.; Abdelghany, A.; Mahmassani, H.; Kaysi, I. Equitable Access to Services in Large-Scale Pedestrian Facilities. Transp. Res. Rec. 2018, 2672, 79–89. [Google Scholar] [CrossRef]
  18. Su, J.L.; Sook, H.S.; Uk, J.S. Analysis of Locational Pattern and Spatial Service Pattern of Public Service Facilities in Seoul: Focused on Public Sport Facilities. SH Urban Res. Insight 2012, 2, 15–27. [Google Scholar] [CrossRef]
  19. Chen, C. Discussion on the Optimization Method of Public Service Facility Layout from the Perspective of Spatial Equity: A Study Based on the Central City of Shanghai. Land 2023, 12, 1780. [Google Scholar] [CrossRef]
  20. Caselli, B.; Carra, M.; Rossetti, S.; Zazzi, M. Exploring the 15-min Neighbourhoods: An Evaluation Based on the Walkability Performance to Public Facilities. Transp. Res. Procedia 2022, 60, 346–353. [Google Scholar] [CrossRef]
  21. Setyono, A.D.; Cahyono, D.D.; Helmy, M. Measuring Service Capacity of Public Facilities Based on Supply Aspect (Case Study: Elementary School in Malang City). Procedia Soc. Behav. Sci. 2016, 227, 45–51. [Google Scholar] [CrossRef]
  22. Cho, J.Y.; Park, S.K. Key Factors for Sustainable Operation of Smart Rural Communities in Aging Societies: Voices of Korean Community Leaders. Technol. Soc. 2023, 74, 102306. [Google Scholar] [CrossRef]
  23. Yang, C.; Xin, L.; Ouyang, H.; Liang, L.; Zhu, M. Research on Optimization Strategy of Public Facilities in Community Life Circle Based on Subjective and Objective Evaluation: A Case Study of Nanning Central City. Shanghai Urban Plan. Rev. 2024, 1, 9–16. (In Chinese) [Google Scholar]
  24. Hu, P.; Zhang, Y.; Cheng, J.L. Research on Spatial Resilient Governance Strategy of Community Public Service Facilities: The Case of Nanjing City. Planners 2023, 39, 44–50. (In Chinese) [Google Scholar]
  25. Xiang, S.Q.; Xu, J.H.; Yang, L. Life-cycle Public Service Facilities Provision System Optimization. Planners 2022, 38, 71–78. (In Chinese) [Google Scholar]
  26. Li, A.; Zhang, J. Equal Urban-Rural Public Service Facility Development. Planners 2011, 27, 7. (In Chinese) [Google Scholar]
  27. Luo, Z.; Wei, J.; Zhang, J. Study on the Characters of Equalization Development of Basic Public Service Facilities in Urban and Rural Areas—Changzhou as the Case. Urban Stud. 2010, 17, 36–42. (In Chinese) [Google Scholar]
  28. Zhang, W. The Core Framework of the Livable City Construction. Geogr. Res. 2016, 35, 205–213. (In Chinese) [Google Scholar]
  29. Cui, X.J.; Ma, L.B.; Tao, T.M.; Zhang, W. Do the Supply of and Demand for Rural Public Service Facilities Match? Assessment Based on the Perspective of Rural Residents. Sustain. Cities Soc. 2022, 82, 103905. [Google Scholar] [CrossRef]
  30. CECS 354: 2013; Standard for Planning of Rural Area Public Facilities. China Planning Press: Beijing, China, 2013. (In Chinese)
  31. Kano, N.; Seraku, N.; Takahashi, F.; Tsuji, S.-I. Attractive Quality and Must-Be Quality. J. Jpn. Soc. Qual. Control 1984, 14, 147–156. [Google Scholar]
  32. National Health Commission. Issuing the Measures for Ethical Review of Life Science and Medical Research Involving Human Being. Available online: https://www.pkulaw.com/en_law/d94e9e56ed4fc8fcbdfb.html?keyword=%E6%B6%89%E5%8F%8A%E4%BA%BA%E7%9A%84%E7%94%9F%E5%91%BD%E7%A7%91%E5%AD%A6%E5%92%8C%E5%8C%BB%E5%AD%A6%E7%A0%94%E7%A9%B6%E4%BC%A6%E7%90%86%E5%AE%A1%E6%9F%A5%E5%8A%9E%E6%B3%95 (accessed on 24 March 2025).
  33. Hu, R.; Tao, X.; Gong, J.; Wang, F. Quality Function Deployment Approach to Urban Ecological Public Art Design Centred on Resident Needs. Sci. Rep. 2024, 14, 22814. [Google Scholar] [CrossRef] [PubMed]
  34. Ying, P.; Hazwani, N.H.N.; Ching, H.G. Public Perception of Cultural Ecosystem Services in Historic Districts Based on Biterm Topic Model. Sci. Rep. 2024, 14, 11717. [Google Scholar] [CrossRef]
  35. de Vasconcelos, C.R.; de Carvalho, R.S.M.C.; de Melo, F.J.C.; de Medeiros, D.D. Improving Quality in Public Health Service: An Integrated Approach to the Kano Model and the Balanced Scorecard. J. Nonprofit Public Sect. Mark. 2023, 35, 215–241. [Google Scholar] [CrossRef]
  36. Tuan, V.A.; Van Truong, N.; Tetsuo, S.; An, N.N. Public Transport Service Quality: Policy Prioritization Strategy in the Importance-Performance Analysis and the Three-Factor Theory Frameworks. Transp. Res. Part A 2022, 166, 118–134. [Google Scholar] [CrossRef]
  37. Lacerda, A.B.; Souza, A.S.d.S.; Da Silva, G.K.L.; De Azevedo, E.H.M.; De Melo, F.J.C. Basic Health Units Services Quality Assessment Through Kano and SERVQUAL Models. Benchmarking Int. J. 2022, 29, 2858–2880. [Google Scholar] [CrossRef]
  38. Xu, B.; Shi, Q.X.; Zhang, Y.P. Evaluation of the Health Promotion Capabilities of Greenway Trails: A Case Study in Hangzhou, China. Land 2022, 11, 547. [Google Scholar] [CrossRef]
  39. Sharareh, K.; Jahan, T.N.; Halil, N. Service Quality Assessment and Enhancement Using Kano Model. PLoS ONE 2022, 17, e0264423. [Google Scholar] [CrossRef]
  40. Jomnonkwao, S.; Champahom, T.; Ratanavaraha, V. Methodologies for Determining the Service Quality of the Inter-city Rail Service Based on Users’ Perceptions and Expectations in Thailand. Sustainability 2020, 12, 4259. [Google Scholar] [CrossRef]
  41. Simpson, G.D.; Parker, J. Data for an Importance-Performance Analysis (IPA) of a Public Green Infrastructure and Urban Nature Space in Perth, Western Australia. Data 2018, 3, 69. [Google Scholar] [CrossRef]
  42. Pan, M.; Huang, Y.; Qin, Y.; Li, X.; Lang, W. Problems and Strategies of Allocating Public Service Resources in Rural Areas in the Context of County Urbanization. Int. J. Environ. Res. Public Health 2022, 19, 14596. [Google Scholar] [CrossRef]
  43. Li, X.L. Focusing on Improving the Supply Level of Rural Basic Public Services. Agric. Econ. 2022, 6, 30–32. (In Chinese) [Google Scholar]
  44. Kano, N. Life Cycle and Creation of Attractive Quality. In Proceedings of the 4th QMOD Conference, Linköping, Sweden, 12–14 September 2001. [Google Scholar]
  45. Wen, J. The Supply of Rural Public Cultural Services Relying on Data Mining Technology under the Rural Revitalization Strategy. Wirel. Commun. Mob. Comput. 2022, 2022, 1–13. [Google Scholar] [CrossRef]
  46. Shayo, E.H.; Senkoro, K.P.; Momburi, R.; Olsen, Ø.E.; Byskov, J.; Makundi, E.A.; Kamuzora, P.; Mboera, L.E.G. Access and Utilisation of Healthcare Services in Rural Tanzania: A Comparison of Public and Non-public Facilities Using Quality, Equity, and Trust Dimensions. Glob. Public Health 2016, 11, 407–422. [Google Scholar] [CrossRef] [PubMed]
Figure 1. Location of the research subject.
Buildings 15 01614 g001
Figure 2. Research roadmap.
Buildings 15 01614 g002
Figure 3. The four quadrants of IPA.
Buildings 15 01614 g003
Figure 4. Better–worse coefficient chart.
Buildings 15 01614 g004
Figure 5. Bar chart on the degree of demand for facility items.
Buildings 15 01614 g005
Figure 6. Bar chart on the degree of service quality satisfaction.
Buildings 15 01614 g006
Figure 7. IPA quadrant diagram for rural public service facilities.
Buildings 15 01614 g007
Table 1. Importance identification table.
Positive and Negative Question OptionsDo Not Provide the Facility
LikeNaturally Not ProvidedIndifferentCan TolerateHighly Needed, Therefore Cannot Tolerate
Provide the FacilityLike33455
Naturally Provide23445
Indifferent22344
Do Not Like But Can Tolerate12233
Cannot Tolerate11223
Notes: 1—very unimportant, 2—not very important, 3—average, 4—relatively important, 5—very important.
Table 2. Priority of rural public service facilities.
Kano AttributesIPA QuadrantFacilitiesRaise PriorityMaintain Priority
MI9. Junior High School, 10. Primary School,11. Kindergarten, 14. Small Library (Reading Room), 17. Epidemic Prevention Station 1st
II12. Nursery, 37. Livestock, Poultry, and Aquatic Products Market, 38. Small Commodities Wholesale Market, 39. Local Specialty, Handicrafts, and Tourist Goods Market1st
III19. Children’s Welfare Institute, 35. Funeral Service Shop2nd
IV8. High School, 18. Nursing Home 2nd
OI1. Administrative Organ, 4. Police Station, 5. Construction and Land Management Agency, 7. Economic Service Station, 21. Savings and Loan Association, 23. Post Office, 24. Supermarket, 25. Drugstore 3rd
II13. Tech Station, 22. Insurance Institutions, Agricultural Cooperatives, 29. Public Bathroom, 36. Vegetables, Fruits, Grains, and Oils, Non-staple Food Markets3rd
III15. Community Health Center, 28. Grain and Oil Shop4th
IV16. Family Planning Service Station 4th
AI
II
III20. Disability Service Station, 27. Handicrafts and Souvenirs Shop, 30. Hostel, 31. Comprehensive Service Station, 32. Labor Service Station, 34. Motorcycle and Bicycle Sales Department5th
IV2. Village Committee, 3. Judicial Office, 6. Grain Management Office, 26. Bookshop, 33. Production Materials Sales Department 5th
Disclaimer/Publisher’s Note: The statements, opinions and data contained in all publications are solely those of the individual author(s) and contributor(s) and not of MDPI and/or the editor(s). MDPI and/or the editor(s) disclaim responsibility for any injury to people or property resulting from any ideas, methods, instructions or products referred to in the content.

