Abstract
Earthen construction is a sustainable alternative to conventional building materials due to its low environmental impact; however, both its mechanical strength and durability differ from conventional building materials. Different physical and chemical stabilization techniques are used to improve the mechanical properties of the incorporated elements, although these increase the carbon footprint. The present research focuses on studying mineral stabilization, specifically the incorporation of powdered steatite residues (PSRs) in matrices for the manufacture of earth blocks (EBs) to improve their physical, mechanical and thermal properties. Through an experimental study to analyze the EB, it is established that the use of this mineral as an aggregate in the different matrices studied registered the following extreme values: a reduction in porosity by 27.43%, an increase in bulk density by 3.73%, a 58.91% reduction in dimensional variation, an increase in compressive strength of 24.7% and in flexural strength of 41.2%, a 36.33% reduction in erosion, and a maximum extreme value in thermal conductivity equal to 1.48 W/(m·k). These results allow us to establish that the use of PSRs as a mineral stabilizer in the manufacture of EBs contributes to sustainability criteria and provides physical, mechanical and thermal improvements.
1. Introduction
One of humanity’s oldest and most widespread construction materials is earth; it is currently estimated that between 33 [1] and 50% [2] of residential buildings worldwide are constructed with this material, with most of them located in rural areas of Africa, Latin America, the Middle East, Asia and Europe [3].
Some of the main advantages of using earth as a construction material are that it is economical and sustainable, as it is versatile in its application due to its hygrothermal properties [4]. On the other hand, if compared to construction systems using concrete, it has lower resistance to mechanical stresses and efficiency regarding its exposure to humidity [5]; therefore, the need to improve these limitations requires new research into them. Some of the improvements already developed have been based on the application of various manufacturing techniques, the use of stabilizing compounds integrated with the earthen matrix or the use of additives.
In the case of the first improvement, one example would be compaction, which is commonly applied in earth blocks (EBs) and in rammed earth; this technique has achieved increases in density and pore reduction [6]. Similarly, increases in compressive strength (fc) of up to 79.43% and 75% have been reported in EB bending tests [7]. On the other hand, in the case of rammed earth, the increases in both density and fc are variable but correlative to a higher degree of compaction [8].
Regarding the use of stabilizers (fibers are the norm), it has already been shown that they reduce the density and thermal conductivity (λ) of the EBs to which they are added [9,10,11,12,13], while also contributing to increased tensile strength (ft), reduced shrinkage from drying and improved hygrothermal properties. However, this type of improvement depends on the type of fiber available in the area of production, demonstrating the need for a specific study to determine the different particular variables in relation to the effects generated on the properties of the EB, such as, for example, the characteristics of the fibers with respect to the mineral variability of the clay [11].
Finally, improvement by chemical stabilization (lime, cement, artificial stabilizers or other chemicals are commonly used) [14] in stabilized earth blocks (SEBs) establishes satisfactory mechanical performance results, with lower production costs than those of fired bricks [15]. Although their embodied energy, carbon dioxide (CO2) emissions in production and manufacturing costs are significantly higher than EBs [16], these disadvantages in SEBs are correlative to the resulting improved properties. Specifically, previous research has described mineral stabilization (in soils, clays, or elements such as EB) as generated by lime or cement reactions, or pozzolanic action [17]. The possibility of stabilization through the action of minerals [14] has also been described. This can appear due to the structure resulting from the ionic bonds between minerals [18], or by the Van der Waals forces [19] that are generated between the molecules of the new compound.
Therefore, the application of stabilizers in soils or earthen constructions, which increases the physical/mechanical properties and durability while also considering the principles of sustainability and production cost reduction, will generate opportunities for further research into alternative stabilizing agents. Among them, those of natural origin, such as mineral aggregates, are of special interest as they are compatible and meet the above application requirements.
One of the mineral aggregates of special interest is steatite, which was previously studied by Konta J. [20]. His research included a detailed analysis of clay varieties and their different uses, describing it as a non-expandable phyllosilicate belonging to the family of clay minerals. Other authors define it as a non-foliated metamorphic rock, of a sedimentary or igneous nature, with a talc content greater than 35%, containing chlorite, quartz, calcite, dolomite, magnesite, tremolite, amphibole, hematite and mica [20,21]. On the other hand, P. Storemyr [22] treats it as a synonym of talc, while others define it as having a high talc content [23,24,25,26,27]. Finally, other authors only highlight the similarities [20]. Konta [20], Cota et al. [25] and Baron [27] provide a chemical and mineral characterization based on origin, with the following general composition (see Equation (1), defined by [20] and [27]):
Mg3Si4O10(OH)2
On the other hand, Alami [28] and Hänchen [29] establish the varying ranges of some properties, such as density between 2.68 and 3.0 g/cm3; a λ of 2.5 W/m·K at 20 °C; thermal capacity between 2626 and 3182 kJ/m3 K, reaching a specific heat of between 980 and 1068 J/kg K at 20 °C; and a uniaxial fc of 10.1 MPa. Finally, it should also be noted that aspects such as esthetics (exterior finish color or tone) are parameters that can be altered or have variations (going from brown to green), as has already been established [26].
This mineral aggregate has several industrial applications, including as a component in paints, cosmetics, pharmaceuticals, insecticides, textiles and ceramics; it is also used in the construction sector and as a cementitious material [20]. It is most commonly used as rough stone in construction and in handicraft carvings. However, in each case, it must meet particular specifications of mineral content, purity, morphology and size, among others, which allow its ideal application to be established.
In particular, several authors have analyzed the properties of ceramics that include steatite residues [26,30]. For their efficient industrial application, these processes, such as crystallization, melting or dissolution (with the consequent energy cost increase that their significant carbon footprint entails), are required. These applications, where the transformation of their molecular structure increases their mechanical behavior, are ideal in the cases of special ceramics for dental use [31]. Their electrical resistance, thermal behavior, mechanical resistance and increase in density also make them suitable for use in electrical engineering [32,33,34,35]. In some studies, increases in density correlative to fc have been established [36], which have been linked to vitrification via the firing process and the addition of new minerals [37] (seeking to apply them in industrial ceramics with high replacement percentages).
In the field of construction, this mineral, along with clay compounds, behaves as a complementary cementitious material [38,39] and stabilizer [26], with reported increases in the bulk density and improvements in the mechanical behavior of the matrices containing it, while its apparent porosity is reduced [40]. Similarly, improvements have been registered in its behavior in water [41] and in its increased durability against damage caused by weathering [25]. The above, and other documented results, have validated the suitability of this mineral’s application in the restoration of historic buildings [24] as composites for the manufacture of gypsum board; it is also used in cement and wood [42] and to improve durability in concrete [43]. However, there are also studies [39,41] that established losses in mechanical strength at a certain replacement percentage, and the research of S.C. Gnanaraj et al. [44] reported worse performance in the properties of fresh concrete.
Regarding aspects of the feasibility of its use, it is necessary to analyze its availability; it was found that the discarded waste derived from its extraction was between 60 [45] and 75% [24]; it was possible to recover almost all of this through standardized procedures of magnetic separation, flotation and leaching [45].
Therefore, if the parameters of the combination of clay soil, steatite (in its powder form) and water are considered, subject to specific natural conditions, such as environmental temperature, natural drying without firing, or matrix sintering (from steatite to enstatite), under these conditions, the resulting matrix does not show a significant chemical or pozzolanic reaction, like lime or cement. However, the contribution of particles (present in steatite) has the ability to form ionic bonds between the molecules of clay particles and water [46,47] and maintain a stable structure as a result of Van der Waals forces [19]. In addition, steatite can also help in plastic and shrinkage properties [48] and lead to improvements in the thermal behavior of the matrices that incorporate them [28], as evidenced by research in other thermal applications [49]. This could lead to the stabilization of the matrices during mixing and drying, and contribute to the mechanical and thermal properties of the matrix.
This research focuses on studying the use of raw steatite waste as a possible stabilizing mineral aggregate, capable of improving mechanical resistance, shrinkage and thermal properties in clay matrices, from which an EB might feasibly be made. This proposal for a new material to constitute an EB is valid if one considers the abundant amount of waste generated from its mineral extraction, including steatites that are not suitable for industrial use, as a sustainable, compatible and alternative mineral aggregate and stabilizer, which can be integrated into an EB. This alternative is a solution for stabilizing the matrices applied in traditional construction solutions.
2. Materials and Methods
2.1. Materials
For this research, powdered steatite residue (PSR), clayey soil (E) and water were used to make up the materials used in the study matrices. The PSR was formed from pieces of steatite provided by an industrial stone company for carving and handicrafts; these originated in pieces and waste from artisanal carving and construction. To guarantee the conditions of sustainability and allow their replication in traditional construction with these materials, it was decided not to subject them to incineration or sintering, nor any other treatment that generated gas emissions or increased their carbon footprint during the manufacturing or production process.
To avoid biases linked to the uniformity of the samples themselves (constitution, texture and particle size), the rocks (Figure 1a, with sizes between 2 and 20 cm, and chromatic variability) were ground using the Los Angeles Abrasion machine, “Mecánica Científica” brand, originating from Madrid, Spain (Figure 1b), with a load of 11 balls of 47 mm and 5 balls of 25.35 mm diameter for 30 min cycles, and from each cycle, only material with a particle size of less than 0.25 mm was extracted. From the results of the previous process, a material with particle distribution and color was obtained, as shown in Figure 1c.
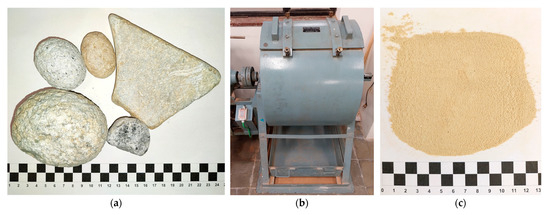
Figure 1.
(a) Steatites before grinding, (b) Los Angeles Abrasion machine, (c) resulting powder (PSR).
The E used for this study proved to be suitable as a raw material in the manufacture and constitution of EBs, which have been studied, described and validated in previous research [50].
The granulometric analysis of the PSR is shown in Figure 2 (in red), in which the high content of fine particles is highlighted, a product of the grinding. The graph also includes the profiles of maximum and minimum limits described in UNE 41410 [51] and ASTM C144-18 [52] (with dashed gray lines), which have also been indicated as ideal in other studies [53,54]. Once the granulometry of the PSR was obtained, the Fineness Modulus (FM) was determined, which was 1.47. From this, its specific gravity (991.42 Kg/m3) of ASTM C128-22 [55] was also obtained.
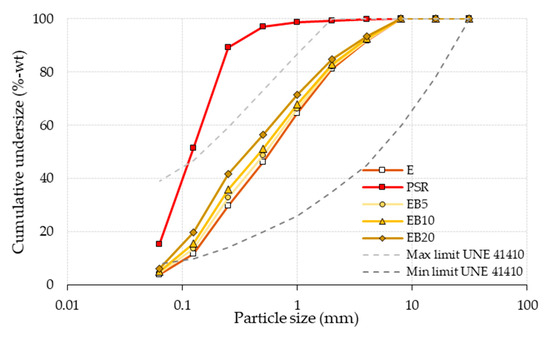
Figure 2.
Granulometry of E, PSRs and the different study dosages (see Table 1). Note: E data from [50].
Next, PSR characterization tests were performed on samples of screened material with particle sizes less than 400 μ (UNE 7050-2 standard) [56]. Among these tests were the Atterberg limits (defined as the states of liquid and plastic consistency in particular conditions of Moisture Content (MC)) determined according to the UNE-EN ISO 17892-12:2019 standard [57] (See Figure 3). These showed values of 24.79% of MC for the Liquid Limit (LL) and 28.62% of MC for the Plastic Limit (PL), both highlighted in the graph. The shrinkage of the PSR with MC in LL was also determined according to the AS 1289.3.4.1-2008 [58] standard, resulting in a value of 1.56%, which classifies it as a soil with a low, or reduced, shrinkage index [59,60,61].
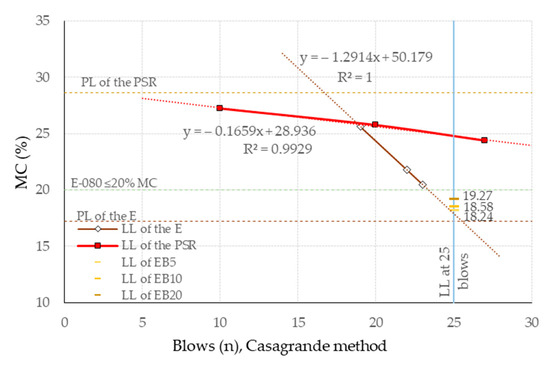
Figure 3.
Comparison of the Atterberg limit test for E and PSR. Data on LL and PL of E from [50].
The replacement of the PSR by E for the conformation of the new matrices was determined by analyzing the trends in the behavior of the physical/mechanical properties of these matrices with respect to similar previous research [53,62,63,64,65,66], where the criteria were defined according to the changes in their behavior in terms of minimum, optimal and maximum replacements.
For this research, the PSR was considered the stabilizing additive [51], so a maximum replacement content of up to 20% by weight was established, as mentioned by [41], PR XP P13-901 [66] and Gnanaraj et al. [44], with values of 5 and 10% (minimum and intermediate replacement). In addition, a control matrix is made as a comparative reference sample, consisting of an EB without PSR content. It should be noted that in the hypothetical maximum case of the replacement of the PSR by E (using these materials), the maximum admissible content, without exceeding the upper limit of the regulatory particle size profile, could even reach 49%.
The proportions of the matrices are indicated in Table 1, in which the following nomenclature of matrix identification is established: EBX, where EB refers to earth blocks and X indicates the percentage of E replaced by the PSR.

Table 1.
Proportions of the study matrices.
The water used complies with RD 3/2023 [67] (drinking water), as confirmed by Aigües de Barcelona; additionally, the E-080 [68] standard for the manufacture of EB (adobe) classifies it as drinking water and suitable for use.
To determine the MC in the proportions of the study matrices, an interpolation of the LL for the E and PSR was considered (Figure 3); it was also considered that this would provide a mixture with a suitably workable consistency. In the specific case of the PSR, the MC obtained for LL is consistent with the previous results of Viñas, M. presented in [48]; the others are also consistent because they are below the maximum value for EB (MC ≤ 20%) of the E-080 standard [68]. These results were contrasted with the MC obtained from the consistency test of the clay content of the E-080 standard [68] (Figure 4), resulting in lower values. This ratifies the interpolation values, as they are between the LL of E and the maximum established by this regulation. It should be noted that high values of MC will lead to difficulty in the manufacturing process (shrinkage during drying), and low values may cause difficulty in workability.
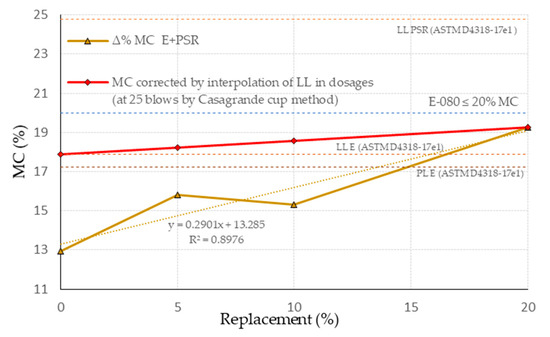
Figure 4.
Ratification of the MC by interpolation of LL of each dosage with respect to the consistency values of the benchmark test.
2.2. Methods
The first phase of the applied methods involved defining the PSR used; the properties studied and the standards applied are presented in Table 2:
Table 2.
Properties of PSR studied and dosing procedure.
The second phase consisted of manufacturing specimens by using optimized traditional methods: pre-homogenization of components, resting period to standardize hydration, manual pouring and molding of specimens, and protected slow drying. A mechanized mixing process was chosen in order to standardize the process, using a Guy Noel brand electric concrete mixer, model B150, 150 l capacity, 25 rpm, from Ambérieu-en-Bugey, France, applying the parameters of use established in previous research [50]. Once the mixing was completed, the resulting mixture was left to rest for 24 h to achieve optimal hydration.
Once hydration was finished, the material was poured into molds with previously moistened inside walls. Molding was performed manually by adding layers of approximately 2 cm thickness until it was filled; finally, the surface was leveled off using a trowel.
The specimens were dried and slowly cured (protected from wind, sun and weather) for a minimum of 90 days after molding, after which it was considered they have reached the dry condition by determining MC. The range of final values obtained from all samples was 1.94 ≤ MC ≤ 2.35% (range of variation with which all experimental properties were determined). Wooden molds with waterproof coating are shown in Figure 5, and the manufacturing process is shown in Figure 6. Examples of the different specimens produced and their dimensions are shown in Figure 7 (specimen types a, b and c were manually polished on their six sides using 80 and 180 grit sandpaper).
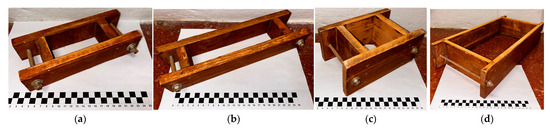
Figure 5.
Common molds for EB specimens (internal measurements): (a) 5 × 5 × 10 cm, (b) 5 × 5 × 20 cm, (c) 10 × 10 × 10 cm, (d) 10 × 20 × 40 cm.
Figure 6.
EB specimen manufacturing process: (a) homogenization of materials, (b) pouring into molds, (c) protected drying.
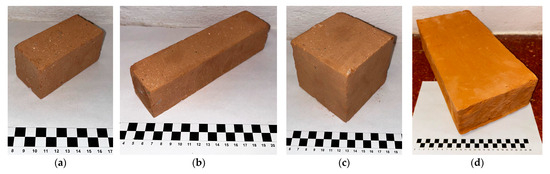
Figure 7.
Types of specimens produced: (a) 5 × 5 × 10 cm, (b) 5 × 5 × 20 cm, (c) 10 × 10 × 10 cm, (d) 10 × 20 × 40 cm.
Finally, the third phase involved the experimental evaluation of the properties, which complied with the applicable regulations of the following tests and the particular criteria of each test:
- Bulk density, apparent solid density, and porosity, UNE-EN ISO 18754:2022 [73]: With immersion in alcohol, applying to four type (a) specimens and considering their maximum, minimum and average results.
- Hygroscopic expansion, based on a previous study [50] that considered ASTM C426-22 [74], UNE-EN 1367-4 [75]: Applying it to four type (b) specimens, considering all the results and obtaining the average of each variable.
- Capillarity by moisture absorption: The UNE-EN 771-4:2011+A1:2016 [76] and UNE-EN 771-5:2011+A1:2016 [77] standards were applied, adapting them to EB, and tested on six type (c) specimens.
- Compressive strength (fc), using adaptations of the ASTM C39 [78], ASTM C-67 [79], UNE-EN 772-1:2011+A1:2016 [80] and E-080 [68] standards: The use of a 5.4 mm neoprene sheet and a 9 mm metal plate was considered for the test, which would guarantee a load distribution on both sides of the load application, with the charging application speed set at 3 N/min. Six type (c) specimens were tested, considering all the results and obtaining the average of the six. The equipment used was a multi-assay press by Mecánica Científica SA, with a capacity of 300 KN.
- Three-point flexural strength (fb), ASTM C-67 [79] and ASTM C1161-13 [81] standards were applied, and six type (d) specimens were tested, considering all the results and obtaining the average of the six. The equipment used was the same for the compressive strength test, with the following configuration: two metal cylinders (Φ = 40 mm) as lower support points at an axial distance of 30 cm and centered on the specimen; in the upper part, another support point was also centered on the specimen.
- Ultrasonic elastic modulus (UEM), ASTM e 1876-01 [82] and UNE-EN 14146:2004 [83]: Four type (b) specimens were used, reporting the average of each variable. The test followed the guidelines of the previous study [50]. The instrument used was a Proceq brand, Pundi Lab (+) model.
- Thermal conductivity was performed following [84]: Thirteen specimens were used per variable, separately considering the average of the vertical and horizontal faces, as well as that of both together. The probe used had a thermal capture range between 0.3 and 2.0 W/m·K, and the specimens were previously conditioned for 24 h in a climatic chamber at 20 °C with a relative humidity (RH) between 20 and 40%. The test was carried out by introducing each specimen and the probe under a protective acrylic capsule of thickness e = 4.40 mm to avoid errors due to air flows or temperature changes. The determination of the reference value is based on the transient principle of the hot wire by detecting the temperature on the contact surface with the probe. The equipment used was a QuicklineTM-30 conductivity meter, Applied Precision probe and CCI for the climatic chamber. Figure 8 shows the configuration of the test performed.
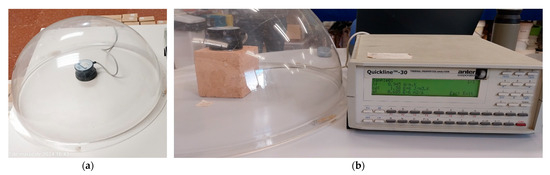 Figure 8. Equipment for determining λ. (a) Probe and protective capsule, (b) conductivity meter and test specimen configuration.
- Drip erosion, applying the NZS 4298:2024 [85] standard and its configurations: 100 mL of water by drip set at a height of 40 cm, impacting the face of a block positioned with a 2:1 inclination and in a test time of no less than 20 min; six type (d) specimens were tested, reporting the minimum, maximum and average values.
- Thermogravimetric analysis (TGA) and chemical composition: This was carried out using a Netzsch thermogravimetric analyzer, model STA 449 F5 Jupiter from Selb, Germany, establishing a range of temperatures (T) from ambient T to T = 1000 °C, with a constant heating rate increase of 10 °C/minute, and subjecting the test to a hydrogen atmosphere. The samples (5 g) for this test were obtained by sectioning representatives of the sizes produced by manually crushing a specimen.
- Chemical identification: Energy-Dispersive Spectroscopy (EDS) analysis coupled with a Scanning Electron Microscope (SEM), JEOL brand, model JSM-6510 (Jeol Ltd., Tokyo, Japan) was used. The SEM used was a JSM-7001F Jeol Field Emission Scanning Electron Microscope, using the Oxford INCA version 4.15 software for the EDS. The samples used were specimens with a size of 2 × 2 × 1 cm cut from EBs using a diamond saw and then embedded in epoxy resin. After hardening, the surface to be studied was subjected to a metallographic polishing process in order to remove scratches and deformations, leaving the surface flat and highly reflective. Finally, the surface was then coated with a thin layer of carbon to improve the sample’s conductivity, prevent charge accumulation on the surface and thus obtain higher-quality images.
- The optical image analysis (OIA) used the Image-Pro v. 11.0.4 Build 9821 software; the images of the analyzed samples were obtained from those used for SEM before being coated with carbonite.
- Regarding the statistical study of the data obtained, the Statistical Software Package for Social Sciences (SPSS) v. 29.0.0.0 (241) software was used, and the Solver version 2025 Q1 software was used 86 for the numerical regression adjustment study.
3. Results
3.1. Bulk Density, Apparent Solid Density and Porosity Test Results
Figure 9a shows that, taking the EB0 matrix as a reference, the EB5 matrix will establish an increase in its bulk density of up to 3.73%. However, for the EB10 and EB20 matrices, despite the fact that there is a low direct correlation between this property and the replacement of the PSR, it shows an average increase of only 0.6%. This is attributed to one of two possible hypotheses: (a) the PSR with a high content of fine particles serves as a “filling” material for existing pores, which creates a denser matrix. On the other hand, once all the available porosity is filled, further increases in PSR content do not have the same effect as in the EB5 matrix (see Figure 9b); (b) the PSR material has a chemical reactive capacity that creates new, denser structures in the matrix, and this reactivity—with high PSR values—is reduced by the possible depletion of the reaction’s activating component (See Figure 9c).
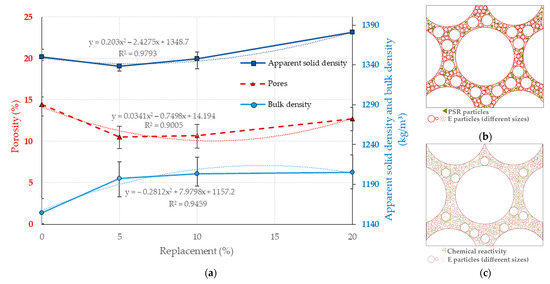
Figure 9.
Effect of PSR replacement on the physical properties of the study matrices. (a) Porosity, apparent solid density, and bulk density for different percentages of PSR replacement. (b) Schematic of the hypothesis in which PSR serves as filler particles for existing pores. (c) Schematic of the hypothesis in which PSR material has the chemical capacity to form new structures. Note: Data EB0 from [50].
The addition of the PSR reduces the porosity of the EB5 matrix with respect to EB0 by 27.43% (see Figure 9a); this establishes a positive correlation that was evaluated at 1.21% more for EB10 and 12.18% for EB20 (always with regard to EB0). The above behavior has as its origin the following hypothesis (see Figure 9b,c): (c) once the pores are filled with filler material (PSR), or once their chemical reaction capacity to form new compounds is exhausted, the increase in the PSR content will lead to an overdose that produces a binding effect in the PSR, which replaces larger particles of E; this will result in an increase in porosity, this time only between the particles of the PSR.
Taking EB0 as a reference, the apparent solid density (see Figure 9a) of the EB5 and EB10 matrices established lower values (0.88 and 0.19%, respectively, with ranges of variation between them); however, for the EB20 matrix, there is an increase of 2.28% with regard to EB0. For the latter matrix, its behavior is supported by the higher density of steatite rock [29].
The behavior of physical properties shows a relationship in their curves, which, in bulk density, is in the opposite direction to the other two, while porosity and apparent solid density have a similar correlative layout.
3.2. Results of the Hygroscopicity Dimensional Variation Test
Three phases of dimensional variation (∆Length) by hygroscopicity are identified: Phase 1, which comprises the matrices in a “dry condition”, which was established after being subjected to oven drying with a constant temperature of 100 °C for 24 h. The matrices with PSR content manage to approximate their MC to zero (average MC of 0.06%); however, the EB0 matrix does not (MC = 2.8%), which is explained if we consider that the PSR has an interlayer hydrophilic reduction, which makes it difficult to moisten or absorb water [20].
Phase 2 was established in each matrix with a condition of temperature (T) and relative humidity (RH) to the environment equal to 21 °C and 46% RH in a constant weight condition (no weight variation). In this phase, a ∆Length was established with an inverse correlation to the increase in the PSR; the proportions of ∆Length were 34.10, 48.06 and 58.91%; for MC, they were 4.44, 8.88 and 25% for EB5, EB10 and EB20, respectively, with regard to the EB0 matrix (dry weight of the matrices are with reference to Phase 1). This phenomenon is grouped by study matrices in ranges that show an inverse correlation between the content of the PSR and MC, as shown in Figure 10a (the larger markers for each matrix identify the average value of the same), attributable to both the lower absorption capacity of MC (typical of the PSR) (see Figure 3) and to its lower shrinkage (1.56% with MC in LL) compared to that of E = 5.33% [50].
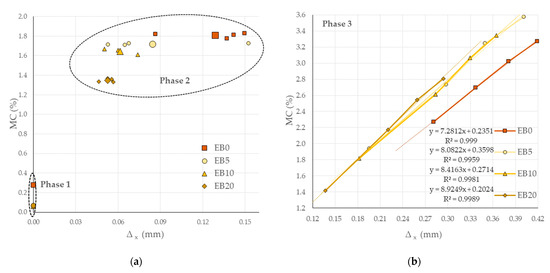
Figure 10.
∆Length product of MC. (a) Phase 1 (dry condition) and Phase 2 (ambient condition); (b) Phase 3 (wet chamber; average of four tests per matrix). Note: Data EB0 from [50].
In Phase 3 (see Figure 10b), the results show that with low MC, the EB0 matrix has higher ∆Length values, while with high MC, the EB5 and EB10 matrices (low PSR contents) have similar ∆Lengths to this, and the EB20 matrix (high PSR content) will establish lower ∆Length values.
Considering the overall behavior of each Phase 3 matrix for the different test days, linear regressions are the best fit, evidencing their direct and high correlation (R2 ≥ 0.99 in all cases). Analyzing the coefficient of the slope (s) of the regressions (7.28 ≤ s ≤ 8.92, with a standard deviation σ = 0.6899), it can be established that they are close to each other, which is correlated with the percentage of the PSR contained in each study matrix.
On the other hand, the distance of ∆Length between consecutive points of each matrix decreases with the duration of the test; however, matrices with PSR content accelerate the hydration process up to five times more on average than the EB0 matrix (which has a difference between equally sensitive consecutive points).
3.3. Capillary Test Results
Due to the impossibility of using the specifications prescribed in the reference test [76,77], as the specimens showed irregular disintegration above the minimum height established for the submerged height of the specimen in water, it is not feasible to determine the absorption of the MC by mass (loss of mass in the test). Therefore, the measurement procedure determined in previous research was considered [87]. In order to set a parameter related to capillarity, the capillary ascension advance front of the specimens’ external faces was established, determining the average height (H) of the equidistant points measured at the test duration of 0, 5, 10 and 30 min. The results of the above procedure are presented in Figure 11.
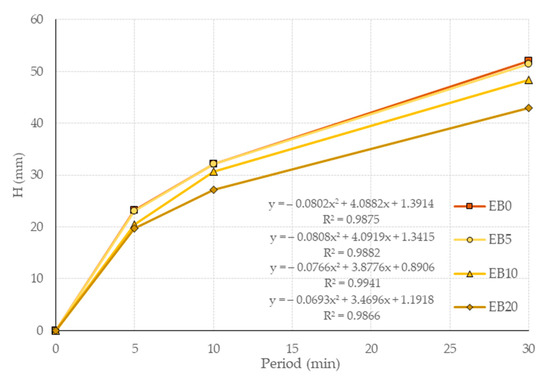
Figure 11.
Capillary ascension advance speed curves.
It is determined that for EB0, the ascent speed H is higher than for the rest of the matrices, which in the different test durations were as follows: (0.72, 11.51 and 15.11%), (0.00, 4.66 and 15.54%), (0.96, 7.05 and 17.31%); each parentheses is in regard to the duration of the test, and in parentheses with respect to the study matrices. This behavior is attributed to the low-absorption nature of the PSR, which affects capillarity, which, in turn, is related to the porosity of the matrices.
With regard to the above, matrices with the PSR should not be used in exposed and outdoor elements (E-080 [68]) or in direct contact with humidity (UNE 41410 [51]); nevertheless, the results establish that the PSR reduces the rate of water absorption via contact.
3.4. Compressive Strength Test Results
Figure 12 shows the simple compression results for each of the study matrices; the graph shows the mean value of six specimens for each matrix with a red line and its mean confidence interval of 95% (CI) with a dashed line. The results of the axial compression test establish an incremental trend for the EB5 and EB10 matrices of 9.1 and 9.6% with respect to EB0. In both study matrices, two specimens reached the maximum fc values of all those tested (3.67 and 3.77 MPa, respectively, 21.3 and 24.7% more than EB0). On the other hand, the average characteristic value of the EB20 matrix (2.7 MPa) positions it as the matrix with the worst fc results (9.4% lower than EB0), with the worst result of one of its specimens being 2.3 MPa.
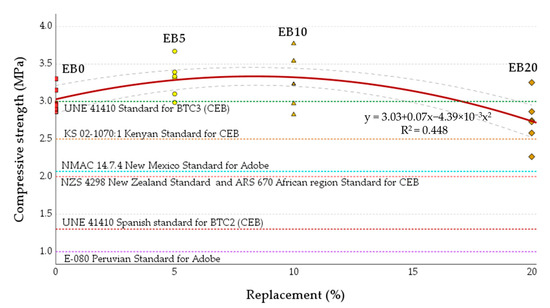
Figure 12.
Results of the compression test for the different study matrices in line with the different minimum limits of the reference regulations. Note: Data EB0 from [50].
As a validation criterion, the minimum acceptable fc values of the international standards available for compressed earth blocks (CEBs), SEBs and adobe were considered. Among these are the Spanish standard UNE 41410 (SEB and CEB comply as BTC2; in the case of BTC3, only the average values of each of the EB0, EB5 and EB10 matrices manage to comply) [51], the Kenyan standard KS 02-1070 (for CEB, meeting the average value requirement) [88], the New Mexico standard, USA NMAC 14.7.4 (for adobe, complying with the requirement) [89], the New Zealand standard NZS 4298 (for CEB, meeting the average value requirement) [85], the African standard ARS 670 (for CEB, complying with the requirement) [90], and the Peruvian standard E-080 (for adobe, complying with all requirements) [68] (see Figure 12).
The behavior of this property is directly linked to the density of each matrix and inversely to porosity (both properties are linked in turn to the PSR content). Specifically, the results of this property are explained by considering that, in regard to EB0, the EB5 and EB10 matrices show improvements in their fc results due to the increase in the PSR’s inherent cohesive forces. On the other hand, the EB20 matrix experiences a loss of fc not only with respect to EB0 but also to the other matrices; this decrease is due to the excess addition (overdose) of the PSR, which generates an inadequate interaction between the PSR and E. The above comments have also been made in previous research [41], in which reductions are established in the fc of specimens when matrices are constituted with replacements of more than 25% of the PSR.
An analysis of the failure planes was performed on the specimens that were tested under simple compression; Figure 13 shows representative examples of each study matrix after having taken them to failure. The predominant failure mode of all the matrices was the “hourglass-shape”, inverted pyramids with a vertex in the center of the specimens, suggesting that the transmission of the applied load is carried out correctly through the central axis of the cube.
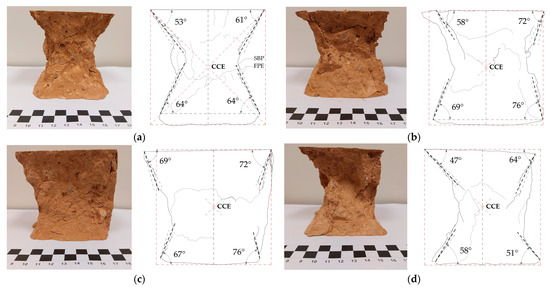
Figure 13.
Typology of the fault planes in the prisms tested at simple compression. (a) EB0, (b) EB5, (c) EB10 and (d) EB20.
The main fracture occurs through the desquamation of the cube’s lateral faces, being minimal at the edge forming the vertical and horizontal face of the cube (see an example of the Fault Plane Edge point (FPE) in Figure 13a) and maximum in the central area of the cube (Center of Crossing of Edges point (CCE)). This type of fault is the result of the concentration of stresses in the central core of the cube, the product of the transmission of longitudinal and transversal deformation stresses [91].
The fault planes of the specimens were determined by bisecting the lines that start in the horizontal plane of the cube (or its projection) with the intersection at the bottom edge of the specimen after testing (Start of Bisector Plane, SBP). Once the fault planes and the interior angle they form with respect to the horizontal were obtained, the average angle of fault planes (AAFP) for each matrix was determined, resulting in the values of 60.5°, 69.0°, 71.0° and 55.0°, respectively. The above values are correlated with the results of the mechanical behavior obtained; the relationship identified is that low AAFP values (failure with maximum lateral desquamation) will occur in matrices with low mechanical properties, and the reverse happens when the matrices obtain better results (failure with minimal lateral desquamation).
3.5. Results of the Three-Point Flexural Strength Test
Figure 14 shows the results of this property (the average values, CI and minimum permitted limits follow the representation guidelines established in Figure 12). Regarding the EB5 and EB10 matrices with reference to EB0, they establish an increase in the mean and correlative values of the PSR content, with a maximum value of 1.92 MPa for EB10 (41.2% higher than EB0). The EB20 matrix showed losses of resistance, establishing its average below EB5 and EB10 but significantly higher than that of EB0. The general behavior of the results of this property is considered in line with that of fc; on the other hand, the results of this property—for the different study matrices—are above the requirements of the NMAC 14.7.4 (fb = 0.345 MPa) and E-080 (ft tensile test = 0.08 MPa) standards. This can be summarized by indicating that all these results show greater cohesion of the tested matrices linked to the PSR replacement and therefore lead to increases in this flexural property.
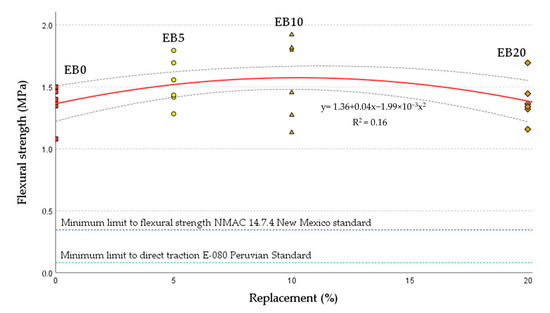
Figure 14.
fb results for the different study matrices in line with the different minimum limits of the relevant regulations. Note: Data EB0 from [50].
3.6. Ultrasonic Elastic Modulus Evaluation Test Results
To determine the elastic modulus by ultrasound E∂, the procedure detailed in previous work [50] was followed, which requires the use of Poisson’s coefficient μ (constant of longitudinal deformation with respect to the transverse). This was selected from previous works [92,93,94], with Miccoli [93] being chosen because it is of similar parameters (fc and behavioral trends of the study matrices) to those presented here (the selection process required statistical evaluation of the numerical regressions of data from previous studies, coupled with those of this study). The values selected were μ = 0.401, 0.386, 0.385 and 0.417 for EB0, EB5, EB10 and EB20, respectively. With μ established, the reference regulations [82,83] were applied, resulting in values of E∂ for the study matrices with a variation range of 1.85 ≤ E∂ ≤ 2.81 GPa, consistent with other research [92,93,95,96]. Figure 15 shows the average value of four specimens and their variation range for each matrix; these values are in harmony with the mechanical strength properties presented above. It is considered that the behavior E∂ is correlated with the bulk density of the study matrices, which, in turn, is correlated with respect to the replacement content of the PSR, since the matrices improve their E∂ when their bulk density increases, and the opposite occurs when it decreases (sound waves travel better, faster and more uniformly in dense and low-porosity materials). This same connection does not arise in the EB20 matrix, where the lowest value of E∂ is presented.
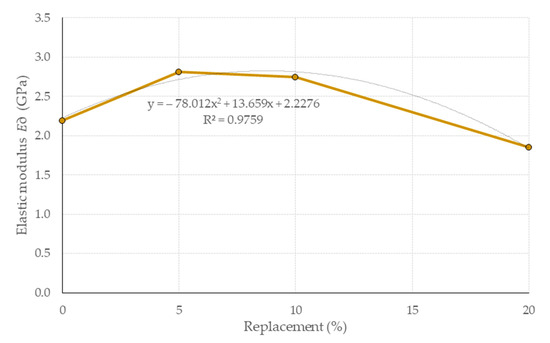
Figure 15.
Results of E∂ for the different study matrices with respect to the study matrices. Note: Data EB0 from [50].
3.7. Thermal Conductivity Property Evaluation Results
Given that λ is one of the determining properties in the thermal behavior of a material, since it estimates its heat energy transfer level, it is of interest in the case of construction elements forming the external barriers of a building, as in the case of the EB in this research.
The results of λ (see Figure 16) show increases correlative to the replacement of the PSR in the matrices. The maximum value recorded was 1.48 W/(m·k), which corresponds to EB10 and represents an increase of 54.16% with respect to the mean established in EB0 (and 37.5% if the means of both matrices are compared). This behavior is similar in the other two matrices with PSR contents and with reference to EB0.
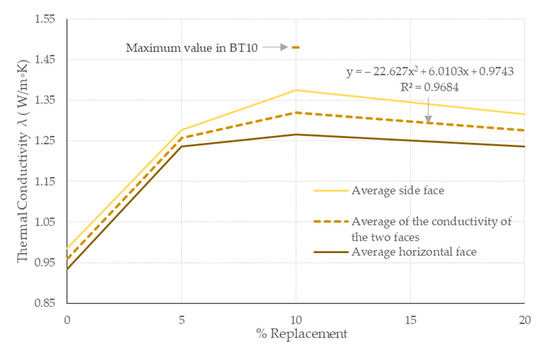
Figure 16.
λ for the study matrices measured on both sides of their determination. The regression and the ranges of variation correspond to the curve of the mean of the two sides of the study.
For each specimen in the test, its λ is determined on two sides of each study specimen (horizontal face in the molded direction and one of its lateral faces). The results of both sides indicate a difference in their obtained λ values, with the lateral faces reaching up to 6% more on average for all the study matrices. This variation is attributed to the manufacturing process of the specimens themselves (molded by consecutive horizontal layers of approximately 2 cm thickness), which causes the samples to be anisotropic. This behavior should be considered for the use of EB for hygrothermal purposes. On the other hand, it can also be established that the incorporation of PSR will represent an increase in λ (regardless of the face used for its determination), which could lead to a greater heat energy gain in a wall that was constructed with EBs that integrate the PSR in their matrix. This confirms that the PSR has λ capacity, as established by other researchers [28,29], and therefore its degree of substitution in EBs will increase this.
3.8. Erosion Test Results
Figure 17 shows the results of the erosion test and the established limit of the NZS 4298 standard [85]. The EB0, EB5 and EB20 matrices establish average percentage increases of 32.67, 33.67 and 14.33% with reference to EB10, while EB10 exceeds the requirement. This behavior can be attributed to the following: In the case of the EB0 and EB5 matrices, it is governed by the high E content, which has a high solubility in water. In the case of the EB10 matrix, its acceptable behavior is the result of having adequate cohesion between particles [97,98] produced by both components and because it is difficult to moisten the PSR or for it to absorb water [20]. Finally, in the case of the EB20 matrix, the two previous effects are also present; however, the overdosage of the PSR will also produce a reduction in cohesion between the particles in the matrix [41], which will become the predominant effect.
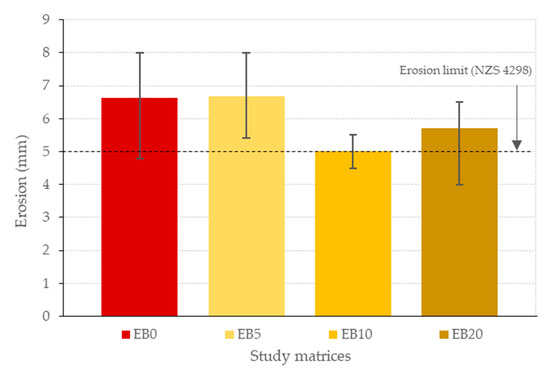
Figure 17.
Erosion for the study matrices.
3.9. TGA Results
Five stages were identified for the study of the TGA results, linked to different phases (DP) of water loss or the compounds’ feasible mass loss due to the effects of temperature, which coincide with the changes in the derived curves (dTGA) coming from the TGA curve (See Figure 18).
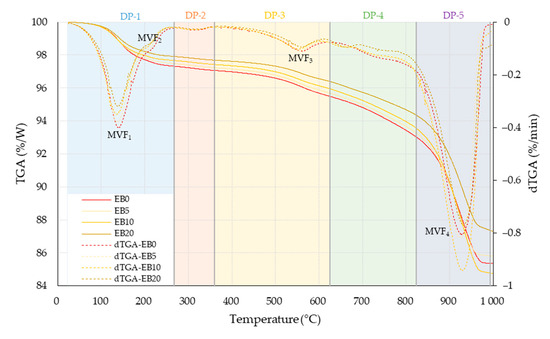
Figure 18.
TGA and dTGA curves for the matrices studied. Note: Data EB0 from [50].
In the DP-1 range, a Temperature Variation (TV) is established around ambient temperature ≤ TV ≤ 268.75 °C; this range includes two Minimum Valleys of the Function (MVF), the first of which is located at MVF1 = 138 °C, and the other at MVF2 = 209°. These are related to the loss of surface and interlayer water [99,100,101]. Applying the integration method by parts, the area above the curve of the TGA graph (%/W-°C) was determined and a percentage comparison was made with respect to EB0 (all comparisons are made with respect to it), obtaining the following values: –5.06, –10.04 and –20.67% for EB5, EB10 and EB20, respectively (always in this order).
DP-2 is established in the range of 268.76 °C ≤ TV ≤ 360.34 °C. In this DP, no mass changes are established that generate a MVF in the dTGA curve for all matrices; DP-2 is linked to the decay of organic matter [99,100,102]. The area losses established in DP-2 were –5.07, –11.77 and –21.49%.
Then, DP-3 is located at 360.35 °C ≤ TV ≤ 625.65 °C. Its generation is related to the dehydroxylation of clay (illite, vermiculite, chlorite and kaolinite) [99,101,102,103] and the disintegration of magnesite (Mg CO3) into periclase (MgO) and carbon dioxide [24]. DP-3 has an MVF3 at 560 °C, which is associated with the change from quartz type α to quartz type β [100,101,104]. Finally, the relationships of the areas for each matrix were –5.23, –11.36 and –21.21%.
Next, DP-4 is identified at 625.66 °C ≤ TV ≤ 823.48 °C; this is related to the decomposition of magnesite, calcite [100,101,103] and dolomite [105] (MVF is not identified). The areas were –3.67, –8.39 and –18.63%.
Finally, DP-5 was identified at 823.49 °C ≤ TV ≤ 993.61 °C; the most significant MVF4 is established, indicative of the maximum disintegration of matrix components. Its origin is linked to the endothermic disintegration of carbonates (calcite, kaolinite and dolomite) [100,102,103] and clayey materials [99,101,103]. It is also linked to the crystallization of cristobalite in silica, magnesium metasilicate and the stable polymorph of enstatite [31,34]. The comparison of the areas results in the following values: –1.00, +0.51 and –15.97%.
Without considering the DP identified above, and comparing the total areas above the TGA curves (ambient °C ≤ TV ≤ 993.61 °C), the following values are established: –3.07, –5.45 and –18.16%.
The behavior of the losses in areas identified in this test for the different matrices can be linked to the mineral composition of the PSR, maximizing its effect in relation to the percentage of PSR replacing E (more evidently in EB10 than in EB20), and its lower decay in DP at high temperatures (in particular for DP5). Finally, considering the general total behavior of the matrices studied for the full range of TGA test temperatures (ambient °C ≤ TV ≤ 993.61 °C), it can be said that all matrices incorporating the PSR, regardless of the replacement percentage, will have a better reaction to high temperatures. This will also be directly correlated with the percentage of the PSR replacement by E.
3.10. Chemical Identification Using EDS
EDS analysis is a technique used to identify and establish relationships in the chemical elements present in a sample. This information is obtained after an electron beam bombards a small area of the sample, resulting in the electrons being excited. The excitation of the photons establishes a characteristic spectrum; this is detected by the EDS detector, which measures the energy of the excited electrons. The equipment’s software generates a spectrum made up of energy peaks in KiloelectroVolts (KeV), associated with each element. The height of each peak indicates the relative amount of the element in the sample study area.
Table 3 shows the results of the chemical basic elements identified by the EDS in the different study matrices. The results are shown in percentage by weight (%W) and atomic percentage (%A). The elements identified were carbon (C), oxygen (O), sodium (Na), magnesium (Mg), aluminum (Al), silica (Si), potassium (K), calcium (Ca) and iron (Fe).
Table 3.
Basic chemical elements identified in each study matrix.
Similarly, Figure 19 shows the various spectra obtained from the matrices studied; here, each obtained spectrum has been moved on the vertical axis in order to identify the detection alignment of each basic element (B–E), its intensity (peak size) and its relative position caused by KeV.
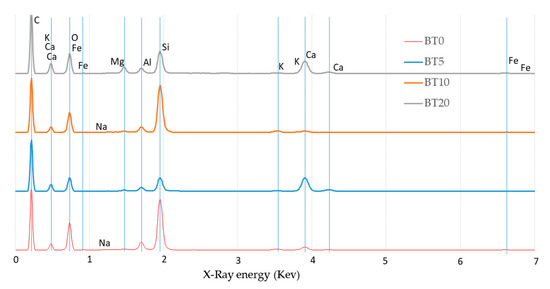
Figure 19.
EDS spectra for the study matrices.
With the peaks of the B-E identified in the spectra of Figure 19, the software associates them with the following compounds: C is associated with calcium carbonate (CaCO3), O and Si with silicon dioxide or quartz (SiO2), Na with albite (NaAlSi3O8), Mg with magnesium oxide (MgO), Al with aluminum oxide (Al2O3), K with feldspar MAD-10 (KAlSi3O8), Ca with wollastonite (CaSiO3) and Fe is iron.
The presence of these compounds, particularly CaCO3 (see maximum peak in Figure 19), can explain the increases in the observed mechanical properties. These may be due to the establishment of ionic bonds by the partial dissolution of CaCO3 in water and the addition of CO2 of possibly environmental origin, which forms the bicarbonate compound Ca(HCO3)2. This reaction over time could favor carbonation, which would act as a physical binder to cement the particles [97], and hydrated oxides of iron and aluminum, which can bond particles into water-stable aggregates [97] (with possible oxides present in the peaks at 0.7 and 1.7 Kev).
In the case of MgO, if even a low solution occurred, it could form Mg(OH)2 (as shown by Venkatesh [41]), having an adverse effect on the mechanical properties; in this case, it is correlative to matrices with high PSR content such as EB20. However, it is directly related to the increase in thermal conductivity values, since this compound is capable of heat storage, as established by previous research [106,107,108].
Another compound with a lower significance may occur with Al2O3, which has heat transfer properties, as evidenced in other research [109,110]. This could generate Al(OH)3 in the presence of a soluble with low hydrogen potential (pH) and form part of the cementing action [111].
The increase in mechanical properties could also be linked to the degree of total cohesion resulting from the interaction of all the compounds: atomic interactions that include Van der Waals forces, electrostatic interactions and harmonic bonds of hydroxyl groups, as mentioned by Li-Lan [112], as well as cementation between particles and the action of chemical bonds [113].
Finally, the presence of potassium oxide proves the illite-type clay content, coinciding with the TGA results, with the iron oxide content giving the “reddish” color to the matrix, and the calcium oxide, which is also related to the increase in mechanical properties [9,114].
3.11. Microstructural Components of the EB
An optical image analysis (OIA) study was conducted in order to establish aspects of the microstructure of the EB and the possible relationship of its physical, mechanical and thermal behavior. In this case, the guidelines and parameters indicated in a previous study were followed [50]. The images obtained were produced in Joint Photographic Experts Group (JPEG) format for each study matrix. These were obtained by scanning the exposed and polished faces of each specimen at a resolution of 7200 dots per inch (dpi). The images analyzed were in color, at 24 bits per pixel, with each pixel having up to 224 different colors, that is, 16.7 million possible colors. These images were then used for the OIA using the Image-Pro v. 11.0.4 Build 9821 software.
For the specific case of the EB0 matrix, the image from a previous study [50] was used, but the protocols of this research were applied; likewise, the sample’s area of interest was delimited as new for this study. The image in Figure 1c was used to calibrate and define the presence of the PSR component in the analyzed image.
For the analysis, an OIA study protocol was established in the Image-Pro software in order to identify the different matrix components (MCs), recognizing four different MCs to be studied:
MC 1: Porosity (black). For its calibration, the porosity data of each study matrix in Figure 9 were used as complementary information. This MC establishes the lack of solid material compounds and is linked to pores not occupied by other components.
MC 2: Earth (E) (orange). This component is the most representative, present in all the study matrices. It is the base component that binds the rest of the MC.
MC 3: Powdered steatite rock (PSR) (yellow). This MC identifies the PSR present, with small particles dispersed throughout the matrix, usually surrounded by MC 2.
MC 4: White aggregate. This identifies the MC that is not part of MC 2 or MC 3 and is distinguished from them by its color.
Once the discrimination criteria of each MC within the study area were established, their areas were obtained. These were then converted into percentages of the total area to make them equivalent in the comparison. The average area of each MC with respect to the total area of interest studied was 1.26 cm2 (with σ = 0.0877). Figure 20 shows the images after applying the protocol and calibration criteria that determined the different MC.
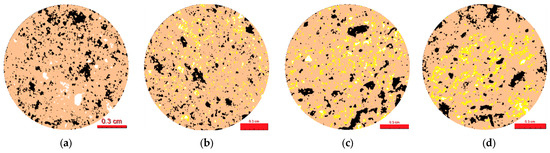
Figure 20.
Segmented images of the four constituent MC for one of the study matrices. (a) EB0, (b) EB5, (c) EB10, (d) EB20.
With the evaluated MC, expressed as a percentage with respect to the total study area of each matrix, Figure 21 shows them with regard to the research replacement variables.
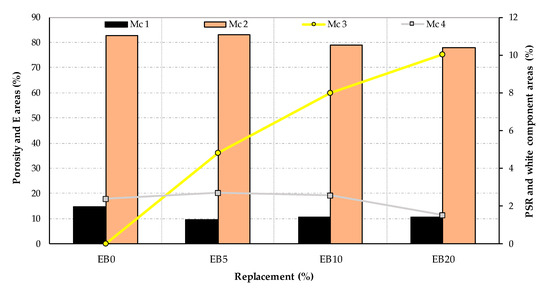
Figure 21.
Area in percentage of the different MC for each study matrix established with the OIA protocol.
The following deductions can be drawn from the results of the quantified areas (in percentage terms) of each phase identified in the matrix.
MC 1 (porosity) shows values with a trend close to those indicated in Figure 9, although all the determinations obtained by OIA for this MC 1 have been positioned, tenuously, below the experimental ones. If the two techniques that determine porosity are compared, and considering the average value of all the matrices, the OIA is −0.78% (with a range of +0.32 to −2.26%) lower than the experimental results. The distribution of the observed porosity in the EB0 and EB5 matrices shows a variety of pore sizes, with the smaller ones predominating. However, in the case of the EB10 and EB20 matrices, this seems to change by grouping together to form areas of more porosity or larger pore sizes. This could be explained if the PSR component, with fine particles, had the capacity to fill small pores (as in the case of EB10 and EB20). However, this also prevents obtaining a uniform isotropic matrix (creating a concentration of porous areas) when the PSR is highly concentrated. This could be explained by establishing that the increase in the PSR produces a decrease in porosity in the matrix, which ranges from small to large pores.
MC 2 (E) is the most representative of the four MC in the matrices studied; its best regression fit is the decreasing linear type, which is inversely correlative to the replacement of the PSR. This links this MC to the physical and mechanical behavior of the different EBs.
In the case of MC 3 (PSR), the curve describing the determination of the area percentages of the different study matrices has its best fit in a decreasing quadratic equation; although if the values obtained by OIA are compared in terms of the percentages of PSR replacement used in their dosage, those of OIA are lower, reaching an average value for all matrices equal to −3.04% (with a range of variation between 0.0 and −9.97%, the latter in the case of EB20). While the values do not fully converge in both techniques, the trend of the MC 3 curve is the one that could best explain the behavior of the properties established for each of the matrices. This is based on the fact that it not only has an adjustment coinciding with the trends of the established properties, but also because it has a significant percentage of representativeness.
Finally, MC 4 (white aggregate). This has a general mean for all matrices of 2.26% (with a maximum value of 2.7% in EB5); therefore, its incidence is not considered significant or representative of the behavior of the EBs.
In order to establish the numerical relationship of the different MC of the EB with respect to their properties determined above, the objective was to obtain the prediction equations of those behaviors that connect them and the eigencoefficients that calibrate the percentage of PSR replacement. Therefore, equations were obtained to predict the behavior of fc, fb UEM by E∂ and λ of the EB studied.
Linear type adjustment equations are proposed, considering that the behavior of the EB in each property to be predicted is the result in conjunction with the four MCs established in OIA. This is composed of the sum of each MC percentage. The criteria that were established to determine the structure were as follows: (a) each MC percentage must be adjusted by means of its own multiplier coefficient; (b) the resulting Adjusted Predictive Equation (APE), which includes the previous criterion, must in turn be adjusted by means of an approximation coefficient that considers the different study matrices of EB with PSR replacements, thus achieving better accuracy in the behavior prediction. Obtaining each of the equations was proposed and established following this typology (see Equation (2)):
where APE = value of the predictive property of the EB, RCPSR is the replacement coefficient of PSR, CMc1 is the coefficient determined by numerical adjustment for each of the four CM in OIA and MC1 is the percentage value of the area of each MC determined by OIA.
To obtain the APEs, Solver version 2025 Q1 software [86] was used, which has approximation adjustment algorithms with cycle sequencing and optimization correction criteria. The software allows different alternative scenarios, with the best one being determined by adjusting the imposed parameters. Once the requirements imposed for the adjustment have been solved and the results of the equations have been validated, the CMc1 and the RCPSR are established for each APE corresponding to the property studied. The limitation criteria, the maximum and minimum possible values of each variable considering the experimental values obtained (see Figure 12, Figure 14, Figure 15 and Figure 16), the approximation criteria obtained from the software, the resolution method (non-linear), the iteration parameters of the applied algorithm (minimum acceptable value of the convergence error of 0.0001), i+1 iteration evaluation by approximation (forward difference) and the initial test value of the variables to be evaluated (equal to zero for all of them) all followed the recommendations of previous research [115].
The results of the prediction were then compared with the experimental results, thus determining the average error of the predictive accuracy (EPA) as a percentage. This showed the predictions that best approximated the actual experimental results. From this numerical process, the following equations including the CMc1 coefficients were obtained: for fc, see Equation (3) (EPA = 1.07%); for fb, see Equation (4) (EPA = 0.127%); for E∂, see Equation (5) (EPA = 4.738%); and for λ, see Equation (6) (EPA = −0.480%):
Table 4 shows the coefficients to be used in the above equations for the different EB matrices studied.
Table 4.
RCPSR adjusted for each EB property considering PSR.
Table 5 shows the values of the real experimental (Ex.) and predictive (Pr.) properties obtained with the adjustment equations for the different matrices studied. The degrees of fit or variation between the experimental and predictive results are plotted in Figure 22.
Table 5.
Values of the resulting properties.
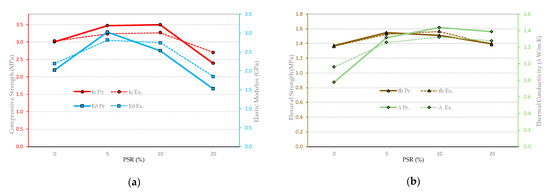
Figure 22.
Comparison between experimental and predictive results of EB properties for the study matrices. (a) fc and E∂, (b) fb and λ.
From the above, it can be established that the OIA technique can be considered complementary and capable of identifying elements present in a microstructure of matrices similar to those studied here. It is also possible to determine correlations and predictions of the mechanical or thermal behavior of the matrices through the numerical adjustment of the equations that predict them by obtaining information from the initial data of the variables for the numerical adjustments.
4. Conclusions
The results obtained in this research show the effectiveness of steatite as a mineral stabilizer, which increases the physical, mechanical and thermal properties of earthen blocks when its content does not exceed the overdose limit (established between 10 and 20% replacement). Increases in density and pore reduction indicate more compact matrices, and, regarding the results of mechanical tests, lead to matrices with greater cohesion, stability and better mechanical resistance. This type of stabilization represents a sustainable alternative to the usual methods, such as chemical stabilization. Additionally, the use of waste materials means a reduction in the related energy footprint.
Durability tests show that although blocks made with these aggregates demonstrate a better capillary moisture absorption behavior, reducing the absorption rate, they are not suitable for exposure to moisture or erosion, where the minimum regulatory requirements may be met.
The most relevant property of this research is the thermal conductivity of the stabilized blocks, in which the results established significant increases. This could be considered a disadvantage in terms of thermal insulation if they were used only as cladding, but applying them in exterior solid wall systems can be of benefit in cold climates, where heat transfer through the material contributes to keeping the internal temperature stable. This opens up a future line of research, in which the efficiency of this behavior should be investigated.
In terms of sustainability, the research confirms the use of powdered steatite residues as a stabilizing aggregate for use in the manufacture of earthen blocks, representing a viable and ecological alternative to conventional soil stabilization methods. This type of mineral stabilization offers an effective strategy for optimizing the performance of earthen blocks without ignoring the principles of sustainable construction.
Proposals for other future lines of research include the study of the mechanical behavior of earth blocks containing different types of earth, evaluating the efficiency of other stabilizers such as lime or cement, assessing the effects of compaction, determining the economic viability of their generalized and industrialized applications, the study of possible environmental impacts through Life Cycle Analysis and, finally, establishing the thermal behavior of construction systems at scale. With the above, it will be possible to advance in developing sustainable and efficient construction materials, thus promoting environmentally responsible architectural practices.
Author Contributions
Conceptualization, J.M.G.-S.; methodology, J.M.G.-S. and C.A.C.-E.; software, C.A.C.-E.; validation, M.C.G.-S.; formal analysis, C.A.C.-E.; investigation, J.M.G.-S. and M.C.G.-S.; resources, J.M.G.-S. and M.C.G.-S.; data curation, C.A.C.-E.; writing—original draft preparation, C.A.C.-E. and J.M.G.-S.; writing—review and editing, M.C.G.-S.; visualization, C.A.C.-E. and J.M.G.-S.; supervision, J.M.G.-S. All authors have read and agreed to the published version of the manuscript.
Funding
This research received no external funding.
Data Availability Statement
In the case of a justified request, supporting information for this research can be requested from the corresponding author.
Acknowledgments
The authors thank Programa Nacional de Becas y Crédito Educativo-PERU (PRONABEC) for its doctoral scholarship program, and the Department of Architecture Technology-EPSEB-UPC.
Conflicts of Interest
The authors declare no conflicts of interest.
References
- Jaquin, P.A.; Augarde, C.E. Earth Building: History, Science and Conservation; BREPress: Berkeley, CA, USA, 2012; Available online: https://durham-repository.worktribe.com/output/1124958 (accessed on 21 November 2024).
- Pacheco-Torgal, F. 1—Introduction to eco-efficient masonry bricks and blocks. In Eco-Efficient Masonry Bricks and Blocks; Pacheco-Torgal, F., Lourenço, P.B., Labrincha, J.A., Kumar, S., Chindaprasirt, P., Eds.; Woodhead Publishing: Oxford, UK, 2015; pp. 1–10. [Google Scholar] [CrossRef]
- Viñuales, G.M. Tecnología y construcción con tierra. Apuntes: Revista de Estudios sobre Patrimonio Cultural. J. Cult. Herit. Stud. 2007, 20, 220–231. [Google Scholar]
- Hernandez, V.; Botero Botero, L.F.; Carvajal Arango, D. Fabricación de bloques de tierra comprimida con adición de residuos de construcción y demolición como reemplazo del agregado pétreo convencional. Ing. Cienc. 2015, 11, 197–220. [Google Scholar] [CrossRef]
- Bestraten, S.; Hormías, E.; Altemir, A. Construcción con tierra en el siglo XXI. Inf. Construcción 2011, 63, 5–20. [Google Scholar] [CrossRef]
- Ouma, J.; Ongwen, N.; Ogam, E.; Auma, M.; Fellah, Z.E.A.; Mageto, M.; Ben Mansour, M.; Oduor, A. Acoustical properties of compressed earth blocks: Effect of compaction pressure, water hyacinth ash and lime. Case Stud. Constr. Mater. 2023, 18, e01828. [Google Scholar] [CrossRef]
- Dormohamadi, M.; Rahimnia, R. Combined effect of compaction and clay content on the mechanical properties of adobe brick. Case Stud. Constr. Mater. 2020, 13, e00402. [Google Scholar] [CrossRef]
- Delgado, M.C.J.; Guerrero, I.C. Earth building in Spain. Constr. Build. Mater. 2006, 20, 679–690. [Google Scholar] [CrossRef]
- El-yahyaoui, A.; Manssouri, I.; Noureddine, O.; Sahbi, H.; Khaldoun, A. Physical and mechanical properties of unfired clay bricks with saw palmetto fibers additive as a construction material. Mater. Today Proc. 2023, 72, 3804–3814. [Google Scholar] [CrossRef]
- Labiad, Y.; Meddah, A.; Beddar, M.; Pantelidis, L. Study on characterization, mechanical, and thermal properties of Alfa fiber–reinforced compressed earth blocks incorporating crushed brick waste. Arab. J. Geosci. 2023, 16, 575. [Google Scholar] [CrossRef]
- Losini, A.E.; Grillet, A.C.; Bellotto, M.; Woloszyn, M.; Dotelli, G. Natural additives and biopolymers for raw earth construction stabilization—A review. Constr. Build. Mater. 2021, 304, 124507. [Google Scholar] [CrossRef]
- Rajurkar, V.; Chitade, A.Z. Study of Natural Fiber over Strength and Density of Cement Stabilized Rammed Earth Blocks. IOP Conf. Ser. Earth Environ. Sci. 2023, 1193, 012025. [Google Scholar] [CrossRef]
- Taallah, B.; Guettala, A. The mechanical and physical properties of compressed earth block stabilized with lime and filled with untreated and alkali-treated date palm fibers. Constr. Build. Mater. 2016, 104, 52–62. [Google Scholar] [CrossRef]
- Minke, G. Building with Earth: Design and Technology of a Sustainable Architecture, 2nd and rev. ed.; Birkhäuser: Basel, Switzerland; Berlin, Germany; Boston, MA, USA, 2006. [Google Scholar]
- Sujatha, E.R.; Selsia Devi, S. Reinforced soil blocks: Viable option for low cost building units. Constr. Build. Mater. 2018, 189, 1124–1133. [Google Scholar] [CrossRef]
- Van Damme, H.; Houben, H. Earth concrete. Stabilization revisited. Cem. Concr. Res. 2018, 114, 90–102. [Google Scholar] [CrossRef]
- Laguna-Torres, C.A.; González-López, J.R.; Guerra-Cossío, M.Á.; Guerrero-Baca, L.F.; Chávez-Guerrero, L.; Figueroa-Torres, M.Z.; Zaldívar-Cadena, A.A. Effect of physical, chemical, and mineralogical properties for selection of soils stabilized by alkaline activation of a natural pozzolan for earth construction techniques such as compressed earth blocks. Constr. Build. Mater. 2024, 419, 135449. [Google Scholar] [CrossRef]
- Brigatti, M.F.; Galan, E.; Theng, B.K.G. Chapter 2 Structures and Mineralogy of Clay Minerals. In Developments in Clay Science; Bergaya, F., Theng, B.K.G., Lagaly, G., Eds.; Handbook of Clay Science; Elsevier: Amsterdam, The Netherlands, 2006; Volume 1, pp. 19–86. [Google Scholar] [CrossRef]
- Sanchez-Soto, P.J.; Wiewióra, A.; Avilés, M.A.; Justo, A.; Pérez-Maqueda, L.A.; Pérez-Rodríguez, J.L.; Bylina, P. Talc from Puebla de Lillo, Spain. II. Effect of dry grinding on particle size and shape. Appl. Clay Sci. 1997, 12, 297–312. [Google Scholar] [CrossRef]
- Konta, J. Clay and man: Clay raw materials in the service of man. Appl. Clay Sci. 1995, 10, 275–335. [Google Scholar] [CrossRef]
- Kuzvart, M. Industrial minerals and rocks; Elsevier: Amsterdam, The Netherlands, 1984. [Google Scholar]
- Storemyr, P. Weathering of soapstone in a historical perspective. Mater. Charact. 2004, 53, 191–207. [Google Scholar] [CrossRef]
- Grammatikakis, I.; Demadis, K.D.; Kyriakidis, E.; Cabeza, A.; Leon-Reina, L. New evidence about the use of serpentinite in the Minoan architecture. A μ-Raman based study of the “House of the High Priest” drain in Knossos. J. Archaeol. Sci. Rep. 2017, 16, 316–321. [Google Scholar] [CrossRef]
- Luukkonen, T.; Abdollahnejad, Z.; Yliniemi, J.; Mastali, M.; Kinnunen, P.; Illikainen, M. Alkali-activated soapstone waste—Mechanical properties, durability, and economic prospects. Sustain. Mater. Technol. 2019, 22, e00118. [Google Scholar] [CrossRef]
- Cota, F.P.; Alves, R.A.A.; Panzera, T.H.; Strecker, K.; Christoforo, A.L.; Borges, P.H.R. Physical properties and microstructure of ceramic–polymer composites for restoration works. Mater. Sci. Eng. A 2012, 531, 28–34. [Google Scholar] [CrossRef]
- Torres, H.S.S.; Varajão, A.F.D.C.; Sabioni, A.C.S. Technological properties of ceramic produced from steatite (soapstone) residues-kaolinite clay ceramic composites. Appl. Clay Sci. 2015, 112–113, 53–61. [Google Scholar] [CrossRef]
- Baron, A.; Burke, A.L.; Gratuze, B.; Chapdelaine, C. Characterization and origin of steatite beads made by Northern Iroquoians in the St. Lawrence Valley during the 15th and 16th centuries. J. Archaeol. Sci. Rep. 2016, 8, 323–334. [Google Scholar] [CrossRef]
- El Alami, K.; Asbik, M.; Agalit, H. Identification of natural rocks as storage materials in thermal energy storage (TES) system of concentrated solar power (CSP) plants—A review. Sol. Energy Mater. Sol. Cells 2020, 217, 110599. [Google Scholar] [CrossRef]
- Hänchen, M.; Brückner, S.; Steinfeld, A. High-temperature thermal storage using a packed bed of rocks—Heat transfer analysis and experimental validation. Appl. Therm. Eng. 2011, 31, 1798–1806. [Google Scholar] [CrossRef]
- Gökçe, H.; Ağaoğulları, D.; Öveçoğlu, M.L.; Duman, İ.; Boyraz, T. Characterization of microstructural and thermal properties of steatite/cordierite ceramics prepared by using natural raw materials. J. Eur. Ceram. Soc. 2011, 31, 2741–2747. [Google Scholar] [CrossRef]
- Mielcarek, W.; Nowak-Woźny, D.; Prociów, K. Correlación entre las fases de MgSiO3 y la durabilidad mecánica de la cerámica de esteatita. J. Eur. Ceram. Soc. 2004, 24, 3817–3821. [Google Scholar] [CrossRef]
- Soykan, H.Ş. Low-temperature fabrication of steatite ceramics with boron oxide addition. Ceram. Int. 2007, 33, 911–914. [Google Scholar] [CrossRef]
- Kharitonov, F.Y.; Shapiro, L.E. A steatite material having a wide sintering range. Glass Ceram. 1989, 46, 162–165. [Google Scholar] [CrossRef]
- Terzić, A.; Obradović, N.; Stojanović, J.; Pavlović, V.; Andrić, L.; Olćan, D.; Đorđević, A. Influence of different bonding and fluxing agents on the sintering behavior and dielectric properties of steatite ceramic materials. Ceram. Int. 2017, 43, 13264–13275. [Google Scholar] [CrossRef]
- Vakalova, T.V.; Sergeev, N.P.; Maksimova, V.E.; Rusinov, P.G.; Balamygin, D.I. Improvement of sinterability and mechanical properties of magnesia-silicate ceramics with enstatite phase from mixtures of serpentinite with silica additives. J. Ind. Eng. Chem. 2022, 106, 86–102. [Google Scholar] [CrossRef]
- Cota, T.G.; Reis, E.L.; Lima, R.M.F.; Cipriano, R.A.S. Incorporation of waste from ferromanganese alloy manufacture and soapstone powder in red ceramic production. Appl. Clay Sci. 2018, 161, 274–281. [Google Scholar] [CrossRef]
- Mymrin, V.; Alekseev, K.; Fortini, O.M.; Catai, R.E.; Nagalli, A.; Rissardi, J.L.; Molinetti, A.; Pedroso, D.E.; Izzo, R.L.S. Water cleaning sludge as principal component of composites to enhance mechanical properties of ecologically clean red ceramics. J. Clean. Prod. 2017, 145, 367–373. [Google Scholar] [CrossRef]
- Strecker, K.; Panzera, T.H.; Sabariz, A.L.R.; Miranda, J.S. The effect of incorporation of steatite wastes on the mechanical properties of cementitious composites. Mater. Struct. 2010, 43, 923–932. [Google Scholar] [CrossRef]
- Panzera, T.H.; Strecker, K.; Miranda, J.d.S.; Christoforo, A.L.; Borges, P.H.R. Cement-Steatite composites reinforced with carbon fibres: An alternative for restoration of brazilian historical buildings. Mat. Res. 2011, 14, 118–123. [Google Scholar] [CrossRef]
- Panzera, T.H.; Strecker, K.; de Oliveira, L.G.; Vasconcelos, W.L.; Schiavon, M.A. Effect of steatite waste additions on the physical and mechanical properties of clay composites. Mater. Res. 2010, 13, 535–540. [Google Scholar] [CrossRef]
- Venkatesh, V.; Shanmugasundaram, M. Enhancement of mechanical and microstructural characteristics of magnesium oxychloride cement with metasteatite. Case Stud. Constr. Mater. 2024, 21, e03683. [Google Scholar] [CrossRef]
- Vu, V.-A.; Cloutier, A.; Bissonnette, B.; Blanchet, P.; Dagenais, C. Steatite Powder Additives in Wood-Cement Drywall Particleboards. Materials 2020, 13, 4813. [Google Scholar] [CrossRef]
- Influence of ultra-fine steatite powder on the properties of alkali-activated concrete. Proc. Inst. Civ. Eng. Eng. Sustain. 2022, 176, 17–27. [CrossRef]
- Gnanaraj, S.C.; Chokkalingam, R.B.; Thankam, G.L.; Pothinathan, S.K.M. Durability properties of self-compacting concrete developed with fly ash and ultra fine natural steatite powder. J. Mater. Res. Technol. 2021, 13, 431–439. [Google Scholar] [CrossRef]
- Rodrigues, M.L.M.; Lima, R.M.F. Cleaner production of soapstone in the Ouro Preto region of Brazil: A case study. J. Clean. Prod. 2012, 32, 149–156. [Google Scholar] [CrossRef]
- Minisy, I.M.; Salahuddin, N.A.; Ayad, M.M. Adsorption of methylene blue onto chitosan–montmorillonite/polyaniline nanocomposite. Appl. Clay Sci. 2021, 203, 105993. [Google Scholar] [CrossRef]
- Igwe Idumah, C.; Okonkwo, U.C.; Obele, C.M. Recently emerging advancements in montmorillonite polymeric nanoarchitectures and applications. Clean. Mater. 2022, 4, 100071. [Google Scholar] [CrossRef]
- Barbeta Solà, G. Mejora de la Tierra Estabilizada en el Desarrollo de una Arquitectura Sostenible Hacia el Siglo XXI. Ph.D. Thesis, Universitat Politècnica de Catalunya, Barcelona, Spain, 2002. [Google Scholar] [CrossRef]
- Frink, L.; Glazer, D.; Harry, K. Canadian Arctic soapstone cooking technology. N. Am. Archaeol. 2012, 33, 429–449. [Google Scholar] [CrossRef]
- Casapino-Espinoza, C.A.; Gómez-Soberón, J.M.; Gómez-Soberón, M.C. The Effect of Recycled Crushed Brick Aggregate on the Physical–Mechanical Properties of Earth Blocks. Buildings 2025, 15, 145. [Google Scholar] [CrossRef]
- UNE 41410:2023; Bloques de Tierra Comprimida (BTC) Para Muros y Tabiques. UNE Asociación Española de Normalización: Madrid, Spain, 2023. Available online: https://www.une.org/encuentra-tu-norma/busca-tu-norma/norma?c=N0072146 (accessed on 4 July 2024).
- Standard Specification for Aggregate for Masonry Mortar. Available online: https://www.astm.org/c0144-18.html (accessed on 5 July 2024).
- Houben, H.; Guillaud, H. Earth Construction: A Comprehensive Guide; Intermediate Technology Publications: London, UK, 1994; ISBN 978-1-85339-193-4. [Google Scholar]
- Noureddine, O.; Manssouri, I.; Sahbi, H.; Limami, H.; Khaldoun, A. Rheological and physico-mechanical investigations on the destabilization of unfired clay bricks with almond husk additive by salt. Constr. Build. Mater. 2023, 375, 130971. [Google Scholar] [CrossRef]
- Standard Test Method for Relative Density (Specific Gravity) and Absorption of Fine Aggregate. Available online: https://www.astm.org/c0128-22.html (accessed on 4 July 2024).
- UNE 7050-2:1997; Tamices y Tamizado de Ensayo. Parte 2: Telas Metálicas, Chapas Perforadas y Láminas Electrosoldadas. Medidas Nominales de las Aberturas. UNE Asociación Española de Normalización: Madrid, Spain, 1997. Available online: https://www.une.org/encuentra-tu-norma/busca-tu-norma/norma?c=N0000151 (accessed on 4 July 2024).
- UNE-EN ISO 17892-12:2019; Investigación y Ensayos Geotécnicos. Ensayos de Laboratorio de Suelos. Parte 12: Determinación del Límite Líquido y del Límite Plástico. UNE Asociación Española de Normalización: Madrid, Spain, 2019. Available online: https://www.une.org/encuentra-tu-norma/busca-tu-norma/norma?c=norma-une-en-iso-17892-12-2019-n0062183 (accessed on 13 November 2024).
- AS 1289.3.4.1-2008; Methods of Testing Soils for Engineering Purposes, Method 3.4.1: Soil Classification Tests—Determination of the Linear Shrinkage of a Soil—Standard Method. Standards Australia Store: Sydney, Australia, 2008. Available online: https://store.standards.org.au/product/as-1289-3-4-1-2008 (accessed on 4 July 2024).
- Skempton, A.W. The colloidal activity of clays. Sel. Pap. Soil Mech. 1953, 1, 57–61. [Google Scholar]
- Seed, H.B.; Woodward, R.J.; Lundgren, R. Prediction of Swelling Potential for Compacted Clays. J. Soil Mech. Found. Div. 1962, 88, 53–87. [Google Scholar] [CrossRef]
- Van der Merwe, D.H. The prediction of heave from the plasticity index and percentage clay fraction of soils. Civ. Eng. Siviele Ingenieurswese 1964, 1964, 103–107. [Google Scholar]
- Khoudja, D.; Taallah, B.; Izemmouren, O.; Aggoun, S.; Herihiri, O.; Guettala, A. Mechanical and thermophysical properties of raw earth bricks incorporating date palm waste. Constr. Build. Mater. 2021, 270, 121824. [Google Scholar] [CrossRef]
- Lahdili, M.; El Abbassi, F.-E.; Sakami, S.; Aamouche, A. Mechanical and Thermal Behavior of Compressed Earth Bricks Reinforced with Lime and Coal Aggregates. Buildings 2022, 12, 1730. [Google Scholar] [CrossRef]
- Giroudon, M.; Laborel-Préneron, A.; Aubert, J.-E.; Magniont, C. Comparison of barley and lavender straws as bioaggregates in earth bricks. Constr. Build. Mater. 2019, 202, 254–265. [Google Scholar] [CrossRef]
- Laborel-Préneron, A.; Aubert, J.-E.; Magniont, C.; Maillard, P.; Poirier, C. Effect of Plant Aggregates on Mechanical Properties of Earth Bricks. J. Mater. Civ. Eng. 2017, 29, 04017244. [Google Scholar] [CrossRef]
- Afnor EDITIONS. XP P13-901. Available online: https://www.boutique.afnor.org/fr-fr/norme/xp-p13901/blocs-de-terre-comprimee-pour-murs-et-cloisons-definitions-specifications-m/fa120503/487 (accessed on 13 December 2024).
- BOE-A-2023-628 Real Decreto 3/2023, de 10 de enero, por el que se establecen los criterios técnico-sanitarios de la calidad del agua de consumo, su control y suministro. Available online: https://www.boe.es/buscar/act.php?id=BOE-A-2023-628 (accessed on 4 July 2024).
- Normas del Reglamento Nacional de Edificaciones (RNE). Available online: https://www.gob.pe/institucion/sencico/informes-publicaciones/887225-normas-del-reglamento-nacional-de-edificaciones-rne (accessed on 16 December 2022).
- UNE-EN ISO 17892-4:2019; Investigación y Ensayos Geotécnicos. Ensayos de Laboratorio de Suelos. Parte 4: Determinación de la Distribución Granulo-métrica. UNE Asociación Española de Normalización: Madrid, Spain, 2019. Available online: https://www.une.org/encuentra-tu-norma/busca-tu-norma/norma?c=N0062597 (accessed on 4 July 2024).
- Normas AENOR. ISO 3310-1:2016. Available online: https://tienda.aenor.com/norma-iso-3310-1-2016-062410 (accessed on 10 July 2024).
- Standard Test Methods for Liquid Limit, Plastic Limit, and Plasticity Index of Soils. Available online: https://www.astm.org/d4318-17e01.html (accessed on 15 June 2023).
- UNE-EN ISO 12570:2000; Prestaciones Higrotérmicas de los Productos y Materiales Para Edificios. Determinación del Contenido de Humedad Mediante Secado a Elevadas Temperaturas. UNE Asociación Española de Normalización: Madrid, Spain, 2000. Available online: https://www.une.org/encuentra-tu-norma/busca-tu-norma/norma?c=N0023664 (accessed on 4 July 2024).
- UNE-EN ISO 18754:2022; (Ratificada) Cerámicas Técnicas (Cerámicas Avanzadas, Cerámicas Técnicas Avanzadas). Determinación de la Densidad y de la Porosidad Aparente. UNE Asociación Española de Normalización: Madrid, Spain, 2022. Available online: https://www.une.org/encuentra-tu-norma/busca-tu-norma/norma/?c=norma-une-en-iso-18754-2022-n0069596 (accessed on 5 July 2024).
- Standard Test Method for Linear Drying Shrinkage of Concrete Masonry Units. Available online: https://www.astm.org/c0426-22.html (accessed on 16 June 2023).
- UNE-EN 1367-4:2009; Ensayos Para Determinar las Propiedades Térmicas y de Alteración de los Áridos. Parte 4: Determinación de la Retracción por Secado. UNE Asociación Española de Normalización: Madrid, Spain, 2009. Available online: https://www.une.org/encuentra-tu-norma/busca-tu-norma/norma?c=N0043307 (accessed on 5 July 2024).
- UNE-EN 771-4:2011+A1:2016; Especificaciones de Piezas Para Fábrica de Albañilería. Parte 4: Bloques de Hormigón Celular Curado en Autoclave. UNE Asociación Española de Normalización: Madrid, Spain, 2016. Available online: https://www.une.org/encuentra-tu-norma/busca-tu-norma/norma?c=N0056390 (accessed on 18 February 2025).
- UNE-EN 771-5:2011+A1:2016; Especificaciones de Piezas Para Fábrica de Albañilería. Parte 5: Piezas de Piedra Artificial. UNE Asociación Española de Normalización: Madrid, Spain, 2016. Available online: https://www.une.org/encuentra-tu-norma/busca-tu-norma/norma?c=N0056812 (accessed on 18 February 2025).
- Standard Test Method for Compressive Strength of Cylindrical Concrete Specimens. Available online: https://www.astm.org/c0039_c0039m-21.html (accessed on 4 July 2024).
- Standard Test Methods for Sampling and Testing Brick and Structural Clay Tile. Available online: https://www.astm.org/c0067_c0067m-23.html (accessed on 16 June 2023).
- UNE-EN 772-1:2011+A1:2016; Métodos de Ensayo de Piezas Para Fábrica de Albañilería. Parte 1: Determinación de la Resistencia a Compresión. UNE Asociación Española de Normalización: Madrid, Spain, 2016. Available online: https://www.une.org/encuentra-tu-norma/busca-tu-norma/norma?c=N0047873 (accessed on 4 July 2024).
- Standard Test Method for Flexural Strength of Advanced Ceramics at Ambient Temperature. Available online: https://www.astm.org/c1161-13.html (accessed on 5 July 2024).
- E1876 Método de Prueba Estándar Para el Módulo de Young Dinámico, el Módulo de Corte y el Coeficiente de Poisson mediante Excitación de Impulso de Vibración. Available online: https://www.astm.org/e1876-22.html (accessed on 4 July 2024).
- UNE-EN 14146:2004; Métodos de Ensayo Para Piedra Natural. Determinación del Módulo de Elasticidad Dinámico (con la Medida de Frecuencia de Resonancia Fundamental). UNE Asociación Española de Normalización: Madrid, Spain, 2004. Available online: https://www.une.org/encuentra-tu-norma/busca-tu-norma/norma?c=N0032544 (accessed on 4 July 2024).
- Real, S.; Bogas, J.A.; Cruz, R.; Gomes, M.G.; Nabais, M. Thermal performance of compressed earth blocks stabilised with thermoactivated recycled cement. Energy Build. 2024, 314, 114288. [Google Scholar] [CrossRef]
- NZS 4298:2024; Materials and construction for earth buildings. Standards New Zealand: Wellington, New Zealand, 2024. Available online: https://www.standards.govt.nz/shop/NZS-42982024 (accessed on 18 February 2025).
- Solver. Available online: https://www.solver.com/ (accessed on 19 March 2025).
- Augusta Cirvini, S.; Gómez Voltan, J.A. Ensayo y dispositivo para evaluar la absorción capilar en probetas de adobe y tapia. Revista Técnica de la Facultad de Ingeniería Universidad del Zulia 2014, 37, 3–10. [Google Scholar]
- Kenya Bureau of Standards Testing Services Department. UNIDO Knowledge Hub. Available online: https://hub.unido.org/es/node/3003 (accessed on 4 March 2025).
- 14.7.4 NMAC. Available online: https://www.srca.nm.gov/parts/title14/14.007.0004.html (accessed on 4 March 2025).
- KS ARS 670-1:2018; Compressed Earth Blocks—Part 1: Definitions, Classification, Specifications and Conformity Criteria. Kenya Bureau of Standards: Nairobi, Kenya, 2018. Available online: https://webstore.kebs.org/index.php?route=product/product&product_id=18324 (accessed on 4 March 2025).
- Ma, J.; Abdelaal, A.; Zhang, H.; Zhou, A.; Fu, Y.; Xie, Y.M. Ultra-compressed earth block stabilized by bio-binder for sustainable building construction. Case Stud. Constr. Mater. 2024, 21, e03523. [Google Scholar] [CrossRef]
- Miccoli, L.; Müller, U.; Fontana, P. Mechanical behaviour of earthen materials: A comparison between earth block masonry, rammed earth and cob. Constr. Build. Mater. 2014, 61, 327–339. [Google Scholar] [CrossRef]
- Miccoli, L.; Garofano, A.; Fontana, P.; Müller, U. Experimental testing and finite element modelling of earth block masonry. Eng. Struct. 2015, 104, 80–94. [Google Scholar] [CrossRef]
- Wiehle, P.; Brinkmann, M. Material behaviour of unstabilised earth block masonry and its components under compression at varying relative humidity. Case Stud. Constr. Mater. 2022, 17, e01663. [Google Scholar] [CrossRef]
- Haddad, K.; Lannon, S.; Latif, E. Investigation of Cob construction: Review of mix designs, structural characteristics, and hygrothermal behaviour. J. Build. Eng. 2024, 87, 108959. [Google Scholar] [CrossRef]
- Wiehle, P.; Simon, S.; Baier, J.; Dennin, L. Influence of relative humidity on the strength and stiffness of unstabilised earth blocks and earth masonry mortar. Constr. Build. Mater. 2022, 342, 128026. [Google Scholar] [CrossRef]
- Pefferkorn, E. Structure and stability of natural organic matter/soil complexes and related synthetic and mixed analogues. Adv. Colloid Interface Sci. 1997, 73, 127–200. [Google Scholar] [CrossRef]
- Lawrence, C.D. 9—The Production of Low-Energy Cements. In Lea’s Chemistry of Cement and Concrete (Fourth Edition); Hewlett, P.C., Ed.; Butterworth-Heinemann: Oxford, UK, 1998; pp. 421–470. [Google Scholar] [CrossRef]
- Tadonbou, J.; Pliya, P.; Beaucour, A.-L.; Faria, P.; Noumowe, A. Behavior of earth mortars at high temperature. Constr. Build. Mater. 2024, 425, 136093. [Google Scholar] [CrossRef]
- El hammouti, A.; Charai, M.; Channouf, S.; Horma, O.; Nasri, H.; Mezrhab, A.; Karkri, M.; Tankari, M.A. Laboratory-testing and industrial scale performance of different clays from eastern Morocco for brick manufacturing. Constr. Build. Mater. 2023, 370, 130624. [Google Scholar] [CrossRef]
- Földvári, M. Handbook of Thermogravimetric System of Minerals and Its Use in Geological Practice; Geological Institute of Hungary (=Magyar Állami Földtani Intézet): Budapest, Hungary, 2011; ISBN 978-963-671-288-4. [Google Scholar]
- Santha Kumar, G.; Saini, P.K.; Deoliya, R.; Mishra, A.K.; Negi, S.K. Characterization of laterite soil and its use in construction applications: A review. Resour. Conserv. Recycl. Adv. 2022, 16, 200120. [Google Scholar] [CrossRef]
- Ozturk, S. Optimization of thermal conductivity and lightweight properties of clay bricks. Eng. Sci. Technol. Int. J. 2023, 48, 101566. [Google Scholar] [CrossRef]
- Wang, S.; Gainey, L.; Baxter, D.; Wang, X.; Mackinnon, I.D.R.; Xi, Y. Thermal behaviours of clay mixtures during brick firing: A combined study of in-situ XRD, TGA and thermal dilatometry. Constr. Build. Mater. 2021, 299, 124319. [Google Scholar] [CrossRef]
- Terzić, A.; Obradović, N.; Kosanović, D.; Stojanović, J.; Đorđević, A.; Andrić, L.; Pavlović, V.B. Effects of mechanical-activation and TiO2 addition on the behavior of two-step sintered steatite ceramics. Ceram. Int. 2019, 45, 3013–3022. [Google Scholar] [CrossRef]
- Li, M.-T.; Li, Y.-T.; Sun, L.; Xu, Z.-B.; Zhao, Y.; Meng, Z.-H.; Wu, Q.-P. Mejora considerable de la eficiencia de almacenamiento de calor para el sistema termoquímico Mg(OH)2-MgO-H2O con la adición de Ce(NO3)3 y LiOH. Nano Energy 2021, 81, 105603. [Google Scholar] [CrossRef]
- Mastronardo, E.; Bonaccorsi, L.; Kato, Y.; Piperopoulos, E.; Lanza, M.; Milone, C. Strategies for the enhancement of heat storage materials performances for MgO/H2O/Mg(OH)2 thermochemical storage system. Appl. Therm. Eng. 2017, 120, 626–634. [Google Scholar] [CrossRef]
- Yan, J.; Pan, Z.H.; Zhao, C.Y. Experimental study of MgO/Mg(OH)2 thermochemical heat storage with direct heat transfer mode. Appl. Energy 2020, 275, 115356. [Google Scholar] [CrossRef]
- Akbarzadeh, A.; Ahmadlouydarab, M.; Niaei, A. Capabilities of α-Al2O3, γ-Al2O3, and bentonite dry powders used in flat plate solar collector for thermal energy storage. Renew. Energy 2021, 173, 704–720. [Google Scholar] [CrossRef]
- Raja Sekhar, Y.; Sharma, K.V.; Thundil Karupparaj, R.; Chiranjeevi, C. Heat Transfer Enhancement with Al2O3 Nanofluids and Twisted Tapes in a Pipe for Solar Thermal Applications. Procedia Eng. 2013, 64, 1474–1484. [Google Scholar] [CrossRef]
- Aluminium, Gallium, Indium and Thallium. In Chemistry of the Elements (Second Edition); Greenwood, N.N., Earnshaw, A., Eds.; Butterworth-Heinemann: Oxford, UK, 1997; pp. 216–267. ISBN 978-0-7506-3365-9. [Google Scholar]
- Zhang, L.-L.; Zheng, Y.-Y.; Wei, P.-C.; Diao, Q.-F.; Yin, Z.-Y. Nanoscale mechanical behavior of kaolinite under uniaxial strain conditions. Appl. Clay Sci. 2021, 201, 105961. [Google Scholar] [CrossRef]
- Zhao, Y.; Kong, L.; Xu, R.; Liu, J.; Sang, S. Mechanical properties of remolded hydrate-bearing clayey-silty sediments. J. Nat. Gas Sci. Eng. 2022, 100, 104473. [Google Scholar] [CrossRef]
- Limami, H.; Manssouri, I.; Cherkaoui, K.; Khaldoun, A. Study of the suitability of unfired clay bricks with polymeric HDPE & PET wastes additives as a construction material. J. Build. Eng. 2020, 27, 100956. [Google Scholar] [CrossRef]
- Cabrera-Covarrubias, F.G.; Gómez-Soberón, J.M.; Almaral-Sánchez, J.L.; Arredondo-Rea, S.P.; Gómez-Soberón, M.C.; Corral-Higuera, R. An Experimental Study of Mortars with Recycled Ceramic Aggregates: Deduction and Prediction of the Stress-Strain. Materials 2016, 9, 1029. [Google Scholar] [CrossRef]
Disclaimer/Publisher’s Note: The statements, opinions and data contained in all publications are solely those of the individual author(s) and contributor(s) and not of MDPI and/or the editor(s). MDPI and/or the editor(s) disclaim responsibility for any injury to people or property resulting from any ideas, methods, instructions or products referred to in the content. |
© 2025 by the authors. Licensee MDPI, Basel, Switzerland. This article is an open access article distributed under the terms and conditions of the Creative Commons Attribution (CC BY) license (https://creativecommons.org/licenses/by/4.0/).