
Investigating the Mechanisms and Dynamic Response of Graded Aggregate Mud Pumping Based on the Hybrid DEM-FDM Method

Abstract
1. Introduction
2. Graded Aggregate Void Formation Simulation with a Hybrid DEM-FDM Model
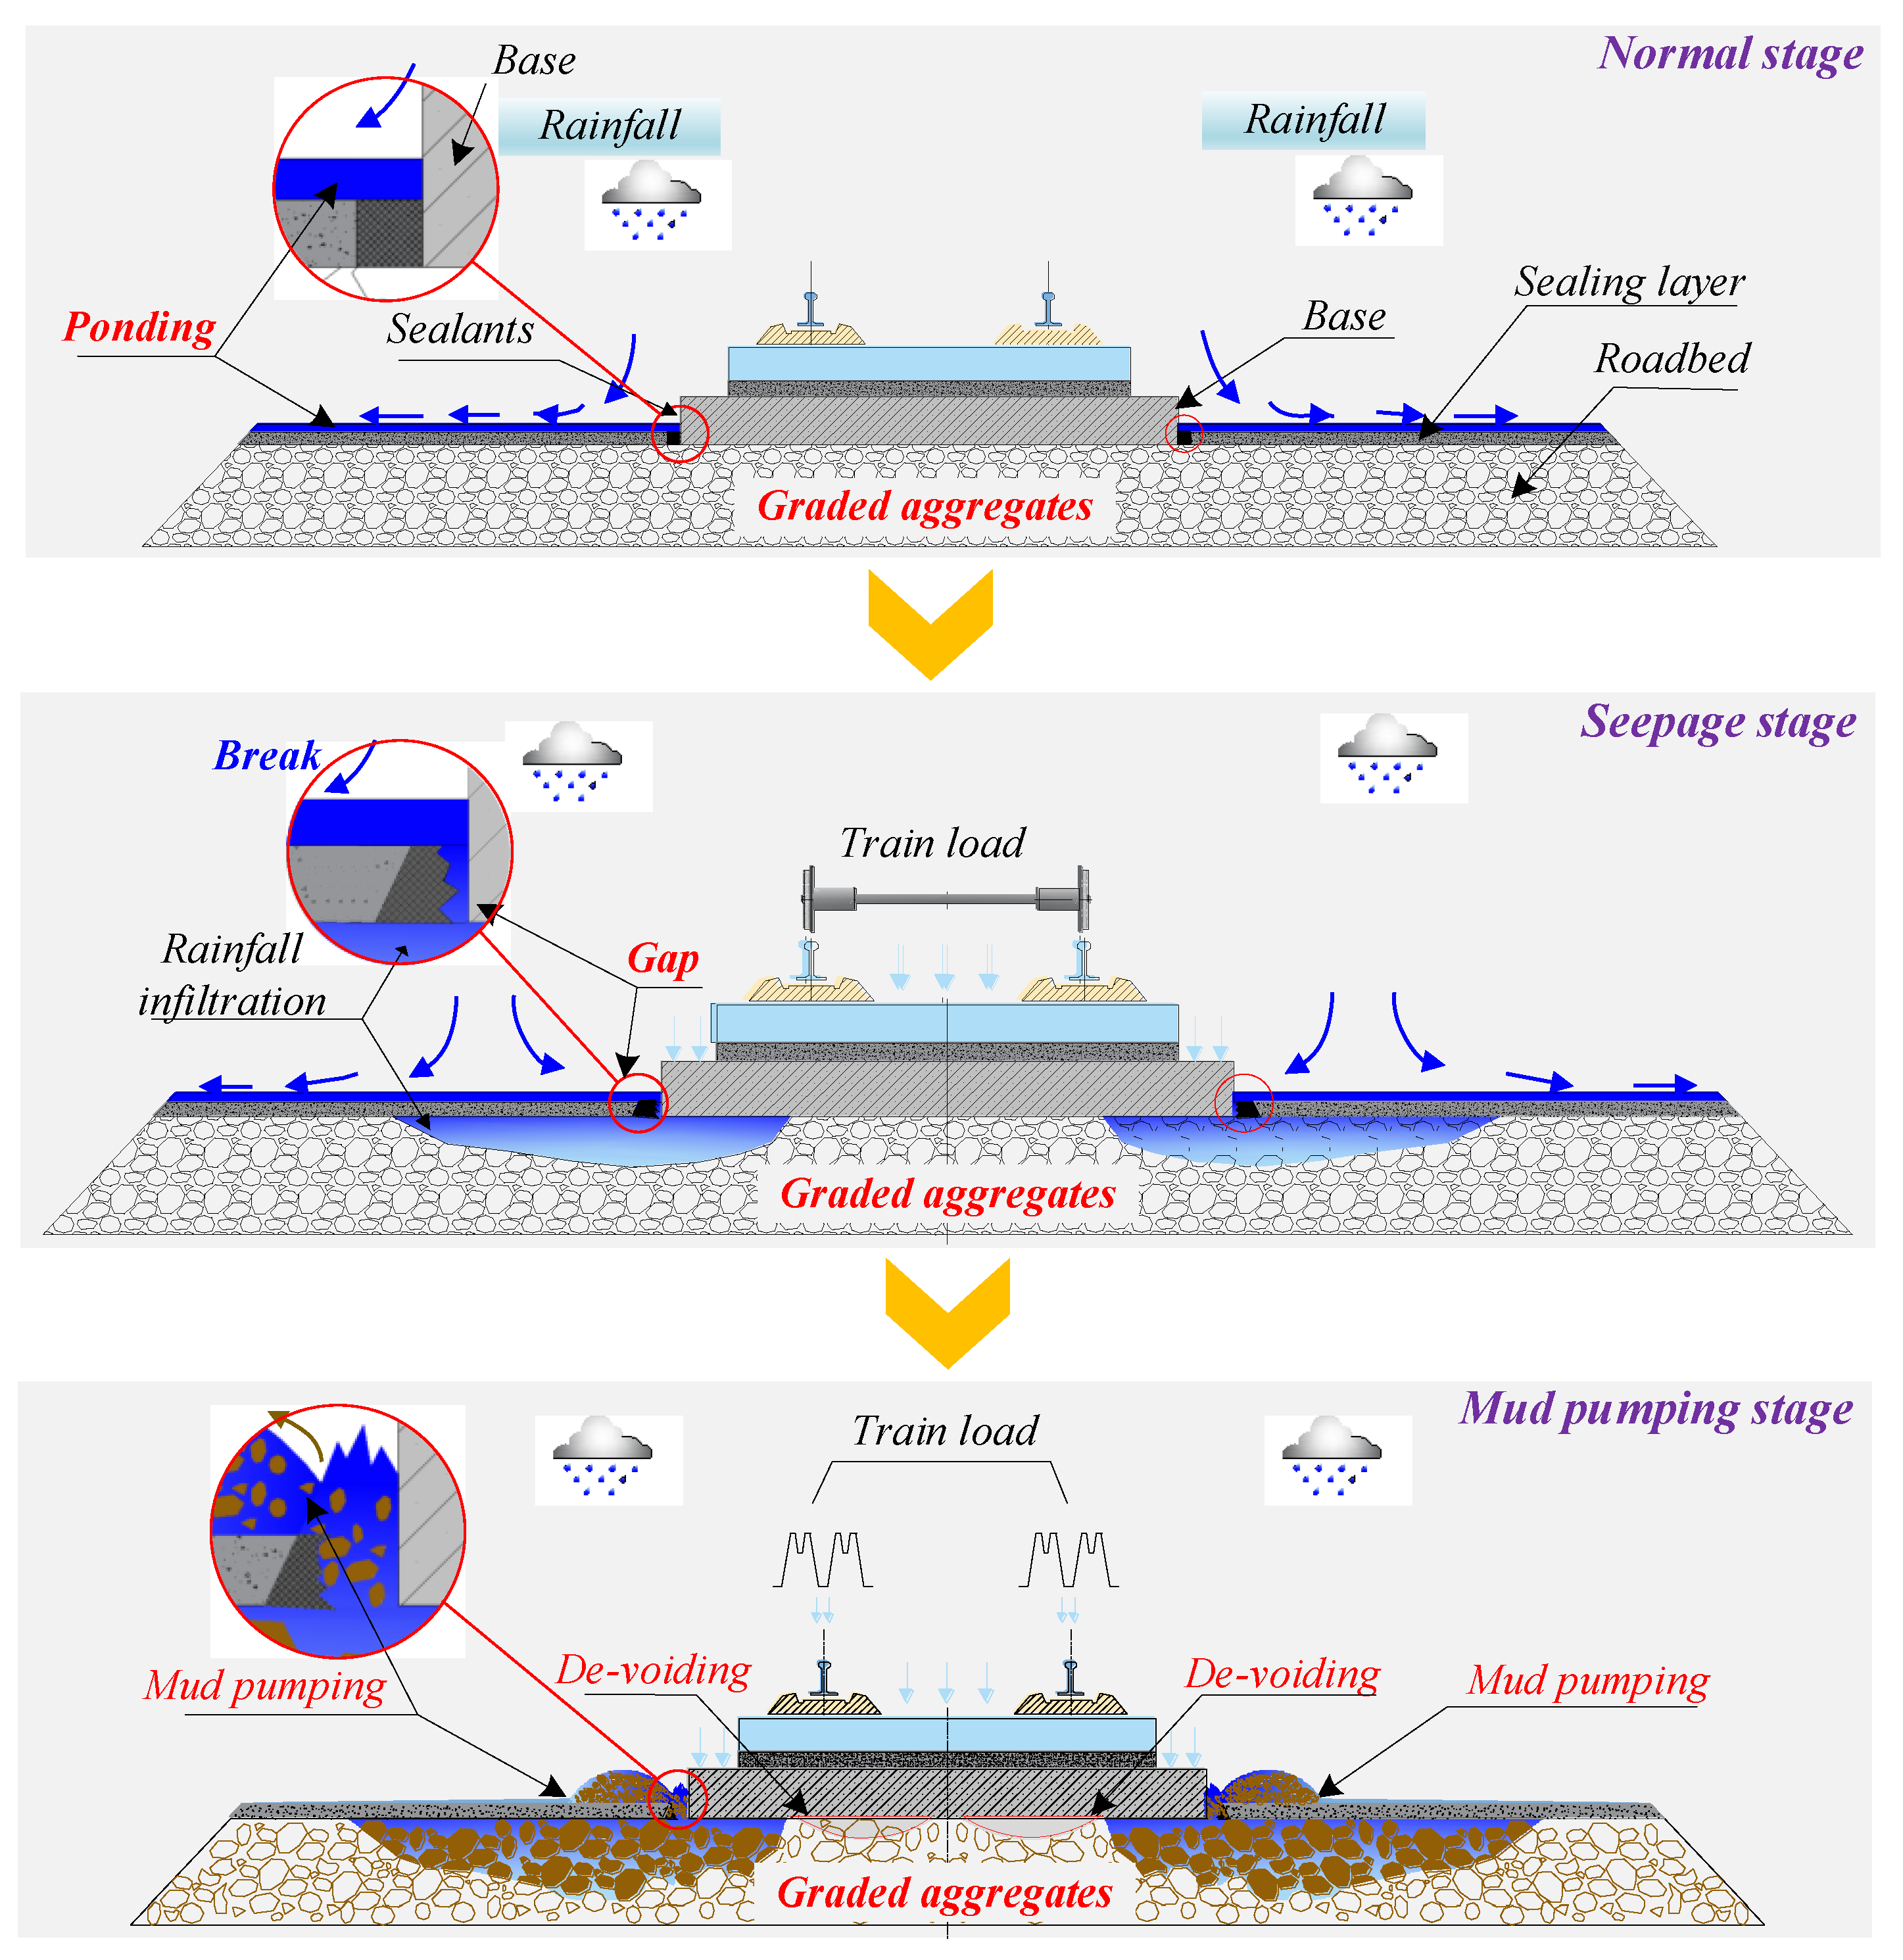
2.1. Graded Aggregate Void Formation
2.2. Hybrid DEM-FDM Model
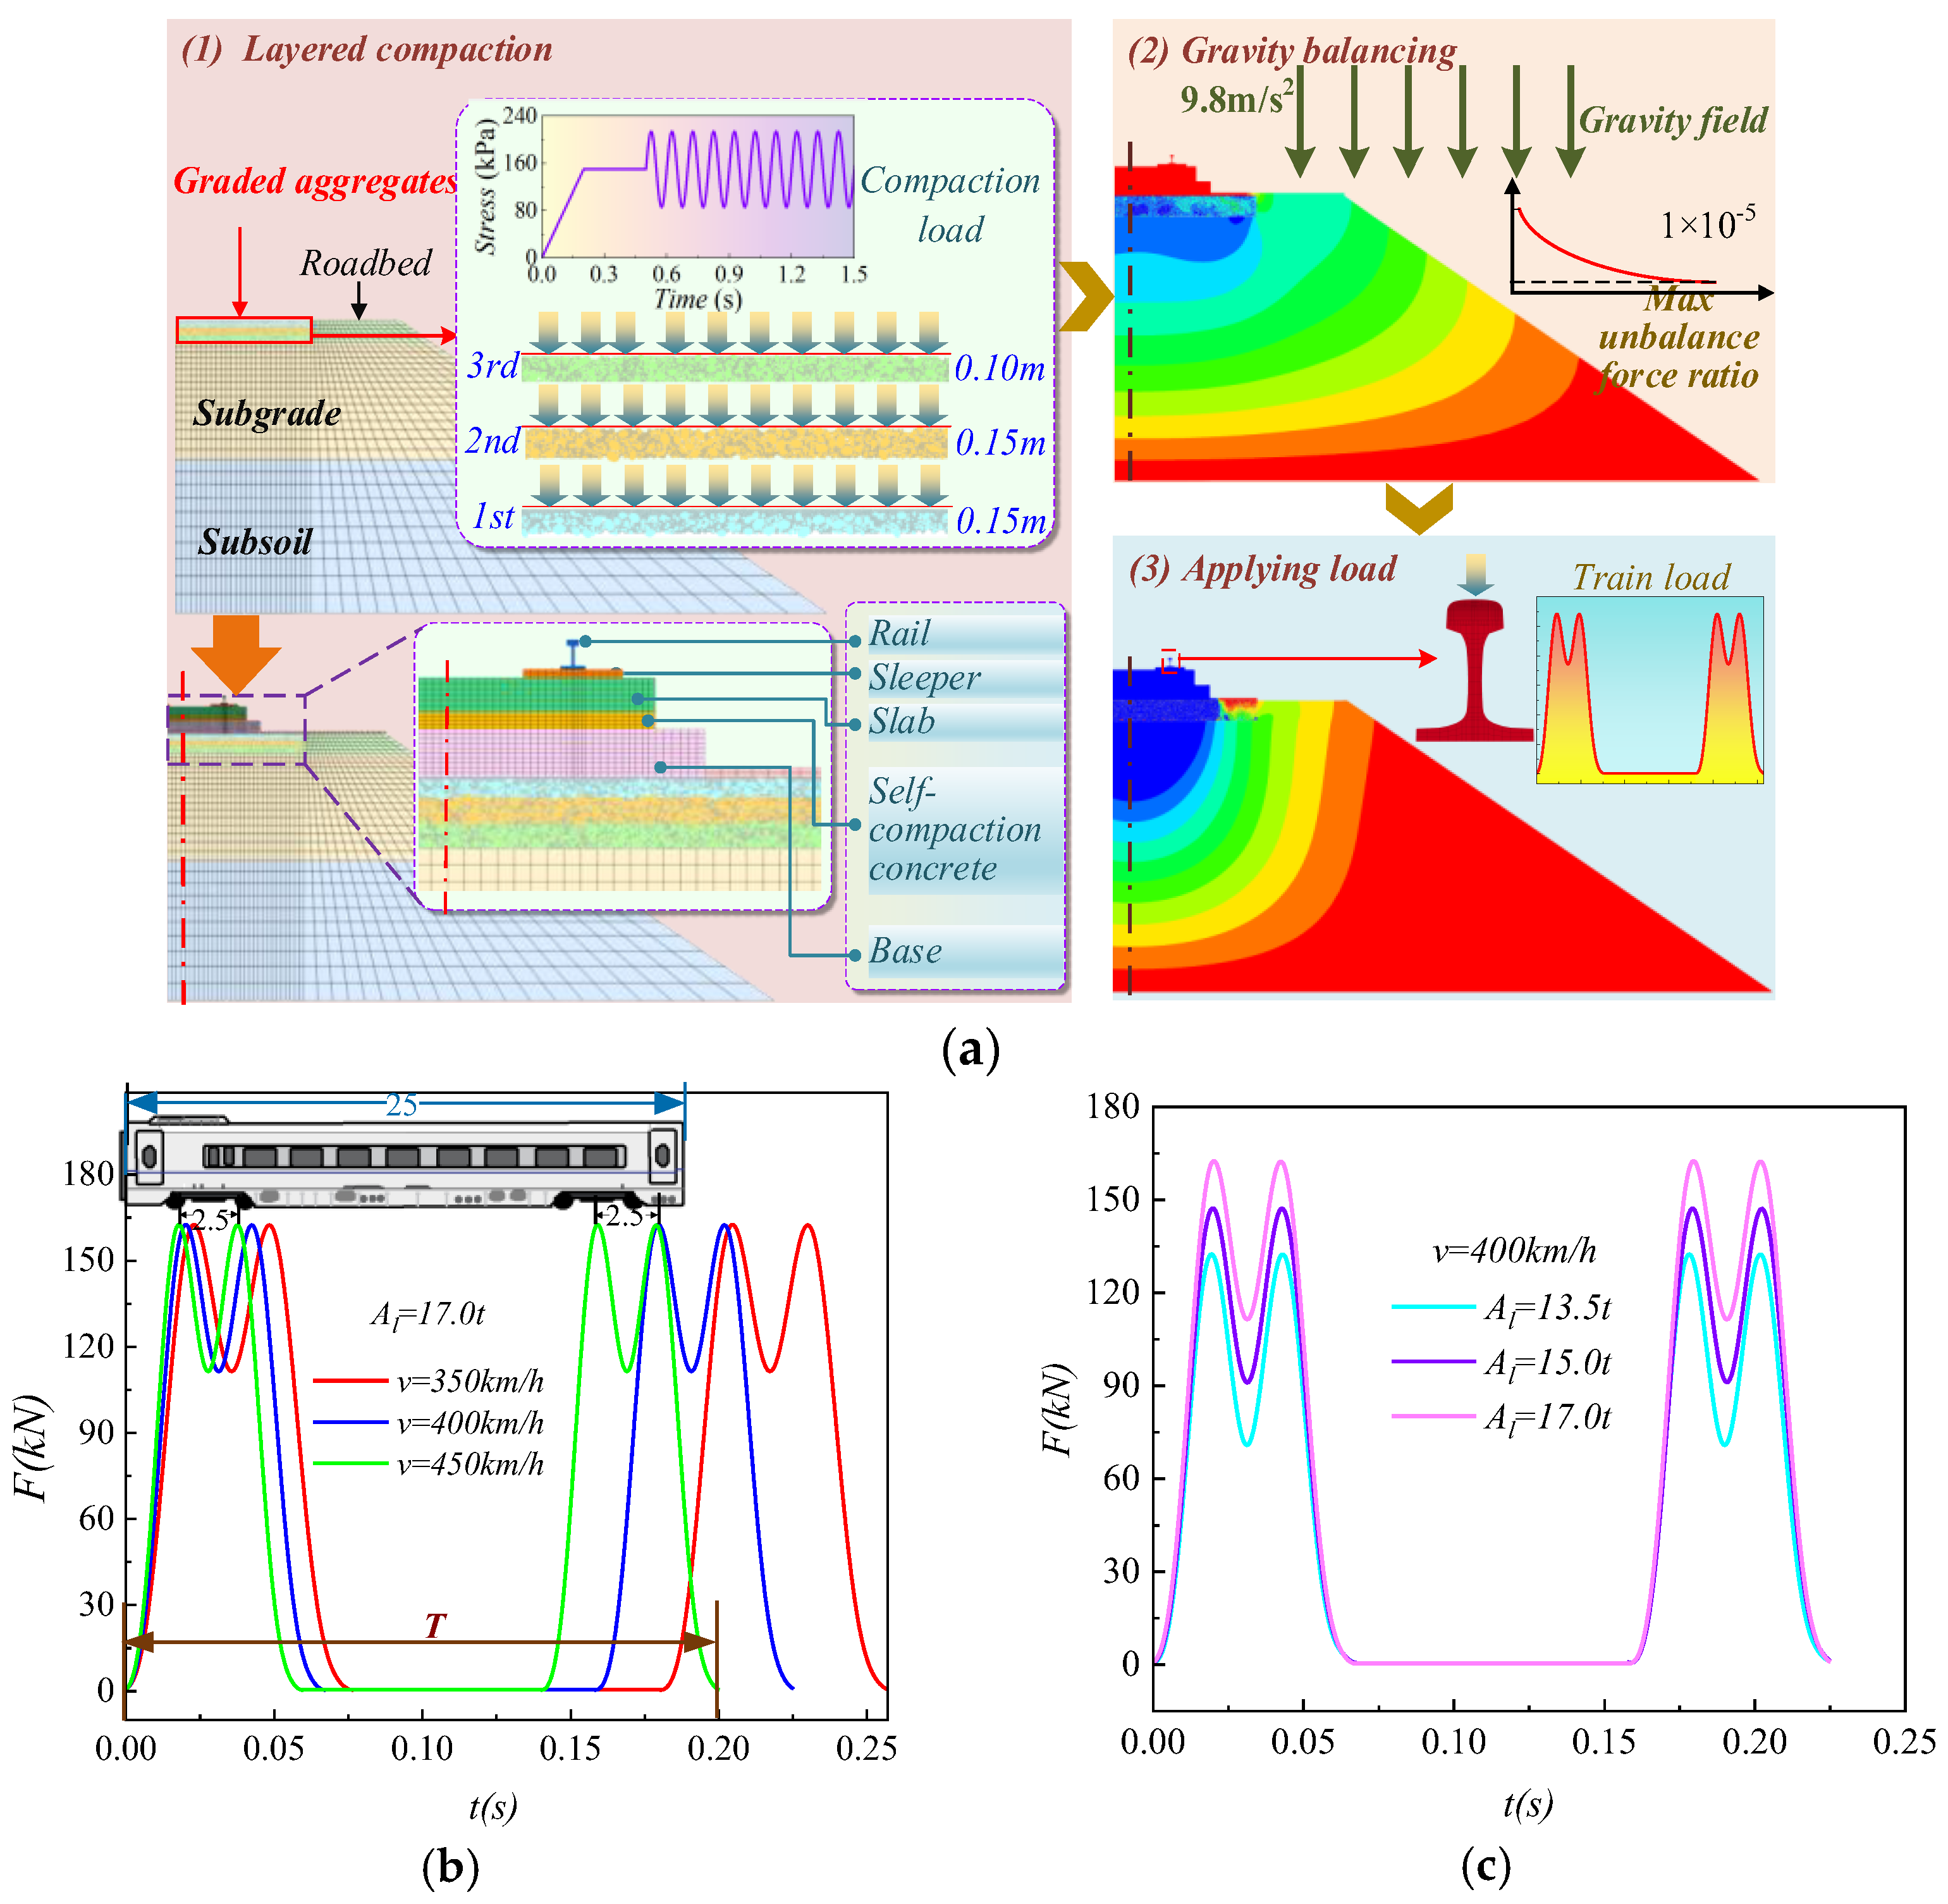
2.2.1. Model Setup
- Step 1: Layered compaction
- Step 2: Gravity balancing
- Step 3: Application load
2.2.2. Model Parameters
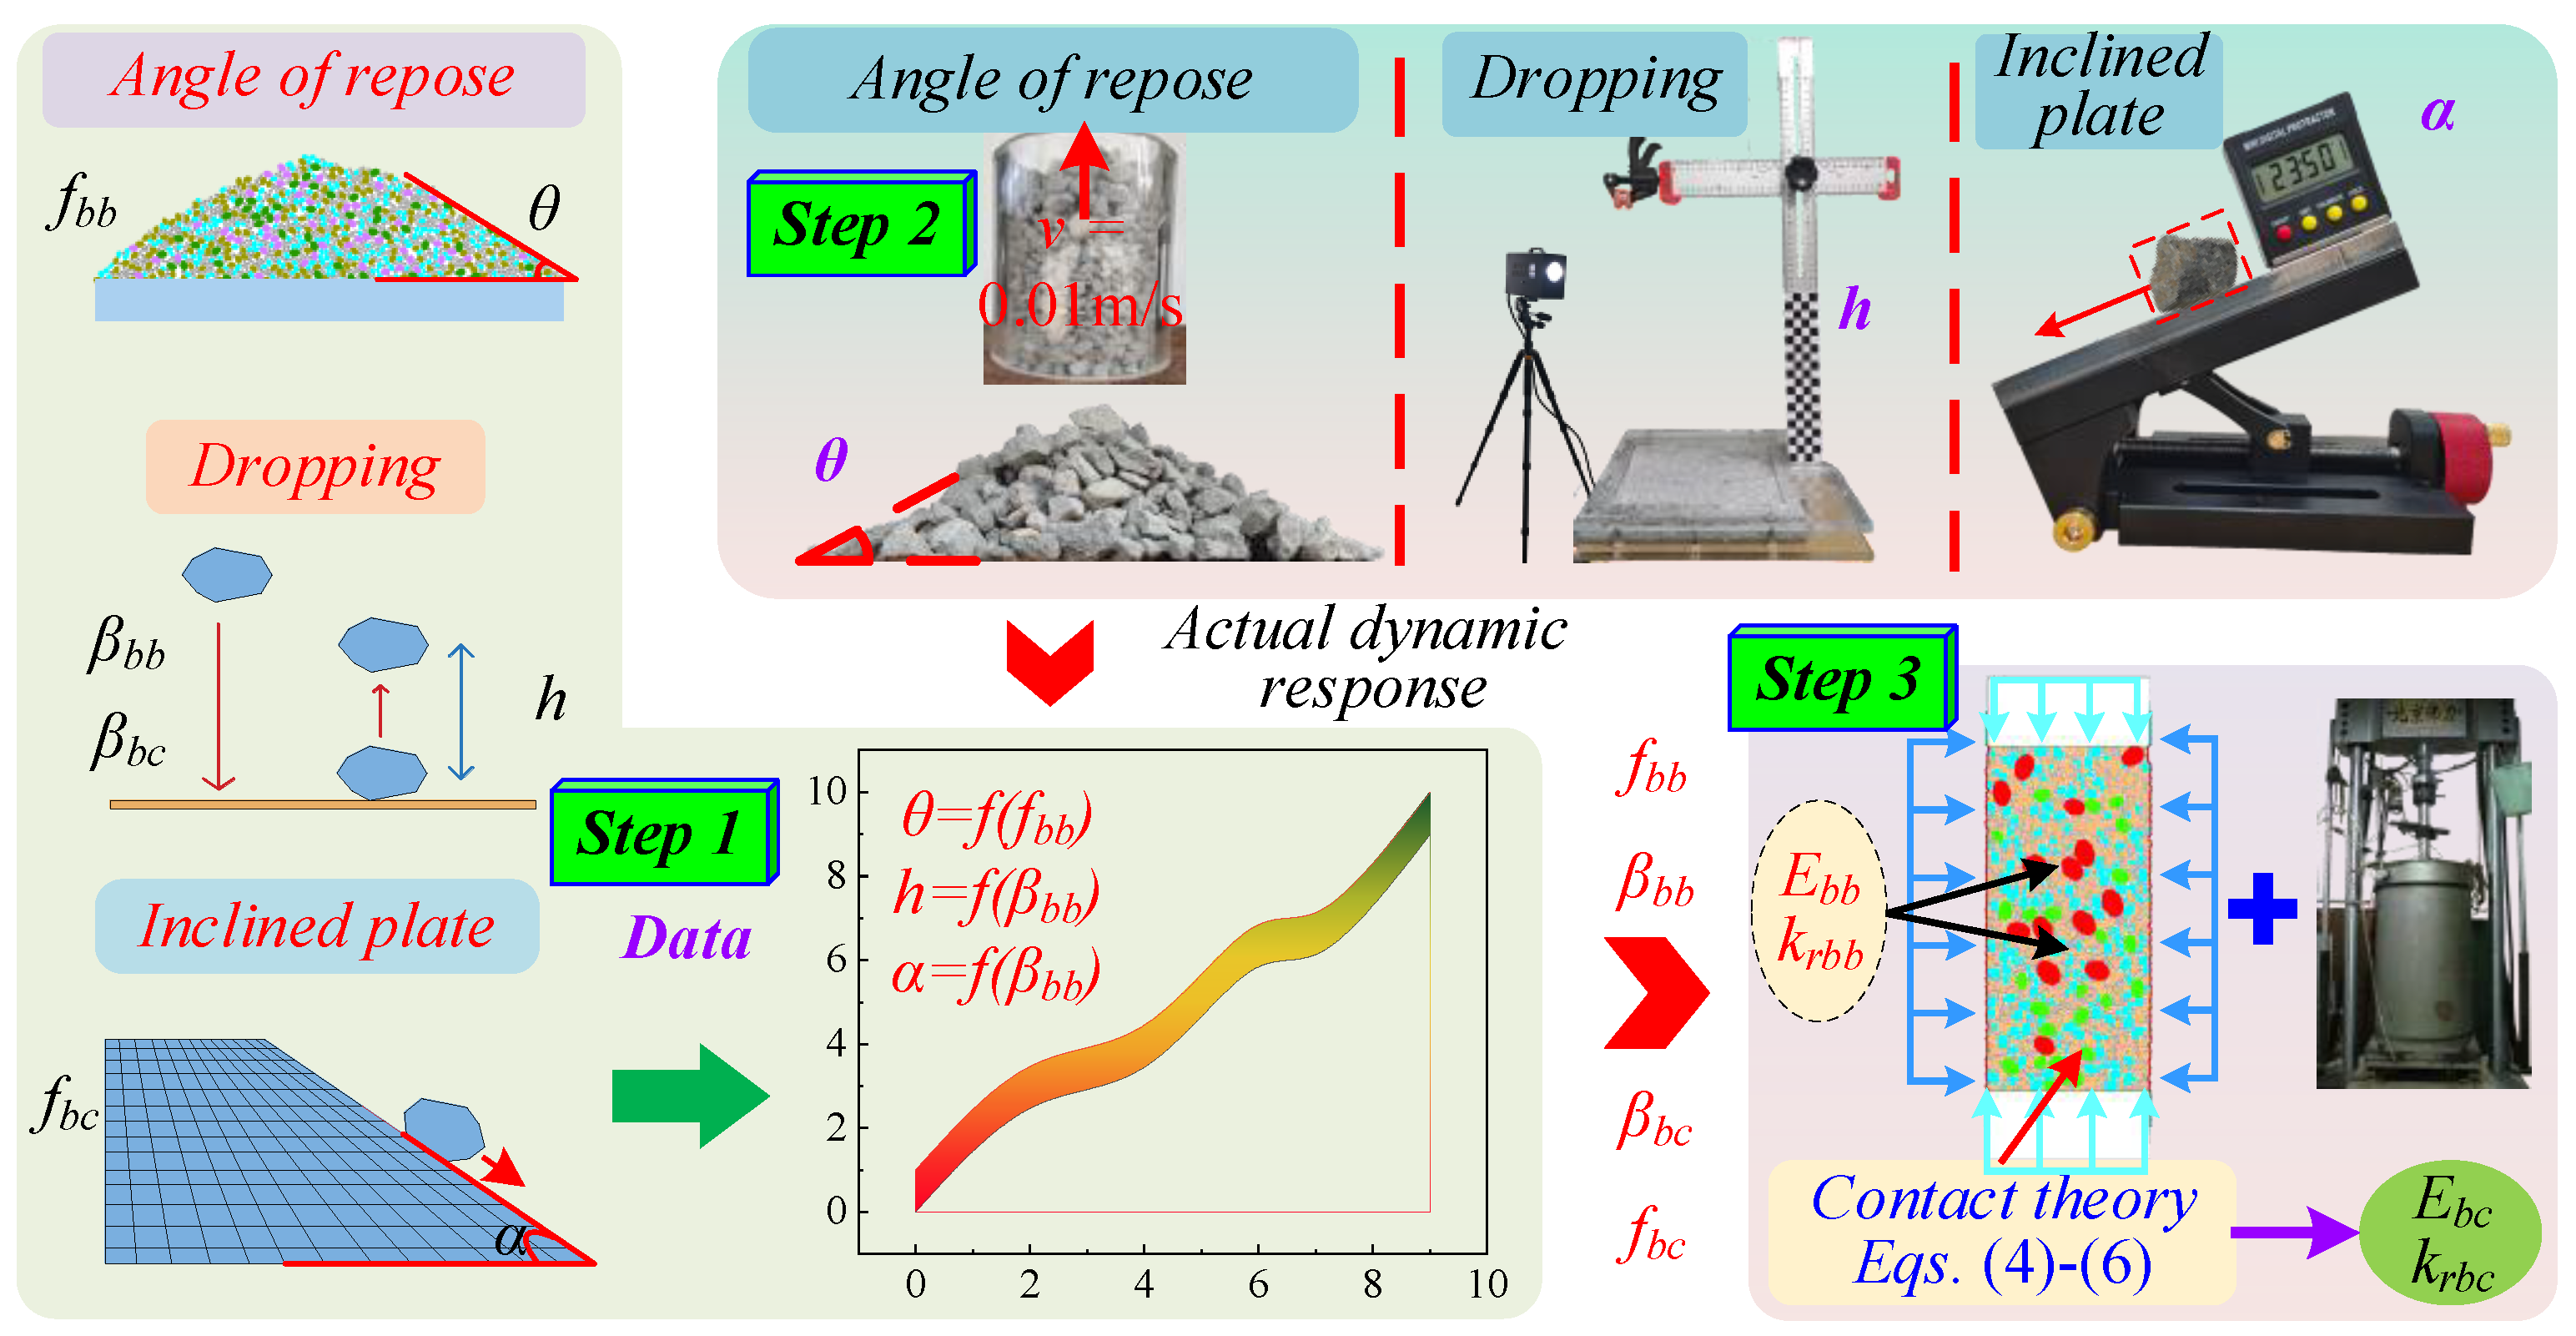
- Step 1: Parametric inversion model
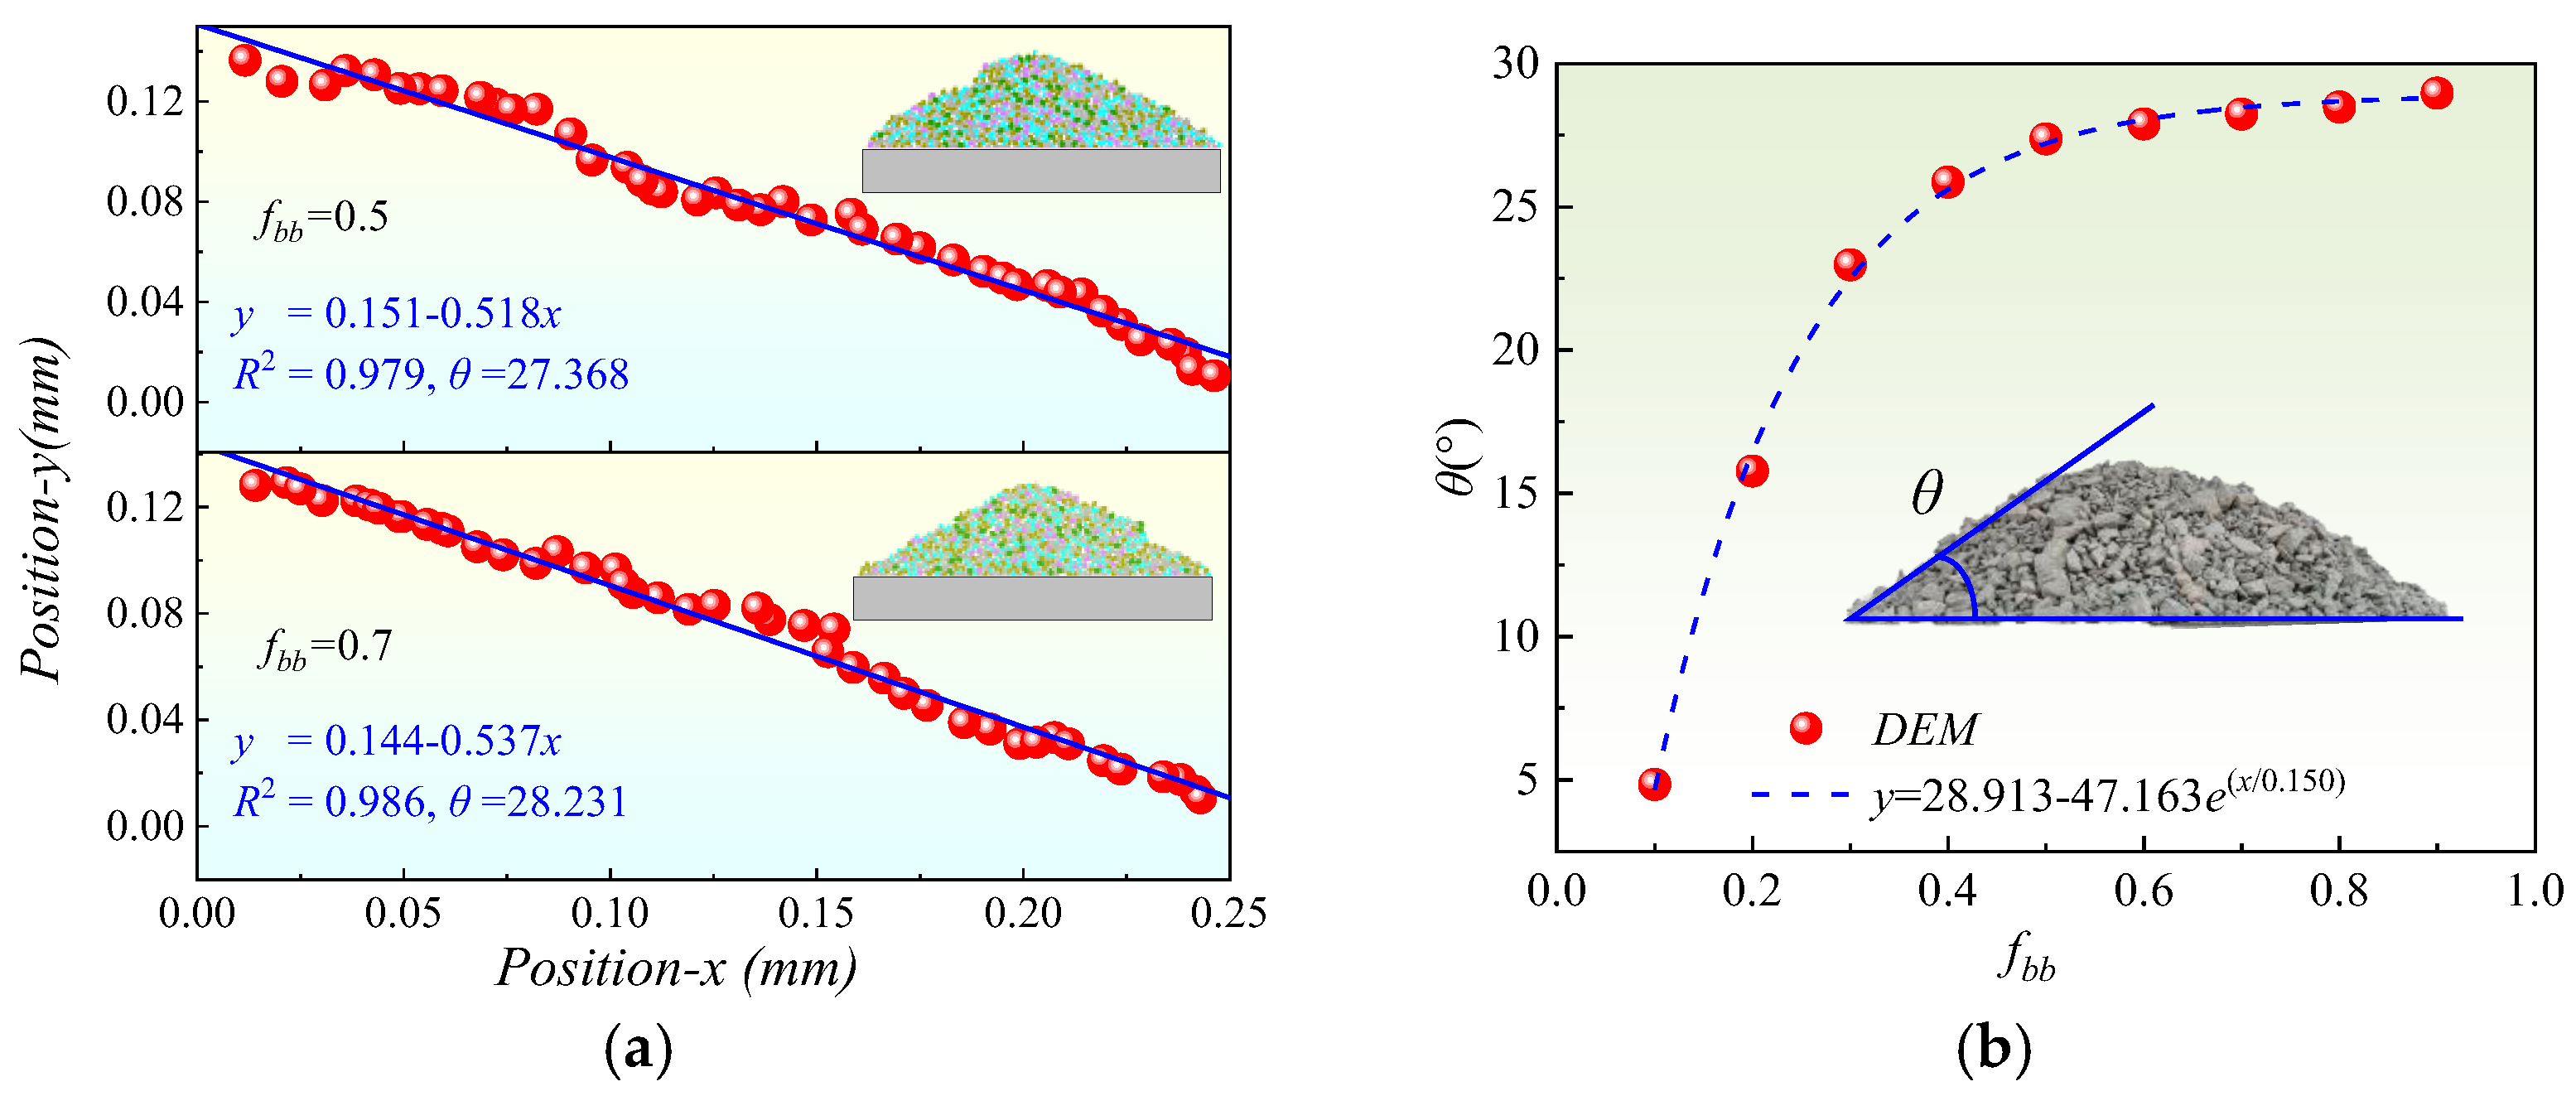
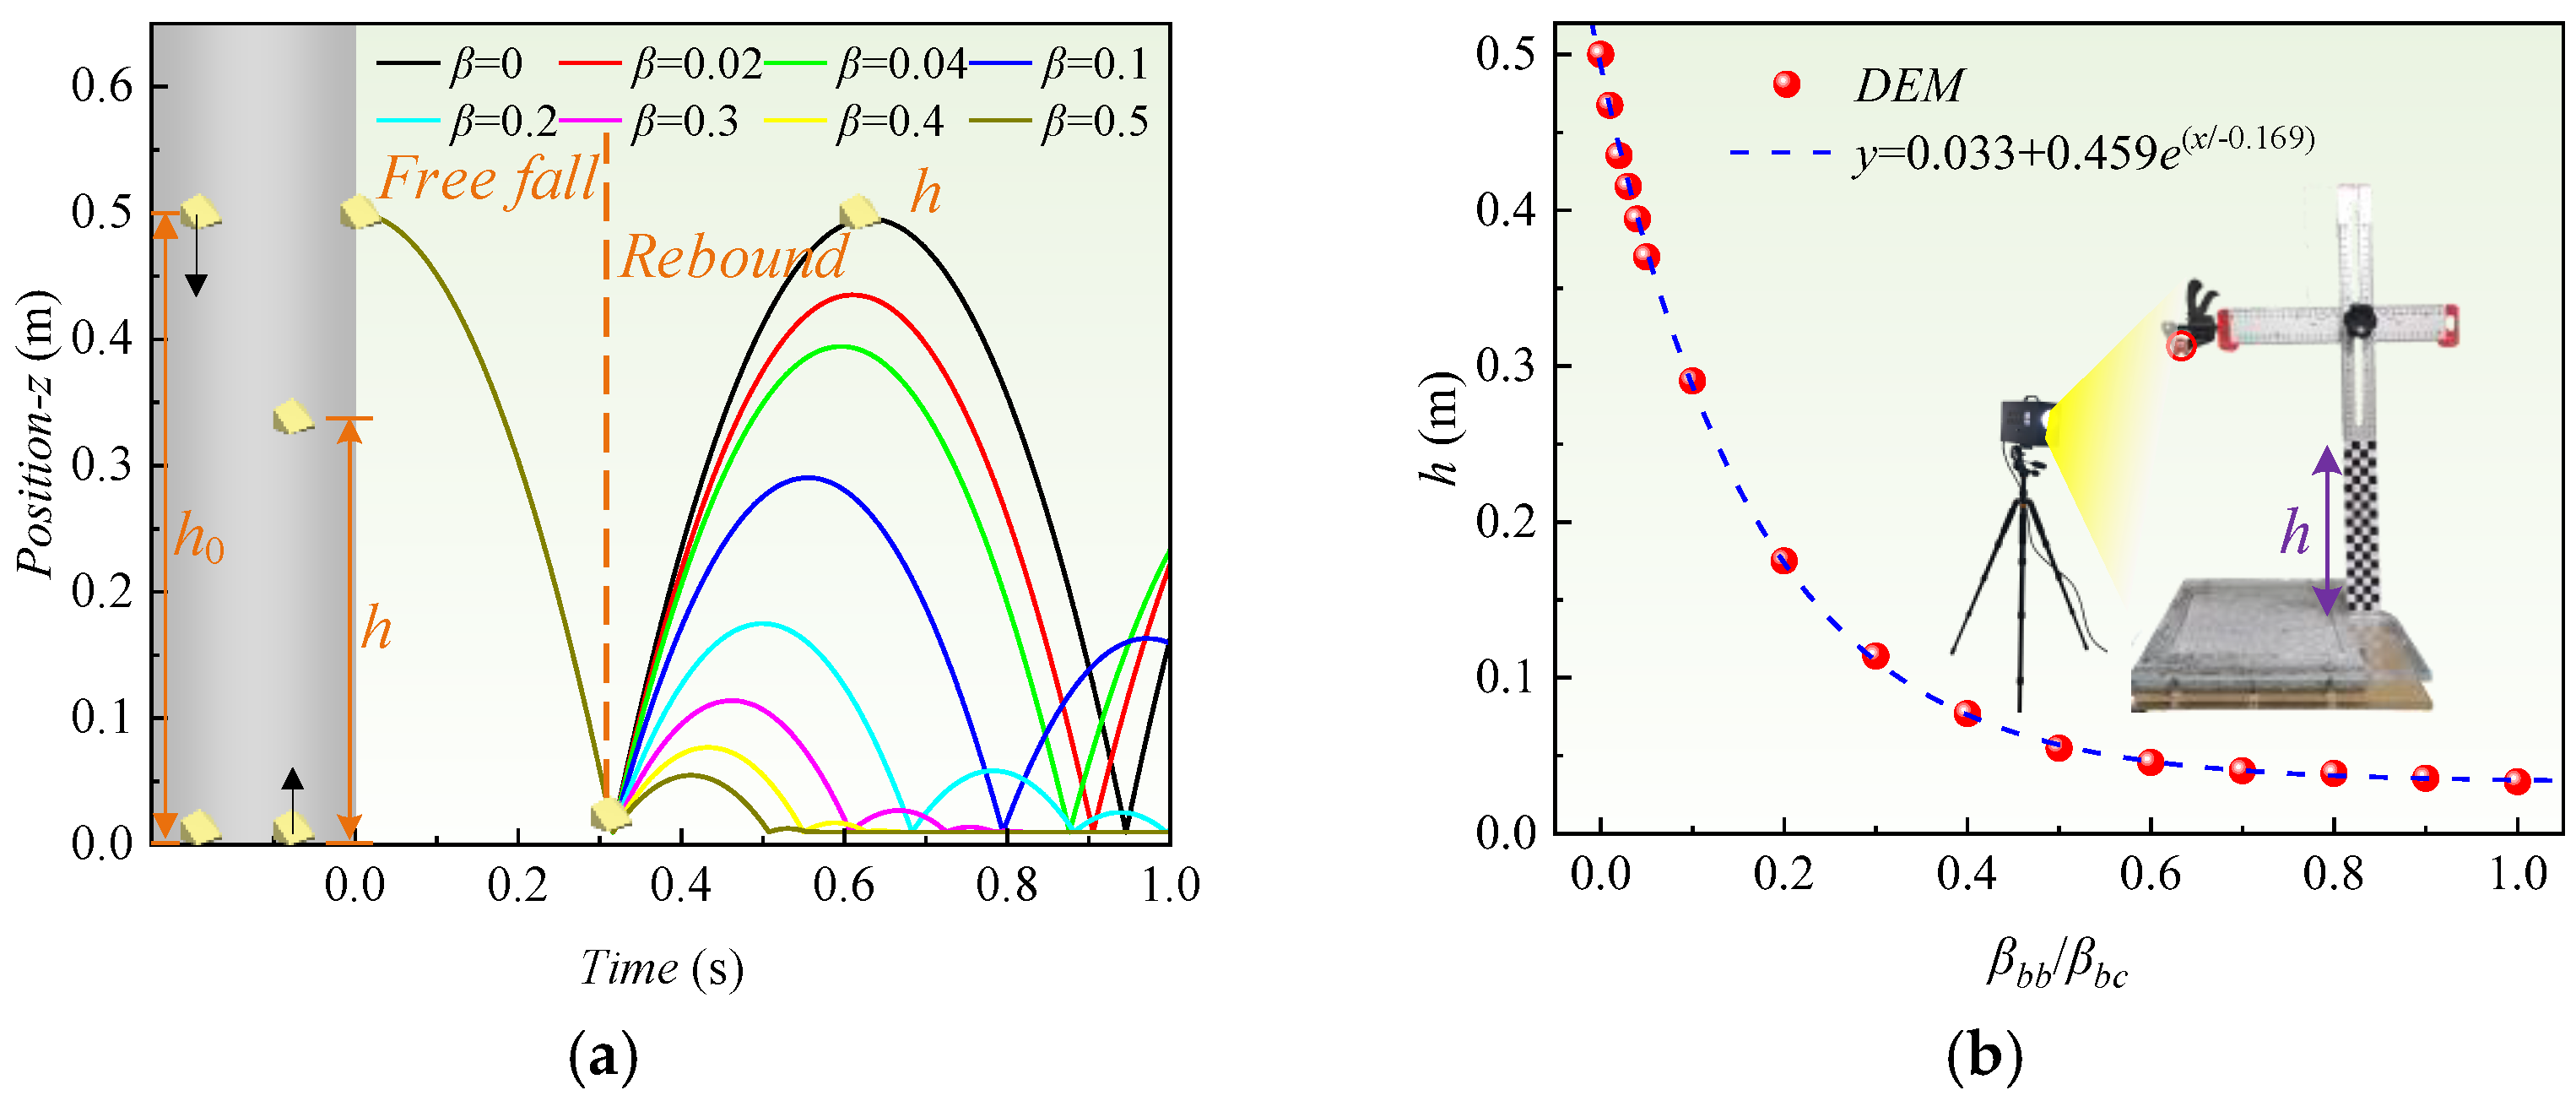
- Step 2: f and β calibration
- Step 3: Ee and kr calibration
2.2.3. Model Verification
2.2.4. Simulation for Graded Aggregate Void Formation
3. Results and Analysis
3.1. Dynamic Response
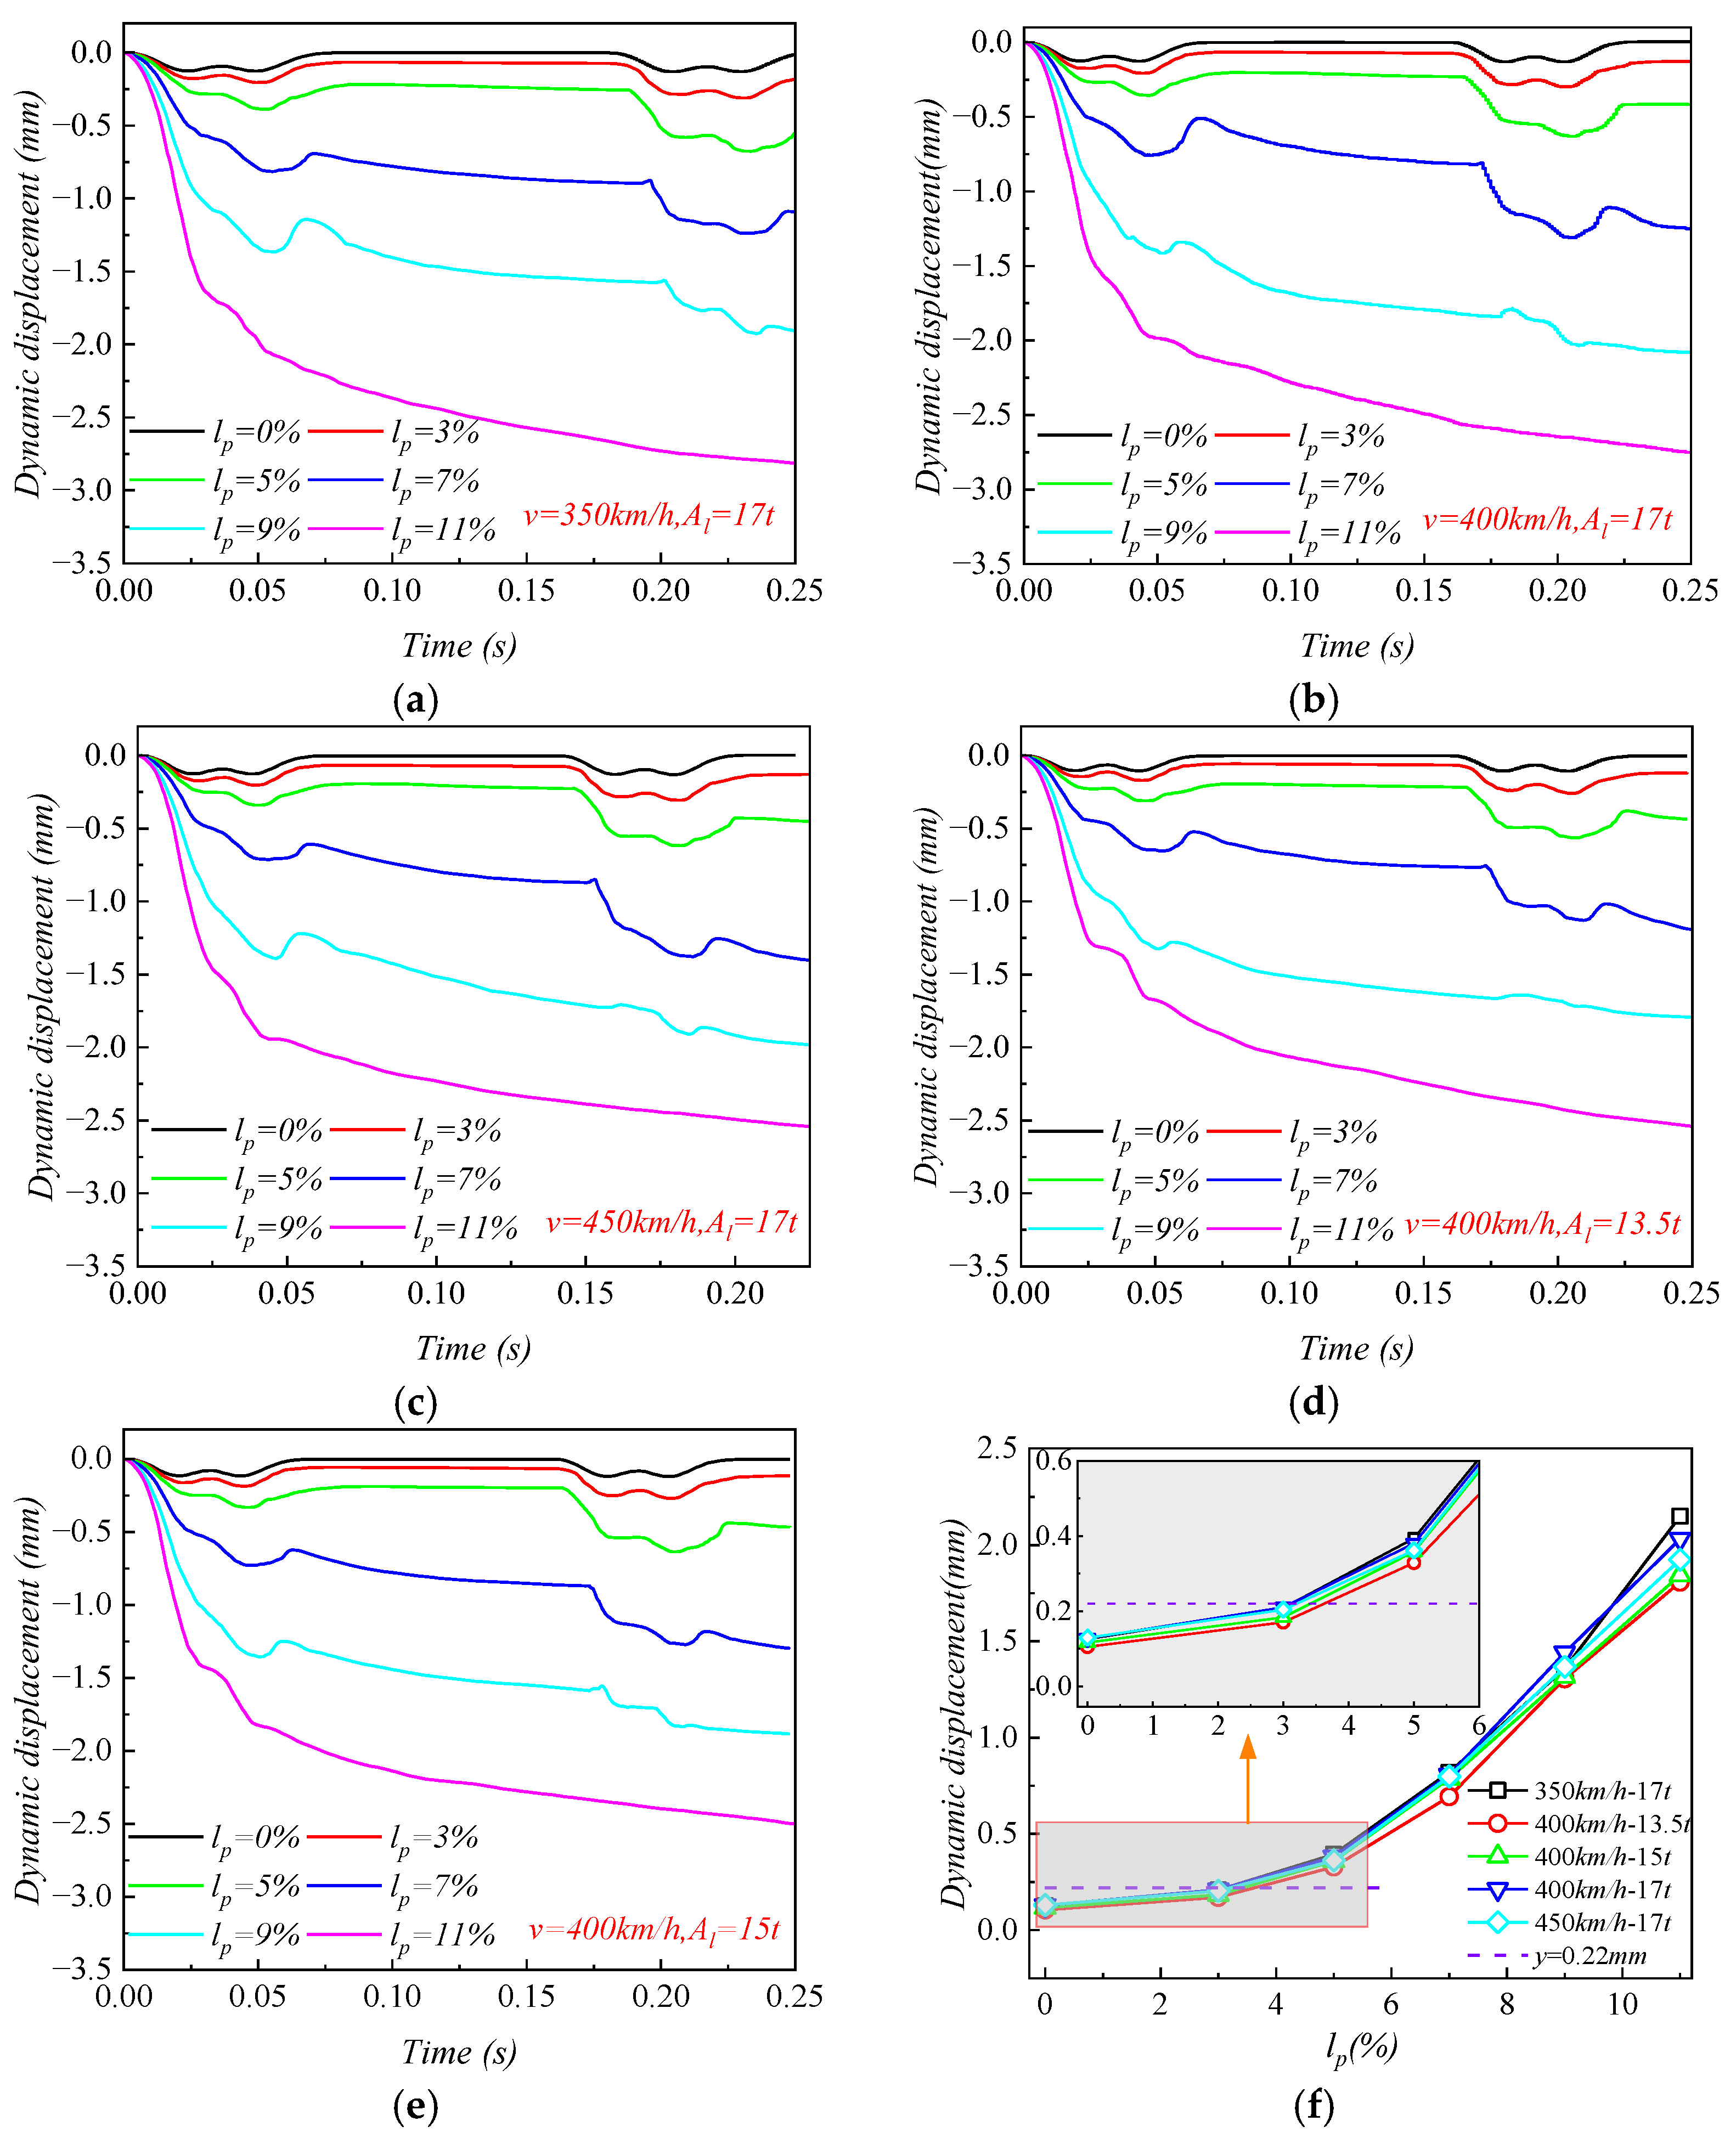
3.1.1. Roadbed Dynamic Displacement
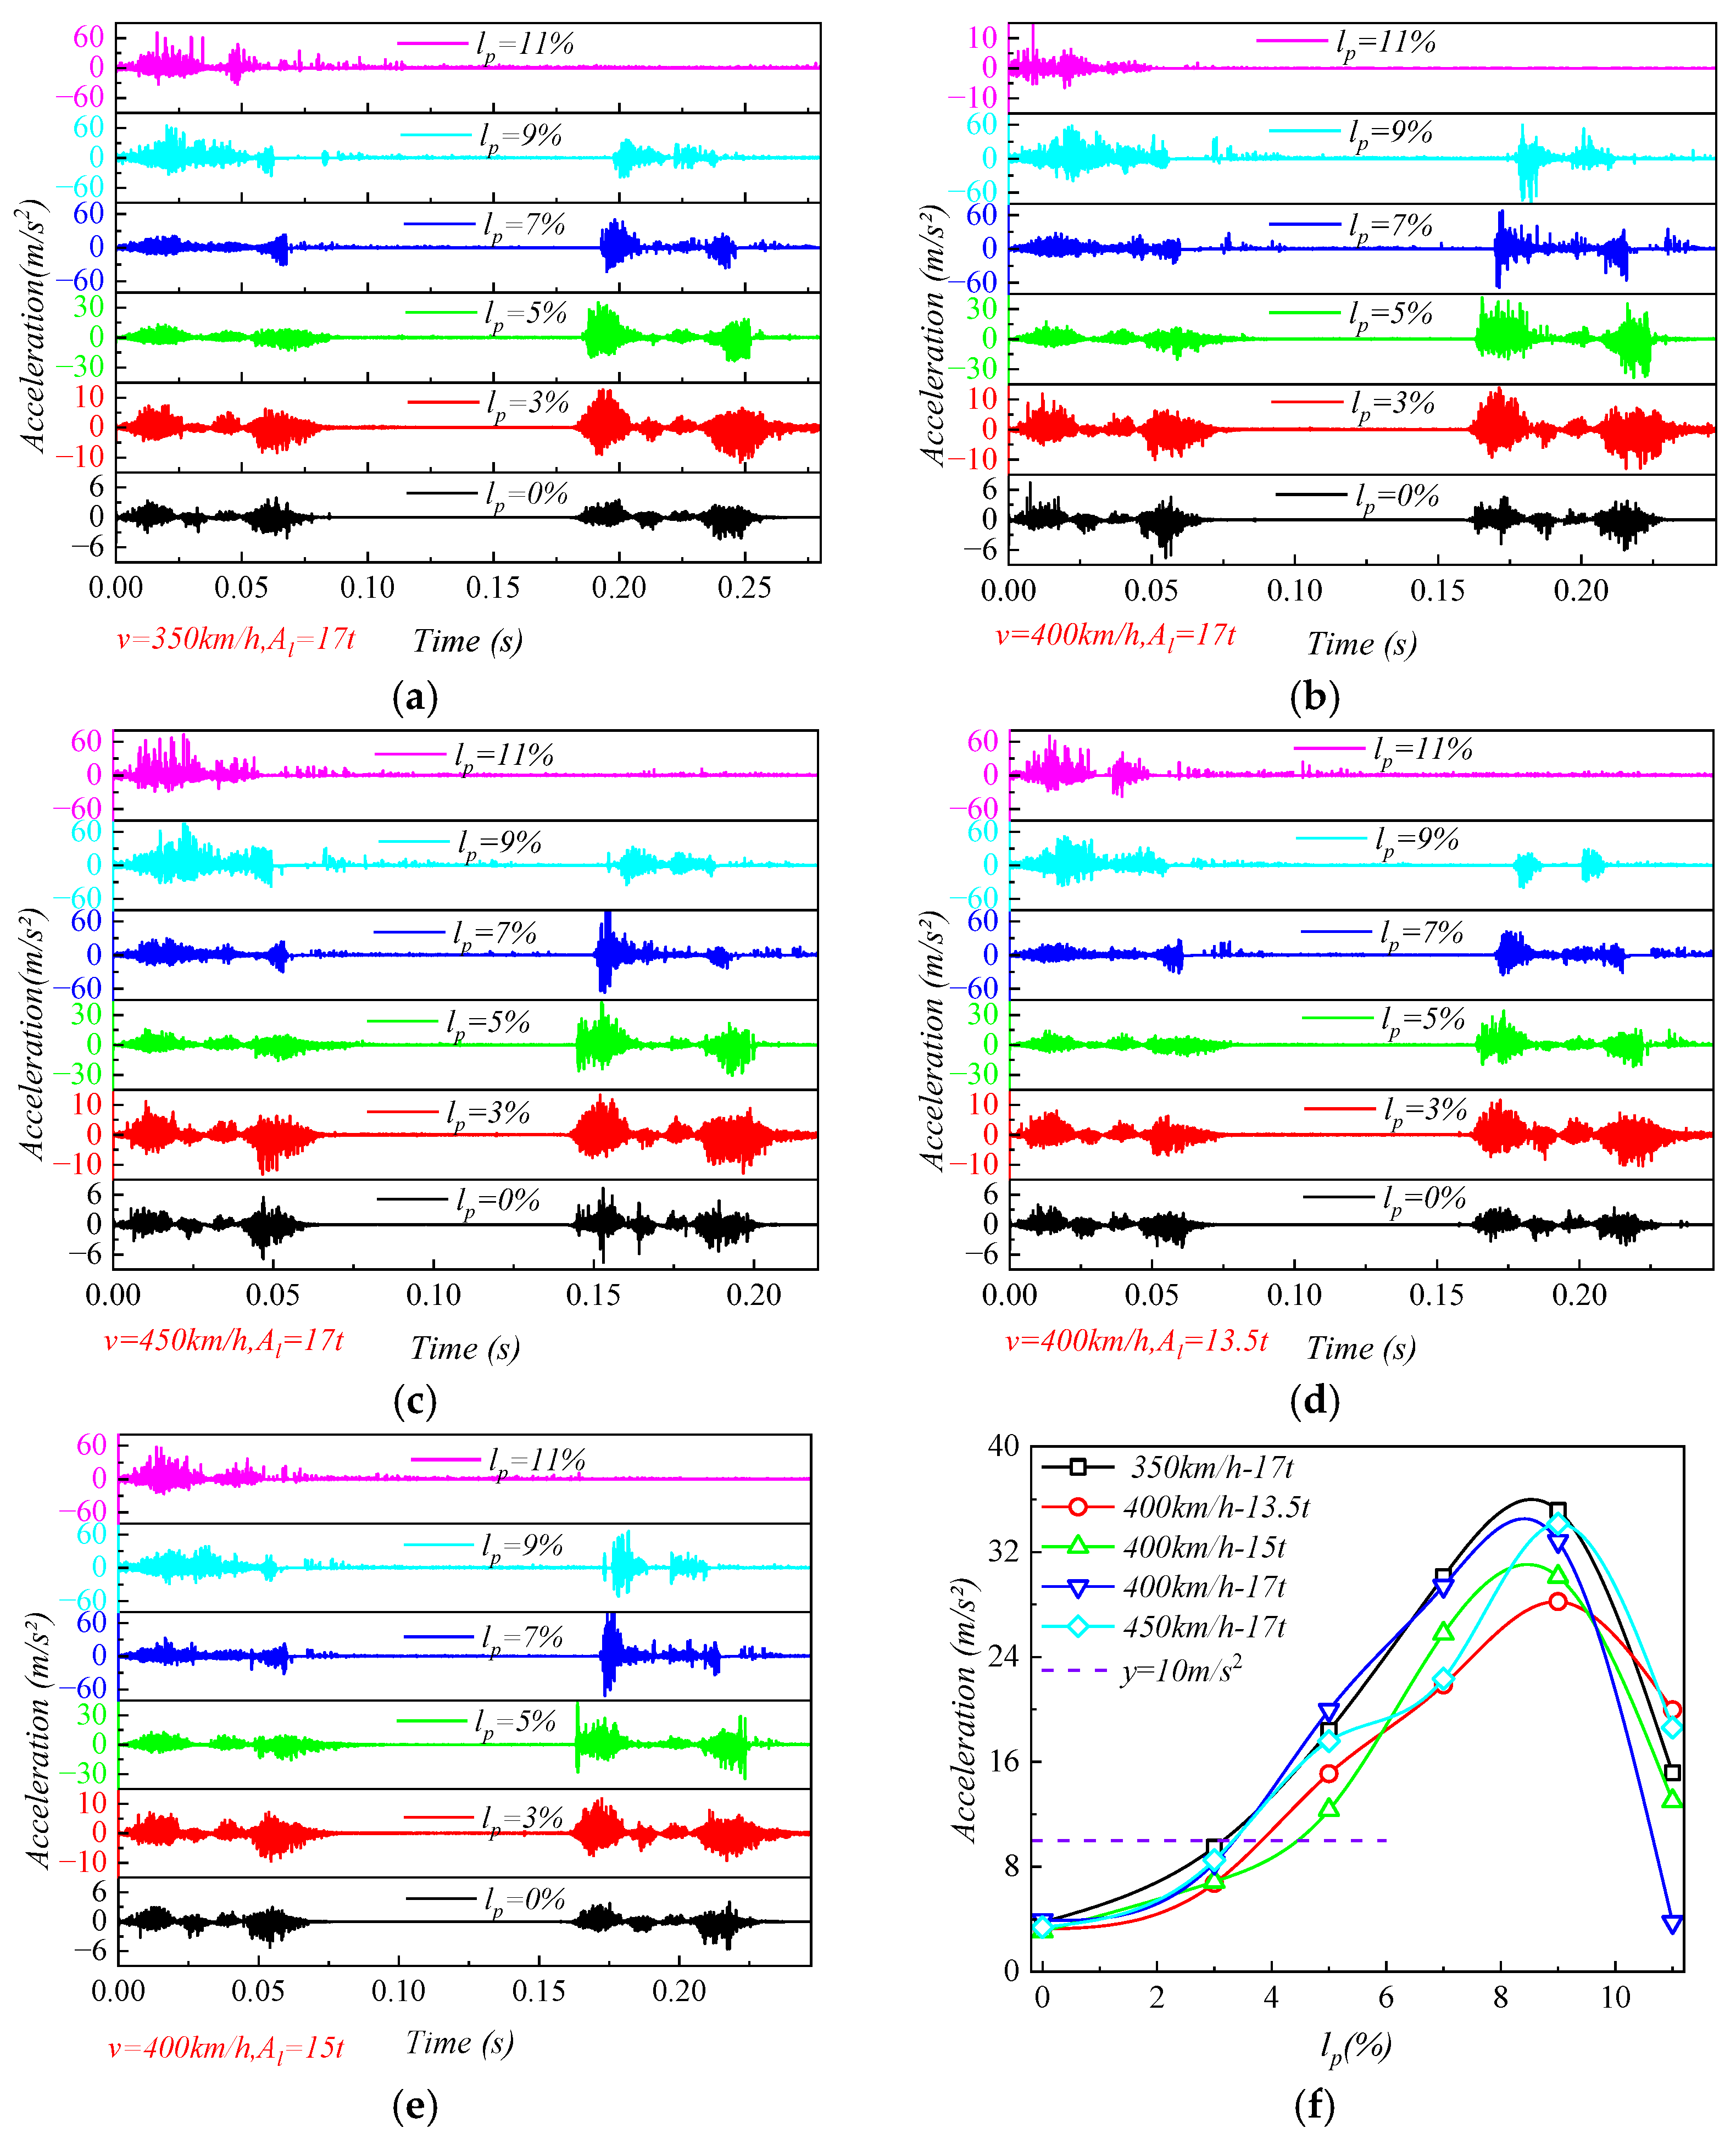
3.1.2. Roadbed Acceleration
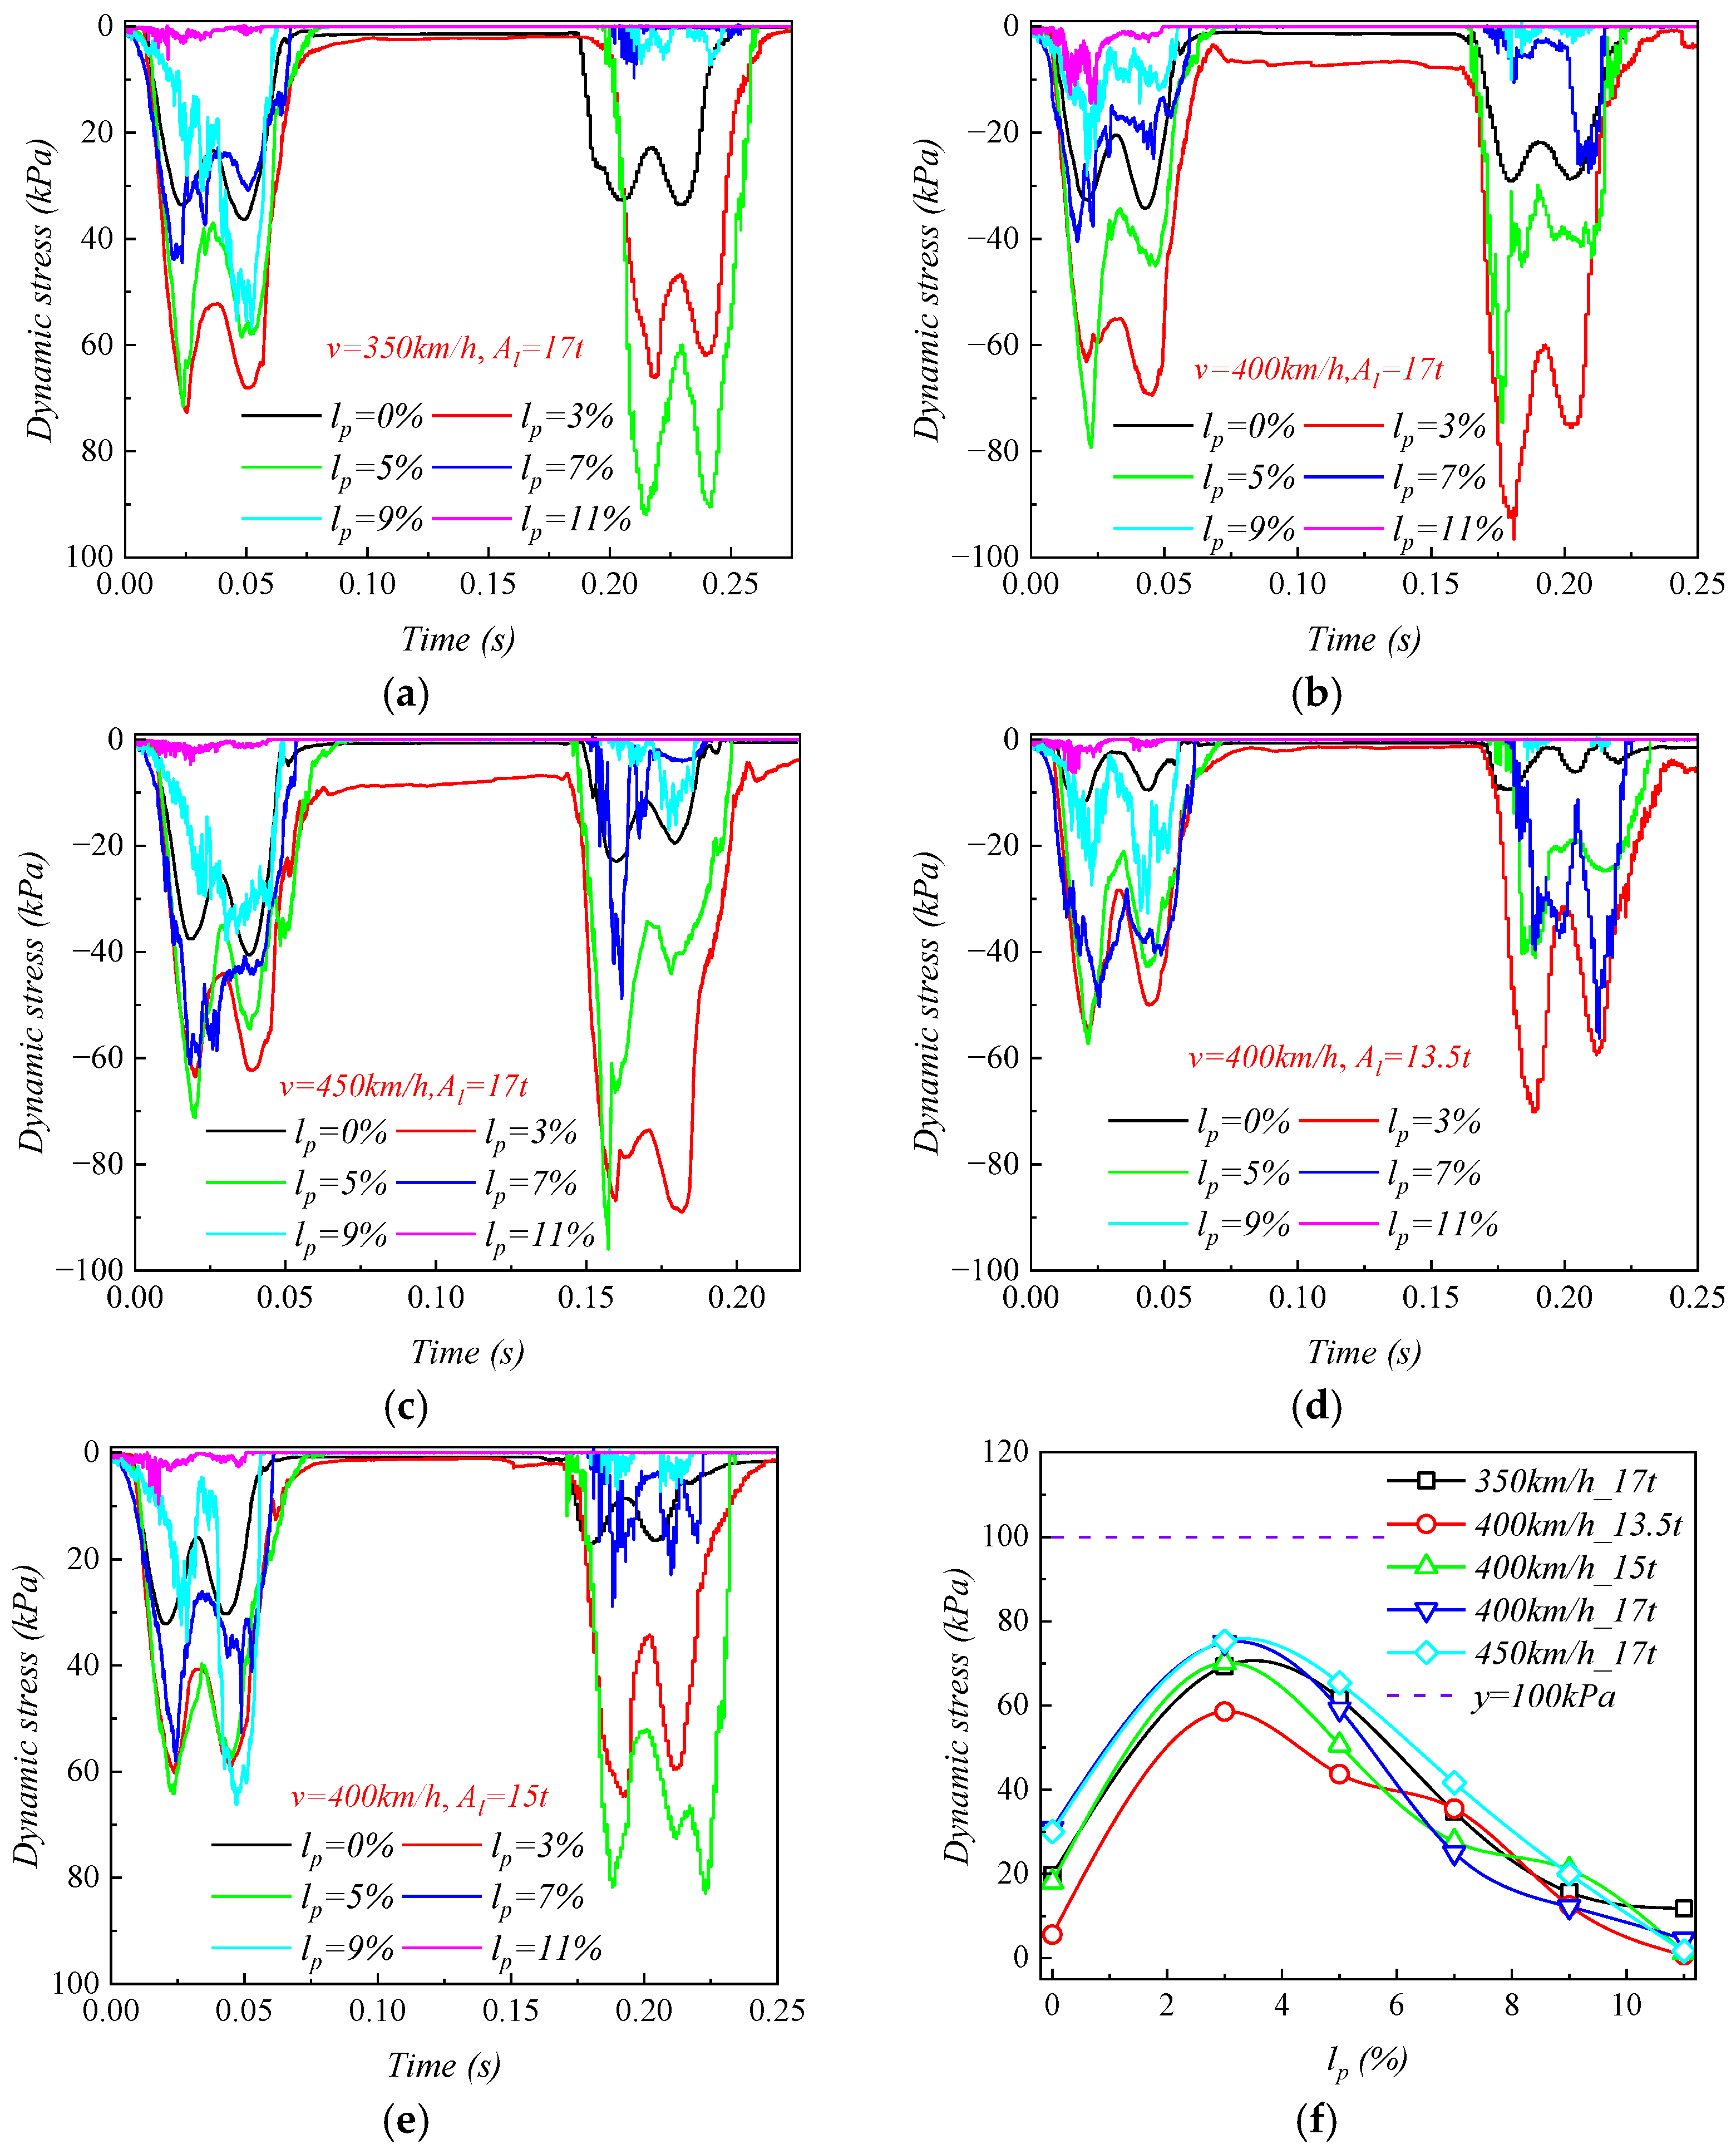
3.1.3. Roadbed Dynamic Stress
3.2. Mesoscopic Analysis
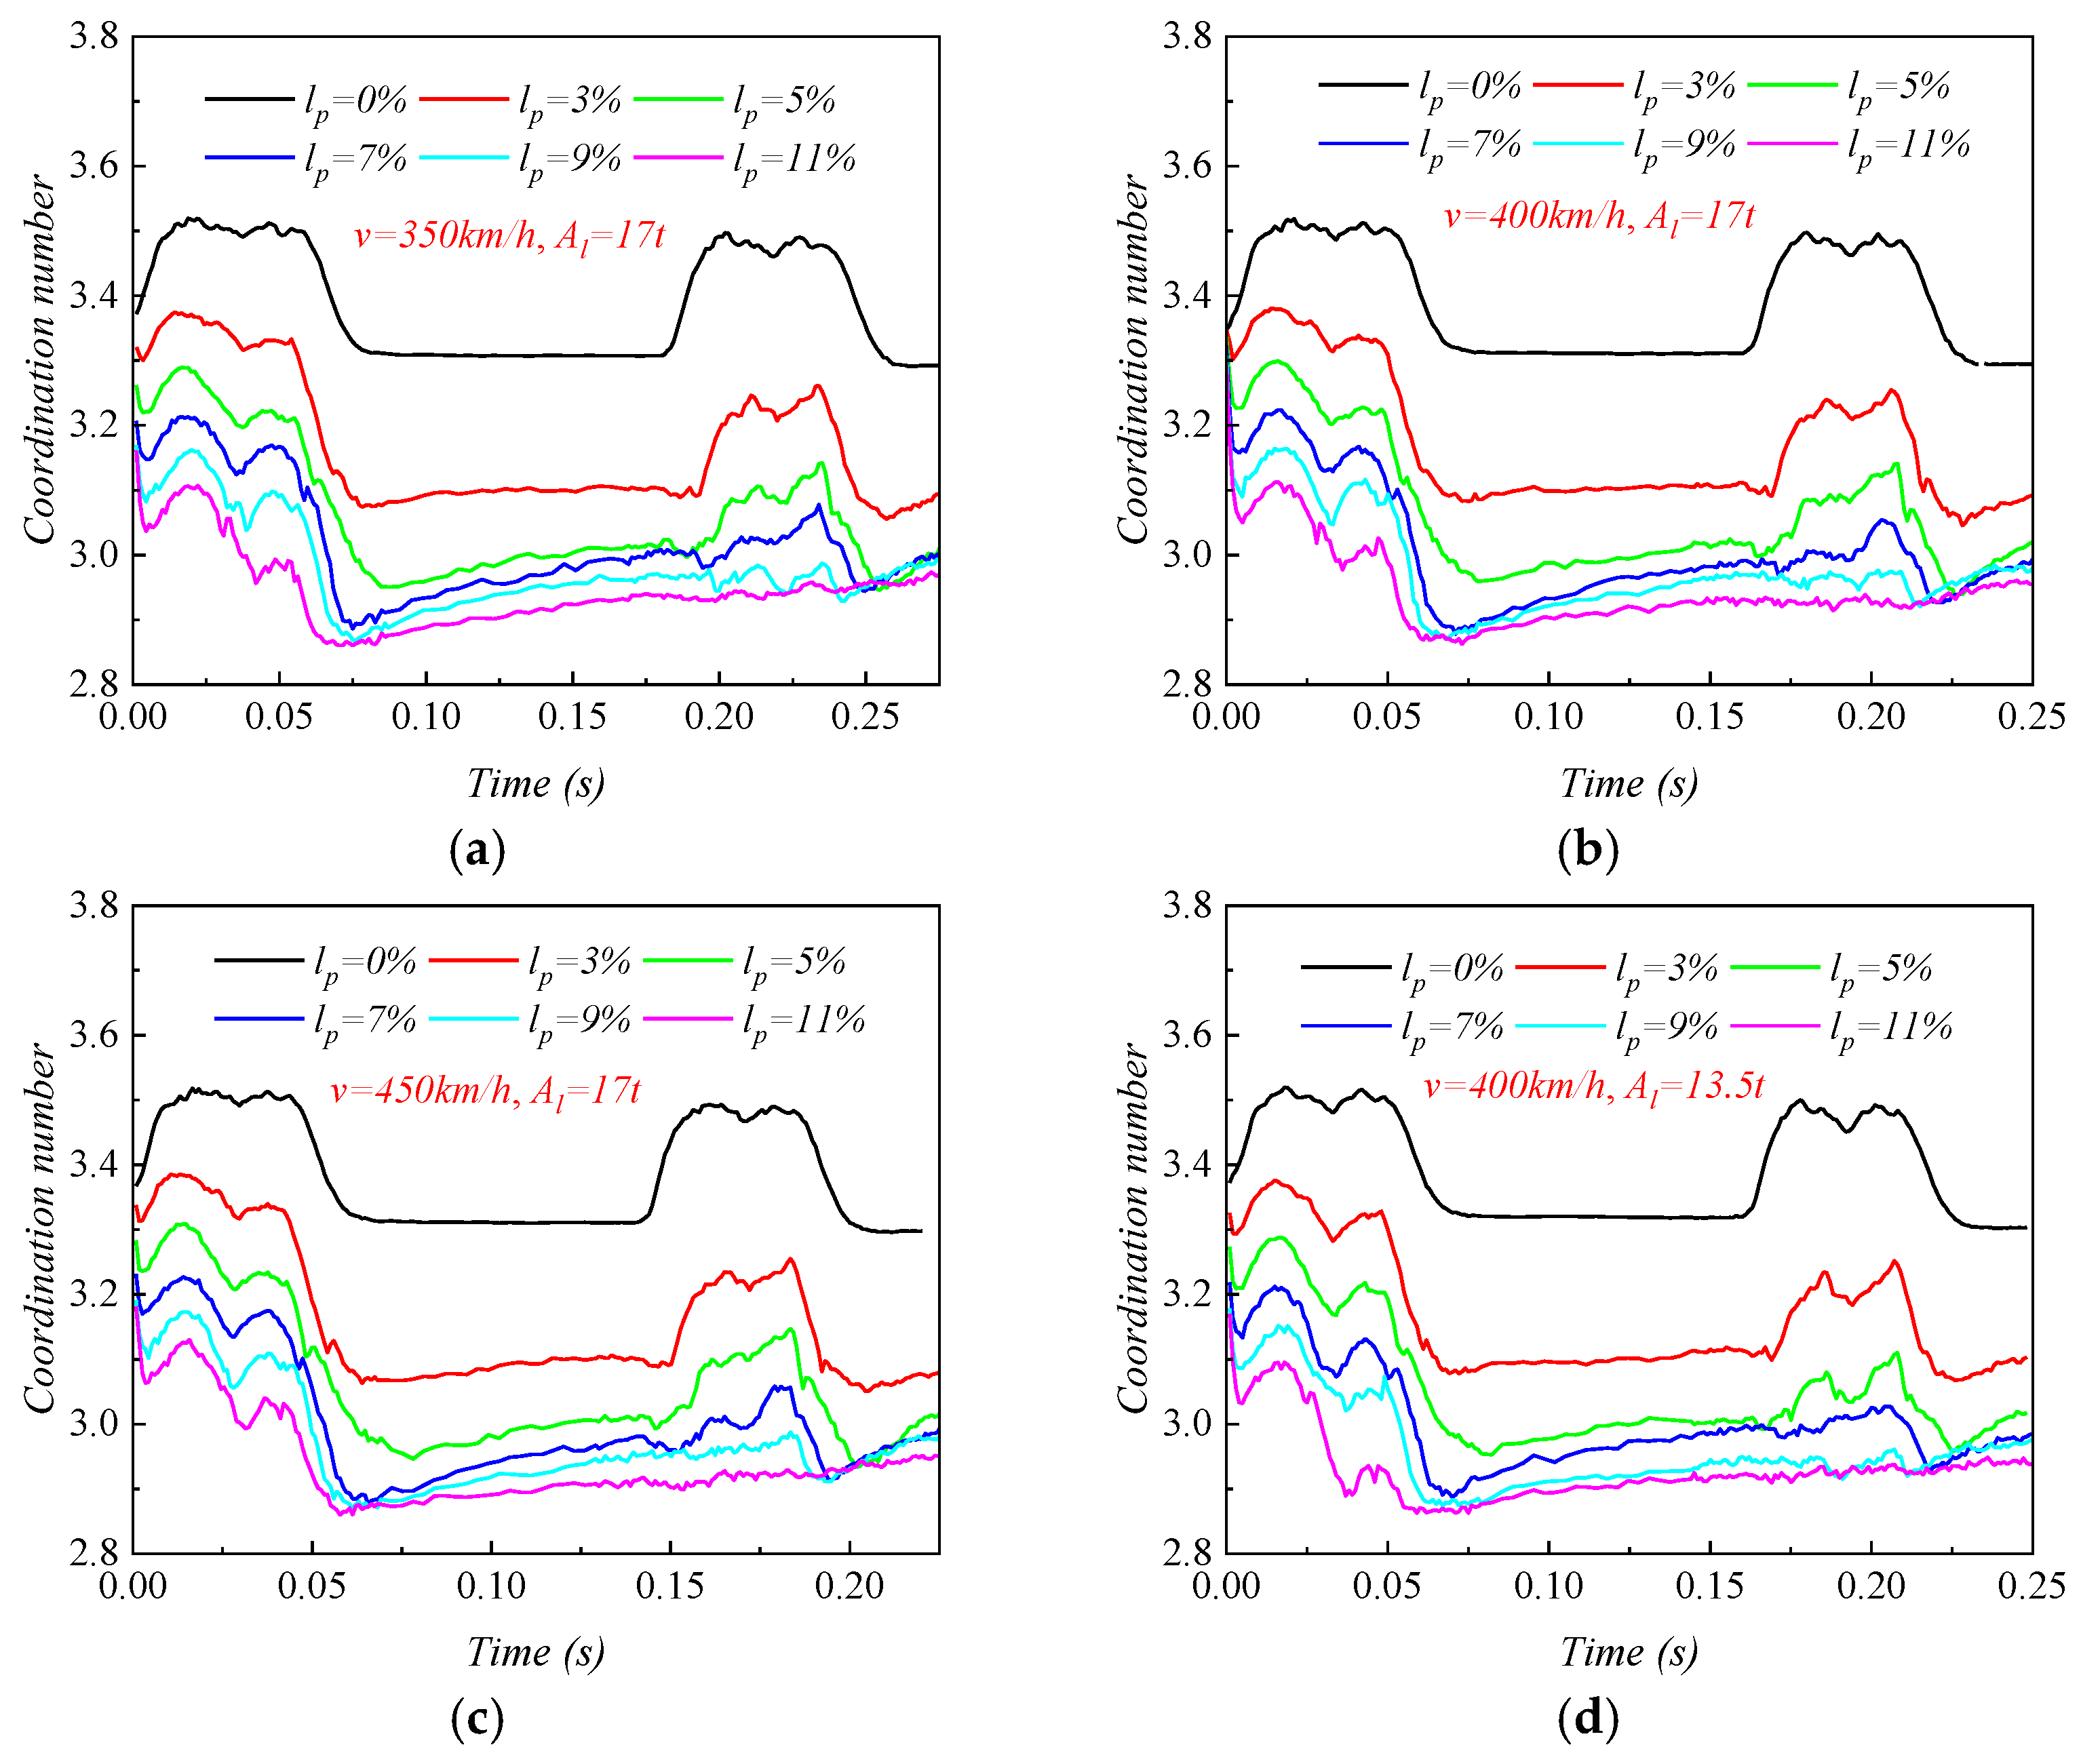
3.2.1. Coordination Number
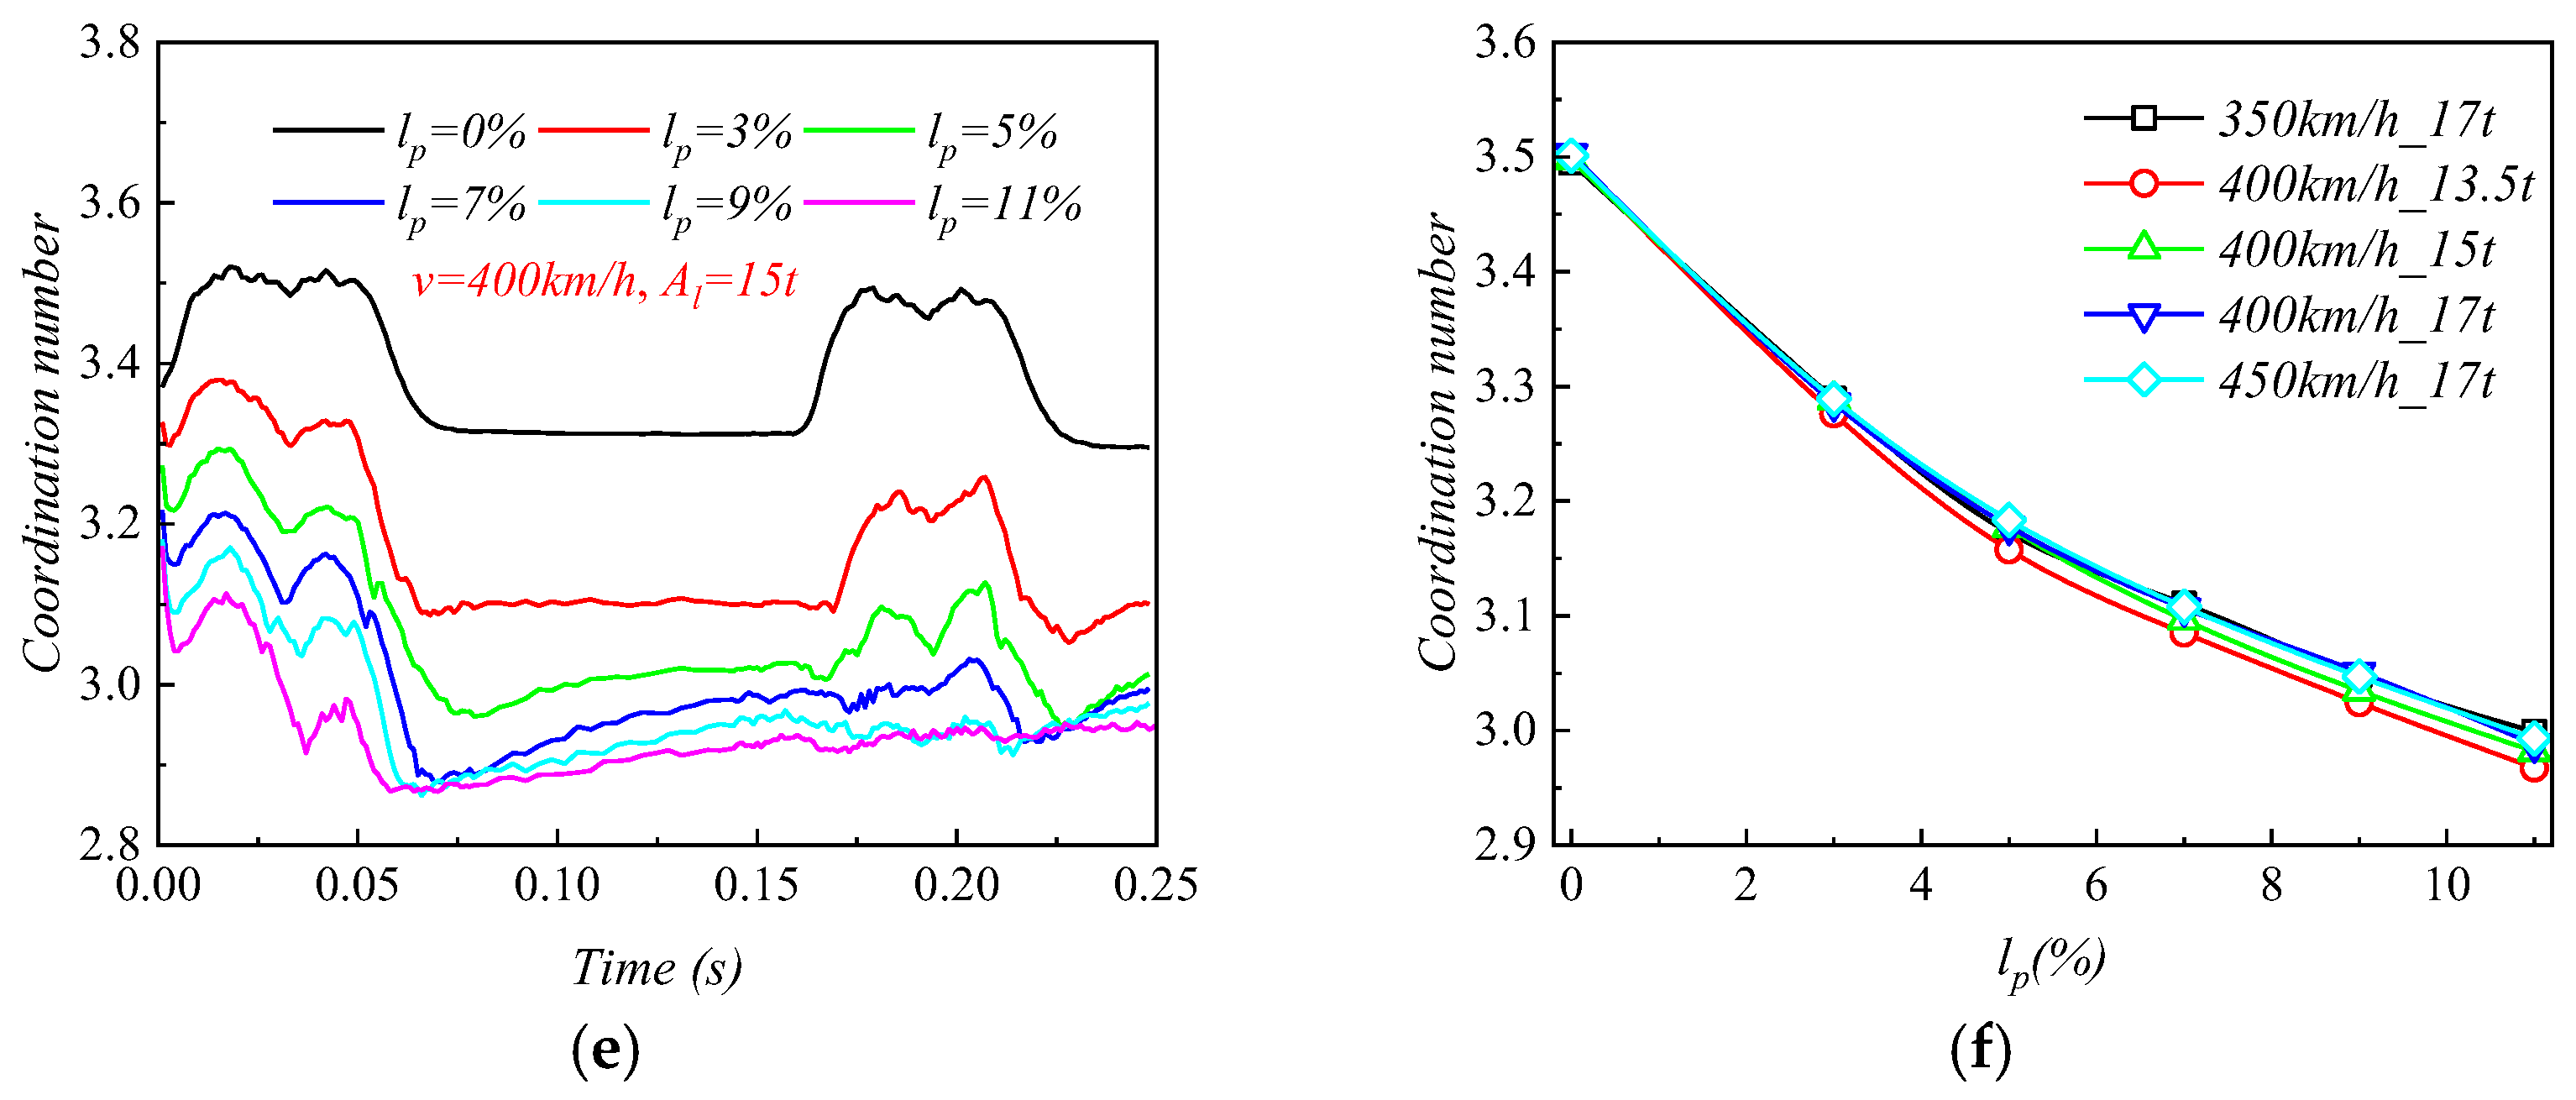
3.2.2. Strong Force Chain
3.2.3. Fabric Anisotropy
4. Conclusions
- (1)
- In the hybrid DEM-FDM model, the linear model contact parameters for graded aggregates were calibrated as Ebb = 1 × 10⁸ Pa, krbb = 1.35, fbb = 0.85, and βbb = 0.18. Moreover, the contact parameters between the graded aggregates and the base were calibrated as Ebc = 5 × 10⁸ Pa, krbc = 1.30, fbc = 0.55, and βbc = 0.22.
- (2)
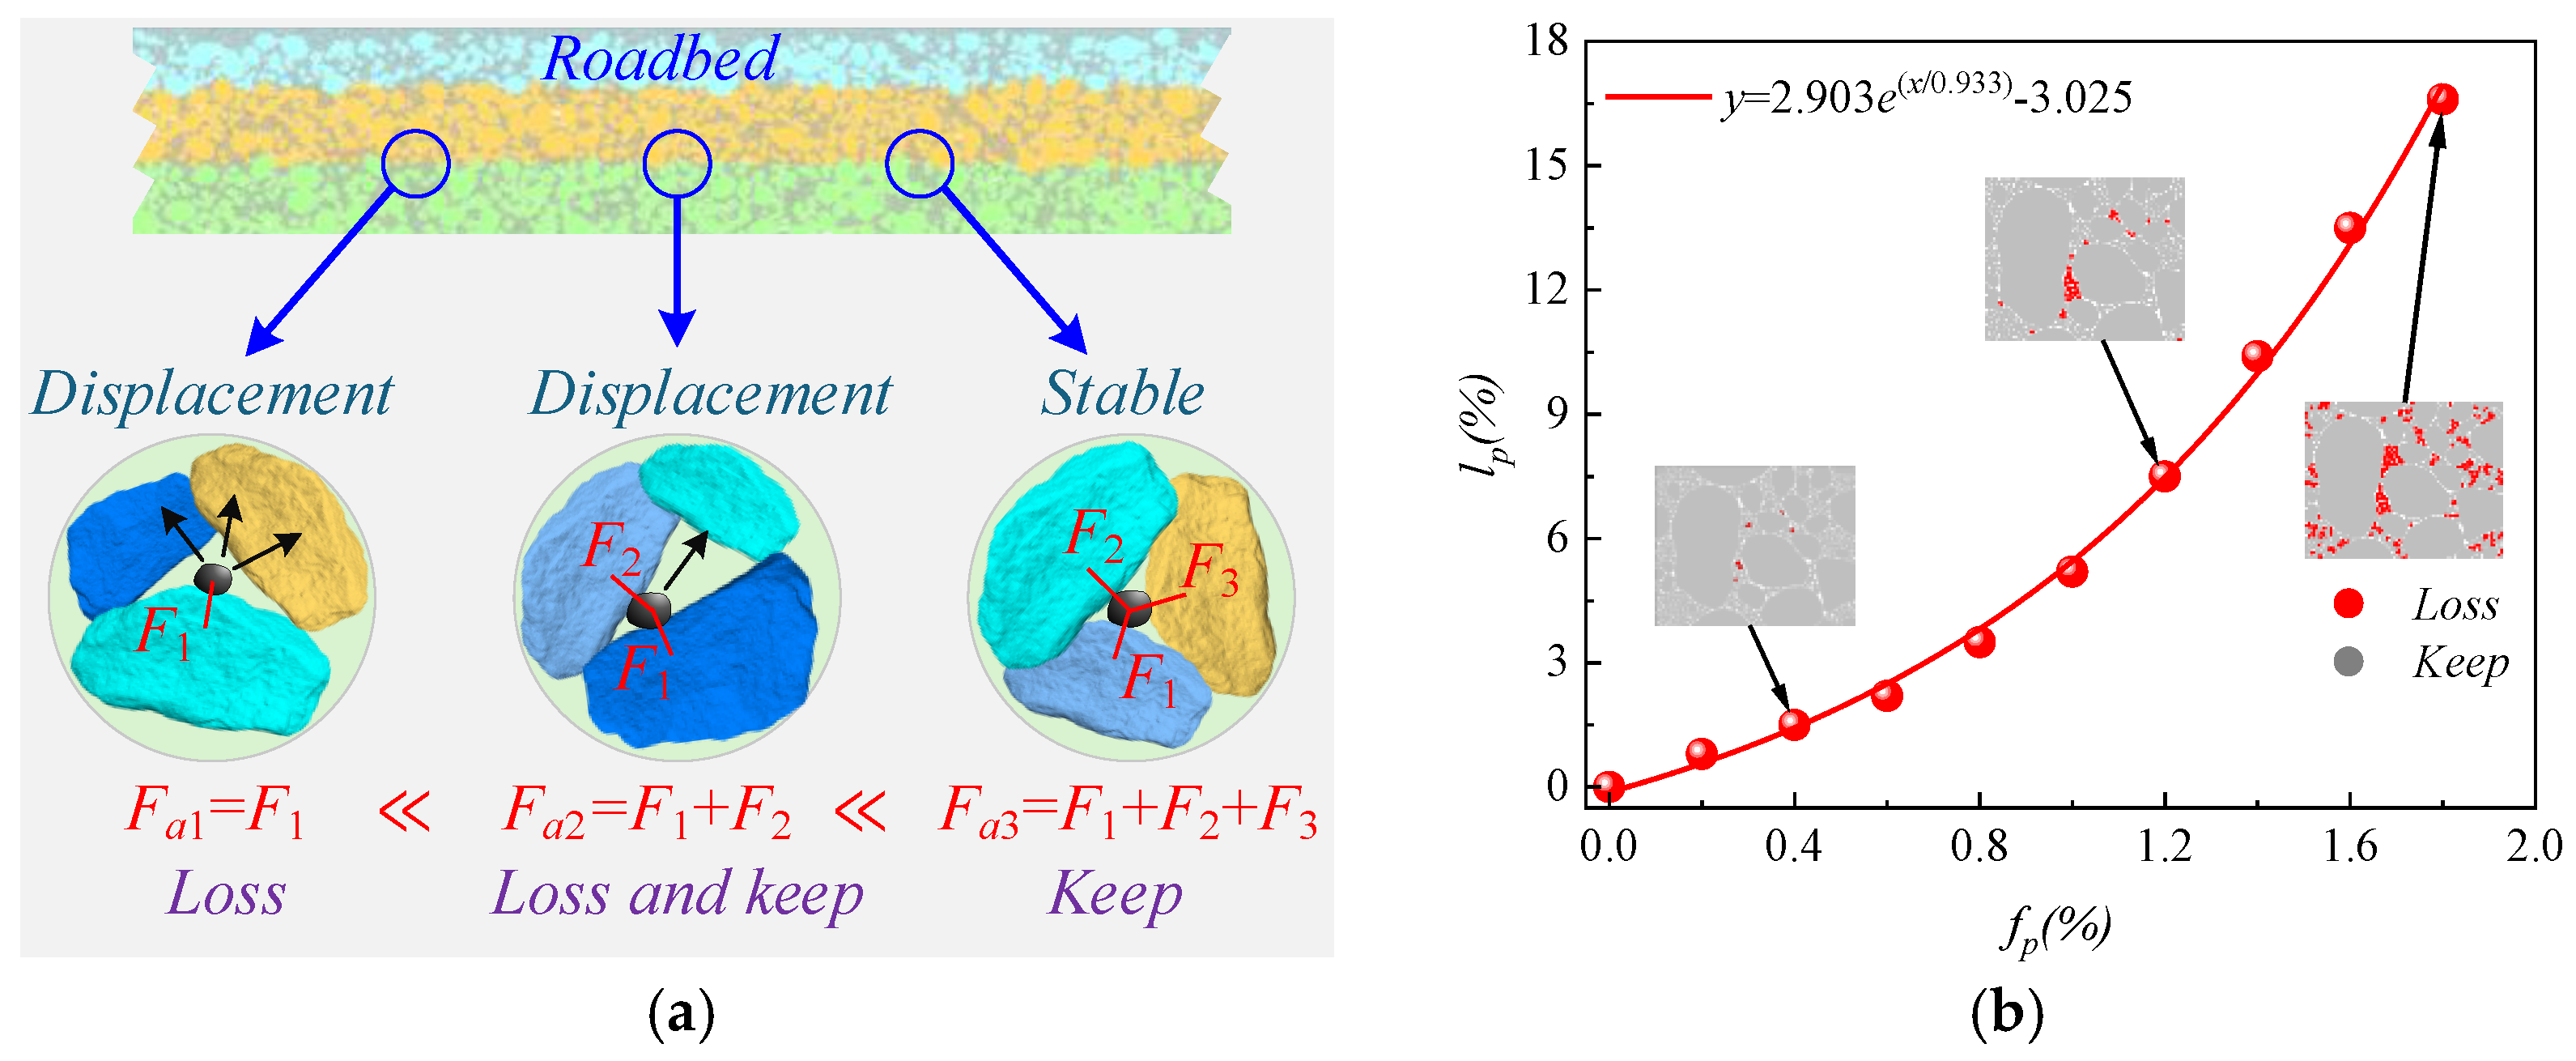
- The model accuracy was validated, as the roadbed dynamic displacement and acceleration at different train speeds in the hybrid DEM-FDM model were within the onsite measured range. Moreover, the roadbed void formation was accurately represented by setting the contact force chain ratio as the particle loss threshold.
- (3)
- As the fine particle mass loss ratio lp increased, the physical indicator (i.e., dynamic displacement) continuously increased, while the mechanical indicators (i.e., acceleration and dynamic stress) first increased and then decreased, reaching their peak values at lp = 9% and lp = 3%, respectively. Under the conditions of 400 km/h and 13.5 t, the maximum acceleration and dynamic stress reached 28.22 m/s2 and 58.57 kPa. It is noteworthy that when lp > 3%, both the dynamic displacement and acceleration exceeded the standard limits of 0.22 mm and 10 m/s2.
- (4)
- As lp increased, the coordination number in the roadbed decreased from about 3.5 to 3.0. Strong force chains peaked at lp = 3%, with a maximum contact force of 138 N under 400 km/h and 13.5 t. When lp ≤ 3%, fine particle loss enhanced coarse particle contact. For 3% < lp < 11%, the roadbed–base contact weakened. At lp ≥ 11%, full separation occurred, and the train load could not be effectively transferred, with the contact force dropping to 20.7 N.
Author Contributions
Funding
Data Availability Statement
Conflicts of Interest
References
- Lan, C.H.; Yang, Z.; Liang, X.L.; Yang, R.S.; Li, P.G.; Liu, Z.J.; Li, Q.Y.; Luo, W. Experimental study on wayside monitoring method of train dynamic load based on strain of ballastless track slab. Constr. Build. Mater. 2023, 394, 132084. [Google Scholar] [CrossRef]
- Wu, Y.; Fu, H.R.; Bian, X.C. Comparative study on dynamic responses of ballasted and ballastless tracks at critical velocity. Transp. Geotech. 2024, 48, 101354. [Google Scholar] [CrossRef]
- Feng, Y.L.; Jiang, L.H.; Zhou, W.B.; Han, J.P.; Zhang, Y.T.; Nie, L.X.; Tan, Z.H.; Liu, X. Experimental investigation on shear steel bars in CRTS II slab ballastless track under low-cyclic reciprocating load. Constr. Build. Mater. 2020, 255, 119425. [Google Scholar] [CrossRef]
- Hu, P.; Zhang, C.S.; Wen, S.; Li, D.Y.; Ma, L.C.; Ding, W.C. Dynamic responses of high-speed railway transition zone with various subgrade fillings. Comput. Geotech. 2019, 108, 17–26. [Google Scholar] [CrossRef]
- Xiao, X.P.; Xie, K.; Li, X.Z.; Hao, Z.R.; Li, T.F.; Deng, Z.X. Macro- and micro- deterioration mechanism of high-speed railway graded gravel filler during vibratory compaction. Constr. Build. Mater. 2023, 409, 134043. [Google Scholar] [CrossRef]
- Xie, K.; Chen, X.B.; Li, T.F.; Xiao, X.P.; Tang, L.B.; Wang, Y.S. Experimental and numerical study on the influence of deterioration on the mechanical properties of graded gravel fillers during vibratory compaction. Constr. Build. Mater. 2023, 404, 133153. [Google Scholar] [CrossRef]
- Ye, Y.S.; Cai, D.G.; Yao, J.K.; Wei, S.W.; Yan, H.Y.; Chen, F. Review on the dynamic modulus of coarse-grained soil filling for high-speed railway subgrade. Transp. Geotech. 2021, 27, 100421. [Google Scholar] [CrossRef]
- Yang, Z.H.; Yue, Z.R.; Tai, B. Investigation of the deformation and strength properties of fouled graded macadam materials in heavy-haul railway subgrade beds. Constr. Build. Mater. 2021, 273, 121778. [Google Scholar] [CrossRef]
- Singh, M.; Indraratna, B.; Nguyen, T.T. Experimental insights into the stiffness degradation of subgrade soils prone to mud pumping. Transp. Geotech. 2021, 27, 100490. [Google Scholar] [CrossRef]
- Zhang, J.; Nie, R.S.; Huang, M.T.; Tan, Y.C.; Li, Y.F. Analysis of ballast penetration phenomenon in ballast track under dynamic loads: Experimental testing and DEM modeling. Rock Soil Mech. 2024, 45, 1720–1730. [Google Scholar] [CrossRef]
- Zhang, J.; Nie, R.; Tan, Y.; Huang, M.T.; Li, Y.F.; Guo, Y.P. Investigation of the parallel gradation method based on response of ballast penetration into subgrade soil by discrete element method. Comp. Part. Mech. 2025, 12, 245–260. [Google Scholar] [CrossRef]
- Chawla, S.; Shahu, J.T. Reinforcement and mud-pumping benefits of geosynthetics in railway tracks: Numerical analysis. Geotext. Geomembr. 2016, 44, 344–357. [Google Scholar] [CrossRef]
- Nguyen, T.T.; Indraratna, B.; Singh, M. Dynamic parameters of subgrade soils prone to mud pumping considering the influence of kaolin content and the cyclic stress ratio. Transp. Geotech. 2021, 29, 100581. [Google Scholar] [CrossRef]
- Ding, Y.; Jia, Y.; Wang, X.; Zhang, J.S.; Luo, H.; Zhang, Y.; Chen, X.B. The influence of geotextile on the characteristics of railway subgrade mud pumping under cyclic loading. Transp. Geotech. 2022, 37, 100831. [Google Scholar] [CrossRef]
- Israr, J.; Indraratna, B. Mechanical response and pore pressure generation in granular filters subjected to uniaxial cyclic loading. Can. Geotech. J. 2018, 55, 1756–1768. [Google Scholar] [CrossRef]
- Zhang, S.; Gao, F.; He, X.; Chen, Q.L.; Sheng, D.C. Experimental study of particle migration under cyclic loading: Effects of load frequency and load magnitude. Acta Geotech. 2021, 16, 367–380. [Google Scholar] [CrossRef]
- Gao, F.; Zhang, S.; He, X.Z.; Sheng, D.C. Experimental study on migration behavior of sandy silt under cyclic load. J. Geotech. Geoenviron. Eng. 2022, 148, 06022003. [Google Scholar] [CrossRef]
- Wan, Z.; Bian, X.; Chen, Y. Mud pumping in high-speed railway: In-situ soil core test and full-scale model testing. Rail. Eng. Sci. 2022, 30, 289–303. [Google Scholar] [CrossRef]
- Li, Y.F.; Leng, W.M.; Nie, R.S.; Guo, Y.P.; Dong, J.L.; Cheng, L.H. Laboratory full-scale model test of subgrade mud pumping for ballastless track of high-speed railway. Int. J. Rail Transp. 2022, 10, 230–256. [Google Scholar] [CrossRef]
- Wan, Z.B.; Xu, W.C.; Zhang, Z.Y.; Zhao, C.; Bian, X.C. In-situ investigation on mud pumping in ballastless high-speed railway and development of remediation method. Transp. Geotech. 2022, 33, 100713. [Google Scholar] [CrossRef]
- Wan, Z.B.; Xu, W.C.; Bian, X.C.; Chen, Y.M. Full-scale mud pumping test of ballastless trackbed under train loading. Soil Dyn. Earthq. Eng. 2023, 174, 108199. [Google Scholar] [CrossRef]
- Bian, X.C.; Wan, Z.B.; Zhao, C.; Chen, Y.M. Mud pumping in the roadbed of ballastless high-speed railway. Géotechnique 2023, 73, 614–628. [Google Scholar] [CrossRef]
- Huang, J.J.; Su, Q.; Liu, T.; Wang, W. Behavior and control of the ballastless track-subgrade vibration induced by high-speed trains moving on the subgrade bed with mud pumping. Shock Vib. 2019, 2019, 9838952. [Google Scholar] [CrossRef]
- Binaree, T.; Kwunjai, S.; Jitsangiam, P.; Azéma, E.; Jing, G.Q. Assessment of macro and micro mechanical properties of fresh and deteriorated ballast combining laboratory tests and 2D-discrete element methods. Constr. Build. Mater. 2024, 420, 135525. [Google Scholar] [CrossRef]
- Xiao, J.; Zhang, X.; Zhang, D.; Geng, X.Y.; Wang, Y.H. Three-Dimensional Discrete Element Simulation of Ballast Direct Shear Testing in Vibration Field. Geotech. Geol. Eng. 2021, 39, 157–169. [Google Scholar] [CrossRef]
- Lu, R.; Luo, Q.; Wang, T.F.; Connolly, D.P.; Liu, K.W.; Zhao, C.F. Discrete element modelling of the effect of aspect ratio on compaction and shear behaviour of aggregates. Comput. Geotech. 2023, 161, 105558. [Google Scholar] [CrossRef]
- Hu, Z.; Guo, N.; Yang, Z.X. Effect of fines loss on the microstructure and shear behaviors of gap-graded soils: A multiscale perspective. Comput. Geotech. 2023, 162, 105711. [Google Scholar] [CrossRef]
- Tan, P.; Xiao, Y.J.; Jiang, Y.; Wang, M.; Wang, X.M.; Zhang, C.C.; Tutnmluer, T. Investigating influencing mechanisms of under-sleeper pads on lateral resistance of ballasted railway track bed via hybrid DEM-FDM simulations. Transp. Geotech. 2024, 45, 101200. [Google Scholar] [CrossRef]
- Chen, W.; Zhang, Y.S.; Wang, C.; Xiao, Y.J.; Lou, P. Effect of ballast pockets and geogrid reinforcement on ballasted track: Numerical analysis. Transp. Geotech. 2023, 42, 101108. [Google Scholar] [CrossRef]
- Xiao, J.H.; Sun, S.Q.; Zhang, X.; Zhang, D.; Wei, K.; Wang, Y.H. Macro and meso dynamic response of granular materials in ballastless track subgrade for high-speed railway. Int. J. Transp. Sci. Tech. 2021, 10, 313–328. [Google Scholar] [CrossRef]
- Xiao, J.H.; Xue, L.H.; Zhang, D.; Sun, S.Q.; Bai, Y.Q.; Shi, J. Coupled DEM-FEM methods for analyzing contact stress between railway ballast and subgrade considering real particle shape characteristic. Comput. Geotech. 2023, 155, 105192. [Google Scholar] [CrossRef]
- Li, L.F.; Liu, W.F.; Ma, M.; Jing, G.Q.; Liu, W.N. Research on the dynamic behaviour of the railway ballast assembly subject to the low loading condition based on a tridimensional DEM-FDM coupled approach. Constr. Build. Mater. 2019, 218, 135–149. [Google Scholar] [CrossRef]
- Bi, Z.Q.; Ye, Y.S.; Gong, Q.M.; Cai, D.G.; Yan, H.Y.; Wei, S.W.; Yao, J.K. An improved thermo-parameters method for dynamic shakedown analysis of railway subgrade. Transp. Geotech. 2022, 33, 100657. [Google Scholar] [CrossRef]
- Zhang, K.; Yao, Y.P. Extended UH model and deformation prediction of high-speed railway subgrade. Transp. Geotech. 2023, 39, 100942. [Google Scholar] [CrossRef]
- Li, X.Z.; Xiao, X.P.; Xie, K.; Yang, H.F.; Xu, L.; Li, T.F. A generalizable parameter calibration framework for discrete element method and application in the compaction of red-bed soft rocks. Constr. Build. Mater. 2024, 444, 137734. [Google Scholar] [CrossRef]
- Tolomeo, M.; McDowell, G.R. Implementation of real contact behaviour in the DEM modelling of triaxial tests on railway ballast. Powder Technol. 2022, 412, 118021. [Google Scholar] [CrossRef]
- Qi, Q.; Nie, Y.X.; Wang, X.; Liu, S.K. Exploring the effects of size ratio and fine content on vibration compaction behaviors of gap-graded granular mixtures via calibrated DEM models. Powder Technol. 2023, 415, 118156. [Google Scholar] [CrossRef]
- Berry, N.; Zhang, Y.H.; Haeri, S. Contact models for the multi-sphere discrete element method. Powder Technol. 2023, 416, 118209. [Google Scholar] [CrossRef]
- China Railway Design Corporation. Code for Design of High Speed Railway; TB 10621-2014; China Railway Publishing House: Beijing, China, 2014. (In Chinese) [Google Scholar]
- Zhang, J.Q.; Wang, X.; Yin, Z.Y. DEM-based study on the mechanical behaviors of sand-rubber mixture in critical state. Constr. Build. Mater. 2023, 370, 130603. [Google Scholar] [CrossRef]
- Zhang, J.Q.; Wang, X.; Yin, Z.Y.; Liang, Z.Y. DEM modeling of large-scale triaxial test of rock clasts considering realistic particle shapes and flexible membrane boundary. Eng. Geol. 2020, 279, 105871. [Google Scholar] [CrossRef]
- Liu, H.M.; Jiang, H.G.; Zhao, C.; Bian, X.C. Long-term responses of high-speed railway subjected to extreme precipitation events. Transp. Geotech. 2022, 37, 100852. [Google Scholar] [CrossRef]
- Sun, G.C.; Li, J.L.; Kong, G.Q.; Luo, Y.; Wang, L.H.; Deng, H.F. Model tests on dynamic response of ballastless track X-shaped pile-raft foundation under long-term train loads. Chin. J. Geotech. Eng. 2022, 44, 961–969. (In Chinese) [Google Scholar] [CrossRef]
- Xue, S.S.; Chen, Y.M.; Liu, H.L. Model test study on the influence of train speed on the dynamic response of an X-section pile-net composite foundation. Shock Vib. 2019, 2019, 2614709. [Google Scholar] [CrossRef]
- Shang, R.P.; Yang, Y.G.; Huang, B.X.; Chen, Y.; Qiu, C.; Liu, W. Calibration and intelligent optimization for DEM numerical parameters in heterogeneous rock mass. Comput. Geotech. 2025, 177, 106863. [Google Scholar] [CrossRef]
- Hu, Y.Y.; Lu, Y. A novel framework for calibrating DEM parameters: A case study of sand and soil-rock mixture. Comput. Geotech. 2024, 174, 106619. [Google Scholar] [CrossRef]
- Qi, Q.; Chen, Y.; Nie, Z.H.; Liu, Y.W. Investigation of the compaction behaviour of sand-gravel mixtures via DEM: Effect of the sand particle shape under vibration loading. Comput. Geotech. 2023, 154, 105153. [Google Scholar] [CrossRef]
- Zhang, J.Q.; Chen, X.B.; Zhang, J.S.; Jitsangiam, P.; Wang, X. DEM investigation of macro- and micro-mechanical properties of rigid-grain and soft-chip mixtures. Particuology 2021, 55, 128–139. [Google Scholar] [CrossRef]
- Deal, E.; Venditti, J.G.; Benavides, S.J.; Bradley, R.; Zhang, Q.; Kamrin, K.; Perron, J.T. Grain shape effects in bed load sediment transport. Nature 2023, 613, 298–302. [Google Scholar] [CrossRef]
- Chen, J.; Zhou, Y. Dynamic vertical displacement for ballastless track-subgrade system under high-speed train moving loads. Soil Dyn. Earthq. Eng. 2020, 129, 105911. [Google Scholar] [CrossRef]
- Zhou, R.; Yin, H.Z.; Li, Y.; Tao, Y.G.; Feng, S.; Zhang, L.H. Mechanical performance analysis of double-block ballastless tracks in intercity railways under temperature and train loads. Eng. Struct. 2024, 315, 118509. [Google Scholar] [CrossRef]
- China Academy of Railway Sciences Corporation Limited. Technical Regulations for Dynamic Acceptance for High-Speed Railways Construction; TB 10761-2013; China Railway Publishing House: Beijing, China, 2013. (In Chinese) [Google Scholar]
- Rothenburg, L.; Bathurst, R.J. Analytical study of induced anisotropy in idealized granular materials. Géotechnique 1989, 39, 601–614. [Google Scholar] [CrossRef]


| Schematic Diagram | LM Contact Parameter | Symbol |
|---|---|---|
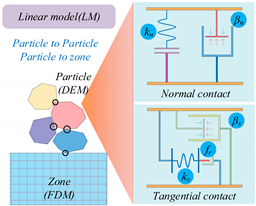 | Effective modulus for particle to particle | Ebb |
| Stiffness ratio for particle to particle | krbb | |
| Friction coefficient for particle to particle | fbb | |
| Damping coefficient for particle to particle | βbb | |
| Effective modulus for particle to base | Ebc | |
| Stiffness ratio for particle to base | krbc | |
| Friction coefficient for particle to base | fbc | |
| Damping coefficient for particle to base | βbc |
| Parameter | Ebb | krbb | fbb | βbb | Ebc | krbc | fbc | βbc |
|---|---|---|---|---|---|---|---|---|
| Value | 1 × 10⁸ Pa | 1.35 | 0.85 | 0.18 | 5 × 10⁸ Pa | 1.30 | 0.55 | 0.22 |
| Parameter | Rail | Sleeper | Slab | Self-Compaction Concrete | Base | Roadbed | Subgrade | Subsoil |
|---|---|---|---|---|---|---|---|---|
| E (GPa) | 206 | 36 | 36 | 32.5 | 32.5 | 0.23 | 0.20 | 0.16 |
| v | 0.3 | 0.167 | 0.167 | 0.167 | 0.167 | 0.3 | 0.35 | 0.40 |
| ρ (kg/m3) | 7830 | 2450 | 2450 | 2450 | 2450 | 2300 | 2100 | 2000 |
| t = 0.02 s | t = 0.11 s | t = 0.18 s | |
|---|---|---|---|
| lp = 0% |  | 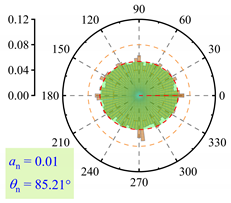 | 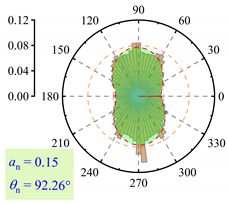 |
| lp = 3% |  | 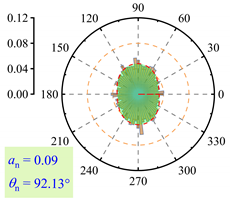 | 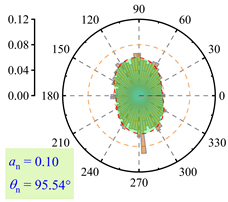 |
| lp = 5% | 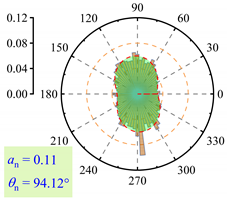 | 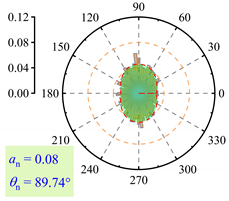 |  |
| lp = 7% | 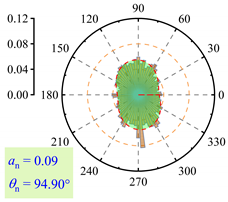 |  | 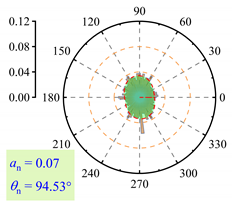 |
| lp = 9% | 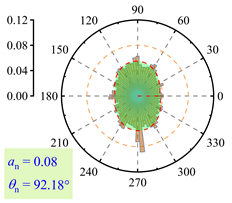 |  | 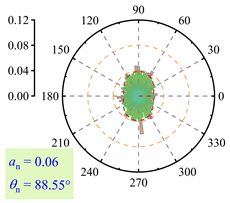 |
| lp = 11% | 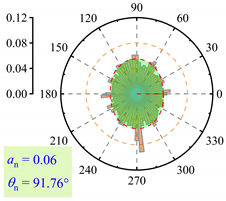 | 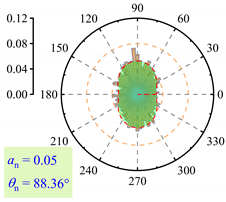 |  |
Disclaimer/Publisher’s Note: The statements, opinions and data contained in all publications are solely those of the individual author(s) and contributor(s) and not of MDPI and/or the editor(s). MDPI and/or the editor(s) disclaim responsibility for any injury to people or property resulting from any ideas, methods, instructions or products referred to in the content. |
© 2025 by the authors. Licensee MDPI, Basel, Switzerland. This article is an open access article distributed under the terms and conditions of the Creative Commons Attribution (CC BY) license (https://creativecommons.org/licenses/by/4.0/).
Share and Cite
Wang, K.; Chen, Z.; Chen, Q.; Cheng, Z.; Xu, J.; Tan, H.; Zhang, L.; You, L. Investigating the Mechanisms and Dynamic Response of Graded Aggregate Mud Pumping Based on the Hybrid DEM-FDM Method. Buildings 2025, 15, 1604. https://doi.org/10.3390/buildings15101604
Wang K, Chen Z, Chen Q, Cheng Z, Xu J, Tan H, Zhang L, You L. Investigating the Mechanisms and Dynamic Response of Graded Aggregate Mud Pumping Based on the Hybrid DEM-FDM Method. Buildings. 2025; 15(10):1604. https://doi.org/10.3390/buildings15101604
Chicago/Turabian StyleWang, Kang, Zhongrui Chen, Qian Chen, Zhibo Cheng, Jiawen Xu, Hongfu Tan, Lei Zhang, and Le You. 2025. "Investigating the Mechanisms and Dynamic Response of Graded Aggregate Mud Pumping Based on the Hybrid DEM-FDM Method" Buildings 15, no. 10: 1604. https://doi.org/10.3390/buildings15101604
APA StyleWang, K., Chen, Z., Chen, Q., Cheng, Z., Xu, J., Tan, H., Zhang, L., & You, L. (2025). Investigating the Mechanisms and Dynamic Response of Graded Aggregate Mud Pumping Based on the Hybrid DEM-FDM Method. Buildings, 15(10), 1604. https://doi.org/10.3390/buildings15101604