

Research on the Positioning Models and Elemental Guarantees of Convention and Exhibition Buildings in Small and Medium-Sized Cities: Based on Empirical Case Studies


Abstract
1. Introduction
- (1)
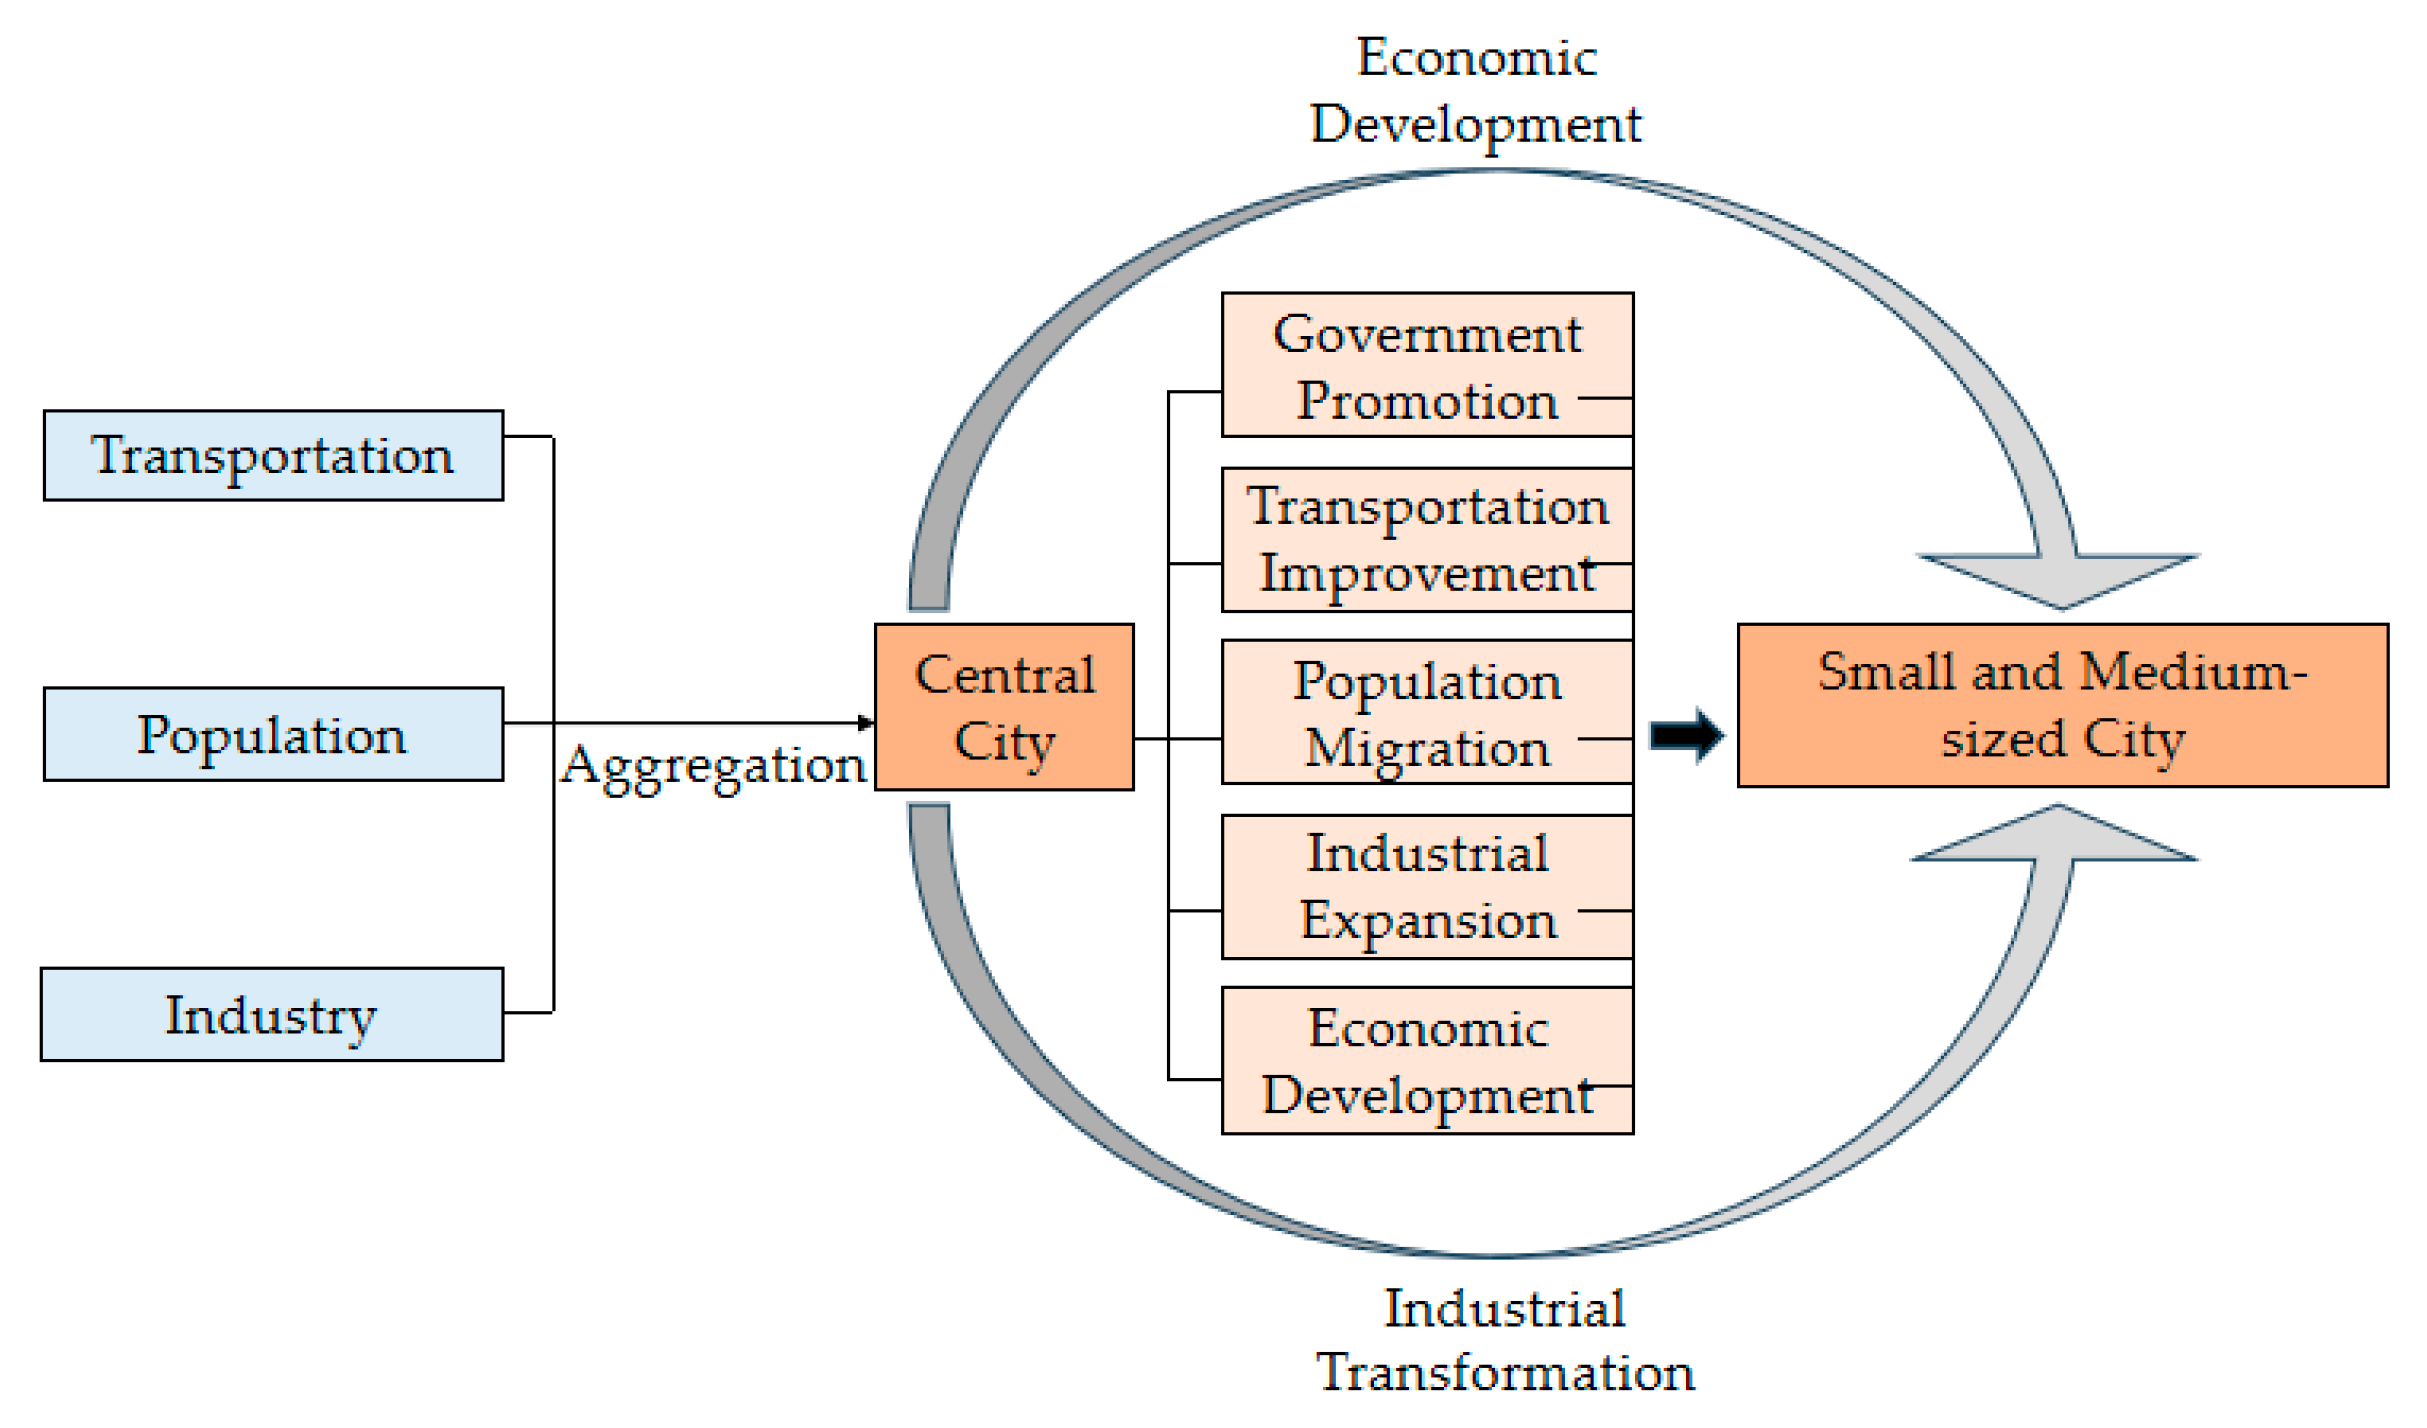
- Development Characteristics of the Convention and Exhibition Industry in Small and Medium-Sized Cities in China
- (2)
- Review of Theories on Convention and Exhibition Architecture
- (1)
- Bias in research focus: Existing domestic and international studies predominantly concentrate on convention and exhibition facilities in large metropolitan areas, while insufficient attention has been paid to the unique constraints of small and medium-sized cities, including site limitations, differentiated operational models, and restricted economic carrying capacity.
- (2)
- Lack of tailored theoretical frameworks: Current theoretical approaches (e.g., Ni Yang’s typological study and Hou Xiao’s symbiosis theory) fail to adequately account for the developmental characteristics of small and medium-sized cities and the specificities of their convention and exhibition industries. This results in significant limitations when applying these theories to guide the planning and design of convention and exhibition buildings in such contexts.
- (3)
- Insufficient interdisciplinary integration: The development of convention and exhibition buildings in small and medium-sized cities must be closely aligned with local industrial characteristics. However, current research remains largely confined to traditional architectural perspectives and lacks effective integration with theories and methodologies from related disciplines such as convention management and urban governance.
- (4)
- Methodological limitations: Existing studies predominantly rely on qualitative analysis, expert judgment, and case studies, lacking systematic data collection and statistical validation. Consequently, the reliability and generalizability of their findings remain questionable.
- (1)
- Typology and Differentiation: What are the typical types of positioning models for convention and exhibition buildings in small and medium-sized cities, and what are the main differences between them?
- (2)
- Sustainability and Resource Dependencies: What are the key resources and development conditions required for the sustainable operation of convention and exhibition buildings under different positioning models?
2. Research Design
3. Research Methods
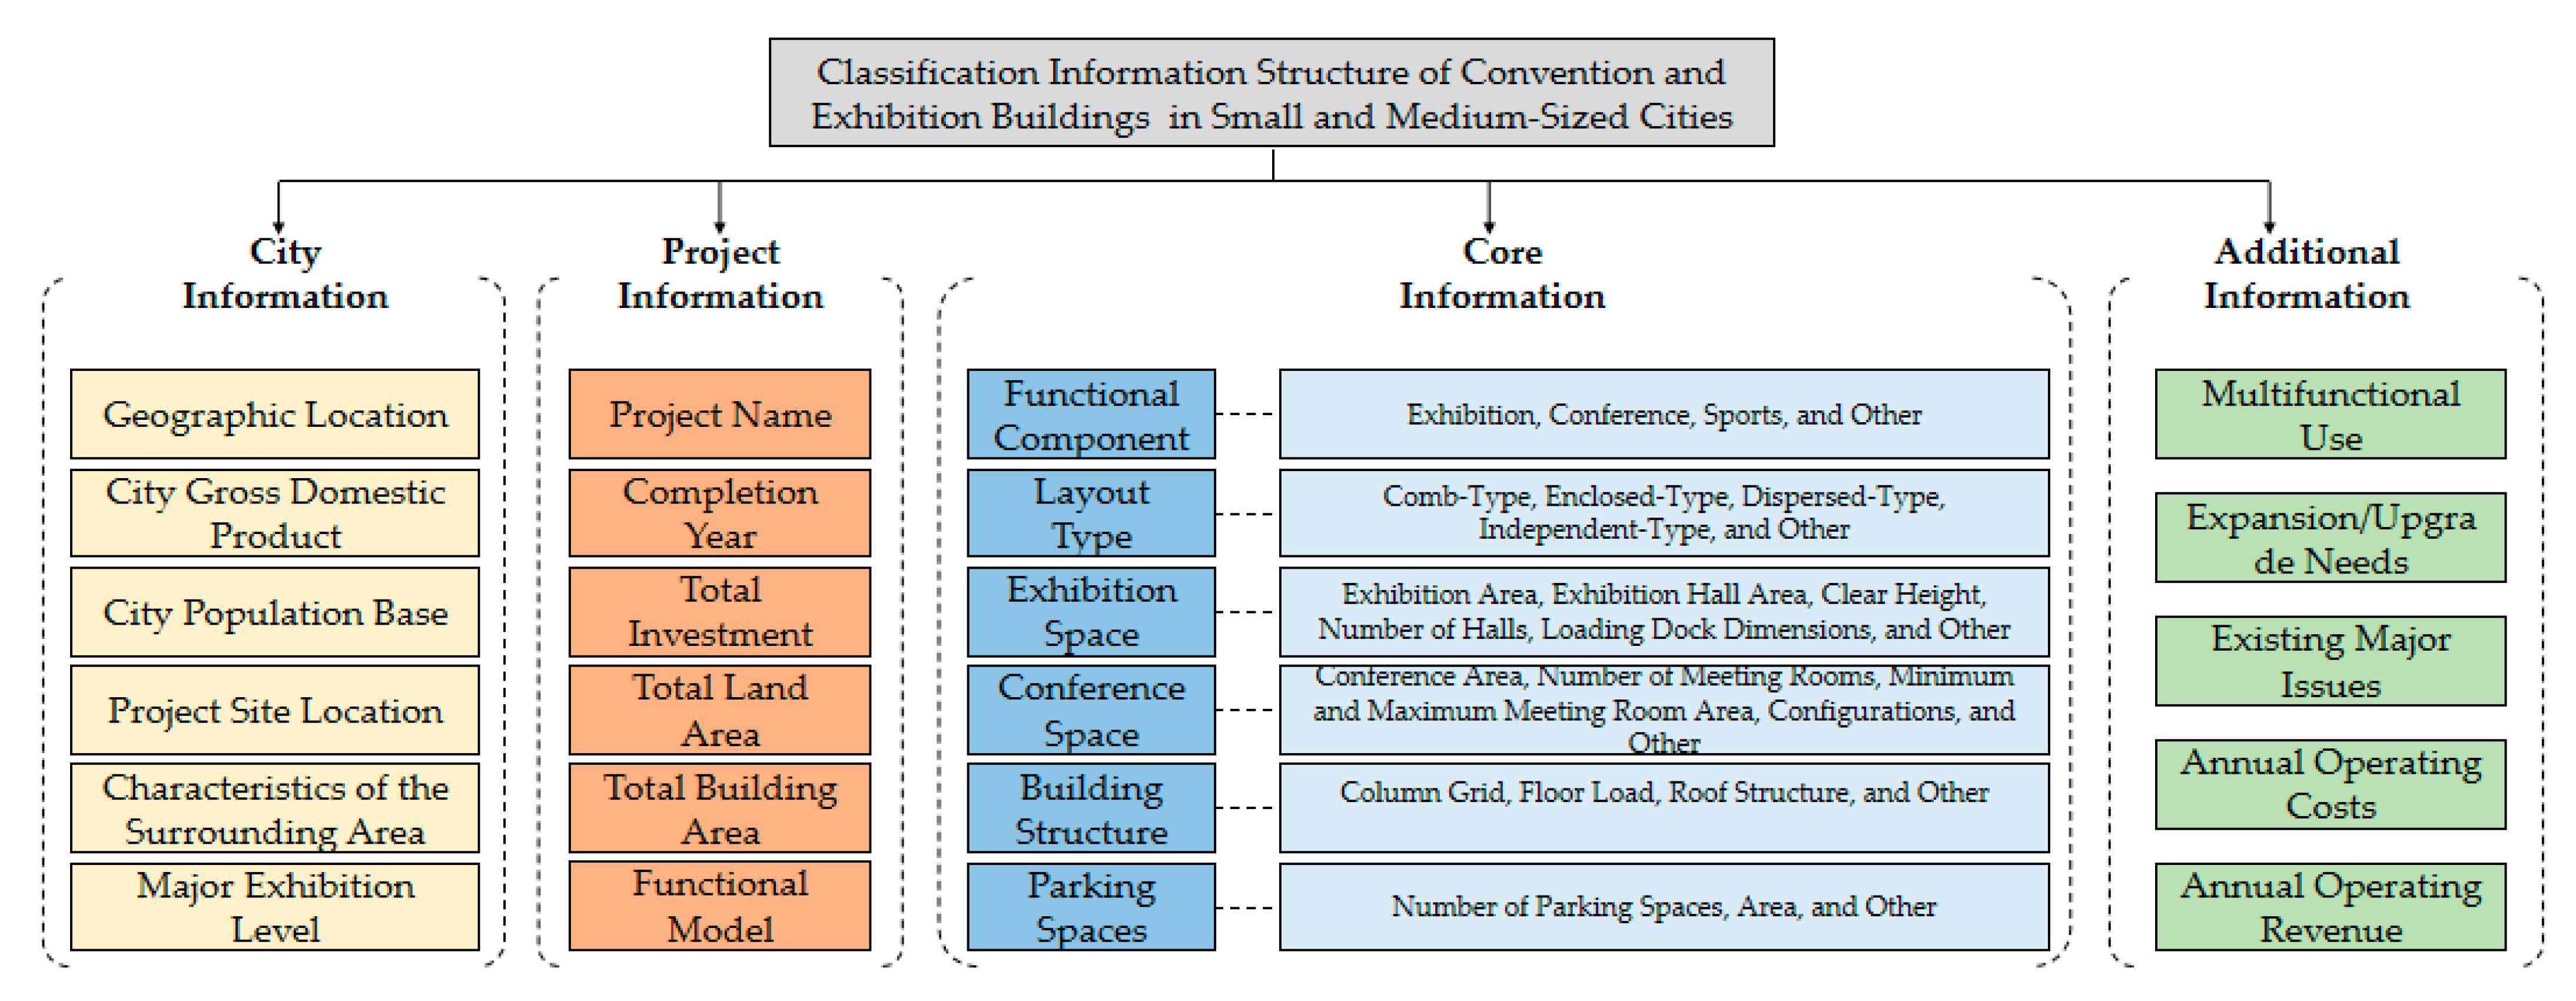
3.1. Database Information Collection
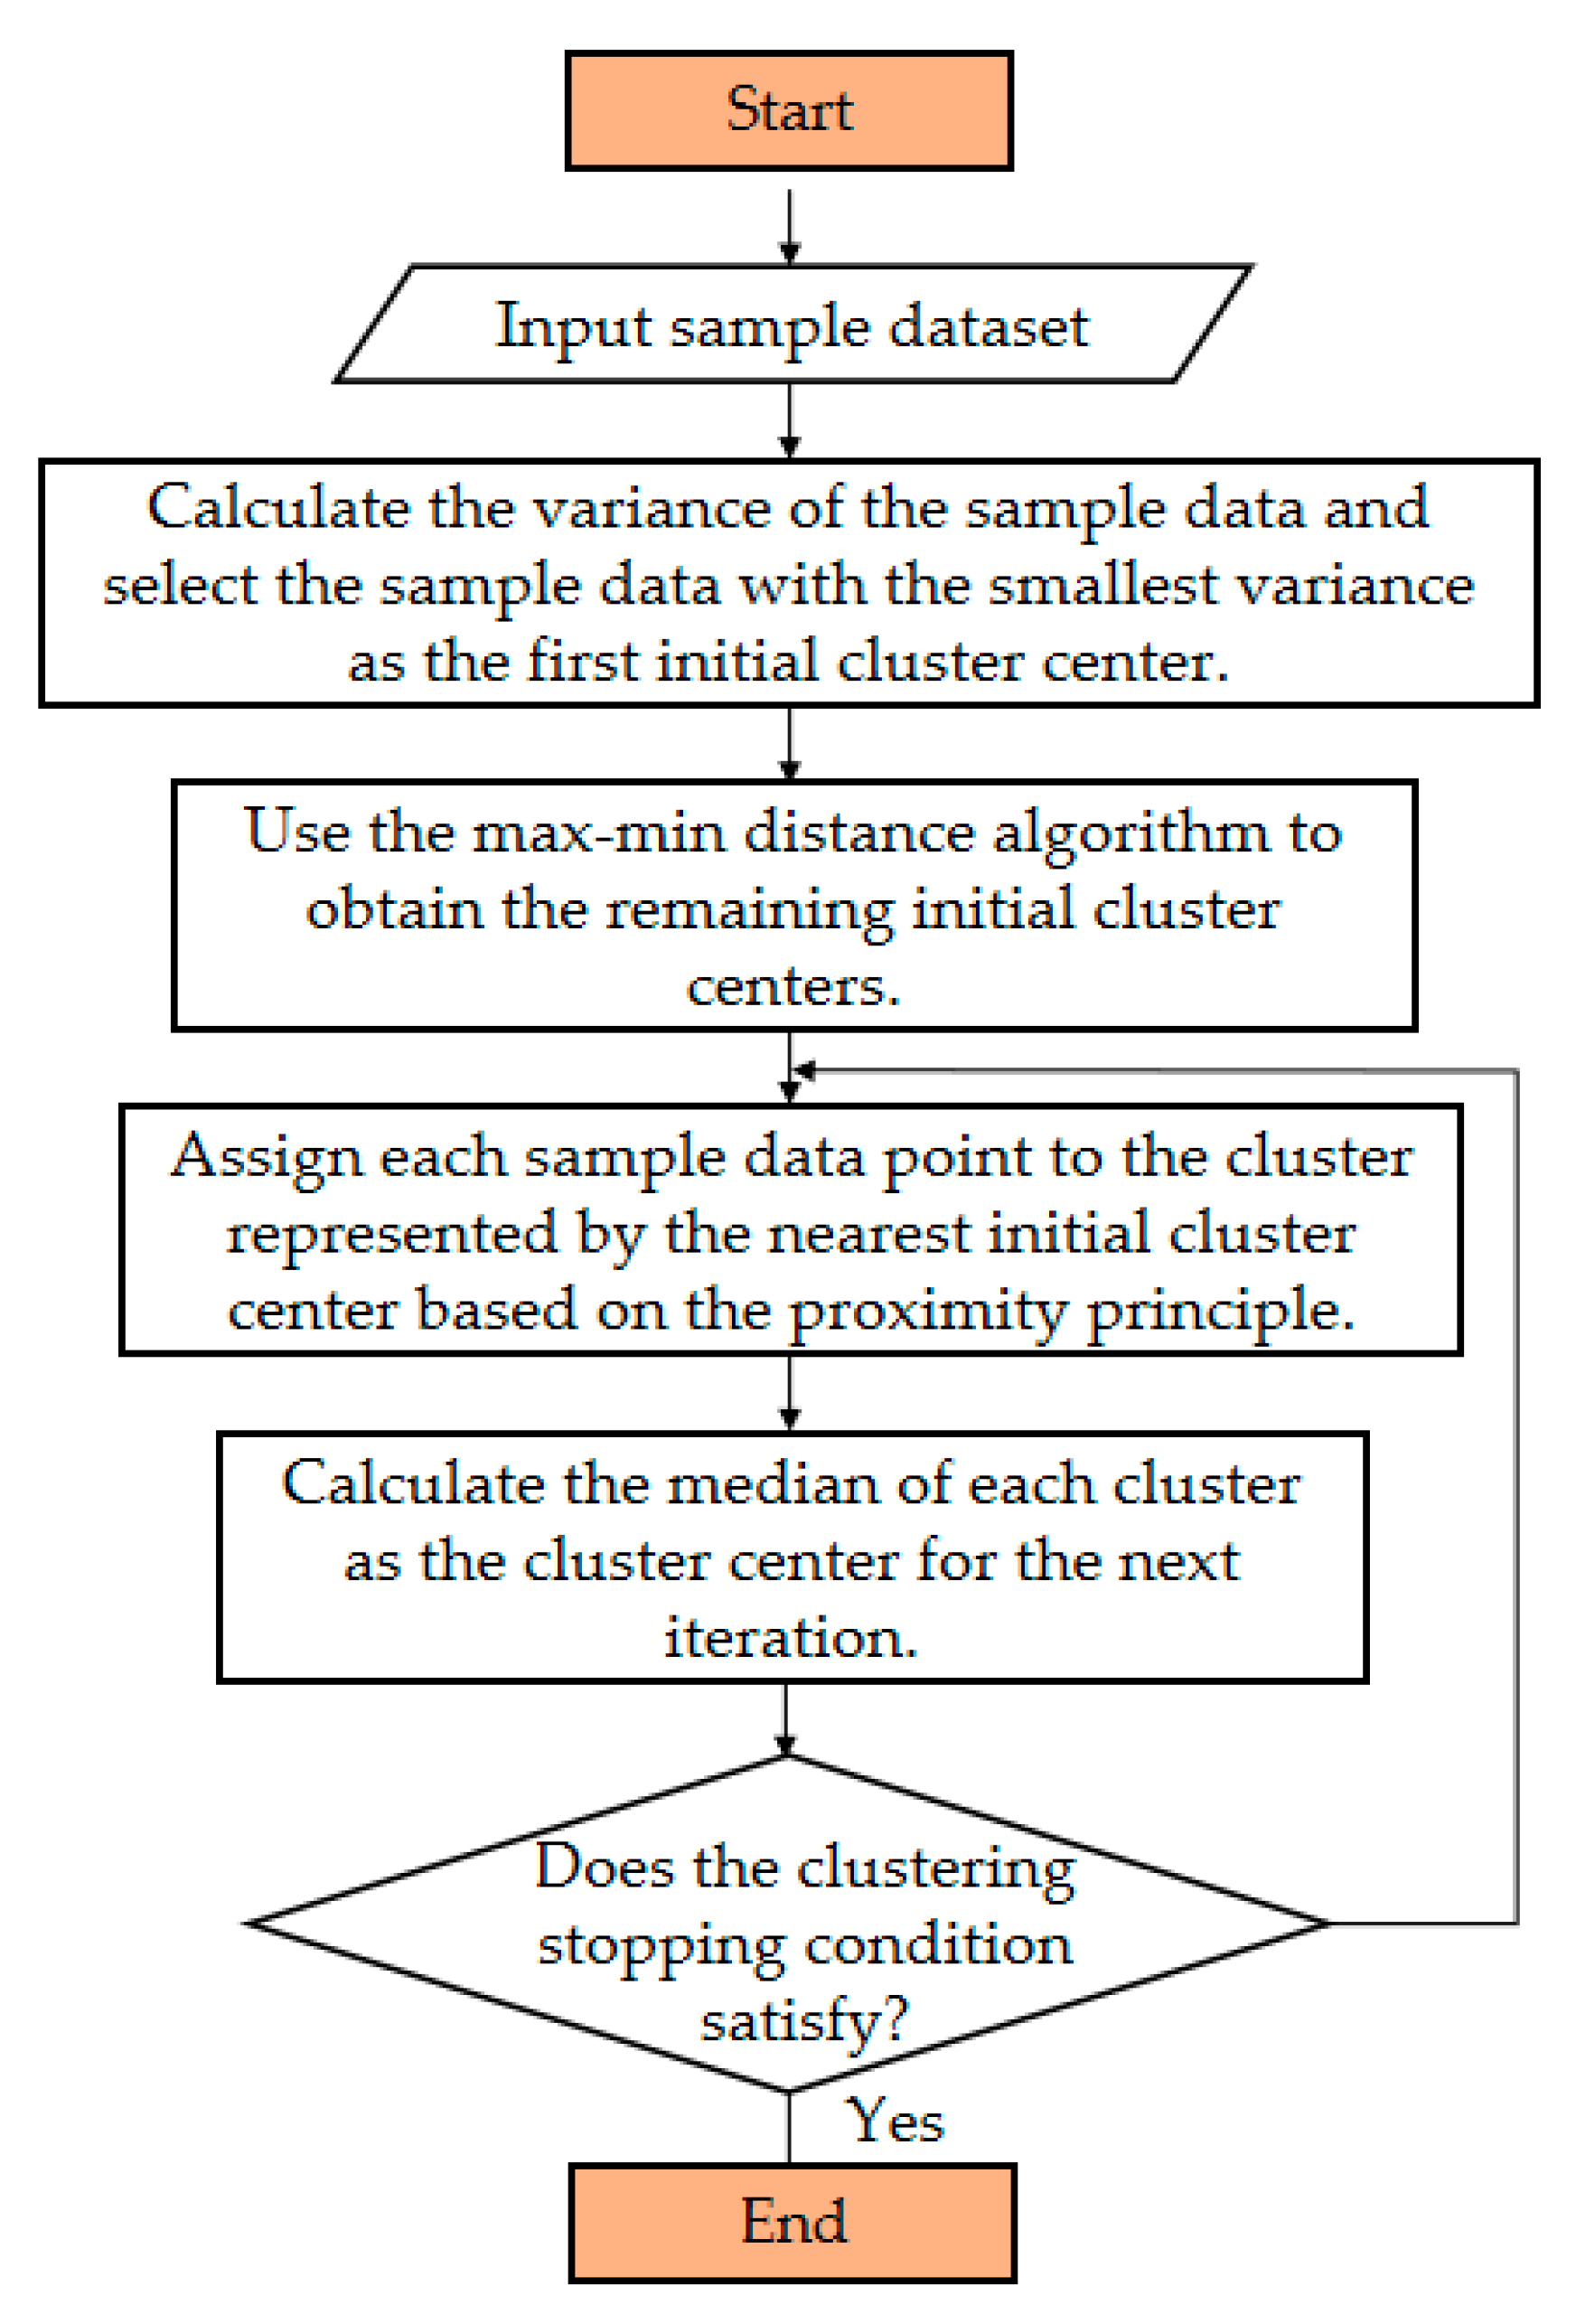
3.2. Clustering Analysis
3.3. Indicator Selection and Questionnaire Data Processing
3.3.1. Indicator Selection Method
3.3.2. Questionnaire Data Processing
4. Analysis of Convention and Exhibition Building Typologies in Small and Medium-Sized Cities
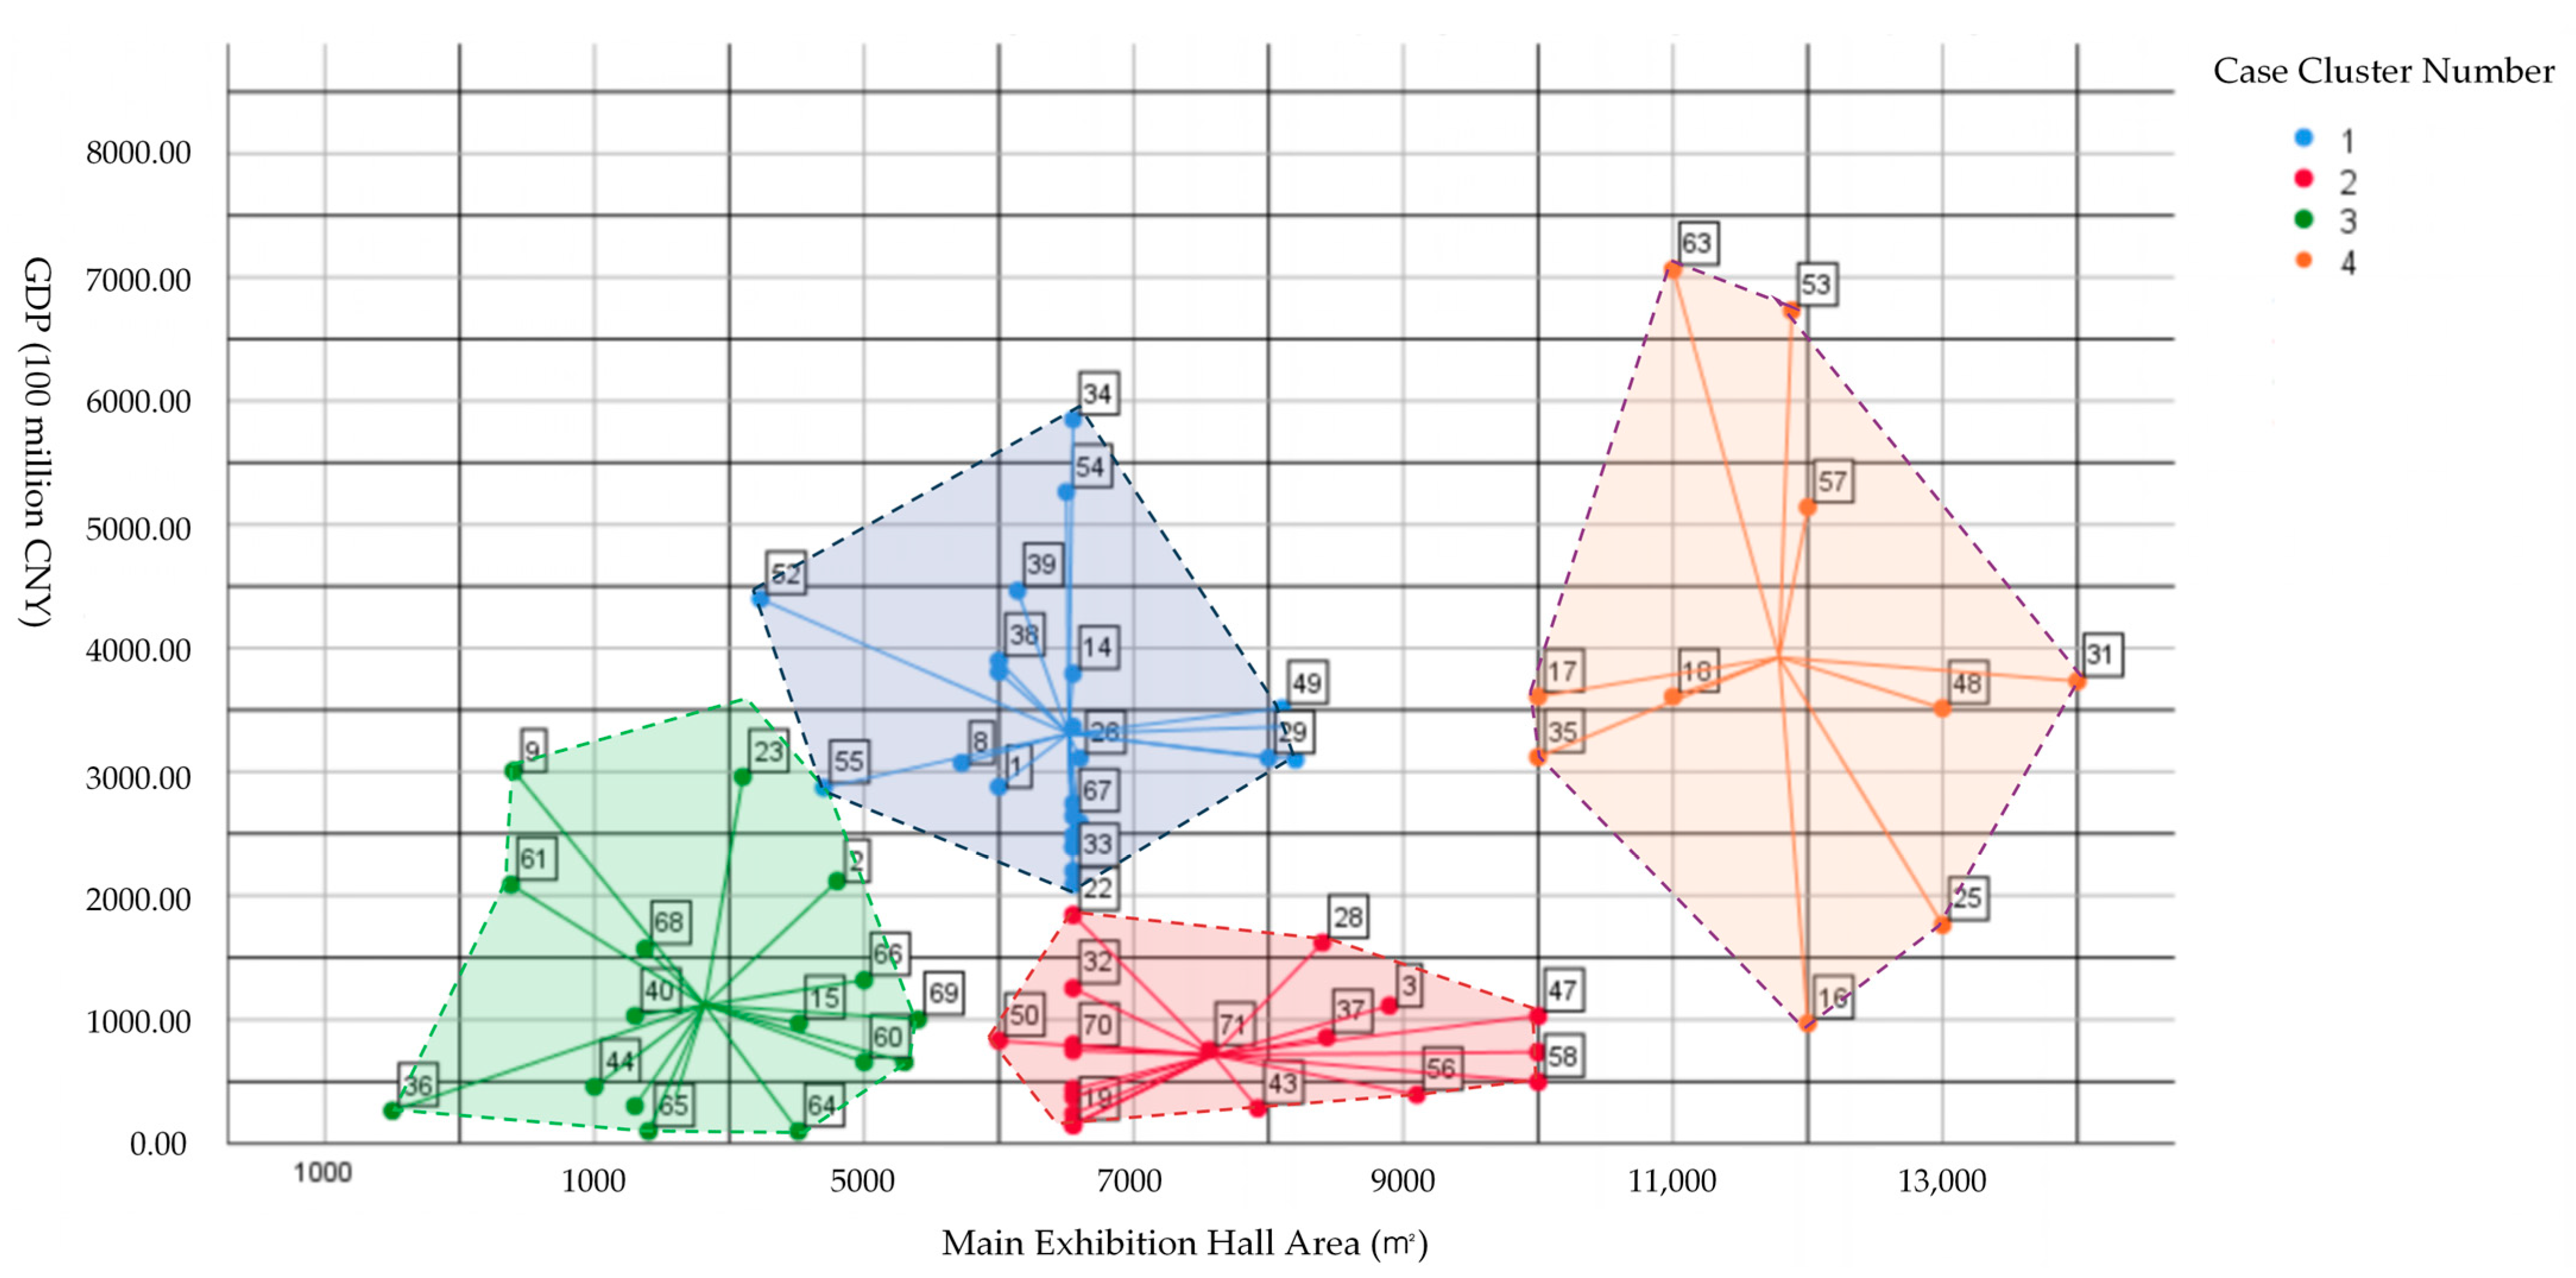
4.1. Clustering Calculation of Typological Patterns
4.2. Definition of Type Patterns
4.3. Analysis of Model Types
- Market type
- 2.
- Production-based type
- 3.
- Enclave type
- 4.
- Comprehensive type
5. Elemental Guarantees Analysis for Convention and Exhibition Buildings in Small and Medium-Sized Cities
5.1. Selection of Evaluation Indicators for Element Guarantees
5.1.1. Explanation of Urban-Related Factors
5.1.2. Explanation of Regional-Related Factors
5.2. Quantification of Element Guarantees
5.2.1. Survey Distribution and Calculation
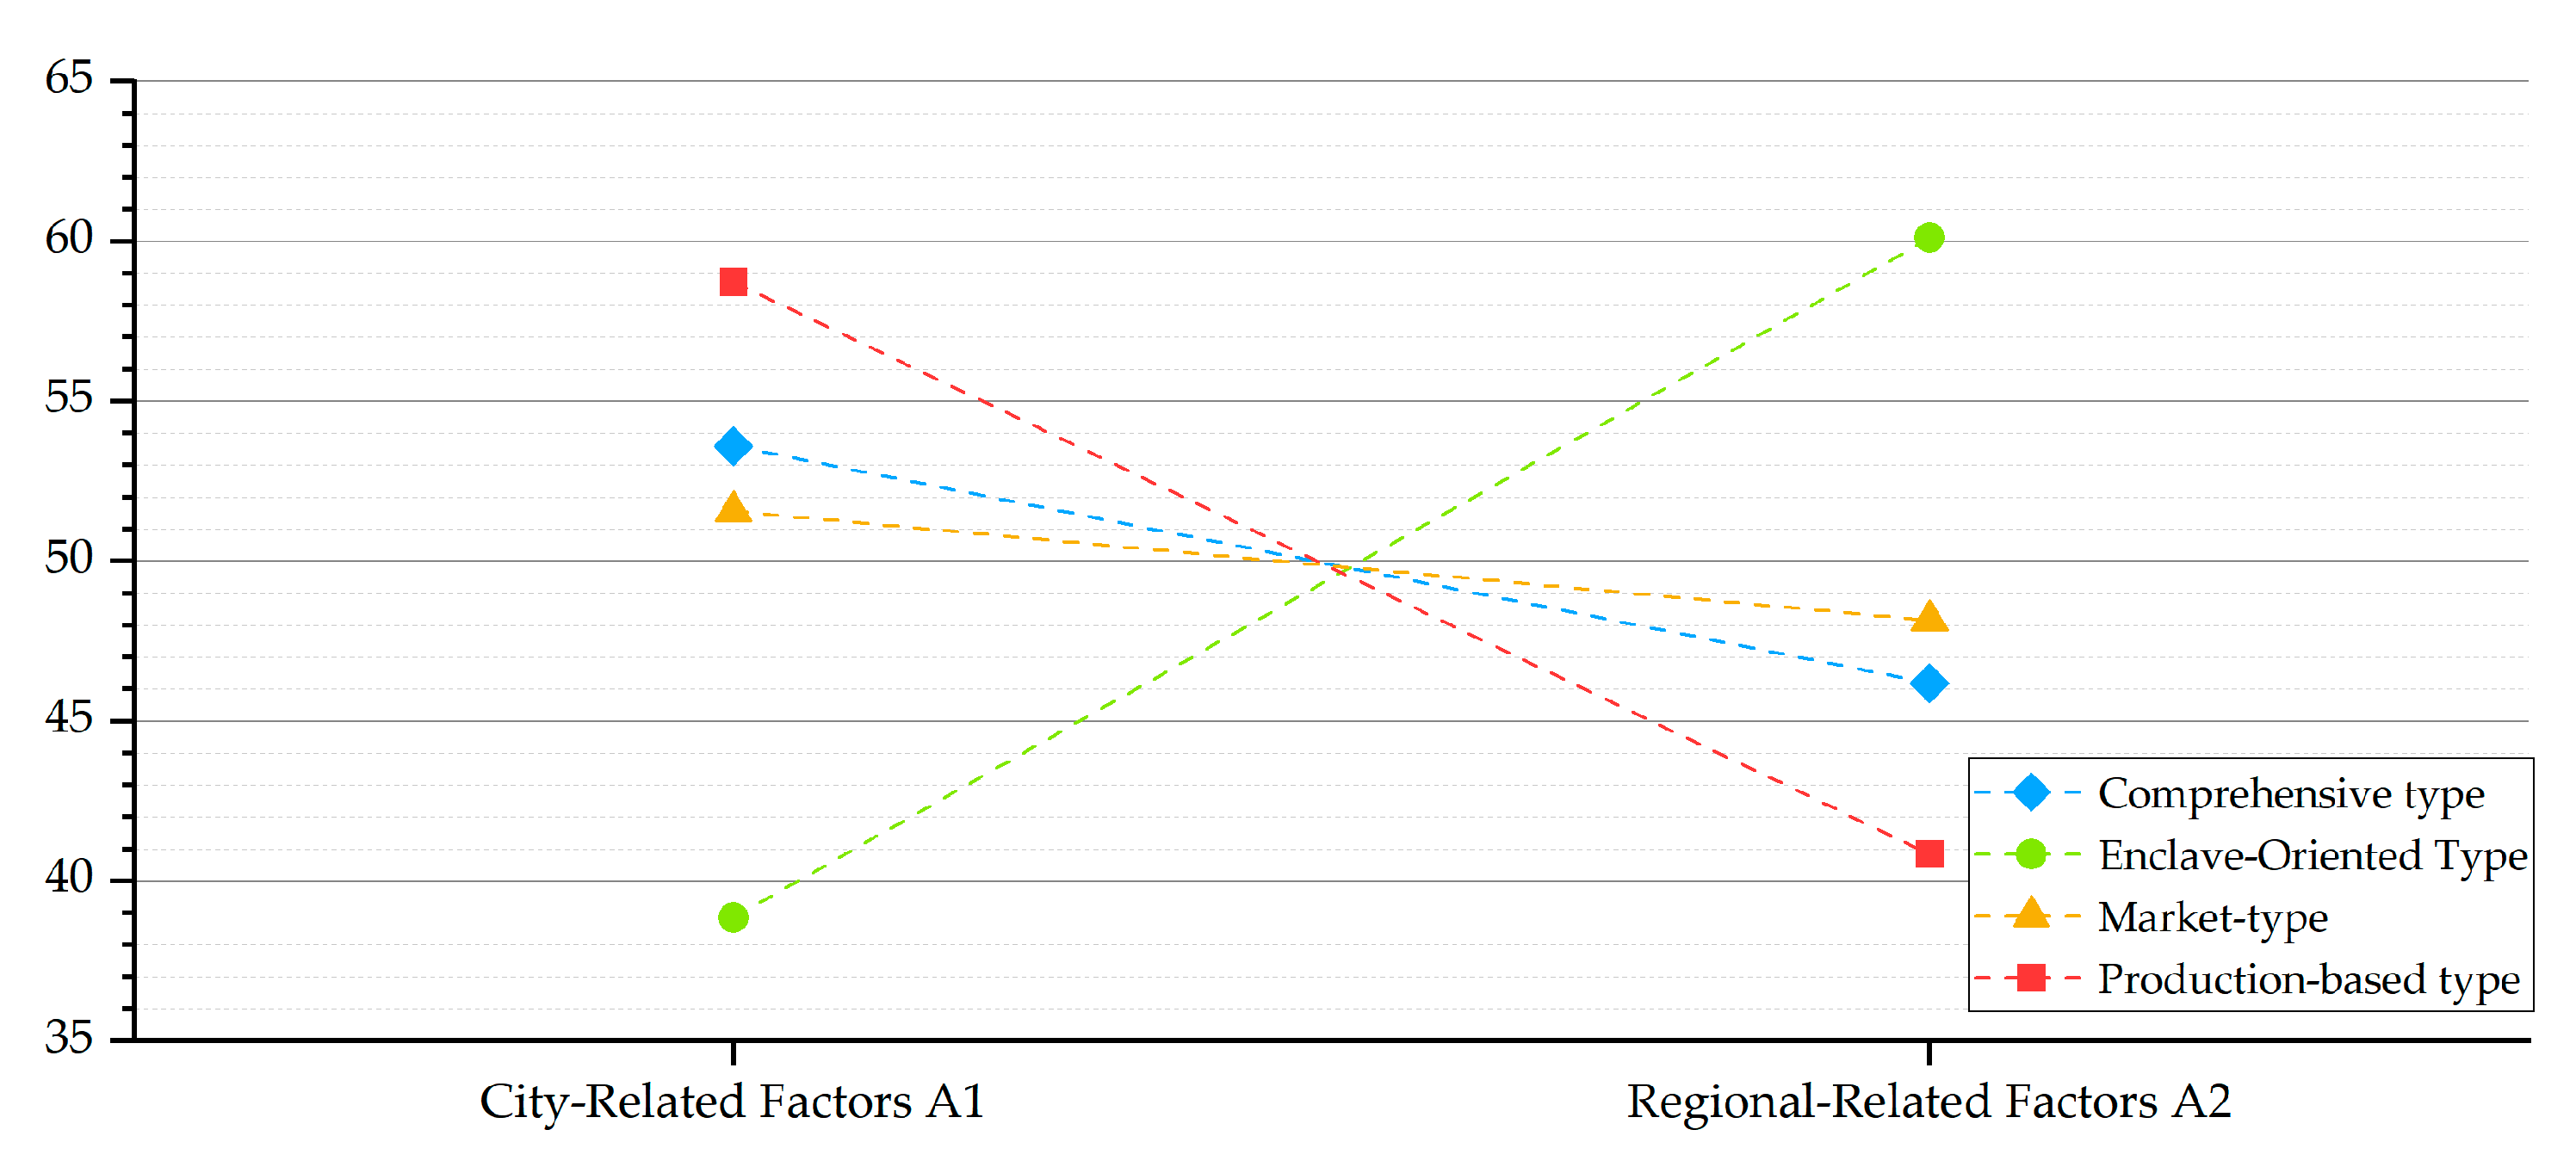
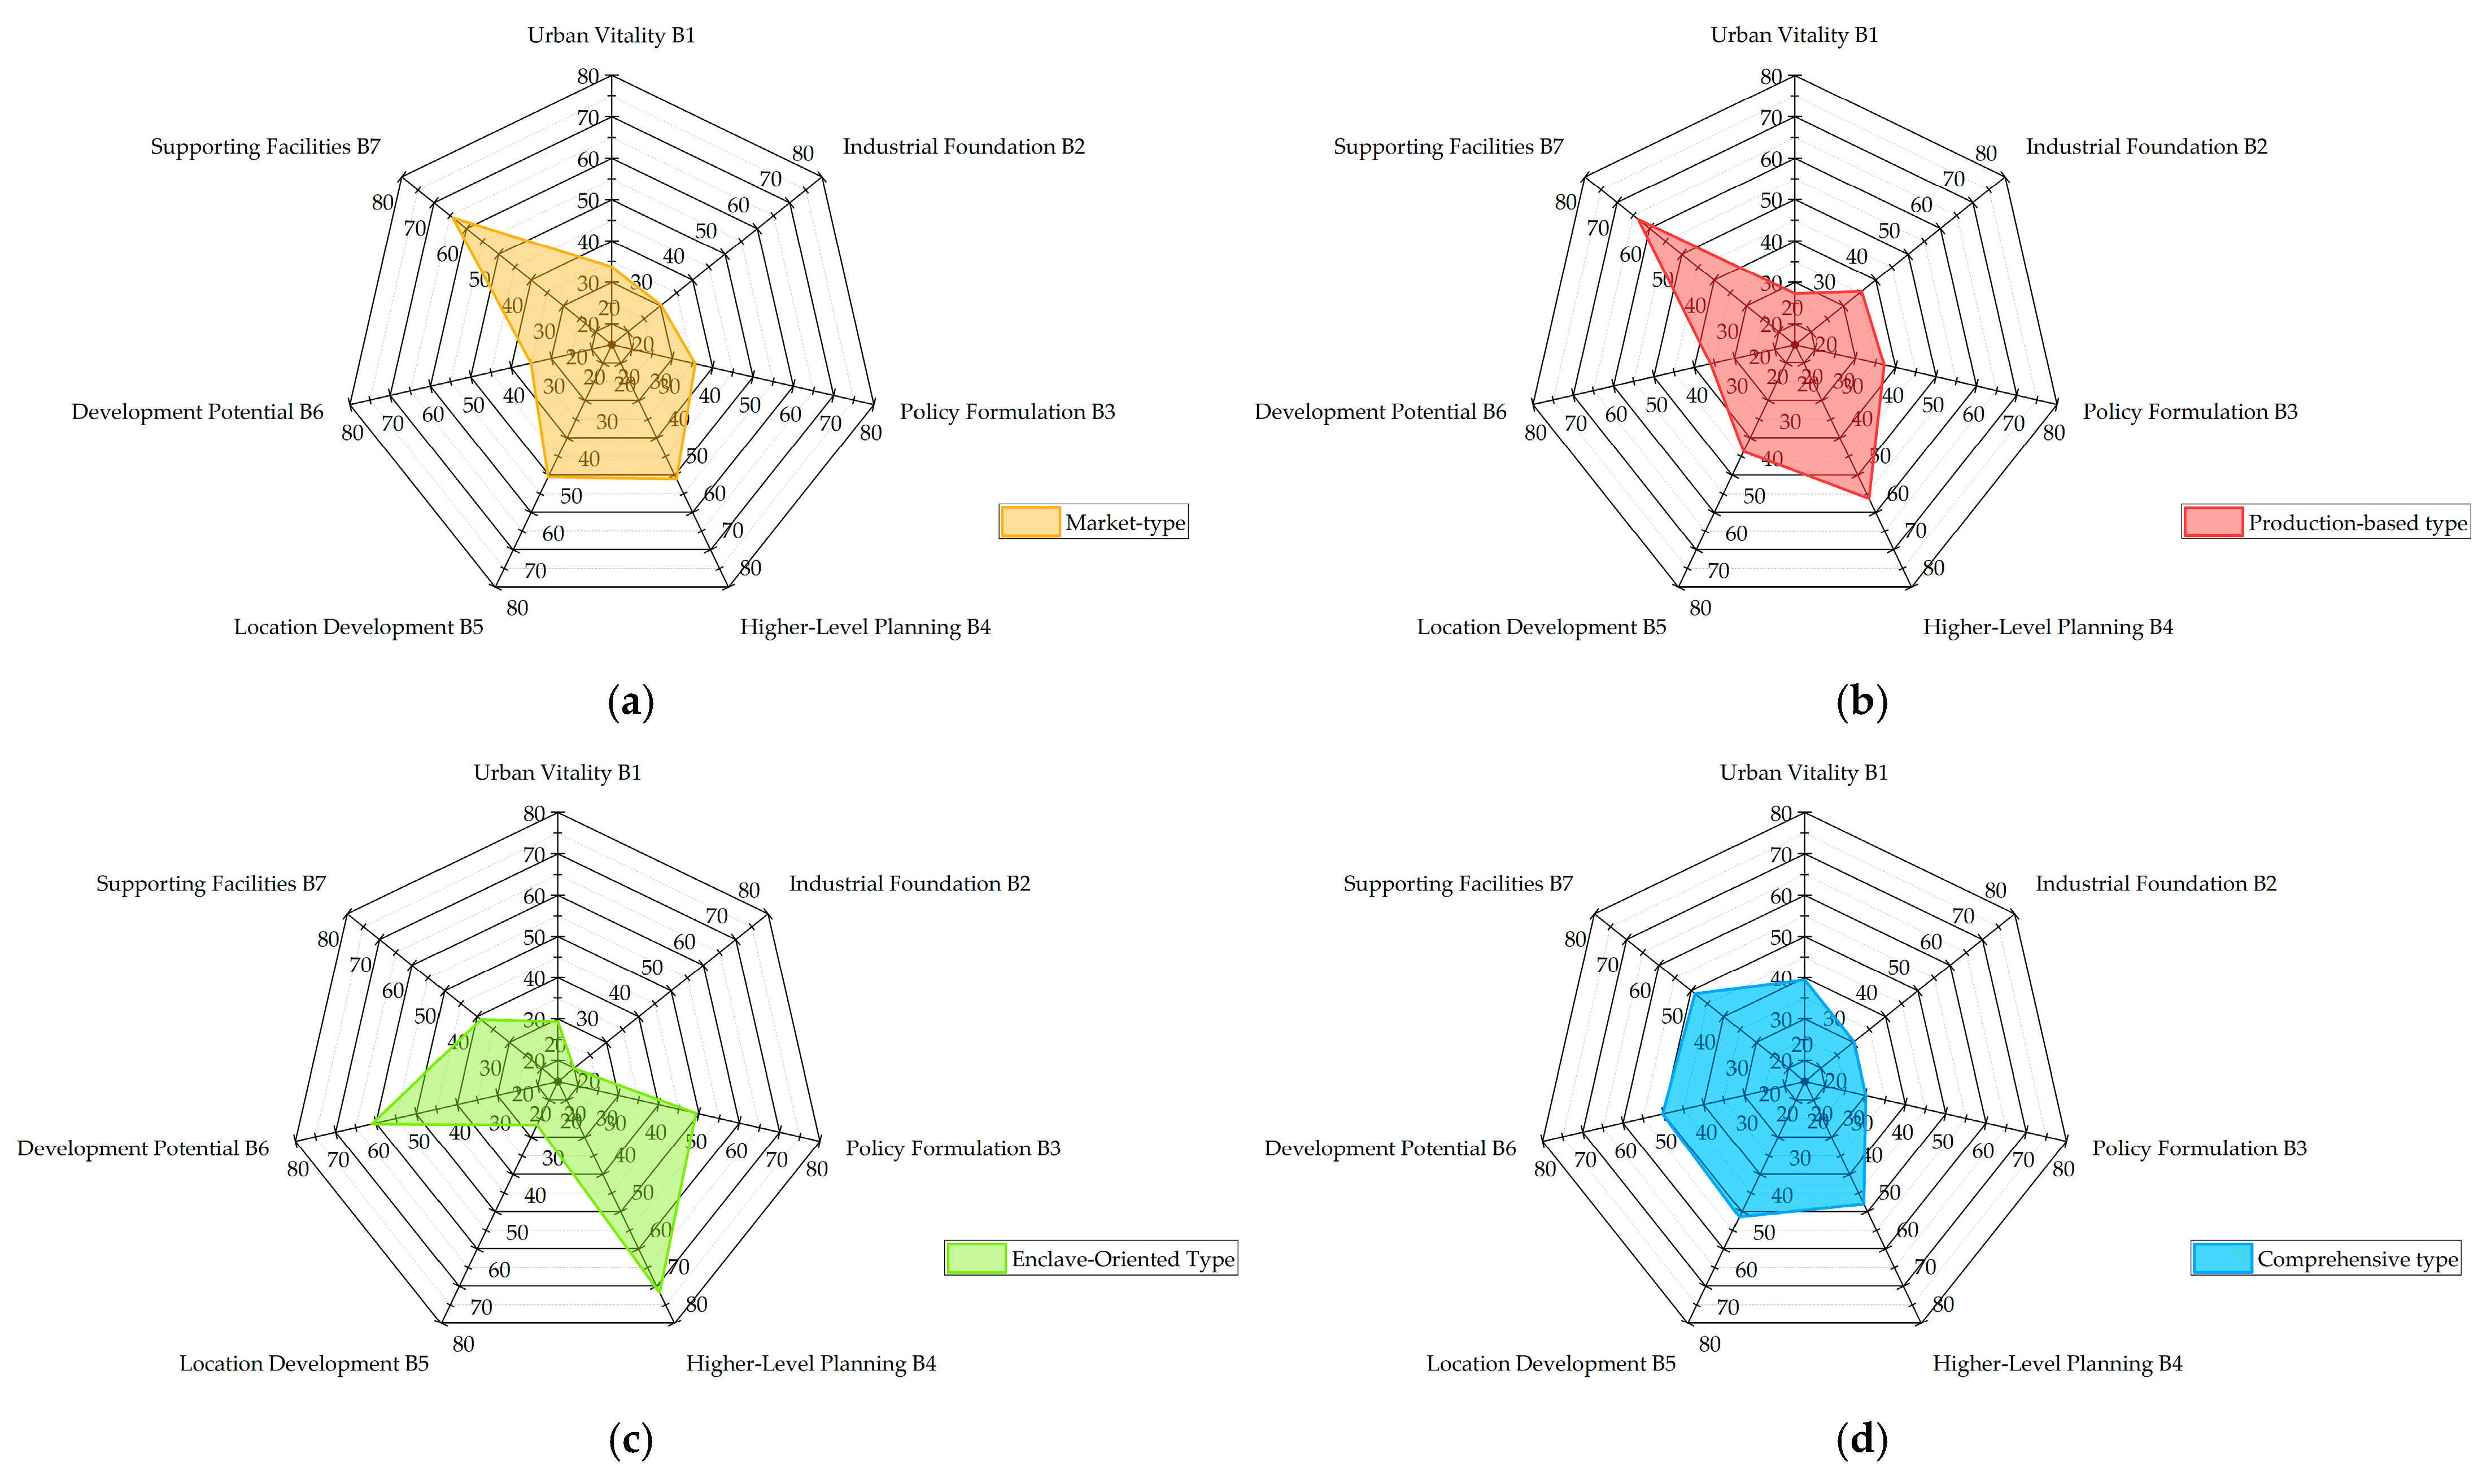
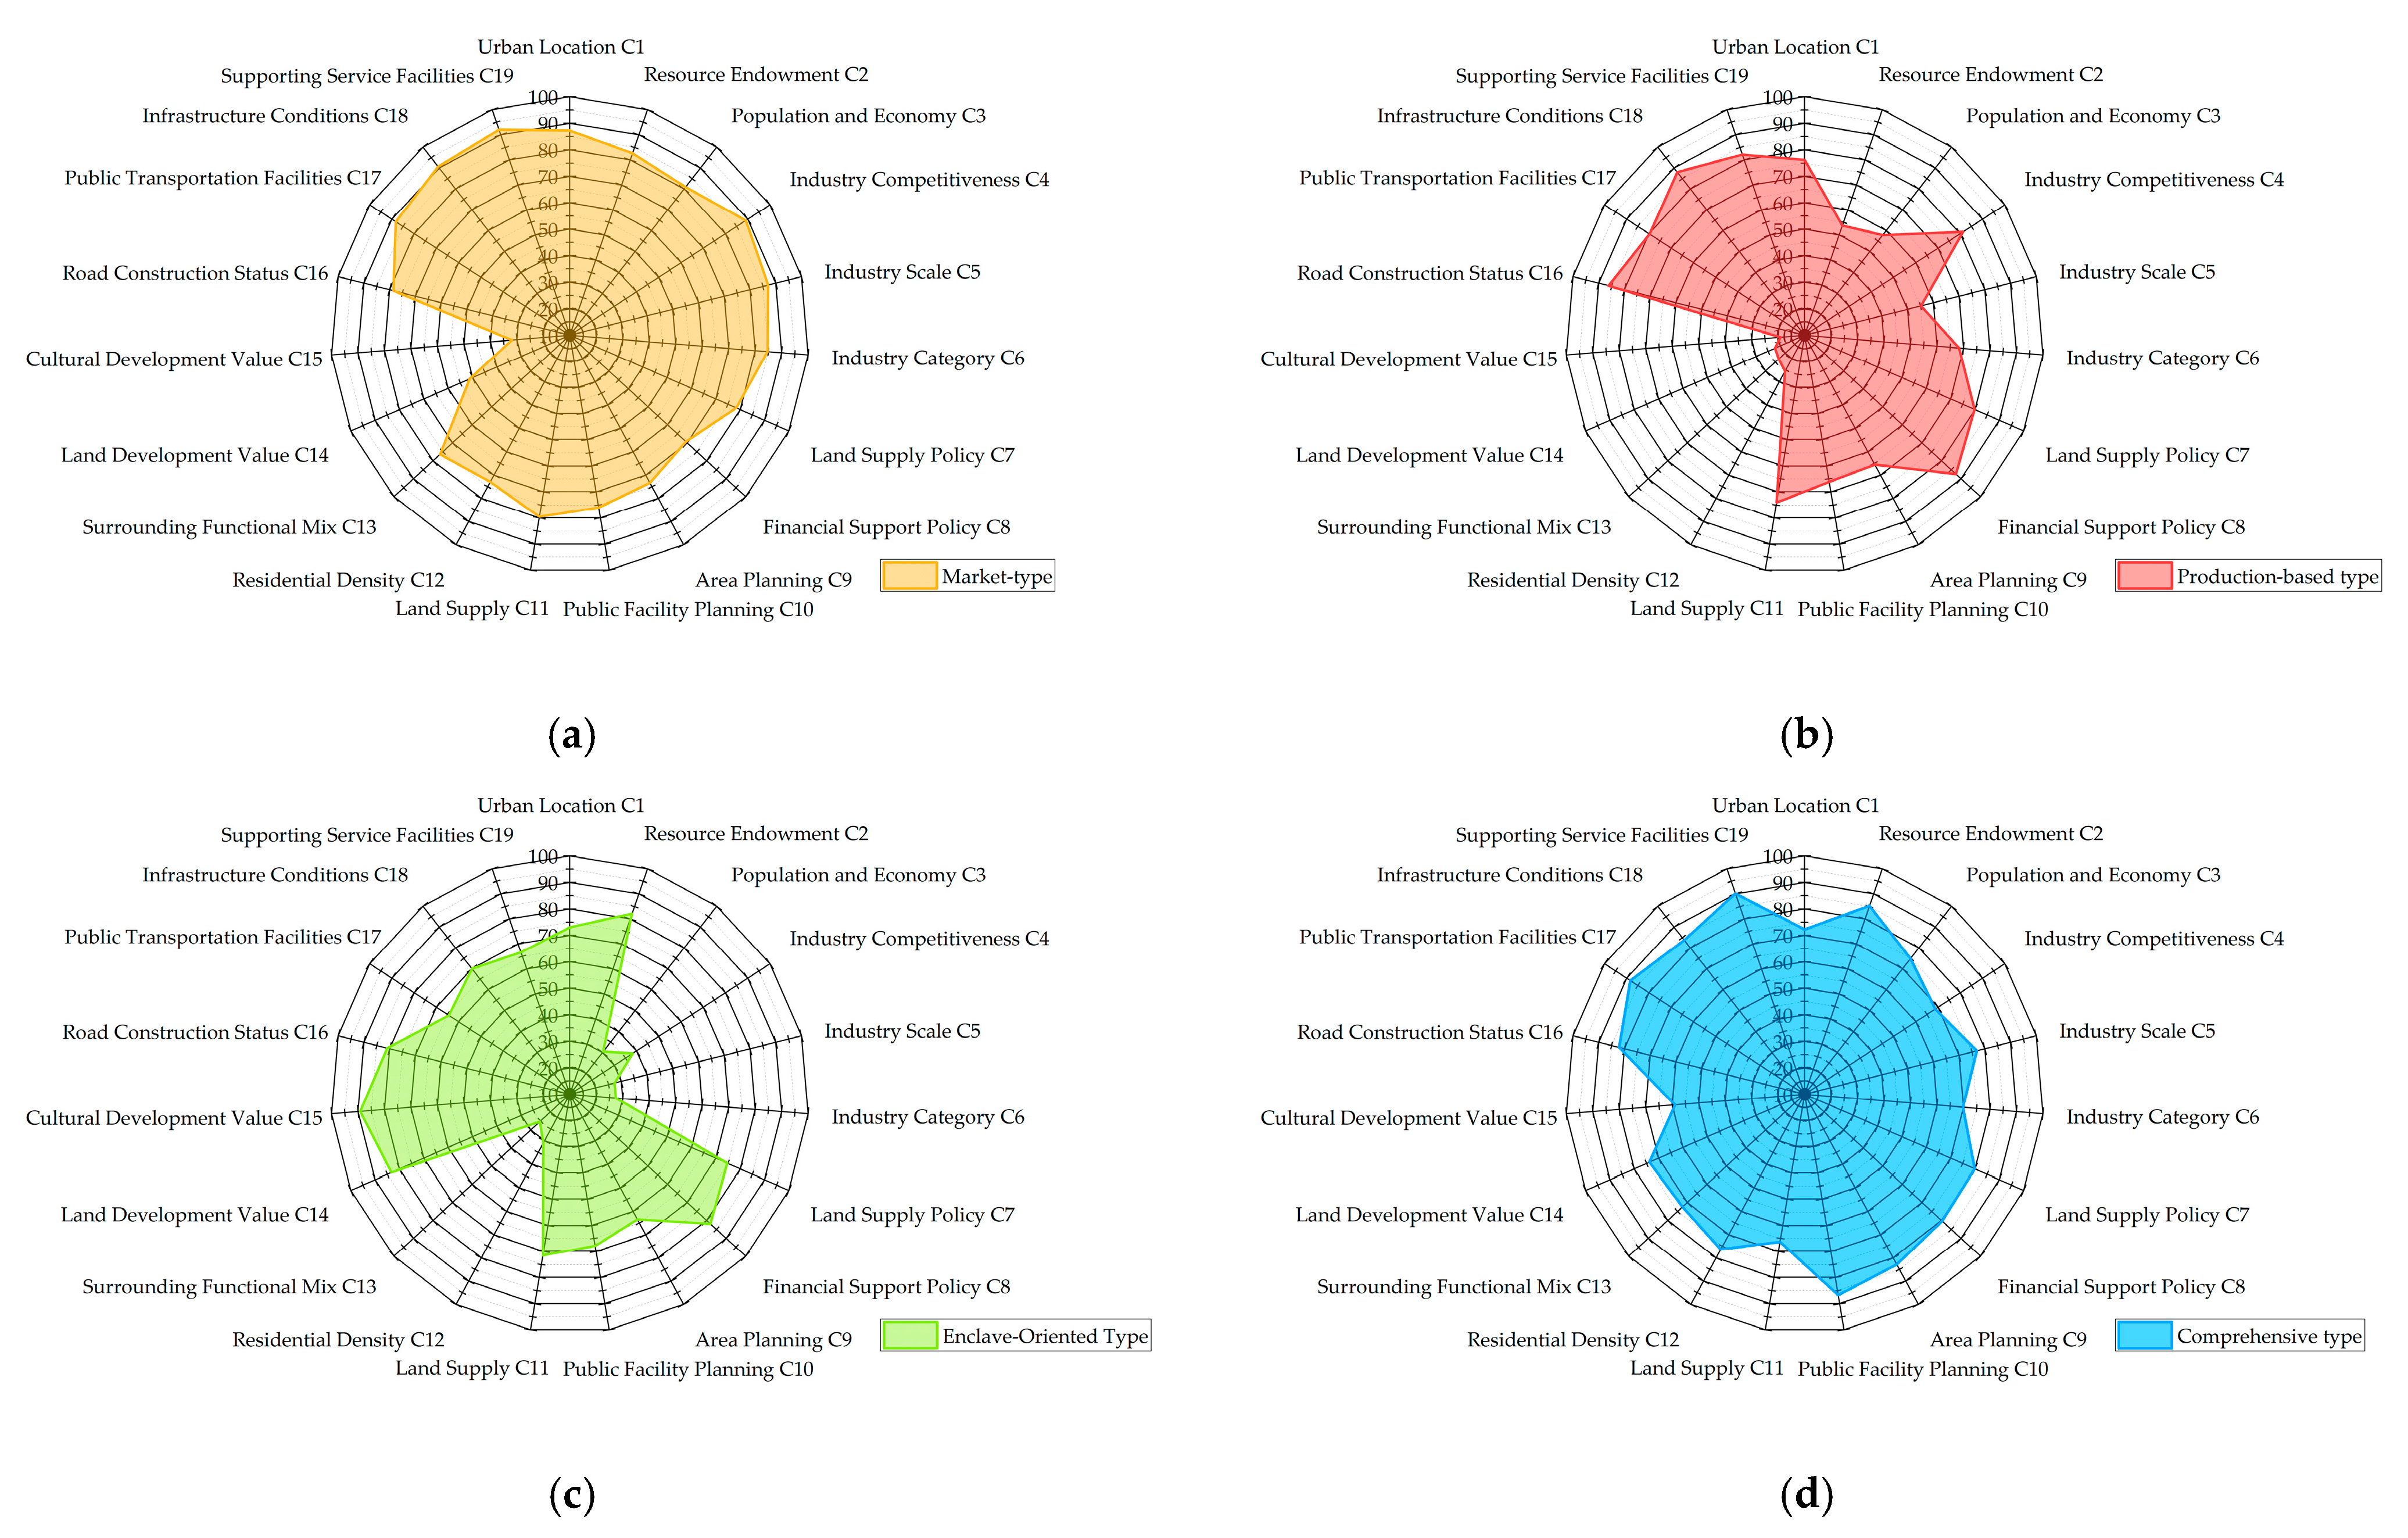
5.2.2. Factor Comparison Analysis
6. Limitations of the Study
7. Conclusions
Author Contributions
Funding
Data Availability Statement
Acknowledgments
Conflicts of Interest
References
- Zhu, F. Exploration and Practice of Convention and Exhibition Industry Development in Small and Medium-Sized Cities; Huazhong University of Science and Technology Press: Wuhan, China, 2022. [Google Scholar]
- Xie, Y. Research on the Architectural Programming Elements of Conference and Exhibition Buildings in Small and Medium-Sized Cities; South China University of Technology: Guangzhou, China, 2024. [Google Scholar]
- Xie, Y.; Lujo, J.; Du, P. Subjective Evaluation of Place Environmental Quality in Conference and Exhibition Buildings in Small- and Medium-Sized Cities: An Empirical Case Study. Buildings 2025, 15, 1553. [Google Scholar] [CrossRef]
- Yi, L. Viewing the Development of Convention and Exhibition Economy in China’s Small and Medium-Sized Cities from the Perspective of City Management. Reform Strategy 2003, 10, 38–41. [Google Scholar]
- China Council for the Promotion of International Trade. China Exhibition Economic Development Report—2019; China Council for the Promotion of International Trade: Beijing, China, 2019. [Google Scholar]
- An, S. Functional Enhancement of Small and Medium-Sized Cities in Metropolitan Areas; Science Press: Beijing, China, 2020. [Google Scholar]
- Compilation Committee of Annual Report on Development of Small and Medium-Sized Cities in China. Annual Report on the Development of Small and Medium-Sized Cities in China (2022): Development of Small and Medium-Sized Cities Under the Goal of Common Prosperity; Social Sciences Academic Press: Beijing, China, 2022. [Google Scholar]
- Jia, X. Research on the Development Path and Countermeasures of New Urbanization in Hulunbuir City. Pract. (Theor. Ed.) 2014, 8, 25–27. [Google Scholar]
- Compilation Committee of Annual Report on Development of Small and Medium-Sized Cities in China. Annual Report on Development of Small and Medium-Sized Cities in China (2020–2021); Social Sciences Academic Press: Beijing, China, 2021. [Google Scholar]
- Guo, X. Development Prospects of Convention and Exhibition Industry in Small and Medium-Sized Cities in China. Mod. Bus. 2018, 8, 24–25. [Google Scholar]
- Lawson, F. Convention and exhibition facilities; Dalian University of Technology Press: Dalian, China, 2003. [Google Scholar]
- Kusche, K. Handbook of Convention and Exhibition Building Design and Construction; Huazhong University of Science and Technology Press: Wuhan, China, 2014. [Google Scholar]
- Chen, J. Convention and Exhibition Buildings; China Architecture & Building Press: Beijing, China, 2008. [Google Scholar]
- Zhou, Z. Development Trends of Contemporary Convention and Exhibition Buildings and Exploration of Their Development in China; Tongji University: Shanghai, China, 2008. [Google Scholar]
- Ni, Y. Research on the Typological Evolution of Convention and Exhibition Buildings in the Context of China’s Urban Development; South China University of Technology: Guangzhou, China, 2018. [Google Scholar]
- Hou, X. Research on the Design of Convention and Exhibition Complexes Based on Symbiosis Theory; South China University of Technology: Guangzhou, China, 2019. [Google Scholar]
- Qin, S. Research on the Design and Evaluation System of Medium-Sized Convention and Exhibition Buildings in Southern China for Flexible Needs; South China University of Technology: Guangzhou, China, 2021. [Google Scholar]
- Tian, Y.; Wang, W. Research on Adaptive Design of Exhibition Buildings in Small and Medium-Sized Cities: A Case of Yibin International Convention and Exhibition Center Phase Ⅱ Project. Urban. Archit. 2021, 18, 93–96. [Google Scholar]
- Zhang, J.K. On sustainable development of convention and exhibition complexes in small-medium cities. Bus. Cult. 2012, 7, 212–213. [Google Scholar]
- Zhong, Z.; Cheng, X.; Fa, S.; Wei, Z.; Hui, Y. Annual Report on the Development of Small and Medium-Sized Cities in China-2012: The Path to New Urbanization in Small and Medium-Sized Cities; Social Sciences Academic Press: Beijing, China, 2012. [Google Scholar]
- Compilation Committee of Annual Report on Development of Small and Medium-Sized Cities in China. China Small and Medium-Sized Cities Development Report (2019): The Path to High-Quality Development; Social Sciences Academic Press: Beijing, China, 2019. [Google Scholar]
- Gao, J.; Zhu, H.; Chen, J. A Preliminary Study on the Development Conditions and Dynamic Mechanisms of the MICE Industry. Tour. Sci. 2003, 1, 24–27. [Google Scholar]
- Zhou, C. Research on the Process and Characteristics of Government Intervention in Urban Convention and Exhibition Industry; China Books Press: Beijing, China, 2013. [Google Scholar]
- Wang, Z. Path Selection for the Development of the Convention and Exhibition Industry in Secondary Convention and Exhibition Cities—A Case Study of Hefei City. J. Hubei Univ. Econ. (Humanit. Soc. Sci. Ed.) 2010, 7, 32–33. [Google Scholar]
- Liang, Y.; Hu, X. Preliminary Study on the Development of Convention and Exhibition Tourism in Small and Medium-sized Cities—A Case Study of Wuhu City, Anhui Province. Resour. Dev. Mark. 2009, 25, 669–672. [Google Scholar]
- Wang, P.; Cai, M.; Peng, P. Research on the Development Path of Convention and Exhibition Industry in Small and Medium-sized Cities—A Case Study of Chenzhou. Hunan Soc. Sci. 2018, 4, 152–158. [Google Scholar]
- Zeng, L.; Qiu, M. Research on the Development of Convention and Exhibition Tourism in Small and Medium-sized Cities in China—A Case Study of Langfang City. Chin. Foreign Entrep. 2020, 2, 242. [Google Scholar]
- Shen, T. Revisiting the Path of MICE Economy Development in Small and Medium-Sized Cities Through the “Long Tail Theory”. In Proceedings of the 2007 Annual Academic Conference of China Convention and Exhibition Economic Research Association, Dongguan, China, 1 March 2007; pp. 139–144. [Google Scholar]
- Dong, Z. Research on the Integrated Development Path of the MICE Industry and Local Industries. Exhib. Econ. Trade. 2025, 2, 4–7. [Google Scholar]
- Zhang, S.; Li, S. Characteristics of MICE Economy and Enhancement of Urban Functions. Areal Res. Dev. 2002, 21, 71–74. [Google Scholar]
- Hsiao, Y.-H. A Study on the Evaluation Model for International Conference Venue Selection: Application of Fuzzy AHP; Nanhua University Institutional Repository (NHUIR): Dalin, Taiwan, 2005. [Google Scholar]
- Zhang, F. Conference and Exhibition Planning; Huazhong University of Science and Technology Press: Wuhan, China, 2019. [Google Scholar]
- Li, H. Practical Conference and Exhibition Planning; China Renmin University Press: Beijing, China, 2019. [Google Scholar]
- Ni, Y. Introduction to Typology of Convention and Exhibition Buildings; South China University of Technology Press: Guangzhou, China, 2019. [Google Scholar]
- Chen, J.; Zhang, X. Multiple Aggregation and Organic Symbiosis: Formal Design of Convention and Exhibition Architecture. Low Temp. Archit. Technol. 2004, 98, 20–22. [Google Scholar]
- Wan, J. Architectural Design Research for Exhibition Spaces in Convention Centers; Beijing University of Civil Engineering and Architecture: Beijing, China, 2015. [Google Scholar]
- Zhang, Y.; Yin, J. Reflections on the Design of Convention and Second Exhibition Buildings. Contemp. Archit. 2021, 10, 134–139. [Google Scholar]
- Liu, Z. Research on Site Selection and Layout Design Strategies for Extra-Large Convention and Exhibition Buildings in China Based on Accessibility Analysis; South China University of Technology: Guangzhou, China, 2019. [Google Scholar]
- Su, Z. Research on Composite Design Strategies for Small and Medium-Sized Convention and Exhibition Buildings; Kunming University of Science and Technology: Kunming, China, 2016. [Google Scholar]
- Zhou, Q. Preliminary Study on the Architectural Design of Convention and Exhibition Buildings; Tianjin University: Tianjin, China, 2008. [Google Scholar]
- Zhang, G. History of Convention and Exhibition Buildings and Venue Design; China Architecture & Building Press: Beijing, China, 2019. [Google Scholar]
- Han, B. Research on Text Clustering Algorithm Based on Deep Learning and Improved K-Means; Dalian Jiaotong University: Dalian, China, 2023. [Google Scholar]
- Zhang, Y. Prediction of Highway Freight Transportation Growth Trend Based on Cluster Analysis; Harbin University of Science and Technology—Computer Science and Technology: Harbin, China, 2022. [Google Scholar]
- Xie, H. Research on the Renewal of Old Industrial Districts Under Urban Stock Optimization; South China University of Technology: Guangzhou, China, 2023. [Google Scholar]
- Wu, Z. Construction of Physical Fitness Evaluation Index System for Outstanding Female Football Players in Sichuan Universities Based on the Precedence Chart Method; Chengdu Sport University: Chengdu, China, 2023. [Google Scholar]
- Tang, Y. Comprehensive Comparison and Application of Precedence Chart Method and Percentage Ratio Method. Career Horiz. 2007, 22, 29. [Google Scholar]
- Jin, X.; Li, Y. Comparative Study and Application of Precedence Chart Method and Analytic Hierarchy Process in Determining Weights. Chin. J. Health Stat. 2001, 18, 119–120. [Google Scholar]
- Moody, P.E. Decision Making: Proven Methods for Better Decisions; McGraw-Hill Press: New York, NY, USA, 1983. [Google Scholar]
- Hong, F. Analysis of Planning and Design Principles for Emerging Convention Centers. Anhui Archit. 2022, 29, 12–13. [Google Scholar]
- Liu, D. Five Considerations for Developing Convention and Exhibition Industries in Small and Medium-Sized Cities. China Conv. Exhib. 2020, 3, 18. [Google Scholar]
- Sun, X. Exploration and Practice of Convention and Exhibition Industry Development in Small and Medium-Sized Cities of Zhejiang Province. Money China 2020, 7, 58. [Google Scholar]
- Zhou, X.; Ye, Q. Research on Convention and Exhibition Industry Competitiveness and Interprovincial Trade Barriers—An Empirical Analysis Based on Chinese Provincial Data. J. Cent. South Univ. (Soc. Sci. Ed.) 2011, 17, 74–79. [Google Scholar]
- Zhu, F. Convention and Exhibition Centers in Small and Medium-sized Cities Should Shift from "Landlord" to "Platform" Management. China Conv. Exhib. 2022, 7, 20. [Google Scholar]
- Huang, W. Research on the Development of the Convention and Exhibition Industry in Coastal Small and Medium-sized Cities—A Case Study of Zhoushan City. China Urban Econ. 2011, 1, 36–37. [Google Scholar]
- Fu, Y.; Zheng, X. Integration of Tourism and Convention and Exhibition Industries: Industrial Value Chain Analysis, Paths, and Countermeasures. J. Northwest AF Univ. (Soc. Sci. Ed.) 2014, 14, 146–153. [Google Scholar]
- Hong, F. Research on the Planning and Design of Mountain Convention and Exhibition Centers; North China University of Technology: Beijing, China, 2022. [Google Scholar]
- He, W. Reflections on the Development of Convention and Exhibition Economy in Small and Medium-sized Cities. J. Bus. Econ. 2004, 11, 49–51. [Google Scholar]
- Sun, Y.; Ma, Y.; Dai, X. Research on the Development Status of E-commerce in the Urbanization Process of Small and Medium-sized Cities. J. Inn. Mong. Univ. Natl. 2011, 17, 62–64. [Google Scholar]
- Yang, Q. The Driving Effect of Convention and Exhibition Economy on the Economic Development of Small and Medium-sized Cities and Countermeasures. Tour. Overv. 2014, 4, 249. [Google Scholar]
- Zheng, B.; Zhang, Y. Qualitative Research on the Low Utilization Rate of Convention and Exhibition Venues in Small and Medium-sized Cities—A Multi-perspective Analysis Based on Stakeholder Theory. China Bus. Mark. 2022, 16, 136–139. [Google Scholar]
- Feng, K. Urban Functions: From Industrial Manufacturing to Service Sector—How Chinese Cities Can Overcome the Development Dilemma of Service Industries. City Plan. Rev. 2013, 37, 93–96. [Google Scholar]
- Liu, T. New Ideas for County Convention and Exhibition—Analysis of the Interactive Relationship Between Agricultural Convention and Exhibition and Rural Economic Development. China Conv. Exhib. 2025, 3, 48–50. [Google Scholar]
- Qi, S. Thoughts on the Development of Convention and Exhibition Tourism in Small and Medium-sized Tourist Cities—A Case Study of Wuyishan. J. Nanping Teach. Coll. 2006, 2, 81–84. [Google Scholar]
- Chen, J. Location Selection and Development Strategies for Convention and Exhibition Centers. J. Chongqing Technol. Bus. Univ. (West. Econ. Forum) 2003, 3, 102–104. [Google Scholar]
- Li, K.; Wang, T.; Han, Z.; Yang, Y.; Wang, S. Jinjiang International Convention and Exhibition Center PPP Project; Social Sciences Academic Press: Beijing, China, 2019. [Google Scholar]
- Wang, H. Research on the Branding Development of Convention and Exhibition Industry in Small and Medium-Sized Cities; Hunan University: Changsha, China, 2013. [Google Scholar]
- Liu, G.; Guo, Y. Feasibility Study on Planning a Sports and Convention Center at Harbin High-speed Rail Station. Heilongjiang Sci. Technol. Inf. 2009, 26, 352. [Google Scholar]
- Song, L. Research on Energy-saving Operation Methods of Power Supply and Distribution Systems for Large Convention and Exhibition Projects in Second- and Third-tier Cities; Beijing University of Civil Engineering and Architecture: Beijing, China, 2014. [Google Scholar]
- Cai, G. Discussion on the Development Needs of Urban Convention and Exhibition Center Planning and Design—A Case Study of Nanjing International Expo Center. Mod. Urban Res. 2015, 2, 55–59. [Google Scholar]
- Tian, X. Attempts in Convention and Exhibition Buildings Under Specific Regional Conditions—Zunyi Shidi Qiangwei International Convention and Exhibition Center. Archit. Tech. 2019, 2, 78–85. [Google Scholar]
- Cheng, J.; Ai, C. Convention and Exhibition Economic Development, Convention and Exhibition City Competitiveness, and Urban Function Enhancement. City Plan. Rev. 2008, 10, 15–20. [Google Scholar]
- Chen, J.; Zhang, X. Multi-Dimensional Aggregation and Organic Symbiosis—Research on the Formal Creation of Convention and Exhibition Buildings. In Proceedings of the Academic Symposium on New Situations and Technological Innovation, Nicosia, Cyprus, 14 March 2004; p. 3. [Google Scholar]
- Wang, T. China PPP Annual Development Report (2017); Social Sciences Academic Press (Law & Society Division): Beijing, China, 2018. [Google Scholar]
- Fang, Q. Research on the Relationship Between Traffic Impact Assessment and Urban Design—A Case Study of the Urban Design of Urumqi Convention and Exhibition Center Area. Hous. Real Estate 2020, 9, 249. [Google Scholar]
- Wang, F.; Li, Q. Research on the Correlation Between the Positioning of Large and Medium-sized Sports Venues and Traffic Accessibility—A Case Study of the Guangzhou-Foshan Area. South. Archit. 2021, 6, 100–106. [Google Scholar]
- Yu, H.; Qian, H.; Yang, M. Discussion on Key Contents of Traffic Impact Analysis for Sports and Convention Centers—A Case Study of Traffic Impact Assessment for Zhenjiang Sports and Convention Center. Traffic Transp. (Acad. Ed.) 2010, 26, 3. [Google Scholar]
- Zhang, D. Research on Traffic Impact Assessment in Small and Medium-Sized Cities; Chongqing Jiaotong University: Chongqing, China, 2014. [Google Scholar]
- Fortin, P.A.; Ritchie, J.R.R.; Arsenault, J. A Study of the Decision Process of North American Associations Concerning the Choice of a Convention Site; Quebec Planning and Development Council: Quebec City, QC, Canada, 1976. [Google Scholar]
- Mair, J. Conferences and Conventions; Routledge: London, UK, 2014. [Google Scholar]


| Variable | Indicator | Definition | Final Cluster Centers | |||
|---|---|---|---|---|---|---|
| 1 | 2 | 3 | 4 | |||
| 1 | Total GDP (100 million CNY) | The gross domestic product (GDP) data in this study represents the total value of all production activities carried out by resident units in each region during the year 2023. | 3307.26 | 714.63 | 1116.64 | 3925.19 |
| 2 | Primary Industry GDP (100 million CNY) | This refers to the gross output value of various types of farmers and primary agricultural products (including both aquatic and terrestrial) in 2023. | 268 | 101 | 98 | 215 |
| 3 | Secondary Industry GDP (100 million CNY) | This refers to the gross output value of various professional workers and all types of industrial production in 2023. | 1446 | 511 | 409 | 1737 |
| 4 | Tertiary Industry GDP (100 million CNY) | The tertiary industry, also known as the service sector, refers to the gross output value of industries excluding the primary and secondary sectors in 2023. | 1458 | 660 | 575 | 2003 |
| 5 | Total Population (10,000 people) | According to the 7th National Population Census of 2020, this refers to the permanent population in urban built-up areas. | 399.47 | 107.71 | 135.63 | 370.79 |
| 6 | Site Selection and Urban Relationship | 1—Urban center, 2—Urban suburbs, 3—Urban outskirts. | 1.79 | 1.65 | 1.94 | 1.70 |
| 7 | Resource Advantages | 1—Near industrial clusters, 2—Within urban development plans, 3—The urban core area, 4—Near transportation hubs, 5—Near natural resources. | 2.4 | 2.1 | 2.6 | 2.3 |
| 8 | Number of Roads | Refers to the number of roads in the base city of the convention and exhibition project, mainly those roads with a dual-carriageway standard or higher. | 2.75 | 2.5 | 1.94 | 2.60 |
| 9 | Functional Model | 1—Exhibition function, 2—Convention and exhibition function, 3—Composite function. | 1.83 | 2.05 | 1.76 | 2.30 |
| 10 | Major Exhibition Level | 1—Government-led, 2—Government-enterprise cooperation, 3—Venue-enterprise cooperation. | 2.25 | 2.10 | 2.18 | 2.40 |
| 11 | Layout Type | 1—Horizontally independent, 2—Vertically independent, 3—Single comb-style, 4—Double comb-style, 5—Dispersed, 6—Enclosed. | 3.21 | 2.10 | 2.06 | 2.60 |
| 12 | Year of Completion | Refers to the completion and operational start date of the project. | 2012.5 | 2012.0 | 2012.8 | 2013.3 |
| 13 | Total Investment (100 million CNY) | Refers to the total investment cost during the construction period (estimated or actual) to complete the project. | 8.5 | 5.8 | 6.8 | 13.3 |
| 14 | Total Land Area (10,000 m2) | Refers to the total land area allocated for buildings, supporting facilities, roads, and landscaping, as defined by land use and planning permits and redline boundaries. | 14.5 | 9.8 | 9.0 | 16.0 |
| 15 | Total Building Area (10,000 m2) | Refers to the total gross floor area of all above-ground and below-ground structures within the land area. | 8.0 | 4.9 | 5.6 | 10.8 |
| 16 | Indoor Exhibition Area (10,000 m2) | Refers to the total indoor exhibition area within the exhibition facility. | 3 | 3 | 1 | 3 |
| 17 | Outdoor Exhibition Area (10,000 m2) | Refers to the total outdoor exhibition space within the exhibition facility. | 2 | 2 | 2 | 2 |
| 18 | Main Exhibition Hall Area (m2) | Refers to the floor area of the main exhibition hall. | 6516 | 7590 | 3817 | 11,788 |
| 19 | Clear Height (m) | Refers to the ceiling height of the main indoor exhibition hall. | 15 | 14 | 15 | 14 |
| 20 | Number of Exhibition Halls | Refers to the total number of exhibition halls in the project. | 4.1 | 4.2 | 3.9 | 3.8 |
| 21 | Number of Booths | Refers to the total number of booths that can be accommodated in the exhibition area. | 1057 | 1187 | 875 | 1231 |
| 22 | Conference Area (m2) | Refers to the total area designated for meetings and conferences within the venue. | 1 | 0 | 1 | 2 |
| 23 | Number of Meeting Rooms | Refers to the total number of meeting rooms within the venue. | 11 | 8 | 10 | 19 |
| 24 | Minimum Meeting Room Area (m2) | Refers to the area of the smallest meeting room. | 112 | 119 | 175 | 96 |
| 25 | Maximum Meeting Room Area (m2) | Refers to the area of the largest meeting room. | 1208 | 1017 | 1387 | 1360 |
| 26 | Maximum Floor Load (T/m2) | Refers to the maximum floor load capacity of the exhibition hal (T/m2). | 3 | 3 | 3 | 4 |
| 27 | Number of Parking Spaces | Total number of parking spaces. | 881 | 641 | 733 | 956 |
| 28 | Expansion Demand | 1—Yes, 2—No | 1.04 | 0.75 | 1.47 | 1.20 |
| 29 | Renovation Demand | 1—Yes, 2—No | 0.88 | 0.65 | 1.18 | 1.00 |
| 30 | Profit and Loss Status | 1—Profit, 2—Loss, 3—Financially budgeted. | 0.96 | 0.65 | 1.71 | 1.40 |
| 31 | Operation Model | 1—Government public institution, 2—State-owned enterprise, 3—Entrusted operation, 4—Privately operated. | 2.50 | 2.33 | 2.14 | 1.94 |
| Cluster Data Features | Cluster Center Representative Case | Typical Case Analysis | Definition |
|---|---|---|---|
| The data characteristics of Cluster 1 reveal that this type of city has a highly developed economy, the largest urban population, and superior transportation infrastructure around the convention and exhibition venues. Key indicators such as exhibition level, total investment, total land area, and total building area are significantly high in these cities. Furthermore, the operational status of the convention and exhibition buildings is strong, with an operational model predominantly based on entrusted operation, demonstrating a high level of marketization and operational efficiency. | Jinjiang International Convention and Exhibition Center | Cluster 1—Yiwu International Expo Center The Yiwu International Expo Center is situated in Yiwu, a globally recognized hub for small commodity trade. Capitalizing on its robust economic foundation and an outward-facing market environment, it has become one of the leading convention and exhibition centers in the country. The center features a large-scale facility with numerous exhibition halls, making it capable of hosting a wide range of large-scale exhibitions and trade fairs. Its operational model is based on entrusted operation, characterized by a high degree of marketization, leading exhibition hall utilization rates, and strong profitability. Additionally, the surrounding area offers convenient transportation, comprehensive logistics, and extensive commercial and accommodation facilities, all of which provide solid support for the successful operation of exhibitions. | Market type |
| Xingtai International Convention and Exhibition Center | |||
| Zhumadian International Convention and Exhibition Center | |||
| Yiwu International Expo Center | |||
| The centroid analysis of Cluster 2 reveals that these cities have relatively small economic scales and lower GDP levels. However, the locations of their convention and exhibition venues are typically situated in the city center. Convention and exhibition activities in these cities are mainly government-led or involve government-enterprise cooperation. While investment in venues is comparatively low, the number of exhibition halls and booths remains high. Notably, the conference spaces in these venues are smaller, with significant demand for expansion and upgrades. This indicates a need for further optimization and expansion in future developments. | Shouguang International Convention and Exhibition Center | Cluster 2—Shouguang International Convention and Exhibition Center Shouguang International Convention and Exhibition Center is located in Shouguang, China’s “Vegetable Capital”, and leverages the region’s well-developed agricultural industrial chain to become a prominent agricultural exhibition platform nationwide. Although Shouguang’s GDP is relatively low, its agricultural prominence stands out. The convention and exhibition center mainly hosts agricultural expos, trade fairs for agricultural products, and other specialized exhibitions, with a high exhibition hall usage rate. It is conveniently located near the city’s core area with easy transportation access. Convention and exhibition activities are mainly government-led or involve government-business cooperation. Despite the relatively small investment scale, the center benefits from strong demand for agricultural exhibitions, resulting in a high number of exhibition halls and booths. This creates significant potential for future exhibition upgrades and industry expansion. | Production-based type |
| Guangrao International Convention and Exhibition Center | |||
| Yuyao Zhongsu International Convention and Exhibition Center | |||
| Jingdezhen International Convention and Exhibition Center | |||
| Cluster 3 includes cities with relatively low overall economic development levels. The location indicators for their convention and exhibition buildings suggest that these venues are typically situated away from the city center. Moreover, the building and exhibition hall areas tend to be smaller, and their financial status is less favorable, indicating challenges in operational efficiency and economic performance. | Qufu Confucius Cultural Convention and Exhibition Center | Cluster 3—Wuzhen Internet International Expo Center The Wuzhen Internet International Expo Center serves as the venue for the World Internet Conference. Despite Wuzhen’s overall lower economic level, the center has gained prominence as a key location for top-tier industry conferences, largely due to the influence of the Internet industry. While the exhibition hall is of moderate size, its location away from the city center results in a relatively low daily usage rate, with the venue mainly supporting specific industry events. The operational model is government-led, and the profit model is relatively straightforward, presenting notable challenges for long-term sustainability. | Enclave type |
| Wuzhen Internet International Convention and Exhibition Center | |||
| Yunqi Town Convention and Exhibition Center | |||
| Deqing Geographical Information Town International Convention and Exhibition Center | |||
| The centroid analysis of Cluster 4 reveals that these cities are leaders in both development and population size. They rank highly in terms of building scale, land area, and investment. Convention and exhibition activities in these cities are typically government-led, with operational models mainly involving government institutions and state-owned enterprises. This reflects strong development momentum and effective resource integration capabilities. | Jiujiang International Convention and Exhibition Center | Cluster 4—Zhenjiang Sports and Exhibition Center Zhenjiang Sports and Exhibition Center is located in the economically developed Yangtze River Delta region. Capitalizing on Zhenjiang’s industrial foundation and geographic advantages, it has become a prominent government-led exhibition venue. The center hosts not only large-scale exhibitions but also integrates multifunctional uses, such as sports events and cultural activities, showcasing strong resource integration capabilities. With a large building scale, substantial investment, and comprehensive facilities, the venue is well-equipped to host high-level exhibitions and government-led events. The operational model is mainly driven by public institutions and state-owned enterprises, benefiting from robust policy support and demonstrating strong advantages in regional economic development and government-resource synergy. | Comprehensive type |
| Binzhou Bohai Sci-Tech Innovation City Exhibition Center | |||
| Zhenjiang Sports Exhibition Center | |||
| Weihai International Economic and Trade Exchange Center |
| Case | Industry Type | Development Level/Location Advantage | Functional Configuration | Photo |
|---|---|---|---|---|
| Jinjiang International Convention and Exhibition Center | Textile and Apparel Industry, Footwear Industry, Paper Products Industry, Food and Beverage Industry | In 2023, the city’s GDP reached 330 billion RMB, ranking 4th among the top 100 counties nationwide, with a per capita GDP of 150,000 RMB. The private sector accounts for over 95% of the local economy. The city is home to more than 50 listed companies, including Anta, and the footwear and apparel industries generate an annual output value of 200 billion RMB—representing one-fifth of the national total. Geographically, the city enjoys notable advantages: it is just 18 min from Xiamen by high-speed rail, and Jinjiang Airport handles 8 million passengers annually. Additionally, the city has a strong overseas Chinese presence, with 2 million overseas Chinese contributing 2 billion USD in annual remittances. Overseas Chinese capital constitutes 60% of total foreign investment. The development model integrates the private economy, overseas Chinese networks, and transportation hub advantages, driving the high-quality growth of an export-oriented economy. | The total construction area is 338,000 m2, comprising six exhibition halls—including a 100,000 m2 pillarless hall—5000 international standard exhibition booths, and a 5000 m2 main venue. The facility is equipped with 18 multifunctional meeting rooms, an eight-language simultaneous interpretation system, 12,000 m2 of commercial space, and 2000 smart parking spaces. It features full 5G coverage and holds LEED Gold certification. Notable highlights include a 10-ton load-bearing lift platform and an advanced digital management system. |  |
| Kunshan International Convention and Exhibition Center | Flat Panel Display, Integrated Circuits, Intelligent Manufacturing, Biomedicine | In 2023, the GDP surpassed 500 billion RMB, securing Kunshan’s position as the top county in China by GDP, with a per capita GDP of 210,000 RMB. The electronics industry alone generated over 100 billion RMB in output, with notebook production accounting for one-third of the global market. The city hosts more than 70 listed companies and over 5000 foreign-funded enterprises. Strategically located near Shanghai—just 40 km from Hongqiao Airport and 17 min away by high-speed rail—Kunshan benefits from its proximity to the Yangtze River Delta economic hub. Supported by a national-level development zone and a Taiwan cooperation zone, Kunshan follows a “Shanghai Radiation + Foreign Investment Driven” development model. Unlike Jinjiang’s “Private Economy + Overseas Chinese” approach, Kunshan emphasizes foreign investment leadership, with both cities serving as frontrunners in China’s county-level economic development. | The Kunshan International Convention and Exhibition Center spans a total construction area of 126,000 m2 and includes five exhibition halls, one of which is a 36,000 m2 pillarless space. The center accommodates 2500 standard exhibition booths and features a 4000 m2 multifunctional hall. It is equipped with 12 meeting rooms, an intelligent conference system, 8000 m2 of commercial facilities, and 1200 parking spaces, all with full 5G coverage. Additional highlights include an 8-ton load-bearing platform and advanced digital management systems. |  |
| Heze International Convention and Exhibition Center | High-end Chemicals, Biomedicine, Mechanical and Electrical Equipment Manufacturing, New Energy and New Materials | In 2023, Heze’s GDP exceeded 420 billion RMB, placing it among the top cities in southwestern Shandong. The city has notable agricultural strengths, consistently ranking first in the province for grain output and generating over 10 billion RMB annually through its peony industry. Its industrial sector is led by energy chemicals and biomedicine, with major enterprises like Dongming Petrochemical. Heze enjoys a strategic location at the intersection of Shandong, Jiangsu, Henan, and Anhui provinces, with the newly opened Rilan High-Speed Railway allowing travel to Zhengzhou and Jinan in just two hours. The development of inland ports in Rizhao and Qingdao is helping the city establish a multimodal transportation system integrating road, rail, and water. As a vital hub in the Central Plains urban cluster, Heze is accelerating the construction of a regional integrated transportation network and an industrial transfer base, supported by infrastructure projects such as Heze Peony Airport and the Lunan High-Speed Railway. | Heze International Convention and Exhibition Center spans a total construction area of 93,000 m2, featuring four exhibition halls, including a 22,000 m2 pillarless hall, 1500 standard exhibition booths, and a 3000 m2 multifunctional hall. The facility is equipped with eight meeting rooms, an intelligent exhibition system, 5000 m2 of commercial space, and 800 parking spaces, all with full 5G coverage. Additional features include a 6-ton load-bearing platform and advanced digital management systems. | 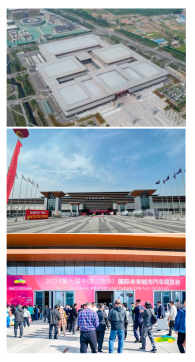 |
| Case | Leading Industry | Core Industry Situation | Photos | Site Analysis |
|---|---|---|---|---|
| Yuyao Zhongsu International Convention and Exhibition Center | Plastic Products | Relying on “China Plastic City”—the world’s largest plastic raw material trading market with an annual transaction volume exceeding 100 billion RMB—Yuyao has emerged as a major hub for China’s plastic industry. The city’s annual plastic industry output surpasses 80 billion RMB, representing over 15% of the national market share. Yuyao is home to more than 4200 plastic-related enterprises, including over 600 large-scale companies, with a combined annual production capacity of 3 million tons. It holds notable advantages in specialized sectors, commanding a 35% national market share in plastic molds, 60% in plastic accessories for daily requirements, and an annual engineering plastics production capacity of 500,000 tons. | 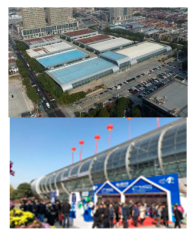 |  |
| Taizhou International Expo Center | Pharmaceutical Products | Relying on Taizhou China Pharmaceutical City, a national-level pharmaceutical high-tech zone, the city’s pharmaceutical industry surpassed 130 billion RMB in 2023. Taizhou is home to over 1200 pharmaceutical enterprises, including 14 of the world’s top 20 pharmaceutical companies, such as AstraZeneca and Nestlé Health. The city has developed a comprehensive industry chain ecosystem. The vaccine industry accounts for one-quarter of the national total, while the market share of diagnostic reagents exceeds 20%. Additionally, Taizhou hosts 56 ongoing first-class new drug projects, 5 national-level key laboratories, and 286 pharmaceutical high-tech enterprises, with annual R&D investment exceeding 5 billion RMB. | 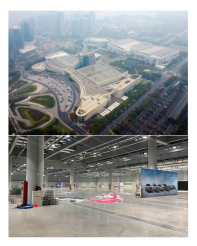 | 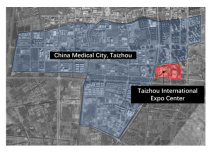 |
| Yongkang International Expo Center | Hardware Products | Relying on China Science and Technology Hardware City, with an annual transaction volume exceeding 60 billion RMB, the hardware industry has an annual output value surpassing 120 billion RMB, accounting for more than 30% of the national market share. The products are exported to over 180 countries and regions worldwide. The industry clustering effect is strong, with over 16,000 hardware manufacturing enterprises, including more than 800 large-scale companies. Leading firms such as Buyang and Wangli have emerged from this cluster. The city holds notable advantages in specialized fields, including 70% of the national production of anti-theft doors, one-third of the national export volume of electric tools, and a leading market share in stainless steel products in China. | 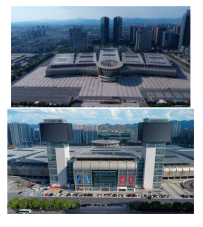 |  |
| Case | Featured Exhibition | Situation Introduction | Photos | Site Analysis |
|---|---|---|---|---|
| Wucheng Migratory Bird Town Convention Center | International Migratory Bird Protection Conference | Wucheng Migratory Bird Town exemplifies the implementation of international migratory bird conservation principles and is located in the core area of the Poyang Lake Nature Reserve. It attracts around 600,000 migratory birds annually, including 98% of the global population of white cranes. The town has pioneered an innovative model that integrates “ecological birdwatching + scientific research & protection + community development”. It features intelligent monitoring systems and ecological birdwatching facilities while preserving traditional fishing culture and promoting a green economy. This initiative has created employment for 2000 local residents. Its “government + technology + community” protection model has been recognized as a typical case under the “Ramsar Convention”. |  | 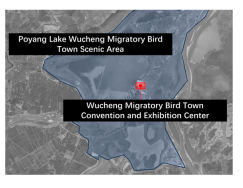 |
| Wuzhen Internet International Convention and Exhibition Center | World Internet Conference | Since the World Internet Conference permanently settled in Wuzhen in 2014, it has evolved into a central platform for global Internet governance. The 9th edition of the conference in 2023 attracted over 1800 guests from 120 countries, including eight Nobel laureates, and featured 567 exhibiting companies—40% of which were Fortune 500 enterprises. The event saw the release of 27 authoritative reports and 136 cutting-edge technological achievements, such as Huawei’s Ascend AI, and led to the signing of 19 international agreements. Leveraging the “Exhibition + Digital” model, the number of digital economy companies in Wuzhen has grown from 12 to 1058, with the industry’s total output exceeding 30 billion yuan. | 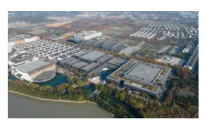 |  |
| Deqing International Exhibition Center | United Nations World Geospatial Information Congress | Since permanently settling in the Geospatial Information Town in 2018, the event has attracted over 4000 guests from more than 100 countries and has released key international agreements, such as the “Moganshan Declaration”. The conference has catalyzed the clustering of over 400 enterprises in Deqing Geospatial Information Town, contributing to an annual output value exceeding 20 billion yuan. It also led to the establishment of the world’s first Geospatial Information Innovation Center and has promoted the application of technologies such as BeiDou Navigation and remote sensing monitoring in fields including autonomous driving and smart cities. | 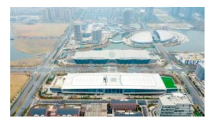 | 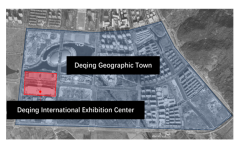 |
| Case | Function Type | Description | Photos | Site Analysis |
|---|---|---|---|---|
| Zhenjiang Sports and Exhibition Center | Exhibition, Sports Center | The Zhenjiang Sports and Exhibition Center integrates three core functions: sports events, exhibition activities, and cultural entertainment performances. The main venue can be rapidly converted between a basketball court and a 3000 m2 exhibition space. It is equipped with shared parking facilities, dining services, and an intelligent management system. By adopting a time-sharing operation model (daytime exhibitions and evening events), the center maximizes usage efficiency. Hosting over 50 exhibitions and large-scale events annually, including the provincial sports games, the center attracts more than 2 million visitors each year. This influx supports the growth of nearby hotels and commercial areas, fostering the development of a “15 min sports living circle”. | 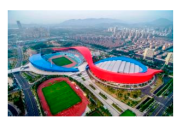 | 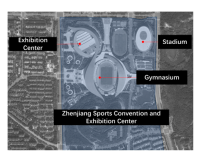 |
| Putian Convention and Exhibition Center | Exhibition, Conference, Commercial, Office | The Putian Convention and Exhibition Center adopts a comprehensive development model of “exhibition + industry + culture + commerce”. It hosts over 30 industry exhibitions annually, including the Shoe Fair and the Global Mazu Culture Forum. The center features a cross-border e-commerce experience zone and professional sports venues, seamlessly integrating the local footwear and apparel industry with a permanent exhibition area. Located directly opposite the Putian High-Speed Railway Station, the venue leverages the accessibility of the high-speed rail hub and its surrounding commercial infrastructure to attract a large number of exhibitors and visitors from outside the region. | 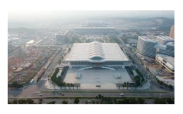 |  |
| Rizhao International Expo Center | Exhibition, Conference, Grand Theater, Hotel | The Rizhao International Expo Center incorporates multiple functions, including exhibition spaces, conference facilities, a grand theater, and star-rated hotels. It is situated next to the Olympic Water Park and the Science and Culture Center, forming an integrated hub for conventions, exhibitions, and cultural tourism. The center hosts over 50 events annually, including the Tea Expo, and also organizes various performing arts activities. Additionally, it has established an exhibition industry park to support the development of local sectors such as the tea and marine industries. |  |  |
| Primary Indicator | Secondary Indicator | Tertiary Indicator | Specific Meaning | References | ||
|---|---|---|---|---|---|---|
| City-Related Factors A1 | Urban Vitality B1 | Urban Location C1 | Refers to the city’s geographical position within a region or country, including its connectivity with neighboring cities, its role as a transportation hub, and its economic influence. The locational advantage directly impacts the city’s development potential and attractiveness. | 0.107 | 92.6316 | [10,15,17,22,23,49,50,51,52] |
| Resource Endowment C2 | Refers to the natural and cultural resources available in a city or region. Resource endowment forms the foundation for economic development. Leveraging market-driven operations or developing unique historical, cultural, or tourism resources can consistently attract exhibition organizers and participants from around the world to the region. | 0.145 | 83.1579 | [1,24,25,26,27,28,53,54,55,56] | ||
| Population and Economy C3 | Refers to the city’s population size, demographic structure, and level of economic development, reflecting its consumption capacity and labor supply. | 0.180 | 82.1053 | [4,22,57] | ||
| Industrial Foundation B2 | Industry Competitiveness C4 | Refers to the technological level, market share, and degree of internationalization of industries, used to assess their competitiveness within the region or on a national scale. | 0.153 | 81.0526 | [1,4,32,58,59,60] | |
| Industry Scale C5 | Refers to the overall size of the primary industries in a city or region, typically measured by output value, employment numbers, etc. The industry scale reflects the city’s economic strength and industrial concentration. | 0.107 | 92.6316 | [4,29,59,61,62] | ||
| Industry Category C6 | Refers to the types of dominant industries in a city or region, including the distribution of primary industries (agriculture), secondary industries (manufacturing), and tertiary industries (services). | 0.153 | 81.0526 | [4,29,57,59,63] | ||
| Policy Formulation B3 | Land Supply Policy C7 | Refers to the government’s planning and policies regarding land supply, including the amount, allocation method, and land use designation. Land supply policies directly affect the efficiency of land development and utilization. | 0.144 | 80 | [23,60,64,65] | |
| Financial Support Policy C8 | Refers to government policies designed to promote the development of the convention and exhibition industry, such as tax incentives, financial subsidies, and venue support. These supportive policies play a crucial role in enhancing the attractiveness and competitiveness of the industry. | 0.137 | 87.3684 | [23,57,60,64,65,66] | ||
| Regional-Related Factors A2 | Higher-Level Planning B4 | Area Planning C9 | Refers to the functional positioning, spatial layout, and development direction of a specific area within a city or region. Area planning defines the future development trajectory and land use patterns for the area. | 0.115 | 89.4737 | [17,49,56,64] |
| Public Facility Planning C10 | Refers to the arrangement of public facilities (such as schools, hospitals, parks, and cultural venues) and the planning of essential infrastructure, including road networks, parking, water, electricity, gas, lighting, and landscaping. The comprehensiveness of public facilities directly influences the quality of basic infrastructure. | 0.160 | 82.1053 | [31,67,68] | ||
| Location Development B5 | Land Supply C11 | Refers to the amount of available land for development within a city or region and its distribution. The adequacy and rationality of land supply impact the city’s expansion and industrial layout. | 0.186 | 80 | [56,65,69,70] | |
| Residential Density C12 | Refers to the population density in the region, typically measured by the number of people per square kilometer or the number of residential units. Residential density reflects the area’s capacity to support its population and the quality of its living environment. | 0.121 | 83.1579 | [4,17,30] | ||
| Surrounding Functional Mix C13 | Refers to the degree of spatial integration of residential, commercial, office, cultural, and other functions within a region. A high degree of functional integration can enhance regional vitality and land use efficiency. | 0.100 | 81.0526 | [1,30,71] | ||
| Development Potential B6 | Land Development Value C14 | Refers to the economic value that can be generated from land during the development process, including land prices, development potential, and market demand. Land development value is a key indicator for investors. | 0.166 | 80 | [60,65,72,73] | |
| Cultural Development Value C15 | Refers to the development potential and economic value of cultural resources in the region (such as historical relics, cultural heritage, and creative industries.). Cultural development value can increase the region’s attractiveness and uniqueness. | 0.144 | 80 | [15,35,65] | ||
| Supporting Facilities B7 | Road Construction Status C16 | Refers to the completeness of the road network in the region, including factors such as the length, density, classification (e.g., main roads, secondary roads), and traffic flow. The condition of the road infrastructure directly impacts transportation convenience and regional connectivity. | 0.077 | 82.1053 | [4,74,75,76] | |
| Public Transportation Facilities C17 | Refers to the coverage, number of routes, and operational efficiency of the public transportation system (such as subways, buses, light rail, etc.) in the region. The comprehensiveness of public transportation facilities is a key indicator of urban modernization. | 0.184 | 83.1579 | [74,75,77] | ||
| Infrastructure Conditions C18 | Refers to the completeness and operational status of infrastructure such as airports, high-speed rail stations, and ports in the region. | 0.225 | 81.0526 | [4,22,60,78,79] | ||
| Supporting Service Facilities C19 | Refers to the various service facilities available for residents and businesses in the region, such as commercial centers, restaurants, hotels, banks, and educational institutions. The completeness of these supporting services directly impacts the region’s livability and attractiveness. | 0.107 | 92.6316 | [4,64,78] |
| Indicator | Market-Type | Production-Based Type | Enclave-Oriented Type | Comprehensive Type | |
|---|---|---|---|---|---|
| Primary Indicator | City-Related Factors A1 | 58.73 | 54.57 | 38.86 | 54.98 |
| Regional-Related Factors A2 | 40.85 | 45.14 | 60.11 | 44.55 | |
| Secondary Indicator | Urban Vitality B1 | 27.33 | 33.70 | 29.36 | 39.42 |
| Industrial Foundation B2 | 35.62 | 30.26 | 19.93 | 30.26 | |
| Policy Formulation B3 | 37.16 | 35.66 | 49.27 | 30.16 | |
| Higher-Level Planning B4 | 56.25 | 51.07 | 71.72 | 47.99 | |
| Location Development B5 | 43.63 | 50.53 | 26.64 | 51.41 | |
| Development Potential B6 | 35.93 | 35.07 | 61.03 | 50.18 | |
| Supporting Facilities B7 | 63.49 | 64.24 | 38.80 | 48.85 | |
| Tertiary Indicator | Urban Location C1 | 76.23 | 87.27 | 73.02 | 72.23 |
| Resource Endowment C2 | 53.75 | 82.67 | 82.13 | 85.28 | |
| Population and Economy C3 | 57.87 | 80.92 | 30.48 | 74.90 | |
| Industry Competitiveness C4 | 81.28 | 89.15 | 38.28 | 68.78 | |
| Industry Scale C5 | 55.20 | 87.04 | 27.39 | 76.92 | |
| Industry Category C6 | 68.35 | 84.68 | 27.39 | 69.84 | |
| Land Supply Policy C7 | 79.88 | 78.46 | 74.71 | 79.91 | |
| Financial Support Policy C8 | 87.37 | 69.39 | 81.93 | 80.38 | |
| Area Planning C9 | 65.55 | 73.39 | 63.48 | 82.87 | |
| Public Facility Planning C10 | 66.13 | 76.04 | 67.84 | 86.76 | |
| Land Supply C11 | 74.06 | 79.57 | 71.49 | 66.31 | |
| Residential Density C12 | 25.51 | 72.94 | 30.94 | 76.40 | |
| Surrounding Functional Mix C13 | 23.25 | 76.37 | 25.34 | 72.50 | |
| Land Development Value C14 | 22.13 | 51.21 | 83.38 | 73.81 | |
| Cultural Development Value C15 | 19.11 | 31.91 | 89.19 | 58.95 | |
| Road Construction Status C16 | 86.12 | 78.51 | 80.95 | 82.05 | |
| Public Transportation Facilities C17 | 79.71 | 88.24 | 64.37 | 88.38 | |
| Infrastructure Conditions C18 | 88.04 | 90.72 | 70.04 | 83.75 | |
| Supporting Service Facilities C19 | 82.15 | 92.09 | 66.66 | 90.18 | |
| Indicator (A) | Weight | Indicator (B) | Weight | Indicator (C) | Weight |
|---|---|---|---|---|---|
| Urban Location A1 | 0.750 | Urban Vitality B1 | 0.102 | Urban Location C1 | 0.025 |
| Resource Endowment C2 | 0.086 | ||||
| Population and Economy C3 | 0.042 | ||||
| Industrial Foundation B2 | 0.061 | Industry Competitiveness C4 | 0.014 | ||
| Industry Scale C5 | 0.047 | ||||
| Industry Category C6 | 0.019 | ||||
| Policy Formulation B3 | 0.020 | Land Supply Policy C7 | 0.058 | ||
| Financial Support Policy C8 | 0.064 | ||||
| Resource Endowment A2 | 0.250 | Higher-Level Planning B4 | 0.143 | Area Planning C9 | 0.075 |
| Public Facility Planning C10 | 0.092 | ||||
| Location Development B5 | 0.265 | Land Supply C11 | 0.008 | ||
| Residential Density C12 | 0.047 | ||||
| Surrounding Functional Mix C13 | 0.031 | ||||
| Development Potential B6 | 0.224 | Land Development Value C14 | 0.036 | ||
| Cultural Development Value C15 | 0.003 | ||||
| Supporting Facilities B7 | 0.184 | Road Construction Status C16 | 0.070 | ||
| Public Transportation Facilities C17 | 0.097 | ||||
| Infrastructure Conditions C18 | 0.081 | ||||
| Supporting Service Facilities C19 | 0.103 |
Disclaimer/Publisher’s Note: The statements, opinions and data contained in all publications are solely those of the individual author(s) and contributor(s) and not of MDPI and/or the editor(s). MDPI and/or the editor(s) disclaim responsibility for any injury to people or property resulting from any ideas, methods, instructions or products referred to in the content. |
© 2025 by the authors. Licensee MDPI, Basel, Switzerland. This article is an open access article distributed under the terms and conditions of the Creative Commons Attribution (CC BY) license (https://creativecommons.org/licenses/by/4.0/).
Share and Cite
Xie, Y.; Luo, J.; Du, P. Research on the Positioning Models and Elemental Guarantees of Convention and Exhibition Buildings in Small and Medium-Sized Cities: Based on Empirical Case Studies. Buildings 2025, 15, 1601. https://doi.org/10.3390/buildings15101601
Xie Y, Luo J, Du P. Research on the Positioning Models and Elemental Guarantees of Convention and Exhibition Buildings in Small and Medium-Sized Cities: Based on Empirical Case Studies. Buildings. 2025; 15(10):1601. https://doi.org/10.3390/buildings15101601
Chicago/Turabian StyleXie, Yuchen, Jianhe Luo, and Peng Du. 2025. "Research on the Positioning Models and Elemental Guarantees of Convention and Exhibition Buildings in Small and Medium-Sized Cities: Based on Empirical Case Studies" Buildings 15, no. 10: 1601. https://doi.org/10.3390/buildings15101601
APA StyleXie, Y., Luo, J., & Du, P. (2025). Research on the Positioning Models and Elemental Guarantees of Convention and Exhibition Buildings in Small and Medium-Sized Cities: Based on Empirical Case Studies. Buildings, 15(10), 1601. https://doi.org/10.3390/buildings15101601