

Relationship between CO2 Emissions from Concrete Production and Economic Growth in 20 OECD Countries


Abstract
1. Introduction
2. Research Background
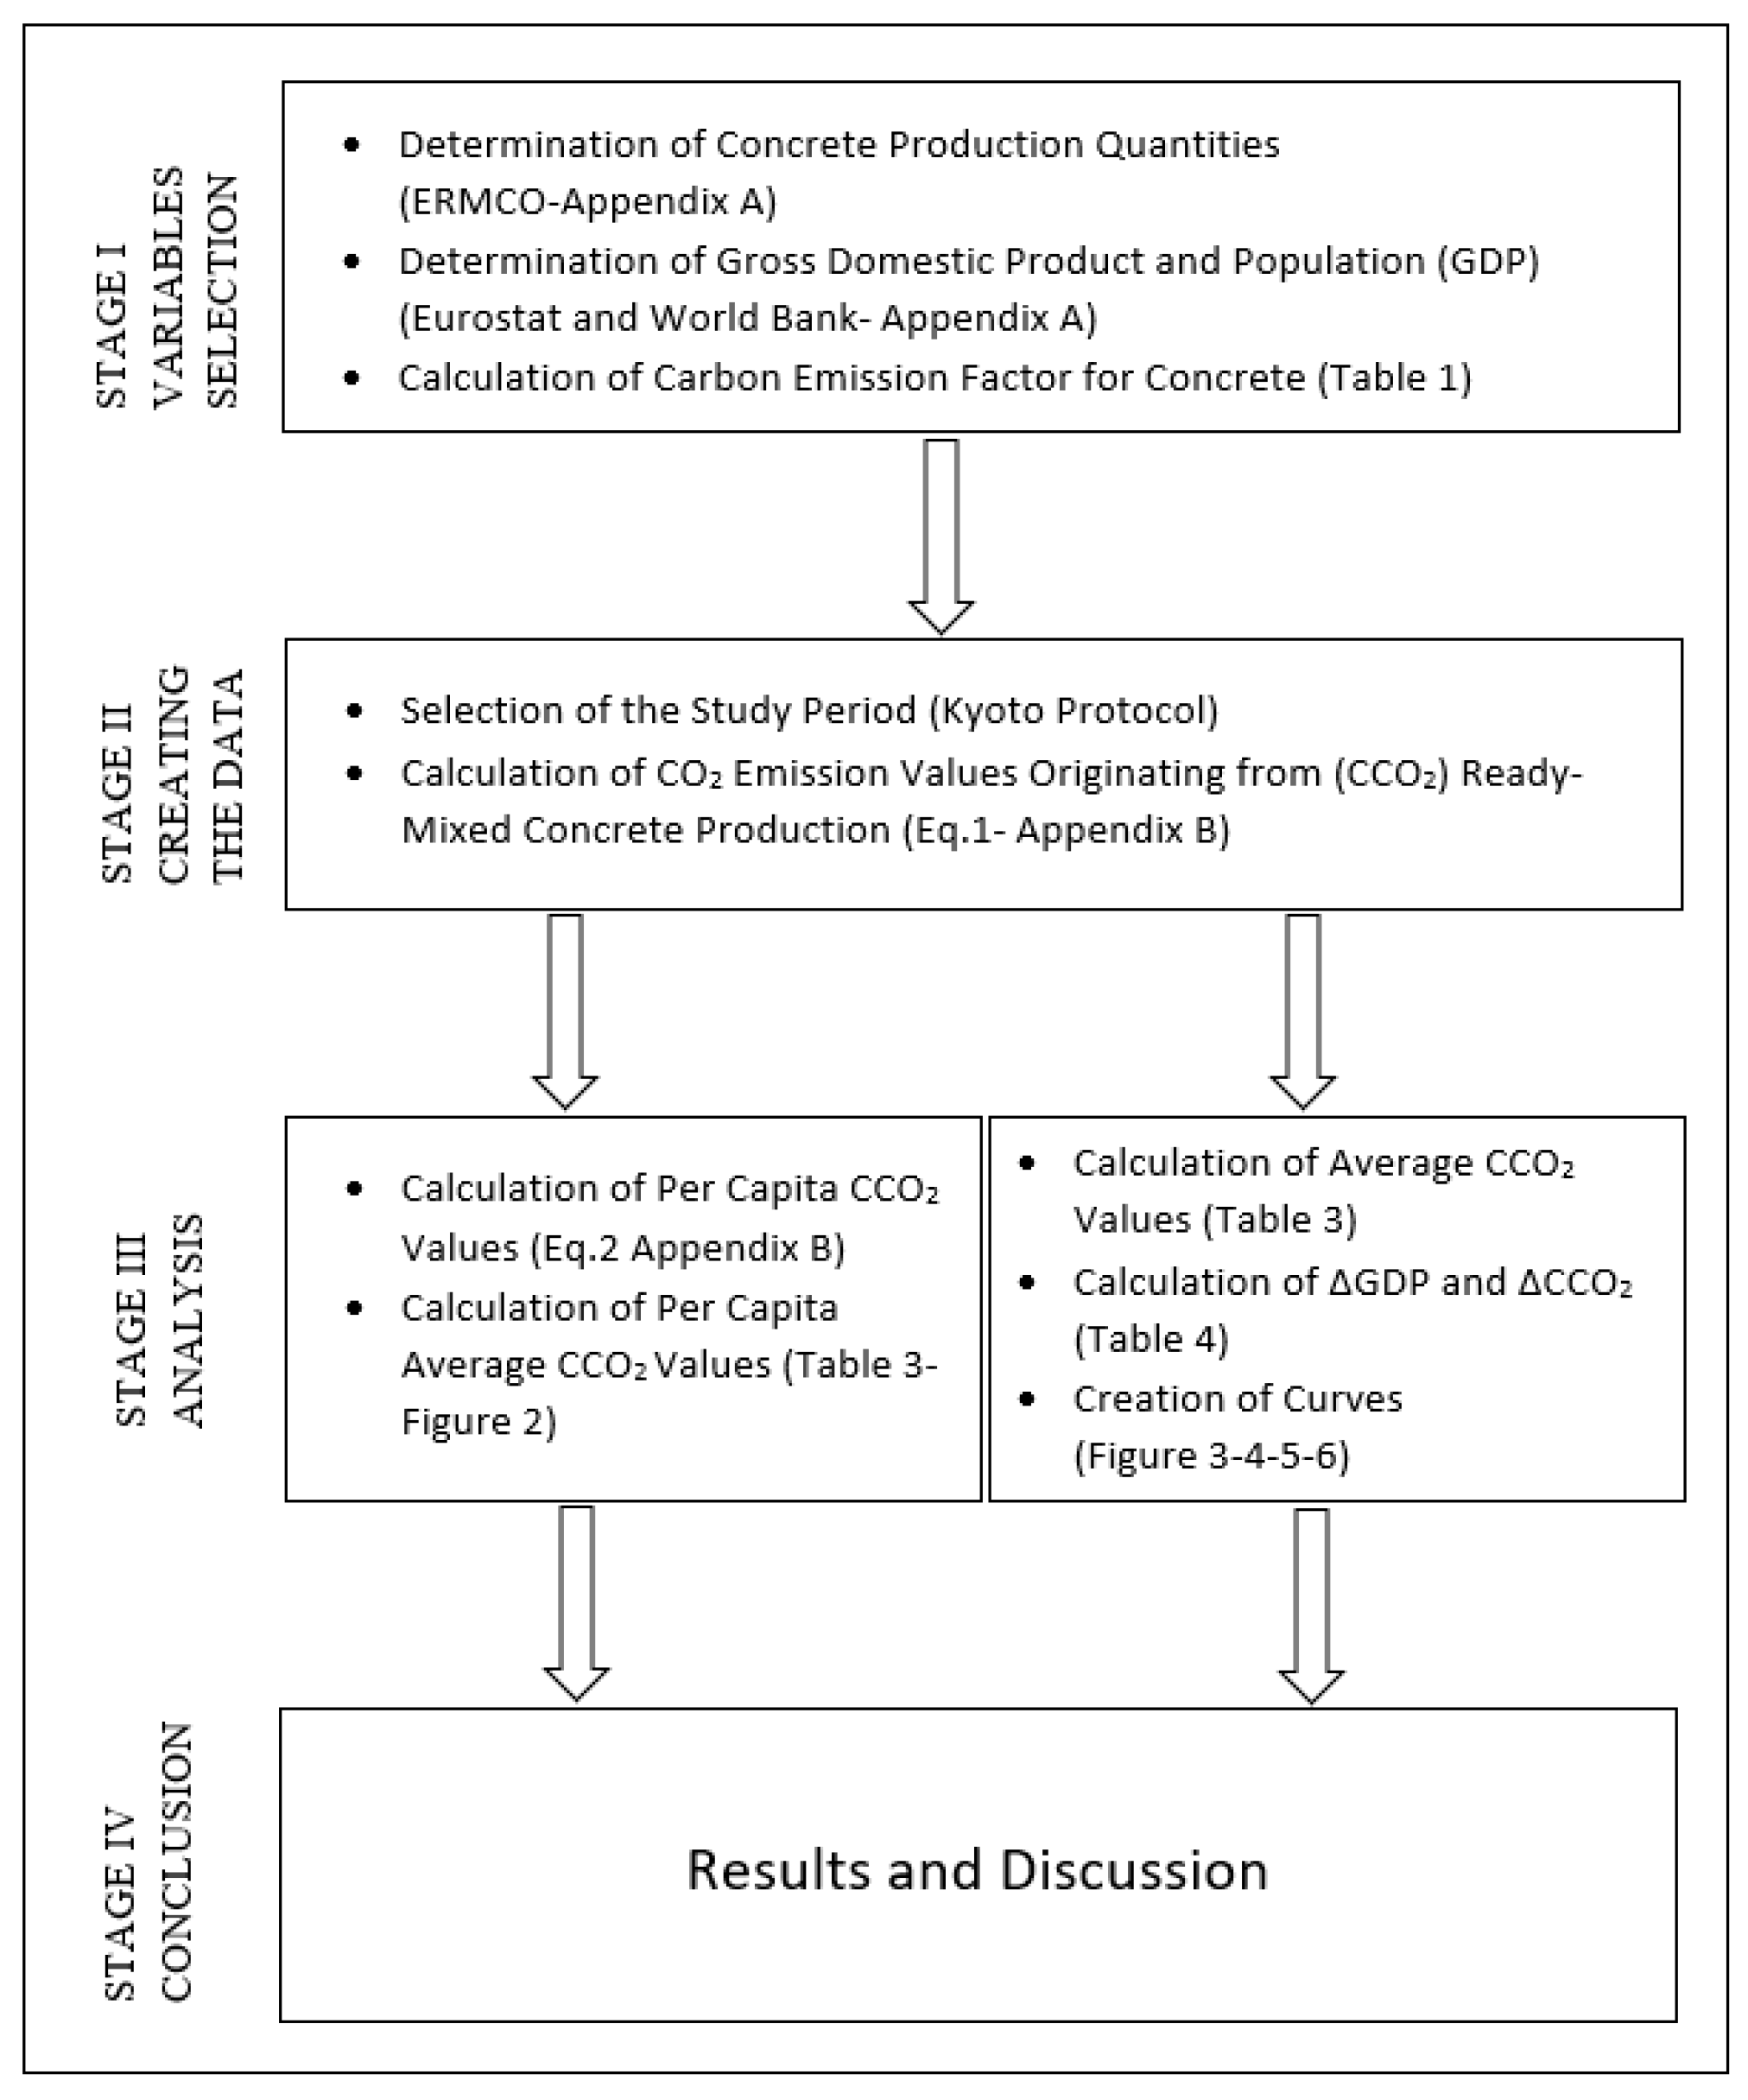
3. Research Methodology
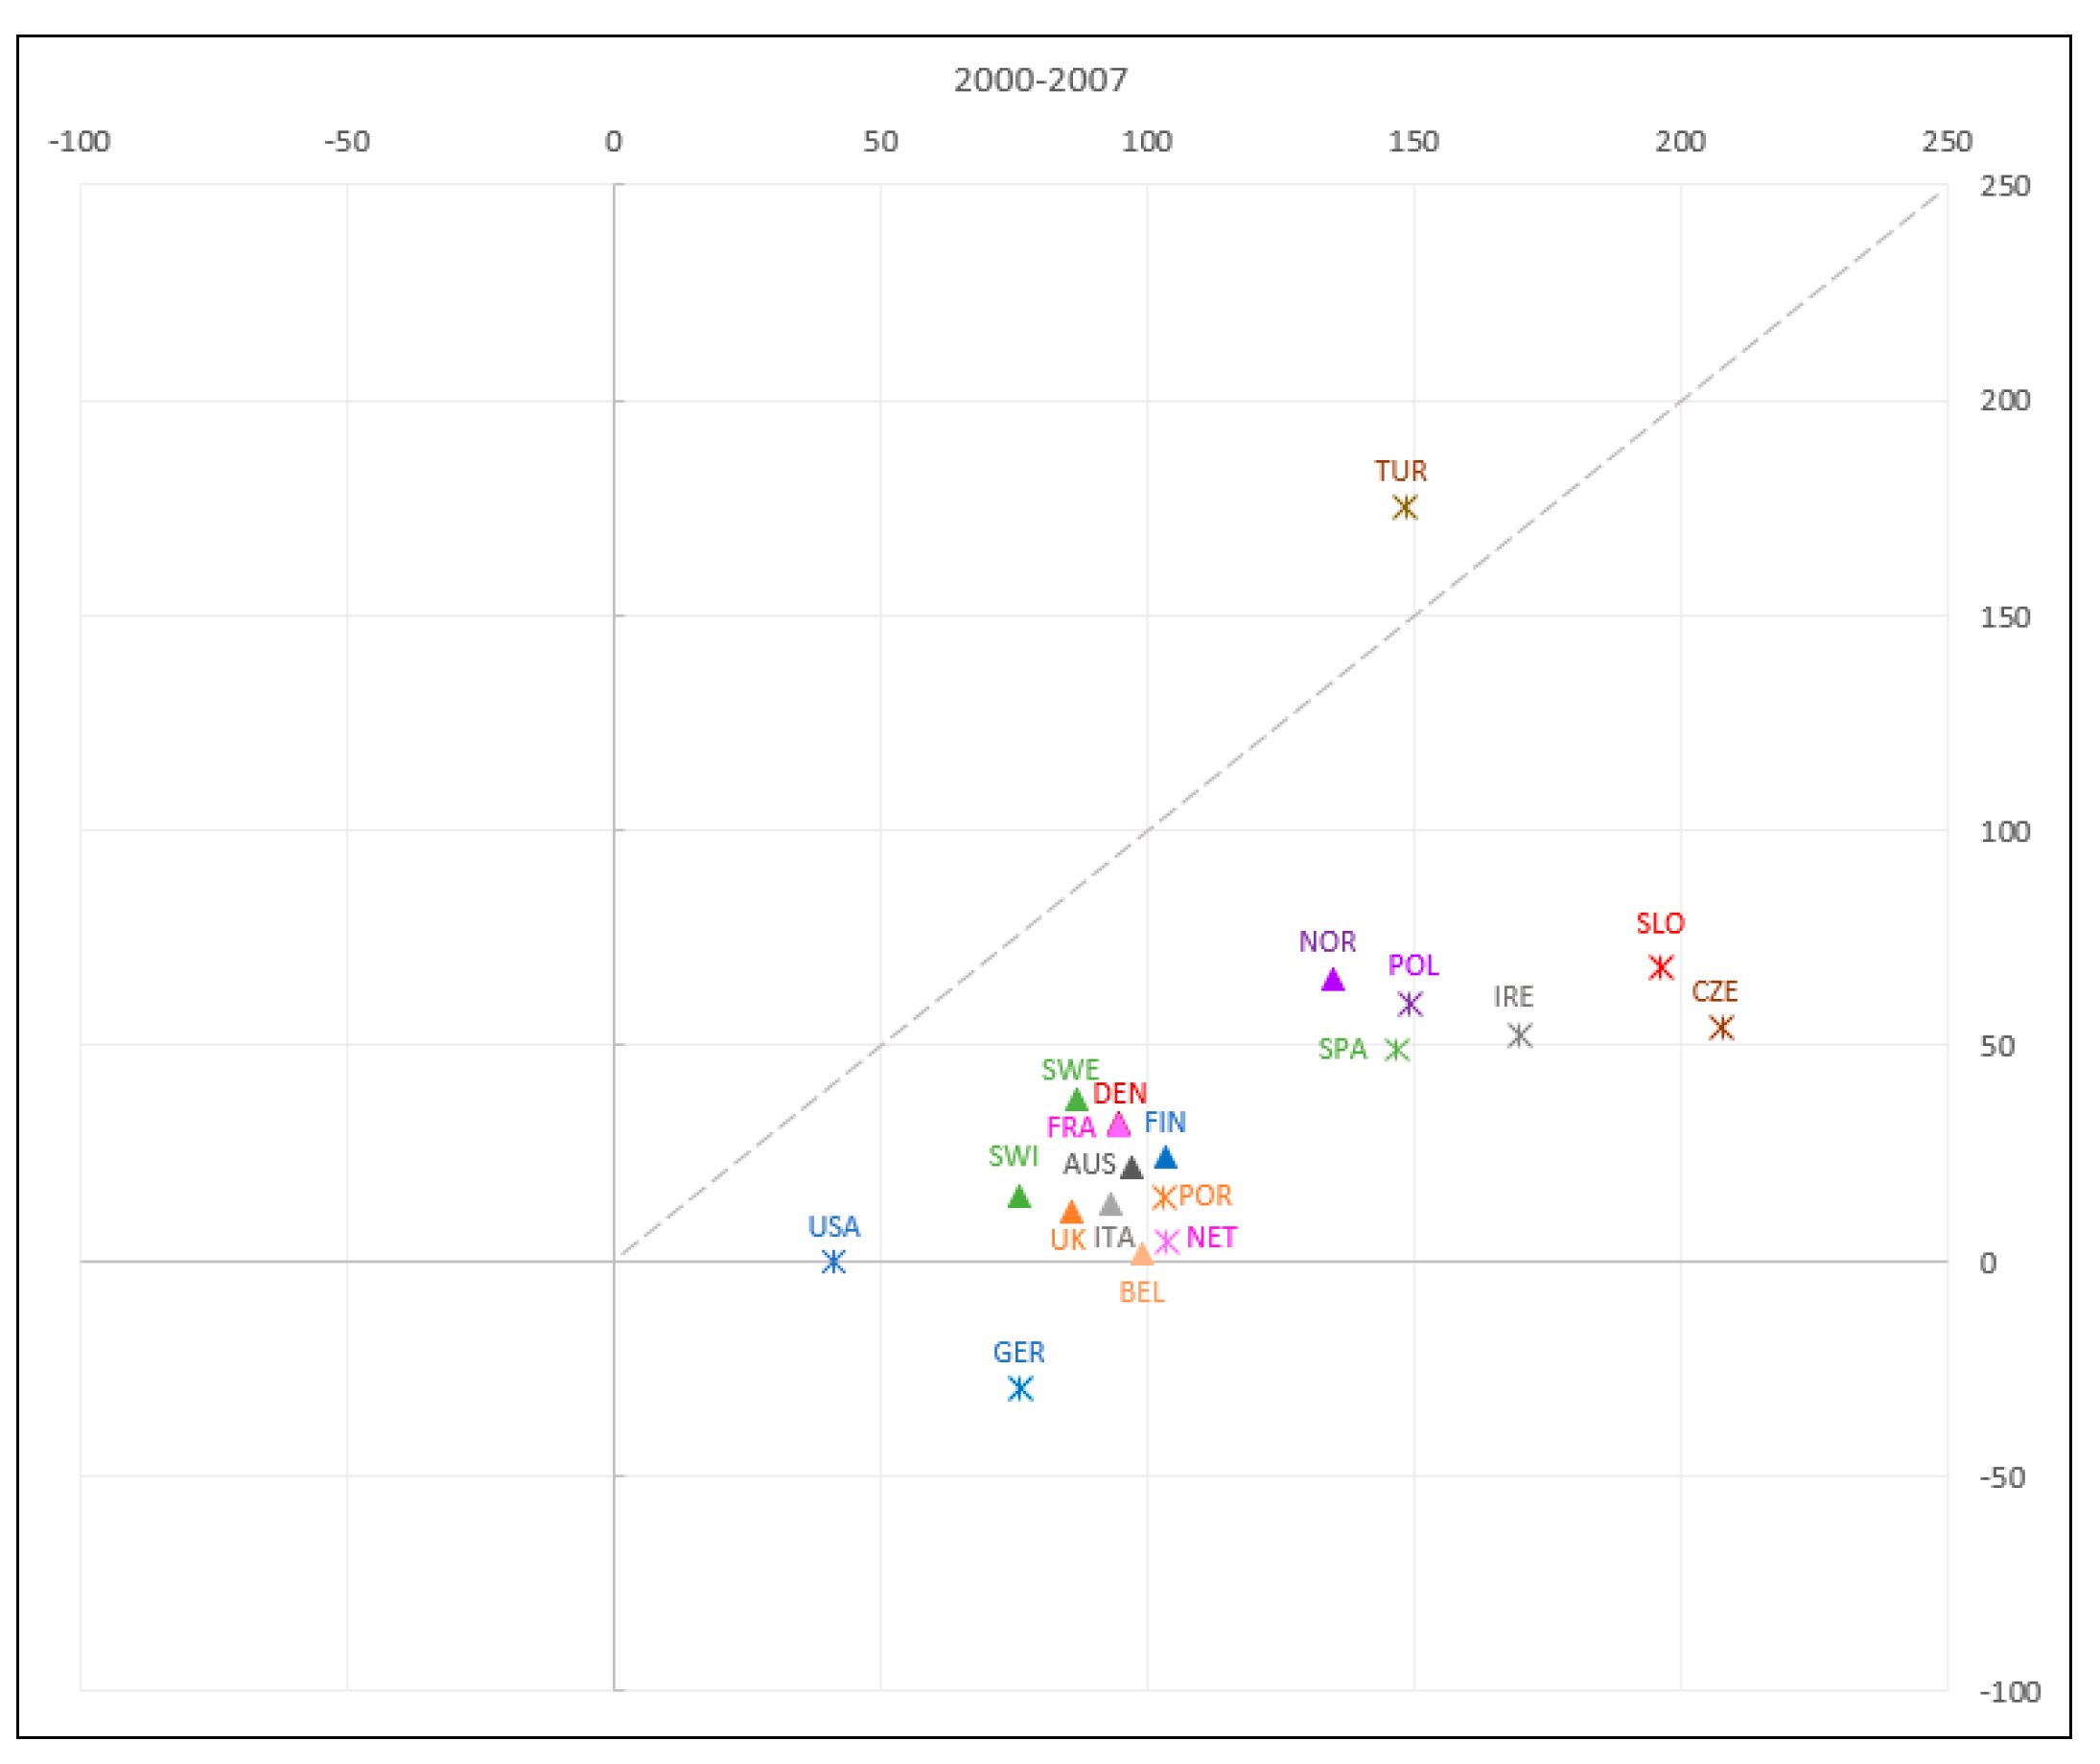
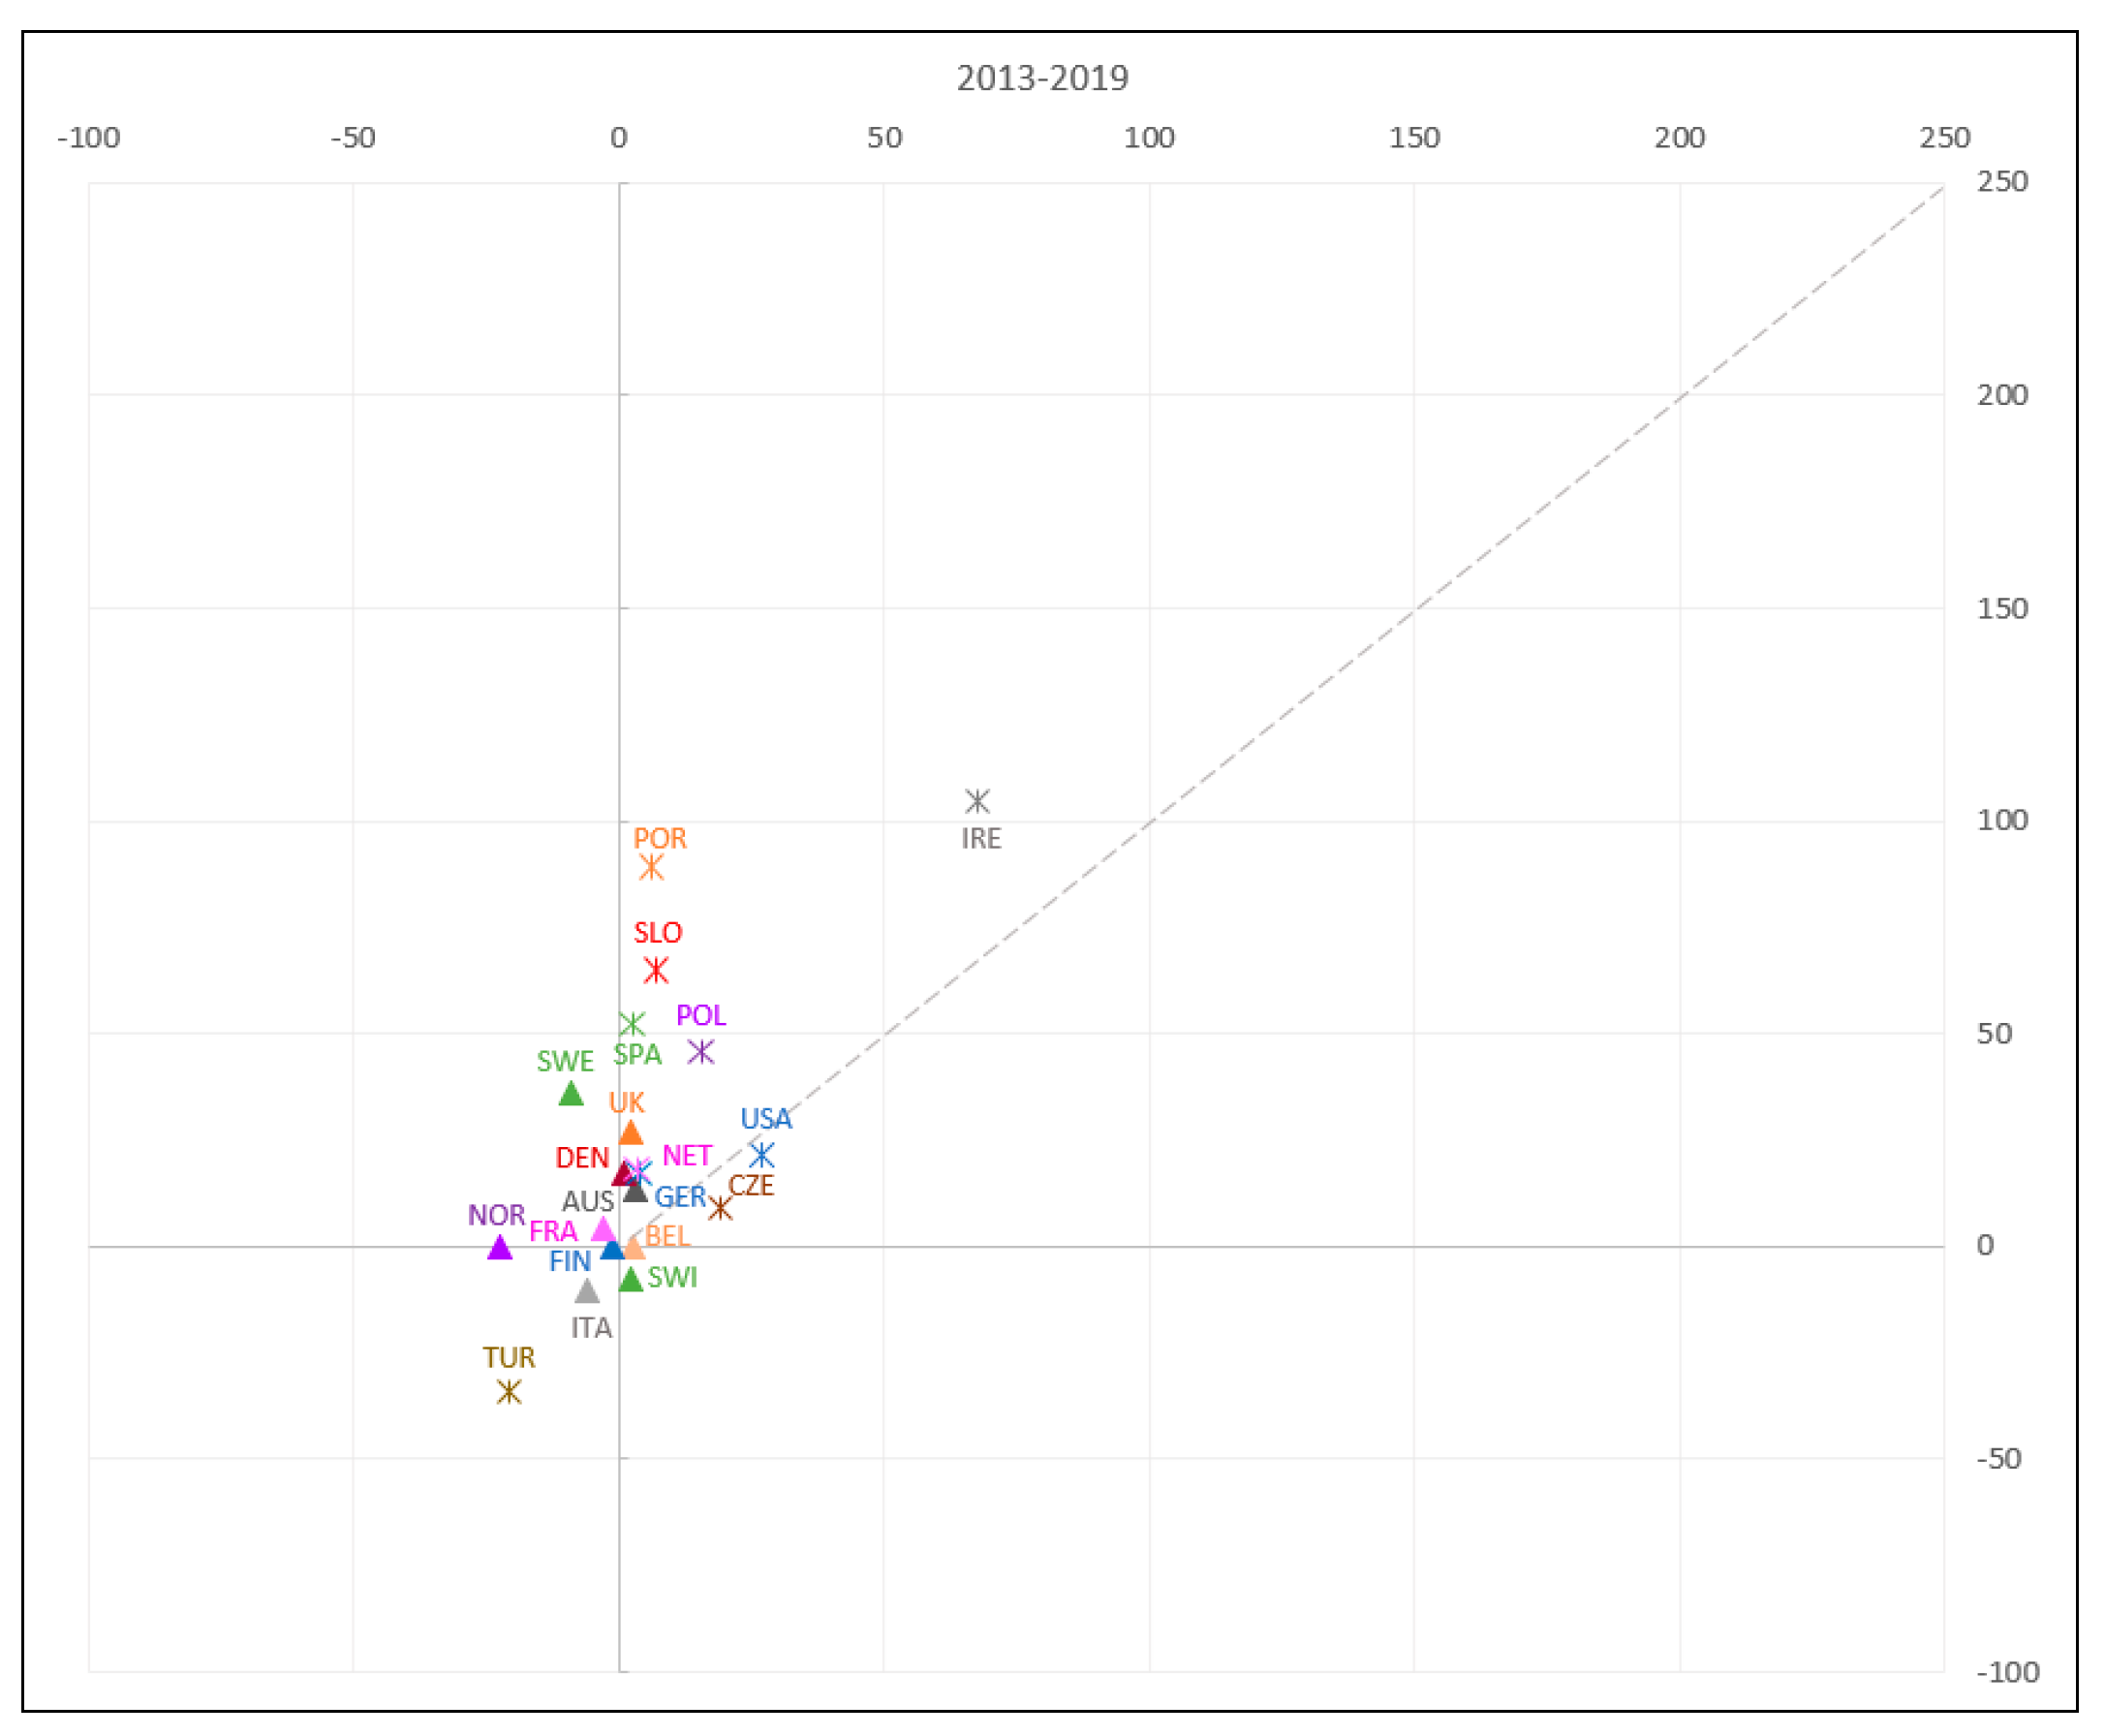
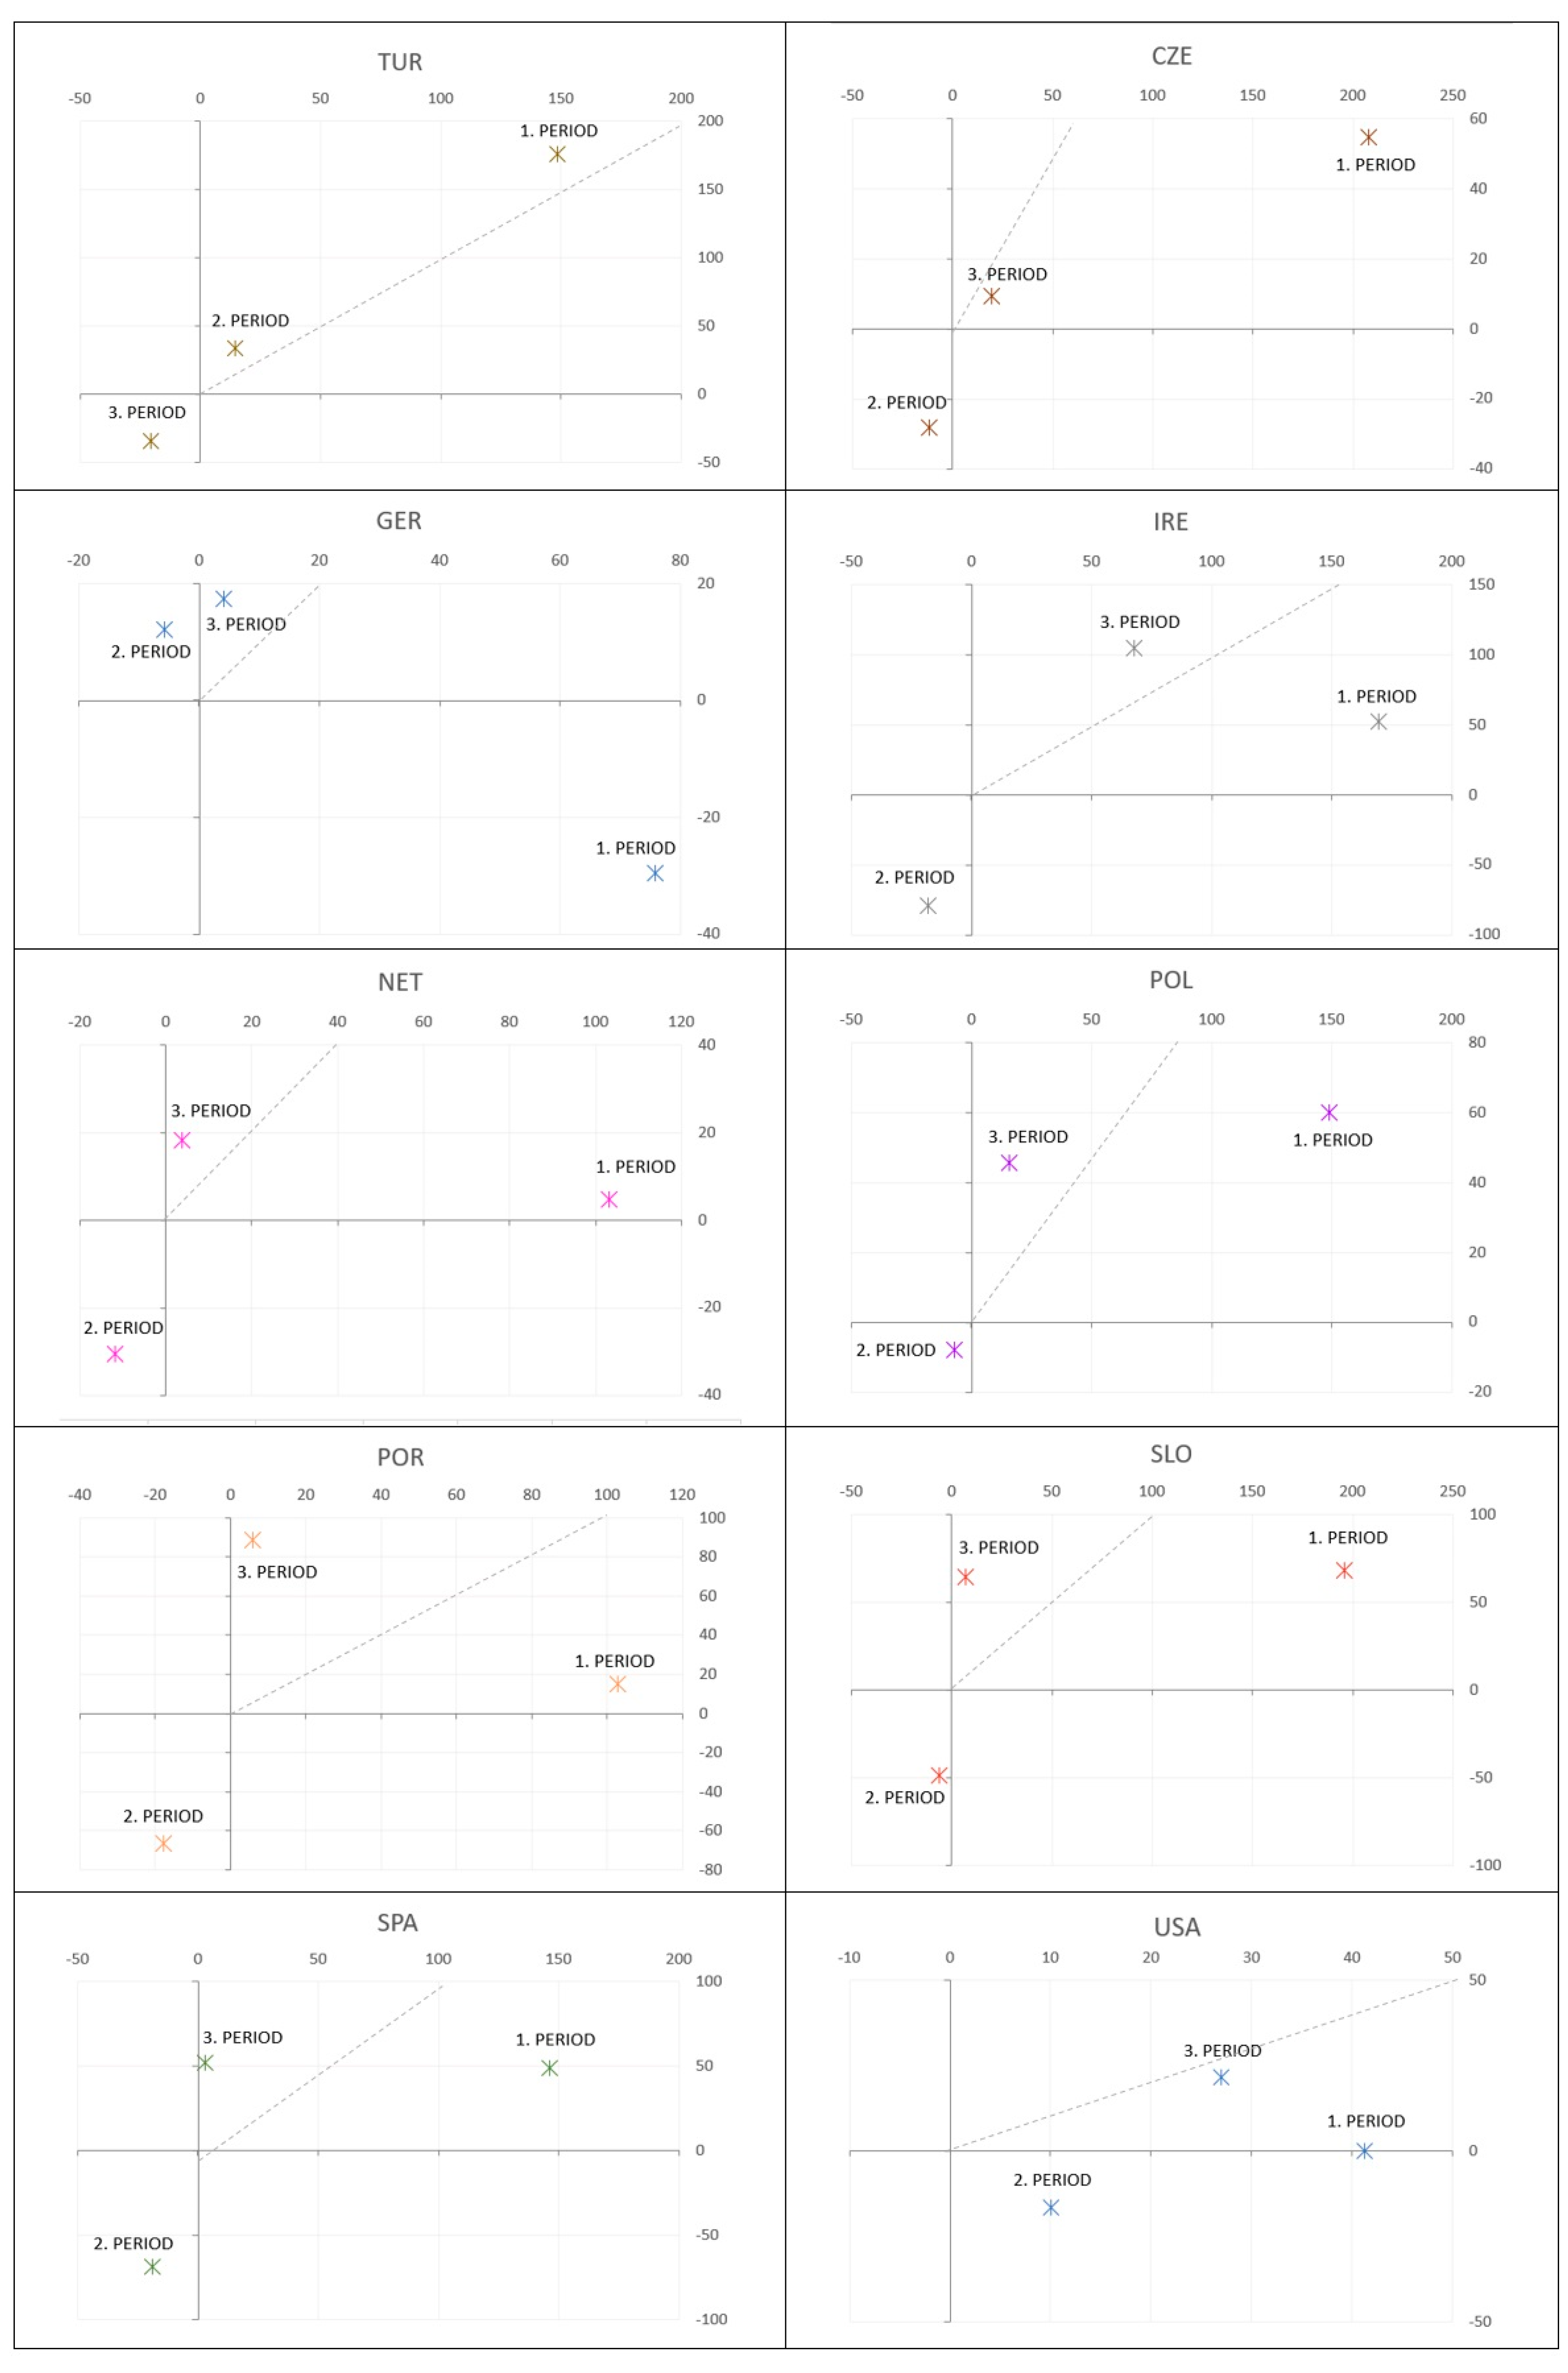
4. Data Analysis and Findings
5. Discussion
6. Conclusions
Funding
Data Availability Statement
Conflicts of Interest
Appendix A

| Country | 2000 | 2001 | 2002 | 2003 | 2004 | 2005 | 2006 | 2007 | 2008 | 2009 | 2010 | 2011 | 2012 | 2013 | 2014 | 2015 | 2016 | 2017 | 2018 | 2019 | Av. | |
|---|---|---|---|---|---|---|---|---|---|---|---|---|---|---|---|---|---|---|---|---|---|---|
| AUS | RMC | 9.30 | 7.30 | 9.60 | 10.00 | 9.90 | 11.00 | 11.00 | 11.30 | 11.50 | 10.30 | 10.20 | 10.50 | 10.60 | 10.50 | 10.00 | 10.50 | 10.80 | 11.00 | 11.80 | 11.90 | 10.45 |
| GDP | 197.29 | 197.51 | 214.39 | 262.27 | 301.46 | 316.09 | 336.28 | 389.19 | 432.05 | 401.76 | 392.28 | 431.69 | 409.40 | 430.19 | 442.58 | 381.97 | 395.84 | 417.26 | 454.99 | 444.60 | 362.45 | |
| P | 8.01 | 8.04 | 8.08 | 8.12 | 8.17 | 8.23 | 8.27 | 8.30 | 8.32 | 8.34 | 8.36 | 8.39 | 8.43 | 8.48 | 8.55 | 8.64 | 8.74 | 8.80 | 8.84 | 8.88 | 8.40 | |
| BEL | RMC | 11.80 | 10.90 | 9.90 | 10.80 | 11.20 | 11.00 | 12.20 | 12.00 | 11.80 | 10.40 | 10.80 | 11.60 | 12.50 | 13.00 | 12.30 | 12.30 | 12.50 | 12.70 | 12.80 | 13.00 | 11.78 |
| GDP | 236.79 | 236.75 | 258.38 | 318.08 | 369.21 | 385.71 | 408.26 | 470.92 | 517.33 | 483.25 | 481.42 | 523.33 | 496.15 | 521.79 | 535.39 | 462.34 | 476.06 | 502.76 | 543.30 | 535.87 | 438.16 | |
| P | 10.25 | 10.29 | 10.33 | 10.38 | 10.42 | 10.48 | 10.55 | 10.63 | 10.71 | 10.80 | 10.90 | 11.04 | 11.11 | 11.16 | 11.21 | 11.27 | 11.33 | 11.38 | 11.43 | 11.49 | 10.86 | |
| CZE | RMC | 5.50 | 5.50 | 5.50 | 6.00 | 6.40 | 7.40 | 8.00 | 8.50 | 9.60 | 7.30 | 6.40 | 7.50 | 6.90 | 6.50 | 6.50 | 6.50 | 6.80 | 6.80 | 7.10 | 7.10 | 6.89 |
| GDP | 61.83 | 67.81 | 82.20 | 100.09 | 119.81 | 137.14 | 156.26 | 190.18 | 236.82 | 207.43 | 209.07 | 229.56 | 208.86 | 211.69 | 209.36 | 188.03 | 196.27 | 218.63 | 249.00 | 252.55 | 176.63 | |
| P | 10.26 | 10.22 | 10.20 | 10.19 | 10.20 | 10.21 | 10.24 | 10.30 | 10.38 | 10.44 | 10.47 | 10.50 | 10.51 | 10.51 | 10.53 | 10.55 | 10.57 | 10.59 | 10.63 | 10.67 | 10.41 | |
| DEN | RMC | 2.20 | 2.10 | 2.30 | 2.20 | 2.30 | 2.60 | 2.80 | 2.90 | 2.70 | 1.80 | 1.70 | 2.10 | 2.00 | 2.30 | 2.30 | 2.50 | 2.50 | 2.60 | 2.60 | 2.70 | 2.36 |
| GDP | 164.16 | 164.79 | 178.64 | 218.10 | 251.37 | 264.47 | 282.88 | 319.42 | 353.36 | 321.24 | 322.00 | 344.00 | 327.15 | 343.58 | 352.99 | 302.67 | 313.12 | 332.12 | 356.84 | 346.50 | 292.97 | |
| P | 5.34 | 5.36 | 5.38 | 5.39 | 5.40 | 5.42 | 5.44 | 5.46 | 5.49 | 5.52 | 5.55 | 5.57 | 5.59 | 5.61 | 5.64 | 5.68 | 5.73 | 5.76 | 5.79 | 5.81 | 5.55 | |
| FIN | RMC | 2.50 | 2.60 | 2.60 | 2.30 | 2.40 | 2.50 | 2.70 | 3.10 | 2.80 | 2.00 | 2.60 | 3.00 | 2.70 | 2.70 | 2.60 | 2.60 | 2.90 | 3.00 | 2.80 | 2.70 | 2.66 |
| GDP | 126.02 | 129.53 | 140.40 | 171.65 | 197.48 | 204.89 | 217.09 | 256.38 | 285.72 | 253.50 | 249.42 | 275.60 | 258.29 | 271.36 | 274.86 | 234.53 | 240.77 | 255.65 | 275.71 | 268.51 | 229.37 | |
| P | 5.18 | 5.19 | 5.20 | 5.21 | 5.23 | 5.25 | 5.27 | 5.29 | 5.31 | 5.34 | 5.36 | 5.39 | 5.41 | 5.44 | 5.46 | 5.48 | 5.50 | 5.51 | 5.52 | 5.52 | 5.35 | |
| FRA | RMC | 34.30 | 34.50 | 34.60 | 34.80 | 37.50 | 40.50 | 43.40 | 45.00 | 44.20 | 37.00 | 37.40 | 41.30 | 38.90 | 38.60 | 36.40 | 34.80 | 36.10 | 38.60 | 39.70 | 40.30 | 38.40 |
| GDP | 1365.64 | 1377.66 | 1501.41 | 1844.54 | 2119.63 | 2196.95 | 2320.54 | 2660.59 | 2930.30 | 2700.89 | 2645.19 | 2865.16 | 2683.67 | 2811.88 | 2855.96 | 2439.19 | 2472.96 | 2595.15 | 2790.96 | 2728.87 | 2395.36 | |
| P | 60.92 | 61.37 | 61.82 | 62.26 | 62.72 | 63.19 | 63.63 | 64.02 | 64.38 | 64.71 | 65.03 | 65.35 | 65.66 | 66.00 | 66.31 | 66.55 | 66.72 | 66.92 | 67.16 | 67.39 | 64.60 | |
| GER | RMC | 57.90 | 51.10 | 46.90 | 47.20 | 44.20 | 18.00 | 24.00 | 40.80 | 41.00 | 37.70 | 42.00 | 48.00 | 46.00 | 45.60 | 46.80 | 46.00 | 49.50 | 52.00 | 52.70 | 53.50 | 44.55 |
| GDP | 1947.98 | 1945.79 | 2078.48 | 2501.64 | 2814.35 | 2846.86 | 2994.70 | 3425.58 | 3745.26 | 3411.26 | 3399.67 | 3749.31 | 3527.14 | 3733.80 | 3889.09 | 3357.59 | 3469.85 | 3690.85 | 3974.44 | 3889.18 | 3219.64 | |
| P | 82.21 | 82.35 | 82.49 | 82.53 | 82.52 | 82.47 | 82.38 | 82.27 | 82.11 | 81.90 | 81.78 | 80.27 | 80.43 | 80.65 | 80.98 | 81.69 | 82.35 | 82.66 | 82.91 | 83.09 | 82.00 | |
| IRE | RMC | 5.90 | 6.00 | 7.50 | 7.50 | 8.50 | 10.00 | 9.20 | 9.00 | 10.00 | 3.80 | 2.70 | 2.40 | 2.10 | 2.10 | 2.40 | 2.40 | 4.20 | 4.30 | 4.30 | 4.30 | 5.43 |
| GDP | 100.21 | 109.35 | 128.60 | 164.67 | 194.37 | 211.88 | 232.18 | 270.08 | 275.45 | 236.44 | 221.91 | 239.17 | 225.12 | 238.11 | 259.68 | 292.36 | 298.56 | 337.24 | 386.69 | 398.93 | 241.05 | |
| P | 3.81 | 3.87 | 3.93 | 4.00 | 4.07 | 4.16 | 4.27 | 4.40 | 4.49 | 4.54 | 4.56 | 4.58 | 4.60 | 4.62 | 4.66 | 4.70 | 4.76 | 4.81 | 4.87 | 4.93 | 4.43 | |
| ITA | RMC | 66.50 | 66.80 | 71.50 | 72.80 | 72.80 | 77.40 | 77.50 | 75.20 | 73.20 | 56.30 | 53.20 | 52.60 | 39.90 | 31.70 | 28.00 | 25.30 | 27.40 | 27.30 | 27.30 | 28.40 | 52.56 |
| GDP | 1146.68 | 1168.02 | 1276.77 | 1577.62 | 1806.54 | 1858.22 | 1949.55 | 2213.10 | 2408.66 | 2199.93 | 2136.10 | 2294.99 | 2086.96 | 2141.92 | 2162.01 | 1836.64 | 1877.07 | 1961.80 | 2091.93 | 2011.30 | 1910.29 | |
| P | 56.94 | 56.97 | 57.06 | 57.31 | 57.69 | 57.97 | 58.14 | 58.44 | 58.83 | 59.10 | 59.28 | 59.38 | 59.54 | 60.23 | 60.79 | 60.73 | 60.63 | 60.54 | 60.42 | 59.73 | 58.99 | |
| NET | RMC | 8.50 | 8.50 | 8.10 | 8.30 | 7.80 | 8.60 | 8.50 | 8.90 | 10.50 | 9.30 | 8.10 | 8.80 | 7.30 | 6.60 | 6.50 | 6.30 | 6.50 | 6.90 | 7.50 | 7.80 | 7.97 |
| GDP | 417.48 | 431.59 | 473.86 | 580.07 | 658.38 | 685.35 | 733.96 | 848.56 | 951.87 | 871.52 | 847.38 | 905.27 | 838.92 | 877.17 | 892.17 | 765.57 | 784.06 | 833.87 | 914.04 | 910.19 | 761.06 | |
| P | 15.93 | 16.05 | 16.15 | 16.23 | 16.28 | 16.32 | 16.35 | 16.38 | 16.45 | 16.53 | 16.62 | 16.69 | 16.75 | 16.80 | 16.87 | 16.94 | 17.03 | 17.13 | 17.23 | 17.34 | 16.60 | |
| POL | RMC | 10.00 | 9.00 | 8.70 | 8.90 | 10.50 | 11.00 | 14.20 | 16.00 | 21.20 | 17.70 | 18.60 | 23.70 | 19.50 | 18.00 | 19.20 | 19.80 | 20.40 | 20.40 | 25.10 | 26.20 | 16.91 |
| GDP | 172.22 | 190.91 | 199.07 | 217.83 | 255.11 | 306.15 | 344.63 | 429.02 | 533.60 | 439.73 | 475.70 | 524.37 | 495.23 | 515.76 | 539.08 | 477.11 | 470.02 | 524.64 | 588.78 | 596.06 | 414.75 | |
| P | 38.26 | 38.25 | 38.23 | 38.20 | 38.18 | 38.17 | 38.14 | 38.12 | 38.13 | 38.15 | 38.04 | 38.06 | 38.06 | 38.04 | 38.01 | 37.99 | 37.97 | 37.97 | 37.97 | 37.97 | 38.10 | |
| POR | RMC | 10.00 | 11.30 | 10.50 | 9.50 | 11.50 | 12.00 | 11.00 | 11.50 | 11.00 | 8.50 | 7.50 | 6.10 | 3.70 | 2.70 | 2.80 | 2.80 | 3.20 | 3.70 | 4.50 | 5.10 | 7.45 |
| GDP | 118.61 | 121.60 | 134.80 | 165.23 | 189.38 | 197.25 | 208.76 | 240.50 | 263.42 | 244.67 | 238.11 | 245.12 | 216.22 | 226.43 | 229.90 | 199.39 | 206.43 | 221.36 | 242.31 | 239.99 | 207.47 | |
| P | 10.29 | 10.36 | 10.42 | 10.46 | 10.48 | 10.50 | 10.52 | 10.54 | 10.56 | 10.57 | 10.57 | 10.56 | 10.51 | 10.46 | 10.40 | 10.36 | 10.33 | 10.30 | 10.28 | 10.29 | 10.44 | |
| SLO | RMC | 1.90 | 1.90 | 1.90 | 2.10 | 2.40 | 2.70 | 2.90 | 3.20 | 3.70 | 2.60 | 2.40 | 2.30 | 1.90 | 1.70 | 1.60 | 1.90 | 1.90 | 2.40 | 3.00 | 2.80 | 2.36 |
| GDP | 29.24 | 30.78 | 35.30 | 46.92 | 57.44 | 62.81 | 70.77 | 86.56 | 100.88 | 89.40 | 91.16 | 99.92 | 94.62 | 98.94 | 101.44 | 88.90 | 89.95 | 95.65 | 106.14 | 105.71 | 79.13 | |
| P | 5.39 | 5.38 | 5.38 | 5.37 | 5.37 | 5.37 | 5.37 | 5.37 | 5.38 | 5.39 | 5.39 | 5.40 | 5.41 | 5.41 | 5.42 | 5.42 | 5.43 | 5.44 | 5.45 | 5.45 | 5.40 | |
| SPA | RMC | 64.00 | 71.10 | 73.50 | 81.00 | 82.00 | 87.60 | 97.80 | 95.30 | 69.00 | 49.00 | 39.10 | 30.80 | 21.60 | 16.30 | 15.90 | 16.30 | 16.30 | 19.70 | 22.20 | 24.80 | 49.67 |
| GDP | 598.36 | 627.83 | 708.76 | 907.49 | 1069.06 | 1153.72 | 1260.40 | 1474.00 | 1631.86 | 1491.47 | 1422.11 | 1480.71 | 1324.75 | 1355.58 | 1371.82 | 1196.16 | 1233.55 | 1313.25 | 1421.70 | 1394.32 | 1221.85 | |
| P | 40.57 | 40.85 | 41.43 | 42.19 | 42.92 | 43.65 | 44.40 | 45.23 | 45.95 | 46.36 | 46.58 | 46.74 | 46.77 | 46.62 | 46.48 | 46.44 | 46.48 | 46.59 | 46.80 | 47.13 | 45.01 | |
| SWE | RMC | 2.40 | 2.60 | 2.40 | 2.40 | 2.50 | 2.70 | 3.00 | 3.30 | 3.50 | 2.80 | 3.30 | 3.30 | 3.30 | 3.30 | 3.30 | 3.30 | 4.50 | 4.50 | 4.50 | 4.50 | 3.27 |
| GDP | 262.84 | 242.40 | 266.85 | 334.34 | 385.12 | 392.22 | 423.09 | 491.25 | 517.71 | 436.54 | 495.81 | 574.09 | 552.48 | 586.84 | 581.96 | 505.10 | 515.65 | 541.02 | 555.46 | 533.88 | 459.73 | |
| P | 8.87 | 8.90 | 8.92 | 8.96 | 8.99 | 9.03 | 9.08 | 9.15 | 9.22 | 9.30 | 9.38 | 9.45 | 9.52 | 9.60 | 9.70 | 9.80 | 9.92 | 10.06 | 10.18 | 10.28 | 9.41 | |
| UK | RMC | 23.00 | 23.00 | 23.00 | 25.00 | 25.00 | 25.20 | 25.10 | 25.60 | 20.50 | 15.80 | 15.70 | 19.20 | 17.60 | 19.60 | 22.70 | 23.70 | 24.60 | 22.90 | 25.70 | 24.90 | 22.39 |
| GDP | 1665.53 | 1649.83 | 1785.73 | 2054.42 | 2421.53 | 2543.18 | 2708.44 | 3090.51 | 2929.41 | 2412.84 | 2485.48 | 2663.81 | 2707.09 | 2784.85 | 3064.71 | 2927.91 | 2689.11 | 2680.15 | 2871.34 | 2851.41 | 2549.36 | |
| P | 58.89 | 59.12 | 59.37 | 59.65 | 59.99 | 60.40 | 60.85 | 61.32 | 61.81 | 62.28 | 62.77 | 63.26 | 63.70 | 64.13 | 64.60 | 65.12 | 65.61 | 66.06 | 66.46 | 66.84 | 62.61 | |
| NOR | RMC | 2.30 | 2.20 | 2.20 | 2.30 | 2.70 | 3.10 | 3.20 | 3.80 | 3.70 | 2.90 | 3.00 | 3.50 | 3.70 | 3.80 | 3.80 | 3.70 | 4.00 | 4.10 | 4.10 | 3.80 | 3.30 |
| GDP | 171.46 | 174.24 | 195.91 | 229.39 | 265.27 | 309.98 | 346.92 | 402.64 | 464.92 | 387.98 | 431.05 | 501.36 | 512.78 | 526.01 | 501.74 | 388.16 | 370.96 | 401.75 | 439.79 | 408.74 | 371.55 | |
| P | 4.49 | 4.51 | 4.54 | 4.56 | 4.59 | 4.62 | 4.66 | 4.71 | 4.77 | 4.83 | 4.89 | 4.95 | 5.02 | 5.08 | 5.14 | 5.19 | 5.23 | 5.28 | 5.31 | 5.35 | 4.89 | |
| SWI | RMC | 10.50 | 10.90 | 10.00 | 9.30 | 9.80 | 11.10 | 12.10 | 12.10 | 12.10 | 12.10 | 12.10 | 12.50 | 13.00 | 12.00 | 12.00 | 12.00 | 11.50 | 11.50 | 10.90 | 11.10 | 11.43 |
| GDP | 279.22 | 286.58 | 309.30 | 362.08 | 403.91 | 418.28 | 441.63 | 490.74 | 567.27 | 554.21 | 598.85 | 715.89 | 686.42 | 706.23 | 726.54 | 694.12 | 687.90 | 695.20 | 725.57 | 721.37 | 553.57 | |
| P | 7.18 | 7.23 | 7.28 | 7.34 | 7.39 | 7.44 | 7.48 | 7.55 | 7.65 | 7.74 | 7.82 | 7.91 | 8.00 | 8.09 | 8.19 | 8.28 | 8.37 | 8.45 | 8.51 | 8.58 | 7.83 | |
| TUR | RMC | 27.00 | 25.40 | 26.80 | 28.20 | 37.10 | 46.30 | 70.70 | 74.40 | 69.60 | 66.40 | 79.70 | 90.00 | 93.00 | 102.00 | 107.00 | 107.00 | 109.00 | 115.00 | 100.00 | 67.00 | 72.08 |
| GDP | 274.29 | 201.75 | 240.25 | 314.60 | 408.87 | 506.31 | 557.08 | 681.32 | 770.45 | 649.29 | 776.97 | 838.79 | 880.56 | 957.80 | 938.93 | 864.31 | 869.68 | 858.99 | 778.97 | 761.01 | 656.51 | |
| P | 64.11 | 65.07 | 65.99 | 66.87 | 67.79 | 68.70 | 69.60 | 70.16 | 71.05 | 72.04 | 73.14 | 74.22 | 75.18 | 76.15 | 77.18 | 78.22 | 79.28 | 80.31 | 81.41 | 82.58 | 72.95 | |
| USA | RMC | 315.00 | 315.00 | 300.00 | 310.00 | 330.00 | 345.00 | 330.00 | 315.00 | 270.00 | 243.00 | 243.00 | 203.00 | 225.00 | 230.00 | 230.00 | 260.00 | 65.00 | 270.00 | 274.00 | 280.00 | 267.65 |
| GDP | 10,250.9 | 10,581.9 | 10,929.1 | 11,456.4 | 12,217.1 | 13,039.2 | 13,815.6 | 14,474.2 | 14,769.9 | 14,478.1 | 15,048.9 | 15,599.7 | 16,253.9 | 16,843.2 | 17,550.7 | 18,206.0 | 18,695.1 | 19,477.3 | 20,533.1 | 21,380.9 | 15,280.1 | |
| P | 282.16 | 284.97 | 287.63 | 290.11 | 292.81 | 295.52 | 298.38 | 301.23 | 304.09 | 306.77 | 309.33 | 311.58 | 313.88 | 316.06 | 318.39 | 320.74 | 323.07 | 325.12 | 326.84 | 328.33 | 306.85 |
Appendix B
| Country | 2000 | 2001 | 2002 | 2003 | 2004 | 2005 | 2006 | 2007 | 2008 | 2009 | 2010 | 2011 | 2012 | 2013 | 2014 | 2015 | 2016 | 2017 | 2018 | 2019 | Av. | |
|---|---|---|---|---|---|---|---|---|---|---|---|---|---|---|---|---|---|---|---|---|---|---|
| AUS | CCO2 | 2.80 | 2.20 | 2.89 | 3.01 | 2.98 | 3.31 | 3.31 | 3.40 | 3.46 | 3.10 | 3.07 | 3.16 | 3.19 | 3.16 | 3.01 | 3.16 | 3.25 | 3.31 | 3.55 | 3.58 | 3.15 |
| CCO2 per capita | 0.35 | 0.27 | 0.36 | 0.37 | 0.36 | 0.40 | 0.40 | 0.41 | 0.42 | 0.37 | 0.37 | 0.38 | 0.38 | 0.37 | 0.35 | 0.37 | 0.37 | 0.38 | 0.40 | 0.40 | 0.37 | |
| BEL | CCO2 | 3.55 | 3.28 | 2.98 | 3.25 | 3.37 | 3.31 | 3.68 | 3.61 | 3.55 | 3.13 | 3.25 | 3.49 | 3.77 | 3.92 | 3.71 | 3.71 | 3.77 | 3.83 | 3.86 | 3.92 | 3.55 |
| CCO2 per capita | 0.35 | 0.32 | 0.29 | 0.31 | 0.32 | 0.32 | 0.35 | 0.34 | 0.33 | 0.29 | 0.30 | 0.32 | 0.34 | 0.35 | 0.33 | 0.33 | 0.33 | 0.34 | 0.34 | 0.34 | 0.33 | |
| CZE | CCO2 | 1.66 | 1.66 | 1.66 | 1.81 | 1.93 | 2.23 | 2.41 | 2.56 | 2.89 | 2.20 | 1.93 | 2.26 | 2.08 | 1.96 | 1.96 | 1.96 | 2.05 | 2.05 | 2.14 | 2.14 | 2.08 |
| CCO2 per capita | 0.16 | 0.16 | 0.16 | 0.18 | 0.19 | 0.22 | 0.24 | 0.25 | 0.28 | 0.21 | 0.18 | 0.22 | 0.20 | 0.19 | 0.19 | 0.19 | 0.19 | 0.19 | 0.20 | 0.20 | 0.20 | |
| DEN | CCO2 | 0.66 | 0.63 | 0.69 | 0.66 | 0.69 | 0.78 | 0.84 | 0.87 | 0.81 | 0.54 | 0.51 | 0.63 | 0.60 | 0.69 | 0.69 | 0.75 | 0.75 | 0.78 | 0.78 | 0.81 | 0.71 |
| CCO2 per capita | 0.12 | 0.12 | 0.13 | 0.12 | 0.13 | 0.14 | 0.16 | 0.16 | 0.15 | 0.10 | 0.09 | 0.11 | 0.11 | 0.12 | 0.12 | 0.13 | 0.13 | 0.14 | 0.14 | 0.14 | 0.13 | |
| FIN | CCO2 | 0.75 | 0.78 | 0.78 | 0.69 | 0.72 | 0.75 | 0.81 | 0.93 | 0.84 | 0.60 | 0.78 | 0.90 | 0.81 | 0.81 | 0.78 | 0.78 | 0.87 | 0.90 | 0.84 | 0.81 | 0.80 |
| CCO2 per capita | 0.15 | 0.15 | 0.15 | 0.13 | 0.14 | 0.14 | 0.15 | 0.18 | 0.16 | 0.11 | 0.15 | 0.17 | 0.15 | 0.15 | 0.14 | 0.14 | 0.16 | 0.16 | 0.15 | 0.15 | 0.15 | |
| FRA | CCO2 | 10.33 | 10.39 | 10.42 | 10.48 | 11.30 | 12.20 | 13.07 | 13.56 | 13.31 | 11.15 | 11.27 | 12.44 | 11.72 | 11.63 | 10.96 | 10.48 | 10.87 | 11.63 | 11.96 | 12.14 | 11.57 |
| CCO2 per capita | 0.17 | 0.17 | 0.17 | 0.17 | 0.18 | 0.19 | 0.21 | 0.21 | 0.21 | 0.17 | 0.17 | 0.19 | 0.18 | 0.18 | 0.17 | 0.16 | 0.16 | 0.17 | 0.18 | 0.18 | 0.18 | |
| GER | CCO2 | 17.44 | 15.39 | 14.13 | 14.22 | 13.31 | 5.42 | 7.23 | 12.29 | 12.35 | 11.36 | 12.65 | 14.46 | 13.86 | 13.74 | 14.10 | 13.86 | 14.91 | 15.66 | 15.87 | 16.12 | 13.42 |
| CCO2 per capita | 0.21 | 0.19 | 0.17 | 0.17 | 0.16 | 0.07 | 0.09 | 0.15 | 0.15 | 0.14 | 0.15 | 0.18 | 0.17 | 0.17 | 0.17 | 0.17 | 0.18 | 0.19 | 0.19 | 0.19 | 0.16 | |
| IRE | CCO2 | 1.78 | 1.81 | 2.26 | 2.26 | 2.56 | 3.01 | 2.77 | 2.71 | 3.01 | 1.14 | 0.81 | 0.72 | 0.63 | 0.63 | 0.72 | 0.72 | 1.27 | 1.30 | 1.30 | 1.30 | 1.64 |
| CCO2 per capita | 0.47 | 0.47 | 0.57 | 0.57 | 0.63 | 0.72 | 0.65 | 0.62 | 0.67 | 0.25 | 0.18 | 0.16 | 0.14 | 0.14 | 0.16 | 0.15 | 0.27 | 0.27 | 0.27 | 0.26 | 0.38 | |
| ITA | CCO2 | 20.03 | 20.12 | 21.54 | 21.93 | 21.93 | 23.32 | 23.35 | 22.65 | 22.05 | 16.96 | 16.03 | 15.84 | 12.02 | 9.55 | 8.43 | 7.62 | 8.25 | 8.22 | 8.22 | 8.55 | 15.83 |
| CCO2 per capita | 0.35 | 0.35 | 0.38 | 0.38 | 0.38 | 0.40 | 0.40 | 0.39 | 0.37 | 0.29 | 0.27 | 0.27 | 0.20 | 0.16 | 0.14 | 0.13 | 0.14 | 0.14 | 0.14 | 0.14 | 0.27 | |
| NET | CCO2 | 2.56 | 2.56 | 2.44 | 2.50 | 2.35 | 2.59 | 2.56 | 2.68 | 3.16 | 2.80 | 2.44 | 2.65 | 2.20 | 1.99 | 1.96 | 1.90 | 1.96 | 2.08 | 2.26 | 2.35 | 2.40 |
| CCO2 per capita | 0.16 | 0.16 | 0.15 | 0.15 | 0.14 | 0.16 | 0.16 | 0.16 | 0.19 | 0.17 | 0.15 | 0.16 | 0.13 | 0.12 | 0.12 | 0.11 | 0.11 | 0.12 | 0.13 | 0.14 | 0.14 | |
| POL | CCO2 | 3.01 | 2.71 | 2.62 | 2.68 | 3.16 | 3.31 | 4.28 | 4.82 | 6.39 | 5.33 | 5.60 | 7.14 | 5.87 | 5.42 | 5.78 | 5.96 | 6.15 | 6.15 | 7.56 | 7.89 | 5.09 |
| CCO2 per capita | 0.08 | 0.07 | 0.07 | 0.07 | 0.08 | 0.09 | 0.11 | 0.13 | 0.17 | 0.14 | 0.15 | 0.19 | 0.15 | 0.14 | 0.15 | 0.16 | 0.16 | 0.16 | 0.20 | 0.21 | 0.13 | |
| POR | CCO2 | 3.01 | 3.40 | 3.16 | 2.86 | 3.46 | 3.61 | 3.31 | 3.46 | 3.31 | 2.56 | 2.26 | 1.84 | 1.11 | 0.81 | 0.84 | 0.84 | 0.96 | 1.11 | 1.36 | 1.54 | 2.24 |
| CCO2 per capita | 0.29 | 0.33 | 0.30 | 0.27 | 0.33 | 0.34 | 0.31 | 0.33 | 0.31 | 0.24 | 0.21 | 0.17 | 0.11 | 0.08 | 0.08 | 0.08 | 0.09 | 0.11 | 0.13 | 0.15 | 0.21 | |
| SLO | CCO2 | 0.57 | 0.57 | 0.57 | 0.63 | 0.72 | 0.81 | 0.87 | 0.96 | 1.11 | 0.78 | 0.72 | 0.69 | 0.57 | 0.51 | 0.48 | 0.57 | 0.57 | 0.72 | 0.90 | 0.84 | 0.71 |
| CCO2 per capita | 0.11 | 0.11 | 0.11 | 0.12 | 0.13 | 0.15 | 0.16 | 0.18 | 0.21 | 0.15 | 0.13 | 0.13 | 0.11 | 0.09 | 0.09 | 0.11 | 0.11 | 0.13 | 0.17 | 0.15 | 0.13 | |
| SPA | CCO2 | 19.28 | 21.42 | 22.14 | 24.40 | 24.70 | 26.39 | 29.46 | 28.71 | 20.78 | 14.76 | 11.78 | 9.28 | 6.51 | 4.91 | 4.79 | 4.91 | 4.91 | 5.93 | 6.69 | 7.47 | 14.96 |
| CCO2 per capita | 0.48 | 0.52 | 0.53 | 0.58 | 0.58 | 0.60 | 0.66 | 0.63 | 0.45 | 0.32 | 0.25 | 0.20 | 0.14 | 0.11 | 0.10 | 0.11 | 0.11 | 0.13 | 0.14 | 0.16 | 0.34 | |
| SWE | CCO2 | 0.72 | 0.78 | 0.72 | 0.72 | 0.75 | 0.81 | 0.90 | 0.99 | 1.05 | 0.84 | 0.99 | 0.99 | 0.99 | 0.99 | 0.99 | 0.99 | 1.36 | 1.36 | 1.36 | 1.36 | 0.99 |
| CCO2 per capita | 0.08 | 0.09 | 0.08 | 0.08 | 0.08 | 0.09 | 0.10 | 0.11 | 0.11 | 0.09 | 0.11 | 0.11 | 0.10 | 0.10 | 0.10 | 0.10 | 0.14 | 0.13 | 0.13 | 0.13 | 0.10 | |
| UK | CCO2 | 6.93 | 6.93 | 6.93 | 7.53 | 7.53 | 7.59 | 7.56 | 7.71 | 6.18 | 4.76 | 4.73 | 5.78 | 5.30 | 5.90 | 6.84 | 7.14 | 7.41 | 6.90 | 7.74 | 7.50 | 6.74 |
| CCO2 per capita | 0.12 | 0.12 | 0.12 | 0.13 | 0.13 | 0.13 | 0.12 | 0.13 | 0.10 | 0.08 | 0.08 | 0.09 | 0.08 | 0.09 | 0.11 | 0.11 | 0.11 | 0.10 | 0.12 | 0.11 | 0.11 | |
| NOR | CCO2 | 0.69 | 0.66 | 0.66 | 0.69 | 0.81 | 0.93 | 0.96 | 1.14 | 1.11 | 0.87 | 0.90 | 1.05 | 1.11 | 1.14 | 1.14 | 1.11 | 1.20 | 1.24 | 1.24 | 1.14 | 0.99 |
| CCO2 per capita | 0.15 | 0.15 | 0.15 | 0.15 | 0.18 | 0.20 | 0.21 | 0.24 | 0.23 | 0.18 | 0.18 | 0.21 | 0.22 | 0.23 | 0.22 | 0.21 | 0.23 | 0.23 | 0.23 | 0.21 | 0.20 | |
| SWI | CCO2 | 3.16 | 3.28 | 3.01 | 2.80 | 2.95 | 3.34 | 3.64 | 3.64 | 3.64 | 3.64 | 3.64 | 3.77 | 3.92 | 3.61 | 3.61 | 3.61 | 3.46 | 3.46 | 3.28 | 3.34 | 3.44 |
| CCO2 per capita | 0.44 | 0.45 | 0.41 | 0.38 | 0.40 | 0.45 | 0.49 | 0.48 | 0.48 | 0.47 | 0.47 | 0.48 | 0.49 | 0.45 | 0.44 | 0.44 | 0.41 | 0.41 | 0.39 | 0.39 | 0.44 | |
| TUR | CCO2 | 8.13 | 7.65 | 8.07 | 8.49 | 11.18 | 13.95 | 21.30 | 22.41 | 20.97 | 20.00 | 24.01 | 27.11 | 28.01 | 30.73 | 32.23 | 32.23 | 32.83 | 34.64 | 30.12 | 20.18 | 21.71 |
| CCO2 per capita | 0.13 | 0.12 | 0.12 | 0.13 | 0.16 | 0.20 | 0.31 | 0.32 | 0.30 | 0.28 | 0.33 | 0.37 | 0.37 | 0.40 | 0.42 | 0.41 | 0.41 | 0.43 | 0.37 | 0.24 | 0.29 | |
| USA | CCO2 | 94.89 | 94.89 | 90.37 | 93.38 | 99.41 | 103.92 | 94.89 | 94.89 | 81.33 | 73.20 | 73.20 | 61.15 | 67.78 | 69.28 | 69.28 | 78.32 | 19.58 | 81.33 | 82.54 | 84.34 | 80.40 |
| CCO2 per capita | 0.34 | 0.33 | 0.31 | 0.32 | 0.34 | 0.35 | 0.33 | 0.31 | 0.27 | 0.24 | 0.24 | 0.20 | 0.22 | 0.22 | 0.22 | 0.24 | 0.06 | 0.25 | 0.25 | 0.26 | 0.27 |
References
- IPCC, Intergovernmental Panel on Climate Change. Climate Change 2007, The Physical Science Basis; Cambridge University Press: New York, NY, USA, 2007. [Google Scholar]
- Yalcin, A.Z. The importance of low carbon economy for sustainable development and an evaluation for Turkey. BAU SBED 2010, 13, 186–203. [Google Scholar]
- IPCC, Intergovernmental Panel on Climate Change. Climate Change 2013, The Physical Science Basis; Cambridge University Press: New York, NY, USA, 2013. [Google Scholar]
- Karakaya, E. Kuresel Isınma ve Kyoto Protokolu Iklim Degisikliginin Bilimsel; Ekonomik ve politik analizi; Baglam Yayınları: Ankara, Turkey, 2008. [Google Scholar]
- Dam, M.M.; Karakaya, E.; Bulut, S. Environmental Kuznets Curve and Turkey: An Ampirical Analysis. Dumlupinar Univ. Sos. Bilim. Derg. 2013, 85–96. [Google Scholar]
- IMF, Internatiol Monetary Fund. The Economics of Climate; IMF: Washington, DC, USA, 2019. [Google Scholar]
- Favier, A.; De Wolf, C.; Scrivener, K.; Habert, G.A. Sustainable Future for the European Cement and Concrete Industry-Technology Assessment for Full Decarbonisation of the Industry by 2050; ETH Zurich: Zürich, Switzerland, 2018. [Google Scholar]
- Stern, N. The Economics of Climate Change; Cambridge University Press: London, UK, 2006. [Google Scholar]
- PMI Project Management Institute, Global Megatrends 2022. Available online: https://www.pmi.org/learning/thought-leadership/megatrends/2022/climate-crisis (accessed on 8 May 2024).
- IPCC, Intergovernmental Panel on Climate Change. Climate Change 2007, Mitigation of Climate Change-Technical Summary; Cambridge University Press: New York, NY, USA, 2022. [Google Scholar]
- Yıldız, N. Klinker uretimi. Madencilik Ve Yerbilim. Derg. 2015, 48, 88–91. Available online: https://madencilikturkiye.com/madencilik-turkiye-dergisinin-48-sayisi-cikti/ (accessed on 8 May 2024).
- Orhon, A.V.; Altin, M. Beton yapıların karbon ayak izi. In Proceedings of the National Conference on Sustainable Building Design, Bornova, Turkey, 12–13 November 2012; pp. 12–13. [Google Scholar]
- Li, N.; Mo, L.; Unluer, C. Emerging CO2 utilization technologies for construction materials: A review. J. CO2 Util. 2022, 65, 102237. [Google Scholar] [CrossRef]
- Orhon, A.V. Tasarımdan Yapıma, Sürdürülebilir Beton Yaklaşımları, 2nd Project and Construction Management Congress; Izmir Institute of Technology: Urla-İzmir, Turkey, 2012. [Google Scholar]
- THBB, Turkish Ready Mixed Concrete Association. 2023. Available online: https://www.thbb.org/sektor/hazir-beton-sektor-raporu/ (accessed on 6 November 2023).
- ERMCO. European Ready Mixed Concrete Organization. 2022. Available online: https://ermco.eu/statistics-previous-years/ (accessed on 6 November 2023).
- Palomoa, A.; Grutzeck, M.W.; Blancoa, M.T. Alkali-activated fly ashes: A cement for the future. Cem. Concr. Res. 1999, 29, 1323–1329. [Google Scholar] [CrossRef]
- WEF, World Economic Forum. Scaling Low-Carbon Design and Construction with Concrete: Enabling the Path to Net-Zero for Buildings and Infrastructure; WEF: Geneva, Switzerland, 2023. [Google Scholar]
- GCCA, Global Cement and Concrete Association. Concrete Future–Roadmap to Net Zero; GCCA: London, UK, 2021. [Google Scholar]
- Jackson, T. Prosperity without Growth? The Transition to a Sustainable Economy; Sustainable Development Commission: London, UK, 2005. [Google Scholar]
- McMullen, C. Firms push sustainability. Waste News. 2001, 7, 1–3. [Google Scholar]
- Presley, A.; Meade, L.; Sarkis, J. A strategic sustainability justification methodology for organizational decisions: A reverse logistics illustration. Int. J. Prod. Res. 2007, 45, 18–19. [Google Scholar] [CrossRef]
- Pope, J.; Annandale, D.; Morrison-Saunders, A. Conceptualising sustainability assessment. Environ. Impact Assess. Rev. 2004, 24, 595–616. [Google Scholar] [CrossRef]
- Wilkins, H, The need for subjectivity in EIA: Discourse as a tool for sustainable development. Environ. Impact Assess. Rev. 2003, 23, 401–414. [CrossRef]
- Martens, M.L.; Carvalho, M.M. Key factors of sustainability in project management context: A survey exploring the project managers’ perspective. Int. J. Proj. Manag. 2017, 35, 1084–1102. [Google Scholar] [CrossRef]
- Vadén, T.; Lähde, V.; Majava, A.; Järvensivu, P.; Toivanen, T.; Hakala, E.; Eronen, J.T. Decoupling for ecological sustainability: A categorisation and review of research literature. Environ. Sci. Policy 2020, 112, 236–244. [Google Scholar] [CrossRef]
- Tapio, P. Towards a theory of decoupling: Degrees of decoupling in the EU and the case of road traffic in Finland between 1970 and 2001. Transp. Policy 2005, 12, 137–151. [Google Scholar] [CrossRef]
- Gupta, S. Decoupling: A step toward sustainable development with reference to OECD countries. Int. J. Sustain. Dev. World Ecol. 2015, 22, 510–519. [Google Scholar] [CrossRef]
- Cautisanu, C.; Hatmanu, M. A study of the decoupling of economic growth from CO2 and HFCs Emissions in the EU27 Countries. Energies 2023, 16, 5546. [Google Scholar] [CrossRef]
- OECD, Organisation for Economic Co-Operation and Development. Indicators to Measure Decoupling of Environmental Pressure from Economic Growth. 2002. Available online: https://www.oecd.org/env/indicators-modelling outlooks/1933638.pdf (accessed on 26 March 2023).
- Jackson, T. Prosperity without Growth: Economics for a Finite Planet; Earthscan: London, UK, 2009. [Google Scholar]
- Ucal, M.; An, N.; Kurnaz, L. New Terms and approaches in economy in the process of climate change. New Terms Approaches Econ. Process Clim. Change 2017, 19, 373–402. [Google Scholar]
- UNFCCC, United Nations Framework Convention on Climate Change. What Is the Kyoto Protocol? 2024. Available online: https://unfccc.int/kyoto_protocol (accessed on 22 March 2024).
- Ekins, P.; Summerton, P.; Thoung, C.; Daniel, L. A major environmental tax reform for the UK: Results for the economy, employment and the environment. Environ. Resour. Econ. 2011, 50, 447–474. [Google Scholar] [CrossRef]
- KPMG. Future State 2030: The Global Megatrends Shaping Governments; KPMG International Cooperative: Amstelveen, The Netherlands, 2014. [Google Scholar]
- Destek, M.A.; Ulucak, R.; Dogan, E. Analyzing the environmental Kuznets curve for the EU countries: The role of ecological footprint. Environ. Sci. Pollut. Res. 2018, 25, 29387–29396. [Google Scholar] [CrossRef]
- Lazar, D.; Minea, A.; Purcel, A.A. Pollution and economic growth: Evidence from central and eastern European countries. Energy Econ. 2019, 81, 1121–1131. [Google Scholar] [CrossRef]
- Kotroni, E.; Kaika, D.; Zervas, E. Environmental Kuznets Curve in Greece in the period 1960–2014. Int. J. Energy Econ. Policy 2020, 10, 364–370. [Google Scholar] [CrossRef]
- Ketenci, N. Environmental Kuznets curve in the presence of structural breaks: New evidence for individual European Countries. Environ. Sci. Pollut. Res. 2021, 28, 31520–31538. [Google Scholar] [CrossRef]
- Hatmanu, M.; Cautisanu, C.; Iacobuta, A.O. On the relationships between CO2 emissions and their determinants in Romania and Bulgaria. ARDL Approach Appl. Econ. 2021, 54, 2582–2595. [Google Scholar] [CrossRef]
- Hatmanu, M.; Cautisanu, C. The impact of COVID-19 pandemic on stock market: Evidence from Romania. Int. J. Environ. Res. Public Health 2022, 18, 9315. [Google Scholar] [CrossRef] [PubMed]
- Freire, F.D.S.; da Silva, N.O.; de Oliveira, V.R.F. Economic growth and greenhouse gases in Brazilian States: Is the environmental Kuznets curve applicable hypothesis? Environ. Sci. Pollut. Res. 2023, 30, 44928–44942. [Google Scholar] [CrossRef] [PubMed]
- Boa, Z.; Lu, W. Applicability of the environmental Kuznets curve to construction waste management: A panel analysis of 27 European economies. Resour. Conserv. Recycl. 2023, 188, 106667. [Google Scholar] [CrossRef]
- Naqvi, A.; Zwickl, K. Fifty shades of green: Revisiting decoupling by economic sectors and air pollutants. Ecol. Econ. 2017, 133, 111–126. [Google Scholar] [CrossRef]
- World Bank, 2023. Available online: https://databank.worldbank.org/reports (accessed on 6 November 2023).
- Dakwale, V.A.; Ralegaonka, R.V. Review of carbon emission through buildings: Threats. causes and solution. Int. J. Low-Carbon Technol. 2012, 7, 143–148. [Google Scholar] [CrossRef]
- Nematchoua, M.K.; Asadi, S.; Reiter, S. Estimation analysis and comparison of carbon emissions and construction cost of the two tallest buildings located in United States and China. Int. J. Environ. Sci. Technol. 2020, 19, 9313–9328. [Google Scholar] [CrossRef]
- Gustavsson, L.; Pingoud, K.; Sathre, R. Carbon dioxide balance of wood substitution: Comparing concrete-and wood-framed buildings. Mitig. Adapt. Strat. Glob. Change 2006, 11, 667–691. [Google Scholar] [CrossRef]
- Ardente, F.; Beccali, M.; Cellura, M.; Mistretta, M. Building energy performance: A LCA case study of kenaf fibres insulation board. Energy Build. 2008, 40, 1–10. [Google Scholar] [CrossRef]
- Upton, B.; Miner, R.; Spinney, M.; Heath, L.S. The greenhouse gas and energy impacts of using wood instead of alternatives in residential construction in the United States. Bio Bioenergy 2008, 32, 1–10. [Google Scholar] [CrossRef]
- Reddy, B.V.V. Sustainable materials for low carbon buildings. Int. J. Low Carbon Technol. 2009, 4, 175–181. [Google Scholar] [CrossRef]
- Salazar, J.; Meil, J. Prospects for carbon-neutral housing: The influence of greater wood use on the carbon footprint of a single-family residence. J. Clean Prod. 2009, 17, 1563–1571. [Google Scholar] [CrossRef]
- Norman, J.; MacLean, H.L.; Kennedy, C.A. Comparing high and low residential density: Lifecycle analysis of energy use and greenhouse gas emissions. J. Urban Plan. Dev. 2006, 132, 10–21. [Google Scholar] [CrossRef]
- Boardman, B. Examining the carbon agenda via the 40% house scenario. Build. Res. Inf. 2007, 35, 363–378. [Google Scholar] [CrossRef]
- Hugo, J.; Barker, A.; Stoffberg, H. The carbon footprint and embodied energy of construction material: A comparative analysis of South African BRT stations. Acta Structilia 2014, 21, 45–78. [Google Scholar]
- Reddy, B.V.V.; Prasanna, K.P. Embodied energy in cement stabilised rammed earth walls. J. Energy Build. 2010, 42, 380–385. [Google Scholar] [CrossRef]
- Gartner, E. Industrially interesting approaches to ‘low-CO2’ cements. J. Cem. Concr. Res. 2004, 34, 1489–1498. [Google Scholar] [CrossRef]
- Chen, G.Q.; Chen, H.; Chen, Z.M.; Zhang, B.; Shao, L.; Guo, S.; Zhou, S.Y.; Jiang, M.M. Low carbon building assessment and multiscale input-output analysis. J. Commun. Nonlinear Sci. Numer. Simul. 2011, 19, 583–595. [Google Scholar] [CrossRef]
- Su, M.S.; Deng, J.; Zhao, C.R. Interaction of renewable energy policy and CO2 emission control policy: Case study. J. Energy Eng. 2008, 63, 63–70. [Google Scholar] [CrossRef]
- Wang, J. Calculation and Analysis of Life Cycle CO2 Emissions of Chinese Urban Residential Communities; Tsinghua University: Beijing, China, 2009. (In Chinese) [Google Scholar]
- Nematchoua, M.K.; Orosa, J.A.; Reiter, S. Life cycle assessment of two sustainable and old neighborhoods affected by climate change in one city in Belgium: A review. Environ. Imp. Assess. Rev. 2019, 78, 106282. [Google Scholar] [CrossRef]
- Zhang, X.; Heeren, N.; Bauer, C.; Burgherr, P.; McKenna, R.; Habert, G. The impacts of future sectoral change on the greenhouse gas emissions of construction materials for Swiss residential buildings. Energy Build. 2024, 303, 113824. [Google Scholar] [CrossRef]
- Griffiths, S.; Sovacool, B.K.; Furszyfer Del Rio, D.D.; Foley, A.M.; Bazilian, M.D.; Kim, J.; Uratani, J.M. Decarbonizing the cement and concrete industry: A systematic review of socio-technical systems, technological innovations, and policy options. Renew. Sustain. Energy Rev. 2023, 180, 113291. [Google Scholar] [CrossRef]
- Nehdi, M.L.; Marani, A.; Zhang, L. Is net-zero feasible: Systematic review of cement and concrete decarbonization technologies. Renew. Sustain. Energy Rev. 2024, 191, 114169. [Google Scholar] [CrossRef]
- Su, Y.; Zou, Z.; Ma, X.; Ji, J. Understanding the relationships between the development of the construction sector, carbon emissions, and economic growth in China: Supply-chain level analysis based on the structural production layer difference approach. Sustain. Prod. Consum. 2022, 29, 730–743. [Google Scholar] [CrossRef]
- Wang, Z.; Hu, T.; Liu, J. Decoupling economic growth from construction waste generation: Comparative analysis between the EU and China. J. Environ. Manag. 2024, 353, 120144. [Google Scholar] [CrossRef]
- Du, Q.; Zhou, J.; Pan, T.; Sun, Q.; Wu, M. Relationship of carbon emissions and economic growth in China’s construction industry. J. Clean. Prod. 2019, 220, 99–109. [Google Scholar] [CrossRef]
- Li, L.; Li, Y. The Spatial Relationship between CO2 emissions and economic growth in the construction industry: Based on the Tapio decoupling model and STIRPAT model. Sustainability 2023, 15, 10528. [Google Scholar] [CrossRef]
- Wu, Y.; Chau, K.W.; Lu, W.; Shen, L.; Shuai, C.; Chen, J. Decoupling relationship between economic output and carbon emission in the Chinese construction industry. Environ. Impact Assess. Rev. 2018, 71, 60–69. [Google Scholar] [CrossRef]
- Eurostat. 2023. Available online: https://ec.europa.eu/eurostat/databrowser/view/sdg_08_10/default/table?lang=en (accessed on 6 November 2023).
- Mergos, P.E. Seismic design of reinforced concrete frames for minimum embodied CO2 emissions. Energy Build. 2018, 162, 77–186. [Google Scholar] [CrossRef]
- Nielsen, C.V. Carbon footprint of concrete buildings seen in the life cycle perspective. In Proceedings of the NRMCA, Denver, CO, USA, 20–22 May 2008; pp. 1–14. [Google Scholar]
- Ji, C.; Hong, T.; Park, H.S. Comparative analysis of decision-making methods for integrating cost and CO2 emission–focus on building structural design. Energy Build. 2014, 72, 186–194. [Google Scholar] [CrossRef]
- de Medeiros, G.F.; Kripka, M. Optimization of reinforced concrete columns according to different environmental impact assessment parameters. Eng. Struct. 2014, 59, 185–194. [Google Scholar] [CrossRef]
- Yeo, D.H.; Potra, F.A. Sustainable design of reinforced concrete structures through CO2 emission optimization. J. Struct. Eng. 2015, 141, B4014002. [Google Scholar] [CrossRef]
- Bodur, S.; Kupeli, M.; Alp, I. Decoupling analysis of environmental pressures from economic growth in the EU-27 and Turkey. Sigma J. Eng. Nat. Sci. 2009, 39, 29–38. [Google Scholar]
- Yamak, Y.; Koçak, S.; Samut, S. Türkiye’de inşaat sektörünün kisa ve uzun dönem dinamikleri. J. Econ. Manag. Res. 2018, 7, 96–113. [Google Scholar]
- Vrijders, J.; De Bock, L. Het Gebruik van Gerecycleerde Betongranulaten in Beton. Buildwise, 3 July 2019. [Google Scholar]
- Hubert, J.; Michel, F.; Courard, L. Sand Resources in North West Europe. (WPT1-Activity 1). 2024. Available online: https://orbi.uliege.be/handle/2268/320465 (accessed on 10 July 2024).
- WHO Director-General’s Opening Remarks at the Media Briefing—5 May 2023. Available online: https://www.who.int/director-general/speeches/detail/who-director-general-s-opening-remarks-at-the-media-briefing---5-may-2023 (accessed on 10 July 2024).


| Literature | CO2 Emission Factor | Strength | ||
|---|---|---|---|---|
| Mergos [71] | 228.0 | kgCO2/m3 | 25 | MPa |
| 264.0 | kgCO2/m3 | 32 | MPa | |
| Nielsen [72] | 387.0 | kgCO2/m3 | 35 | MPa |
| Ji et al. [73] | 236.8 | kgCO2/m3 | 24 | MPa |
| 285.7 | kgCO2/m3 | 30 | MPa | |
| 340.0 | kgCO2/m3 | 40 | MPa | |
| de Medeiro and Kripka [74] | 224.0 | kgCO2/m3 | 25 | MPa |
| 265.0 | kgCO2/m3 | 35 | MPa | |
| 255.0 | kgCO2/m3 | 20 | MPa | |
| Yeo and Potra [75] | 376.0 | kgCO2/m3 | 30 | MPa |
| 452.0 | kgCO2/m3 | 40 | MPa | |
| Country | Av. CCO2 (Million Ton) | Per Capita Av. CCO2 (Tons per Capita) | ||||
|---|---|---|---|---|---|---|
| 1. Period | 2. Period | 3. Period | 1. Period | 2. Period | 3. Period | |
| Austria (AUS) | 2.99 | 3.20 | 3.29 | 0.37 | 0.38 | 0.38 |
| Belgium (BEL) | 3.38 | 3.44 | 3.81 | 0.32 | 0.32 | 0.34 |
| Czechia (CZE) | 1.99 | 2.27 | 2.04 | 0.19 | 0.22 | 0.19 |
| Denmark (DEN) | 0.73 | 0.62 | 0.75 | 0.14 | 0.11 | 0.13 |
| Finland (FIN) | 0.78 | 0.79 | 0.83 | 0.15 | 0.15 | 0.15 |
| France (FRA) | 11.47 | 11.98 | 11.38 | 0.18 | 0.18 | 0.17 |
| Germany (GER) | 12.43 | 12.93 | 14.89 | 0.15 | 0.16 | 0.18 |
| Ireland (IRE) | 2.39 | 1.27 | 1.03 | 0.59 | 0.28 | 0.22 |
| Italy (ITA) | 21.86 | 16.58 | 8.41 | 0.38 | 0.28 | 0.14 |
| Netherlands (NET) | 2.53 | 2.65 | 2.07 | 0.16 | 0.16 | 0.12 |
| Poland (POL) | 3.32 | 6.07 | 6.42 | 0.09 | 0.16 | 0.17 |
| Portugal (POR) | 3.29 | 2.22 | 1.07 | 0.31 | 0.21 | 0.10 |
| Slovakia (SLO) | 0.72 | 0.78 | 0.66 | 0.13 | 0.14 | 0.12 |
| Spain (SPA) | 24.56 | 12.62 | 5.66 | 0.57 | 0.27 | 0.12 |
| Sweden (SWE) | 0.80 | 0.98 | 1.20 | 0.09 | 0.10 | 0.12 |
| United Kingdom (UK) | 7.34 | 5.35 | 7.06 | 0.12 | 0.09 | 0.11 |
| Norway (NOR) | 0.82 | 1.01 | 1.17 | 0.18 | 0.21 | 0.22 |
| Switzerland (SWI) | 3.23 | 3.72 | 3.49 | 0.44 | 0.48 | 0.42 |
| Turkey (TUR) | 12.65 | 24.02 | 30.42 | 0.19 | 0.33 | 0.38 |
| United States of America (USA) | 96.39 | 71.33 | 69.24 | 0.33 | 0.23 | 0.21 |
| Average | 10.68 | 9.19 | 8.74 | 0.25 | 0.22 | 0.20 |
| 1. Period | 2. Period | 3. Period | ||||
|---|---|---|---|---|---|---|
| ΔGDP | ΔCCO2 | ΔGDP | ΔCCO2 | ΔGDP | ΔCCO2 | |
| AUS | 97.27 | 21.51 | −5.24 | −7.83 | 3.35 | 13.33 |
| BEL | 98.88 | 1.69 | −4.09 | 5.93 | 2.70 | 0.00 |
| CZE | 207.60 | 54.55 | −11.81 | −28.13 | 19.30 | 9.23 |
| DEN | 94.58 | 31.82 | −7.42 | −25.93 | 0.85 | 17.39 |
| FIN | 103.44 | 24.00 | −9.60 | −3.57 | −1.05 | 0.00 |
| FRA | 94.82 | 31.20 | −8.42 | −11.99 | −2.95 | 4.40 |
| GER | 75.85 | −29.53 | −5.82 | 12.20 | 4.16 | 17.32 |
| IRE | 169.52 | 52.54 | −18.27 | −79.00 | 67.54 | 104.76 |
| ITA | 93.00 | 13.08 | −13.36 | −45.49 | −6.10 | −10.41 |
| NET | 103.26 | 4.71 | −11.87 | −30.48 | 3.76 | 18.18 |
| POL | 149.11 | 60.00 | −7.19 | −8.02 | 15.57 | 45.56 |
| POR | 102.77 | 15.00 | −17.92 | −66.36 | 5.99 | 88.89 |
| SLO | 196.02 | 68.42 | −6.20 | −48.65 | 6.85 | 64.71 |
| SPA | 146.34 | 48.91 | −18.82 | −68.70 | 2.86 | 52.15 |
| SWE | 86.90 | 37.50 | 6.72 | −5.71 | −9.02 | 36.36 |
| UK | 85.56 | 11.30 | −7.59 | −14.15 | 2.39 | 27.04 |
| NOR | 134.84 | 65.22 | 10.29 | 0.00 | −22.29 | 0.00 |
| SWI | 75.76 | 15.24 | 21.00 | 7.44 | 2.14 | −7.50 |
| TUR | 148.39 | 175.56 | 14.29 | 33.62 | −20.55 | −34.31 |
| USA | 41.20 | 0.00 | 10.05 | −16.66 | 26.94 | 21.73 |
 | 1a | Coupling | GDP > 0 Air Emission > 0 GDP < Air Emission | Positive Growth |
| 1b | Relative Decoupling | GDP > 0 Air Emission > 0 GDP > Air Emission | ||
| 2 | Absolute Decoupling | GDP > 0 Air Emission < 0 | ||
| 3 | Negative Coupling | GDP < 0 Air Emission < 0 | Negative Growth | |
| 4 | Negative Decoupling | GDP < 0 Air Emission > 0 |
Disclaimer/Publisher’s Note: The statements, opinions and data contained in all publications are solely those of the individual author(s) and contributor(s) and not of MDPI and/or the editor(s). MDPI and/or the editor(s) disclaim responsibility for any injury to people or property resulting from any ideas, methods, instructions or products referred to in the content. |
© 2024 by the author. Licensee MDPI, Basel, Switzerland. This article is an open access article distributed under the terms and conditions of the Creative Commons Attribution (CC BY) license (https://creativecommons.org/licenses/by/4.0/).
Share and Cite
Dobrucali, E. Relationship between CO2 Emissions from Concrete Production and Economic Growth in 20 OECD Countries. Buildings 2024, 14, 2709. https://doi.org/10.3390/buildings14092709
Dobrucali E. Relationship between CO2 Emissions from Concrete Production and Economic Growth in 20 OECD Countries. Buildings. 2024; 14(9):2709. https://doi.org/10.3390/buildings14092709
Chicago/Turabian StyleDobrucali, Esra. 2024. "Relationship between CO2 Emissions from Concrete Production and Economic Growth in 20 OECD Countries" Buildings 14, no. 9: 2709. https://doi.org/10.3390/buildings14092709
APA StyleDobrucali, E. (2024). Relationship between CO2 Emissions from Concrete Production and Economic Growth in 20 OECD Countries. Buildings, 14(9), 2709. https://doi.org/10.3390/buildings14092709