Article

Evaluation of Machine Learning and Traditional Methods for Estimating Compressive Strength of UHPC

1
School of Civil Engineering, Changsha University of Science & Technology, Changsha 410000, Hunan, China
2
Qionghai Construction Engineering Quality and Safety Supervision Station, Qionghai 571442, Hainan, China
3
China Construction Fifth Engineering Division Corp., Ltd., Changsha 410000, China
4
Department of Civil Engineering, College of Engineering, University of Hafr Al Batin, Hafr Al Batin 39524, Saudi Arabia
5
Department of Civil Engineering, Jubail Industrial College, Royal Commission of Jubail, Jubail Industrial City 31961, Saudi Arabia
6
Department of Electrical Engineering, College of Engineering, University of Hafr Al Batin, Hafr Al Batin 39524, Saudi Arabia
7
School of Civil Engineering, Southeast University, Nanjing 210096, Jiangsu, China
*
Authors to whom correspondence should be addressed.
Buildings 2024, 14(9), 2693; https://doi.org/10.3390/buildings14092693
Submission received: 19 July 2024 / Revised: 16 August 2024 / Accepted: 21 August 2024 / Published: 28 August 2024
(This article belongs to the Section Building Materials, and Repair & Renovation)

Abstract

This research provides a comparative analysis of the optimization of ultra-high-performance concrete (UHPC) using artificial neural network (ANN) and response surface methodology (RSM). By using ANN and RSM, the yield of UHPC was modeled and optimized as a function of 22 independent variables, including cement content, cement compressive strength, cement type, cement strength class, fly-ash, slag, silica-fume, nano-silica, limestone powder, sand, coarse aggregates, maximum aggregate size, quartz powder, water, super-plasticizers, polystyrene fiber, polystyrene fiber diameter, polystyrene fiber length, steel fiber content, steel fiber diameter, steel fiber length, and curing time. Two statistical parameters were examined based on their modeling, i.e., determination coefficient (R2) and mean square error (MSE). ANN and RSM were evaluated for their predictive and generalization capabilities using a different dataset from previously published research. Results show that RSM is computationally efficient and easy to interpret, whereas ANN is more accurate at predicting UHPC characteristics due to its nonlinear interactions. Results show that the ANN model (R = 0.95 and R2 = 0.91) and RSM model (R = 0.94, and R2 = 0.90) can predict UHPC compressive strength. The prediction error for optimal yield using an ANN and RSM was 3.5% and 7%, respectively. According to the ANN model’s sensitivity analysis, cement and water have a significant impact on compressive strength.

1. Introduction

UHPC materials have an ultra-low water/binder ratio (0.15–0.25), dense microstructure, high cement (800–1200 kg/m3), SCMs, fine sand, steel fibers, and superplasticizer contents [1,2]. UHPC has good flowability (mini-slump flow ≥ 160 mm) and high mechanical properties (28-day compressive strength ≥ 120 MPa) due to its low water-to-binder ratio (w/b, 0.15–0.25), high particle packing density (0.825–0.855), high steel fiber volume (≥2%, by volume), and proper chemical admixtures [2]. UHPC performance has opened up new potential for infrastructure, building construction, and specialty sectors with more applications in recent years. Commercialization of UHPC in different regions of the world has garnered global attention [3]. UHPC is ideal for complex modern constructions like long-span bridges [4,5] slab structures [6], thin-shell structures [7], nuclear power containments [8], maritime engineering [9] etc, due to its excellent performance. However, measures concerning the perfect method to predict the properties of UHPC should be proposed and implemented in many projects.
Neural network-based algorithms have been used to forecast concrete characteristics for years [10]. Several prediction methods can characterize the independent-dependent relationship [11]. An enhanced artificial neural network (ANN) was employed to forecast the mechanical characteristics in an extensive experimental study on the feasibility of employing waste sawdust [12], waste quartz mineral dust [13], and supplementary cementitious material (SCM) to generate high-efficiency lightweight concretes using no cement. In comparison to artificial neural networks (ANNs), extreme gradient boosting (XGB) proved less successful at recognizing WMP content in some studies. Both the XGB and ANN models performed effectively in optimizing the incorporation of WMP into concrete mixtures [14]. By using the ANN approach, Dantas et al. [15] examined the compressive strength of concrete that contained trash from construction and demolition. According to their paper, artificial neural networks (ANNs) can forecast the compressive strength of materials for periods of 3, 7, 28, and 91 days. This prediction ability was observed in both the training and testing phases. Another approach called response surface methodology (RSM) is an effective method of statistical analysis that is particularly valuable in experimental research. It allows researchers to examine the mathematical relationship between input and output variables using a limited number of trials [16]. A set of statistical and mathematical techniques called the response surface method (RSM) is helpful and efficient for modeling and assessing experimental problems [17]. In concrete work, this method has not been applied very much, despite being widely used in trial design and optimization. The study employed the response surface methodology to investigate the impact of aspect ratio and steel fiber volume fraction on fracture parameters of steel fiber-reinforced concrete. The most effective mix of key components is determined using mathematical and statistical models and analysis of variance (ANOVA) statistics to determine how a factor affects observed responses [18]. Thus, the performance and applicability of RSM and ANN for the current application were examined in the current study to estimate UHPC compressive strength.
Recently, much attention has been needed to focus on traditional methods that do not depend on machine learning to predict the properties of concrete. This is because traditional methods are often more interpretable, less complex, and require fewer computational resources compared to machine learning approaches. However, there has still been a lack of research focused on forecasting the mechanical properties of UHPC, which is crucial for its application. Currently, there is an increasing amount of attention from researchers to investigate how suitable machine learning and traditional modeling techniques are for identifying practical solutions to problems. This study developed and compared two models, the RSM and the ANN method, to estimate the compressive strength of UHPC. The efficacy of each approach was assessed by comparing the coefficient of determination (R2) and mean square error (MSE) of both models. This article represents the first known comparison between ANN and RSM in predicting the compressive strength of previous research data. Furthermore, the study’s final goal includes a sensitivity analysis of the model developed from ANNs.

2. Methodology

2.1. Analyzing Dataset and Statistics

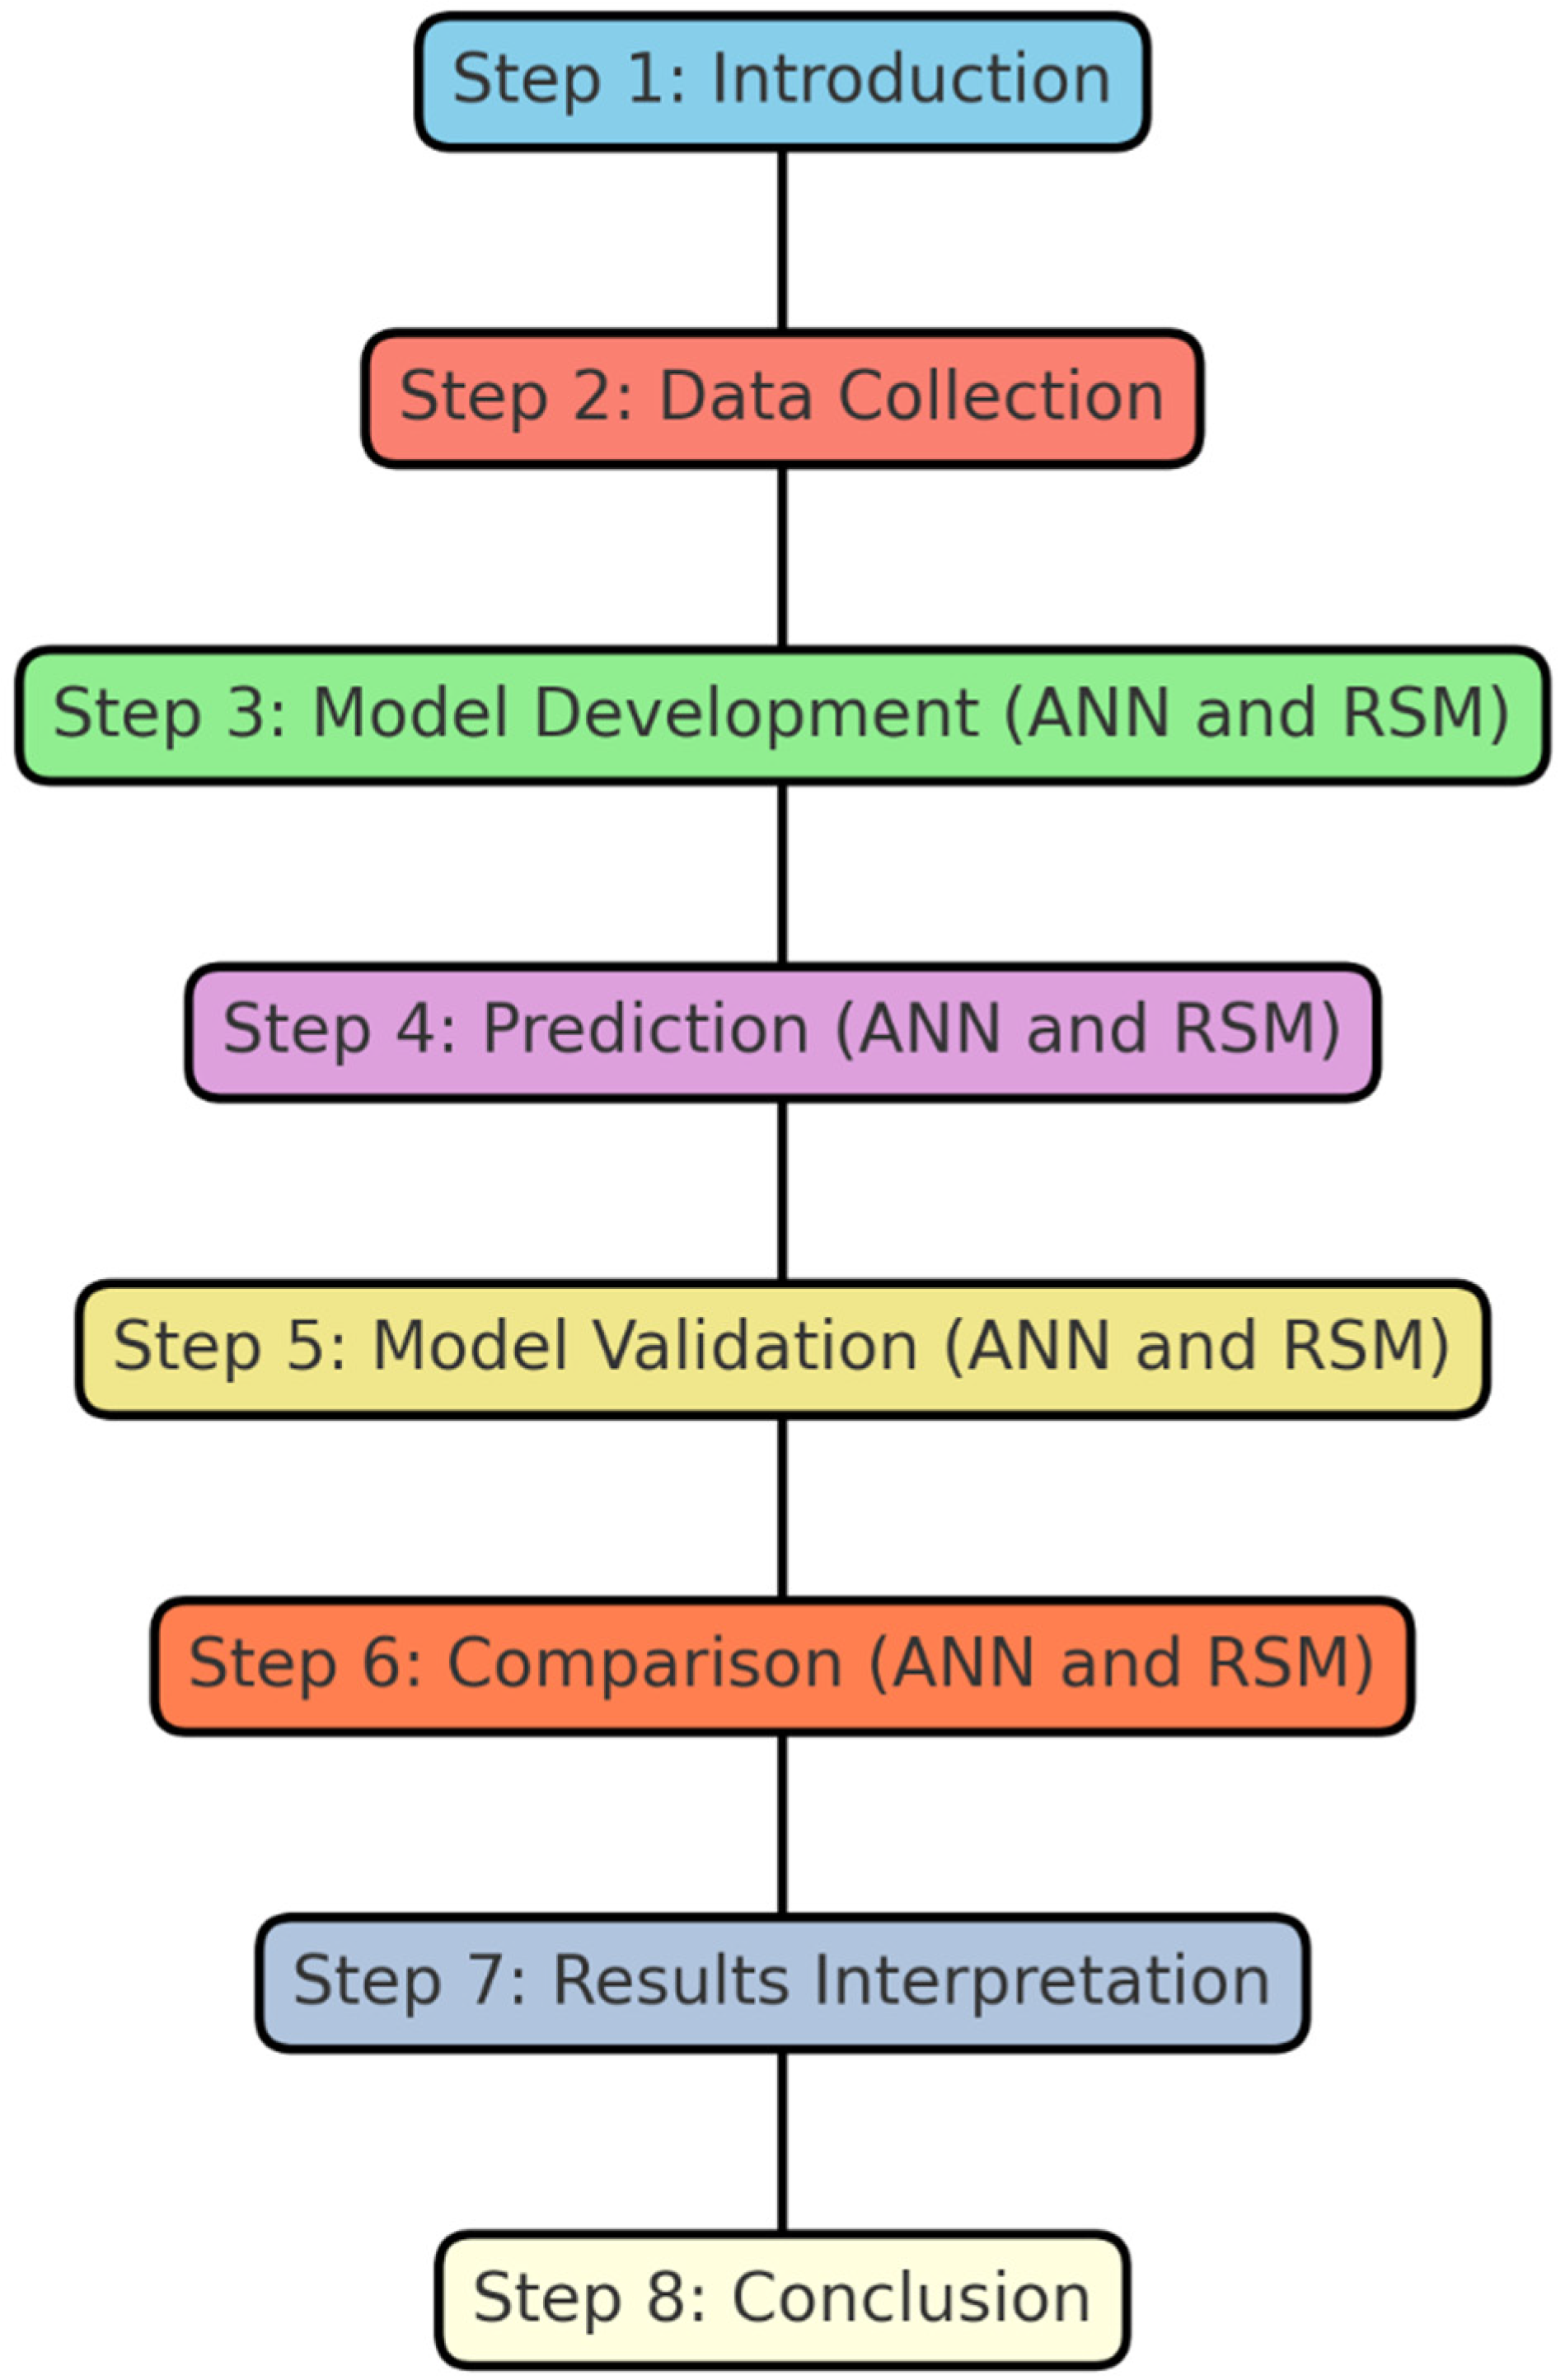
This section analyzed 626 data samples from experiments under different settings to construct and test the ANN and RSM models in this study. Conditions include cement content, cement compressive strength, cement type, cement strength class, fly-ash, slag, silica-fume, nano-silica, limestone powder, sand, coarse aggregates, maximum aggregate size, quartz powder, water, super-plasticizers, polystyrene fiber, polystyrene fiber diameter, polystyrene fiber length, steel fiber content, steel fiber diameter, steel fiber length, and curing time. The linear correlation coefficients and their significance levels among the data components are also examined using Pearson’s linear correlation [19]. For modeling the final output, linear correlation analysis is frequently utilized to identify input variables, particularly when a large number of variables are unrelated to the target. In our experiment, the correlation coefficients between the target and the 22 input variables were computed. High levels of correlation between independent variables can lead to the multicollinearity problem, which misinterprets the output of machine learning models [20]. Model parameters can result in significant differences between observed and projected outcomes because of their sensitivity. For simulated values to be predicted, the predicted parameters must be accurate. Identifying influential variables is a critical obstacle in any statistical analysis [21]. Figure 1 shows the correlations of all the variables involved in predicting the compressive strength. Whereas X1: cement content, X2: cement compressive strength, X3: cement type, X4, cement strength class, X5: fly-ash, X6: slag, X7: silica-fume, X8: nano-silica, X9: limestone powder, X10: sand, X11: coarse aggregates, X12: maximum aggregate size, X13: quartz powder, X14: water, X15: super-plasticizers, X16: polystyrene fiber, X17: polystyrene fiber diameter, X18: polystyrene fiber length, X19: steel fiber content, X20: steel fiber diameter, X21: steel fiber length, and X22: curing time. Models are tested and validated in slightly different ways, but in order to fully understand them, new machine-learning algorithms need to estimate them. The evaluation of the model’s performance and reliability was conducted based on four crucial parameters [22]. Performance ratings and ranks are used for assessment [23]. Figure 2 shows the flow chart of the methodology. Sensitivity analysis was used to assess the effect of inputs on compressive strength. Equation (1) determines compressive strength’s input variable sensitivity.
Si = N i i = 1 n N i × 100
where Si: sensitivity analysis, Ni = Fmax(X1) − Fmin(X1) and i = 1,…, n.

2.2. RSM Modeling

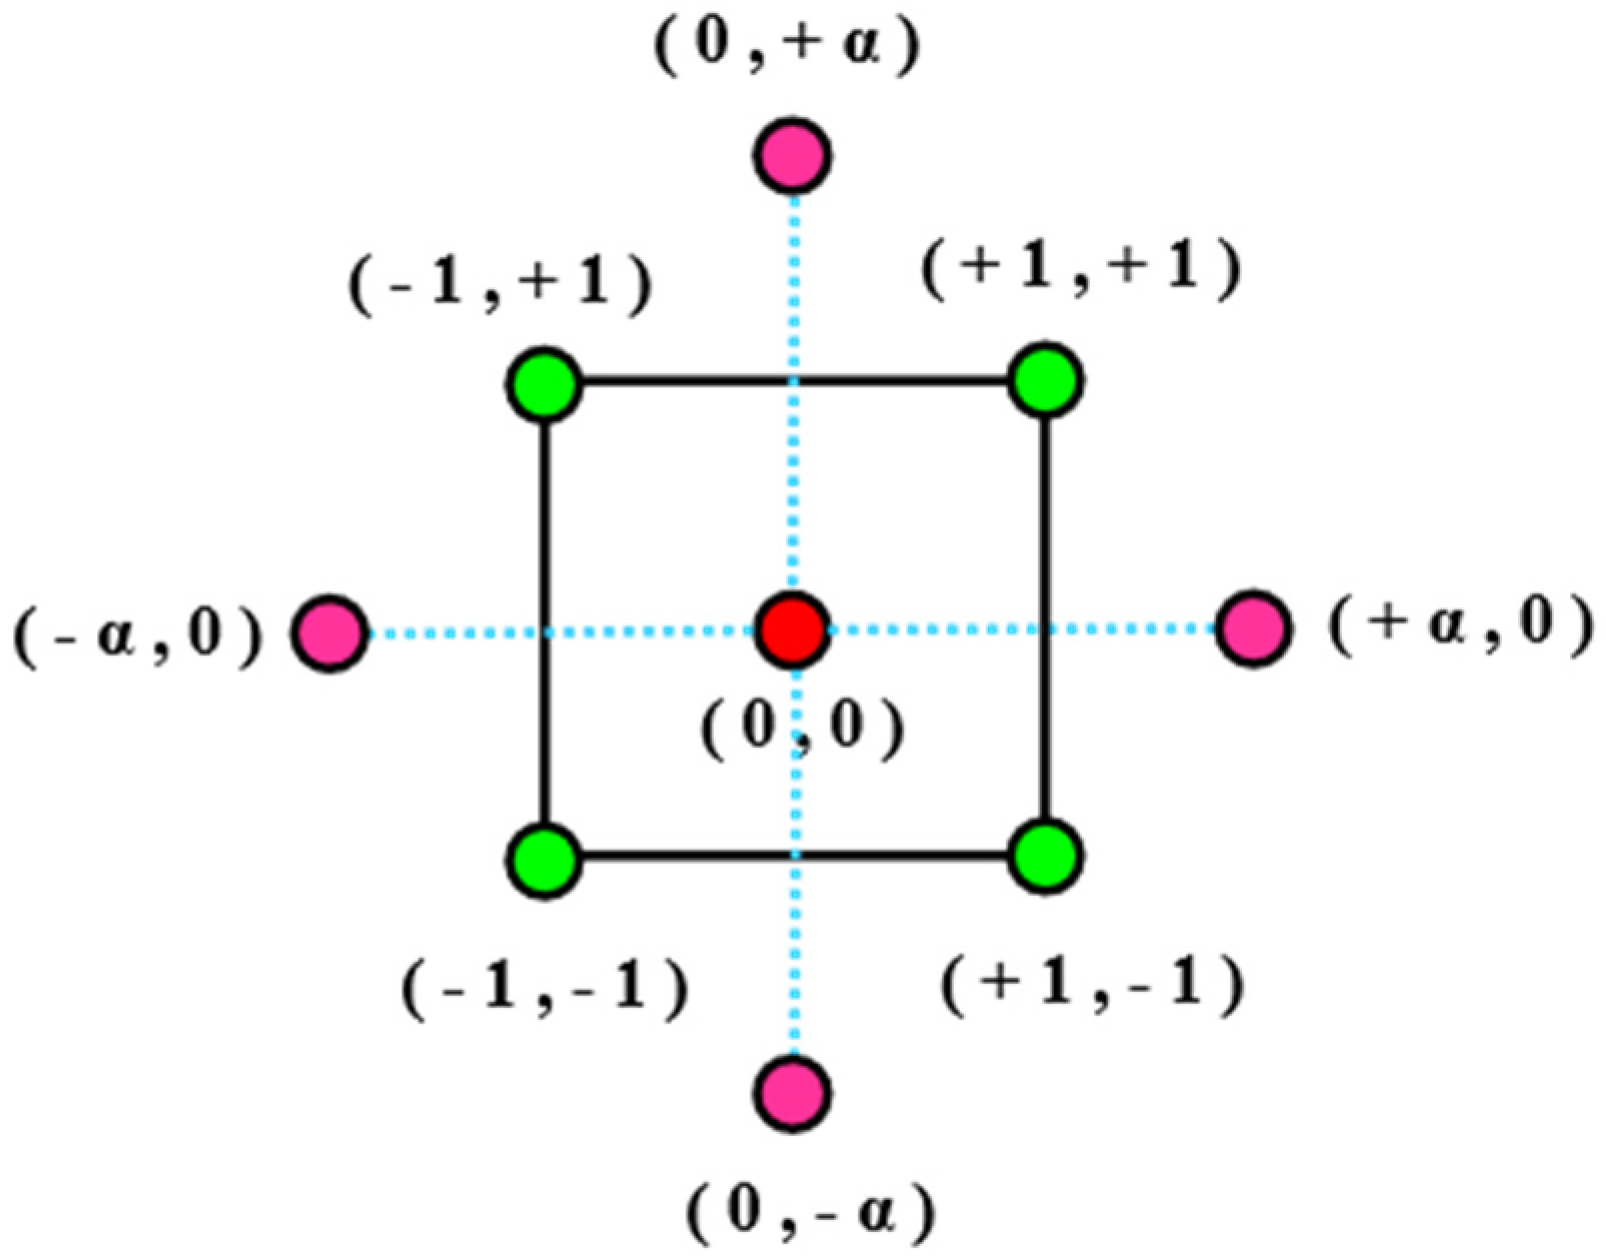
The response surface methodology (RSM) is a mathematical and statistical approach used to develop, enhance, and optimize situations where a response variable is affected by numerous influencing variables [24]. In response variable and independent variable design, the central composite design in response surface methodology (RSM) is often a fractional factorial design approach [25]. Three levels are present in each of the two components of the face-centered central composite design, which was chosen with α = 1 as shown in Table S1. To increase the accuracy of RSM in predicting experimental results, 624 mixtures were divided into 10 groups.
The experiment number was explained in [26]. The factorial, axial, and center points are schematically represented by CCD in Figure 3.
The quadratic model or second-order polynomial Equation (2) was utilized to determine the optimal response.
y = β0 + ∑ βixi + ∑ βiixi2 + ∑ βiixixj
where the details of the equation are explained in detail in [27].

2.3. ANN Modeling

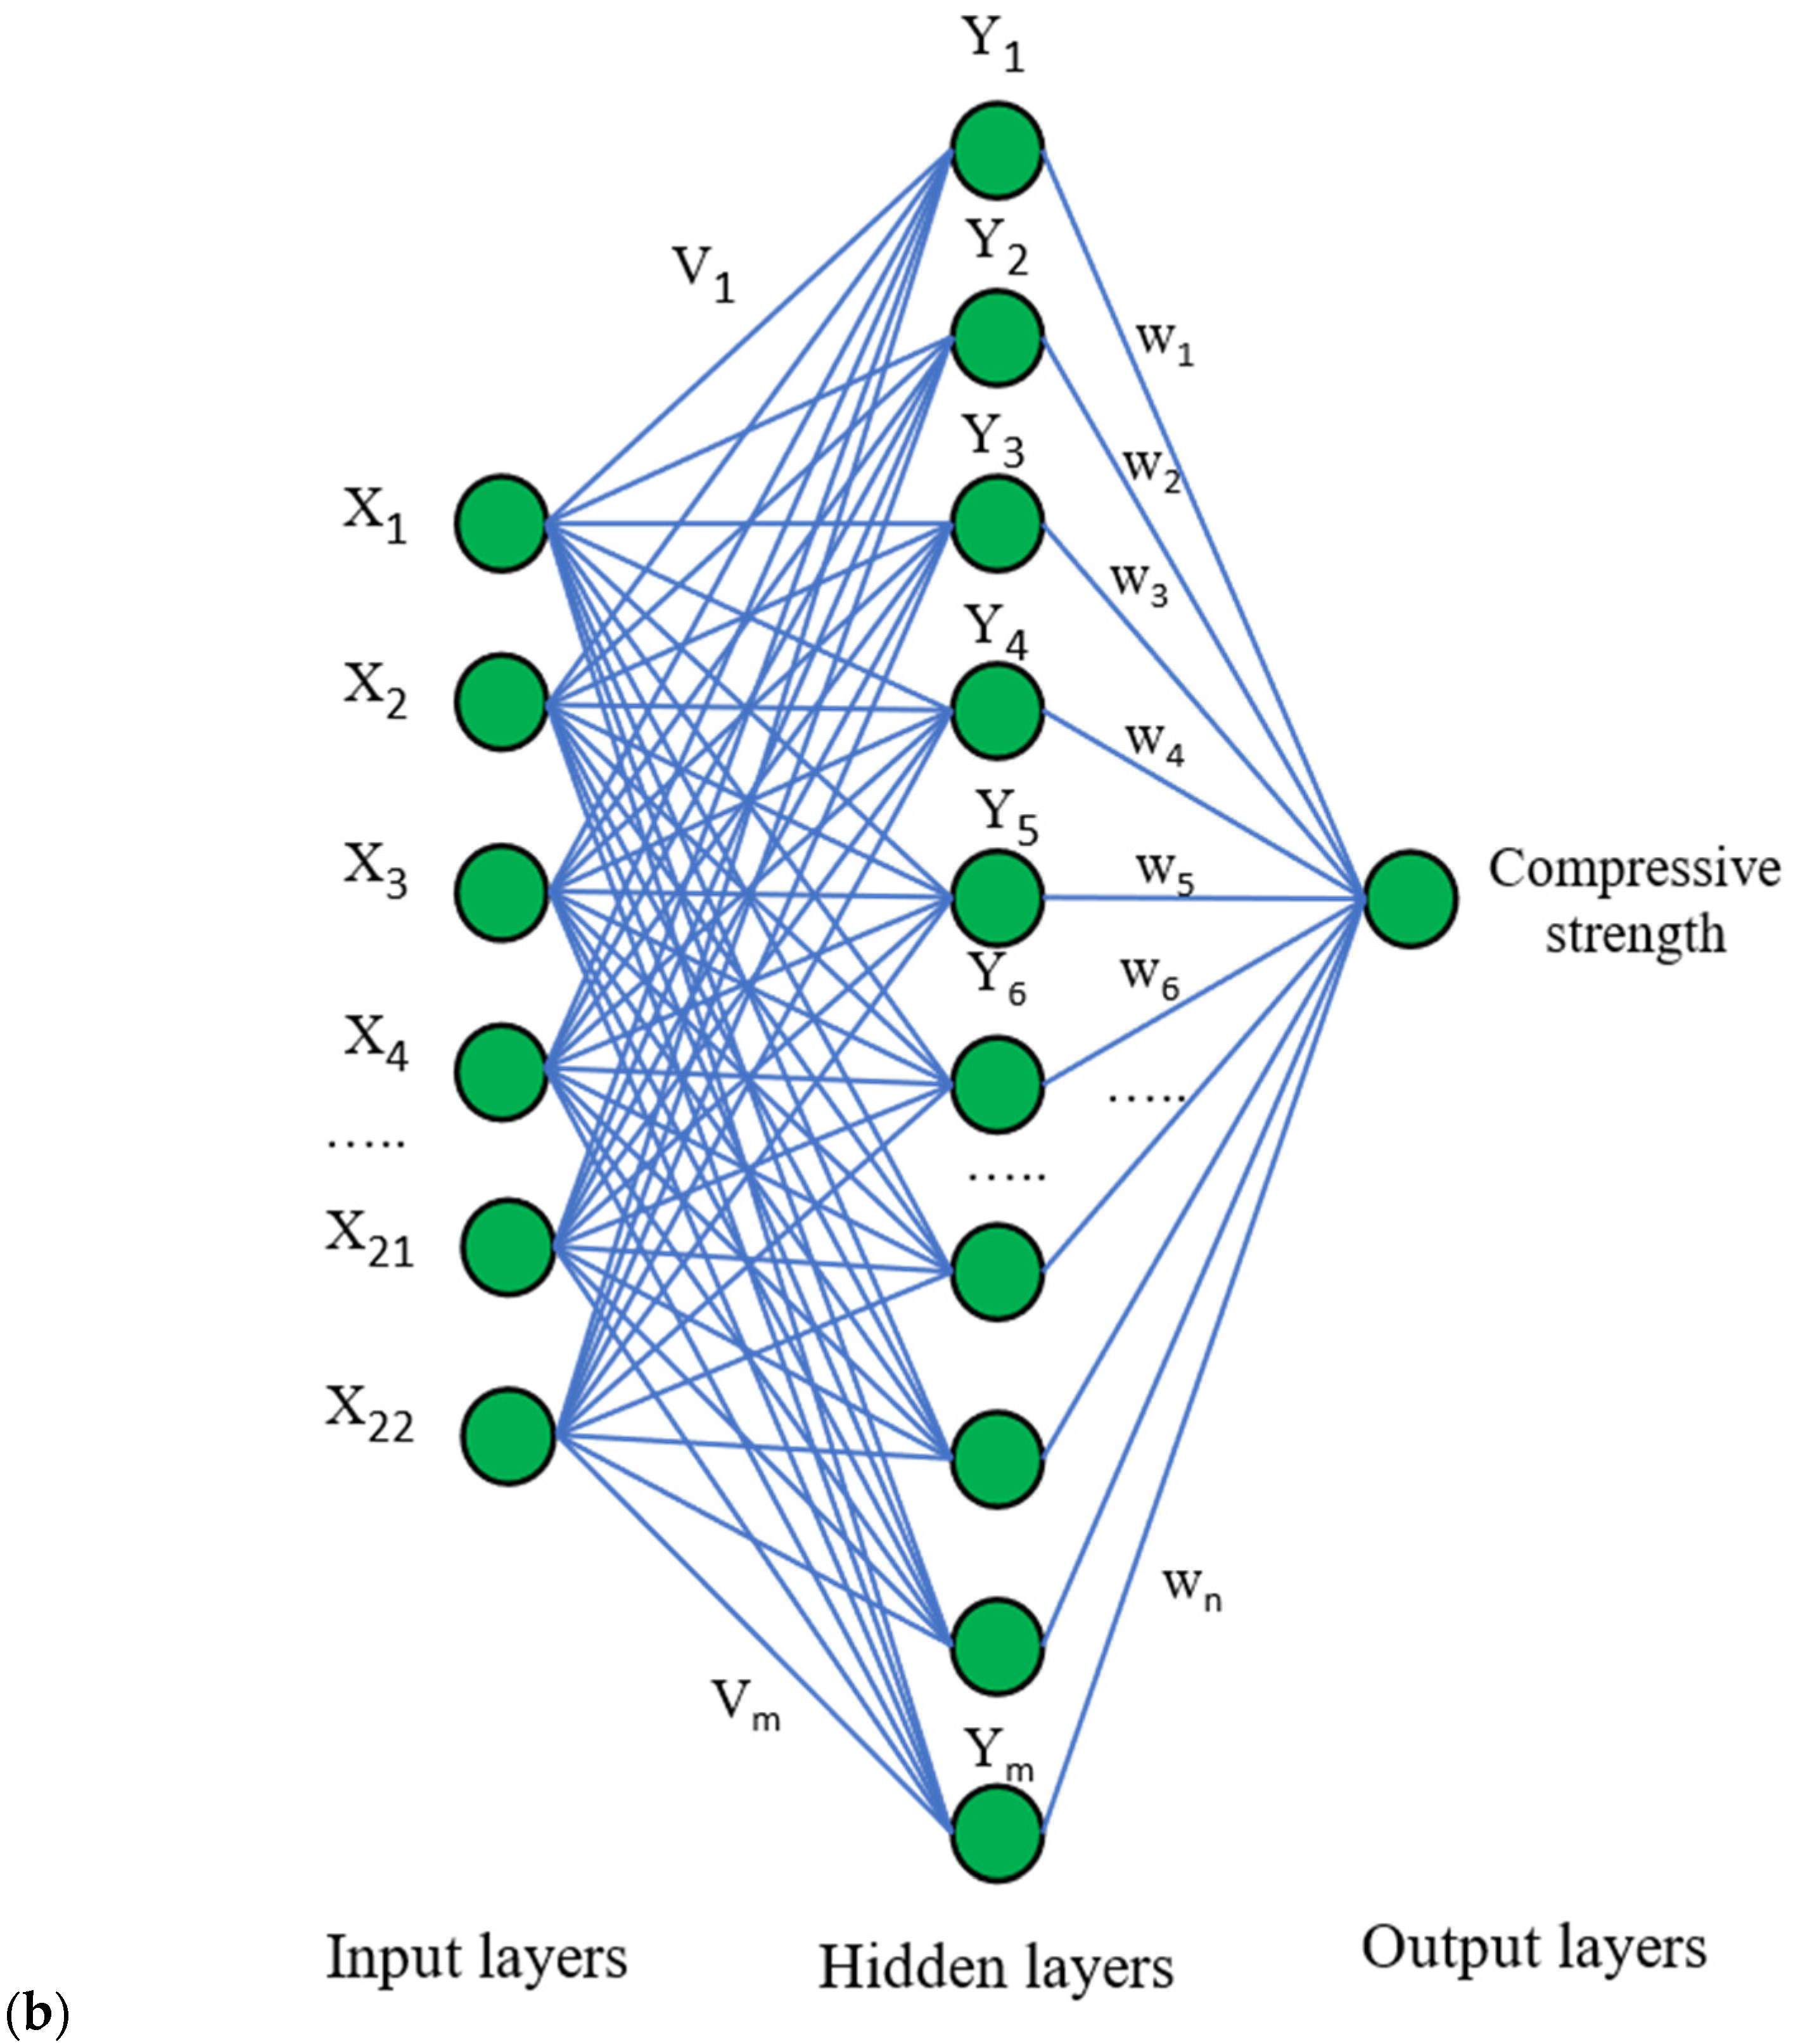
An artificial neural network (ANN) is a computational model that imitates the functional characteristics of the human brain’s neural system using numerical and mathematical methods [28]. The MLP (multilayer perceptron) feed-forward ANN was used, employing the L-M (Levenberg–Marquardt) approach for the propagation learning procedure [29]. Numerous dense, simple, parallel, interconnected processing units known as neurons are found in each layer (Figure 4a). The ANN network utilized three layers: the input layer, which consisted of various parameters such as cement content, cement compressive strength, cement type, cement strength class, fly-ash, slag, silica-fume, nano-silica, limestone powder, etc.; the hidden layer; and the output layer, which specifically predicted the compressive strength. The data are collected by the input layer and sent to the hidden layer for processing. All data processing is then completed by the hidden layer, which produces the output [30]. Three categories were randomly selected from the input data: 70% for training samples, 15% for validation, and 15% for testing [26]. Table 1 describes the statistical features of the data. The input layer has three neurons representing the same three independent variables as RSM, the hidden layer is the second, and the output layer is the ANN, as shown in Figure 4b.

3. Results and Discussion

3.1. ANN Model

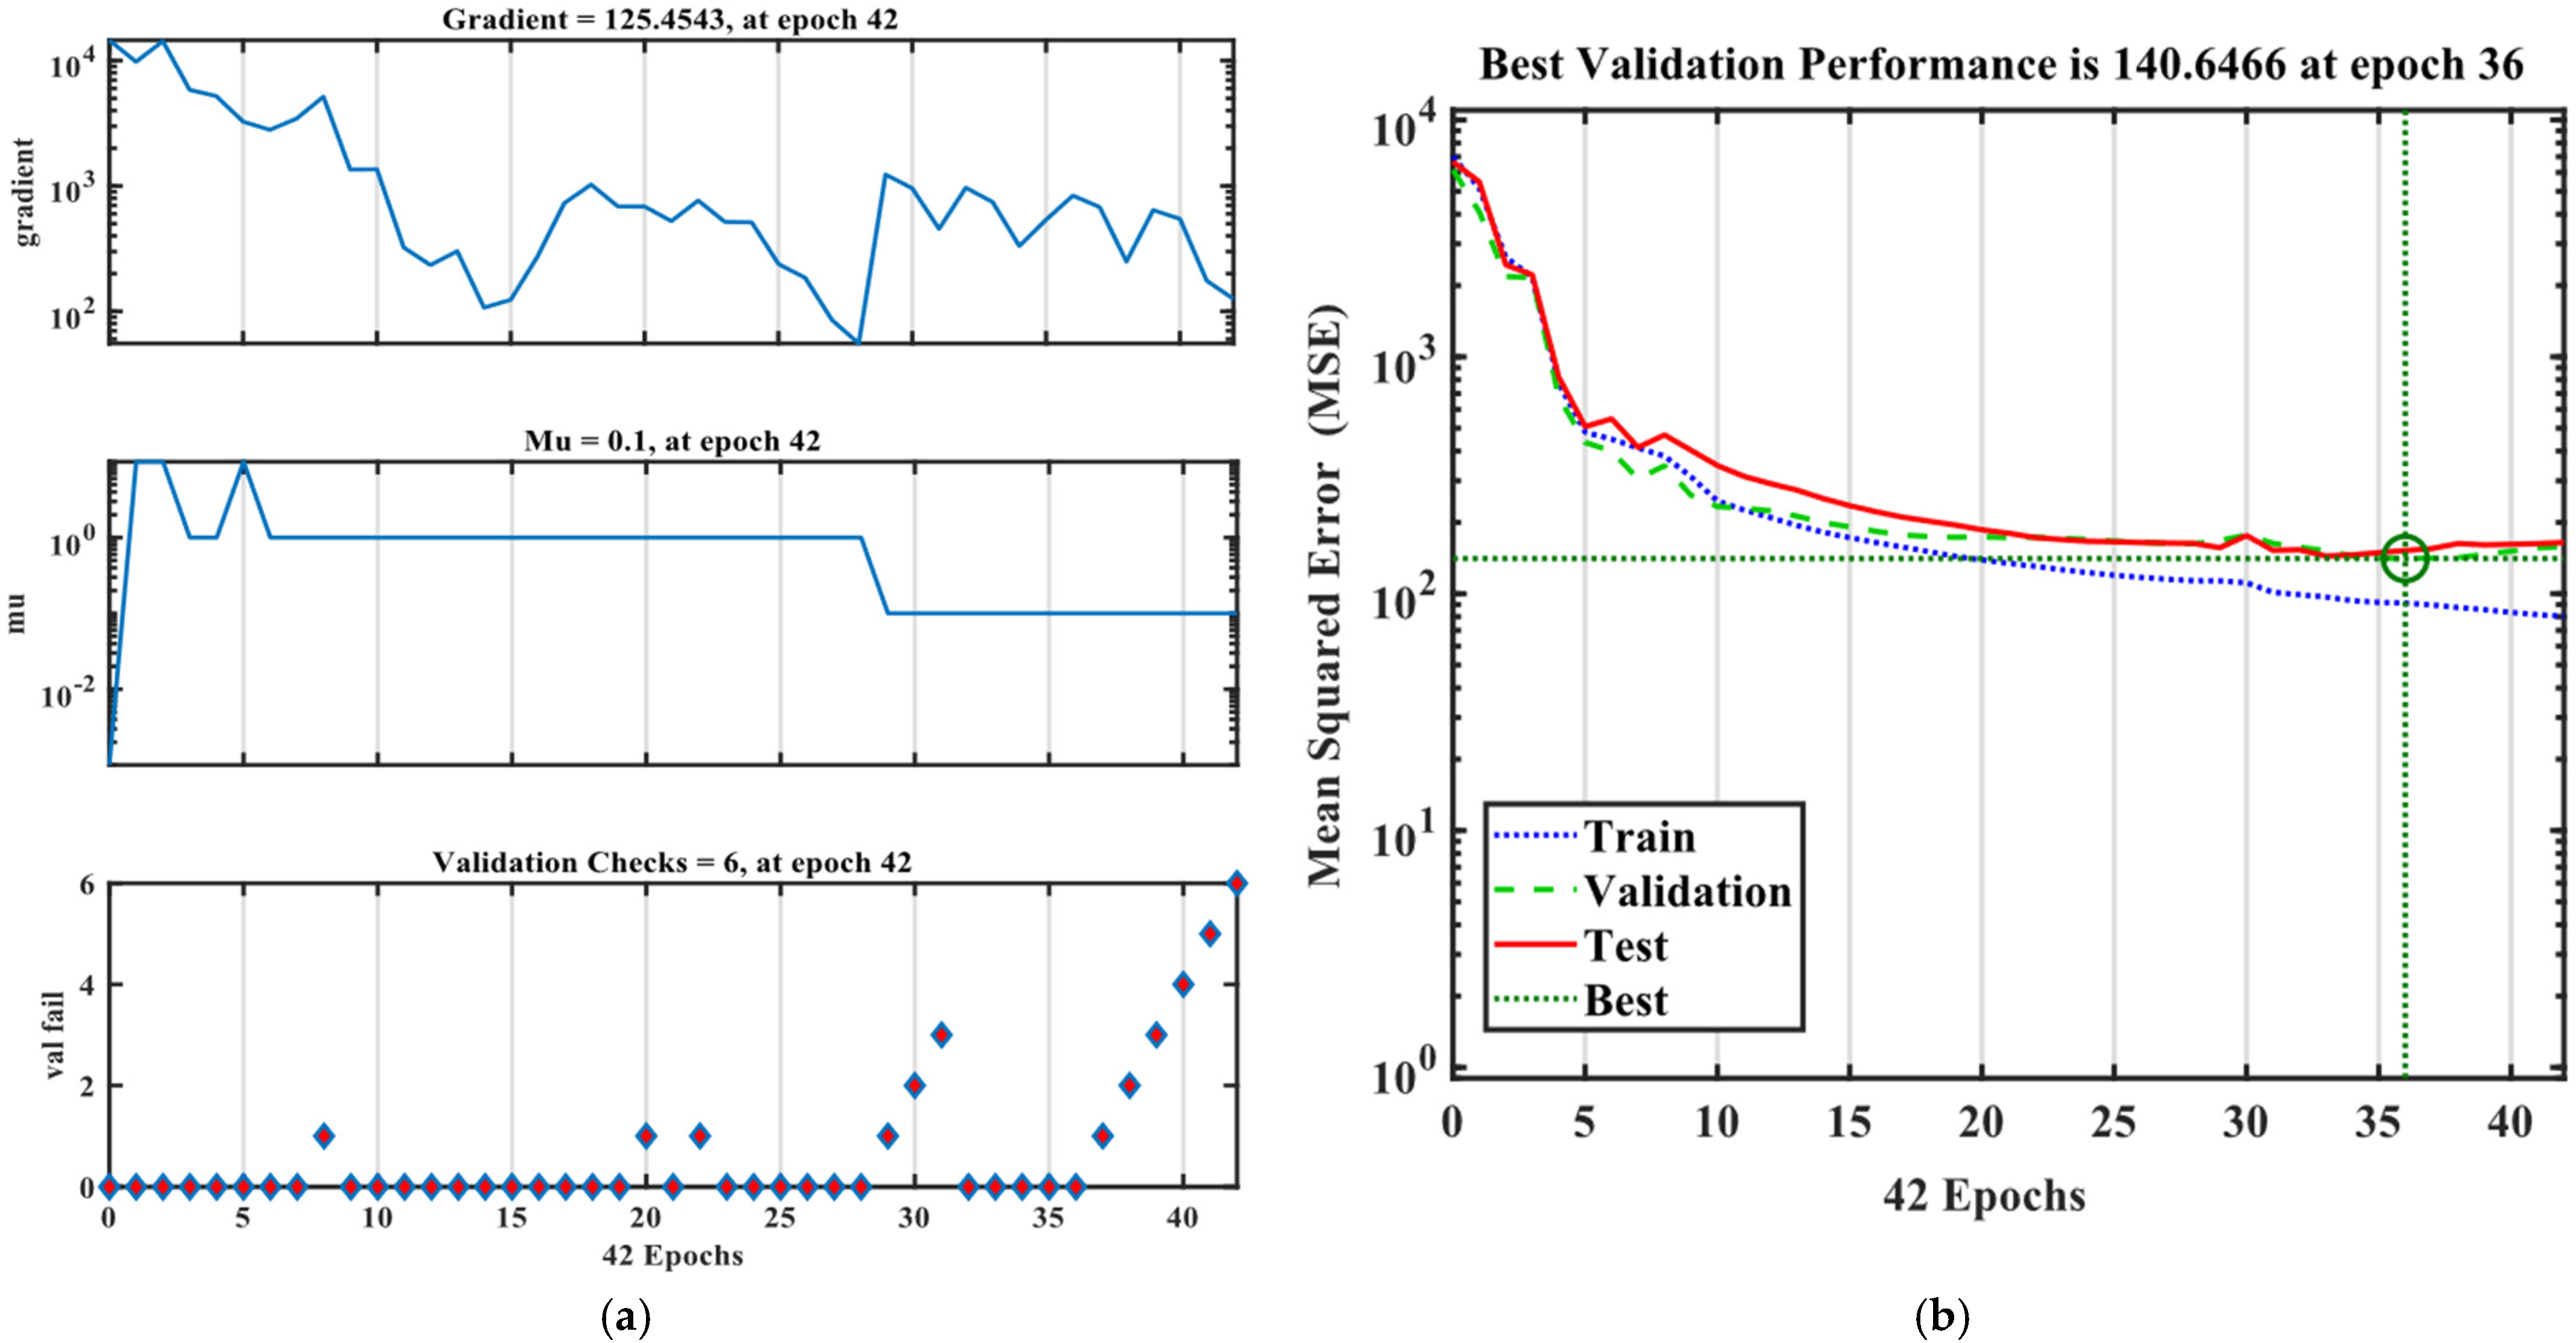
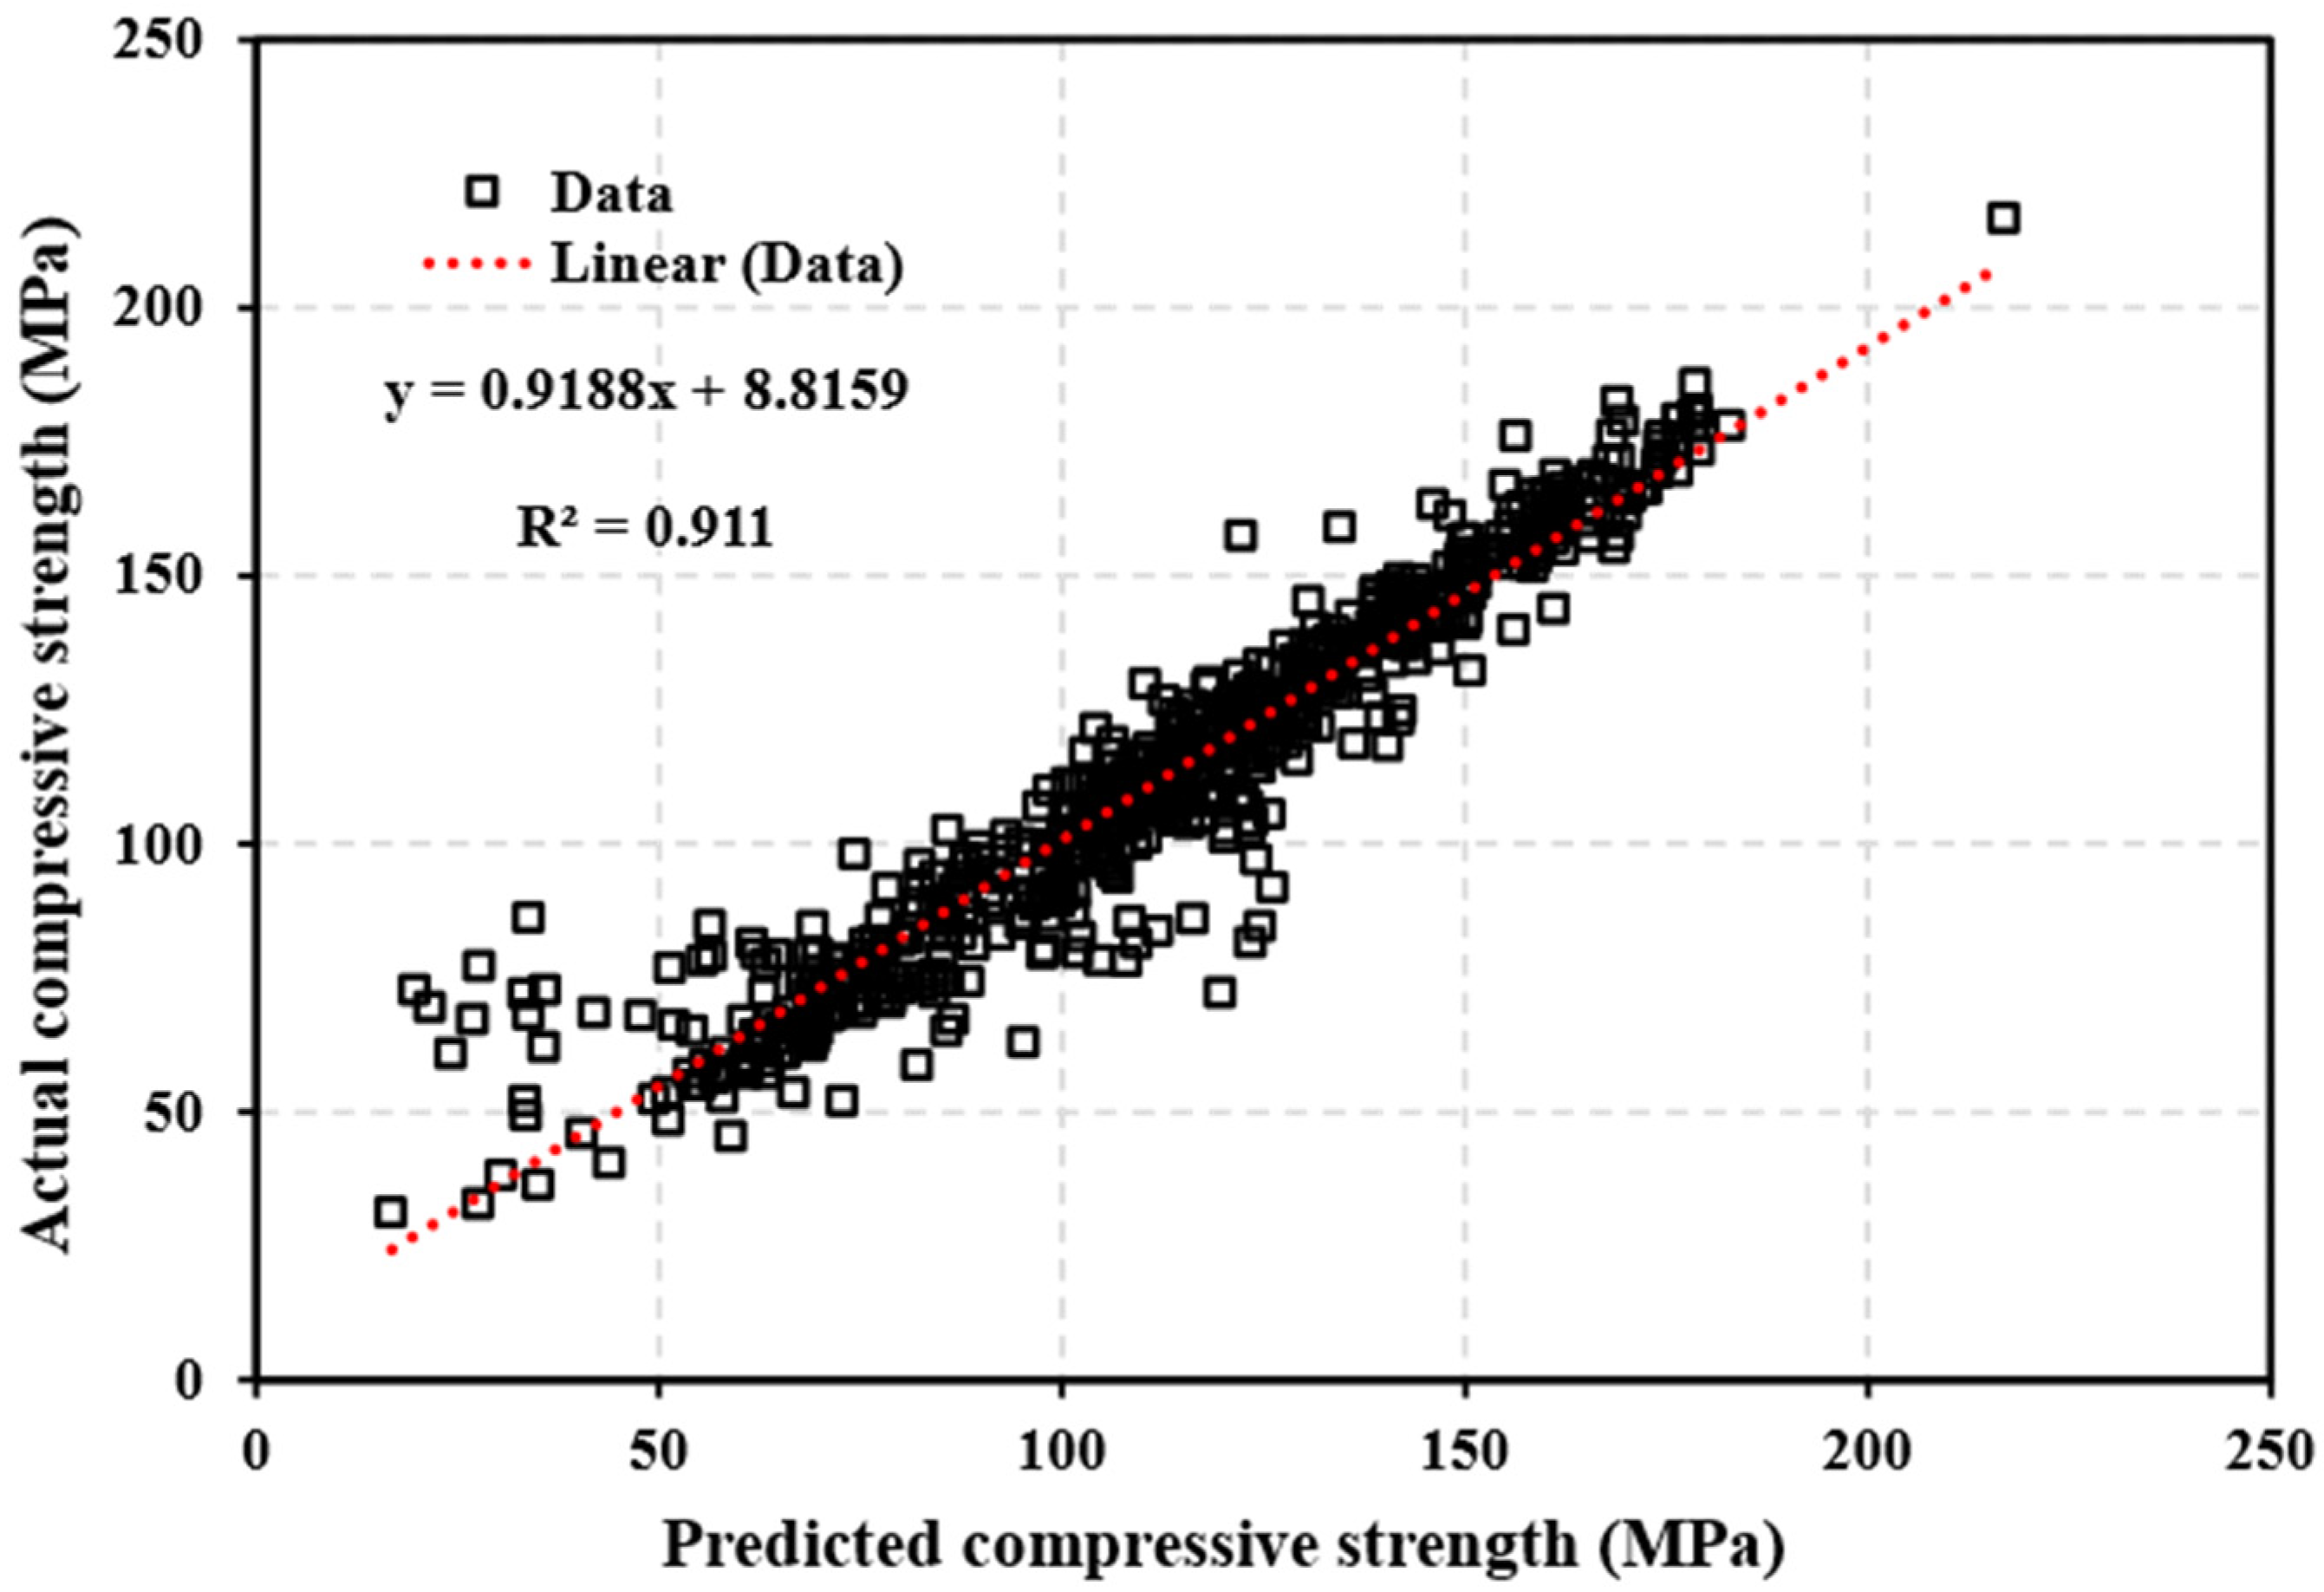
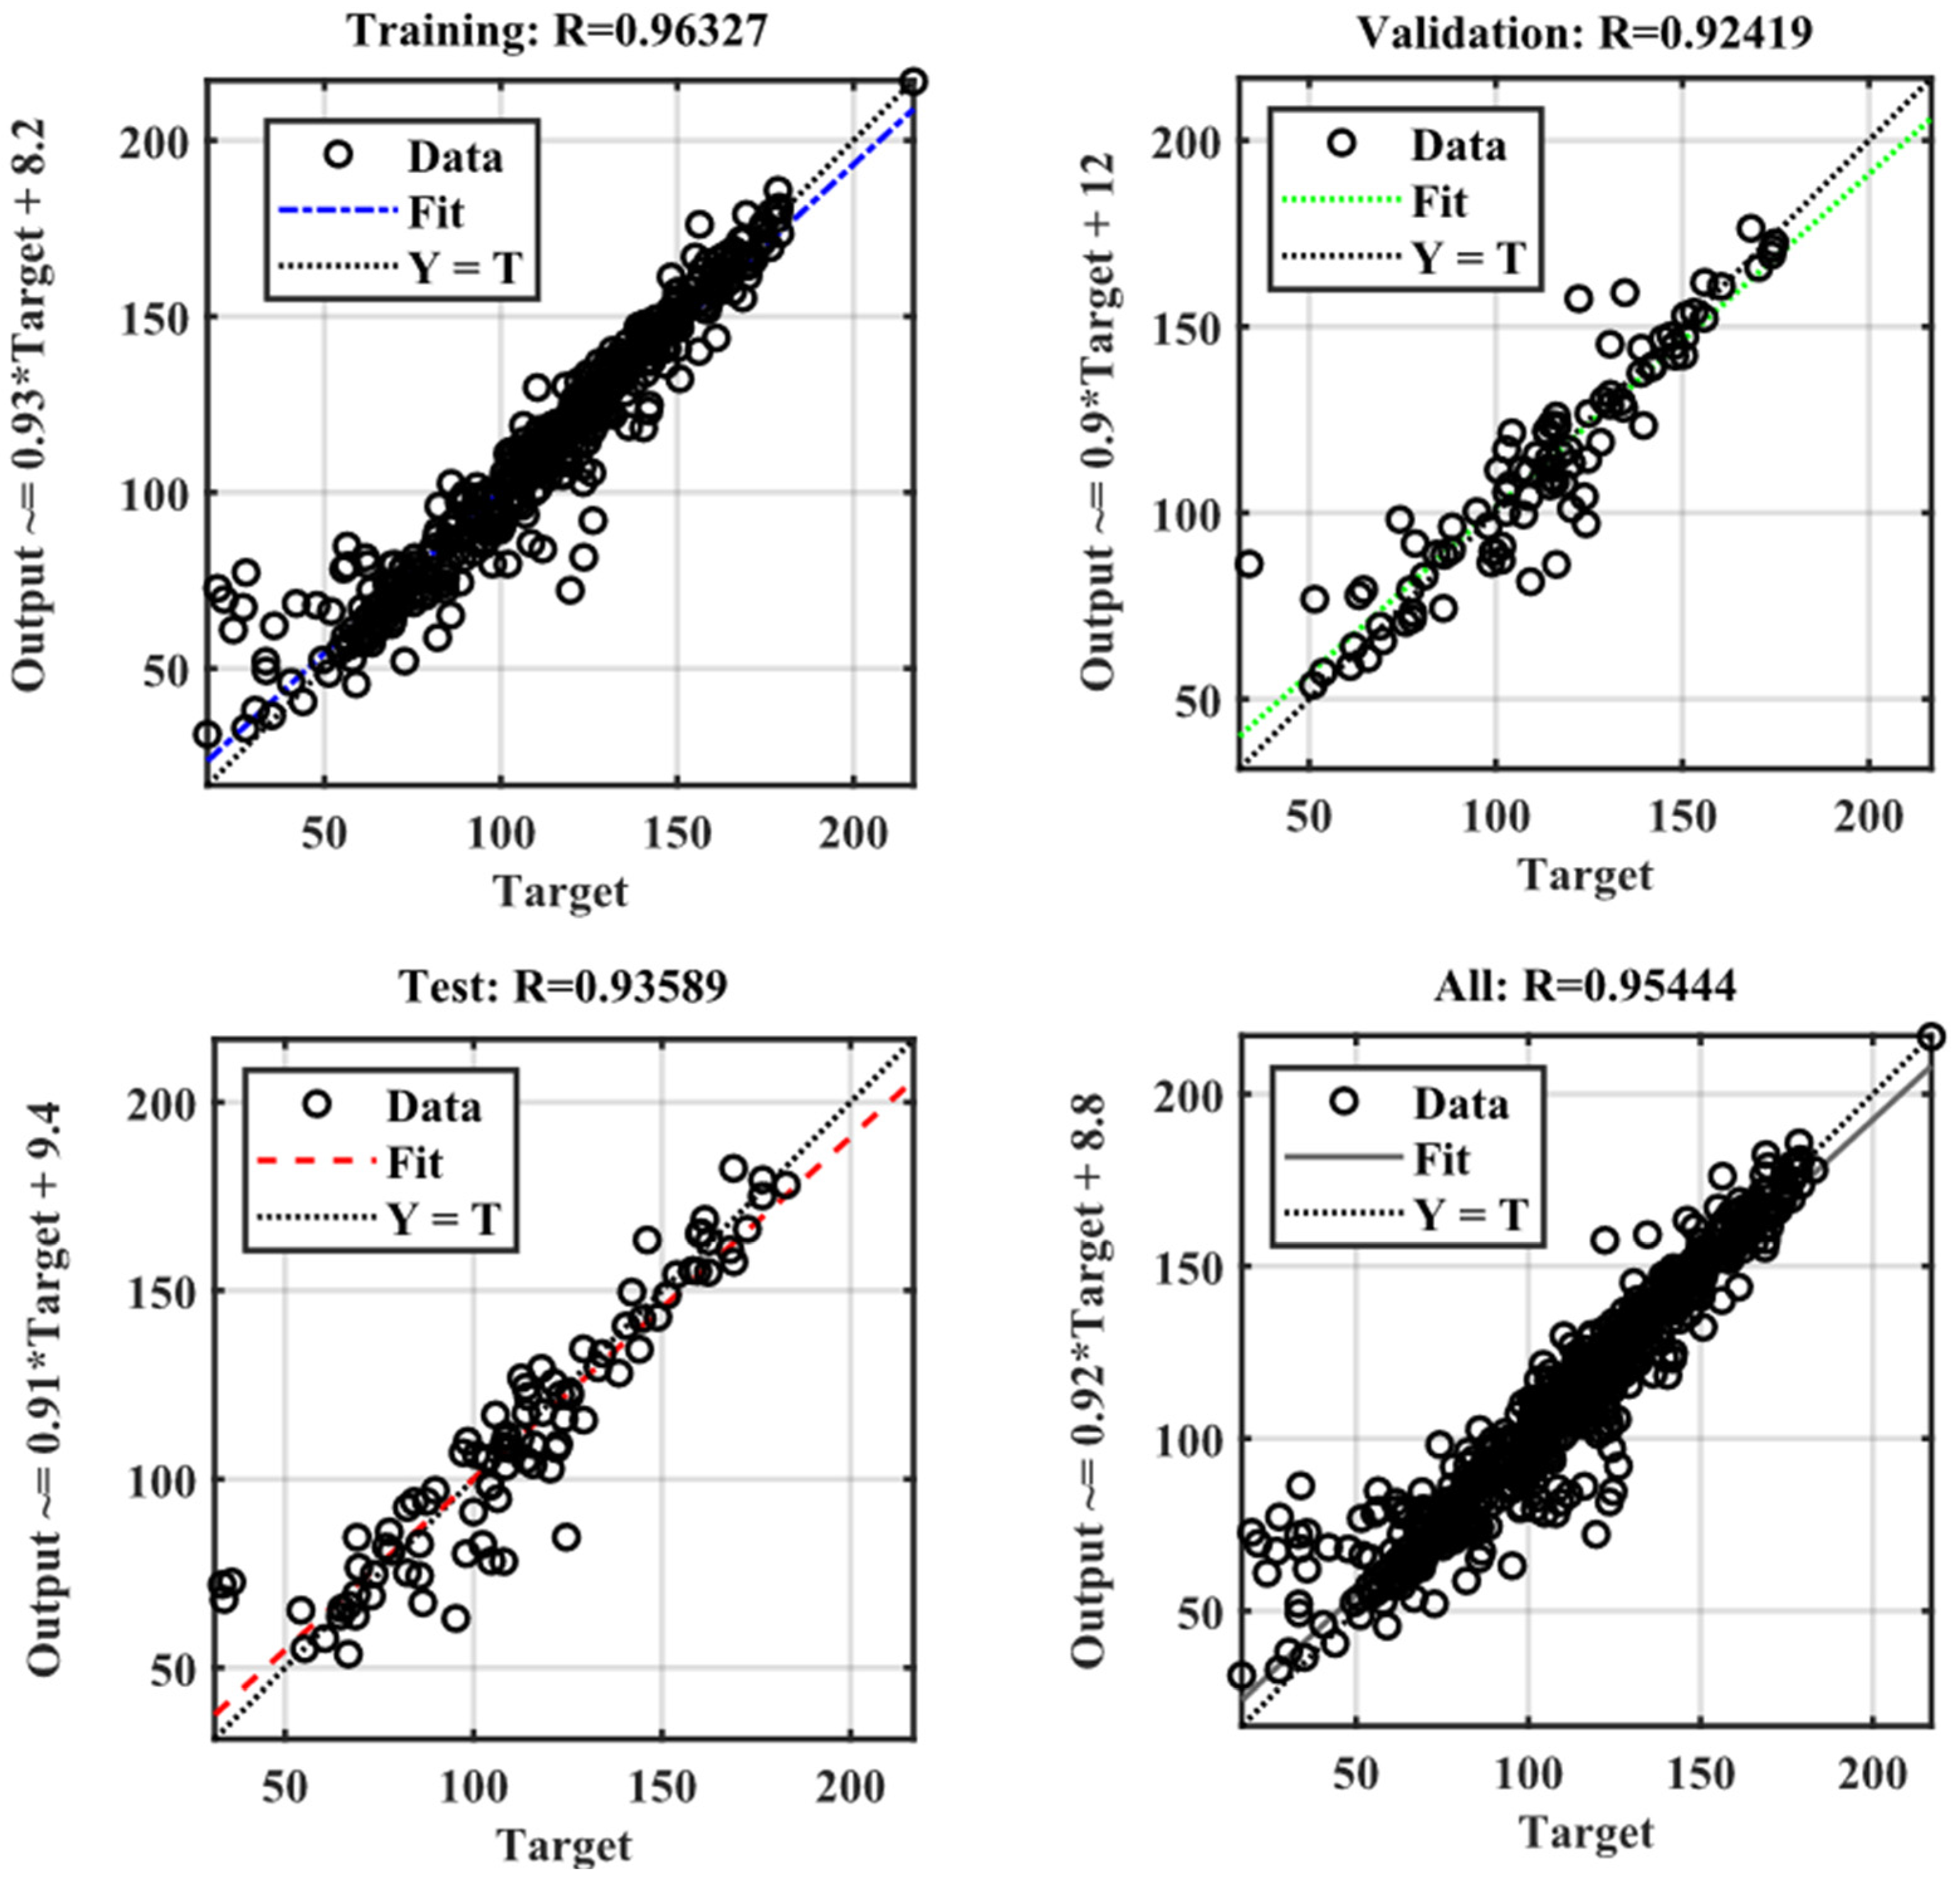
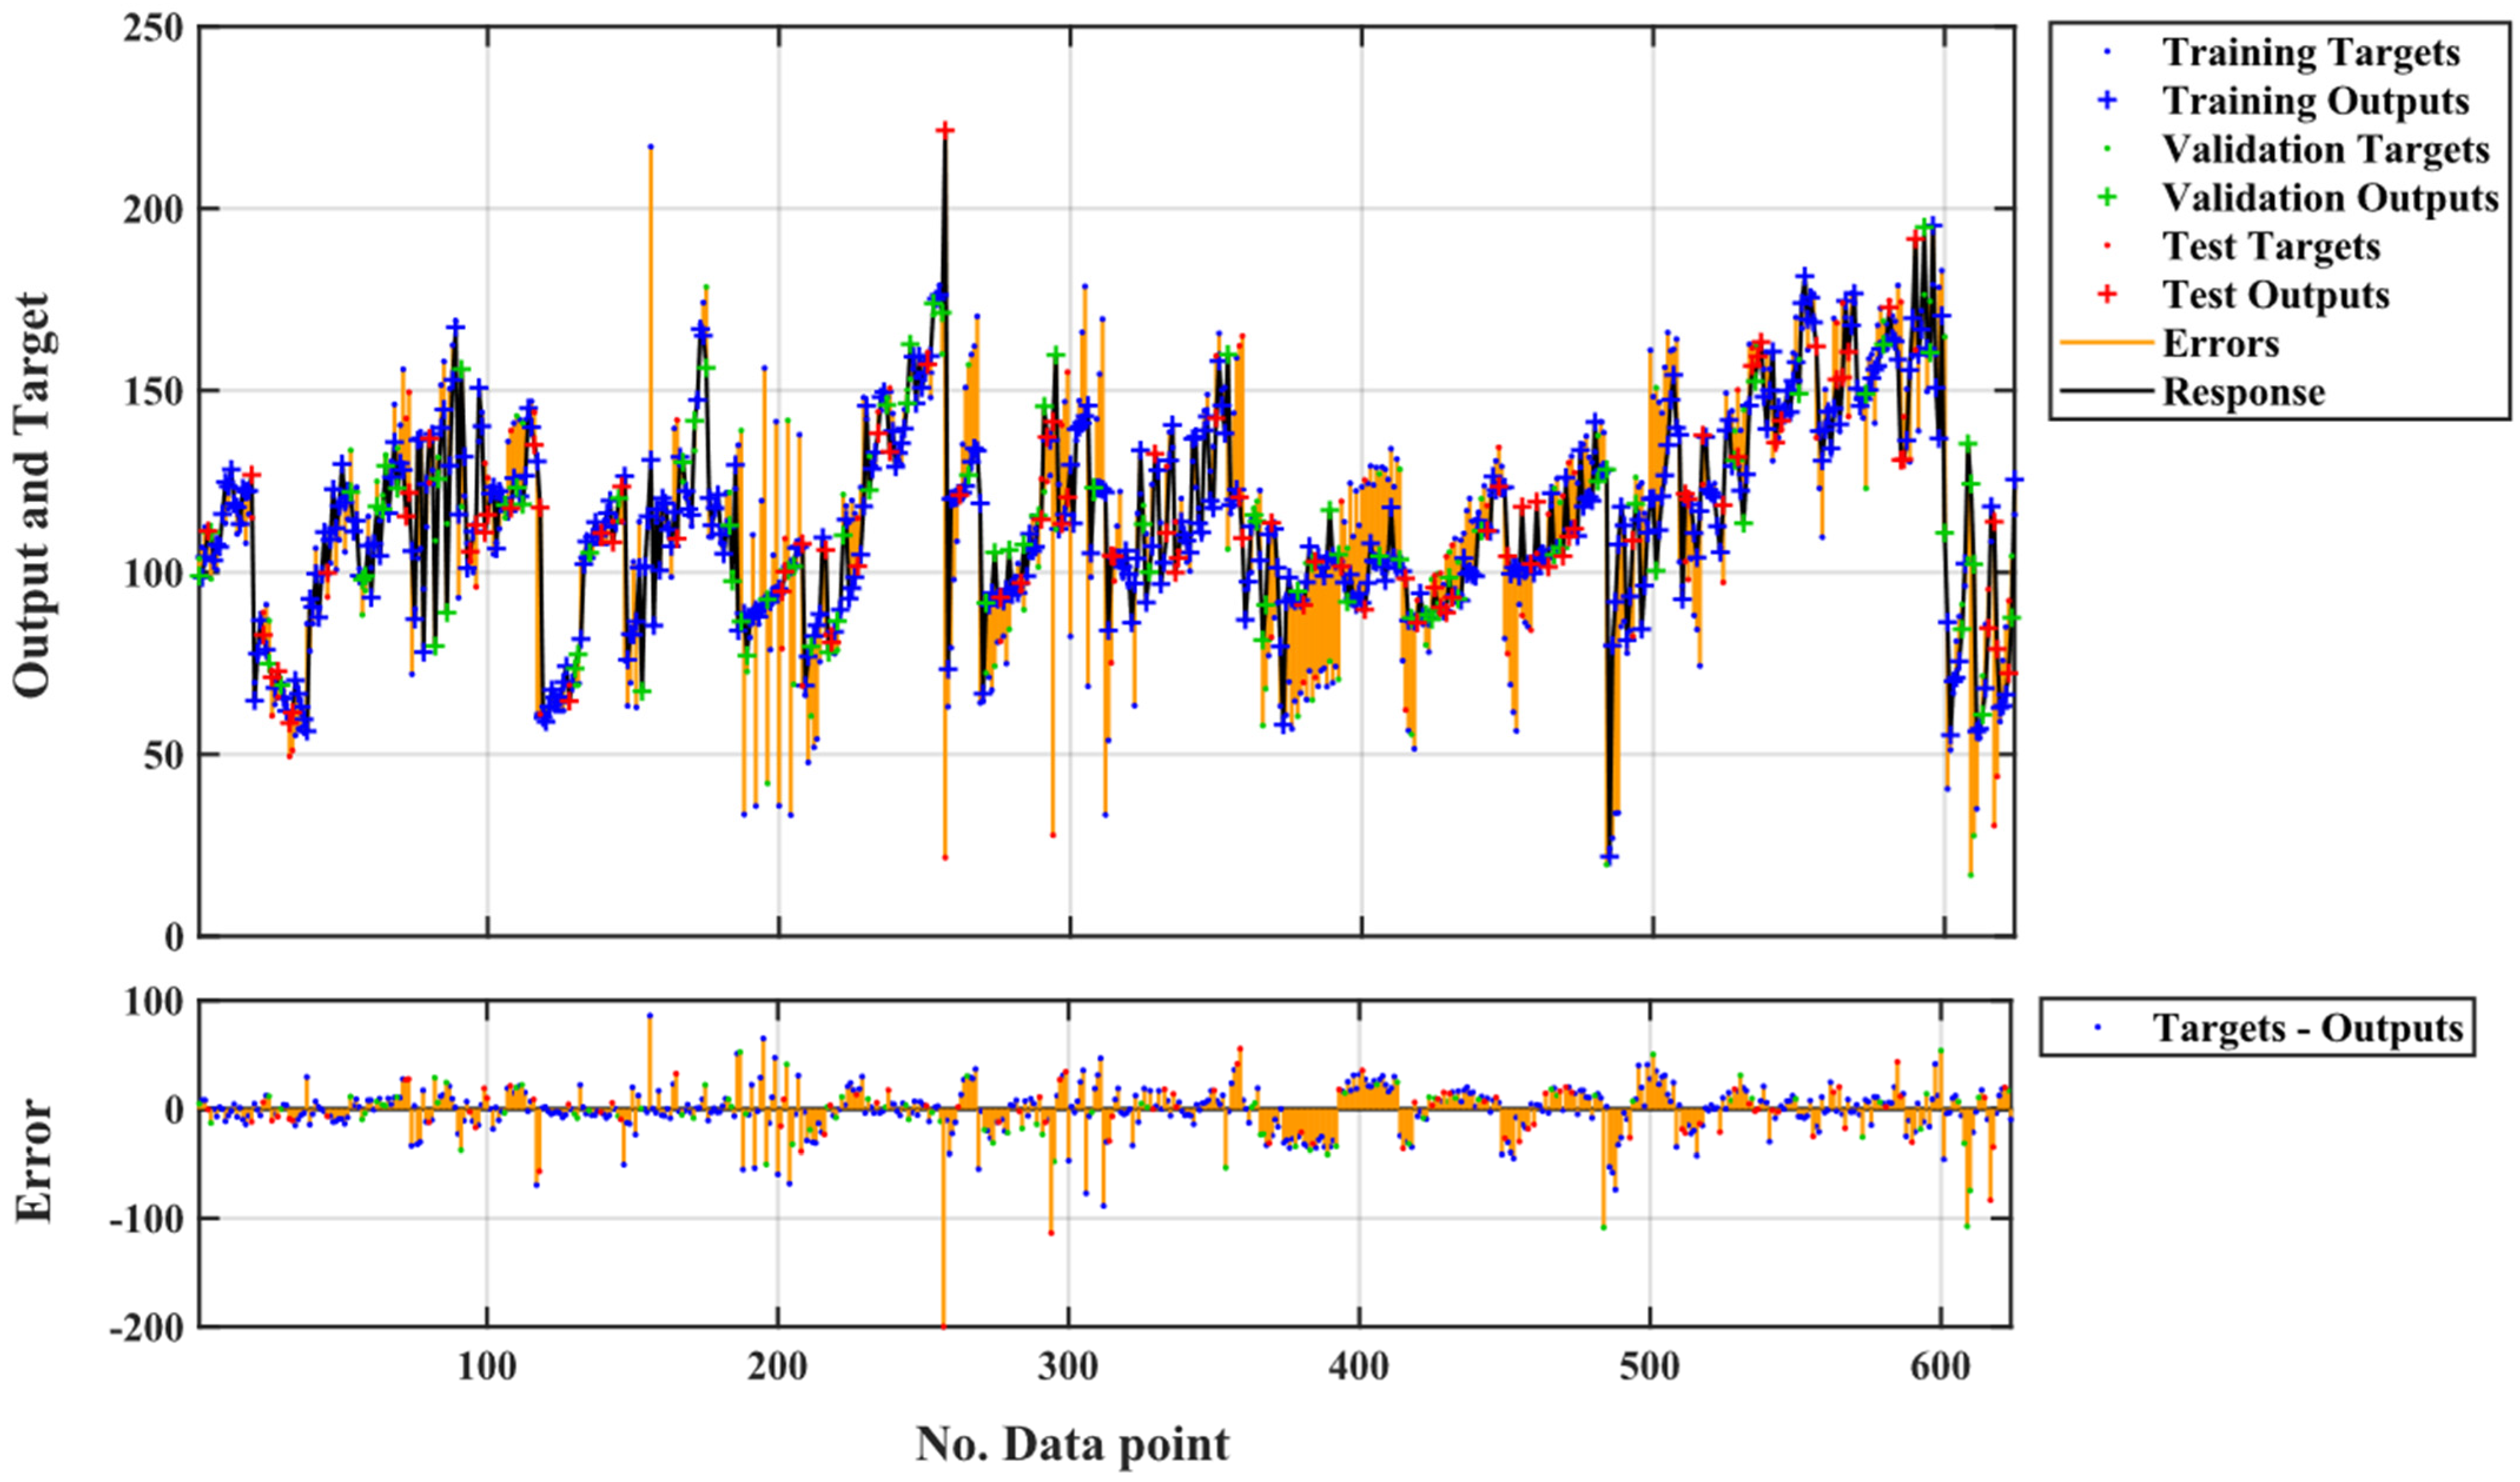
In this study, feedforward back propagation neural networks were used to develop ANN models for compressive strength. Seventy percent of the sample (438 samples) used in modeling was used for the training set, while the remaining 15% (94 samples) was used for each of the testing and validation sets. For developing a good artificial neural network (ANN), two hidden layers with ten neurons were used [31]. The input parameters for the models were 22 variables, and the output parameters were compressive strength. To assess the accuracy of the present models, the coefficient of determination (R2) and mean square error (MSE) were utilized [32]. The model accurately predicts the concrete compressive strength with a lower mean square error (MSE) and a higher R2 [33]. The training state of the ANN model is shown in Figure 5a, which also indicates that the test was terminated at epoch 42 and that errors are repeated 6 times after epoch 0. The initial epoch 0 is designated as the reference point, and its weights are adopted as the ultimate weights. Therefore, the validation check is equal to 6 because the errors are repeated 6 times before terminating the process. This result was similar to [34]. Epoch 36 achieved the highest performance in the validation of the artificial neural network model, with a mean squared error of 140.6466, as shown in Figure 5b. The nonlinear relationship between input variables and the model’s predictive effectiveness of compressive strength is shown in Figure 6, where R2 = 0.911 is shown. The accuracy of the responses predicted by the developed artificial neural network (ANN) models, which were trained using actual data, is indicated by a determination coefficient (R2) larger than 0.81 [35]. The R correlation coefficient for training, validation, testing, and cumulative compressive strength, which was determined by applying the ANN technique to the analysis, is shown in Figure 7. R values exceeding 0.9 show a strong correlation between real and anticipated values in all cases [36]. The artificial neural network (ANN) models, trained on actual data, efficiently forecasted the results. The best results predicted by MATLAB were at epoch 42, as shown in Figure 8. To further ensure the validity of the extracted results, predictions were made at 13 and 59 epochs, and these values were determined by MATLAB as the values before and after 42 epochs. Figure 9 and Figure 10 show the coincidence between the output and target variables of training, validation, testing, and cumulative for 13 and 59 epochs, respectively. Table 2 shows the correlation coefficient (R) and mean square error (MSE) for training, validation, testing, and cumulative.
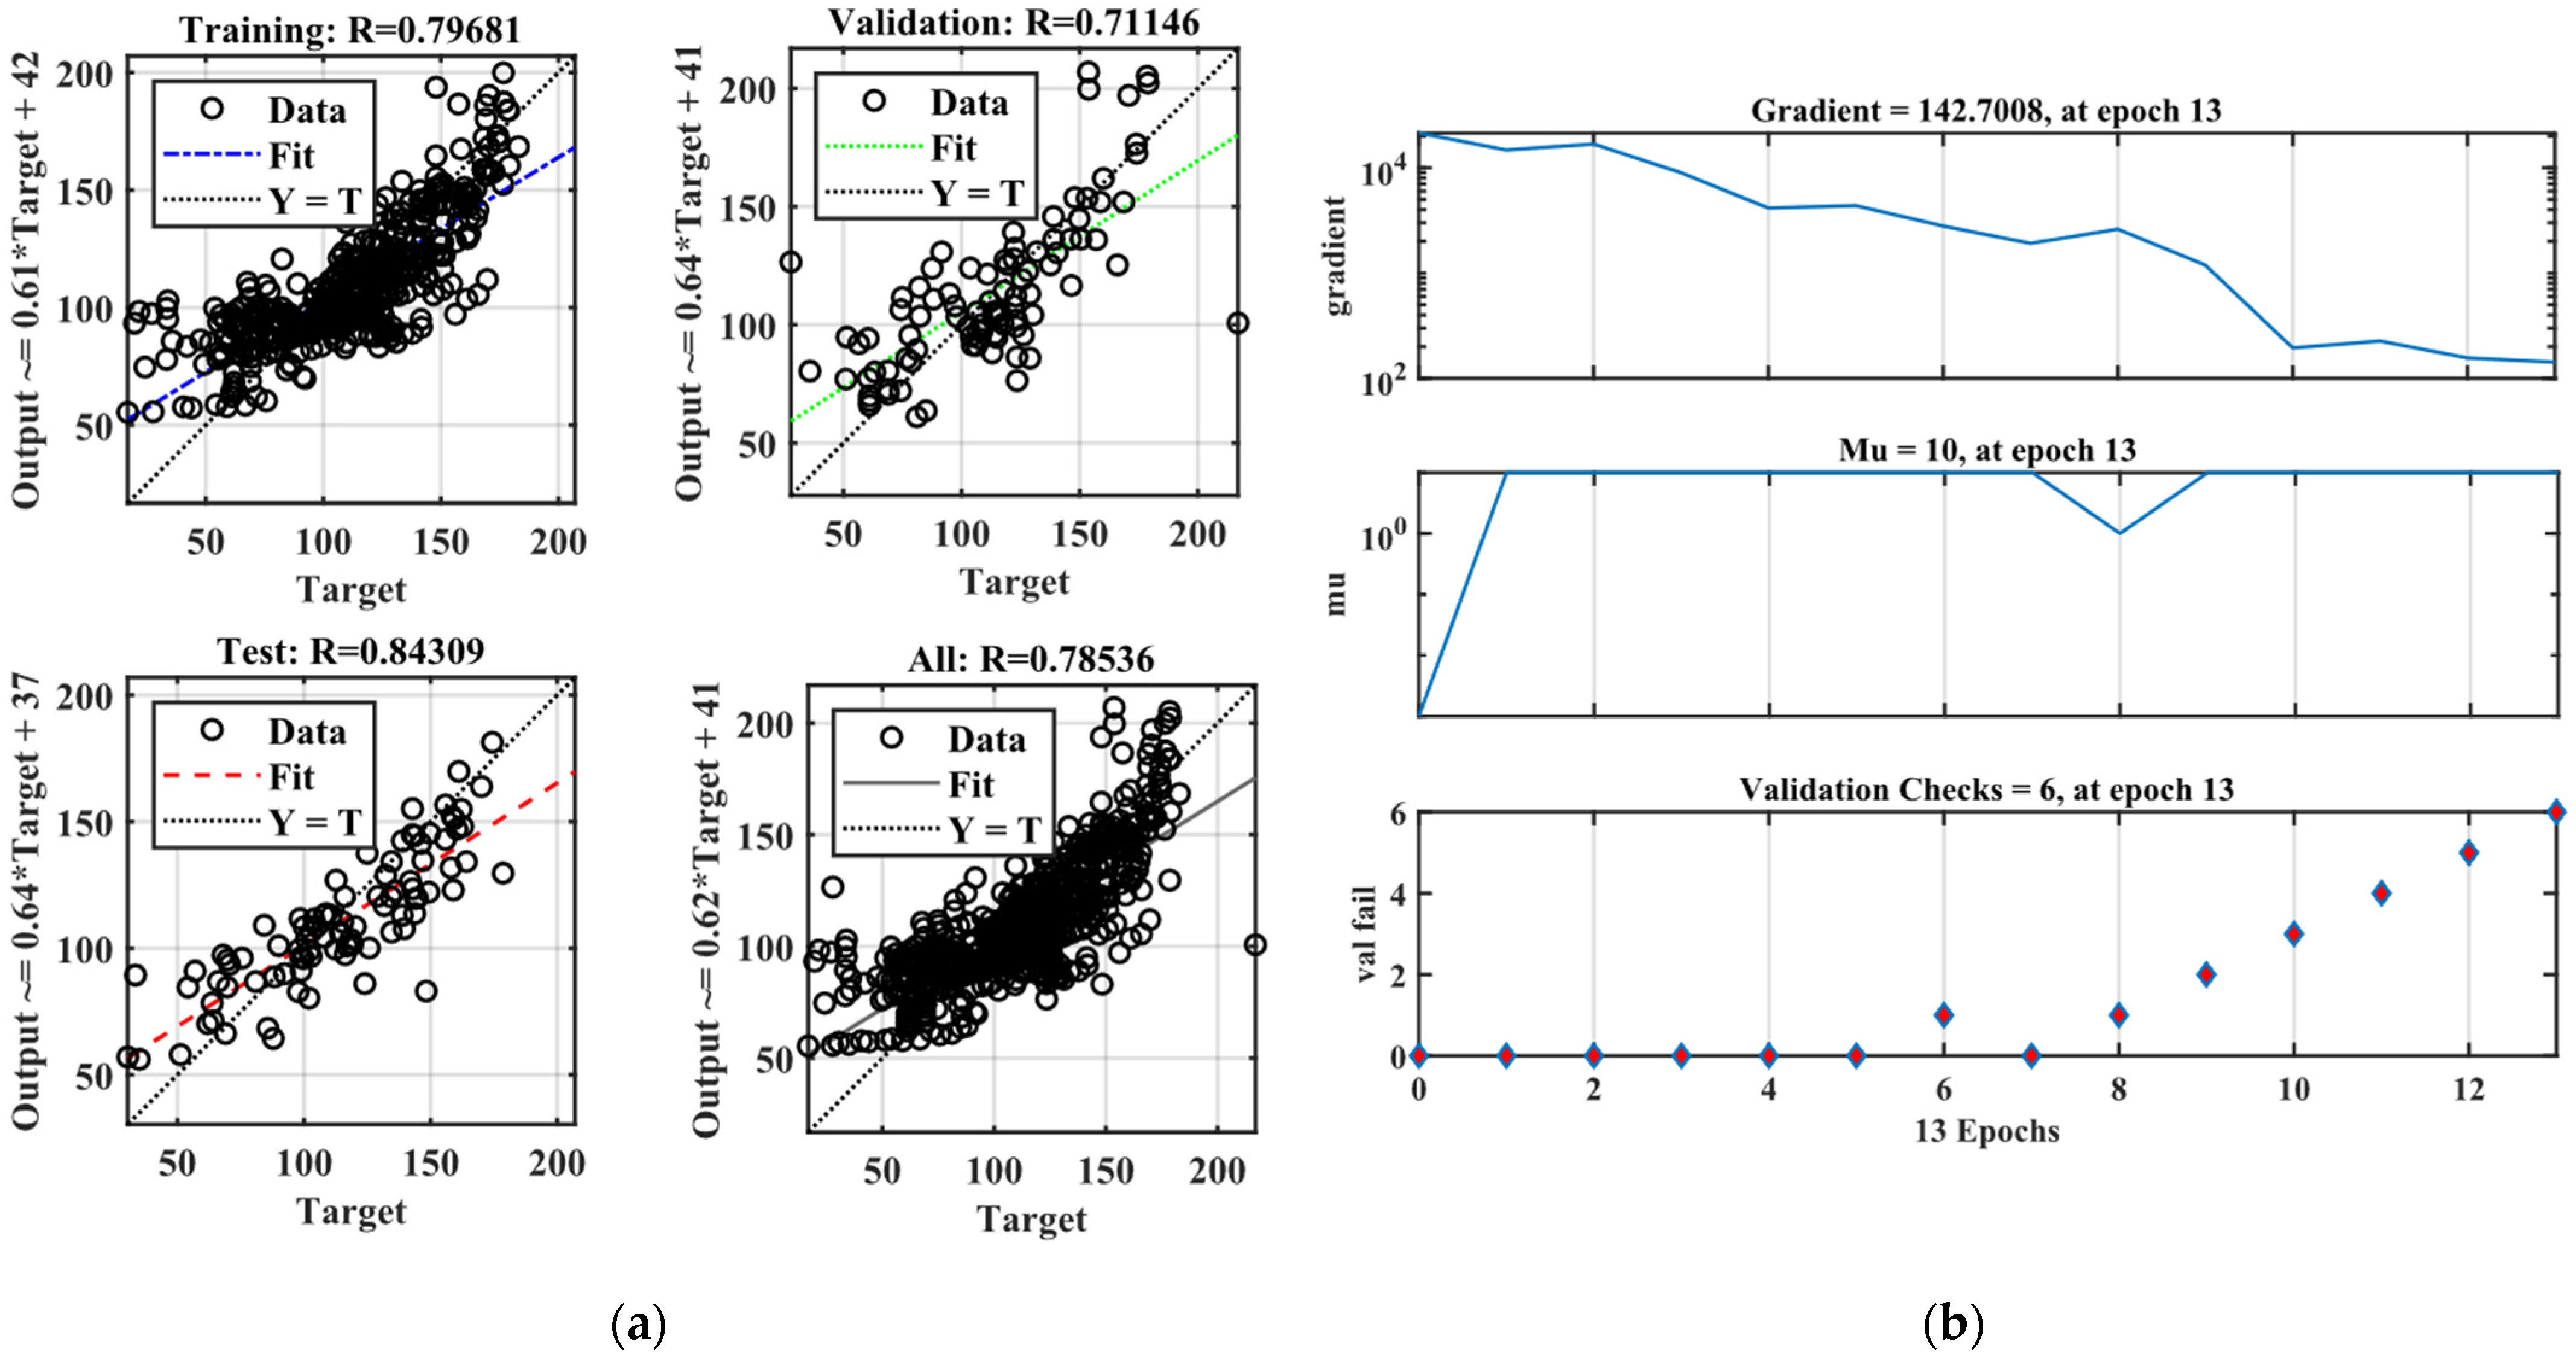
Training targets, training outputs, validation targets, validation outputs, test targets, test outputs, errors, and responses are the main components of Figure 8. The output values from MATLAB models closely match their target values, as shown in Figure 8, indicating their capacity to comprehend the relationship between the input and output parameters and their ability to generalize [37]. The accuracy of the predicted results at epoch 42 compared to the rest of the epochs is shown in Figure 7, Figure 9a and Figure 10a. The correlation coefficient (R) decreased by 1.58 and 16.9% for the 59 and 13 epochs, respectively, while the mean square error (MSE) increased by 28.37% and 113.42% for the 59 and 13 epochs, respectively, compared to the 42 epochs. The results were consistent in terms of the increase in [38]. The training case for the ANN model for verification processes at 13 and 59 epochs was also highlighted in Figure 9b and Figure 10b. The results were re-predicted at epoch 59, and the predicted results were lower than at epoch 42, as shown in Figure 9a. The R coefficient at epoch 59 was 0.96586, 0.94281, 0.84141, and 0.93965 for training, validation, testing, and cumulative. There was an increase in the R coefficient for training and validation by 0.26% and 2.015%, but there was a decrease in the R for the test by 11.18%, and this decrease was the reason for the decrease in the R for the cumulative by 1.58% compared with epoch 42. The training state of the ANN model is shown in Figure 5b, which also indicates that the test was terminated at epoch 59 and that errors are repeated 6 times after epoch 0, similar to epoch 42. For epoch 13, the decrease in the R coefficient was noticeable compared to epoch 42 and 59. The R coefficient at epoch 13 was 0.79681, 0.71146, 0.84309, and 0.78536 for training, validation, testing, and cumulative, as shown in Figure 9a. There was a decrease in the R coefficient for training, validation, testing, and cumulative by 16.65%, 21.273%, 9.285%, and 16.9% compared with epoch 42. The training state of the ANN model is shown in Figure 9b, which also indicates that the test was terminated at epoch 13 and that errors are repeated 6 times after epoch 0, similar to epochs 42 and 59.

3.2. RSM Model

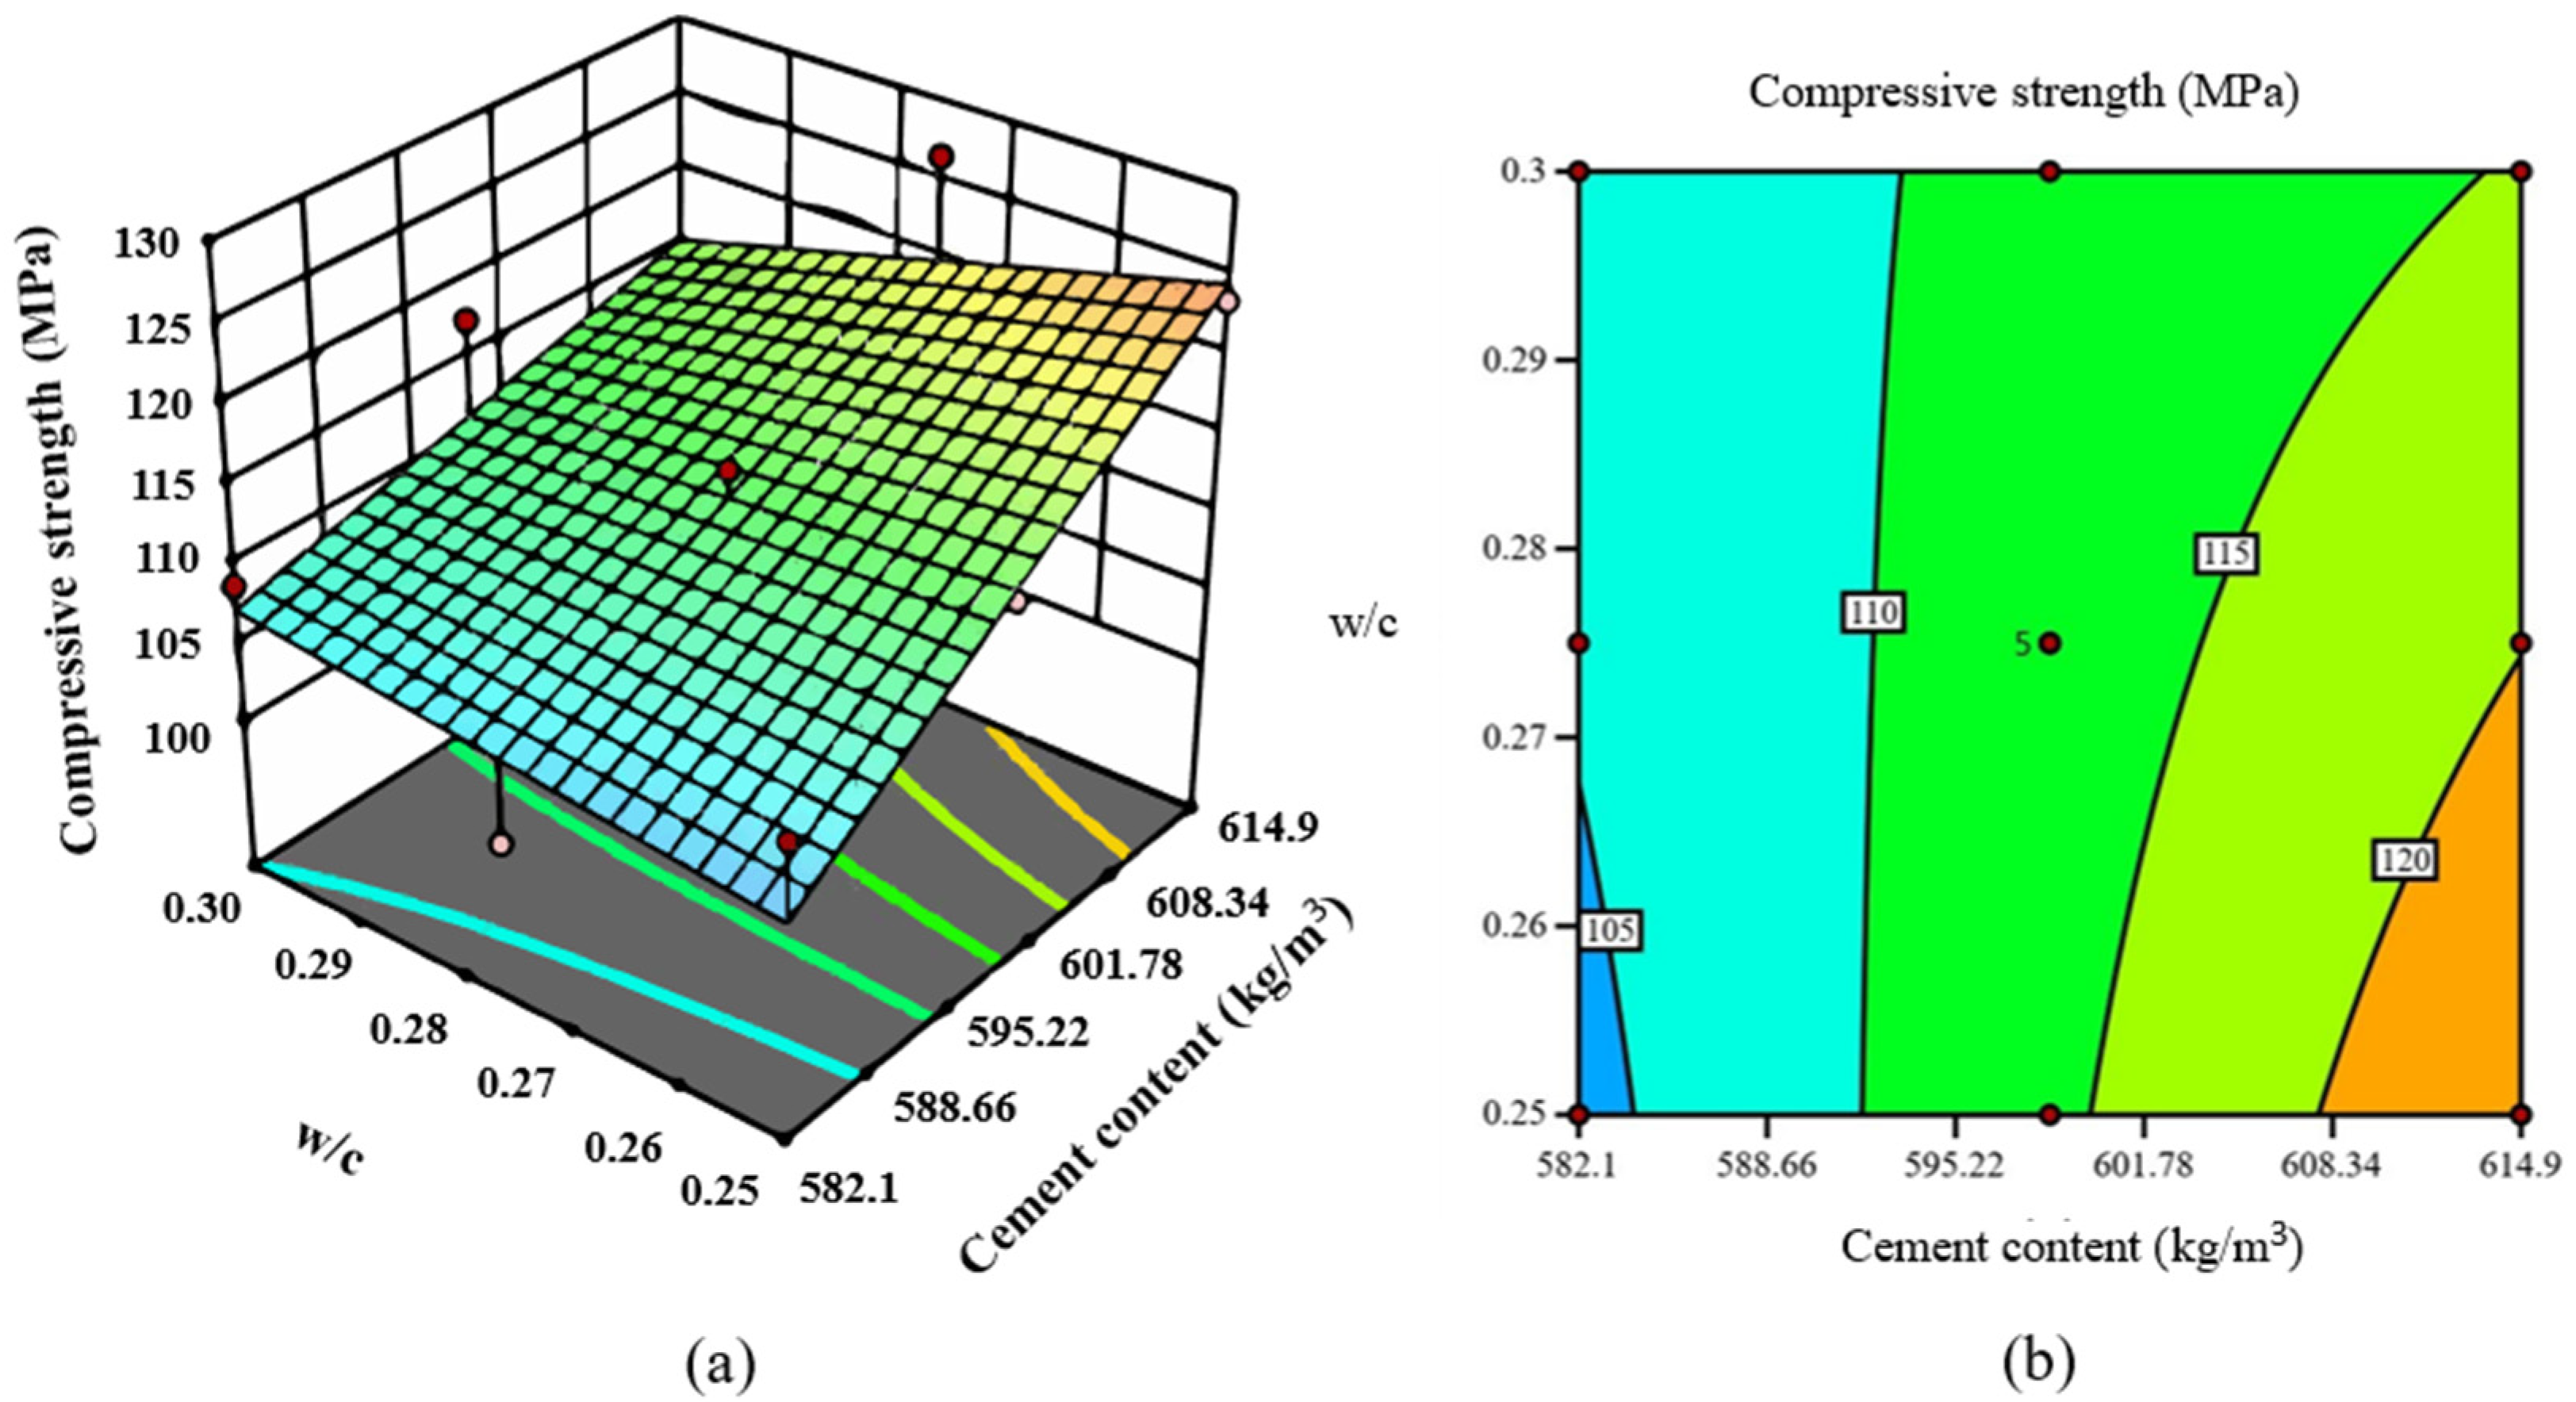
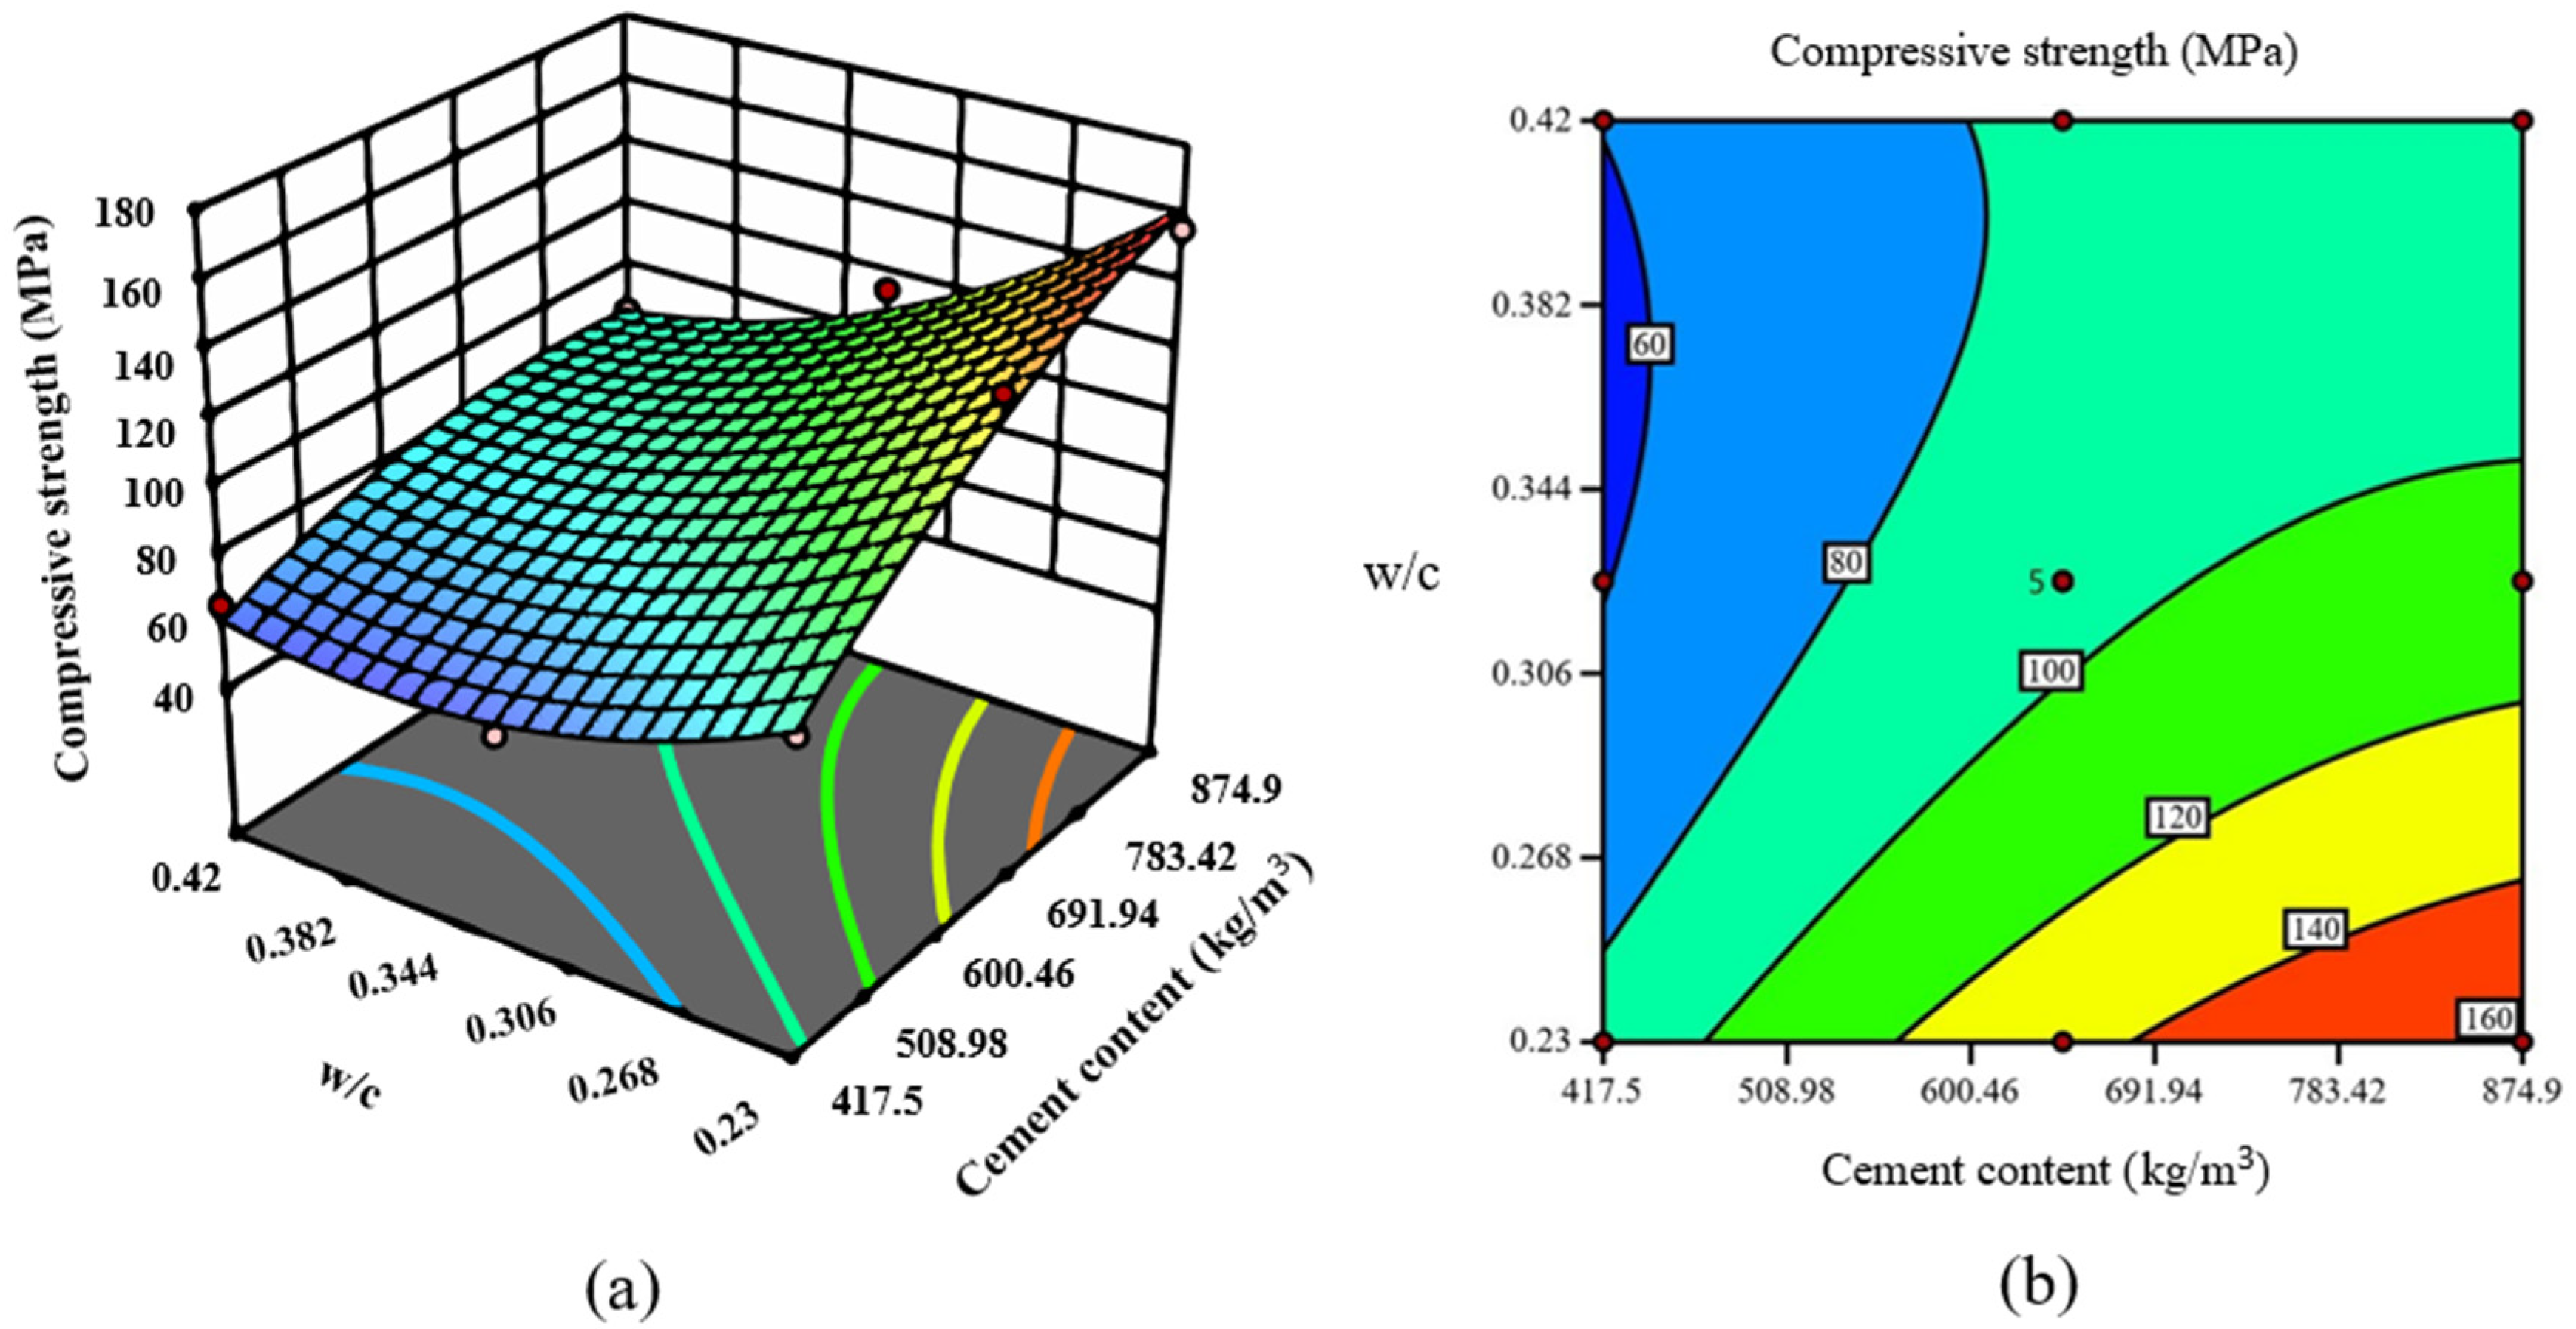
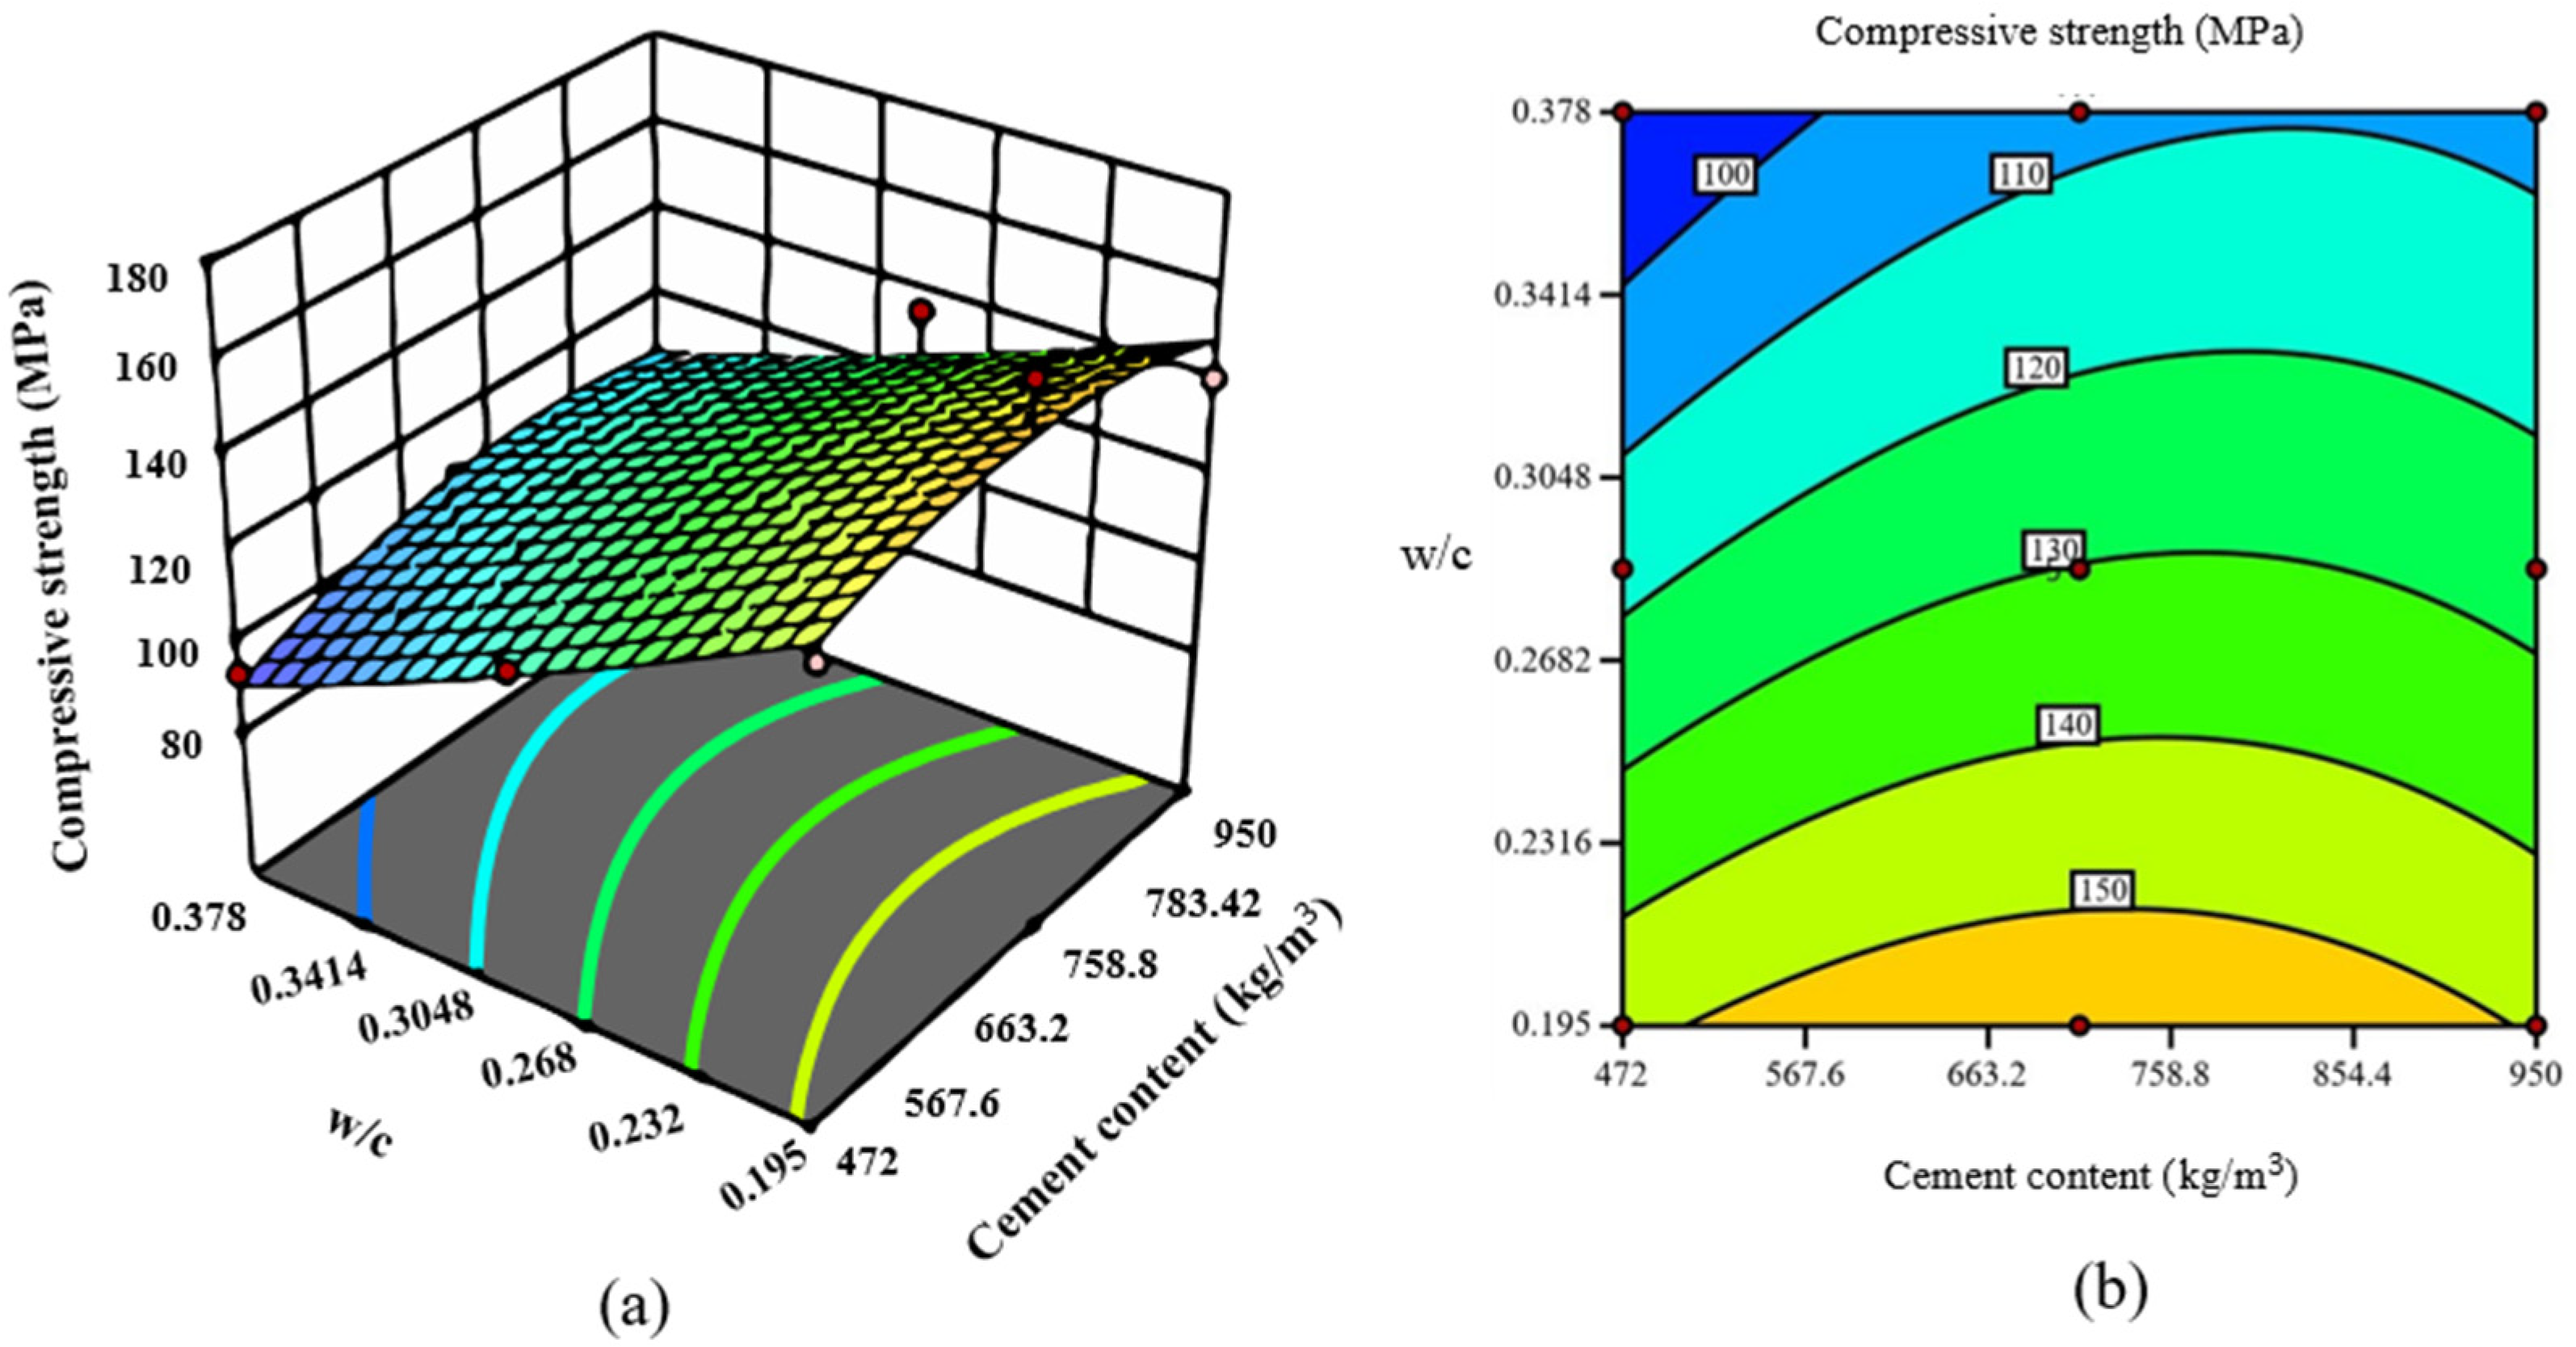
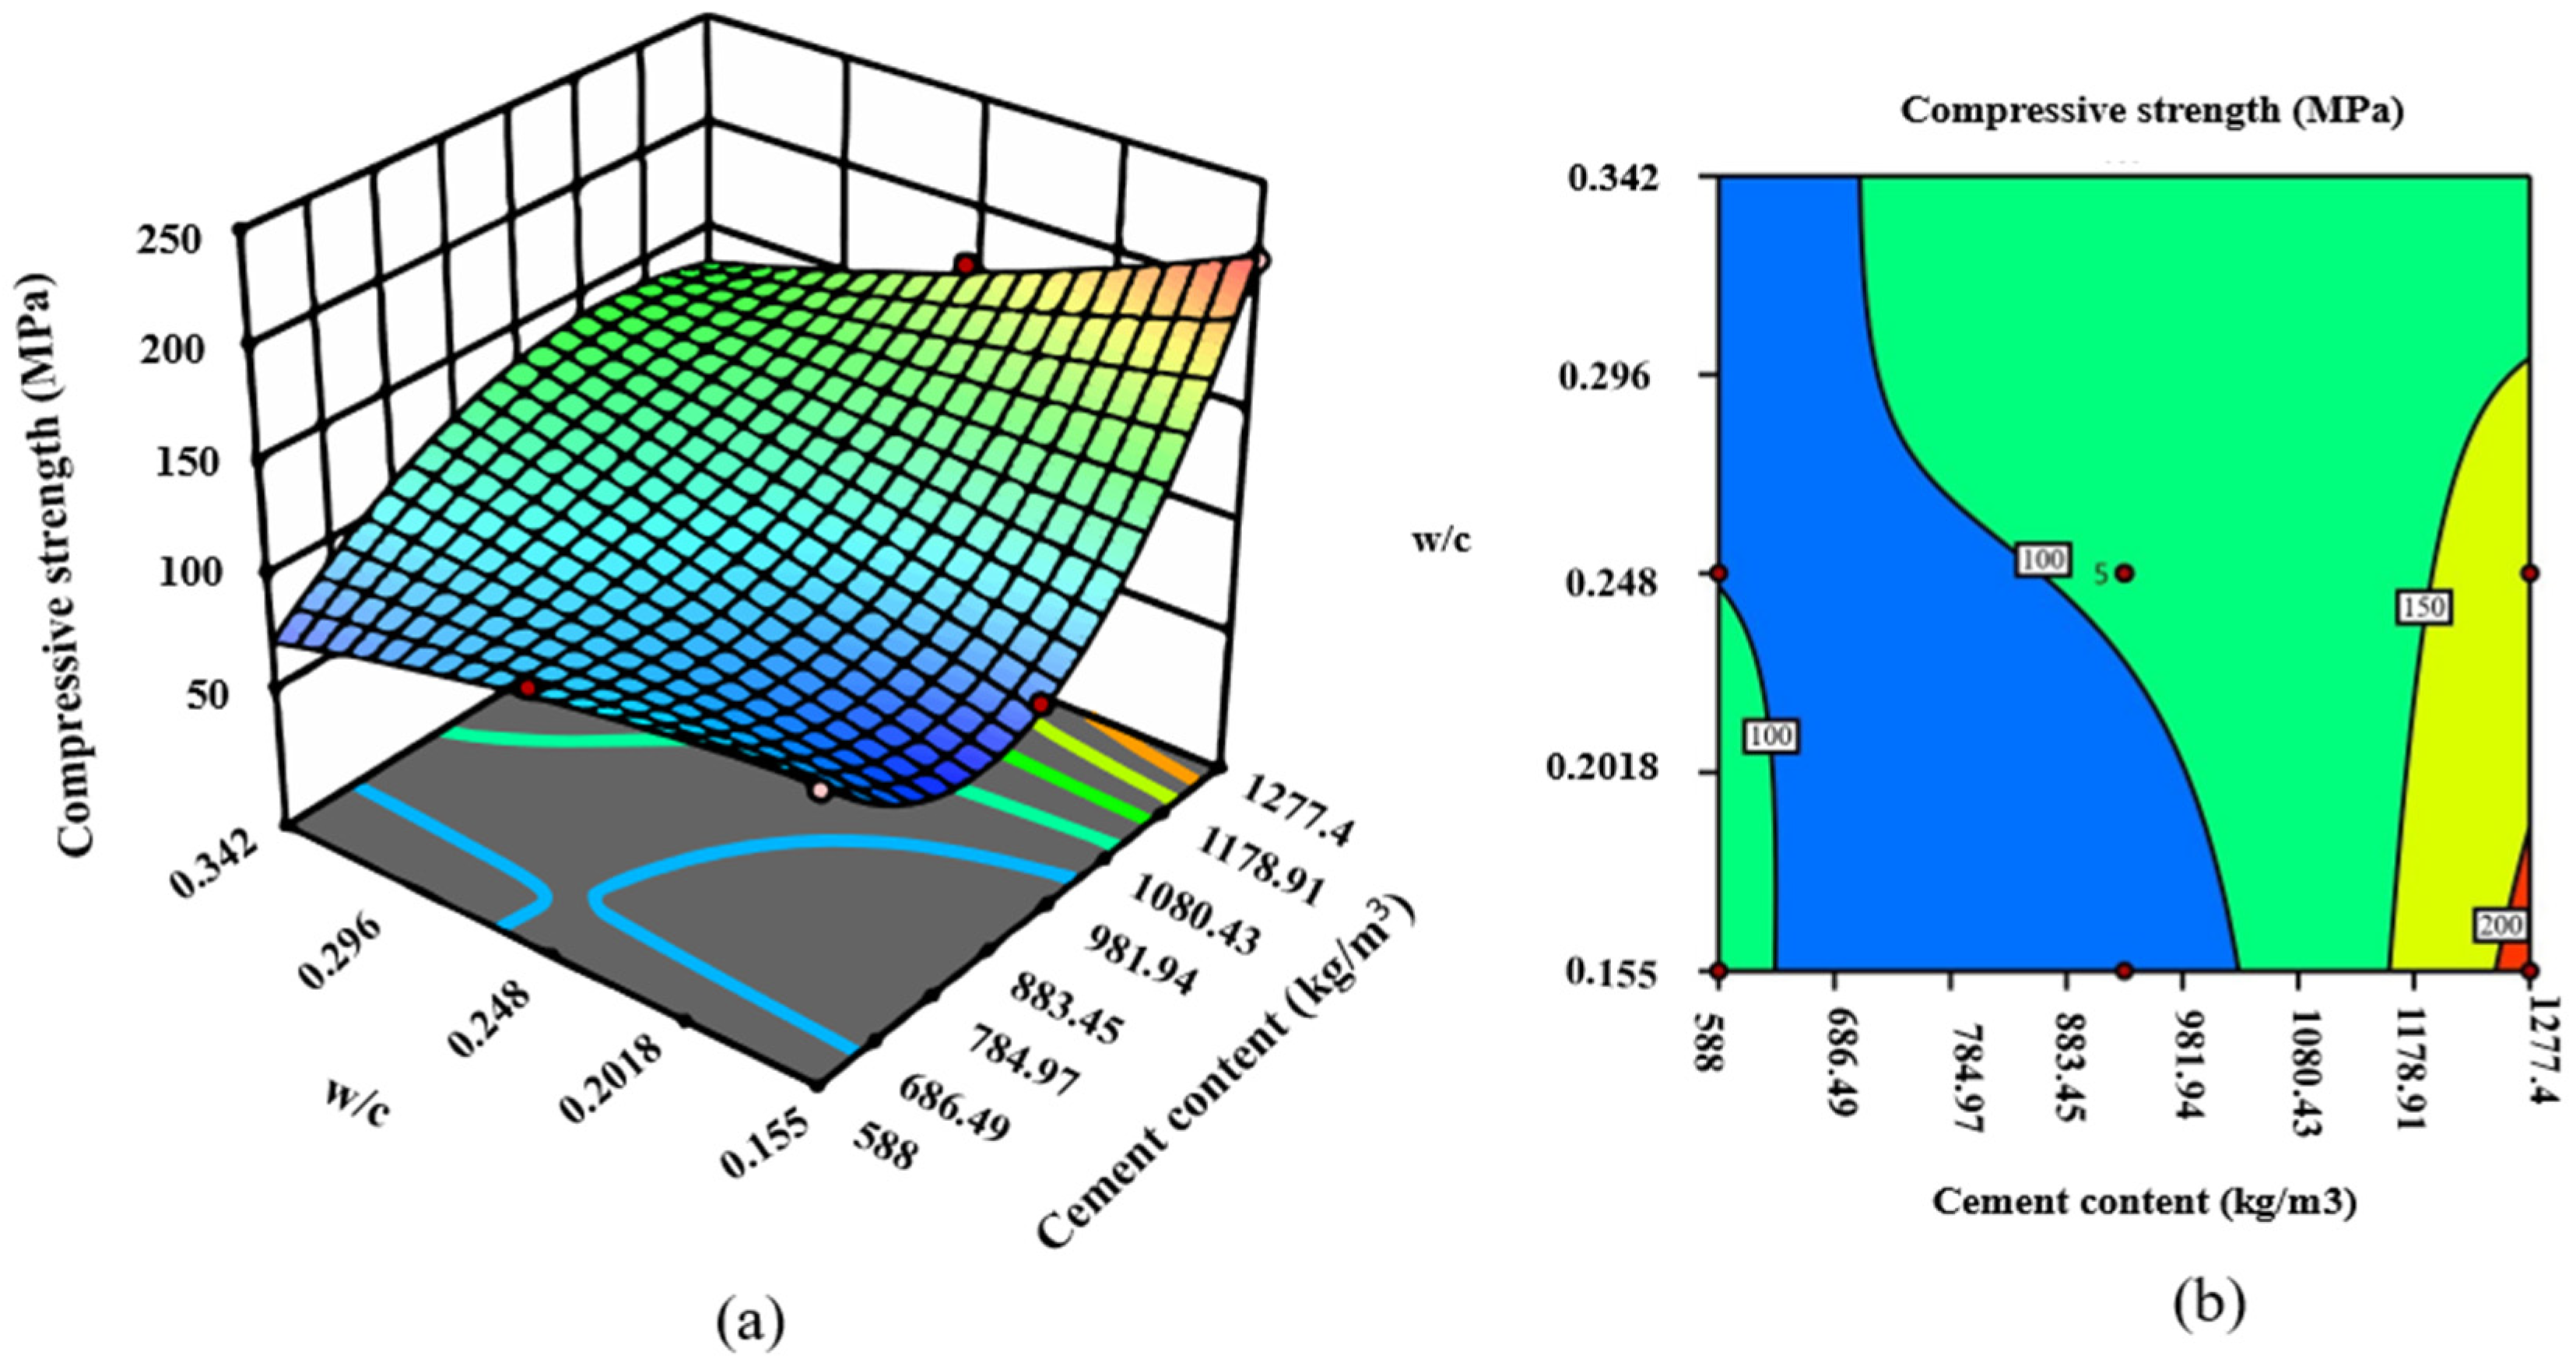
To assess the validity of the polynomial regression model and determine the significance of the components to the response, the response surface model’s ANOVA can be performed [33]. The study was carried out, according to the CCD, to predict the compressive strength of concrete mixtures [16,39,40] and to investigate the effects of the 22 variables. To simplify the study, 626 mixtures were divided into 10 responses according to variables as show in Table S2. For each of the three numerical factors, a total of 20 experimental points, or runs, are suggested: 5 runs for factorial points without replication, 4 runs for axial points without replication, and 1 point with 4 replications for the center point [27]. ANOVA comprises the following: F-value, lack-of-fit analysis, and coefficient of determination [41]. The degree of difference between the predicted and experimental values is expressed by the coefficient of determination (R2), which has three characteristics: predicted, adjusted, and R2 [41]. In R2, 0 represents the worst possible situation, and 1 represents the optimum state. The predicted value and the measured value coincide well if the model’s lack-of-fit F-value is smaller than the crucial F-value, indicating that the model’s lack of fit is not significant [42]. When compressive strength is evaluated using ANOVA, p-values of 0.0405, 0.0001, 0.01, 0.0001, 0.003, 0.0007, 0.0007, 0.0001, 0.0001, and 0.0001, respectively, are less than 0.05, indicating that the model is highly significant [43]. Table 3 and Figure 11, Figure 12, Figure 13, Figure 14, Figure 15, Figure 16, Figure 17, Figure 18, Figure 19 and Figure 20a show the maximum and minimum compressive strengths for responses 1 to 10.
Using ANOVA, Figure 11, Figure 12, Figure 13, Figure 14, Figure 15, Figure 16, Figure 17, Figure 18, Figure 19 and Figure 20 show a 3D–2D pattern of compressive strength models of responses 1 to 10. An increase in cement content from 582.1 to 614.9 kg/m3 led to an increase in compressive strength of 19.97%, as shown in Figure 11a. This increase in compressive strength is a result of the high cement content contributing to the formation of dense C-S-H, which provides a dense microstructure [44]. The decrease in w/c also played a role in affecting the compressive strength [45]. The increase in compressive strength was 4.9%. The reason for the mentioned increase was that w/c = 0.3 was the appropriate amount to complete the hydration process, as shown in Figure 11b. p-values less than 0.0500 indicate model terms are significant [33]. In this case, A is a significant model term [46]. The lack-of-fit F-value of 1.65 implies that the lack of fit is not significant relative to pure error. There is a 32.35% chance that a lack-of-fit F-value this large could occur due to noise. Compressive strength increased by 80.1% with a cement content increase from 417.5 to 874.9 kg/m3, as shown in Figure 12a. The contour lines that follow the cement content axis are denser than those that follow the w/c axis, indicating that the cement content has a bigger effect on compressive strength than the w/c, as shown in Figure 12b. Table 4 shows the decrease in compressive strength of response 2.
The model’s F-value of 63.69 implies the model is significant. There is only a 0.01% chance that an F-value this large could occur due to noise. In this case, A, B, AB, A2, B2 are significant model terms [47]. Values greater than 0.01 indicate the model terms are significant. No significant increases in compressive strength were observed at the cement content of 472 to 950 kg/m3, but a significant increase was observed from 91.9 MPa to 146.829 MPa with a change in w/c from 0.195 to 0.378 as shown in Figure 13a. The contour lines that follow the w/c axis are denser than those that follow the cement content axis, indicating that the w/c has a bigger effect on compressive strength than the cement content, as shown in Figure 13b. The compressive strengths were 109.09, 113.04, 123.45, 133.04, 143.89, and 156.53 MPa at w/c 0.195, 0.2316, 0.2687, 0.3048, 0.3413, and 0.378, respectively, as shown in Figure 14a. There is only a 0.10% chance that an F-value this large could occur due to noise [26]. The contour lines following the axis of w/c and cement content are far apart from each other, indicating that the effect of w/c and cement content is less on the compressive strength, as shown in Figure 14b. The model’s F-value of 170.94 implies the model is significant.
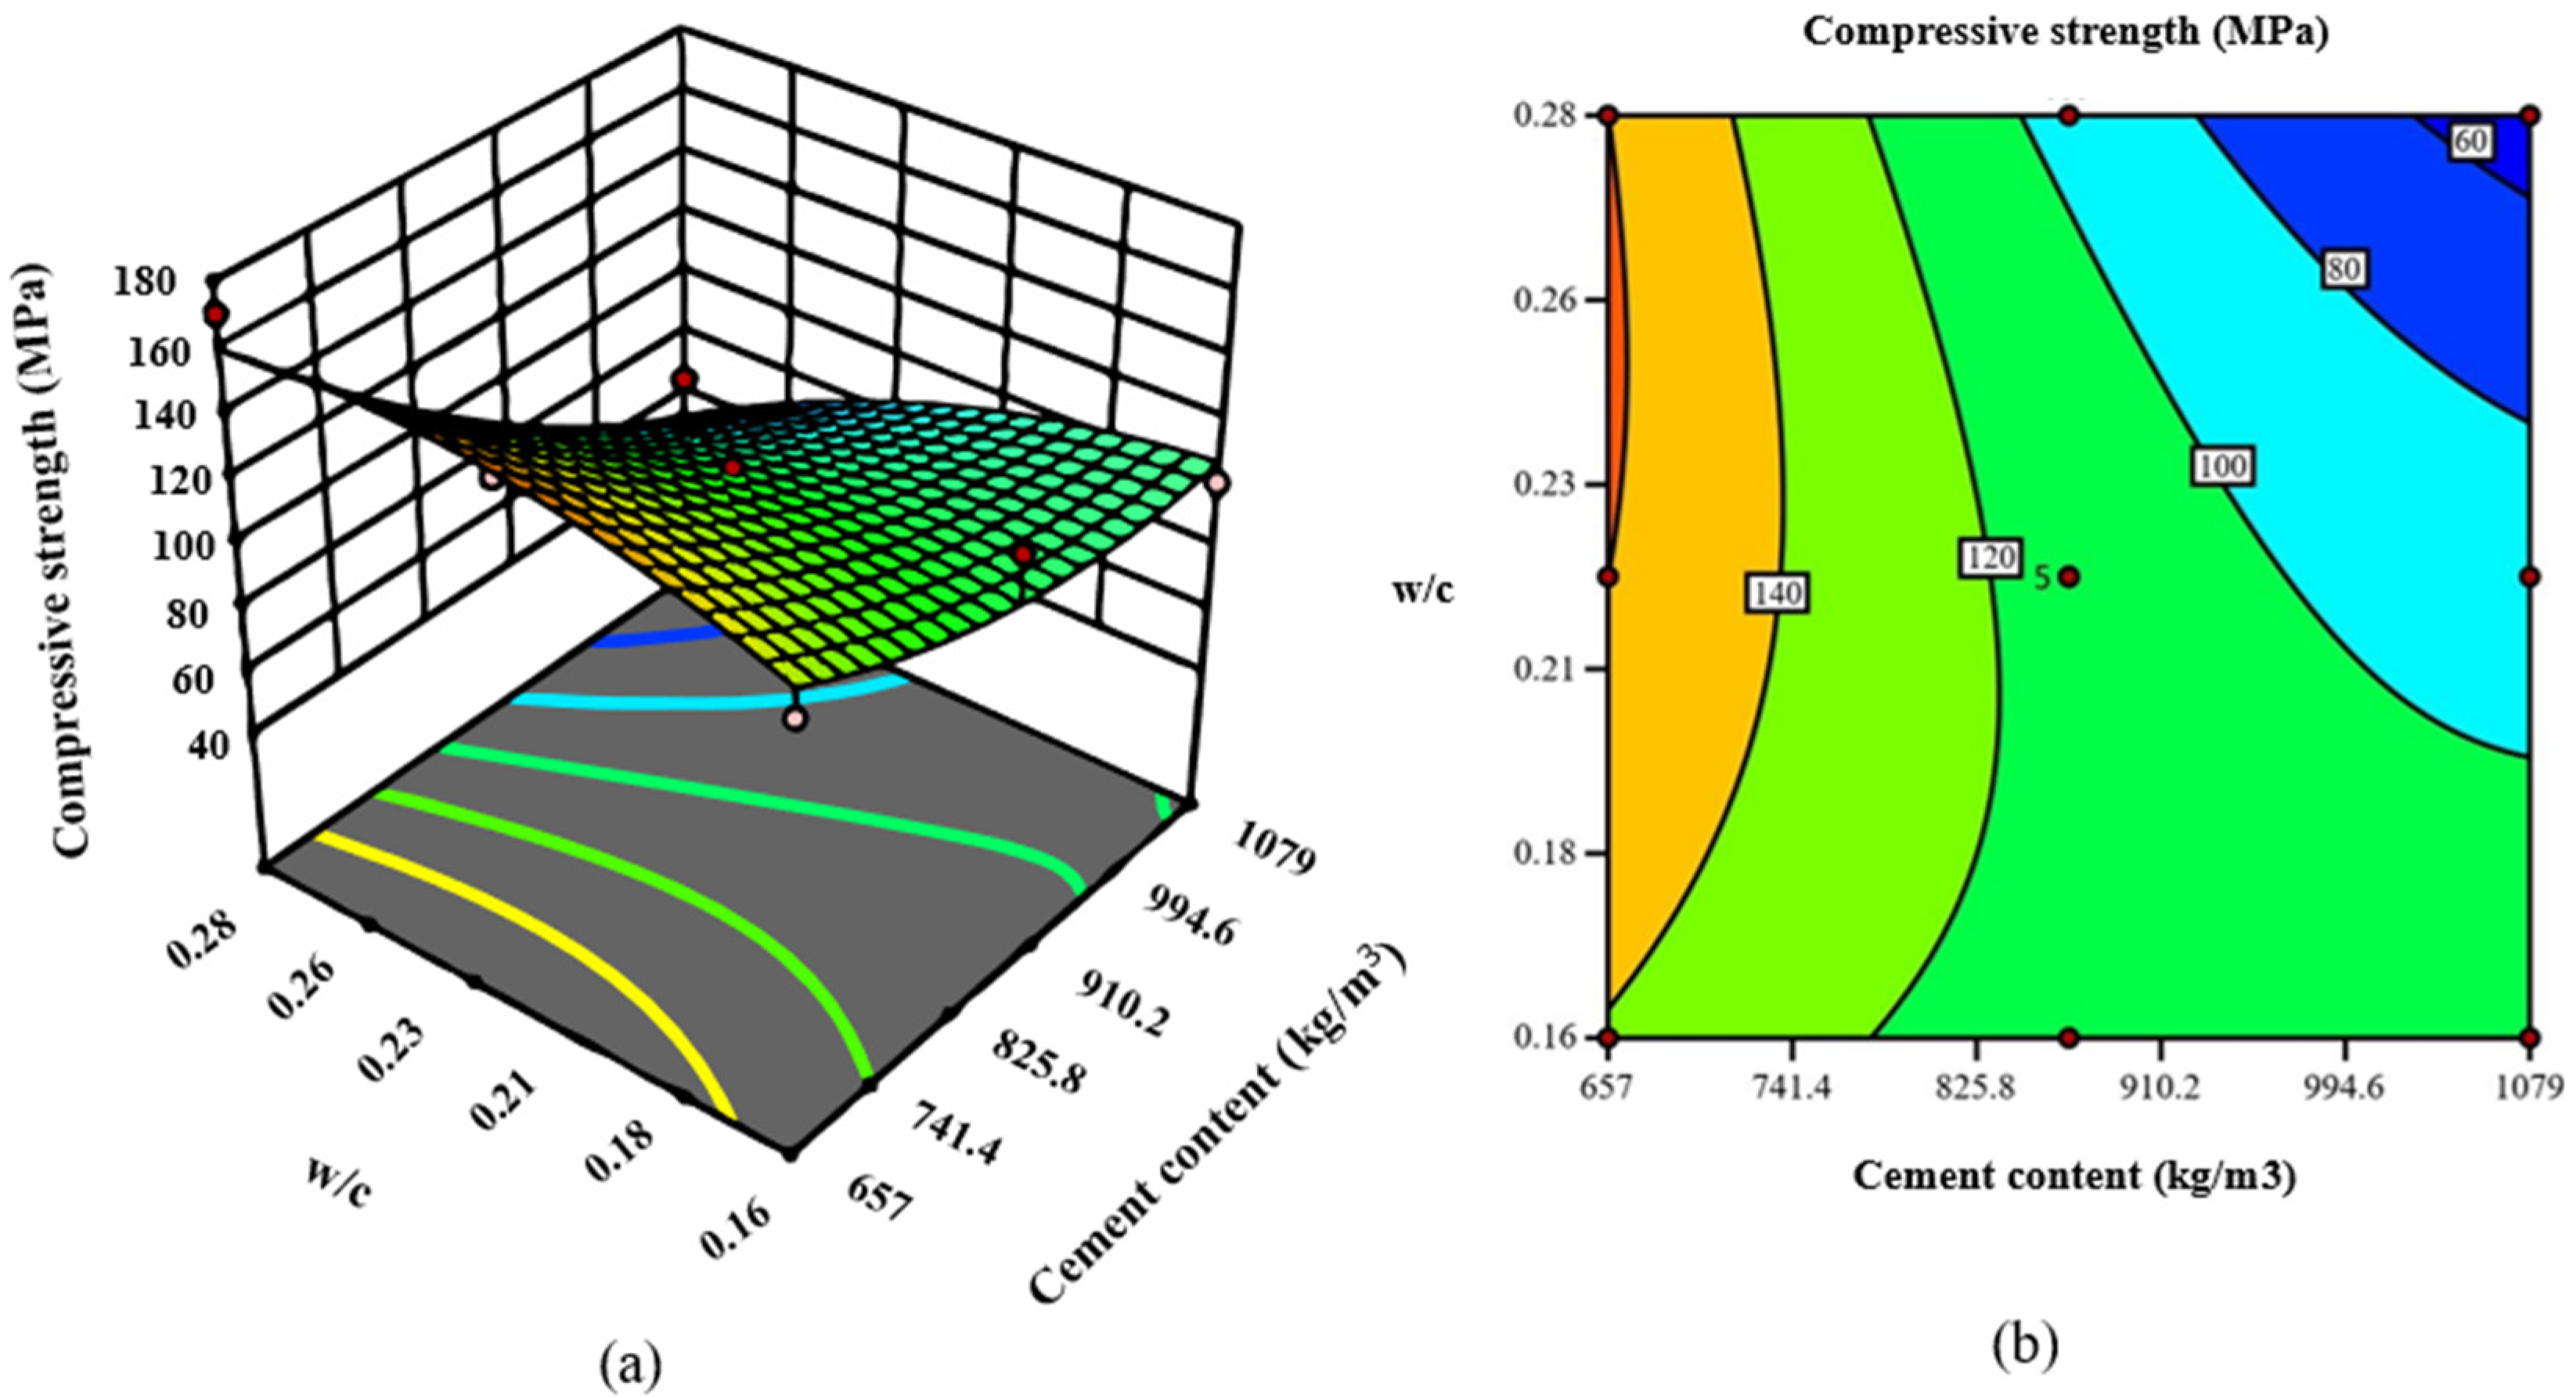
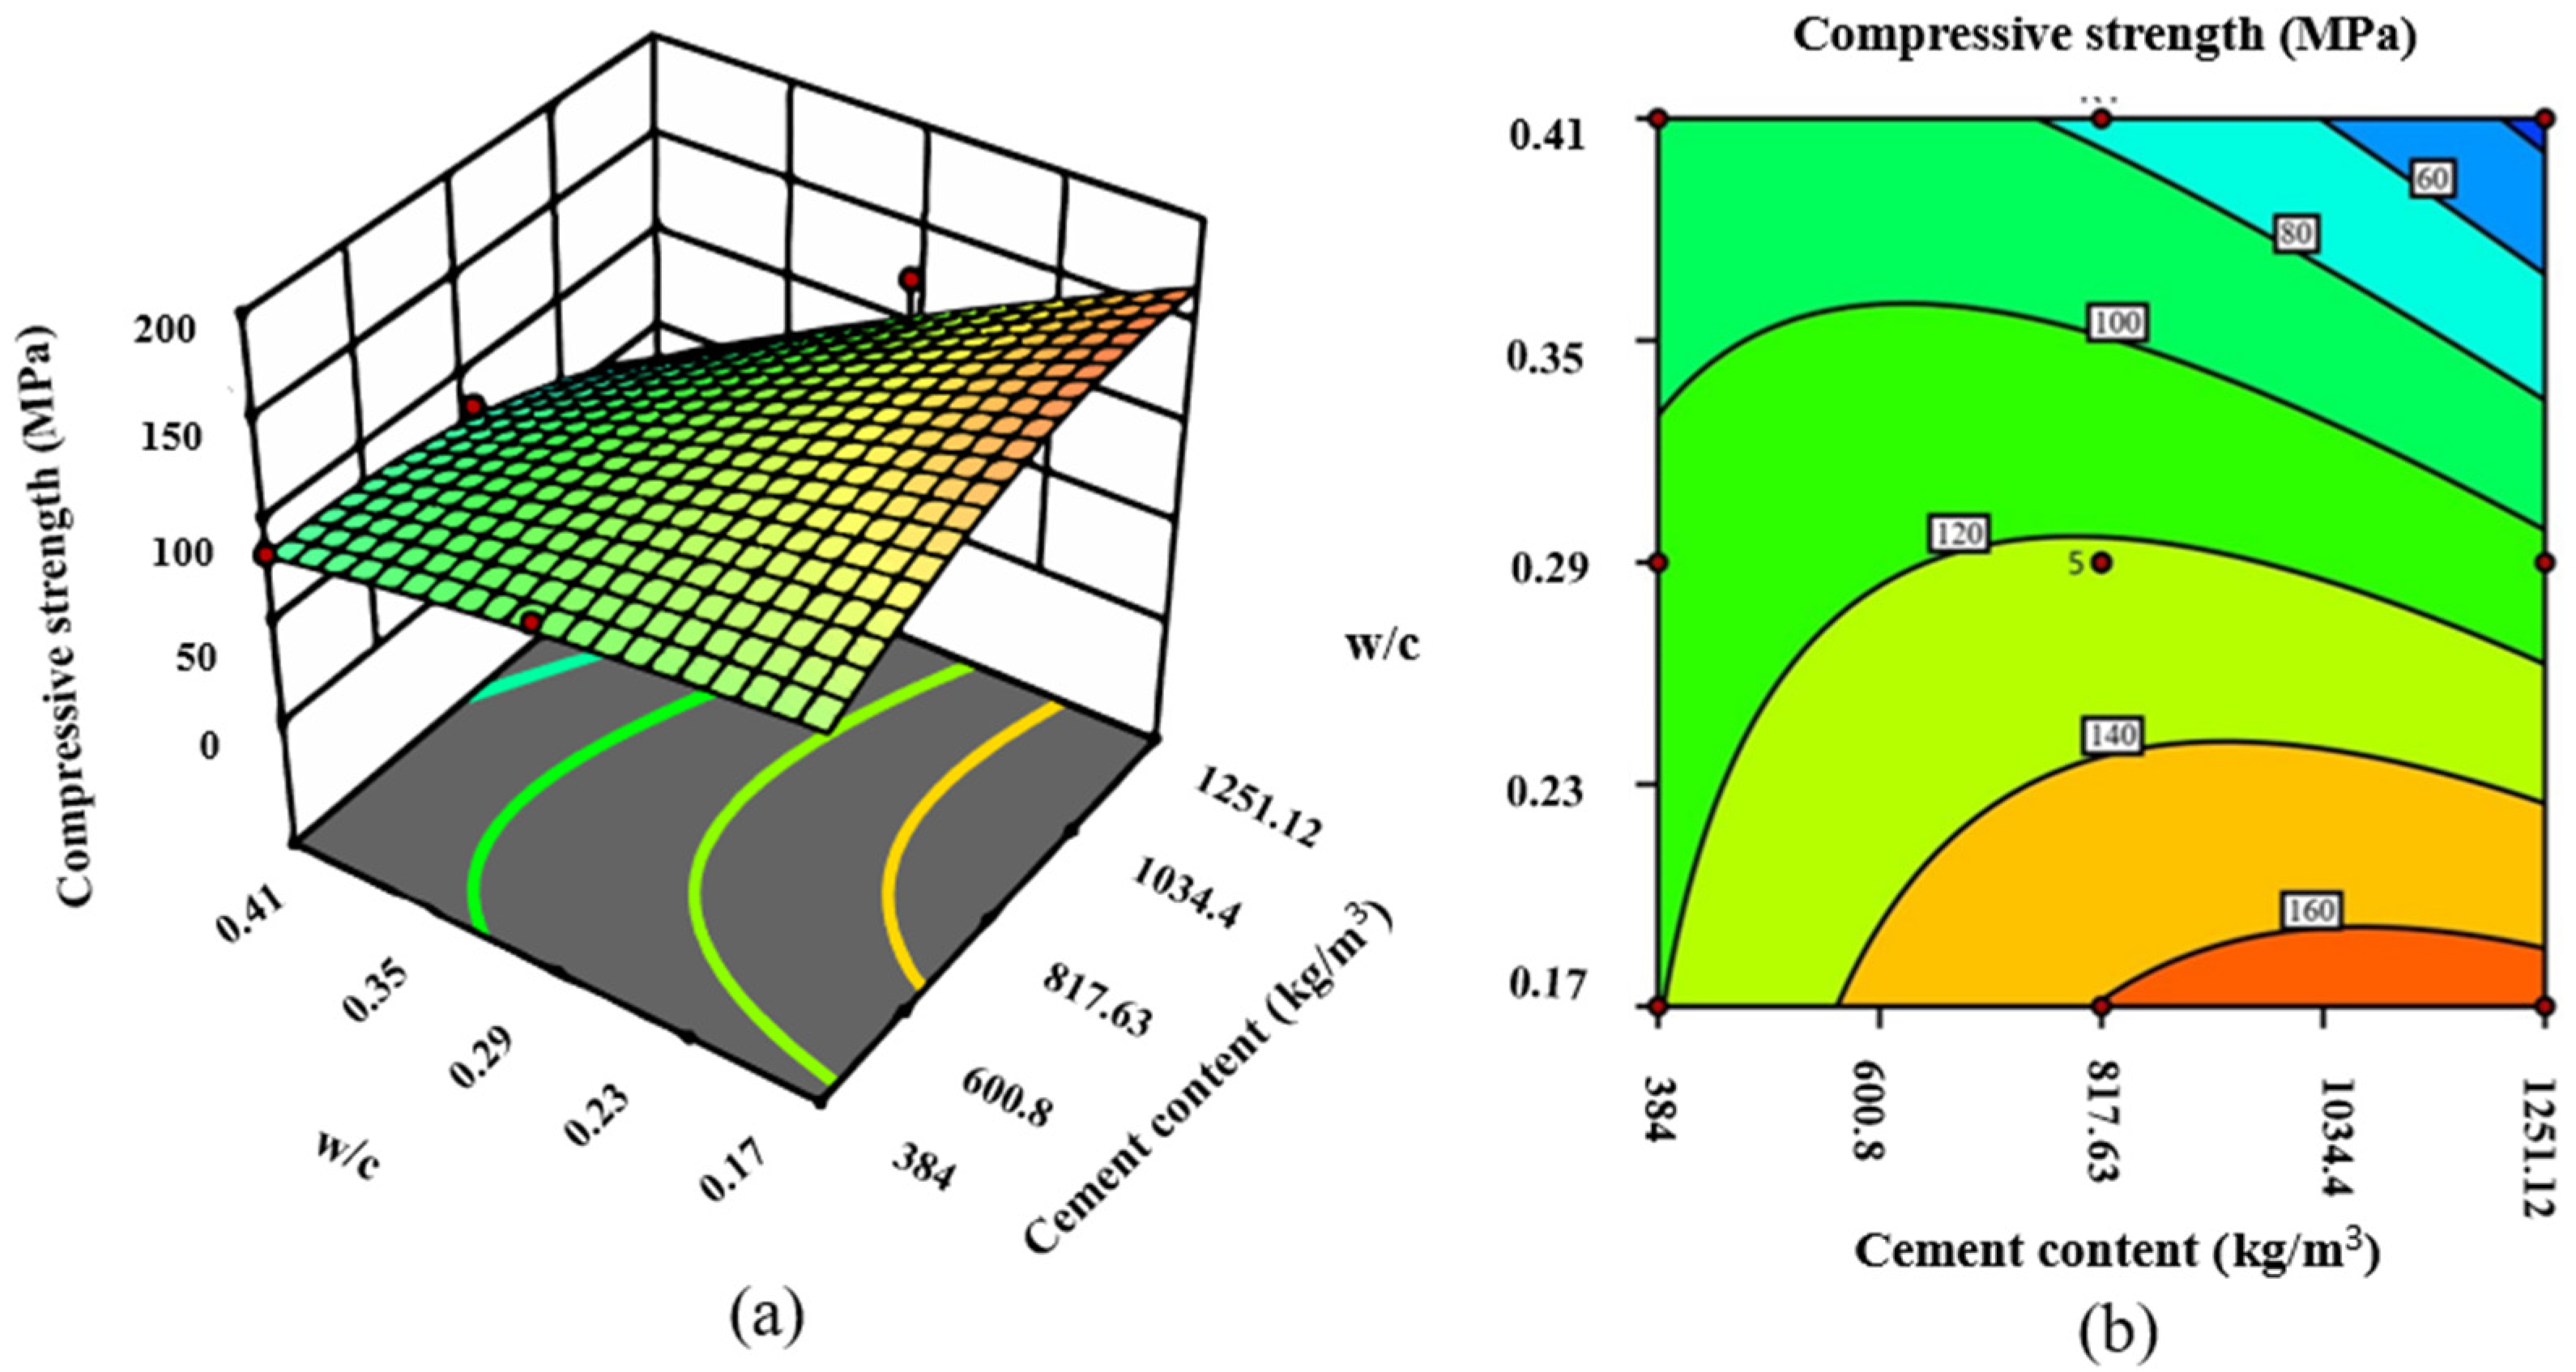
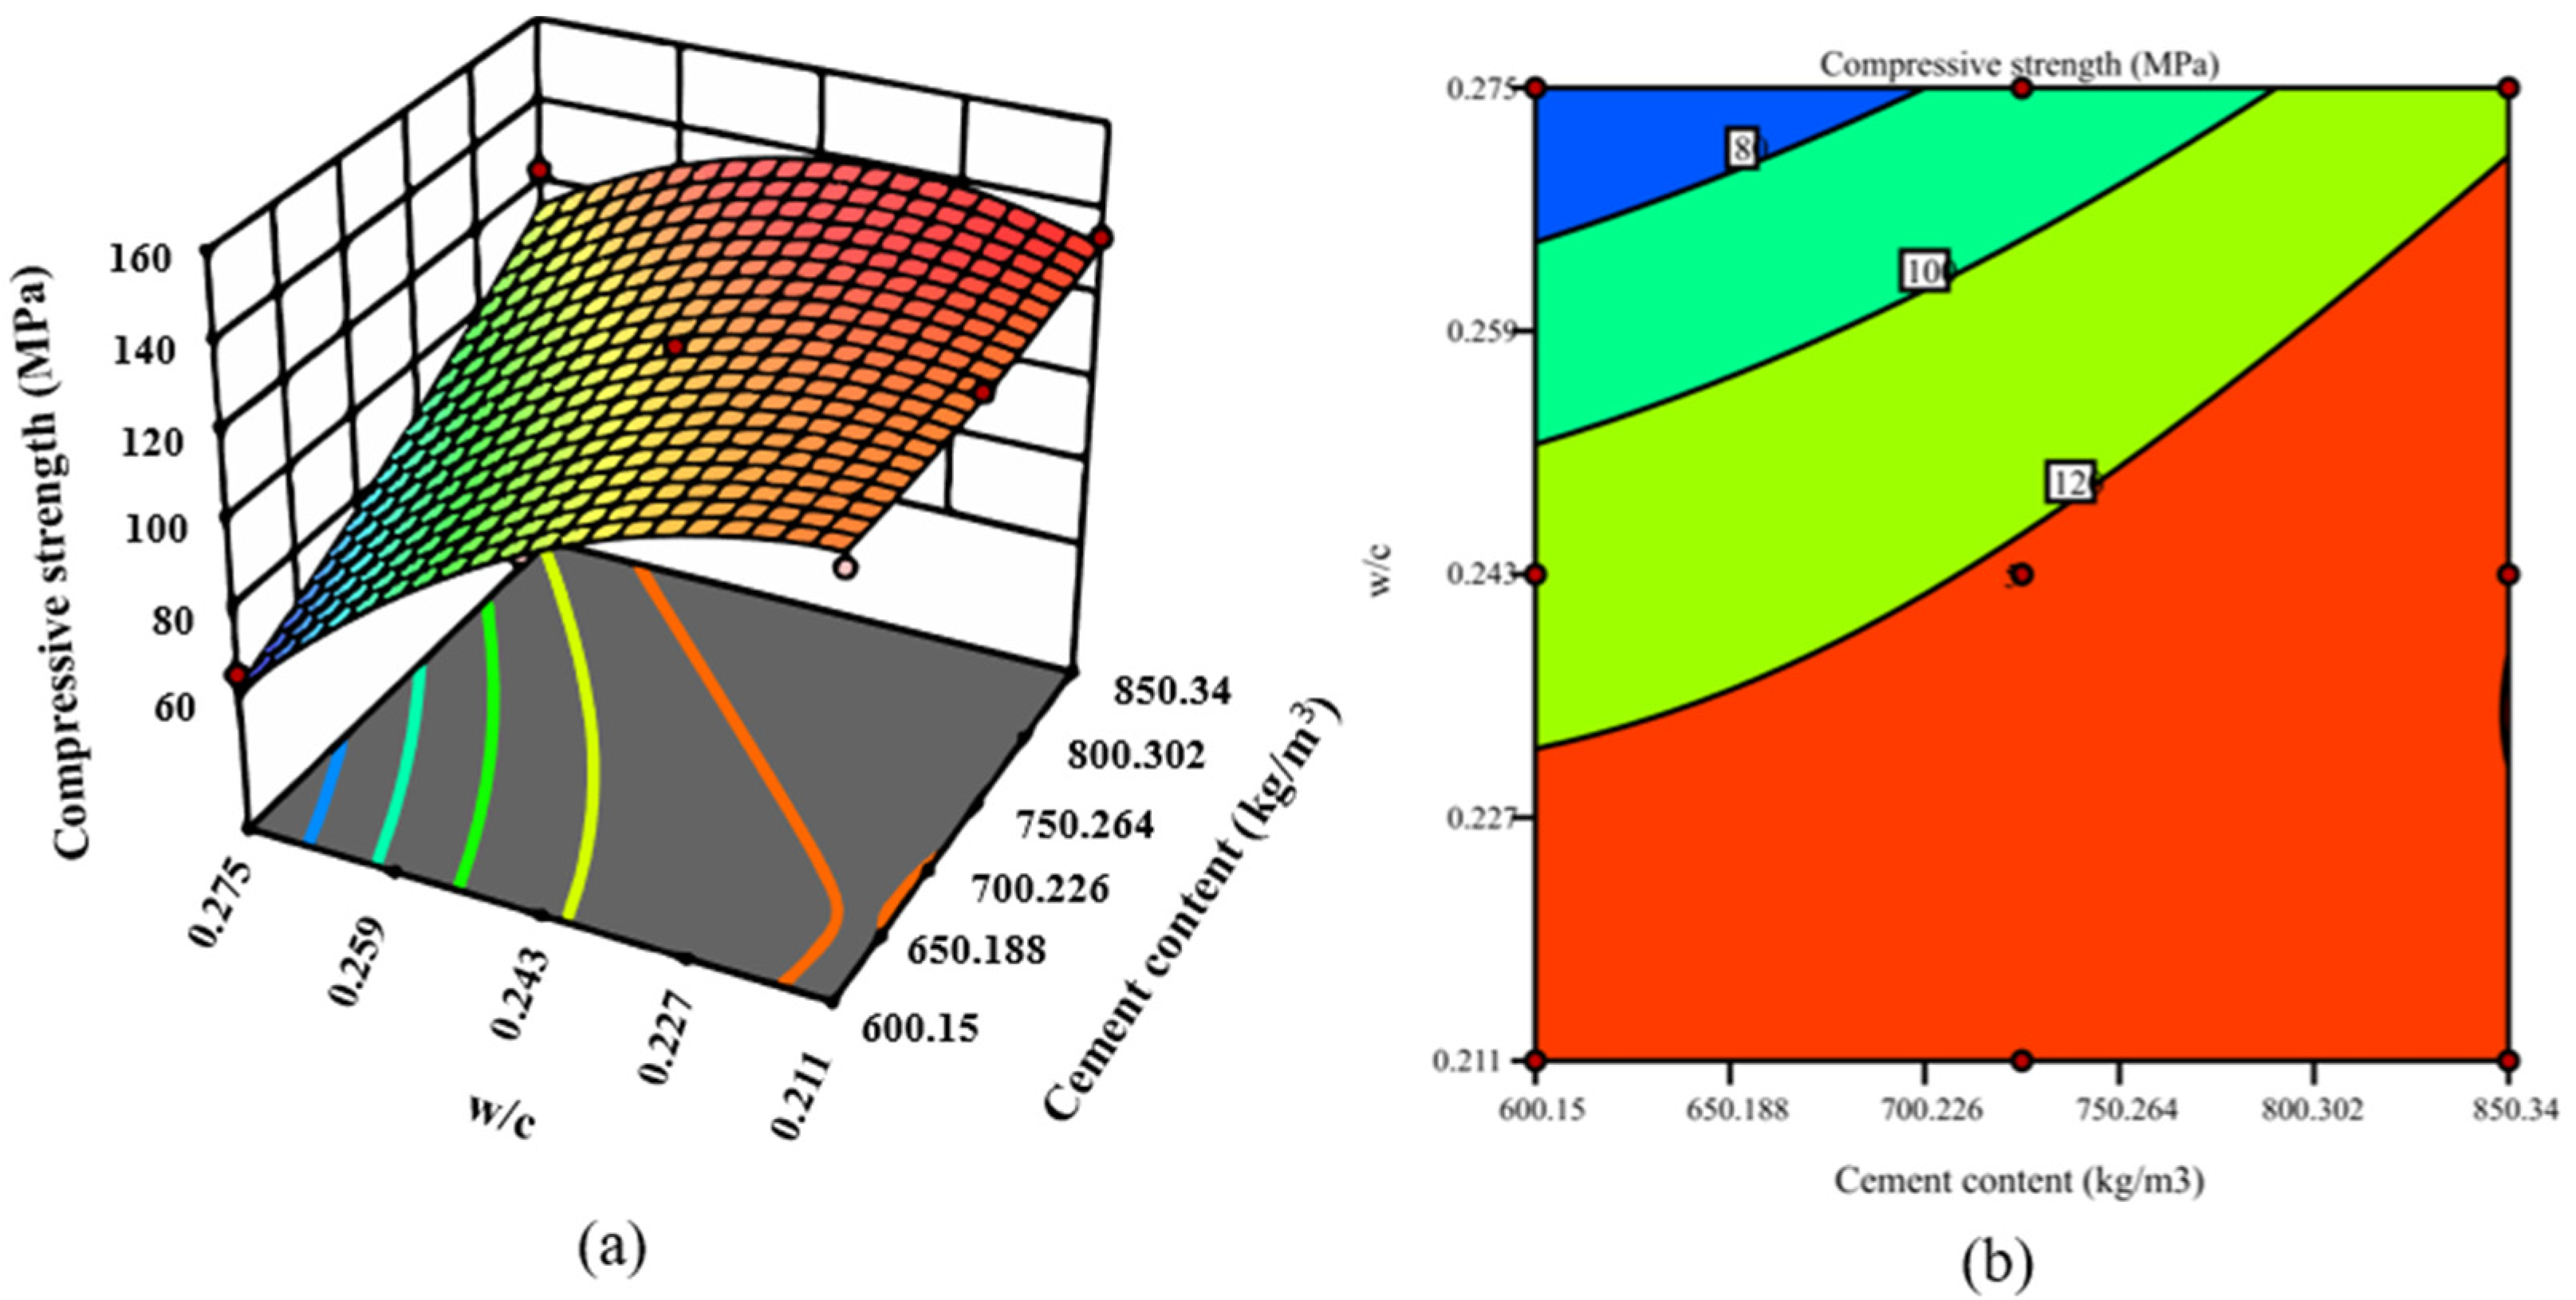
As shown in Figure 11, Figure 12, Figure 13, Figure 14, Figure 15, Figure 16, Figure 17, Figure 18, Figure 19 and Figure 20a, the process order was quadratic [48]. At a cement content of 910.2 kg/m3, the predicted compressive strengths were 111.33, 109.93, 103.8, 96.54, and 84.24 MPa at w/c 0.16, 0.18, 0.21, 0.23, 0.26, and 0.28, respectively, as shown in Figure 15a. Increases in predicted compressive strengths were observed at a cement content of 657 kg/m3 of 7.96, 13.49, 17, 17.2, and 16.1% at w/c 0.18, 0.21, 0.23, 0.26, and 0.28, respectively, compared to w/c 0.16. From Figure 15b, the lowest compressive strength was recorded at a cement content of 910.2 to 1079 kg/m3 and a w/c of 0.26 to 0.28. The predicted compressive strengths for w/c 0.16, 0.23, 0.29, 0.36, and 0.42, respectively, were 143.5, 132.24, 118.2, 101.78, and 85.98 MPa at a cement content of 600.80 kg/m3, as shown in Figure 16a. The contour lines following the axis of w/c and cement content are far apart from each other, indicating that the effect of w/c and cement content is less on the compressive strength, as shown in Figure 16b. Increases in predicted compressive strengths were observed at w/c 0.16 of 20.04, 33.31, 39.79, and 38.93% at cement content 600.8, 817.6, 1034.4, and 1251.2, respectively, compared to cement content 384 kg/m3. As shown in Figure 13 and Figure 14b, the contour lines are spaced apart, which indicates the weak influence of w/c and cement content on compressive strength. These results were similar to [16]. At a cement content of 748 kg/m3, the predicted compressive strengths for w/c 0.2, 0.206, 0.212, 0.218, 0.224, and 0.23 were, respectively, 124.6, 116.62, 107.1, 101.78, and 85.98 MPa, as shown in Figure 17a. The predicted compressive strengths for w/c 0.22, 0.225, 0.29, 0.33, and 0.36, respectively, were 165.28, 158.13, 145.22, 125.29, and 104.58 MPa at a cement content of 792 kg/m3 as shown in Figure 18a. For response 9, the predicted compressive strengths for w/c 0.218, 0.255, 0.291, 0.3275, and 0.364, respectively, were 165, 151.9, 138.45, 118.17, and 81.2 MPa at a cement content of 601.8 kg/m3, as shown in Figure 19a. For response 10, the predicted compressive strengths for w/c 0.2, 0.24, 0.28, 0.32, and 0.36, respectively, were 176, 158.46, 140.6, 127.9, and 121.68 MPa at a cement content of 630 kg/m3, as shown in Figure 20a. The contour lines that follow the w/c axis are denser than those that follow the cement content axis, indicating that the w/c has a bigger effect on compressive strength than the cement content, as shown in Figure 19 and Figure 20b. Table S2 shows the ANOVA table for the compressive strength. For response 10, the model’s F-value of 392.55 implies the model is significant [49].

3.3. Sensitivity Analysis (SA)

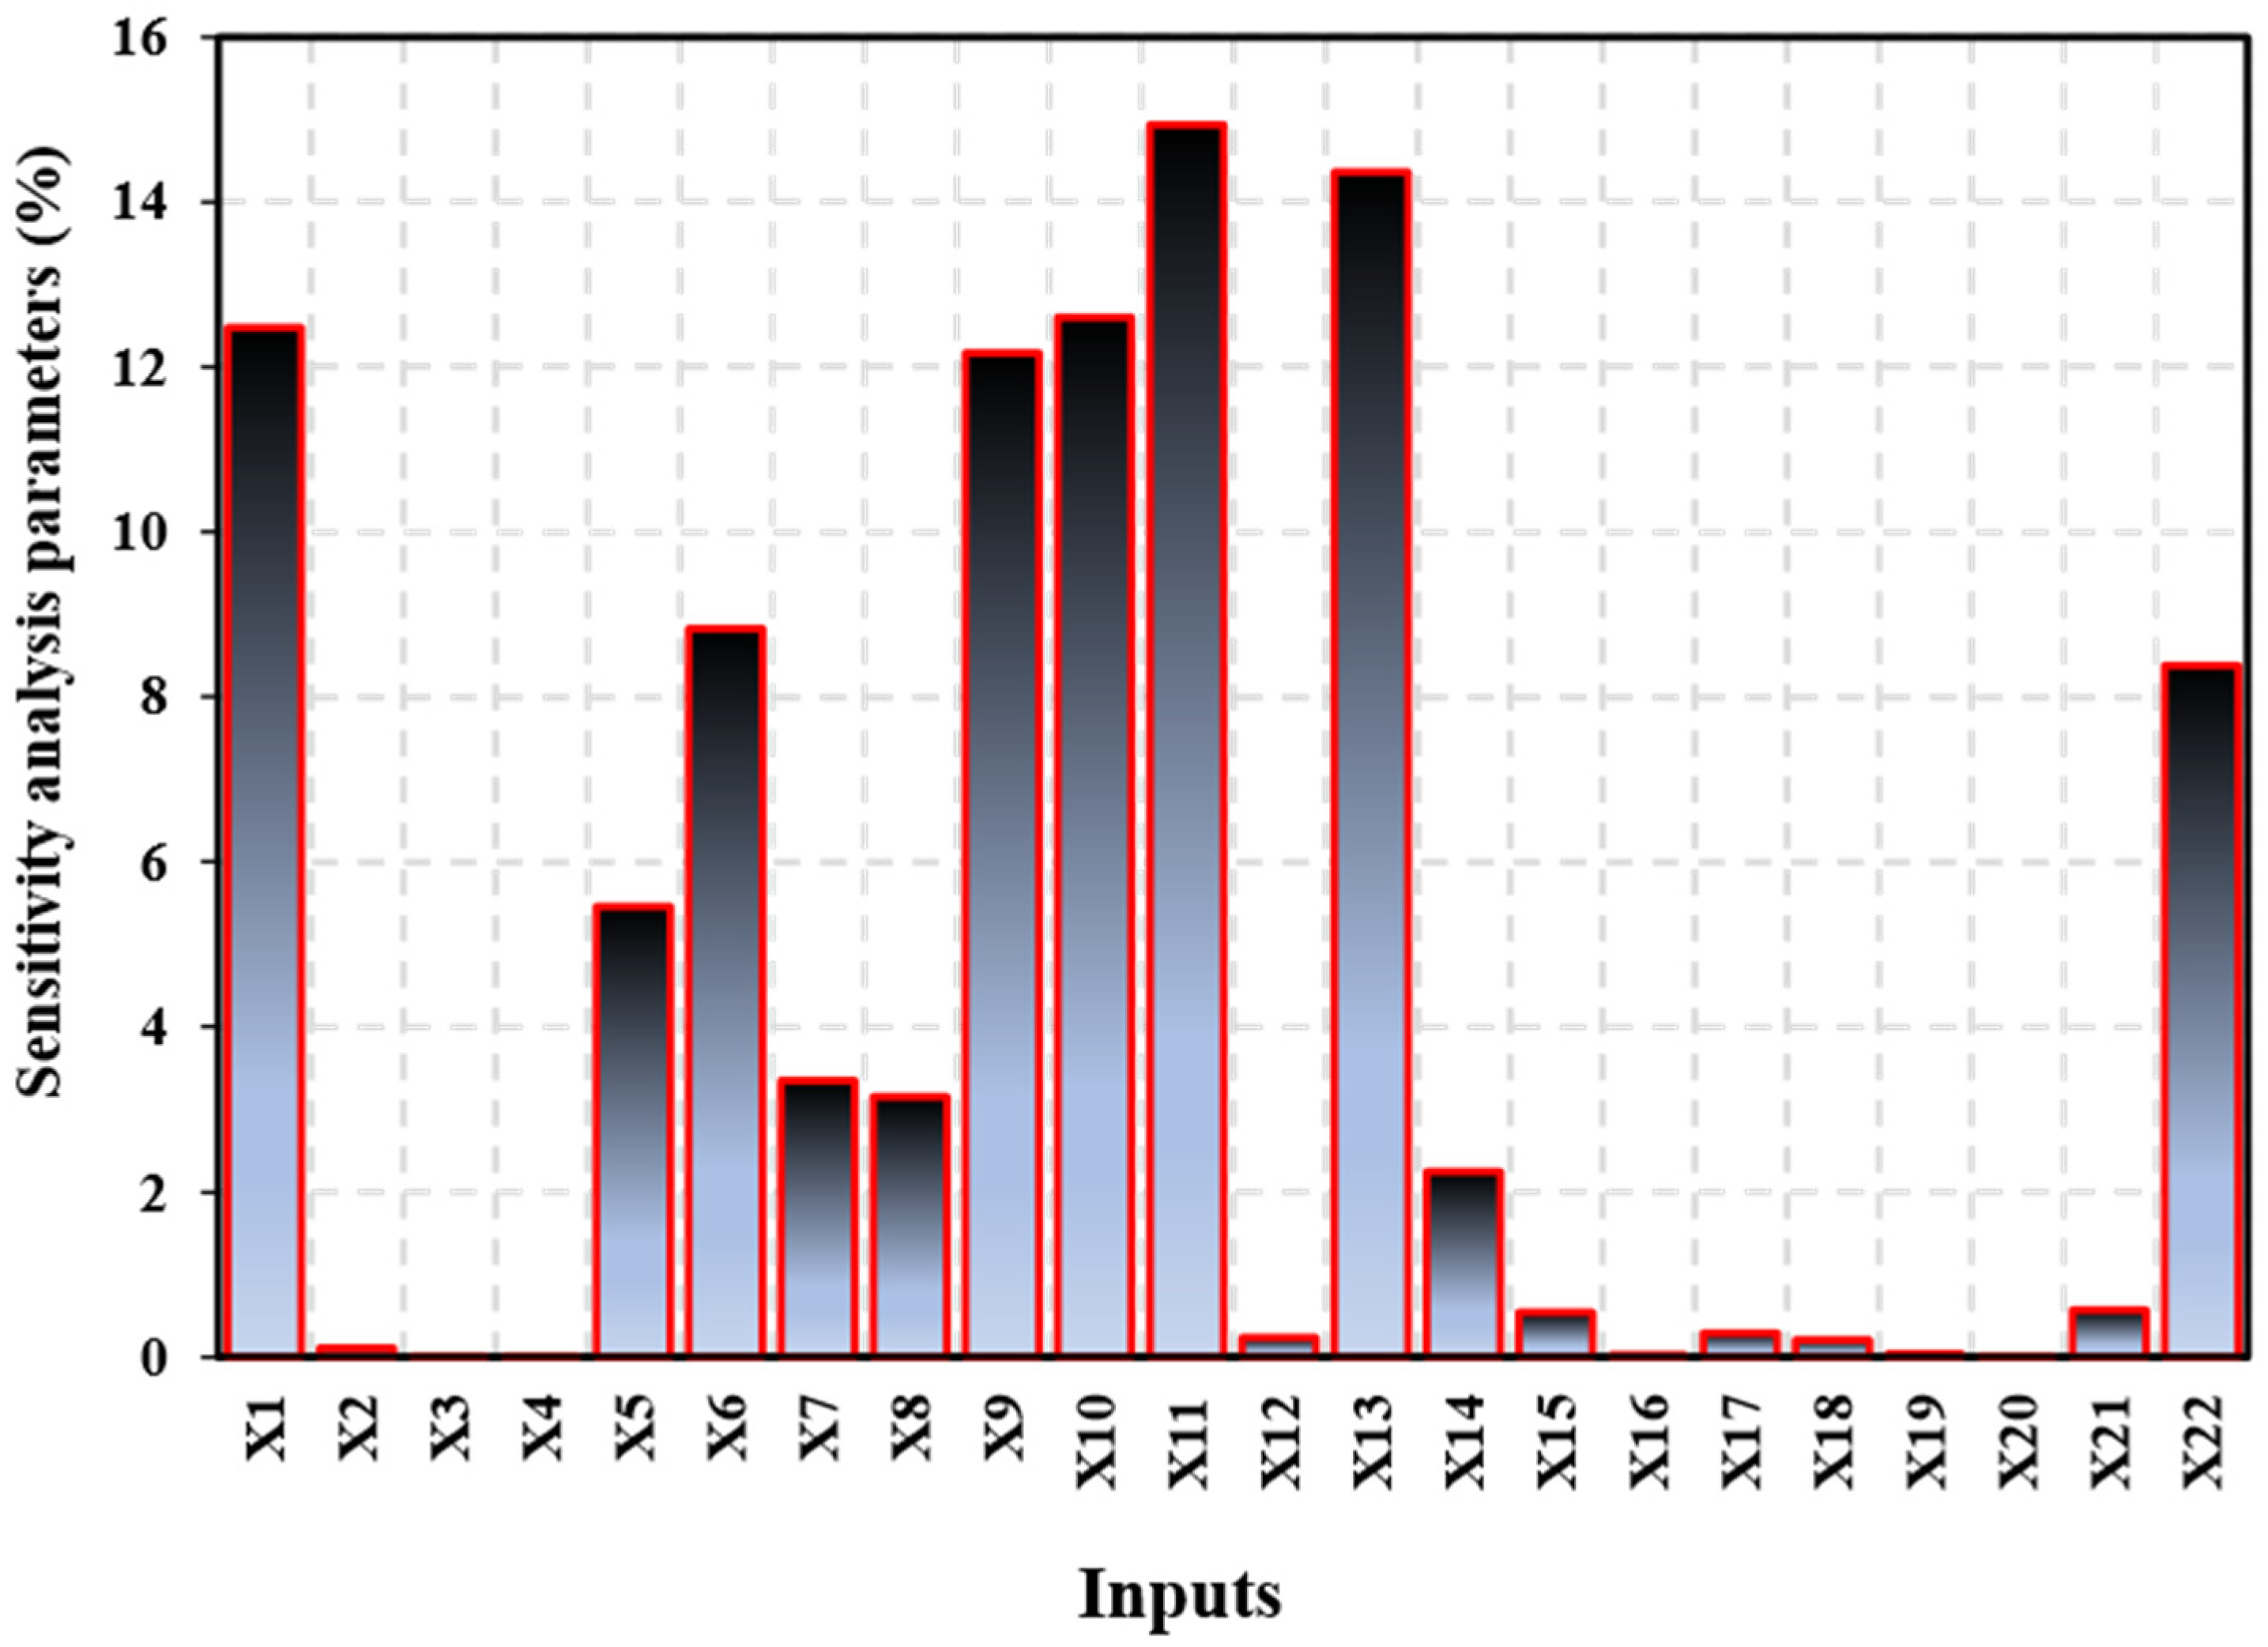
Sensitivity analysis examined how input variables affected the output variables. SA provides numerous methods for quantifying model input–output uncertainty [50]. The sensitivity analysis typically assesses the model’s responsiveness to variations in parameters and data uncertainty. Higher sensitivity analysis (SA) values result in a greater impact of input variables on output variables [51]. The effect of input parameters on the calculation of the ANN compression strength is shown in Figure 21. Sensitivity analysis showed that the most significant element was the coarse aggregate, which contributed more to the overall impact of output [51]. The highest sensitivity analysis for input for coarse aggregate, quartz powder, sand, cement, and limestone with 14.93, 14.36, 12.59, 12.48, and 12.16%, respectively. It was demonstrated that the impact of additional input parameters, such as cement type and steel fiber, on the Levenberg–Marquardt artificial neural network (ANN) used to calculate the compressive strength of concrete was reduced [52].

3.4. Validation and Comparison of RSM and ANN Models

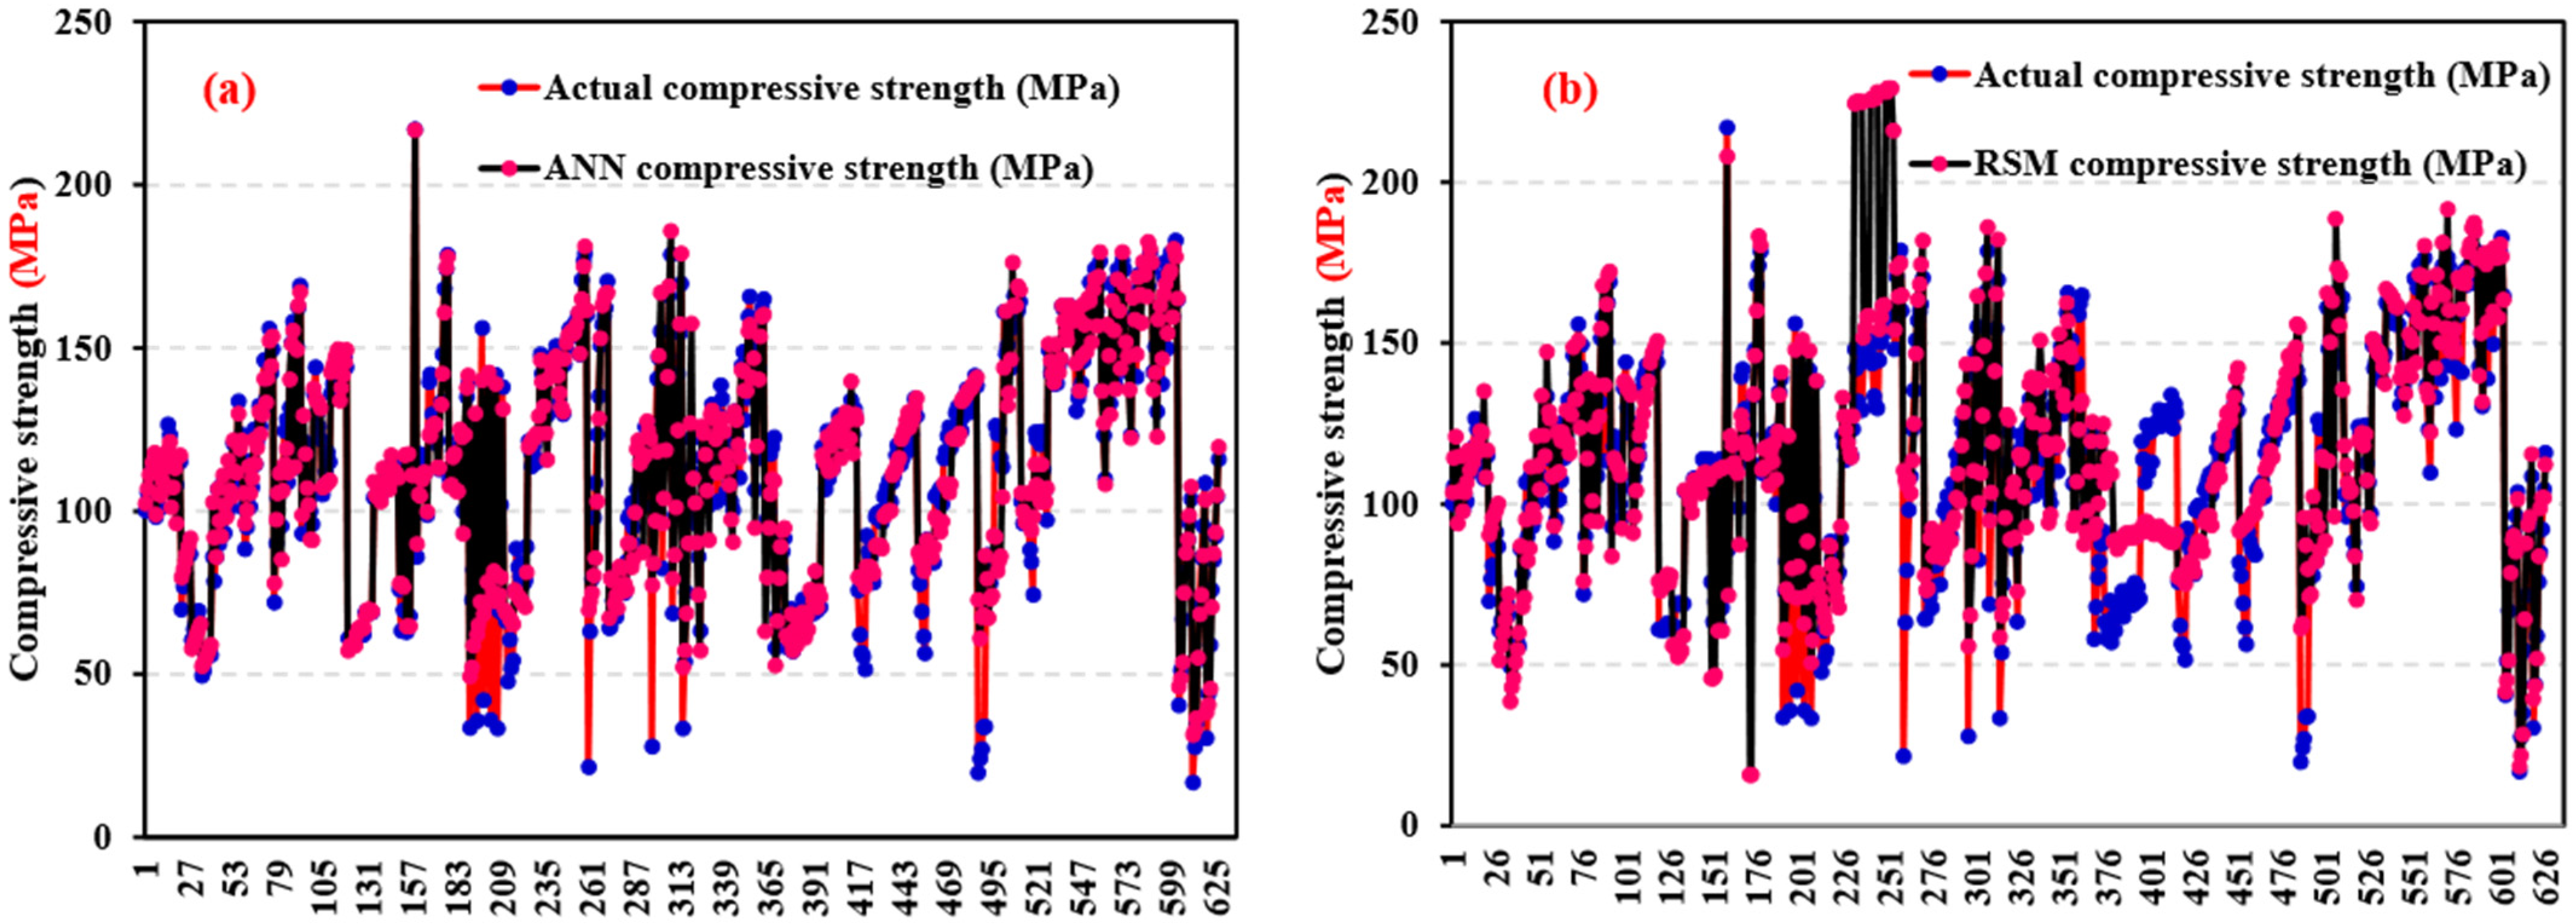
Response surface methodology (RSM) and artificial neural network (ANN)-based degree of experimentation has emerged as the most popular model and process improvement methodologies in recent years [53]. In the current work, the compressive strength was predicted using the CCD-RSM and ANN methods. To assess the accuracy of the mathematical models, we evaluated the correlation between the actual and predicted values [54]. The strong correlation seen in these results verified that the mathematical models adequately represented the predicted results [55]. The performance of the created response surface methodology (RSM) and artificial neural network (ANN) models was also statistically evaluated and presented in Table S3. According to the results, the compressive strength model projected values were in close agreement with comparable experimental values in both methods. However, RSM models for pre-designed mixtures were found to have drawbacks in predicting responses compared to ANN. The determination coefficient (R2) was utilized to assess the relationship between the actual and predicted results of the CCD-RSM and ANN models to support the appropriateness of the resulting models [56]. The predicted data and the mean actual data are shown in Figure 22.
The accuracy of the developed response surface method (RSM) and Artificial Neural Network (ANN) models was evaluated using the statistical parameters described in Table 2 and Table S2. Compared to RSM methods, the ANN-estimated R2 was more accurate, and the values were significantly closer to 1 [29]. Consequently, the models produced by ANN exhibited greater efficacy and accuracy in predicting responses. The artificial neural network (ANN) demonstrates superior performance compared to the response surface method (RSM), as evidenced by the reduced mean squared error (MSE) values obtained by the ANN in comparison to the RSM.

4. Discussion

Based on the data described above, it can be concluded that artificial neural networks (ANNs) are more accurate at predicting real results than response surface methods (RSMs) [36]. The most effective predictor has been determined by comparing the accuracy of the Levenberg–Marquardt artificial neural network (ANN) and response surface methodology (RSM) approaches [56]. The R2-value, the difference between actual and expected results, and the precision of error estimations were all higher for the Levenberg–Marquardt artificial neural network (ANN) model than for the response surface method (RSM) models [57]. However, the results of the RSM model demonstrated a significant level of agreement with the experimental data [46]. The Levenberg–Marquardt artificial neural network (ANN) method predicts many traits better than other machine learning (ML) methods, according to previous studies [58]. A machine learning (ML) method’s effectiveness depends on the number of inputs and datasets needed to run it, making it difficult to find and recommend the optimum ML strategy for outcome prediction across scientific fields [59]. ANN research can assist the construction industry in building fast, low-cost material property assessment systems [60]. The ANN model developed during this study predicted better than earlier research [61,62]. Numerous factors contribute to the high prediction efficiency, one of which is that increasing the number of ANN inputs decreases operational errors and so enhances prediction performance [63]. According to some studies, normalizing parameter values to include variables and prevent issues with the poor learning rate of ANNs is one way to increase the capacity to predict outcomes [26]. Artificial neural networks (ANNs) may effectively predict outcomes in various applications due to their capacity to learn representations, model nonlinear relationships, scale well, adapt to different scenarios, and utilize advanced techniques such as regularization and ensemble learning [20]. Table S2 clearly demonstrates that the RSM model developed for this study surpassed earlier studies in terms of its predictive accuracy. This study achieved a prediction rate R2 of 0.901, which is significantly higher than what has been reported in previous literature [49,64,65]. Improving the prediction accuracy of the RSM model is crucial, and one way to achieve this is by selecting the input variables well and employing the right modeling techniques [66].

5. Conclusions

This study employed response surface methodology (RSM) and artificial neural networks (ANNs) to develop a model for estimating compressive strength. A comparison between machine learning and non-machine learning approaches was conducted to understand the in-depth evaluations. The investigation produced significant conclusions, as follows:
  • The empirical data-based ANN and RSM models have demonstrated their potential and utility in accurately simulating the compressive strength of ultra-high-performance concrete (UHPC).
  • ANN has proven effective in predicting multiple preceding results simultaneously, unlike RSM, which needed to divide preceding results into groups to improve prediction accuracy.
  • The ANN model outperforms RSM, with a strong correlation coefficient (R2) near 1 (0.91).
  • The RSM model predicted compressive strength with R2 values of 0.90 and higher. The model was significant (p < 0.05) and without prediction bias.
  • ANN and RSM predicted maximum compressive strengths of 219.7 MPa and 229.3 MPa at late ages and minimum compressive strengths of 31.2 MPa and 15.8 MPa at early ages, respectively.
  • Sensitivity analysis of the ANN model reveals that the primary factor influencing compressive strength is coarse aggregate, accounting for 14.93% of the influence. Quartz powder accounts for 14.3% of the influence on the compressive strength estimate as a significant variable.
  • However, the compressive strength of UHPC with ANN increases more with coarse aggregate, quartz powder, sand, cement, and limestone, whereas steel fiber and cement type decrease it.
ANN is computationally intensive and needs considerable time and resources. RSM is suitable for small-scale datasets as it uses a simple quadratic relationship, but it is not suggested for large-scale datasets. However, further studies should be carried out to adopt more sophisticated methods of deep learning, such as recurrent neural networks and convolutional neural networks, for improved prediction performance of UHPC.

Supplementary Materials

The following supporting information can be downloaded at: https://www.mdpi.com/article/10.3390/buildings14092693/s1, Table S1: Factors and Factor Levels for RSM. Table S2: Analysis of variance (ANOVA) and regression model statistics from the experimental results. Table S3: Actual and predicted results of ANN and RSM.

Author Contributions

Conceptualization, T.L., A.H.A. and M.S.; Methodology, P.J. and J.Y.; Software, T.L. and P.J.; Validation, A.A. and M.S.; Formal analysis, T.L., Y.Q., A.A. and A.M.A.; Investigation, P.J.; Resources, Y.Q., A.H.A. and A.M.A.; Data curation, Y.Q.; Writing—original draft, T.L.; Writing—review & editing, P.J., Y.Q., J.Y., A.H.A., A.A., A.M.A. and M.S.; Visualization, J.Y. and M.S.; Supervision, J.Y. and M.S.; Project administration, A.H.A., A.A. and A.M.A.; Funding acquisition, A.H.A. All authors have read and agreed to the published version of the manuscript.

Funding

This research was supported by National Natural Science Foundation of China (52209155), Hunan Natural Science Foundation (2023JJ30045) and Hunan Provincial Department of Water Resources Science and Technology Project (22cslg034).

Data Availability Statement

The data will be made available by the corresponding authors upon reasonable request.

Conflicts of Interest

Author Pengxiao Jiang was employed by the company China Construction Fifth Engineering Division Corp., Ltd. The remaining authors declare that the research was conducted in the absence of any commercial or financial relationships that could be construed as a potential conflict of interest.

References

  1. Meng, Q.; Wu, C.; Li, J.; Liu, Z.; Wu, P.; Yang, Y.; Wang, Z. Steel/basalt rebar reinforced Ultra-High Performance Concrete components against methane-air explosion loads. Compos. Part B Eng. 2020, 198, 108215. [Google Scholar] [CrossRef]
  2. Li, P.; Sluijsmans, M.; Brouwers, H.; Yu, Q. Functionally graded ultra-high performance cementitious composite with enhanced impact properties. Compos. Part B Eng. 2020, 183, 107680. [Google Scholar] [CrossRef]
  3. Azmee, N.M.; Shafiq, N. Ultra-high performance concrete: From fundamental to applications. Case Stud. Constr. Mater. 2018, 9, e00197. [Google Scholar] [CrossRef]
  4. Ren, L.; Fang, Z.; Wang, K. Design and behavior of super-long span cable-stayed bridge with CFRP cables and UHPC members. Compos. Part B Eng. 2018, 164, 72–81. [Google Scholar] [CrossRef]
  5. Graybeal, B.; Brühwiler, E.; Kim, B.-S.; Toutlemonde, F.; Voo, Y.L.; Zaghi, A. International Perspective on UHPC in Bridge Engineering. J. Bridg. Eng. 2020, 25, 04020094. [Google Scholar] [CrossRef]
  6. Mahmud, G.H.; Hassan, A.M.; Jones, S.W.; Schleyer, G.K. Experimental and numerical studies of ultra high performance fibre reinforced concrete (UHPFRC) two-way slabs. Structures 2021, 29, 1763–1778. [Google Scholar] [CrossRef]
  7. Liu, J.; Wei, J.; Li, J.; Su, Y.; Wu, C. A comprehensive review of ultra-high performance concrete (UHPC) behaviour under blast loads. Cem. Concr. Compos. 2023, 148, 105449. [Google Scholar] [CrossRef]
  8. Zhang, X.; Wu, Z.; Xie, J.; Hu, X.; Shi, C. Trends toward lower-carbon ultra-high performance concrete (UHPC)—A review. Constr. Build. Mater. 2024, 420, 135602. [Google Scholar] [CrossRef]
  9. Dong, Z.; Wu, G.; Zhu, H.; Zhao, X.-L.; Wei, Y.; Qian, H. Flexural behavior of seawater sea-sand coral concrete–UHPC composite beams reinforced with BFRP bars. Constr. Build. Mater. 2020, 265, 120279. [Google Scholar] [CrossRef]
  10. Heniegal, A. Design of Self Compacting Concrete Using Artificial Neural. Mansoura Eng. J. 2020, 37, 50–73. [Google Scholar] [CrossRef]
  11. Khan, A.Q.; Awan, H.A.; Rasul, M.; Siddiqi, Z.A.; Pimanmas, A. Optimized artificial neural network model for accurate prediction of compressive strength of normal and high strength concrete. Clean. Mater. 2023, 10, 100211. [Google Scholar] [CrossRef]
  12. Alyouef, R.; Algaifi, H.A.; Alaskar, A. Engineering Properties of Waste Sawdust-Based Assessment and Numerical Prediction. Materials 2020, 13, 5490. [Google Scholar]
  13. Sadowski, Ł.; Piechówka-Mielnik, M.; Widziszowski, T.; Gardynik, A.; Mackiewicz, S. Hybrid ultrasonic-neural prediction of the compressive strength of environmentally friendly concrete screeds with high volume of waste quartz mineral dust. J. Clean. Prod. 2019, 212, 727–740. [Google Scholar] [CrossRef]
  14. Shamsabadi, E.A.; Roshan, N.; Hadigheh, S.A.; Nehdi, M.L.; Khodabakhshian, A.; Ghalehnovi, M. Machine learning-based compressive strength modelling of concrete incorporating waste marble powder. Constr. Build. Mater. 2021, 324, 126592. [Google Scholar] [CrossRef]
  15. Shahmansouri, A.A.; Yazdani, M.; Ghanbari, S.; Bengar, H.A.; Jafari, A.; Ghatte, H.F. Artificial neural network model to predict the compressive strength of eco-friendly geopolymer concrete incorporating silica fume and natural zeolite. J. Clean. Prod. 2021, 279, 123697. [Google Scholar] [CrossRef]
  16. Ali, M.; Kumar, A.; Yvaz, A.; Salah, B. Central composite design application in the optimization of the effect of pumice stone on lightweight concrete properties using RSM. Case Stud. Constr. Mater. 2023, 18, e01958. [Google Scholar] [CrossRef]
  17. Rantung, D.; Supit, S.W.; Nicolaas, S. Effects of different size of fly ash as cement replacement on self-compacting concrete properties. J. Sustain. Eng. Proc. Ser. 2019, 1, 180–186. [Google Scholar] [CrossRef]
  18. Shah, S.A.R.; Ben Kahla, N.; Atig, M.; Anwar, M.K.; Azab, M.; Mahmood, A. Optimization of fresh and mechanical properties of sustainable concrete composite containing ARGF and fly ash: An application of response surface methodology. Constr. Build. Mater. 2023, 362, 129722. [Google Scholar] [CrossRef]
  19. Schober, P.; Boer, C.; Schwarte, L.A. Correlation Coefficients: Appropriate Use and Interpretation. Anesth. Analg. 2018, 126, 1763–1768. [Google Scholar] [CrossRef]
  20. Liu, Q.-F.; Iqbal, M.F.; Yang, J.; Lu, X.-Y.; Zhang, P.; Rauf, M. Prediction of chloride diffusivity in concrete using artificial neural network: Modelling and performance evaluation. Constr. Build. Mater. 2021, 268, 121082. [Google Scholar] [CrossRef]
  21. Jagadesh, P.; de Prado-Gil, J.; Silva-Monteiro, N.; Martínez-García, R. Assessing the compressive strength of self-compacting concrete with recycled aggregates from mix ratio using machine learning approach. J. Mater. Res. Technol. 2023, 24, 1483–1498. [Google Scholar] [CrossRef]
  22. Boudali, S.; Abdulsalam, B.; Rafiean, A.H.; Poncet, S.; Soliman, A.; ElSafty, A. Influence of Fine Recycled Concrete Powder on the Compressive Strength of Self-Compacting Concrete (SCC) Using Artificial Neural Network. Sustainability 2021, 13, 3111. [Google Scholar] [CrossRef]
  23. Chen, H.; Li, X.; Wu, Y.; Zuo, L.; Lu, M.; Zhou, Y. Compressive Strength Prediction of High-Strength Concrete Using Long Short-Term Memory and Machine Learning Algorithms. Buildings 2022, 12, 302. [Google Scholar] [CrossRef]
  24. Adamu, M.; Mohammed, B.S.; Liew, M.S. Mechanical properties and performance of high volume fly ash roller compacted concrete containing crumb rubber and nano silica. Constr. Build. Mater. 2018, 171, 521–538. [Google Scholar] [CrossRef]
  25. Aldahdooh, M.; Bunnori, N.M.; Johari, M.M. Evaluation of ultra-high-performance-fiber reinforced concrete binder content using the response surface method. Mater. Des. 2013, 52, 957–965. [Google Scholar] [CrossRef]
  26. Essam, A.; Mostafa, S.A.; Khan, M.; Tahwia, A.M. Modified particle packing approach for optimizing waste marble powder as a cement substitute in high-performance concrete. Constr. Build. Mater. 2023, 409, 133845. [Google Scholar] [CrossRef]
  27. Ferdosian, I.; Camões, A. Eco-efficient ultra-high performance concrete development by means of response surface methodology. Cem. Concr. Compos. 2017, 84, 146–156. [Google Scholar] [CrossRef]
  28. Behnood, A.; Golafshani, E.M. Predicting the compressive strength of silica fume concrete using hybrid artificial neural network with multi-objective grey wolves. J. Clean. Prod. 2018, 202, 54–64. [Google Scholar] [CrossRef]
  29. Ofuyatan, O.M.; Agbawhe, O.B.; Omole, D.O.; Igwegbe, C.A.; Ighalo, J.O. RSM and ANN modelling of the mechanical properties of self-compacting concrete with silica fume and plastic waste as partial constituent replacement. Clean. Mater. 2022, 4, 100065. [Google Scholar] [CrossRef]
  30. Ghosh, A.; Das, P.; Sinha, K. Modeling of biosorption of Cu(II) by alkali-modified spent tea leaves using response surface methodology (RSM) and artificial neural network (ANN). Appl. Water Sci. 2015, 5, 191–199. [Google Scholar] [CrossRef]
  31. Iqbal, M.A.; Ali, M.; Bahu, M.A.; Nadeem, K.Z.; Mustafa, M.A.; Raza, A. Application of Artificial Neural Networks for Predicting Axial Strain of FRP-Confined Concrete. MATEC Web Conf. 2024, 398, 01033. [Google Scholar] [CrossRef]
  32. Jaf, D.K.I.; Abdalla, A.; Mohammed, A.S.; Abdulrahman, P.I.; Kurda, R. Hybrid nonlinear regression model versus MARS, MEP, and ANN to evaluate the effect of the size and content of waste tire rubber on the compressive strength of concrete. Heliyon 2024, 10, e25997. [Google Scholar] [CrossRef]
  33. Kursuncu, B.; Gencel, O.; Bayraktar, O.Y.; Shi, J.; Nematzadeh, M.; Kaplan, G. Optimization of foam concrete characteristics using response surface methodology and artificial neural networks. Constr. Build. Mater. 2022, 337, 127575. [Google Scholar] [CrossRef]
  34. Rahman, S.K.; Al-Ameri, R. Structural assessment of Basalt FRP reinforced self-compacting geopolymer concrete using artificial neural network (ANN) modelling. Constr. Build. Mater. 2023, 397, 132464. [Google Scholar] [CrossRef]
  35. Abbas, B.A.; Adisa, S.N.; Abubakar, J.; Akorede, B.A.; Alabi, A.S. An ann model for predicting slump of concrete containing crushed glass and natural gravel. Usak Univ. J. Eng. Sci. 2024, 7, 43–53. [Google Scholar] [CrossRef]
  36. Van Dao, D.; Ly, H.-B.; Vu, H.-L.T.; Le, T.-T.; Pham, B.T. Investigation and Optimization of the C-ANN Structure in Predicting the Compressive Strength of Foamed Concrete. Materials 2020, 13, 1072. [Google Scholar] [CrossRef]
  37. Zermane, H.; Madjour, H.; Ziar, A.; Zermane, A. Forecasting material quantity using machine learning and times series techniques. J. Electr. Eng. 2024, 75, 237–248. [Google Scholar] [CrossRef]
  38. Ardiansyah, M.F.R.; Wijaya, R.; Wulandari, G.S. Comparative Prediction of Physical Fatigue Patterns in Bandung, Indonesia Workers using CNN and ANN. J. Media Inform. Budidarma 2024, 8, 537. [Google Scholar] [CrossRef]
  39. Luo, X.; Xing, G.; Qiao, L.; Miao, P.; Yu, X.; Ma, K. Multi-objective optimization of the mix proportion for dune sand concrete based on response surface methodology. Constr. Build. Mater. 2023, 366, 129928. [Google Scholar] [CrossRef]
  40. Adamu, M.; Marouf, M.L.; Ibrahim, Y.E.; Ahmed, O.S.; Alanazi, H.; Marouf, A.L. Modeling and optimization of the mechanical properties of date fiber reinforced concrete containing silica fume using response surface methodology. Case Stud. Constr. Mater. 2022, 17, e01633. [Google Scholar] [CrossRef]
  41. Adamu, M.; Trabanpruek, P.; Jongvivatsakul, P.; Likitlersuang, S.; Iwanami, M. Mechanical performance and optimization of high-volume fly ash concrete containing plastic wastes and graphene nanoplatelets using response surface methodology. Constr. Build. Mater. 2021, 308, 125085. [Google Scholar] [CrossRef]
  42. Bheel, N.; Waqar, A.; Radu, D.; Benjeddou, O.; Alwetaishi, M.; Almujibah, H.R. A comprehensive study on the impact of nano-silica and ground granulated blast furnace slag on high strength concrete characteristics: RSM modeling and optimization. Structures 2024, 62, 106160. [Google Scholar] [CrossRef]
  43. He, H.; Cheng, S.; Chen, Y.; Lan, B. Compression performance analysis of multi-scale modified concrete based on response surface method. Case Stud. Constr. Mater. 2022, 17, e01312. [Google Scholar] [CrossRef]
  44. Chindasiriphan, P.; Meenyut, B.; Orasutthikul, S.; Jongvivatsakul, P.; Tangchirapat, W. Influences of high-volume coal bottom ash as cement and fine aggregate replacements on strength and heat evolution of eco-friendly high-strength concrete. J. Build. Eng. 2023, 65, 105791. [Google Scholar] [CrossRef]
  45. Ayanlere, S.; Ajamu, S.; Odeyemi, S.; Ajayi, O.; Kareem, M. Effects of water-cement ratio on bond strength of concrete. Mater. Today Proc. 2023, 86, 134–139. [Google Scholar] [CrossRef]
  46. Anjali, R.; Venkatesan, G. Optimization and prediction of mechanical properties of composite concrete with crumb rubber using RSM and hybrid DNN-HHO algorithm. J. Build. Eng. 2024, 84, 108486. [Google Scholar] [CrossRef]
  47. Aghajanzadeh, I.; Ramezanianpour, A.M.; Amani, A.; Habibi, A. Mixture optimization of alkali activated slag concrete containing recycled concrete aggregates and silica fume using response surface method. Constr. Build. Mater. 2024, 425, 135928. [Google Scholar] [CrossRef]
  48. Patil, S.; Bhaskar, R.; Xavier, J.R.; Raja, R. Experimental evaluation and statistical modeling of sustainable sisal fiber-reinforced fly ash-based lateritic concrete using response surface methodology. J. Build. Eng. 2024, 84, 108498. [Google Scholar] [CrossRef]
  49. Ma, H.; Sun, Z.; Ma, G. Research on Compressive Strength of Manufactured Sand Concrete Based on Response Surface Methodology (RSM). Appl. Sci. 2022, 12, 3506. [Google Scholar] [CrossRef]
  50. De-Prado-Gil, J.; Martínez-García, R.; Jagadesh, P.; Juan-Valdés, A.; Gónzalez-Alonso, M.-I.; Palencia, C. To determine the compressive strength of self-compacting recycled aggregate concrete using artificial neural network (ANN). Ain Shams Eng. J. 2023, 15, 102548. [Google Scholar] [CrossRef]
  51. De-Prado-Gil, J.; Zaid, O.; Palencia, C.; Martínez-García, R. Prediction of Splitting Tensile Strength of Self-Compacting Recycled Aggregate Concrete Using Novel Deep Learning Methods. Mathematics 2022, 10, 2245. [Google Scholar] [CrossRef]
  52. Mai, H.-V.T.; Nguyen, M.H.; Ly, H.-B. Development of machine learning methods to predict the compressive strength of fiber-reinforced self-compacting concrete and sensitivity analysis. Constr. Build. Mater. 2023, 367, 130339. [Google Scholar] [CrossRef]
  53. Dahmoune, F.; Remini, H.; Dairi, S.; Aoun, O.; Moussi, K.; Bouaoudia-Madi, N.; Adjeroud, N.; Kadri, N.; Lefsih, K.; Boughani, L.; et al. Ultrasound assisted extraction of phenolic compounds from P. lentiscus L. leaves: Comparative study of artificial neural network (ANN) versus degree of experiment for prediction ability of phenolic compounds recovery. Ind. Crop. Prod. 2015, 77, 251–261. [Google Scholar] [CrossRef]
  54. Khan, K.; Johari, M.A.M.; Amin, M.N.; Khan, M.I.; Iqbal, M. Optimization of colloidal nano-silica based cementitious mortar composites using RSM and ANN approaches. Results Eng. 2023, 20, 101390. [Google Scholar] [CrossRef]
  55. Rizalman, A.N.; Lee, C.C. Comparison of Artificial Neural Network (ANN) and Response Surface Methodology (RSM) in Predicting the Compressive Strength of POFA Concrete. Appl. Model. Simul. 2021, 4, 210–216. [Google Scholar]
  56. Hammoudi, A.; Moussaceb, K.; Belebchouche, C.; Dahmoune, F. Comparison of artificial neural network (ANN) and response surface methodology (RSM) prediction in compressive strength of recycled concrete aggregates. Constr. Build. Mater. 2019, 209, 425–436. [Google Scholar] [CrossRef]
  57. Al-Kahtani, M.S.M.; Zhu, H.; Ibrahim, Y.E.; Haruna, S.I.; Al-Qahtani, S.S.M. Study on the Mechanical Properties of Polyurethane-Cement Mortar Containing Nanosilica: RSM and Machine Learning Approach. Appl. Sci. 2023, 13, 13348. [Google Scholar] [CrossRef]
  58. Kumar, S.; Kumar, D.R.; Wipulanusat, W.; Keawsawasvong, S. Development of ANN-based metaheuristic models for the study of the durability characteristics of high-volume fly ash self-compacting concrete with silica fume. J. Build. Eng. 2024, 94, 109844. [Google Scholar] [CrossRef]
  59. Mater, Y.; Kamel, M.; Karam, A.; Bakhoum, E. ANN-Python prediction model for the compressive strength of green concrete. Constr. Innov. 2022, 23, 340–359. [Google Scholar] [CrossRef]
  60. Afzali, S.A.E.; Shayanfar, M.A.; Ghanooni-Bagha, M.; Golafshani, E.; Ngo, T. The use of machine learning techniques to investigate the properties of metakaolin-based geopolymer concrete. J. Clean. Prod. 2024, 446, 141305. [Google Scholar] [CrossRef]
  61. Hoang, N.-D.; Pham, A.-D.; Nguyen, Q.-L.; Pham, Q.-N. Estimating Compressive Strength of High Performance Concrete with Gaussian Process Regression Model. Adv. Civ. Eng. 2016, 2016, 1–8. [Google Scholar] [CrossRef]
  62. Song, H.; Ahmad, A.; Ostrowski, K.A.; Dudek, M. Analyzing the Compressive Strength of Ceramic Waste-Based Concrete Using Experiment and Artificial Neural Network (ANN) Approach. Materials 2021, 14, 4518. [Google Scholar] [CrossRef] [PubMed]
  63. Jahangir, H.; Eidgahee, D.R. A new and robust hybrid artificial bee colony algorithm—ANN model for FRP-concrete bond strength evaluation. Compos. Struct. 2021, 257, 113160. [Google Scholar] [CrossRef]
  64. Ali, M.; Khan, M.I.; Masood, F.; Alsulami, B.T.; Bouallegue, B.; Nawaz, R.; Fediuk, R. Central composite design application in the optimization of the effect of waste foundry sand on concrete properties using RSM. Structures 2022, 46, 1581–1594. [Google Scholar] [CrossRef]
  65. Ho, C.; Doh, S.; Chin, S.; Li, X. Prediction of concrete residual compressive strength under elevated temperatures: Response surface methodology (RSM) approach. Mater. Today Proc. 2023. [Google Scholar] [CrossRef]
  66. Parhi, S.K.; Patro, S.K. Application of R-curve, ANCOVA, and RSM techniques on fracture toughness enhancement in PET fiber-reinforced concrete. Constr. Build. Mater. 2024, 411, 134644. [Google Scholar] [CrossRef]
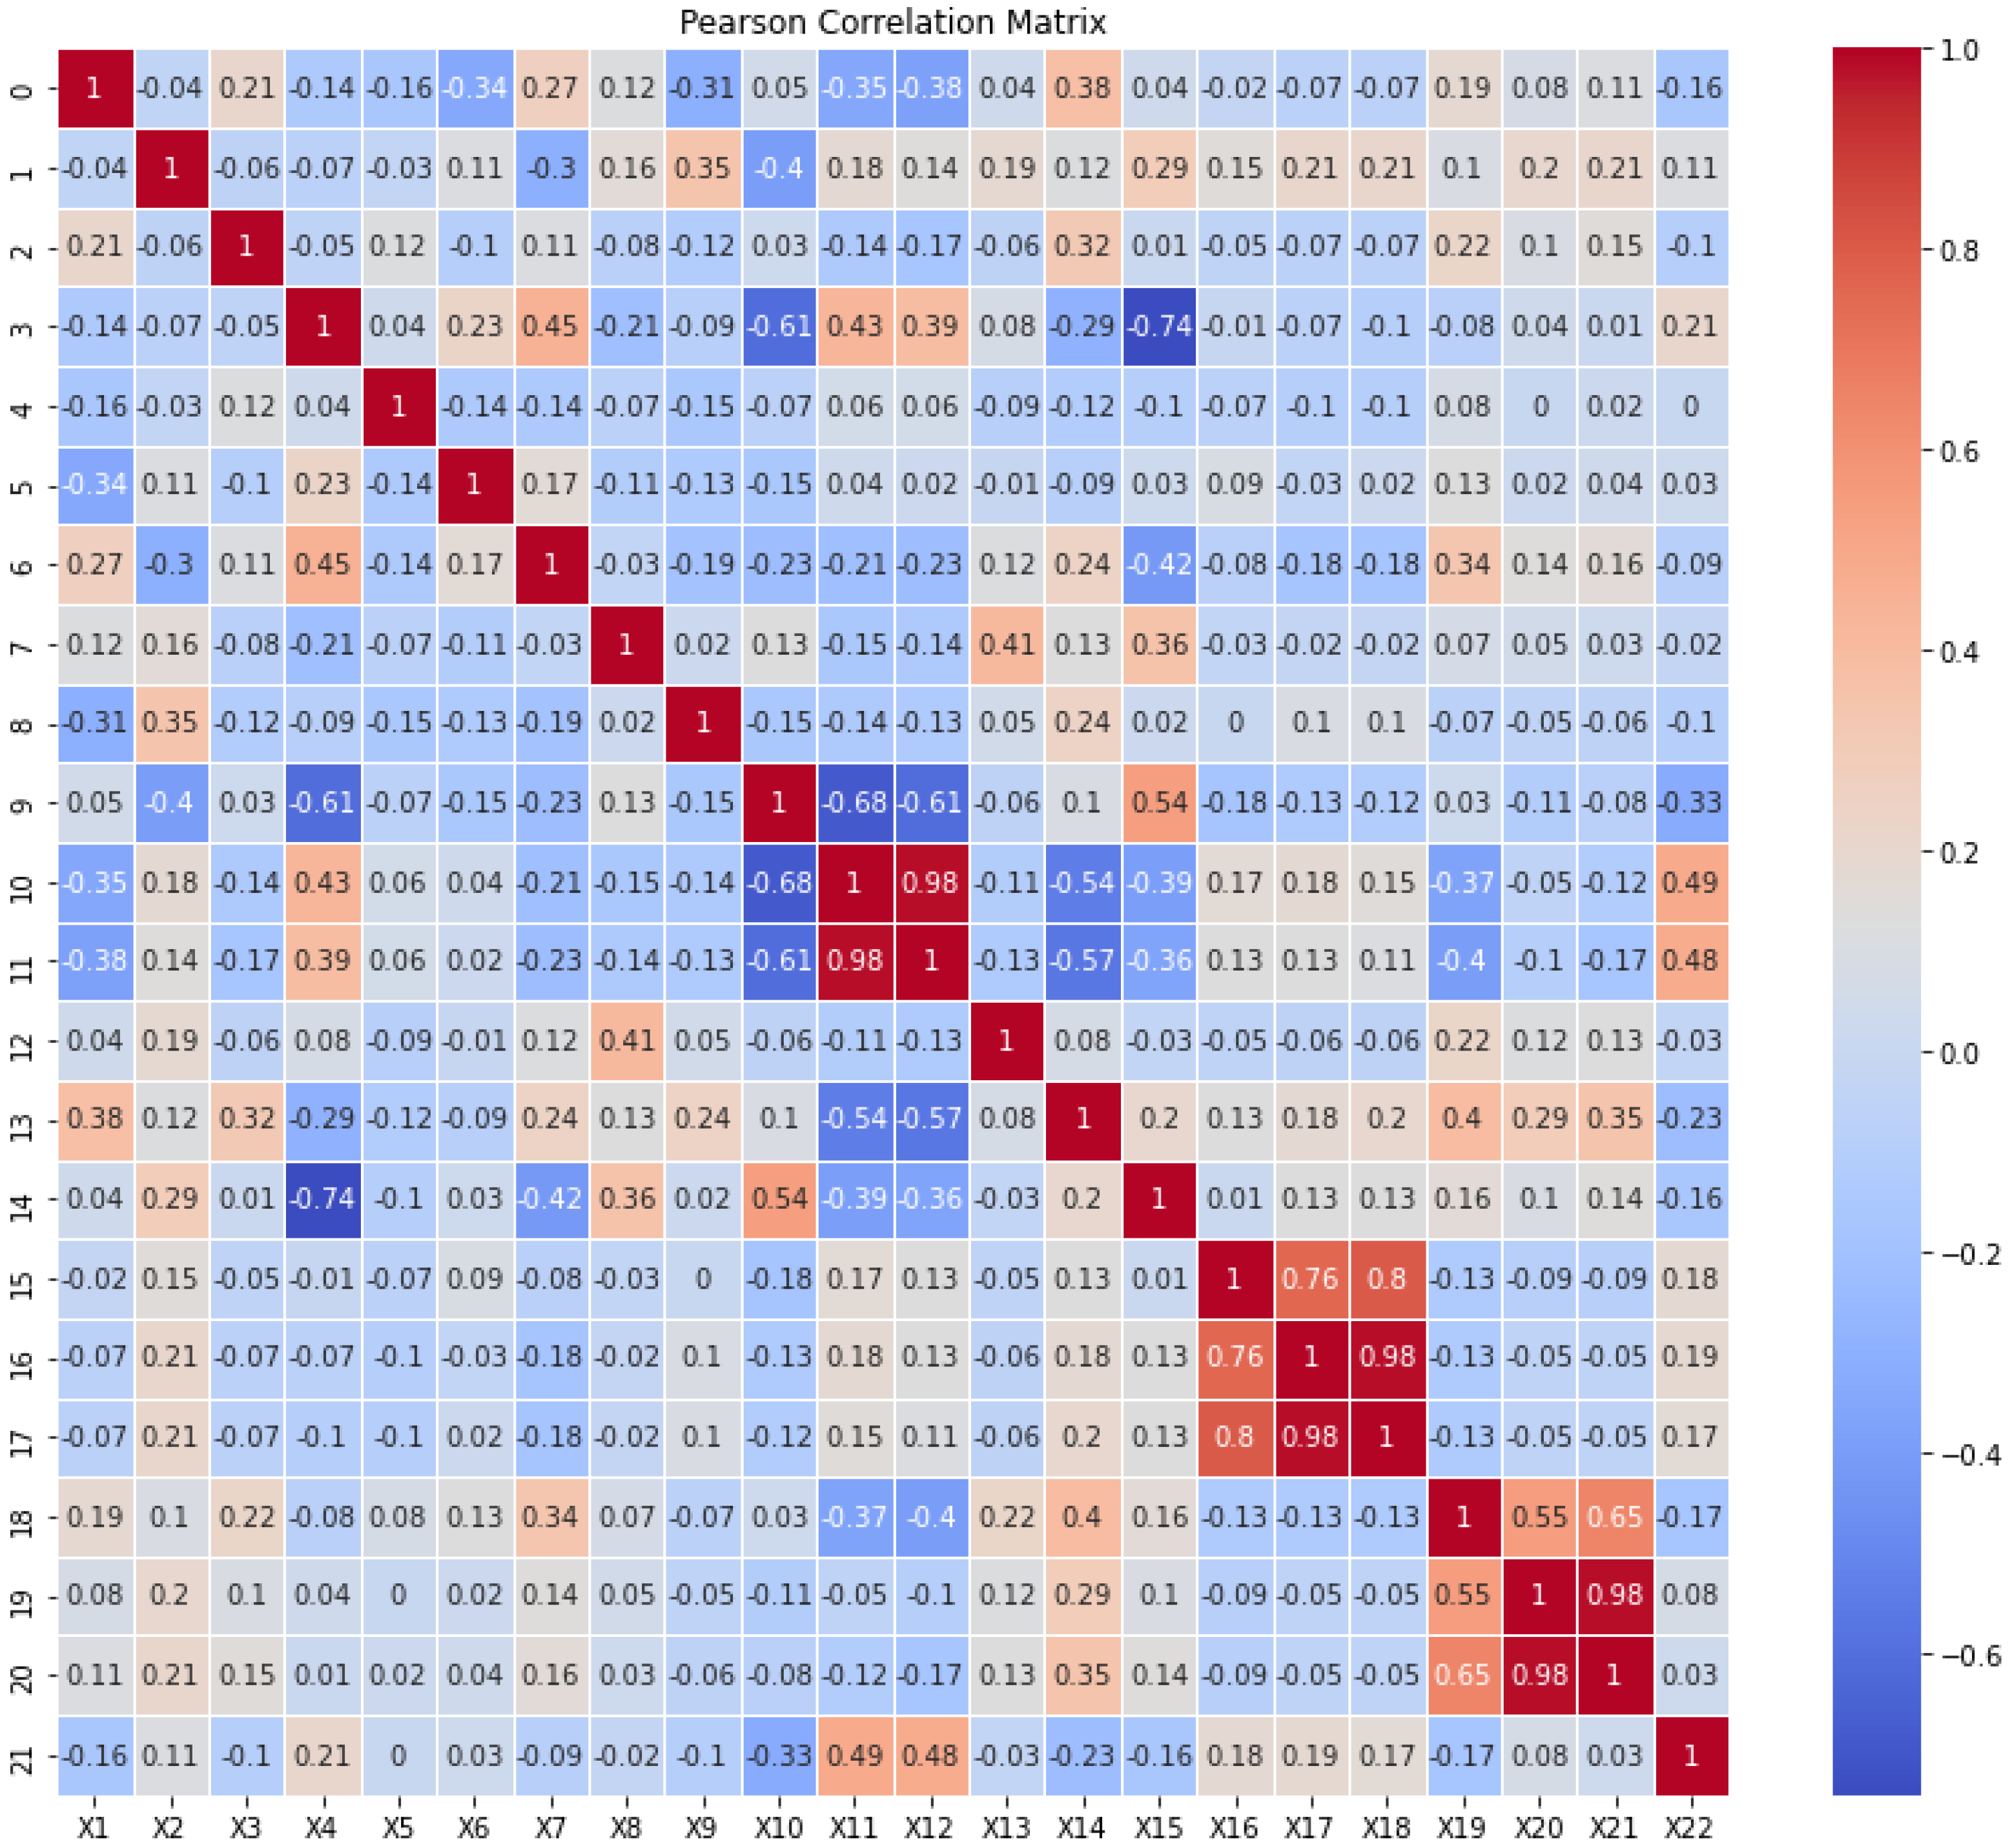
Figure 1. Correlations of all the variables.
Buildings 14 02693 g001
Figure 2. Summary of this study.
Buildings 14 02693 g002
Figure 3. Schematic representation of factorial, axial, and center points in CCD [26].
Buildings 14 02693 g003
Figure 4. ANN model: (a) Steps-wise process; (b) Schematic diagram [26].
Buildings 14 02693 g004aBuildings 14 02693 g004b
Figure 5. Parameters (a) the training state of the ANN model and (b) the best validation performance and mean square error (MSE).
Buildings 14 02693 g005
Figure 6. R2 coefficient of actual and predicted compressive strength.
Buildings 14 02693 g006
Figure 7. The relationship between the output and target variables of training, validation, testing, and cumulative.
Buildings 14 02693 g007
Figure 8. Response of output model 1 for time series for compressive strength.
Buildings 14 02693 g008
Figure 9. Parameters: (a) The coincidence between the output and target variables of training, validation, testing, and cumulative and (b) the training state of the ANN model at epoch 59.
Buildings 14 02693 g009
Figure 10. Parameters. (a) The relationship between the output and target variables of training, validation, testing, and cumulative and (b) the training state of the ANN model at epoch 13.
Buildings 14 02693 g010
Figure 11. Compressive strength for response 1; (a) 3D view; (b) contour graph.
Buildings 14 02693 g011
Figure 12. Compressive strength for response 2; (a) 3D view; (b) contour graph.
Buildings 14 02693 g012
Figure 13. Compressive strength for response 3; (a) 3D view; (b) contour graph.
Buildings 14 02693 g013
Figure 14. Compressive strength for response 4; (a) 3D view; (b) contour graph.
Buildings 14 02693 g014
Figure 15. Compressive strength for response 5; (a) 3D view; (b) contour graph.
Buildings 14 02693 g015
Figure 16. Compressive strength for response 6; (a) 3D view; (b) contour graph.
Buildings 14 02693 g016
Figure 17. Compressive strength for response 7; (a) 3D view; (b) contour graph.
Buildings 14 02693 g017
Figure 18. Compressive strength for response 8; (a) 3D view; (b) contour graph.
Buildings 14 02693 g018
Figure 19. Compressive strength for response 9; (a) 3D view; (b) contour graph.
Buildings 14 02693 g019
Figure 20. Compressive strength for response 10; (a) 3D view; (b) contour graph.
Buildings 14 02693 g020
Figure 21. Sensitivity analysis of the input parameters.
Buildings 14 02693 g021
Figure 22. Comparing experimental compressive strength to predicted compressive strength using (a) RSM and (b) ANN.
Buildings 14 02693 g022
Table 1. The input and output layers’ range and average values.
VariableMaxMinAverage
Cement content (kg/m3)1277.4192694.01
Cement compressive strength52.542.548.66
Cement type211.06
Cement strength class100.59
Fly-ash content (kg/m3)475029.45
Slag content (kg/m3)768049.89
Silica-fume content (kg/m3)291.30105.19
Nano-silica content (kg/m3)27509.15
Limestone powder content (kg/m3)1058.2072.77
Sand content (kg/m3)1503.4407.8989.37
Coarse aggregates content (kg/m3)1298.610213.48
Maximum aggregate size (mm)200.14.87
Quartz powder content (kg/m3)1249032.47
Water content (kg/m3)28690176.36
Super-plasticizers content (kg/m3)525.127.13
Polystyrene fiber content (%)200.04
Polystyrene fiber diameter (mm)2501.33
Polystyrene fiber length (mm)1800.70
Steel fiber content (%)301.01
Steel fiber diameter (mm)100.12
Steel fiber length (mm)5007.69
Curing time (days)730154.55
Table 2. R and MSE for training, validation, testing, and cumulative.
Correlation Coefficient (R)
Epoch 42Epoch 59Epoch 13
Training0.963270.965860.79681
Validation0.924190.942810.71146
Testing0.935890.841810.84309
all0.954440.939680.78536
% decreasing in cumulative--1.58%16.9%
Mean Square Error (MSE)
Epoch 42Epoch 59Epoch 13
MSE140.6466180.5462300.1546
Table 3. The maximum and minimum compressive strength of all responses.
Response12345678910
Max.C.S (MPa)123.4159.56156.53212.45129.15167.66132.72127.63165.28132.72
Min.C.S (MPa)102.8688.7391.271.74533762.7285.0979.8662.72
Table 4. Percent decrease in compressive strength of response 2.
Cement Content (kg/m3)
417.5508.98600.46691.94783.43874.9
w/c0.42−30.76%−33.44%−36.47%−39.13%−42.69%−46.36%
0.382−35.32%−35.46%−36.88%−38.15%−43.75%−44.05%
0.344−34.96%−33.52%−33.61%−34.26%−36.52%−38.58%
0.306−27.97%−26.86%−26.91%−27.34%−29.04%−29.42%
0.268−10.63%−15.49%−14.24%−15.64%−17.43%−18.09%
0.23------------
Disclaimer/Publisher’s Note: The statements, opinions and data contained in all publications are solely those of the individual author(s) and contributor(s) and not of MDPI and/or the editor(s). MDPI and/or the editor(s) disclaim responsibility for any injury to people or property resulting from any ideas, methods, instructions or products referred to in the content.