1. Introduction
Given the escalating threat of extreme weather events driven by the greenhouse effect, nations globally are grappling with carbon mitigation and sustainable development through both policy initiatives and technological advancements [
1]. The Paris Agreement (2015) set forth a framework aimed at limiting global temperature rise to well below 2 °C [
2]. Achieving this necessitates an estimated 77% reduction in greenhouse gas (GHG) emissions from the building sector by 2050. The building sector, responsible for approximately 40% of global GHG emissions, emerges as a critical area of focus [
3]. With the rapid pace of urbanization, energy demand for construction is projected to surge by 50% by 2050. Consequently, enhancing energy efficiency and reducing emissions within the building sector are pivotal to mitigating the impact of climate change [
4].
The European Union (EU) has implemented a comprehensive array of strategies to address climate change, prominently featuring the adoption and promotion of net-zero energy buildings (NZEB) [
5]. This concept is garnering significant global interest as it aims to minimize a building’s energy consumption by enhancing energy efficiency and utilizing renewable energy sources [
6], but with the increased prevalence of NZEB and other energy-efficient structures, the significance of embodied carbon is projected to rise [
7].
To manage and mitigate these impacts, LCA methodologies have become highly advanced in the building sector [
8]. These include adherence to European standards for sustainable construction, as well as internationally recognized frameworks like Leadership in Energy and Environmental Design (LEED) and Building Research Establishment Environmental Assessment Method (BREEAM). These tools provide robust quantitative assessments of environmental impacts, guiding the selection of materials, optimization of design and construction processes, and sustainability performance of buildings [
9].
As an EU member, Finland follows climate policy according to the legislation. The Climate Act primarily oversees national climate goals and the planning of climate legislation, rather than imposing specific emission reduction measures [
10]. Emission reduction strategies are determined through plans prepared under this law, often influenced by obligations under the UN Climate Convention and EU regulations [
11]. Prior to the implementation of proposed climate mitigation tools in the new Building Act, emissions from construction were indirectly addressed through building energy efficiency regulations aligned with EU directives.
Furthermore, a roadmap study commissioned by the Finnish Ministry of the Environment (FMoE) in 2017 explored incorporating the life cycle carbon footprint of buildings into construction regulations, highlighting the growing significance of emissions from building materials alongside improved energy efficiency standards [
12]. Therefore, Finnish initiatives aimed at controlling emissions from construction have progressed, acknowledging the significance of both energy efficiency and life cycle emissions in climate mitigation within the construction industry [
13].
FMoE utilizes a low-carbon assessment approach for buildings based on LCA, which examines various environmental impacts throughout the lifecycle of a product or service. Although the application of LCA in construction is a recent addition to Finnish legislation, it is not entirely new to the industry. Prior experience in low-carbon and sustainability studies within the construction sector is seen as beneficial under FMoE’s assessment approach. This method, initially tested in 2019, builds on existing industry knowledge, as demonstrated by the voluntary or encouraged LCAs in Finland, often linked to environmental certification systems like LEED. However, current systems face challenges due to the lack of standardized methodologies, leading to interpretational ambiguities and difficulties in ensuring sustainable construction quality. In contrast, FMoE’s method addresses these issues by adapting assessments to Finland’s climate conditions, aiming for standardized evaluations better suited to local contexts. Notably, no research has been found in the literature that examines FMoE’s LCA method and proposes new calculation techniques to overcome its shortcomings and limitations.
Prominent studies on LCA in the literature across various countries and regions have predominantly focused on the product stage (A1–A3) and usage stage (B1–B5) of buildings. Ref. [
14] found that operational emissions form the largest portion of life-cycle emissions in traditional buildings. Conversely, in low-energy buildings, embodied emissions can constitute up to 57% of the total emissions [
15]. Numerous studies assessed the environmental impacts of specific construction products [
16], including flooring [
17], insulation [
18], and cladding materials [
19]. Structural research mainly concentrated on concrete, timber, and steel, which are the primary structural materials used in construction [
20]. Among these, concrete remained the most prevalent and crucial structural form in contemporary architecture, contributing significantly to building GHG emissions [
21]. The field of steel construction benefited from advances in prefabrication techniques and high recycling rates [
22]. Engineered wood products are gaining recognition for their lower environmental impact [
23]. Additionally, studies explored GHG emissions during the construction process stage (A4–A5) [
24] and the end-of-life stage (C1–C4) [
25]. Ref. [
26] examined methods to harmonize standards and guidelines across different regions, while [
27] suggested an environmental benchmarking method to aid the design process. Ref. [
28] concentrated on the cost and low-carbon emissions of frame structures for timber and concrete apartment buildings in Finland, whereas [
29] performed a comparative study on LCA and carbon footprint of hybrid, concrete, and timber apartment buildings in Finland. Ref. [
30] studied the use of industrial-based PVC waste powder (PWP) as a sustainable building material in self-compacting concrete (SCC), and their findings indicated that SCC with 5–10% PWP can serve as a substitute for cement.
Within the realm of studies focusing on LCAs of office buildings, using Malaysia’s green-certified office buildings as an example, ref. [
31] created LCA-Multiple Linear Regression (MLR) framework to develop hotspot-focused regression models. The findings indicated that cement and steel account for two-thirds of embodied emissions and are included in MLR model to estimate embodied carbon. The hotspot-based embodied regression equations, designed with material-specific parameters, allow for precise predictions with a 23.7–42.1% deviation from actual embodied emissions. In contrast, using gross floor area and number of stories results in a 90.6% and 99.9% deviation, respectively. [
32] evaluated the embodied carbon (EC) of eco-friendly office buildings and propose strategies to lower the EC of structures in Sri Lanka. Findings revealed that the building’s EC was about 584 kgCO
2e/m
2 of the total floor area. Reinforcement steel emerged as the primary EC contributor, accounting for nearly 48% of the overall EC. Additionally, ready-mixed concrete, cement blocks, plywood, and aluminum were identified as other significant EC-intensive materials. Ref. [
33] presented the comparative findings of a LCA for an office building in Luxembourg, by considering 3 structural systems: a steel–concrete composite frame, a prefabricated concrete frame, and a timber frame. The steel–concrete composite frame had a lower global warming potential (GWP) compared to the prefabricated concrete frame. It also demonstrated a lower GWP than the timber frame when a landfill end-of-life (EOL) scenario for the wood is considered. The steel–concrete composite and timber solutions exhibited similar GWPs when assuming the wood is 100% incinerated with energy recovery at EOL. Ref. [
34] offered reference data on the life cycle impacts of office buildings, focusing on how different building subsystems chosen early in the design process affect these impacts in South Carolina. Key findings included that timber wall buildings have the lowest embodied impacts, while concrete wall buildings have the highest. Steel buildings generally performed better than concrete alternatives. Of the four envelope systems studied (spandrel, steel stud, CMU, and CLT), CLT envelope had the lowest total GWP and energy impacts, showing 38% and 58% lower GWP and energy impacts compared to the highest-impact building. The operational stage had the largest environmental impacts for all building types, whereas the production stage dominates embodied impacts. Ref. [
35] managed a LCA assessing both initial and ongoing emissions of various retrofitting options for a standard office building in Norway. The results displayed that, by implementing retrofitting strategies, emissions could drop by up to around 50%, ranging from 1336–637 kg CO
2 equivalent (CO
2-eq)/m
2. Operational energy usage (B6) accounted for approximately 77% of total CO
2-eq emissions in the baseline, compared to 43–46% in retrofit scenarios. The primary contributors to embodied CO
2-eq emissions in retrofitting were the product phase (19–23%), transportation to site (24–31%), and end-of-life services (about 25%). Ref. [
36] performed LCA and LCC analyses on an office building in the Netherlands. The research revealed the capacity of BIM-driven simulations to evaluate the ecological and financial effects of buildings by integrating semantic data into the model. Ref. [
37] conducted a LCA of a Danish office building engineered for disassembly, wherein the concrete structure is crafted for disassembly for future reuse. The potential environmental impact reductions fluctuated across various impact categories. These reductions were notably shaped by the building’s material makeup, particularly the quantity of component-use cycles and the lifespan of both the building and its components. Ref. [
38] showcased a life cycle energy examination of buildings derived from 73 instances spanning 13 nations, encompassing both residential and office edifices. Findings indicated that operational (80–90%) and embodied (10–20%) phases of energy consumption substantially impact a building’s life cycle energy requisites. The primary life cycle energy demand of office buildings ranged from 250–550 kWh/m
2 per year. Ref. [
39] furnished a LCA regarding a customary business office structure in Thailand. The findings displayed that steel and concrete emerge as the most substantial materials both in terms of quantities utilized and their related environmental impacts during the manufacturing phase. They represented 24% and 47% of the global warming potential, correspondingly, and contributed approximately 41% and 30% to the overall photo-oxidant formation potential, and 37% and 42% to the overall acidification potential, respectively. It was unveiled that the environmental impacts across the life cycle of commercial buildings are chiefly governed by the operational phase, constituting roughly 52% of the total global warming potential.
From the literature review conducted, it is evident that the prevailing gap in current research lies in the lack of thorough investigations comparing the environmental ramifications of office buildings in Finland built with concrete, timber, and steel frameworks. This comparison necessitates the utilization of specialized tools for assessing LCA, carbon footprint, and carbon handprint, while also integrating the low-carbon assessment methodology outlined by FMoE for producing climate reports on buildings. Despite ample research on residential structures, there is a conspicuous scarcity of similar analyses concerning office buildings within the Finnish setting. This gap is significant because office buildings, due to their size and functional requirements, can have distinct environmental impacts compared to residential structures. To address this gap, our research focuses on evaluating and comparing the environmental impacts of concrete, timber, and steel framing materials specifically for office buildings in Finland. The LCA in our study is confined to assessing the building structures themselves, excluding the building sites, to maintain a clear focus on the material-specific impacts. The selected concrete, timber, and steel-framed structures represent widely adopted solutions in Finnish office architecture. These choices ensure the relevance and applicability of our findings to real-world scenarios. Additionally, the specific solutions within these material categories were meticulously chosen to meet the essential fire safety, structural integrity, and acoustic performance standards mandated in Finland. By undertaking this comparative analysis, our study aims to provide a nuanced understanding of how different framing materials influence the overall environmental footprint of office buildings. Additionally, we seek to develop new calculation techniques to address the shortcomings and limitations of FMoE’s LCA method, thereby informing more sustainable construction practices and policy decisions within the Finnish context.
2. Materials and Methods
In this chapter, we undertake a detailed exploration of the complexities involved in conducting a comprehensive LCA for a building. Our LCA was conducted over a 50-year time horizon. For comparative analysis of different structural frames, the functional unit was defined as kilograms of CO2 equivalent per square meter per annum (kgCO2e/m2/a). For individual building products, the functional unit was kilograms of CO2 equivalent (kgCO2e). Our approach is guided by the meticulous framework established by FMoE, specifically designed to assess the carbon neutrality of buildings. The primary objective of this analysis is to go beyond a superficial understanding, delving deep to extract and synthesize the crucial data needed to develop a robust and effective tool tailored to the Ministry’s assessment method. Excel (version Microsoft 365), a versatile and powerful tool in modern analysis, serves as the main platform for creating this custom LCA tool. Through careful iteration and refinement, this tool will evolve into a sophisticated apparatus capable of systematically evaluating and quantifying the environmental impact of a building throughout its entire life cycle. Its importance extends beyond this chapter, as it will play a crucial role in the subsequent phases of our paper, especially in the calculation section, where its precision and reliability will be crucial. Thus, our study aims not only to understand the methodology and intricacies of LCA but also to enhance the suite of tools available for sustainable building practices and environmental stewardship.
In Finland, the Construction Act is slated to come into force on January 1st, 2025. One significant departure from the current Land Use and Building Act in this updated legislation is the integration of provisions aimed at addressing climate change. These provisions encompass regulations concerning climate reports, material requirements, and constraints on building carbon footprints. Consequently, it is imperative to utilize the carbon neutrality assessment method provided by FMoE.
Moreover, the carbon neutrality assessment method provided by FMoE underwent scrutiny to formulate a draft regulation on climate surveys, along with memorandum justifications for the regulation and local guidelines. At the time of writing our paper, the most recent iteration of these guidelines was a draft made available for parliamentary consultation. The final version is slated for release upon the enactment of FMoE’s carbon neutrality regulation [
40]. In this study, we employed this draft tool to validate assessment outcomes, acknowledging the constraints imposed by the tool’s internal material database.
The custom assessment tool rigorously adhered to the FmoE’s 2021 assessment method guidelines, meticulously aligning with the updated Building Act of Finland [
41]. The primary data source utilized was the national emissions database for construction [
42], which the Building Act acknowledges as a principal reference for environmental impact assessments. This database is integral due to its comprehensive and frequently updated emissions data. At the time of writing, the FmoE’s low-carbon emission method guide was under review by the Finnish Parliament, rendering it a provisional document subject to potential amendments. A significant limitation of this guide was the absence of standardized protocols for evaluating the environmental impacts associated with transportation and the construction of replaceable building components. As a result, default values from the national emissions database were employed exclusively at the beginning of the life cycle. To address this, product-related emissions were adjusted according to the number of replacements required throughout the building’s lifecycle. Additionally, the guide conflicted with the national emissions database on the assessment method for carbonation in cement-based products, an essential factor in lifecycle emission calculations. Our study assumed that the national emissions database, being web-based and presumably the most current source, provided values more consistent with the latest interpretations of the Construction Act for carbonation calculations. This approach ensured that our emissions assessments were both accurate and in line with contemporary legislative standards, enhancing the reliability and relevance of our findings.
This study’s LCA meticulously evaluated the embodied energy by employing default per square meter values sourced from the national emissions database. For operational energy-related emissions, the assessment involved multiplying the building’s annual purchased energy consumption by the annual emission factors also provided by the national database [
42]. These emission factors, although not specifically distinguishing between renewable and non-renewable energy sources, integrate the national policy trends aimed at increasing the proportion of green energy, thus reflecting a gradual annual decrease in emission values. The annual energy consumption of the building encompasses both district heating and electricity use. To obtain these figures, the study calculated average consumption values for buildings of similar size and energy profiles, utilizing data from the Finnish energy certificate register [
43]. This rigorous methodology ensures a detailed and accurate assessment of the building’s total energy-related emissions, incorporating both embodied and operational energy consumption and accounting for policy-driven reductions in emissions over time. By leveraging comprehensive and representative data, the study provides a robust framework for understanding and mitigating the environmental impacts associated with building energy use.
The assessment of building service emissions using data from the national emissions database for construction [
42], involves a systematic approach that integrates the heated floor area of the building with emission factors tailored to specific categories of use. This method allows for a nuanced understanding of the environmental impact stemming from the operational phase of building service systems, encompassing aspects such as heating, ventilation, and air conditioning. The emissions factors detailed in the background report titled “Building Service Systems’ Emissions Factors” [
44] provide a comprehensive framework for quantifying greenhouse gas emissions, thereby supporting informed decision-making in sustainable construction practices. By aligning assessments with these standardized factors, stakeholders can effectively mitigate environmental footprints associated with building operations, contributing to broader efforts towards carbon neutrality and environmental stewardship in the built environment.
The evaluation of carbonation in cement-based products was conducted using the D5 Carbonation values extracted from the national emissions database for construction. The comparative analysis presented in this paper demonstrated that these values yielded estimations that were up to 46% lower than those derived from the assessment method specified by [
41]. This substantial discrepancy signifies a significant variation in carbonation rate calculations between the two methodologies. As policymakers contemplate the adoption of an official method under the Construction Act, the decision-making process is currently unsettled. The uncertainty surrounding the preferred approach necessitates further investigation and consensus-building within the scientific community and regulatory bodies. Resolving this issue is crucial for ensuring that future carbon footprint assessments in construction align with accurate and reliable data, thus supporting informed environmental policies and sustainable development goals.
In this study, the most critical aspects of LCA are those factors that accumulate over time. Specifically, the energy consumption of the building, which is computed annually, has been identified as the most cumulative factor. This means that even a small error in estimating energy consumption has the potential to significantly impact the LCA results. Conversely, this underscores the importance of reducing a building’s energy intake as a pivotal strategy for emissions reduction. To address the sensitivity of cumulative factors, the building’s energy consumption was treated as an average value. This method highlights energy consumption as the single most influential factor in reducing emissions. Furthermore, the cumulative nature of replaceable building components was considered by refraining from making additional assumptions within the FmoE assessment method, despite its identified shortcomings. This approach ensures that our study accurately reflects the significant impact of energy consumption on LCA outcomes and acknowledges the limitations of current assessment methods regarding replaceable building parts.
It is noteworthy that in Finland, where sustainability and resource efficiency hold great importance, the comparison of materials plays a crucial role in optimizing building design and construction methods to minimize environmental impact. This approach aligns with promoting circular economy principles and meeting rigorous energy efficiency targets, particularly in office buildings, which account for a substantial portion of urban energy consumption and emissions. Understanding the relative environmental performance of these materials facilitates informed decision-making to advance sustainable building practices tailored to local contexts, such as those found in Finland.
2.1. Components of the Assessment
FMoE’s assessment method distinguishes between the assessment results for the building and the construction site. As per the guidelines, the assessment results for the building encompass the load-bearing structure, supplementary parts, and main technical systems. Similarly, the assessment results for the construction site encompass structures within the area, underground structures, foundations, piling, and stabilization [
44].
Table 1 summarizes the components included in FMoE’s assessment method.
According to the Building Act, LCA following FMoE’s method commences with a design model submitted with the building permit application. This initial model is subsequently refined using the as-built model after construction. Given that not all components are fully defined at the permit stage, broader default values are utilized. For instance, default values for building services, based on the building’s intended use and floor area, are drawn from the national emission database. These default values are segmented into separate categories: GWP A1–A3 for the product stage emissions and GWP B4 for replacement emissions (see
Table 2).
Emissions associated with building services can be assessed using default values sourced from the national emission database, which are determined based on the building’s usage class and size, covering the entire life cycle. FMoE’s guidelines specify these default values as the primary data source for emissions related to material transport (GWP A4), construction (GWP A5), demolition (GWP C1), and construction material waste management (GWP C2) [
44] (
Table 3).
In our study, these default values were applied specifically to office buildings. We integrated distinct cells within the LCA tool for each life cycle stage (A4, A5, C1, and C2), where these values were adjusted according to the building’s net heated floor area.
2.2. Compilation of the Material List
The assessment of building emissions necessitates detailed information on the quantity of building components and products. With the implementation of the Building Act (751/2023) [
41], such data are mandated to be included in the material description submitted alongside building permit applications. This requirement specifies a delimited content determined by a FMoE decree. In this context, a material list, crucial for LCA, is formed from the examined object’s BIM model. The quantity of building components and products is derived primarily from the projected surface area and volume fields of the components, which calculates these quantities reliably.
Furthermore, for accurate emission calculations, precise information on the mass of building materials is essential. This is achieved by integrating data such as density, weight, and thickness into the material list worksheet. Our custom assessment tool, developed in Excel, facilitates the organization of this data and its alignment with various life cycle modules for emission assessment. While the methodology adheres to FMoE guidelines, certain aspects, such as emissions from transportation, construction, and dismantling of replaceable parts, remain unassessed due to limited information beyond default values. Instead, a systematic approach is adopted to evaluate emissions from replacements, by aggregating those from the manufacturing phase of the replacement product and the waste treatment phase of the removed product. Ultimately, the assessed emissions are consolidated by life cycle modules according to the cost code structure, enabling comprehensive analysis and reporting.
2.3. Carbon Handprint Assessment
According to FMoE’s evaluation criteria, the concept of carbon handprint refers to the positive climate impacts resulting from activities related to a building project that extend beyond its LCA. This includes various life cycle modules (D1–D5), where the outcomes are reported as negative carbon dioxide equivalents (kgCO2e), rounded to two decimal places. In addition to impacts extending beyond the life cycle, carbon handprint encompasses carbon sinks that affect emissions during the product and waste treatment stages.
The computational assessment of carbon handprint primarily involves combining material quantity data with emission factors. For this purpose, the national emission database provides emission factors in kgCO2e/kg for GWP D1–D5. However, there are specialized methods for evaluating carbon handprint, such as assessing concrete carbonation and the sequestration of organic carbon, which are detailed in subsequent sections.
2.3.1. Assessment of Organic Carbon
According to guidelines from FMoE, the carbon content of organic materials in buildings is recorded as emissions at the building’s end-of-life stage. Initially, the organic carbon in timber materials is reported as a negative value, indicating sequestration, but it is recorded as a positive value when the building reaches the end of its life cycle. Emission factors from the national emission database, specifically GWP A1–A3 BIOGENIC and C3 BIOGENIC, are used for these calculations. Additionally, the sequestered organic carbon is reported in module D at the end of the life cycle using the D4 Carbon storage effect emission factor. For instance, the organic carbon in one kilogram of CLT during the product stage A1–A3 is calculated using a specific formula:
At the time of writing this paper, the national emission database lists a conservative value of 0.2 kgCO
2e/kg for the GWP A1–A3 of CLT panels, and −1.6 kgCO
2e/kg for GWP A1–A3 Biogenic. During the waste treatment phase C3, the organic carbon would then be calculated using the following formula:
In the national emission database, the GWP C3 value for CLT panels is listed as 0.02 kgCO
2e/kg, and the GWP C3 Biogenic value is 1.6 kgCO
2e/kg. Finally, the amount of organic carbon bound in the CLT panel will be reported as an external effect in module D4 using the following formula:
When evaluating the timeline, Equation (1) shows that emissions from CLT panels result in a negative value, indicating that these panels sequester carbon. This sequestered carbon is released at the end of the panel’s life cycle during the waste treatment phase, calculated using Equation (2). Because the coefficients for GWP A1–A3 BIO-GENIC and C3 BIOGENIC cancel each other out, they are excluded from the total emissions of the product life cycle but are considered for specific stages within that cycle. However, total emissions do include carbon sinks evaluated as external effects, as per Equation (3). In our custom Excel-based assessment tool used for this study, separate columns were not created for GWP A1–A3 BIO-GENIC and C3 BIOGENIC coefficients. Instead, these coefficients were computed by combining the A1–A3 and C3 coefficients in designated cells on the material list tab (
Table 4). According to FMoE’s guidelines for assessing low-carbon buildings, the foundational assumption when evaluating carbon sinks is that all assessed timber products are sustainably sourced. In this paper, timber products are theoretically evaluated under the premise that they meet this sustainability criterion.
2.3.2. Assessment of Carbonation
In FMoE’s method for assessing the low-carbonity of buildings, the evaluation of concrete carbonation follows the formula provided in the standard EN 16757 [
41]. Similarly, the 2021 version of FMoE’s guidance method includes a formula for assessing carbonation, based on the same standard annex.
where volume (
V) of a cement-based material in cubic meters, the amount of cement (
D) in kilograms per cubic meter, the lime content (
XcaO) in kilograms per kilogram of finished material, and the proportion of lime prone to carbonation (Xcarbonatable, CaO) relative to the total lime are all factors considered in the assessment of carbonation for cement-based materials [
41]. The guidance suggests that the carbon dioxide absorbed by such materials should be calculated using either the national emission database or product specific EPD data. Unlike the detailed formula, the national emission database provides an emission factor D5 for carbonation, expressed in kilograms of carbon dioxide equivalents per kilogram of finished material, without explaining its calculation. The discrepancy between the national emission database’s D5 coefficient and the formula based on the EN standard annex is evident when comparing their results. For example, a cubic meter of concrete demolished, crushed, and used as fill for a noise barrier over 100 years illustrates the assessment formula where atmospheric exposure to the concrete particles is assumed. Thus, the formula is as follows:
when Portland CEM I type cement has been used in the concrete.
In the national emission database, the emission factor D5 for carbonation for ready-mixed concrete with strength class C30/37 is reported as −0.022 kgCO
2e/kg. Using this coefficient, the emissions from the carbonation of one cubic meter of ready-mixed concrete would be estimated to be
Upon comparing Formulas (5) and (6), it becomes apparent that the values for carbonation estimation from the national emission database result in approximately 46% lower emissions compared to FMoE’s assessment method. This indicates that the national database values are more conservative, assuming full carbonation of cement-based products. However, results from the EN standard annex formula are contingent upon factors such as the product’s exposure to atmospheric conditions at its final disposal site and its specific material composition, which can vary significantly. In our LCA study, we opted to utilize the values from the national emission database for the D5 module to avoid making assumptions about the compositions of materials or their disposal sites. Given the inherent uncertainty in the national database values, the results are considered indicative and will be subject to refinement as legal changes are implemented. In our custom Excel-based assessment tool, the calculation involves multiplying the D5 emission coefficient by the masses of the evaluated cement-based products (
Table 5).
2.4. Precision of Building Information Modeling
FMoE’s proposal for a construction act and related laws places significant emphasis on creating detailed material descriptions through BIM for construction projects, in alignment with requirements set by construction laws. However, FMoE’s guidelines for assessing low-carbon buildings currently lack stringent criteria regarding the precision of BIM data. The guidelines specify that no more than one percent of building components by weight can be excluded from assessments, and that all necessary parts should be accurately modeled. However, detailed precision is explicitly defined for only a few components. This has led to inconsistencies, such as hollow-core slabs being modeled as solid, despite guidelines suggesting otherwise, due to default mass values in the national emission database that include voids. Moreover, the lack of detailed modeling precision for frame structures significantly affects LCAs, often necessitating assumptions based on calculations rather than standardized guidelines. In this study, frame structure quantities are estimated by calculating their relative proportions to the total surface area. Formulas are used to determine the volume of frame timber and insulation materials in different wall types, addressing these challenges in assessment.
and
where
x represents the thickness of the frame post,
y the spacing of the framing,
z the thickness of the structural layer, and
A the projected total surface area of the partition. The same calculation principle was utilized to determine the internal framing of different structure types. In our custom assessment (Excel) tool, the quantities of frame structure components were computed within the quantity data cells on the material list tab.
According to FMoE’s guidelines on low-carbon building assessment methods, the quantity list of building components should be prepared in the BIM in a manner compatible with LCA software used. Consequently, the current guidance does not address the interoperability of BIM-based quantity lists, which has been identified as a crucial factor in BIM-based construction permitting procedures.
2.5. Carbon Footprint of Energy
The assessment of emissions resulting from the building’s energy consumption during its operation combines the calculated values of the estimated purchased energy consumption with the emission factors of various energy forms. According to FMoE’s guidance on low-carbon building assessment methods, the primary source for determining a building’s purchased energy consumption is its energy survey [
41].
In the national emission database, emission factors for energy forms are listed by decade, measured as the weight of carbon dioxide equivalents per kilowatt-hour (kgCO
2e/kWh). This decade-based reporting method is used because it is anticipated that the emissions of energy forms will decrease over time. According to the national emission database, the annual emission factors of energy forms can be calculated using the following formula:
where
x is the emission factor for decade
1 and
y is the emission factor for decade
2.
In our paper, the emission factors for energy forms were computed for each year within the study period. Subsequently, the annual purchased energy consumption was multiplied by the corresponding emission factor for each year, and the resulting emissions were accumulated.
In addition to emissions from energy consumption, carbon footprints from product replacements were scheduled according to the products’ lifespans. The national emission database does not specify replacement intervals for the default values of building services (GWP B4), preventing a clear timeline representation for these replacements. To avoid a single carbon spike from replacements, this research divides the total emissions from building service replacements into three parts in the cumulative annual emissions graphs. Accordingly, one-quarter of the carbon footprint of replacements is shown within the first 15 years and then after 20 years, with the remaining two-quarters presented after 30 years.
2.6. Lifecycle Assessment of an Office Building
2.6.1. Building Facts
Our case study focuses on a five-story office building (
Figure 1) and its attached two-story lobby, which serves as the main entrance for both the study subject and an adjacent building. Combined, the office building and lobby encompass about 7350 square meters of heated floor area.
This building is part of a complex with five separate office buildings, interconnected via spaces on the basement and ground floors. The subject is situated in the Lahdesjärvi area of Tampere, specifically targeting the westernmost building in this zone.
On the ground floor, the building forms a continuous space with the lobby (
Figure 2), and the lobby connects to the building’s first floor. The second to fifth floors are dedicated to office spaces, with layouts customized to the occupants’ needs. For the carbon footprint assessment, the space division on the second floor was utilized (
Figure 3). Mechanical ventilation rooms are situated on the roof of the building.
FMoE’s regulation on building fire safety (848/2017), the fire class designation for this building is P2. In accordance with this regulation, the building necessitates an automatic fire extinguishing system.
2.6.2. Basis and Scope of the Lifecycle Assessment
As mentioned earlier, our research focused exclusively on the lifecycle assessment of the building itself, excluding the building site’s lifecycle and the assessment of room surfaces, except for protective claddings. This exclusion was consistent with the scope objectives outlined in FMoE’s low-carbon assessment method. Additionally, frame stairs were not assessed due to the absence of table values in the national emission database at the time of writing.
The assessment utilized permit image data, achieving an accuracy level comparable to the construction permit stage. Modules A4 (transportation), A5 (construction), C1 (demolition work), and C2 (transportation to treatment) were evaluated using table values from the national emission database. Environmental data for building materials were primarily sourced from this database, with EPD environmental data used only when specific structural component data were unavailable. Table values were also used for assessing emissions from building services. Notably, the default values in the national emission database did not account for sprinkler systems.
Since no energy certificate was available for the subject at the time of writing, the purchased energy consumption was estimated by averaging the consumption of comparable subjects from the energy certificate registry. Selection criteria for comparable subjects included matching usage category, location, and heated net area within ±10% of the subject’s area. Subjects utilizing district heating and assessed under the 2018 method were considered. The potential impact of frame systems on energy consumption was not examined due to scope constraints.
To validate the assessment results, a lifecycle assessment of the subject was conducted using the FMoE’s assessment tool. The outcomes were compared with those from our custom assessment (Excel) tool. This comparative analysis aimed to identify potential calculation errors and discrepancies in interpretation between the tools, with findings to be detailed later in the chapter presenting the assessment results.
3. Results
FMoE’s guidelines for assessing a building’s greenhouse gas emissions, detailed in regulation YM027:00/2021, require a breakdown of assessment results for each stage of the building’s life cycle, reported in both rounded symmetric figures and whole numbers per heated floor area. Notably, negative carbon dioxide equivalents (kgCO2e) representing the estimated carbon handprint are reported separately. In this article, assessment results were consolidated into a tab for summary, mirroring the format of FMoE’s carbon footprint assessment tool for comparison. FMoE’s tool organizes emissions by life cycle modules and displays them according to building components, whereas our custom assessment (Excel) tool in this paper uses project classification for components, with distinct columns for construction and site emissions. This difference enables a detailed comparison between FMoE’s tool, and the tool developed in this paper.
3.1. Comparison of Different Frame Systems for the Office Building
The original structural configurations of the subject were extracted from the plans and BIM model prepared by a Finnish architectural firm for the subject’s building permit. Utilizing these documents, alternative structures utilizing concrete, timber, and steel frames were formulated, and their lifecycle emissions were evaluated using our custom assessment (Excel) tool developed.
In comparing the frame systems, emphasis was placed on assessing the horizontal and vertical frames, as well as the exterior and partition walls. Concrete elevator shafts and stairwells were retained in the comparison due to safety considerations regarding fire protection. Furthermore, the cast-in-place concrete slab foundation outlined in the structural plans was included in the comparison, as alternative foundation options were not extensively explored within the scope of this paper. The subsequent subsection delves into a detailed discussion of the structural types evaluated in the comparison of frame systems.
3.1.1. Concrete Frame
For the comparison of frame systems, reinforced concrete beam options delineated in the subject’s structural drawings were chosen for the concrete-framed alternative. Vertical elements of the frame include floor-high concrete columns and load-bearing concrete walls for shafts and stairwells.
To estimate the quantity of concrete columns, values sourced from the national emission database were utilized to assess the weight of columns per meter. However, for estimating the quantity of concrete beams, the density of prestressed beam elements (height 680 mm, web 380 mm, flanges 200 mm) sourced from [
47], at 2499 kg/m
3, as the national emission database provides values solely for rectangular beams. The density value was then multiplied by the volume values derived from the quantity list, obtained by modeling the concrete beams of the subject based on the structural drawings.
Apart from stairwells, the load-bearing structures of the intermediate floors consist of hollow-core slabs and cast-in-place reinforced concrete topping slabs. Stairwells feature solid slab elements for the intermediate floors. According to the structural drawings, the fire resistance class of the intermediate floors is REI60. For this study, the minimum value of the sound reduction index DnT,W for the intermediate floors was set at 52 decibels, following FMoE’s guideline on building sound environments.
External walls comprise concrete sandwich panels, with the U-value presented as 0.17 W/m
2K in the structural plans, meeting the minimum requirement level for external walls in the structural comparison of this article. Double-layered steel-framed walls with plasterboard linings are proposed for separating office spaces. The sound reduction index DnT,W for these partition walls is indicated as 48 decibels, aligning with the minimum requirement level per FMoE’s guideline on building sound environments [
47].
3.1.2. Timber frame
To facilitate comparison in the lifecycle assessment, an LVL column-beam frame was designated as the timber-framed alternative. The design approach aimed to estimate material quantities for a comparable timber frame aligned with the concrete-framed alternative, without producing actual structural calculations due to the study’s scope objectives.
According to FMoE’s regulation on building fire safety (848/2017), for a P2 fire-rated building with more than 2-story, internal spaces must be equipped with at least a K2 30 class protective cladding composed of at least A2-s1, d0 class materials, excluding exit and firewall surfaces. Consequently, in this paper’s assessment, LVL columns and beams were considered fire-protected with plasterboards.
CLT concrete composite slabs were selected for the intermediate floor structure. The thickness of the intermediate floor was estimated using the formula provided in [
48] for CLT concrete composite slabs:
where
is the total thickness of the intermediate floor and
L is the span of the floor.
According to the handbook, the proportions of CLT and concrete in the cross-section typically follow these formulas:
where
is the thickness of the CLT slab,
is the thickness of the concrete slab. In this assessment, the intermediate floors were deemed fire-protected under gypsum boards. Utilizing Formula (12), the thickness of the intermediate floor was estimated to be around 350 mm, with the CLT slab thickness approximated to be about 220 mm using Formula (11). Consequently, utilizing Formula (12), the thickness of the concrete slab was estimated to be around 140 mm.
For load-bearing walls adjacent to ducts, a 5-layer CLT panel protected by fire-rated gypsum boards was chosen. Lightweight partition walls were constructed using timber-framed walls as indicated in the structural plans.
For the structural frames of internal partition walls within office spaces, alternatives involving steel and timber frames were proposed. In the concrete-framed office building, steel studs were selected for the partition walls.
It is worth noting that utilizing timber in construction offers a multitude of benefits tailored to Finland’s unique environmental conditions. As a renewable and locally sourced material, timber supports Finland’s sustainability goals by reducing reliance on fossil fuels and minimizing the carbon footprint associated with transportation [
49]. The natural carbon sequestration properties of timber contribute significantly to climate change mitigation, as growing trees absorb carbon dioxide, which remains stored in the wood throughout its use in construction [
50]. This characteristic is particularly valuable in Finland’s efforts to meet international climate commitments.
Timber also excels in thermal performance, providing excellent insulation that is crucial for maintaining energy efficiency in Finland’s cold climate. This leads to reduced heating requirements and lower energy costs, contributing to both economic and environmental benefits. Furthermore, timber’s lightweight nature allows for quicker and more flexible construction processes compared to traditional materials like steel and concrete, which can lead to shorter project timelines and cost savings in labor and logistics.
However, the Finnish climate presents challenges for timber use. The high humidity and significant seasonal temperature variations can lead to moisture-related issues such as warping, decay, and fungal growth [
51]. To combat these challenges, advanced treatments like pressure impregnation and surface coatings are necessary to enhance the durability and longevity of timber structures. These treatments, while effective, can increase initial construction costs and require ongoing maintenance to ensure long-term performance.
Additionally, while modern fire-retardant treatments improve timber’s fire resistance, its inherent combustibility necessitates careful design and adherence to stringent building codes to ensure occupant safety [
52]. Innovations in CLT and other engineered wood products have enhanced fire performance and structural integrity, making timber a more viable option for a wider range of building types.
3.1.3. Steel Frame
In the structural plans of the subject building, steel alternatives for the steel-reinforced flange beams were specified as DELTABEAM
® composite beams (Peikko, Lahti, Finland) [
53], designed to integrate seamlessly with the building’s hollow-core slab floors. Specifically, for the office building, models DR32-365 and D32-600 were designated for the composite beams, while model DR40-500 was specified for the lobby building. These specified composite beams served as the reference for the structural comparison of the steel-framed option. DELTABEAM
® composite beams do not necessitate additional fire protection; thus, the beams were modeled according to the manufacturer’s measurements.
Environmental data for DELTABEAM
® composite beams were sourced from model-specific Environmental Product Declaration (EPD) reports [
53]. Although the reports did not explicitly state the mass of the beams, they provided total emissions for each phase (GWP A1–A3) within the EPD data. The mass of the beams was estimated by multiplying these total emissions for each phase by the emission factor of 1.16 kgCO
2e/kg, obtained from OneClickLCA [
54] for the product phase (GWP A1–A3) of DELTABEAM
® beams. The estimated mass factors for the beams are detailed in
Table 6.
The DELTABEAM® connection frame encompasses connection beams and standard connections to beams compatible with concrete-filled connection columns. However, the inclusion of connection columns in the assessment was not feasible due to the absence of EPD environmental data for them at the time of writing this paper.
For comparison with the steel frame option, corrugated metal sandwich panels (PVP) were designated for the exterior walls. The estimation of the quantity of PVP panels utilized manufacturer’s data, as the national emissions database lacked conversion factors for their default masses at the time of writing this study. The exterior walls were specified as panels, with a thickness of 230 mm, a reported U-value of 0.17 W/m2K, and a weight of 24.2 kg/m2. The frame structure for the partition walls was selected to be steel studs, like the concrete frame option.
3.2. Evaluation
The estimated life cycle carbon footprint for the concrete frame option amounted to 9101 tons of CO
2e, equivalent to 24.77 kgCO
2e per heated square meter per year. The project’s carbon handprint was estimated at −343 tons of CO
2e, approximately −0.93 kgCO
2e per heated square meter per year. Predominantly, emissions stemmed from energy consumption (B6), estimated at 11.62 kgCO
2e per heated square meter per year, constituting around 47% of all emissions over the building’s life cycle (
Figure 4).
Following energy consumption, the next highest emissions occurred during the manufacturing phase of products (A1–A3), accounting for 7.19 kgCO2e per heated square meter per year, approximately 29% of all estimated emissions over the building’s life cycle.
Around 9% of total emissions were estimated to result from component replacements. However, this assessment result is approached cautiously due to ambiguities associated with the assessment of replacements using default values from the national emissions database.
During the demolition phase (C), emissions were estimated at 1.47 kgCO2e per heated square meter per year. In the waste treatment and disposal phase, highest emissions were anticipated from facade components, approximately 38% (90 tons of CO2e) of emissions. The second highest emissions were attributed to floor slab components, approximately 20% (47 tons of CO2e) of emissions. Facade demolition phase emissions primarily stemmed from concrete sandwich elements, which exhibit relatively high emission factors for waste treatment (C3) in the national emissions database.
The project’s carbon handprint was primarily attributed to the recycling and reuse of concrete components (D1) and the climate benefits of carbonation (D). Floor slabs contributed significantly to the carbon handprint, estimated at approximately 33% (−112 tons of CO2e) of the building’s carbon handprint, consisting of approximately 44% recycling and reuse of components and 56% from carbonation of cement-based products. Following floor slabs, facades were the next significant contributor to the carbon handprint, estimated at −75 tons of CO2e, approximately 22% of the estimated total carbon handprint.
According to the evaluation tool provided by FMoE, the project’s total life cycle carbon footprint was estimated at 6940 tons of CO2e. This equates to approximately 18.89 kgCO2e emissions per heated square meter annually. Consequently, when evaluated using FMoE’s tool, the project’s overall carbon footprint appeared to be roughly 24% smaller compared to the assessment conducted using our custom assessment (Excel) tool developed in this study.
The emissions from the manufacturing, transportation, and construction phases (A1-A5) of the project were approximately 18% smaller when assessed with FMoE’s tool compared to our custom assessment (Excel) tool developed in this research. However, operational emissions (B) showed a reduction of around 24%, while demolition phase emissions were approximately 54% lower. Notably, FMoE’s assessment tool doesn’t incorporate the benefits of carbonation of cement-based materials (D5) or the reuse and recycling of building components (D1), resulting in no attributed carbon footprint for the project according to this assessment.
In FMoE’s assessment tool, material quantities were inputted in kilograms, except for windows, glass facade systems, glass walls, and doors, which were entered in square meters, reflecting their emissions per square meter in the tool’s material database in kgCO2e/m2. Consequently, discrepancies in the results of the product phase (A1–A3) assessment arise from variations in the emission factors employed.
The most significant disparities in carbon footprints in the product phase were observed in the estimated emissions of glass facade systems, glass partition walls, and external doors. For instance, emissions from the product phase of the glass facade system (7 tons of CO2e) constituted only about 7% of the outcome derived from national emissions database emission factors (100 tons of CO2e). Similarly, emissions from glass partition walls (2 tons of CO2e) accounted for only around 3% of the result obtained with national emissions database data (39 tons of CO2e), while emissions from external doors (7 tons of CO2e) were approximately 9% (76 tons of CO2e). However, emissions from hollow-core slabs in the tool (331 tons of CO2e) were merely one percentage point lower than those assessed using emission factors from the emissions database (335 tons of CO2e).
Apart from glass facade systems, glass partition walls, and external doors, substantial individual deviations in the results of the product phase assessment were not observed. Instead, emissions estimated using FMoE’s tool consistently showed lower values compared to those estimated using emission factors from the national emissions database. Nonetheless, since FMoE’s assessment tool was published in 2019, its material database might be somewhat outdated. Thus, it is considered a supplement to the national emissions database, presumed to provide current research data in this study.
Regarding emissions related to energy consumption, FMoE’s assessment tool doesn’t furnish the emission factors employed in the assessment. Instead, the tool only inputs estimated purchased energy consumption by energy type, hence limiting further analysis of the disparities in the results of the operational phase emissions assessment.
It’s notable that when scrutinizing the results derived from FMoE’s assessment tool, the internal material database of the tool didn’t allow for all evaluated materials to be categorized into their respective building component classes. Consequently, the distribution of emissions by building component class provided doesn’t align with the classification of materials in the original material list.
3.3. Comparison of LCAs of Structural Systems
Based on the LCAs of structural systems, the timber-framed option emerged with the smallest carbon footprint (
Figure 5), while the steel-framed option displayed the largest carbon footprint. However, the disparity in estimated carbon footprints between concrete and steel-framed options was relatively minimal. Instead, the variance in carbon footprints between concrete and steel-framed options in contrast to the timber-framed option was notable.
According to the assessment, the total carbon footprint of the timber-framed option amounted to 8379 tons of CO2e, about 8% smaller than that of the concrete-framed option, which stood at 9101 tons of CO2e. However, the total carbon footprint of the steel-framed option was nearly identical at 9105 tons of CO2e.
Moreover, the timber-framed option exhibited the largest carbon handprint. As per the assessment, the carbon handprint of the timber-framed option reached 1820 tons of CO2e, over five times that of the concrete-framed option, which measured 343 tons of CO2e. Nevertheless, the handprint of the steel-framed option was approximately 32% higher than that of the concrete-framed option, totaling 501 tons of CO2e. The discrepancy in carbon handprints between concrete and steel-framed options compared to the timber-framed option was substantial.
Throughout the manufacturing, transport, and construction phases (A1–A5), the carbon footprint of the timber-framed option markedly outperformed that of the concrete and steel-framed alternatives (
Figure 6). This advantage stems from the organic carbon sequestration inherent in timber materials during the manufacturing phase, which, as per the current iteration of FMoE’s assessment method guidelines, manifests as negative carbon dioxide equivalents (kgCO
2e) in the product phase assessment results.
Conversely, owing to the calculation methodology of carbon sinks, the timber-framed option demonstrated the largest carbon footprint during the demolition phase (C). This occurs because the carbon sinks present in timber components are released back into the atmosphere during demolition, per FMoE’s assessment method guidelines. Nonetheless, the organic carbon sequestered in timber components notably augmented the carbon handprint of the timber-framed option in terms of life cycle impacts (D), surpassing that of the concrete and steel-framed alternatives. Additionally, in comparison to the concrete-framed option, the carbon handprint of the steel-framed option was amplified by the considerable theoretical recycling and reuse potential of steel components (D1).
The impact of carbon sinks within the timber-framed option becomes evident when analyzing the cumulative annual emissions of the subjects over time (
Figure 7). During the construction phase (A), the carbon spike of the timber-framed option is notably lower compared to the concrete and steel alternatives. However, during the demolition and waste treatment phase (C), the carbon spike of the timber-framed option is significantly higher than that of its counterparts.
Conversely, carbon spikes during the operational phase (B) are linked to replacements of building services components, which are noted to occur at 15-, 20-, and 30-year post-building commissioning. Additionally, a singular carbon spike in the operational phase is observed due to the replacement of rubber bitumen membranes on the roof in year 35, which were found to be nearly equivalent in size according to this study.
3.3.1. Comparison of Product-Related Emissions
In this subsection, a separate examination of product-related emissions is conducted, encompassing emissions from manufacturing (A1–A3), replacements (B4), as well as demolition (C3) and waste treatment (C4). However, the assessment does not consider emissions from transportation, installation, and demolition work, as default values from the national emission database were utilized. Therefore, the focus is on scrutinizing the shares of emissions from building components in the assessed total emissions rather than conducting detailed type-specific assessments.
Upon scrutinizing the product-related emissions of the concrete-framed option (
Figure 8), it becomes apparent that the majority of emissions stem from building services components (1537 tnCO
2e). These components constitute nearly 41% of the assessed product-related emissions. The assessment of building services components relied on values provided in the national emission database, hence further disaggregation of results is not pursued in this case.
The second-largest emissions are attributed to the facade components of the building (671 tnCO2e), constituting approximately 18% of the total emissions. Among the facade components, the primary portion of emissions arises from concrete sandwich panels (374 tnCO2e), accounting for approximately 56% of emissions from facade components. Subsequently, the glass facade system (105 tnCO2e) contributes the second-highest emissions, estimated to constitute approximately 16% of the total emissions. Similarly, windows of the building contribute 16% of the total emissions (104 tnCO2e).
The substantial relative share of emissions from concrete sandwich panels is primarily due to their high mass, as the emission coefficient during the product phase does not appear notably high compared to other assessed building components. However, it’s worth noting that concrete sandwich panels exhibit the second-highest emission coefficient during the demolition phase (C) after EPS insulation, as retrieved from the national emission database. Conversely, the glass facade system and windows exhibit the highest emission coefficients among the compared building components and products.
Following facades, the next significant emissions originate from the floor slabs of the building (532 tnCO2e), constituting approximately 14% of the assessed emissions. Among the floor slabs, the majority of emissions stem from hollow-core slabs (375 tnCO2e), estimated to account for approximately 71% of the total emissions from floor slabs. Unlike concrete sandwich panels, the emission coefficients of hollow-core slabs do not appear exceptionally high compared to other materials, indicating that their relatively high emissions can be attributed to their substantial mass. Nevertheless, the handprint of the steel-framed option (501 tons of CO2e) was approximately 32% higher than that of the concrete-framed option. Nonetheless, the contrast in carbon handprints between concrete and steel-framed options in comparison to the timber-framed option remained significant.
In the steel-framed alternative, the relative proportions of product-related emissions remained relatively similar to those in the concrete-framed alternative (
Figure 9). The most significant change was observed in the emissions caused by beams (325 tons of CO
2e), which were found to be more than double in the steel-framed alternative compared to the concrete-framed alternative. In other words, DELTABEAM
® composite beams appeared to cause significantly more emissions in this case study than concrete beams.
The most significant reduction in emissions compared to the concrete-framed alternative was observed in the facade components (486 tons of CO2e), which were approximately 28% lower in total emissions than those of the concrete-framed alternative. This reduction in emissions was due to the facade’s PVP elements, whose carbon footprint was estimated to be 58% smaller than that of concrete sandwich elements.
In the timber-framed alternative, the relative proportions of product-related emissions changed significantly compared to the concrete-framed alternative (
Figure 10). In the timber-framed alternative, the share of emissions from building services increased as the total emissions decreased. Additionally, the emissions caused by the facade components emerged as the second-largest source of product-related emissions after building services.
The most significant reduction in emissions compared to the concrete-framed alternative was observed in the roof structures (168 tons of CO2e), whose carbon footprint was estimated to be about 40% of that of the hollow core slab roofs. Similarly, a notable reduction in emissions was observed in the total emissions from intermediate floors (352 tons of CO2e), whose carbon footprint was estimated to be about 66% of that of the intermediate floors in the concrete-framed alternative. According to the estimates, the reason for these emission reductions was the lower emission factors and the timber components.
3.3.2. Comparison of Individual Construction Parts
This subsection compares the types of construction used in different frame systems, focusing on life cycle emissions and examining the carbon handprints reported as effects outside the life cycle (D) of the structure types. Facade components were found to cause significant emissions in each frame alternative, with exterior walls being the most emission-intensive among them. Concrete sandwich elements had the largest carbon footprint, while PVP elements had the smallest, with PVP elements’ carbon footprint (158 tons of CO
2e) being 58% smaller than that of concrete sandwich elements (
Figure 11). CLT-framed exterior walls had a carbon footprint 26% smaller (277 tons of CO
2e) than concrete sandwich elements. Despite a higher product phase emission factor for PVP elements (2.1 kg CO
2e/kg) compared to concrete sandwich elements (0.28 kg CO
2e/kg), the total carbon footprint of PVP elements was smaller due to their lower estimated mass (63 tons) compared to concrete sandwich elements (100 tons).
The carbon handprint of CLT-framed exterior walls (217 tons of CO2e) is significantly larger than that of concrete sandwich and PVP elements, mainly due to the carbon sinks of CLT panels and climate benefits from energy recovery of timber components (D2). Excluding organic carbon nullified during demolition, the national emission database reports a product phase emission factor for CLT panels of 0.2 kg CO2e/kg, while in the effects outside the life cycle (D4), they sequester 1.6 kg CO2e/kg, forming a carbon footprint to handprint ratio of approximately 1:8. The waste management phase (C3) for CLT panels has an emission factor of 0.02 kg CO2e/kg, higher than that of strength class C30/37 ready-mixed concrete (0.006 kg CO2e/kg), and includes emissions from organic carbons released during demolition (1.6 kg CO2e/kg), resulting in a high carbon footprint for CLT panels during this phase. Intermediate floors were also significant in product-related emissions; in concrete- and steel-framed alternatives, most emissions came from hollow core slabs, while in the timber-framed alternative, they primarily came from the concrete slabs of the intermediate floors, which were heavier than the CLT panels.
The total life cycle carbon footprint of hollow core slab intermediate floors in the concrete-framed alternative is approximately 525 tons of CO
2e, while the CLT-concrete composite slabs have a carbon footprint of about 345 tons of CO
2e, making the latter about 34% smaller (
Figure 12). Conversely, the carbon handprint of CLT-concrete composite slabs (914 tons of CO
2e) is over eight times larger than that of the hollow core slabs (110 tons of CO
2e). The hollow core slab handprint comprises 56% from concrete carbonation and 44% from recycling and reuse benefits, while the CLT-composite slab handprint is mainly due to carbon sinks in CLT panels, accounting for 92%, with energy recovery benefits contributing about 3%. Roof structures also significantly impact emissions; in concrete- and steel-framed alternatives, hollow core slabs dominate the carbon footprint, while in timber-framed alternatives, insulation materials are the main contributors. The concrete-framed building’s roof structures emit 421 tons of CO
2e, compared to 129 tons in the timber-framed alternative, which is 31% of the hollow core slab roof emissions. The carbon handprint of the timber-framed roof structures (93 tons of CO
2e) is over four times larger than that of the hollow core slab roof structures.
In a concrete-framed office building, the total carbon footprint of roofs was estimated at 421 tnCO
2e (
Figure 13). In contrast, for the timber-framed option, the total carbon footprint of roofs was estimated at 129 tnCO
2e, nearly 31% of the carbon footprint of hollow core slab roofs. Conversely, the carbon handprint of roofs in the timber-framed option was estimated at 93 tnCO
2e, more than four times higher than that of hollow core slab roofs.
In examining product-related emissions, it was found that DELTABEAM
® composite beams, including the necessary infill concrete, had a total carbon footprint (340 kg CO
2e/kg) about 34% higher than that of concrete beams (254 kg CO
2e/kg). Conversely, the carbon footprint of LVL beams and protective cladding was approximately 78% lower than that of concrete beams (
Figure 14). Despite DELTABEAM
® composite beams weighing about 45% less (579 tons) compared to concrete beams (1048 tons), their higher product phase emission factor led to a greater carbon footprint. This higher emission rate was confirmed in the national emissions database and was particularly evident when analyzing emissions per meter of DELTABEAM
® composite beams with a D32-600 cross-section.
where 1775 kg CO
2e is the emission reported in the EPD data for a 7.5 m long composite beam with the load of the hollow core slab intermediate floors of the examined project. In contrast, using the values given in the national emissions database, for example, the meter-specific emissions for the largest concrete beam with a cross-section of 780 mm × 480 mm can be estimated with the formula
where 648 kg/m is the mass conversion factor indicated for the beam and 0.22 kgCO
2e/kg is the emission factor specified for the product stage (GWP A1–A3).
The environmental friendliness of DELTABEAM
® composite beams is significantly influenced by their high recycling and reuse potential. The carbon handprint of DELTABEAM
® composite beams (191 tnCO
2e) exceeds that of LVL beams, which have a combined handprint from carbon sinks and energy recovery benefits (170 tnCO
2e). Conversely, concrete flange beams have the smallest carbon handprint (61 tnCO
2e) due to their recycling and reuse potential (D1) and carbonation of concrete (D5). In comparing lightweight partitions, timber-framed partitions have a slightly higher carbon footprint (45 tnCO
2e) than steel-framed partitions (44 tnCO
2e), despite steel’s higher emission factors, because steel is lighter (
Figure 15). The carbon handprint of steel-framed partitions (6% of timber-framed) is only 6 tnCO
2e, compared to 11 tnCO
2e for timber-framed partitions. Although lightweight partitions contribute minimally to total emissions, this comparison highlights how materials with higher emission factors can have smaller carbon footprints due to differences in material mass.
4. Discussion and Conclusions
Our article presents comparative studies on the environmental impacts of five-story office buildings in Finland constructed with concrete, timber, and steel frames. It evaluates the LCA method of FMoE and proposes new calculation techniques to address its shortcomings and limitations. Our results are as follows: (a) Majority of the carbon footprint of the concrete-framed building originated from emissions associated with energy use. (b) Second-largest share of total emissions occurred during the product phase of the building, with building services contributing the most to product-related emissions within this phase. (c) A significant portion of these emissions came from the facades and floor structures. (d) Carbon footprint of the timber-framed option was significantly lower than that of its concrete- and steel-framed counterparts. (e) Carbon footprint of the steel-framed option was nearly equivalent to that of the concrete-framed option. (f) Estimated carbon handprint of the timber-framed option was considerably higher than that of the concrete- and steel-framed options, primarily due to the carbon storage capacity of the timber components. (g) Steel-framed option’s carbon handprint surpassed that of the concrete-framed option because of the high recycling and reuse potential of steel components. (h) LCA method used by FMoE has some unclear areas. Additionally, our findings indicated that the longevity of building materials indicates that when using the FmoE assessment method, most timber products are projected to end up in energy recovery by the end of their lifespan. This contributes to considerable emissions during the demolition and waste processing stages of timber framed buildings. However, this method of calculation overlooks the potential for lifespans exceeding 50 years and the complete recyclability of wooden products.
It is worth noting that based on our findings, timber-framed buildings offer a markedly reduced carbon footprint compared to alternative construction methods, stemming from several critical factors. Firstly, the materials used in timber frames, as evaluated by national emissions databases for construction, consistently exhibit lower carbon emissions across their entire lifecycle. This advantage arises from the inherently lower energy requirements and emissions associated with timber production and processing relative to materials such as concrete or steel. Additionally, timber’s structural properties yield lighter building components, reducing both overall mass and the embodied carbon linked to transportation and construction activities. Consequently, when assessing the environmental impact of timber-framed structures, these cumulative benefits lead to a substantially diminished carbon footprint. This underscores timber-framed construction as a compelling and sustainable choice amidst modern building practices, aligning with global efforts towards reducing environmental impact and promoting ecological balance.
This paper, through lifecycle calculations, highlights the increasing significance of product-related emissions, which current measures often overlook. It also underscores the emission reduction potential of different materials, such as timber compared to concrete and steel. FMoE’s assessment method remains partly interpretative, particularly regarding cement carbonation and component replacement. A cross-disciplinary approach is essential, emphasizing the need for carbon literacy among all stakeholders to understand and implement low-carbon design effectively. This necessity extends beyond industry experts to encompass a broader societal imperative.
Our research shares both similarities and differences with research conducted on LCA of office buildings in different contexts [
31,
32,
33,
34,
35,
36,
37,
38,
39]. Studies from Malaysia and Sri Lanka emphasized the dominance of cement and steel in embodied emissions, with Malaysia using an LCA-Multiple Linear Regression framework for precise predictions and Sri Lanka focusing on eco-friendly strategies. Luxembourg’s findings indicated a lower global warming potential (GWP) for steel-concrete composites compared to prefabricated concrete, with timber’s GWP highly dependent on end-of-life scenarios. In South Carolina, timber walls showed the lowest embodied impacts, whereas the operational stage dominates total environmental impacts for all building types. Norway’s retrofitting studies highlighted substantial emission reductions, particularly in operational energy use. The Netherlands utilized BIM-driven simulations for ecological and financial assessments, and Denmark explores the benefits of engineered disassembly. A global review underscores the significant energy demands during both operational and embodied phases, with operational impacts generally predominating. Lastly, Thailand’s study confirmed the substantial environmental burdens of steel and concrete, especially during the manufacturing phase, and emphasizes the predominance of operational phase impacts on global warming potential. Overall, our article focuses on comparing structural systems, showcasing timber-framed buildings as notably lower in carbon footprint due to carbon storage in timber components, while steel-framed options highlight recycling benefits. In contrast, studies from Malaysia, Sri Lanka, Luxembourg, South Carolina, Norway, the Netherlands, Denmark, Thailand, and a global dataset explore diverse aspects such as regional material preferences, retrofitting impacts, disassembly potentials, and operational versus embodied impacts.
When evaluating the implementation limitations of steel, timber, and concrete for office buildings, each material poses distinct challenges from a scientific perspective. Concrete, renowned for its strength and durability, is hindered by a substantial carbon footprint, predominantly due to emissions from energy consumption during its lifecycle and product phase, particularly impacting facades and floor structures. FMoE’s LCA method also presents ambiguities, notably in assessing cement carbonation impacts and the replacement cycles of building components. Timber, despite offering a significantly lower carbon footprint and a higher carbon handprint due to its inherent carbon storage capacity, faces limitations related to Finnish building regulations, susceptibility to decay, and availability, which could affect its long-term viability. Steel, while nearly equivalent to concrete in terms of carbon footprint, benefits from a superior carbon handprint because of its high recyclability and potential for reuse. However, steel’s high initial production emissions and the environmental impact of raw material extraction and processing remain significant drawbacks. Thus, the selection of building materials must consider these environmental impacts, structural capabilities, and lifecycle costs, especially in light of the current uncertainties in the Finnish LCA methodology.
The transition to statutory LCA in the construction sector is essential for Finland to meet its ambitious national emission targets and progress towards a carbon-neutral future. Current initiatives predominantly emphasize improving building energy efficiency; however, our research demonstrates that this singular focus is inadequate. A comprehensive strategy encompassing the entire lifecycle of buildings, from material extraction to demolition, is imperative. The proposed regulations outlined in HE 139/2022 will transform the construction industry, demanding new expertise and fostering innovation. Although the initial phase of these regulations may entail higher costs, they are anticipated to become standard practice, integrating sustainability deeply into industry norms. During the transition period, extensive research and feedback from practical applications will be crucial in fine-tuning assessment methods. Nonetheless, large-scale implementation is expected to uncover potential challenges and areas for further improvement, emphasizing the need for adaptive and iterative regulatory frameworks.
Our study’s findings on the environmental impacts of various framing materials for office buildings hold significant policy and practical implications for the Finnish construction sector. The clear evidence that timber-framed buildings exhibit a substantially lower carbon footprint and a higher carbon handprint compared to their concrete and steel counterparts suggests a strong case for promoting timber as a primary construction material. Policymakers could capitalize on these insights by revising building regulations and introducing incentives to favor timber usage, thereby contributing to national and global carbon reduction targets. Additionally, this study identifies critical ambiguities in FMoE’s LCA methodology, such as the assessment of carbonation in cement-based products and the lifecycle impacts of component replacement. Addressing these ambiguities is crucial for enhancing the precision and comprehensiveness of environmental assessments. Furthermore, our study’s emphasis on the scarcity of LCA research on office buildings, as opposed to residential structures, underscores the need for more targeted studies to develop nuanced strategies for emission reductions across different building types. This comprehensive approach could significantly inform design and material selection processes, driving sustainable construction practices and advancing Finland’s environmental objectives.
Governmental authorities and construction industry stakeholders should prioritize the widespread adoption and enhancement of LCA methodologies to bolster the sustainability of building practices, especially by addressing the identified shortcomings in the FMoE LCA method. Authorities should invest in research to develop clearer guidelines for evaluating the impacts of carbonation in cement-based products and the replacement of building components, ensuring more accurate environmental assessments. The industry should shift towards utilizing low-carbon materials, with a particular emphasis on timber framing, which has been shown to possess a significantly lower carbon footprint and a higher carbon handprint due to its carbon storage capacity. Additionally, improving the energy efficiency of building services and innovations in facade design are critical to reducing emissions, particularly those arising from the energy use and product phases of buildings. Promoting the recycling and reuse potential of steel components aligns with circular economy principles and can help reduce overall environmental impacts. Collaborative efforts between government and industry to refine LCA techniques and adopt sustainable materials and practices will be pivotal in achieving long-term environmental goals in the construction sector.
Future studies stemming from our research could delve into several areas to deepen our understanding of sustainable construction practices. Firstly, investigating alternative materials and innovative construction techniques beyond concrete, timber, and steel could provide a broader perspective on sustainable building options, particularly in the Finnish context. Secondly, conducting long-term assessments to track the actual environmental performance of these building materials over their entire life cycles could offer insights into their durability, maintenance requirements, and potential for carbon sequestration or emissions reduction. Additionally, exploring the socio-economic implications of adopting different construction methods, including factors such as job creation, local industry development, and community resilience, would contribute to a more holistic evaluation of sustainability in the built environment. Furthermore, refining and standardizing assessment tools for LCA, carbon footprint, and carbon handprint, taking into account regional variations and specificities, would enhance the comparability and reliability of future studies. Finally, engaging stakeholders from diverse backgrounds, including policymakers, industry representatives, environmental organizations, and end-users, in collaborative research initiatives could foster interdisciplinary dialogue and facilitate the implementation of evidence-based sustainability strategies in the construction sector, both in Finland and globally.


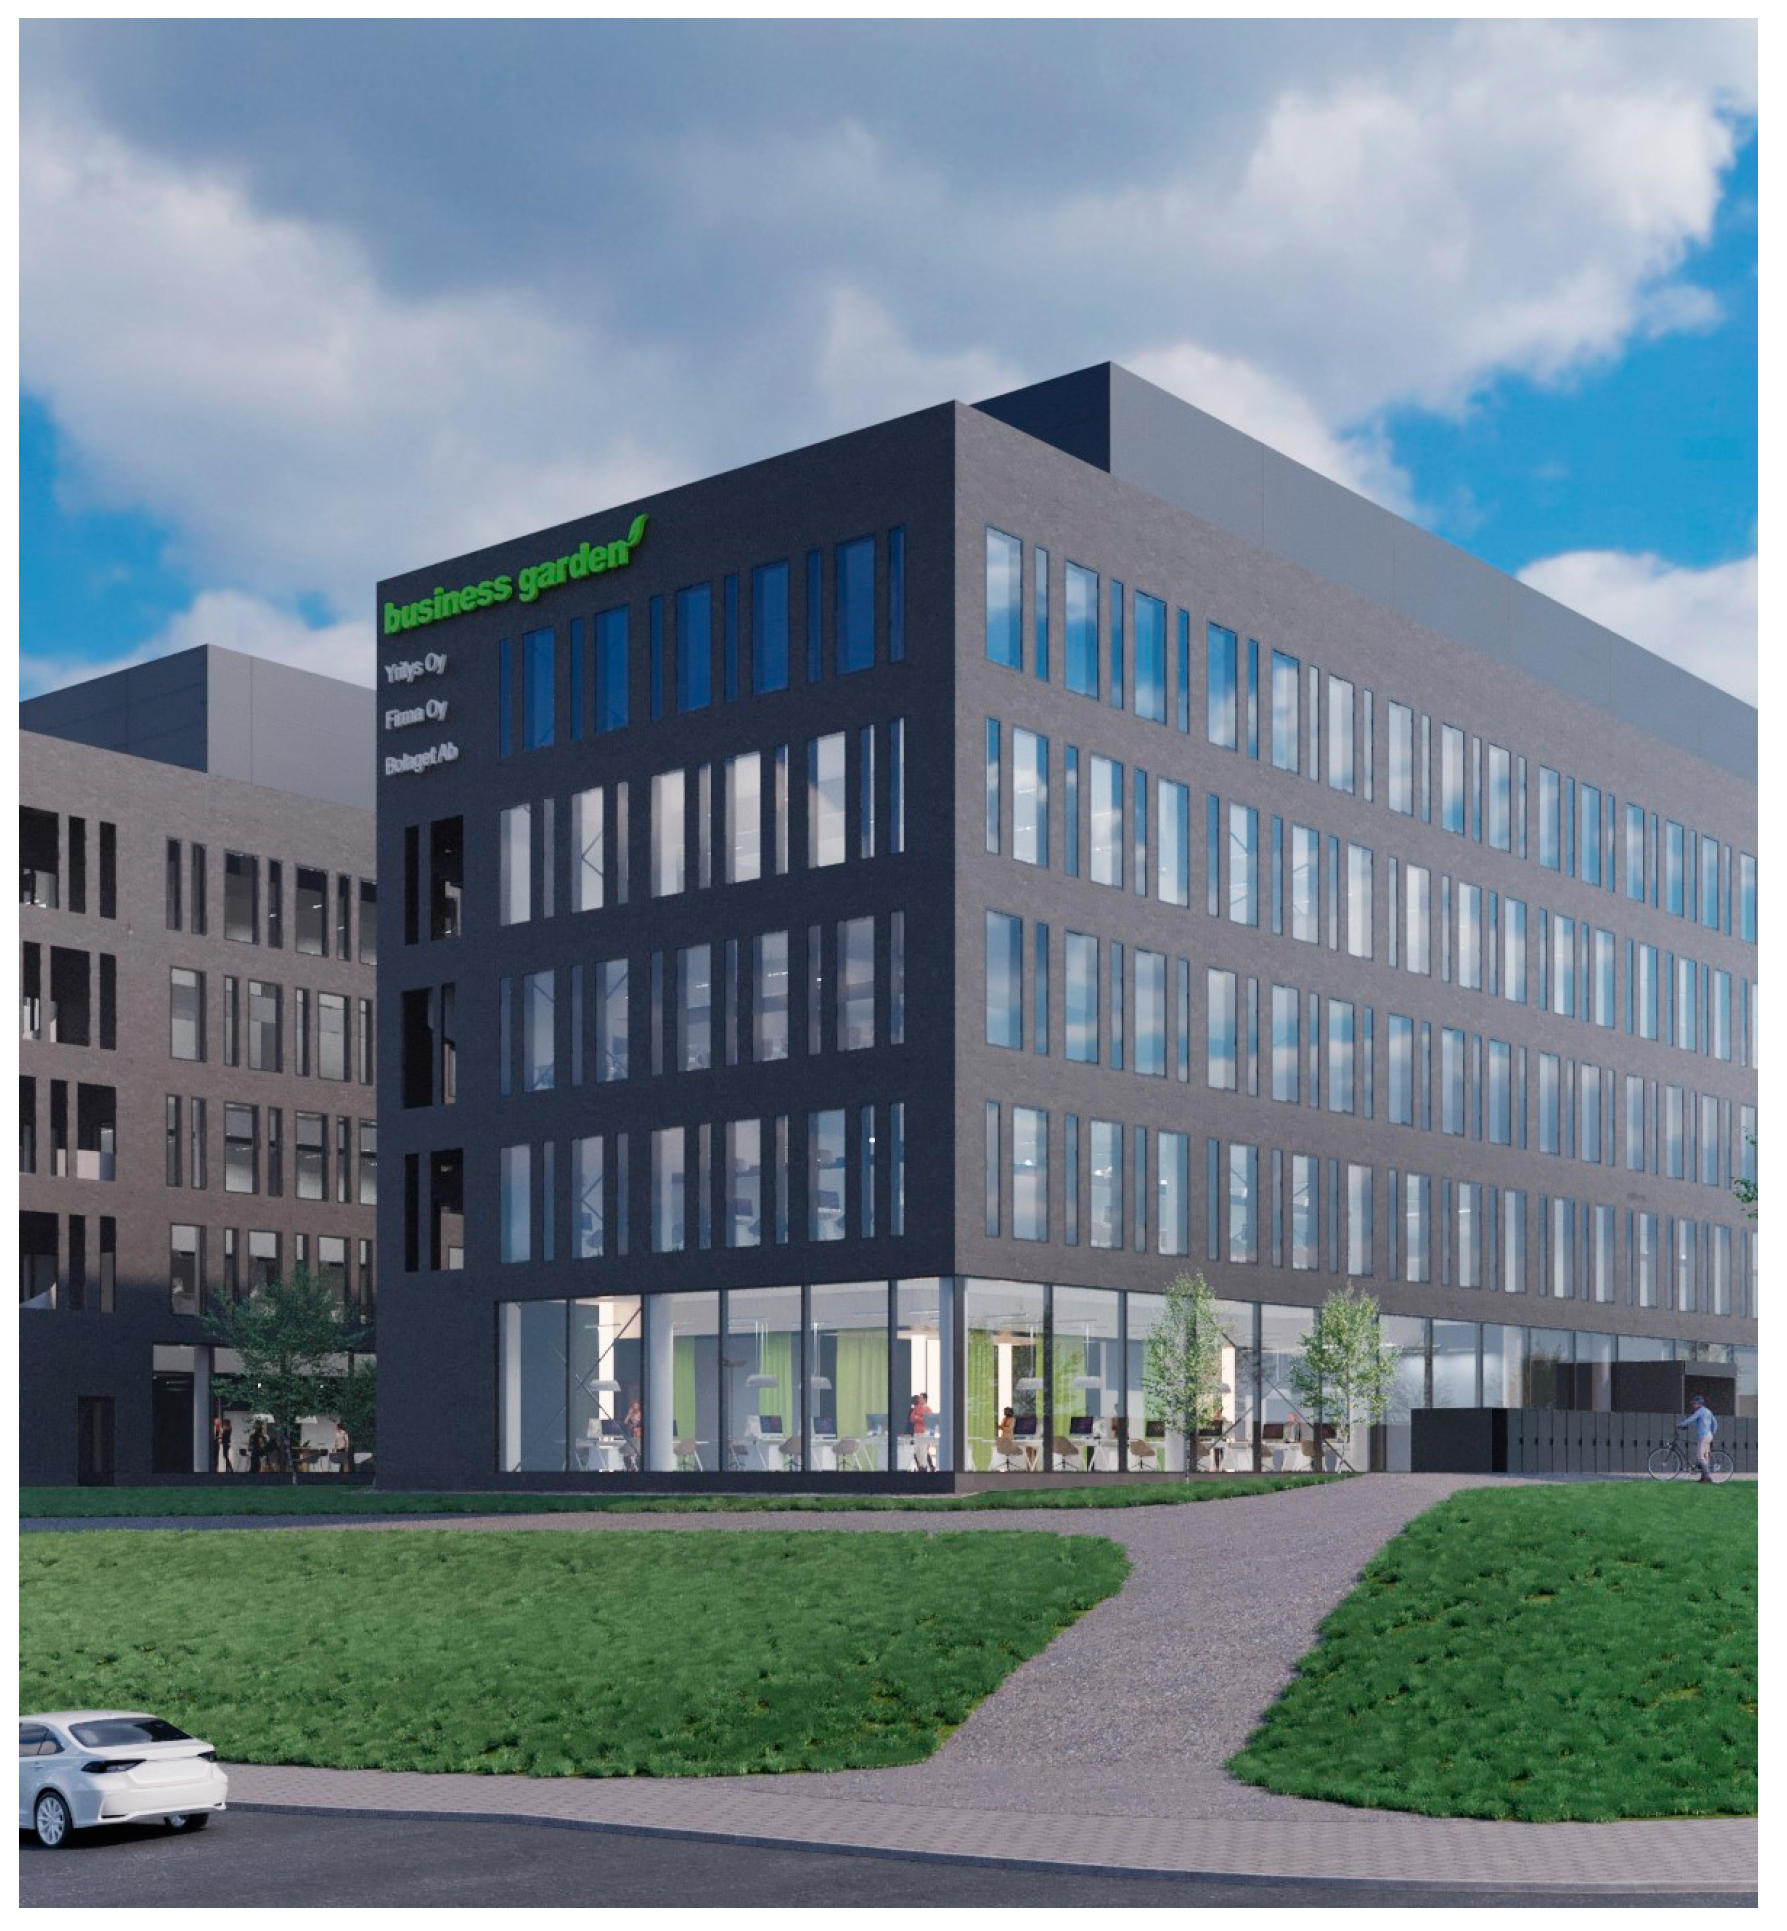
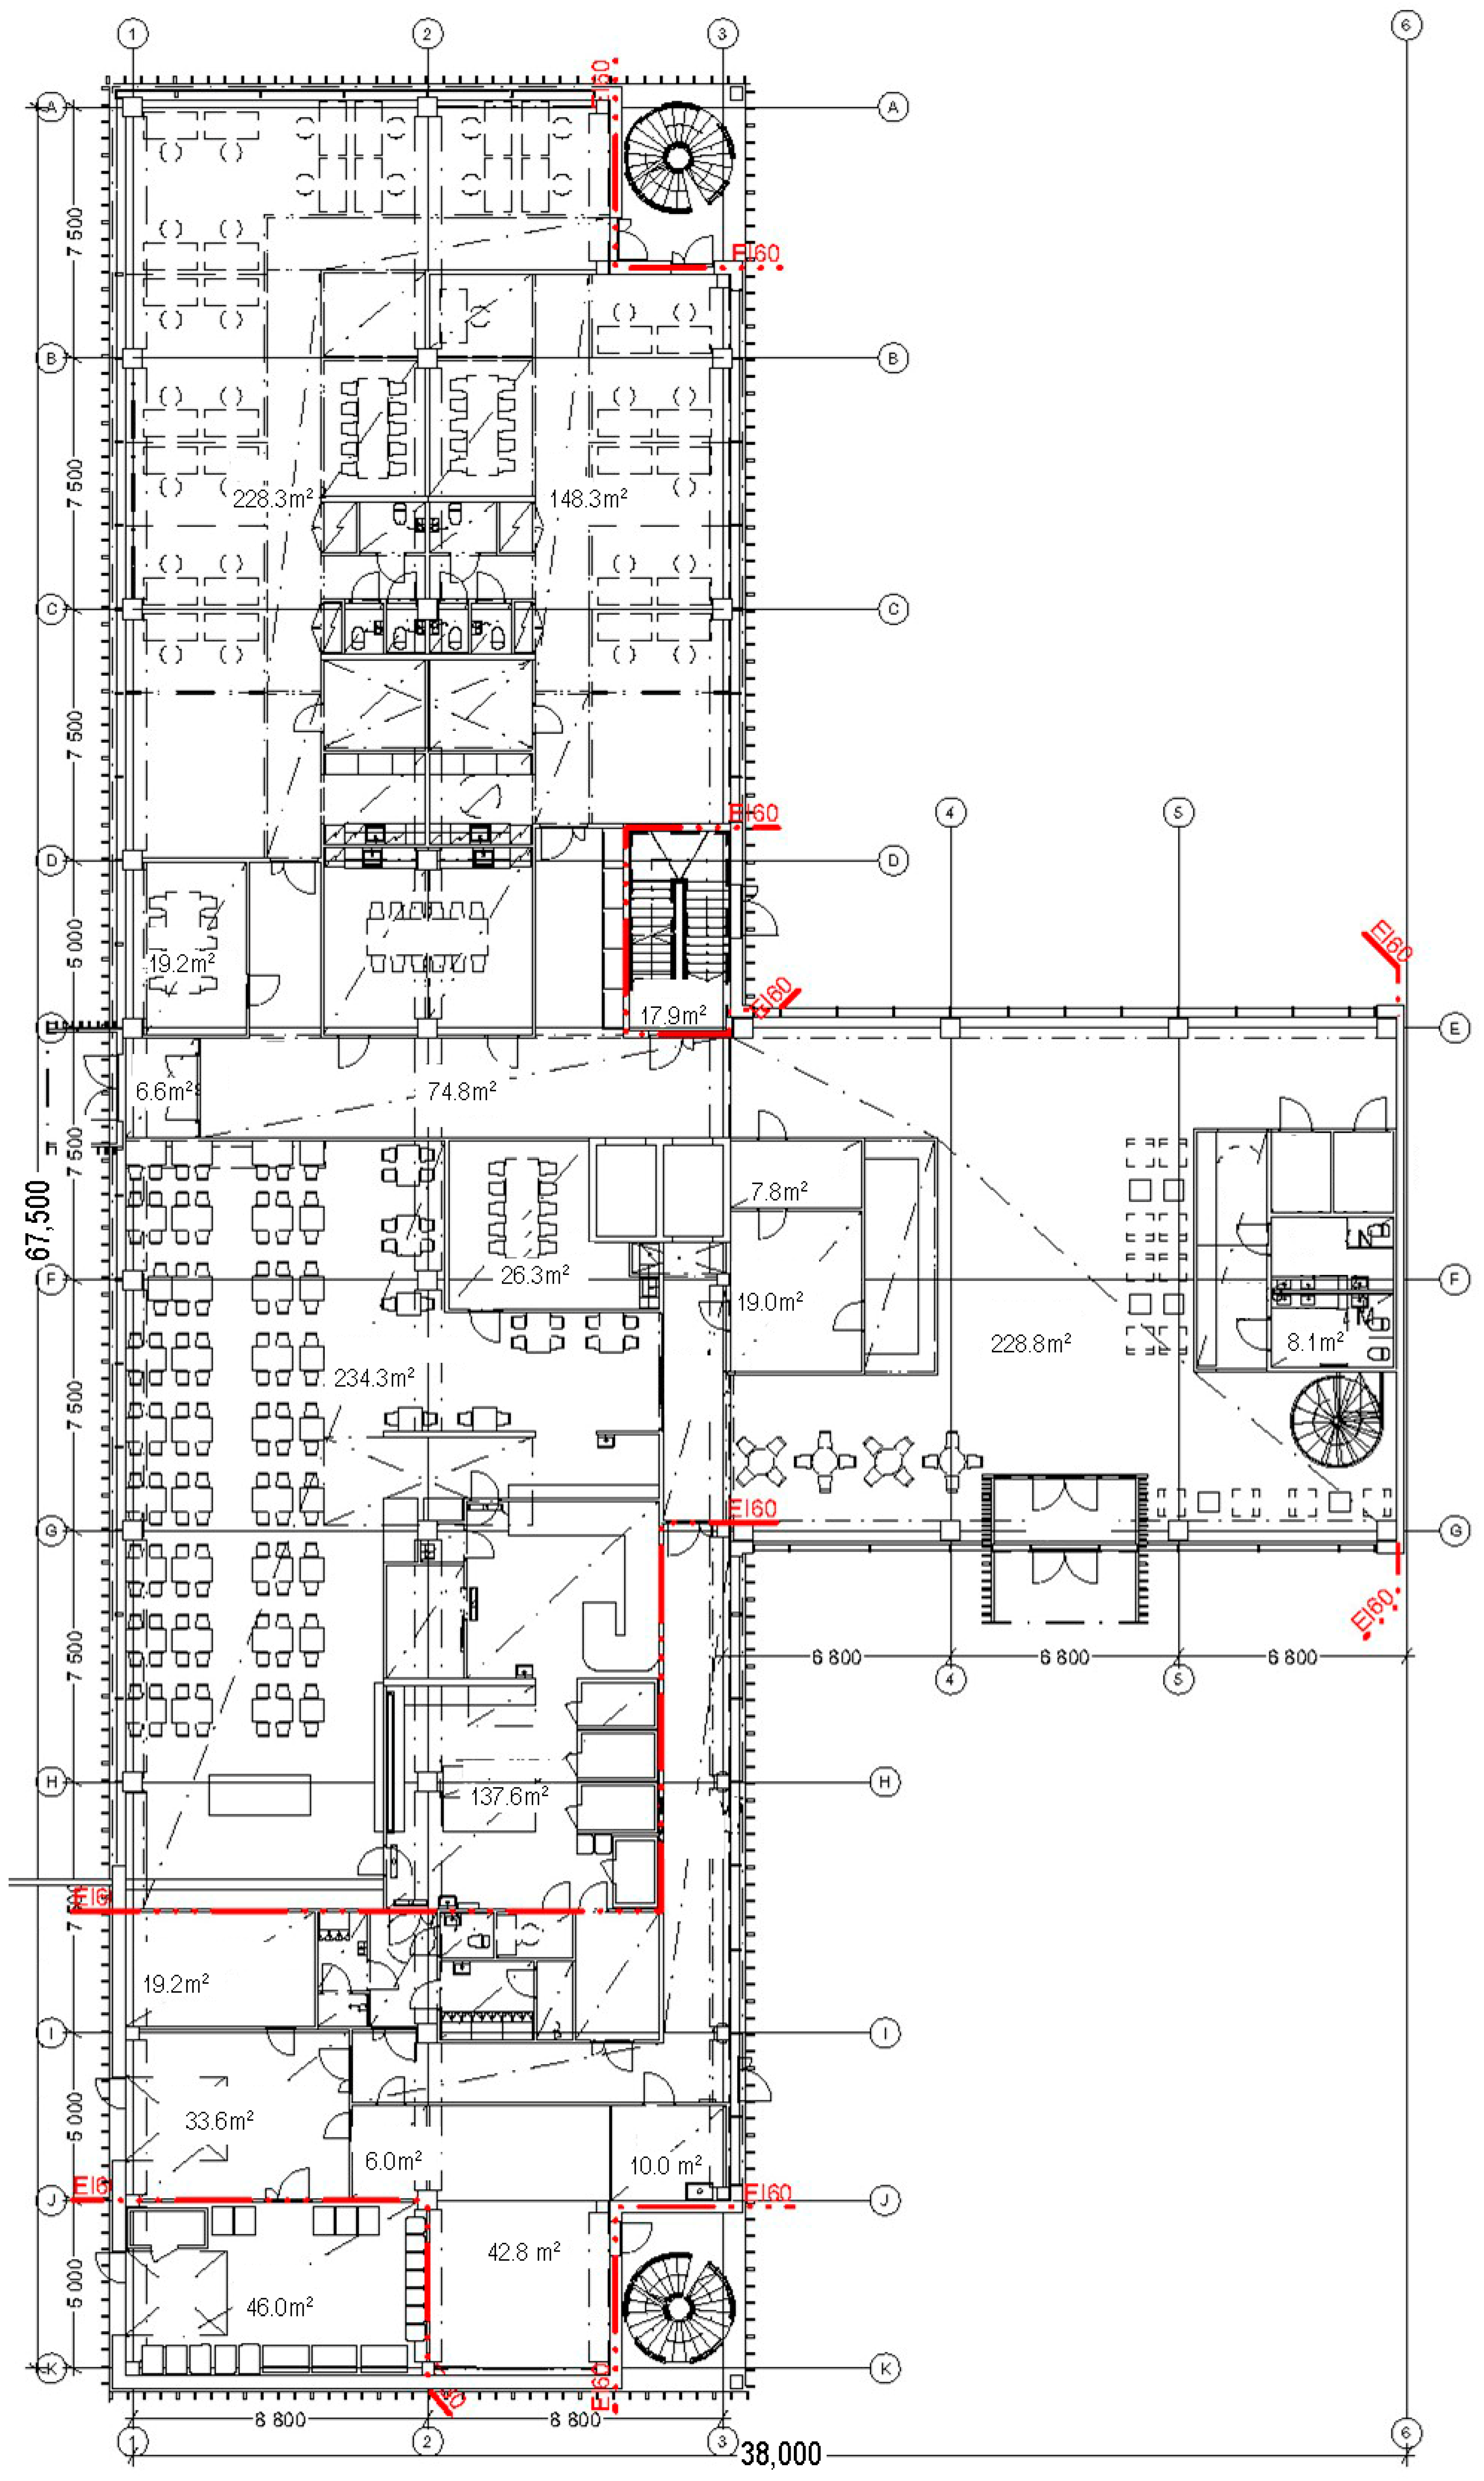
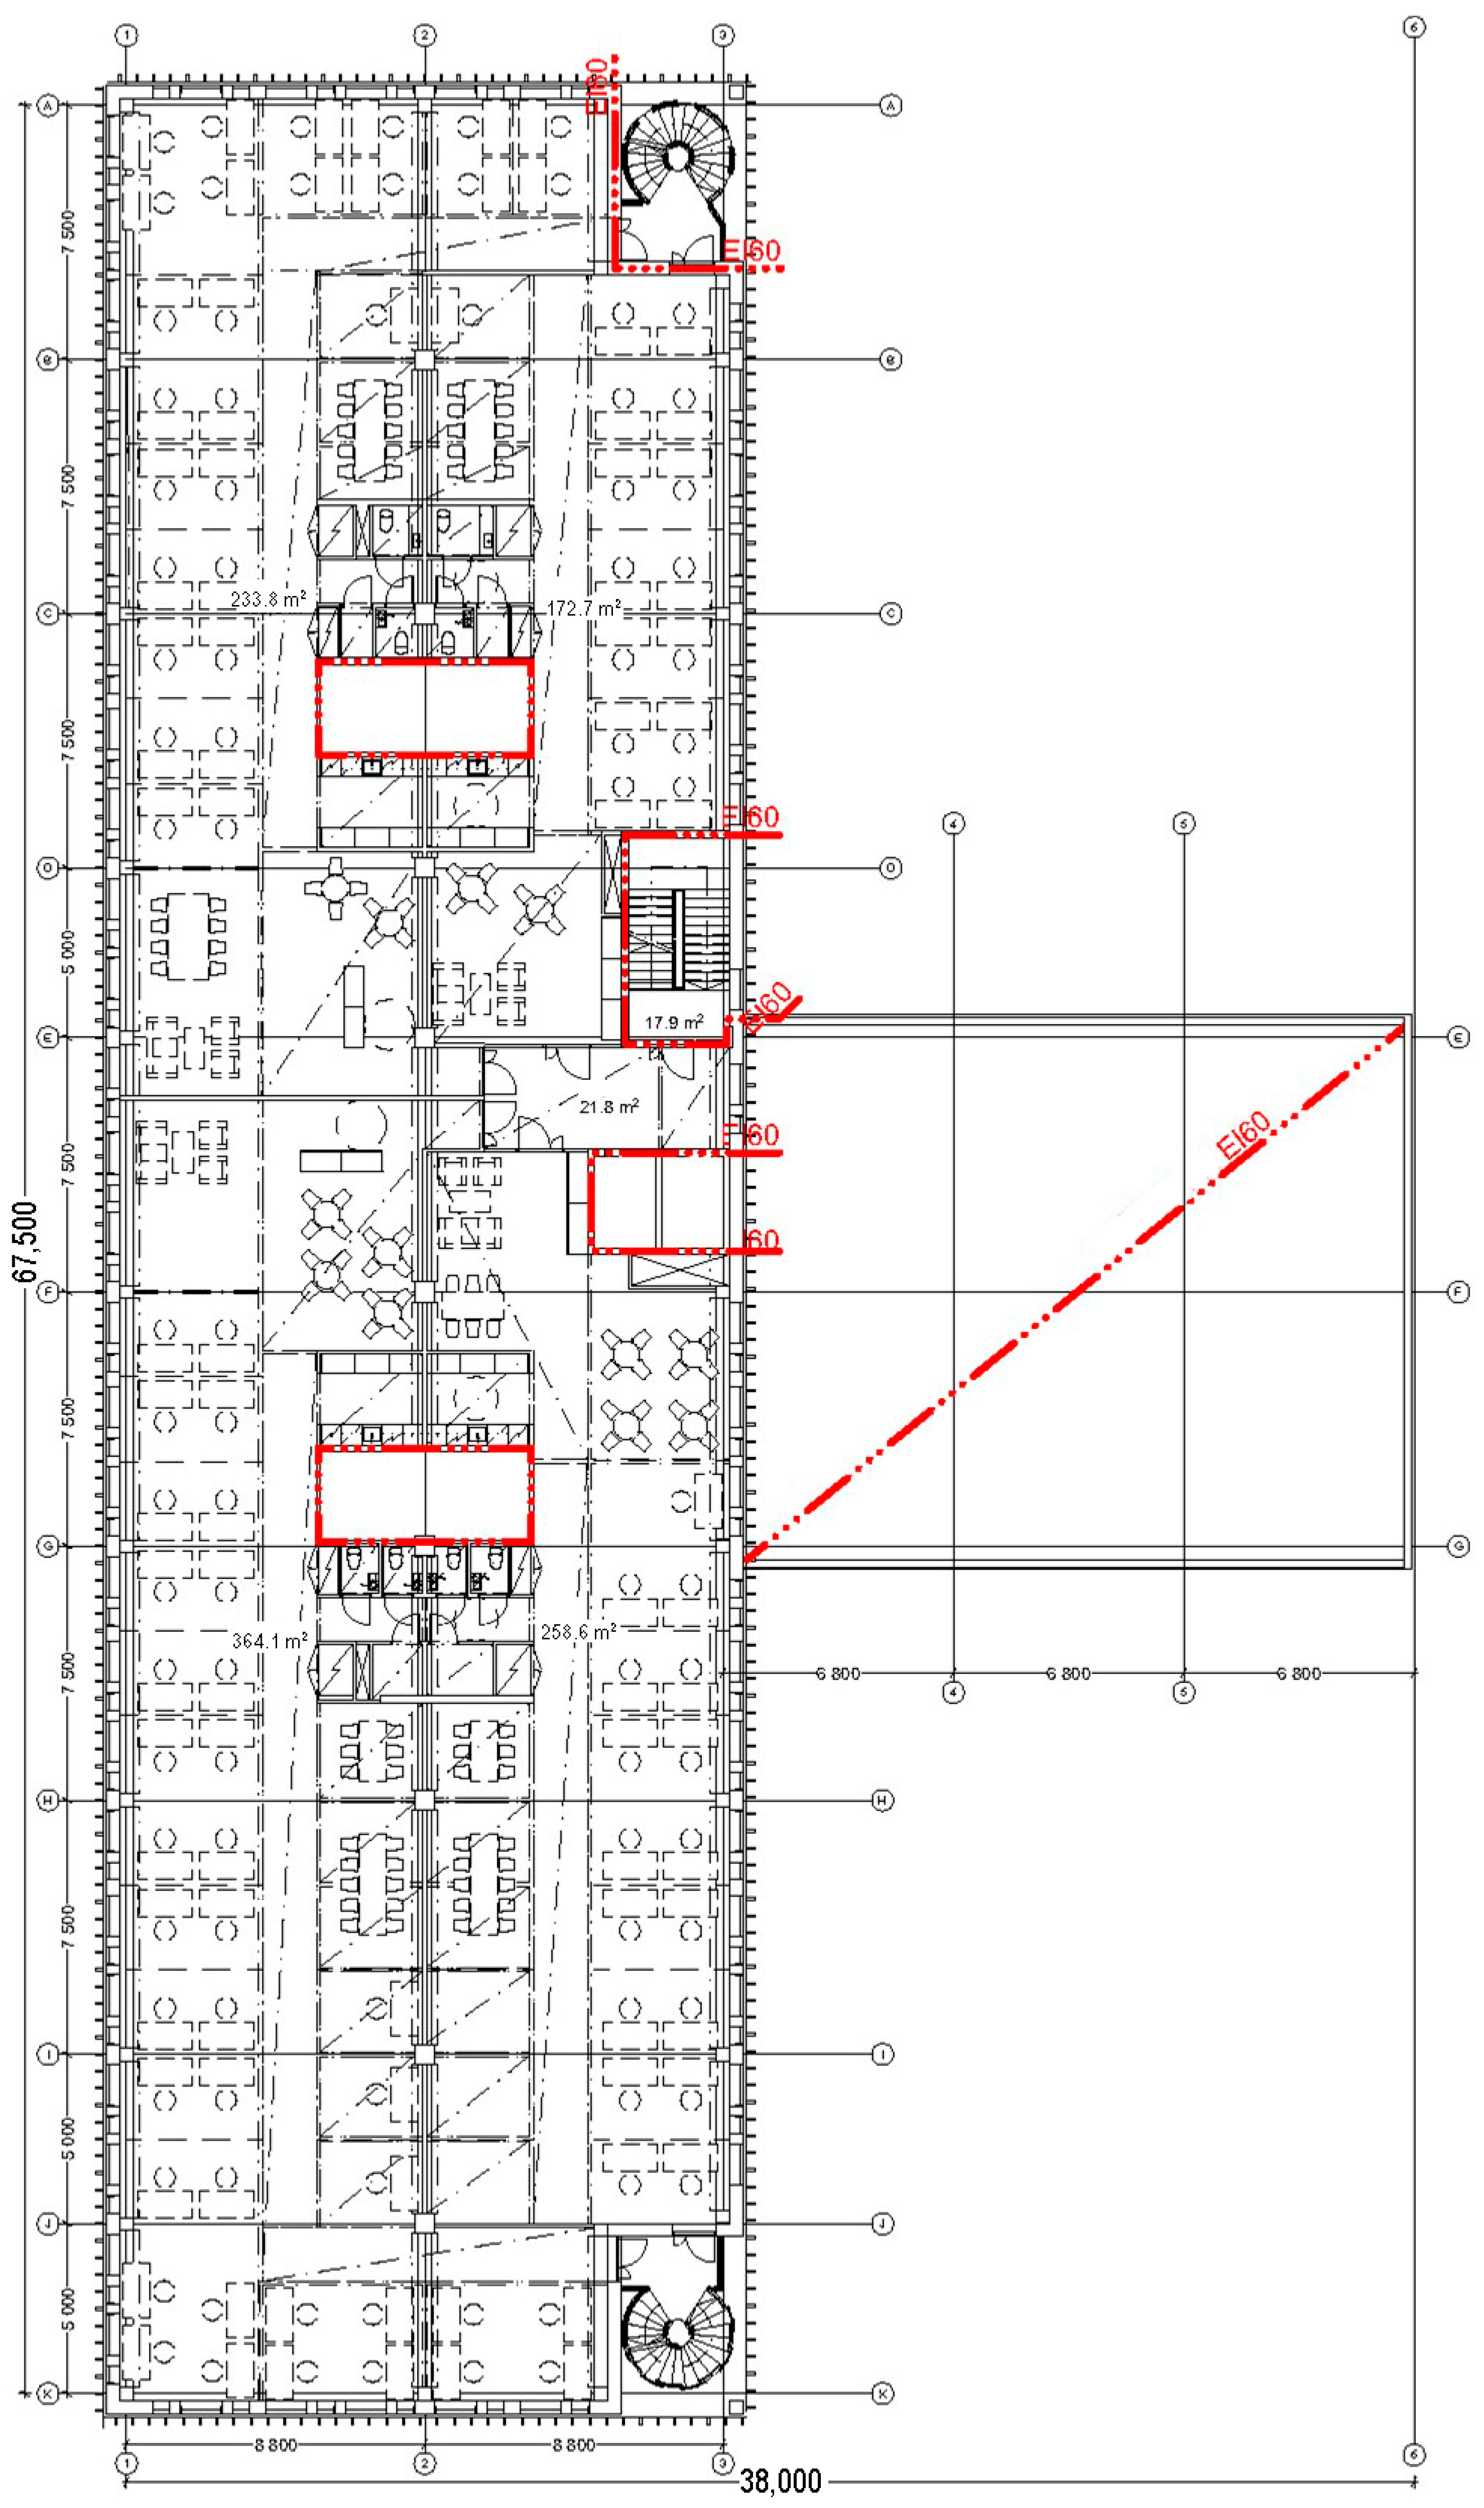
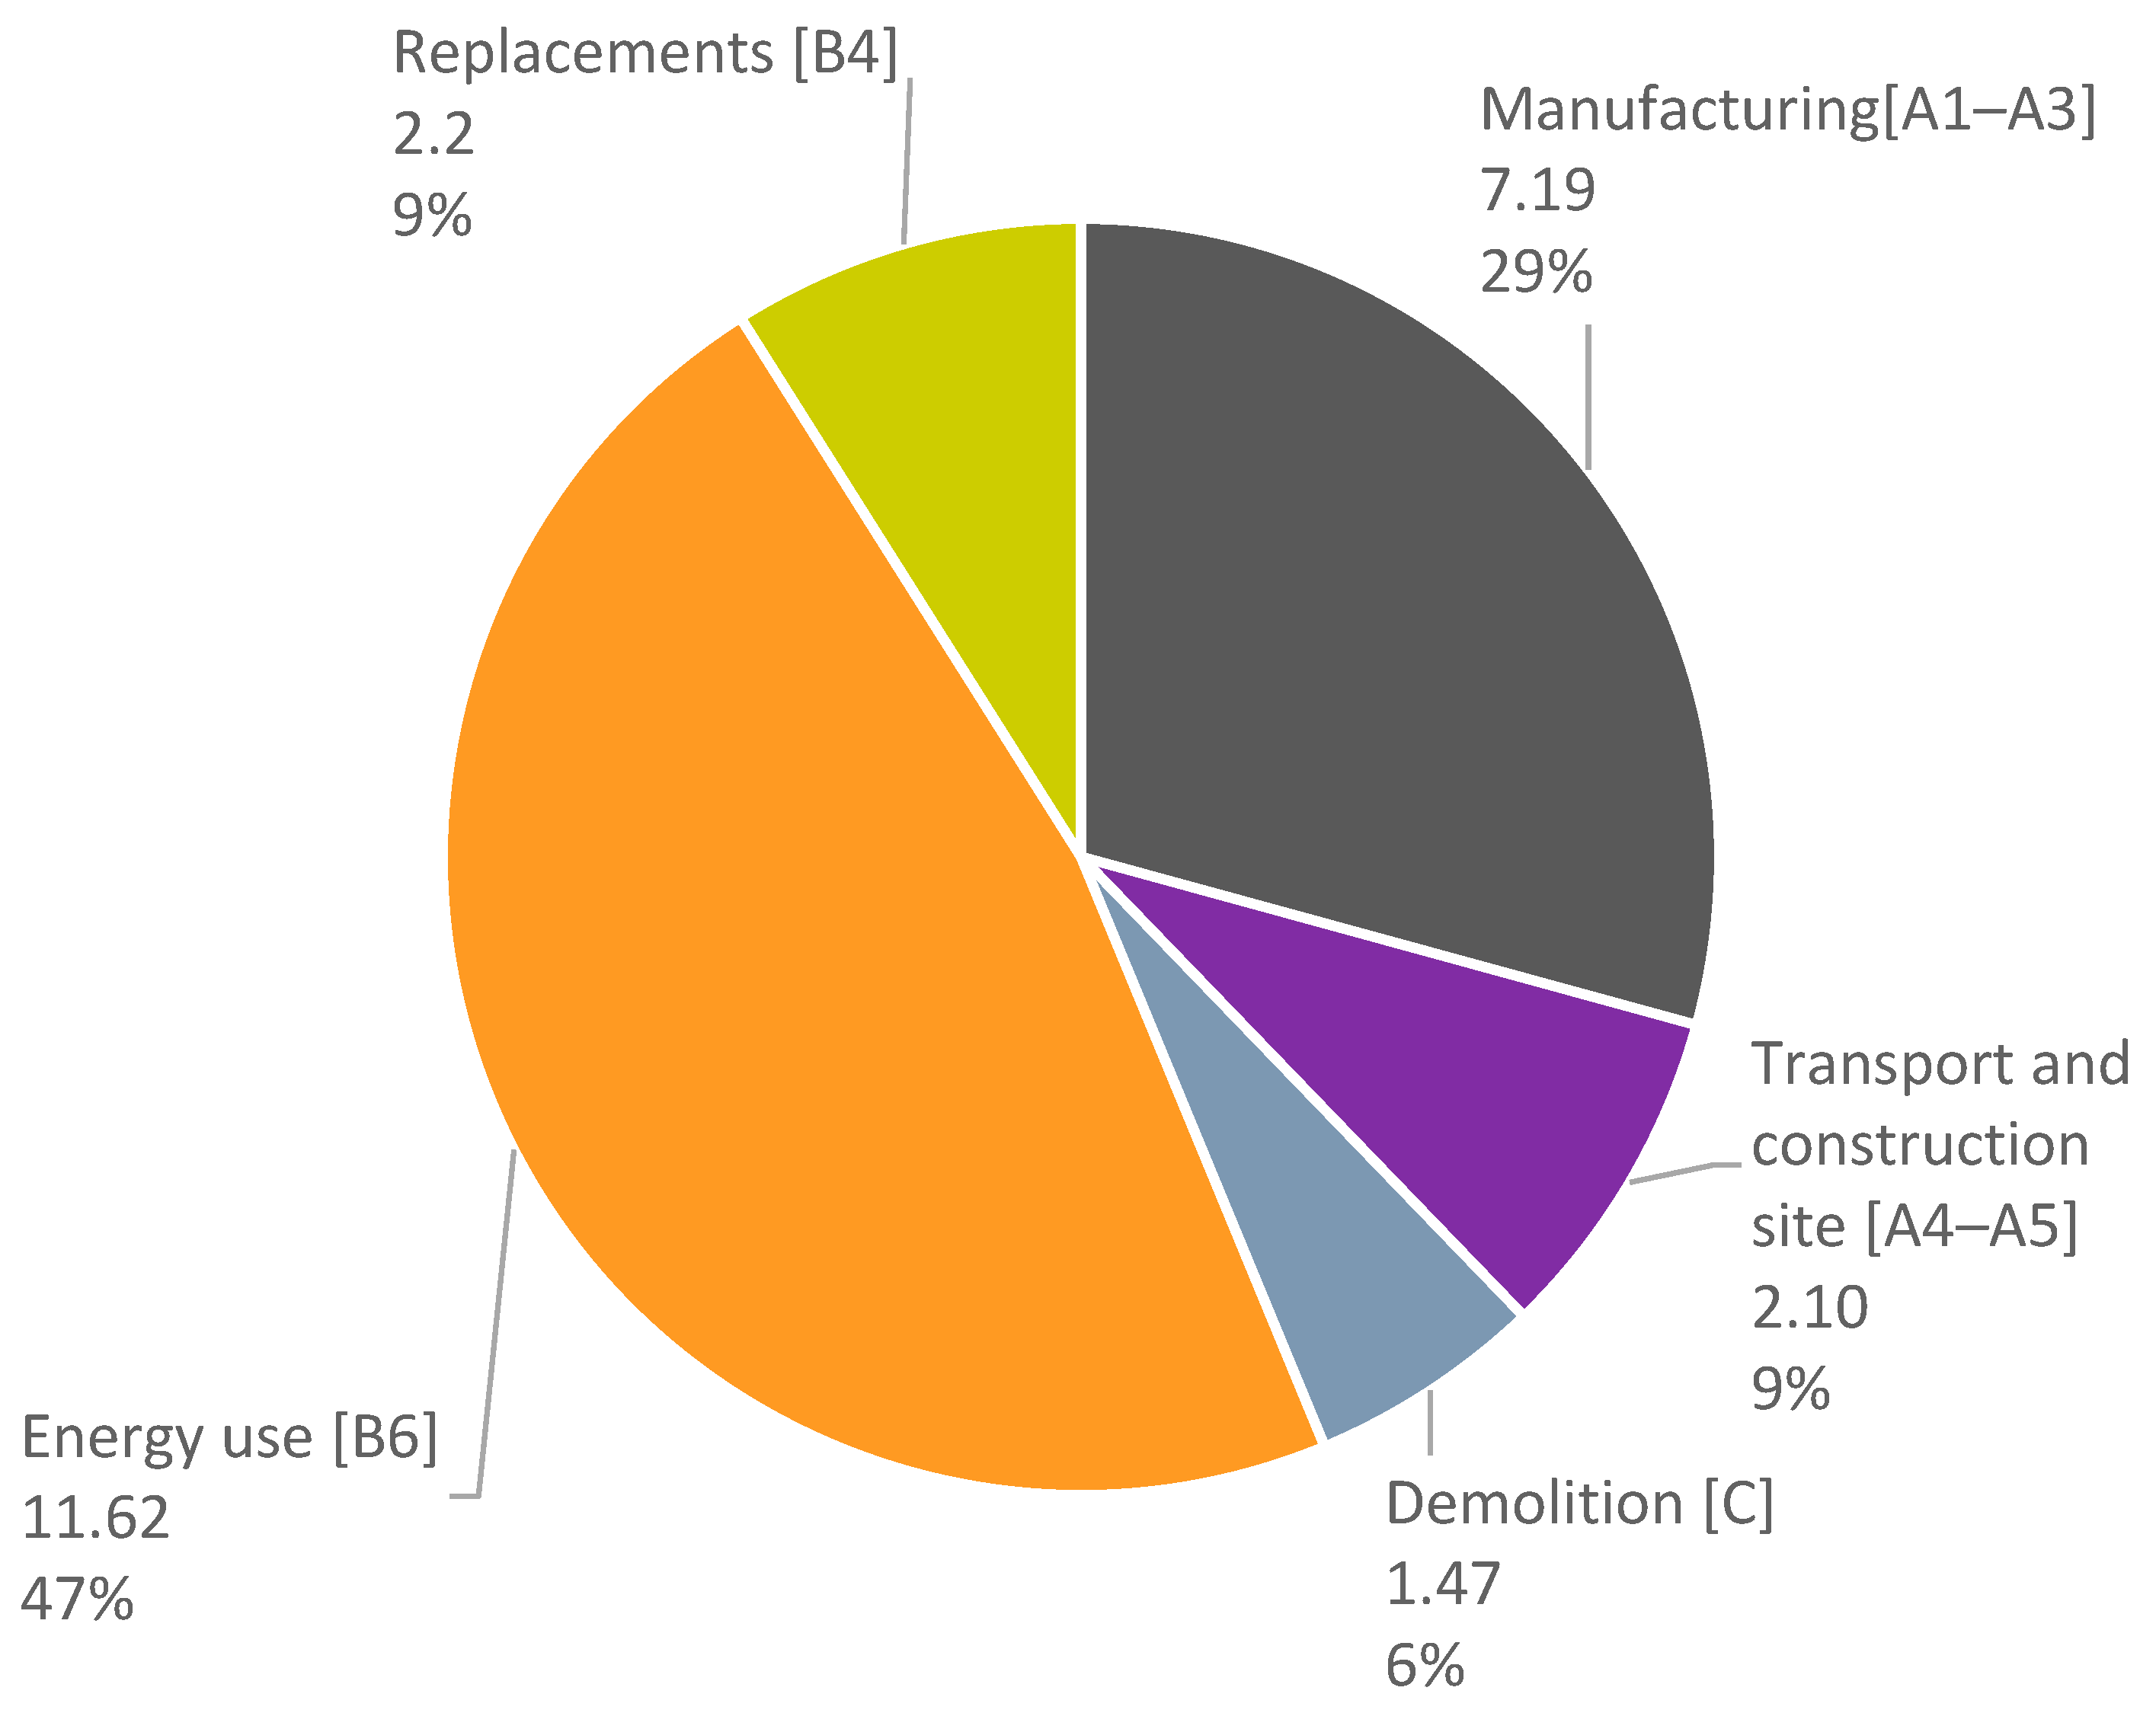
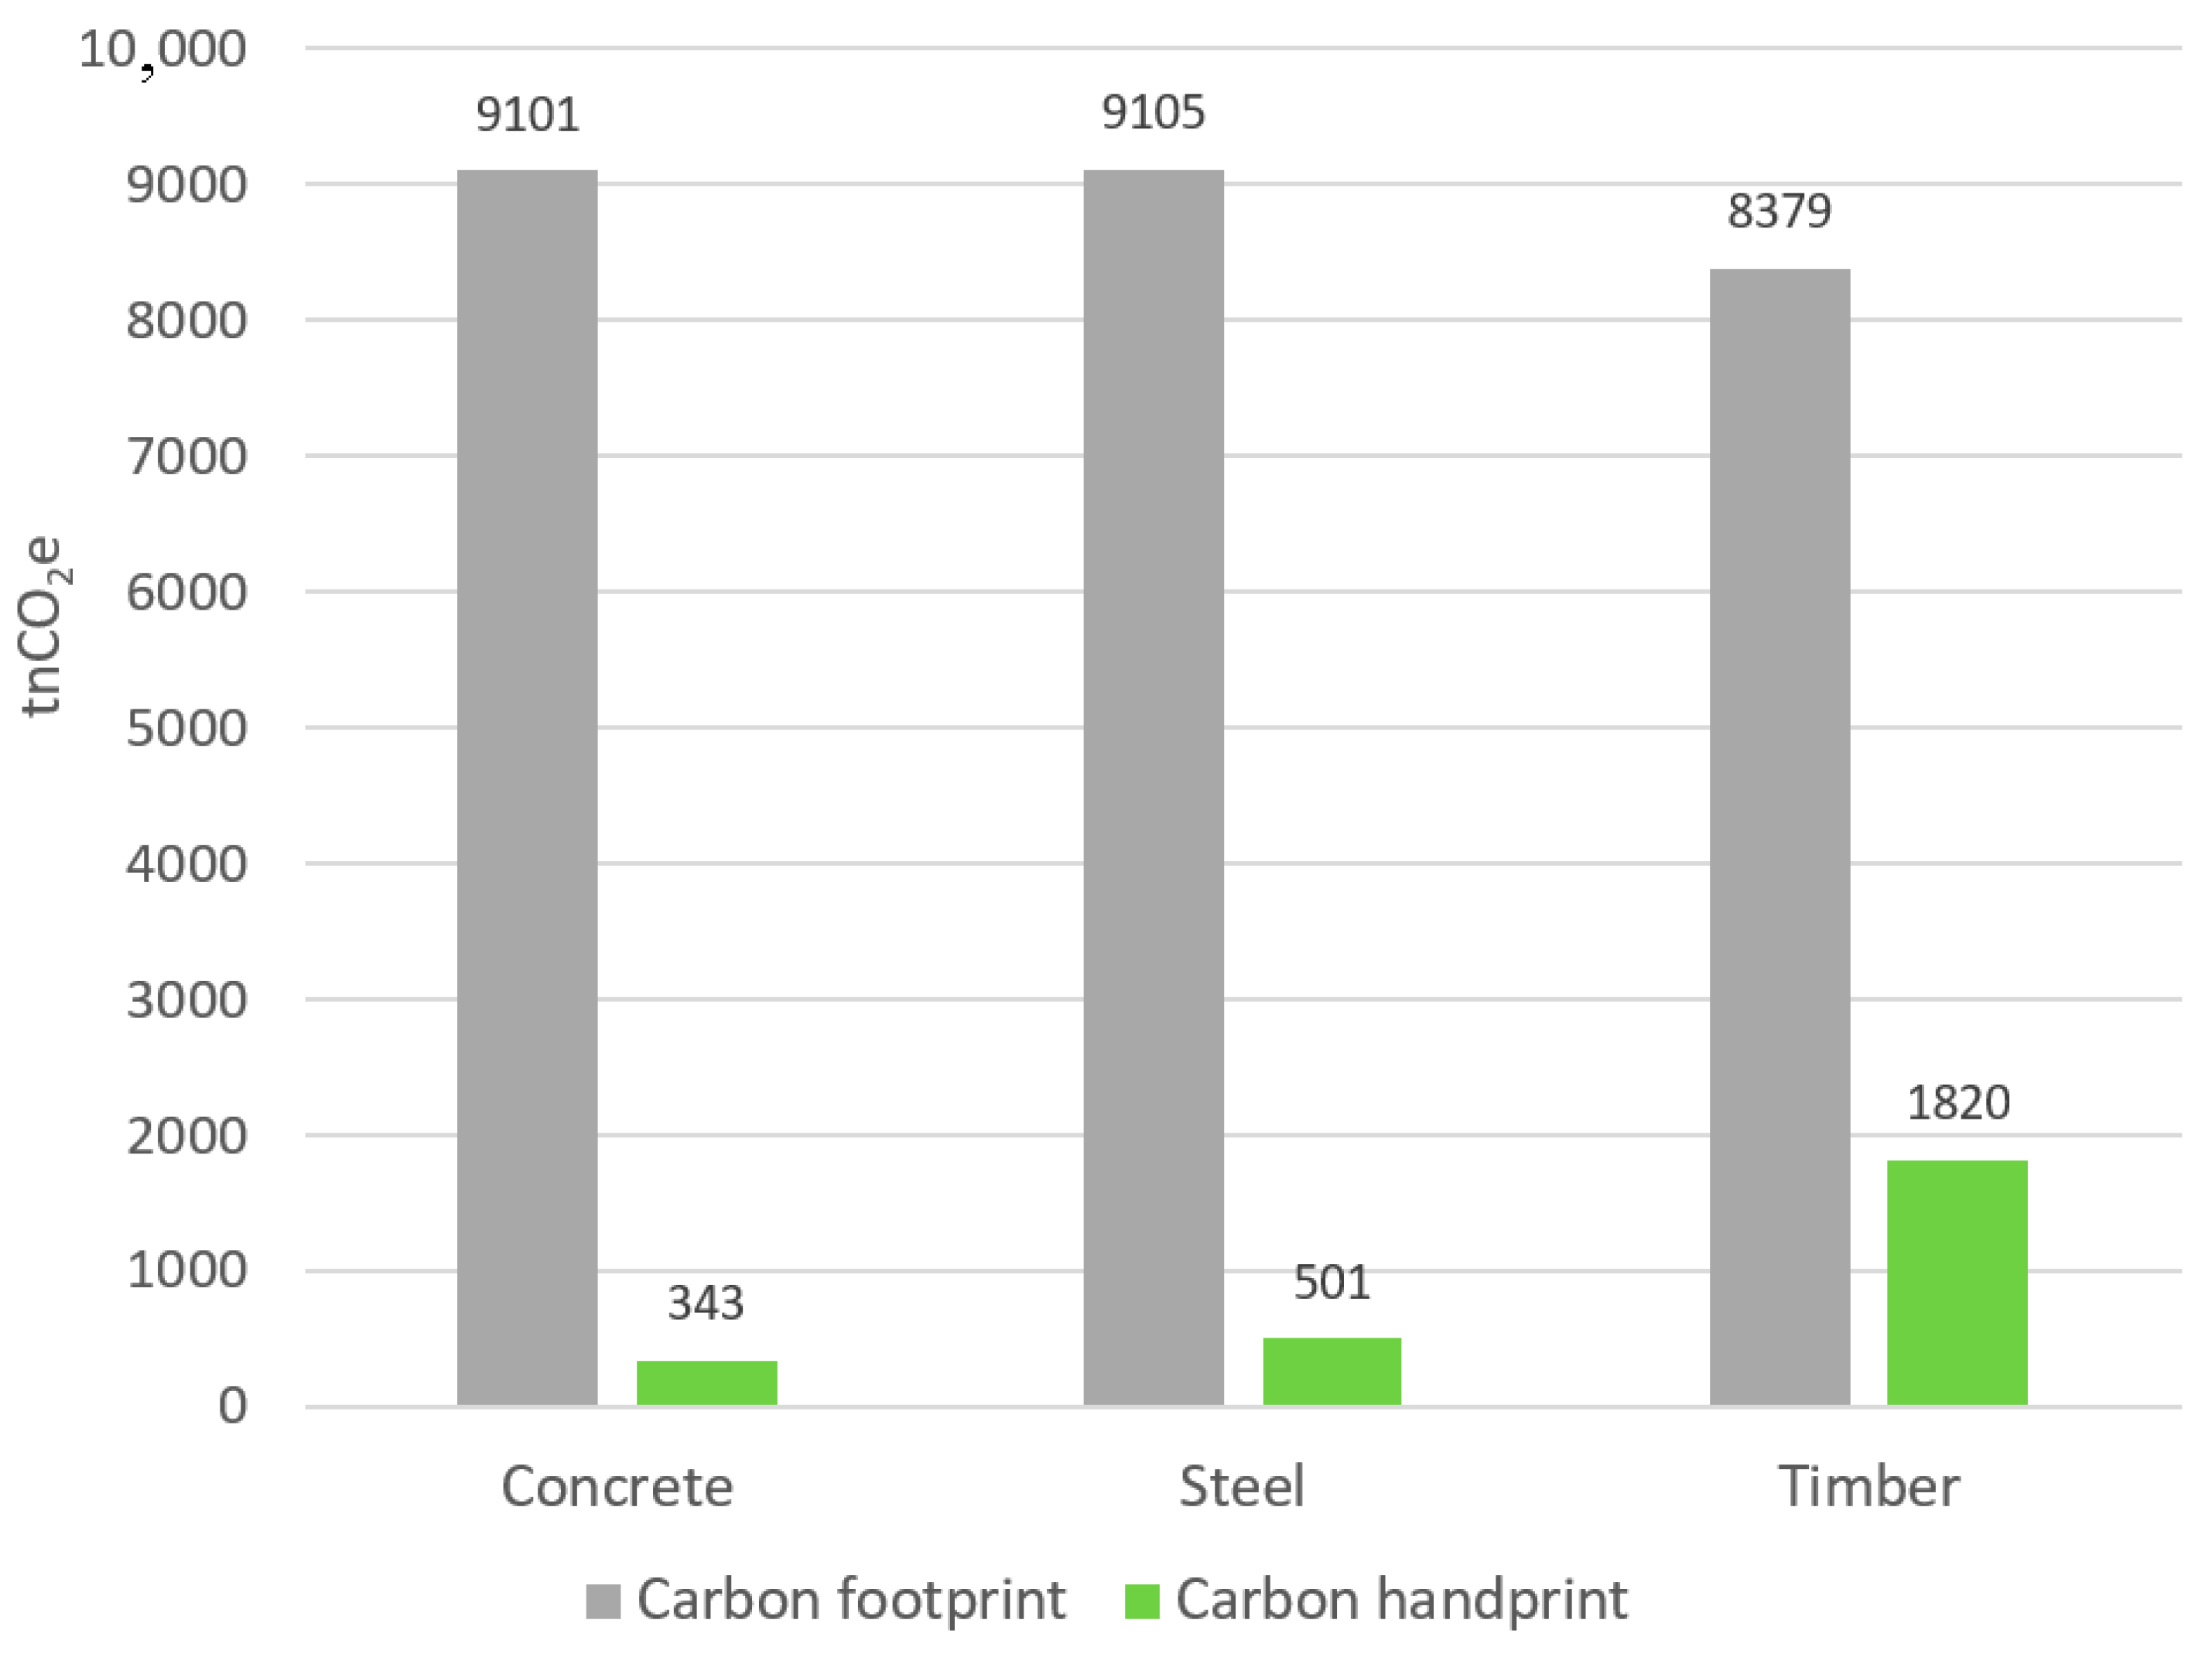
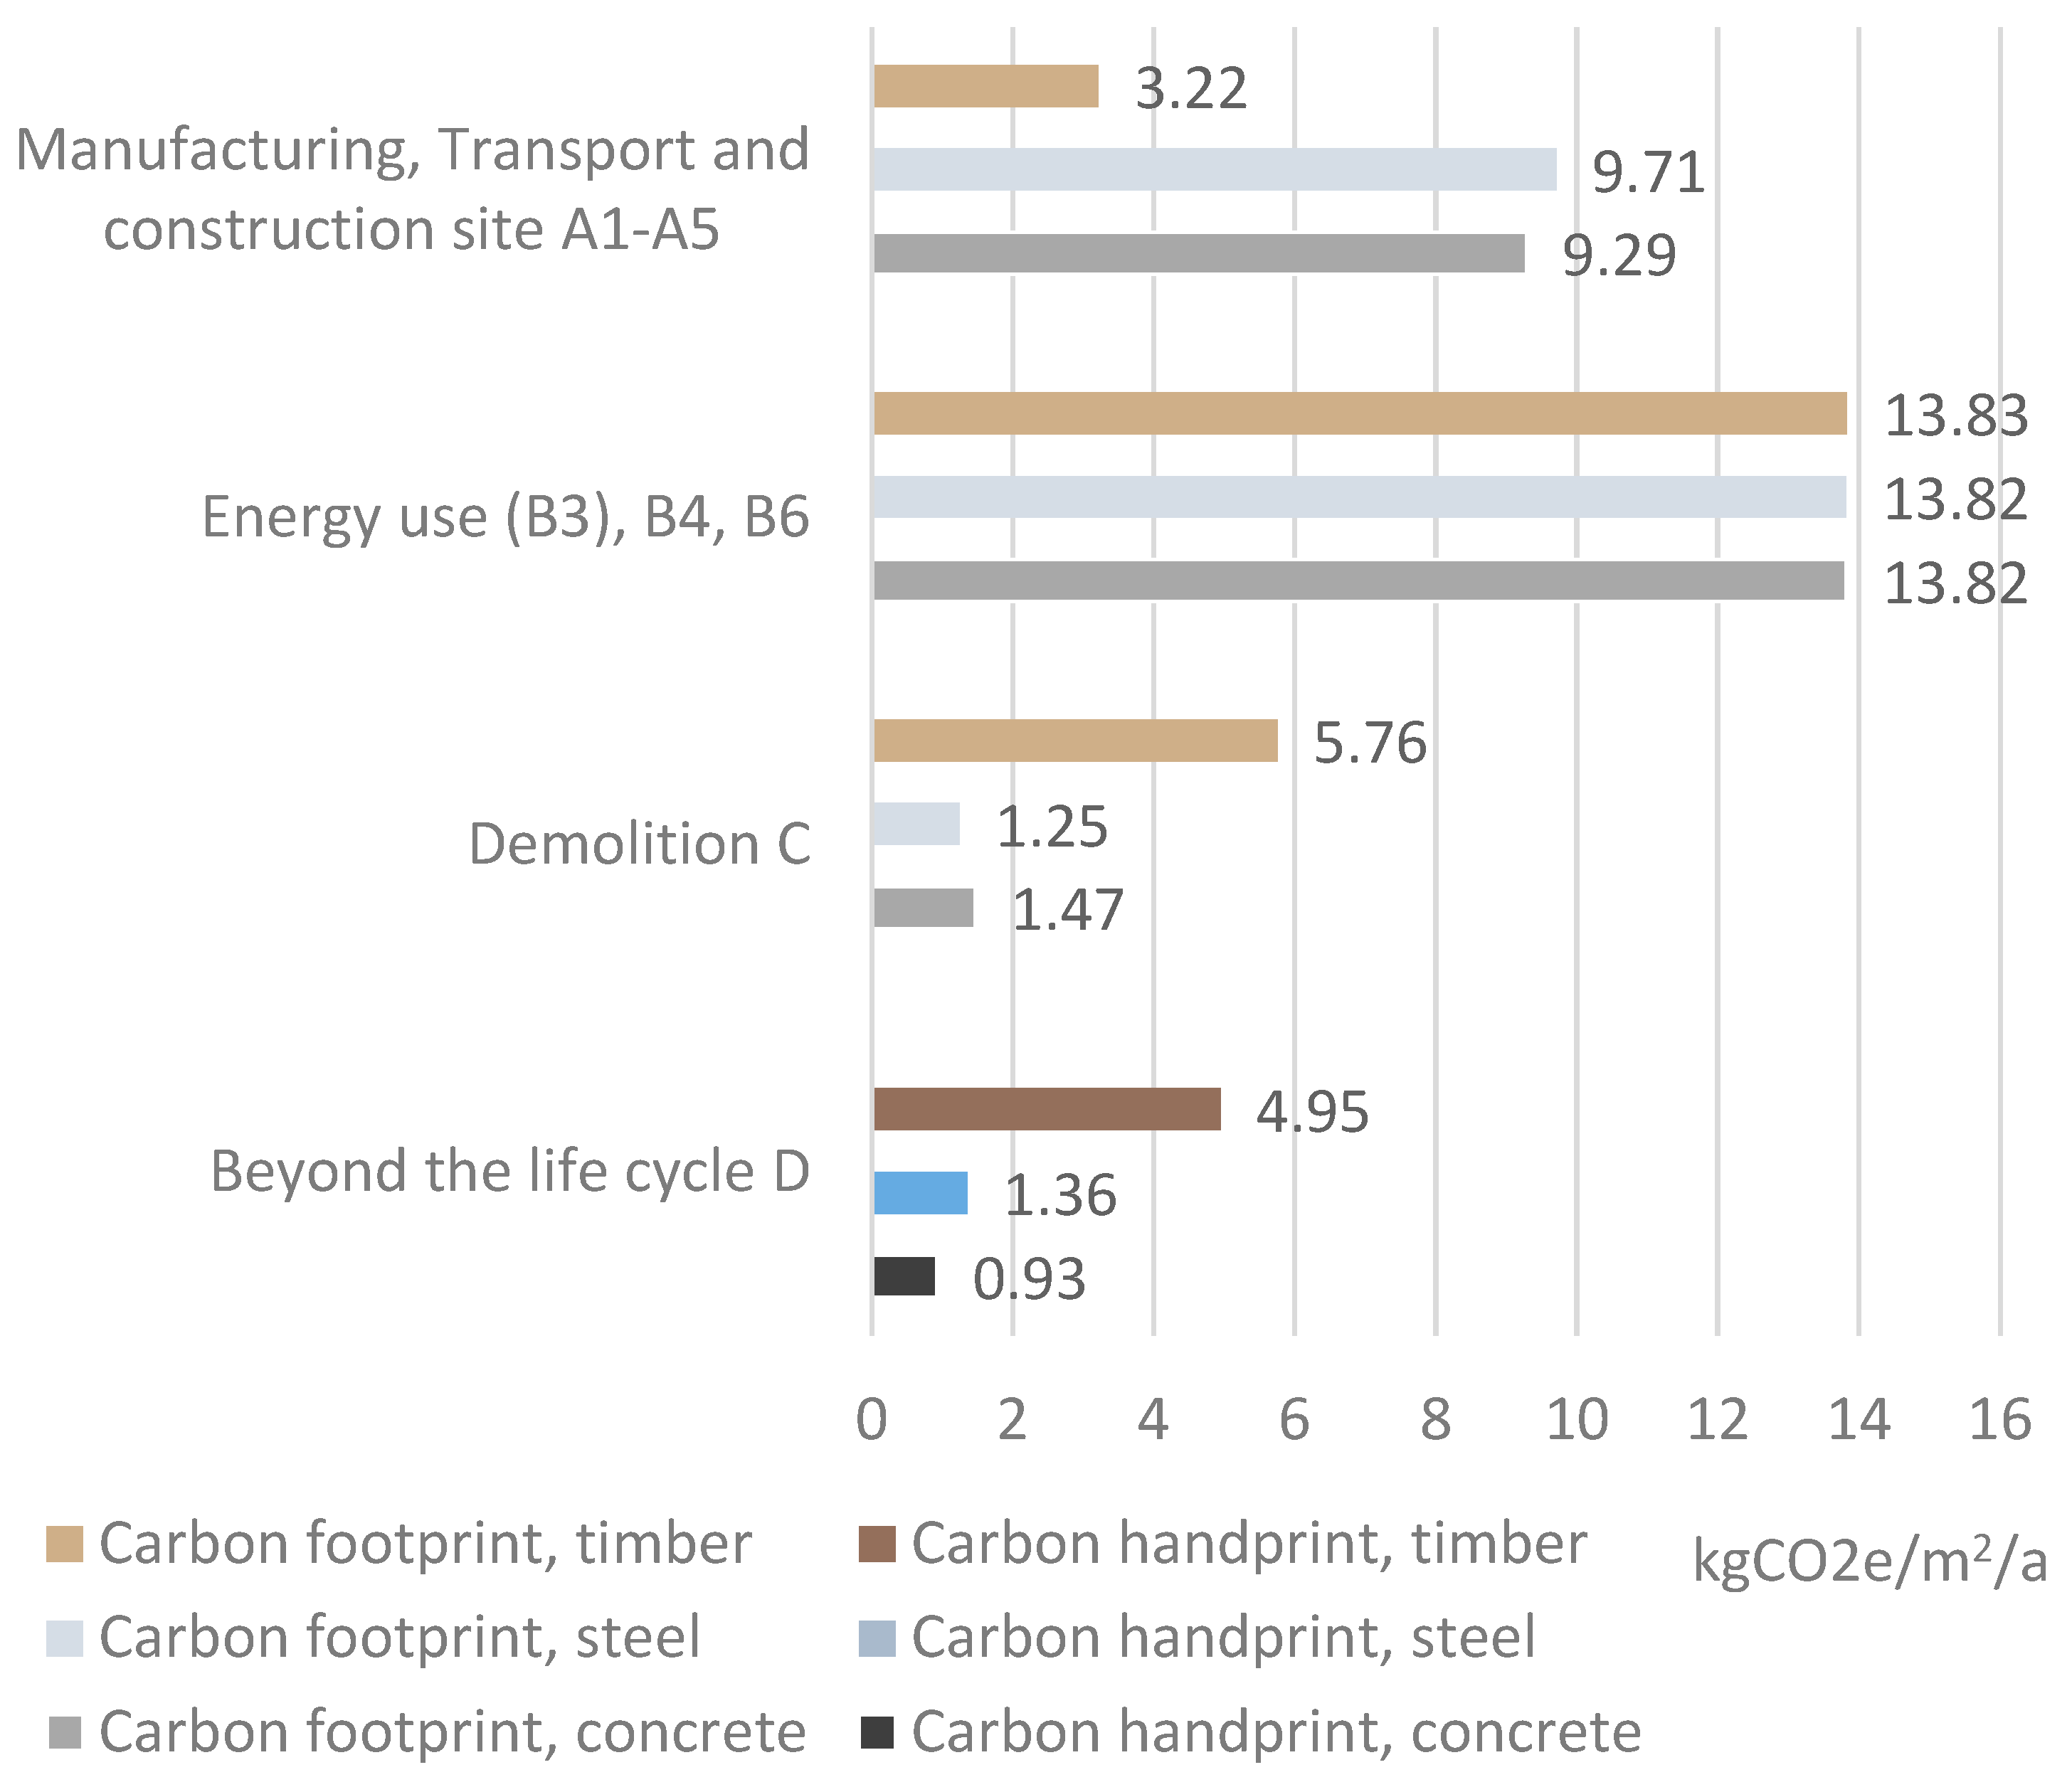
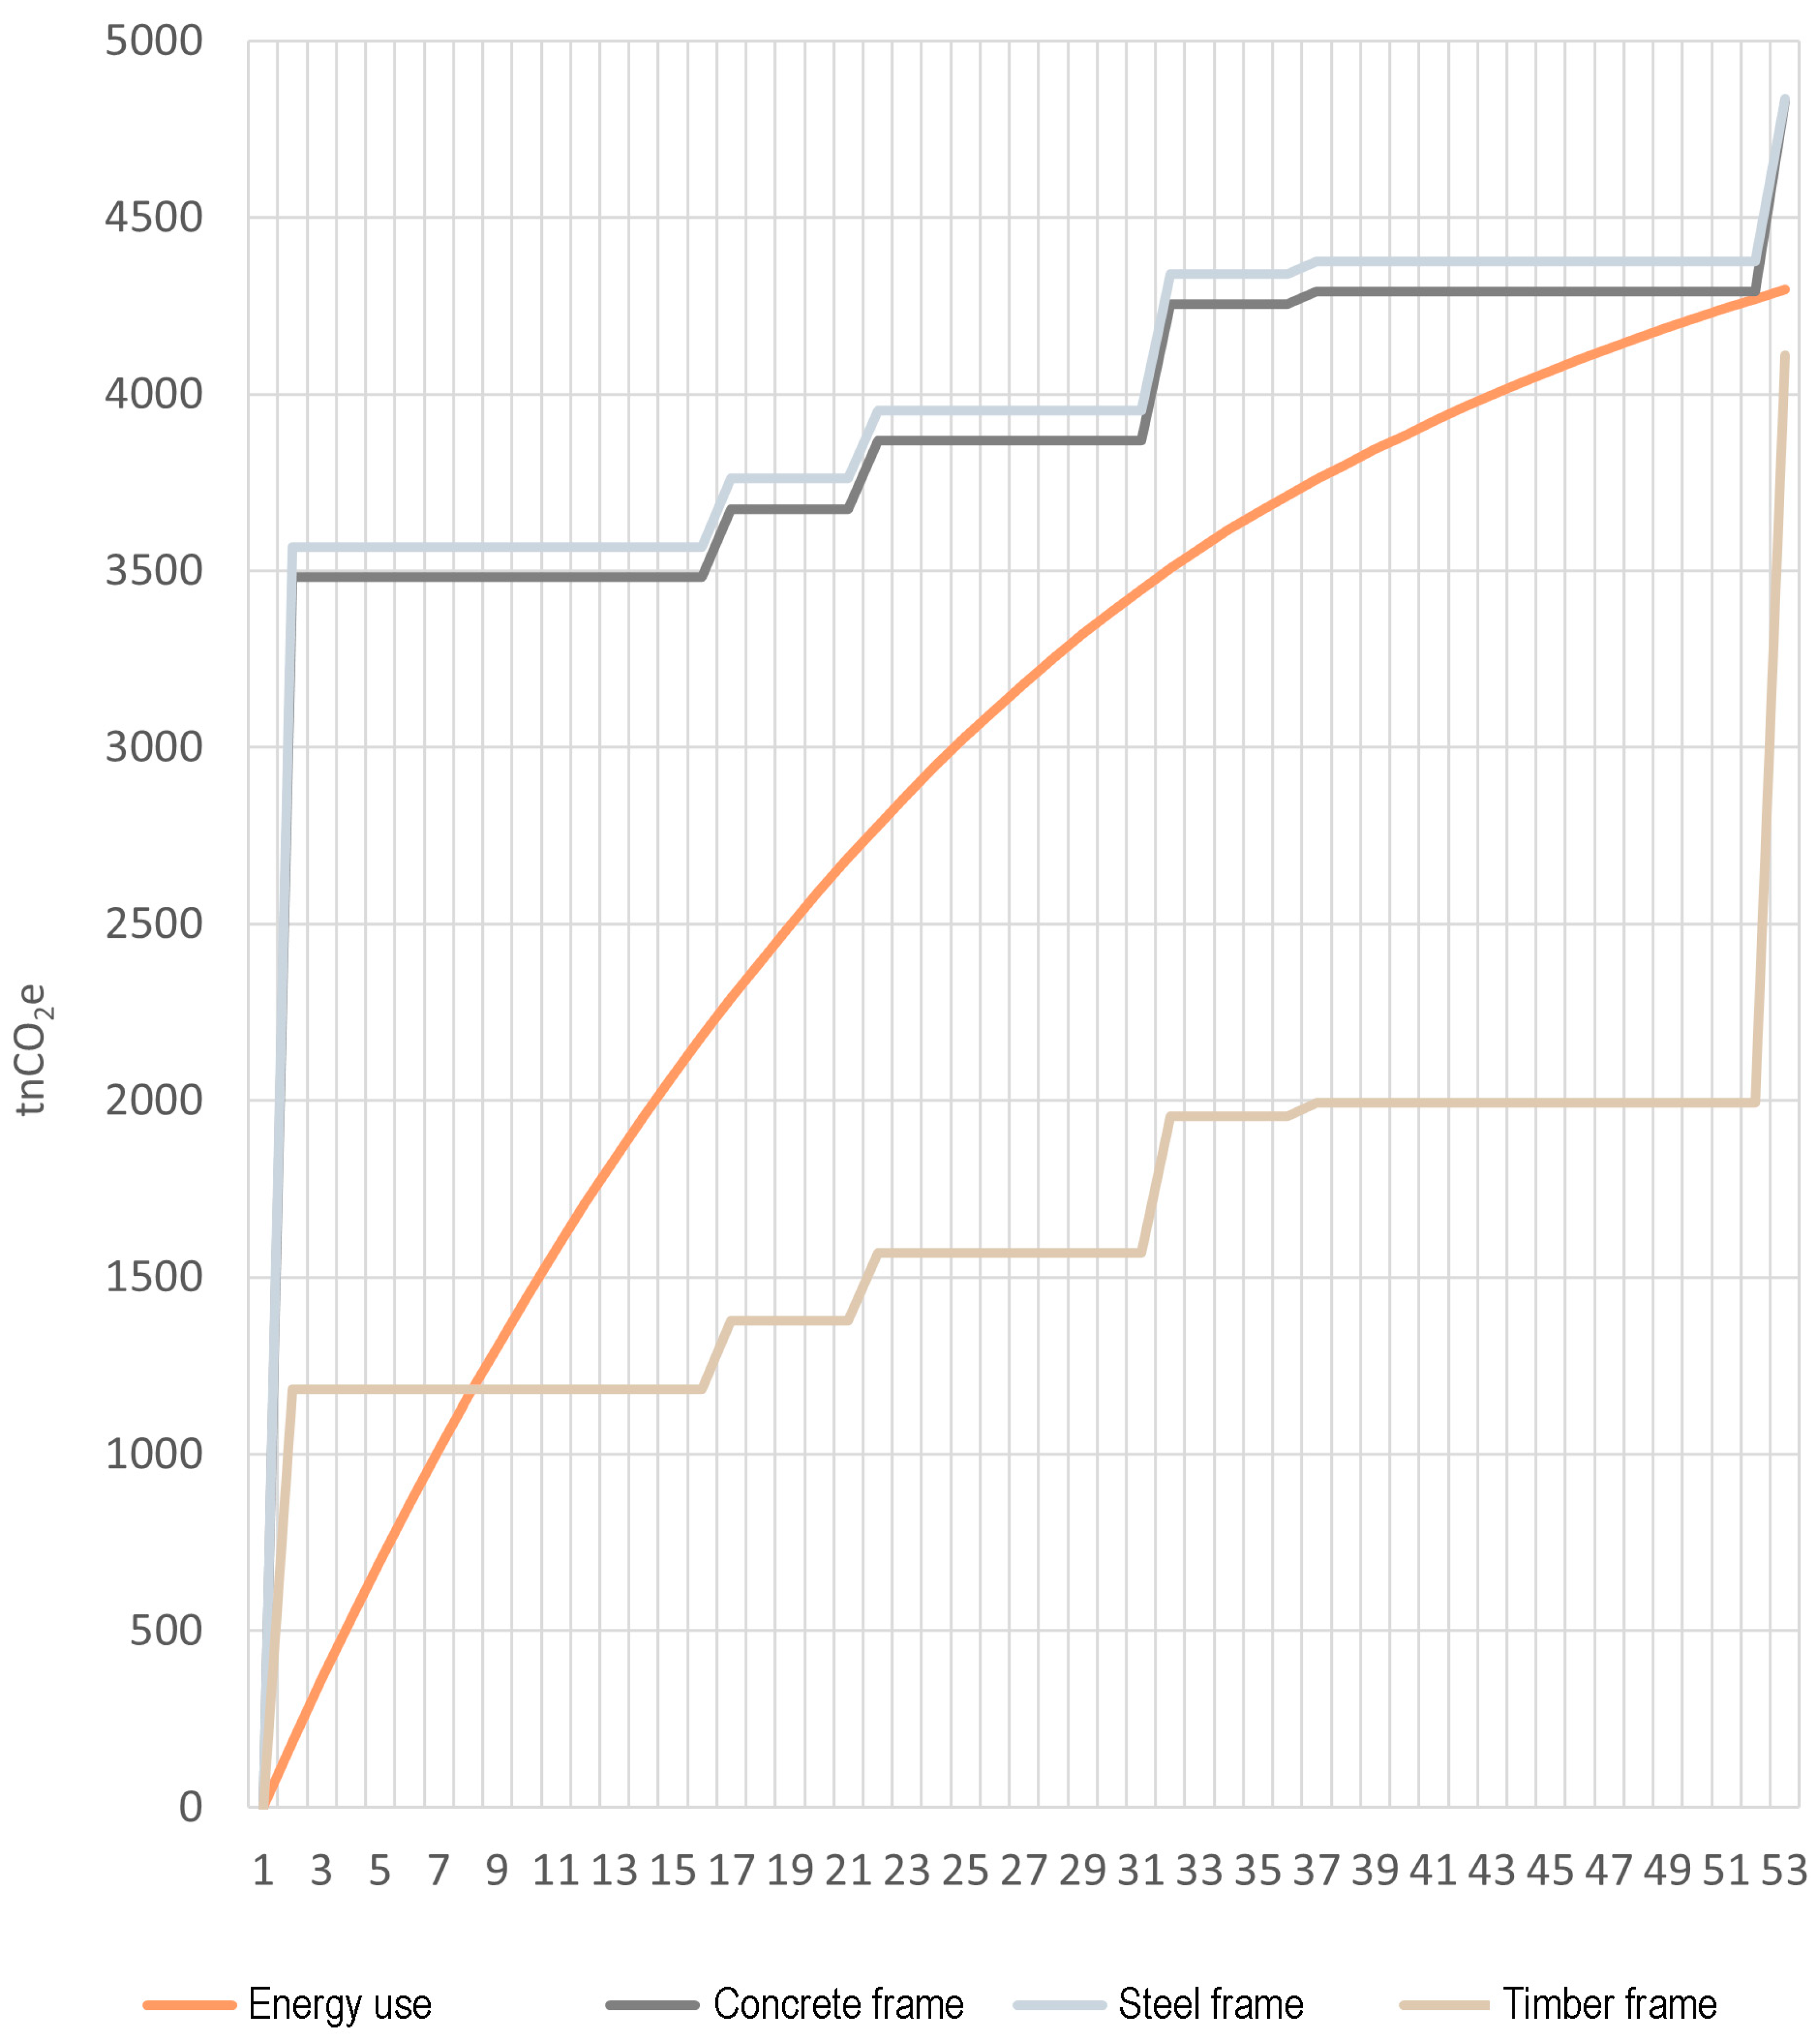
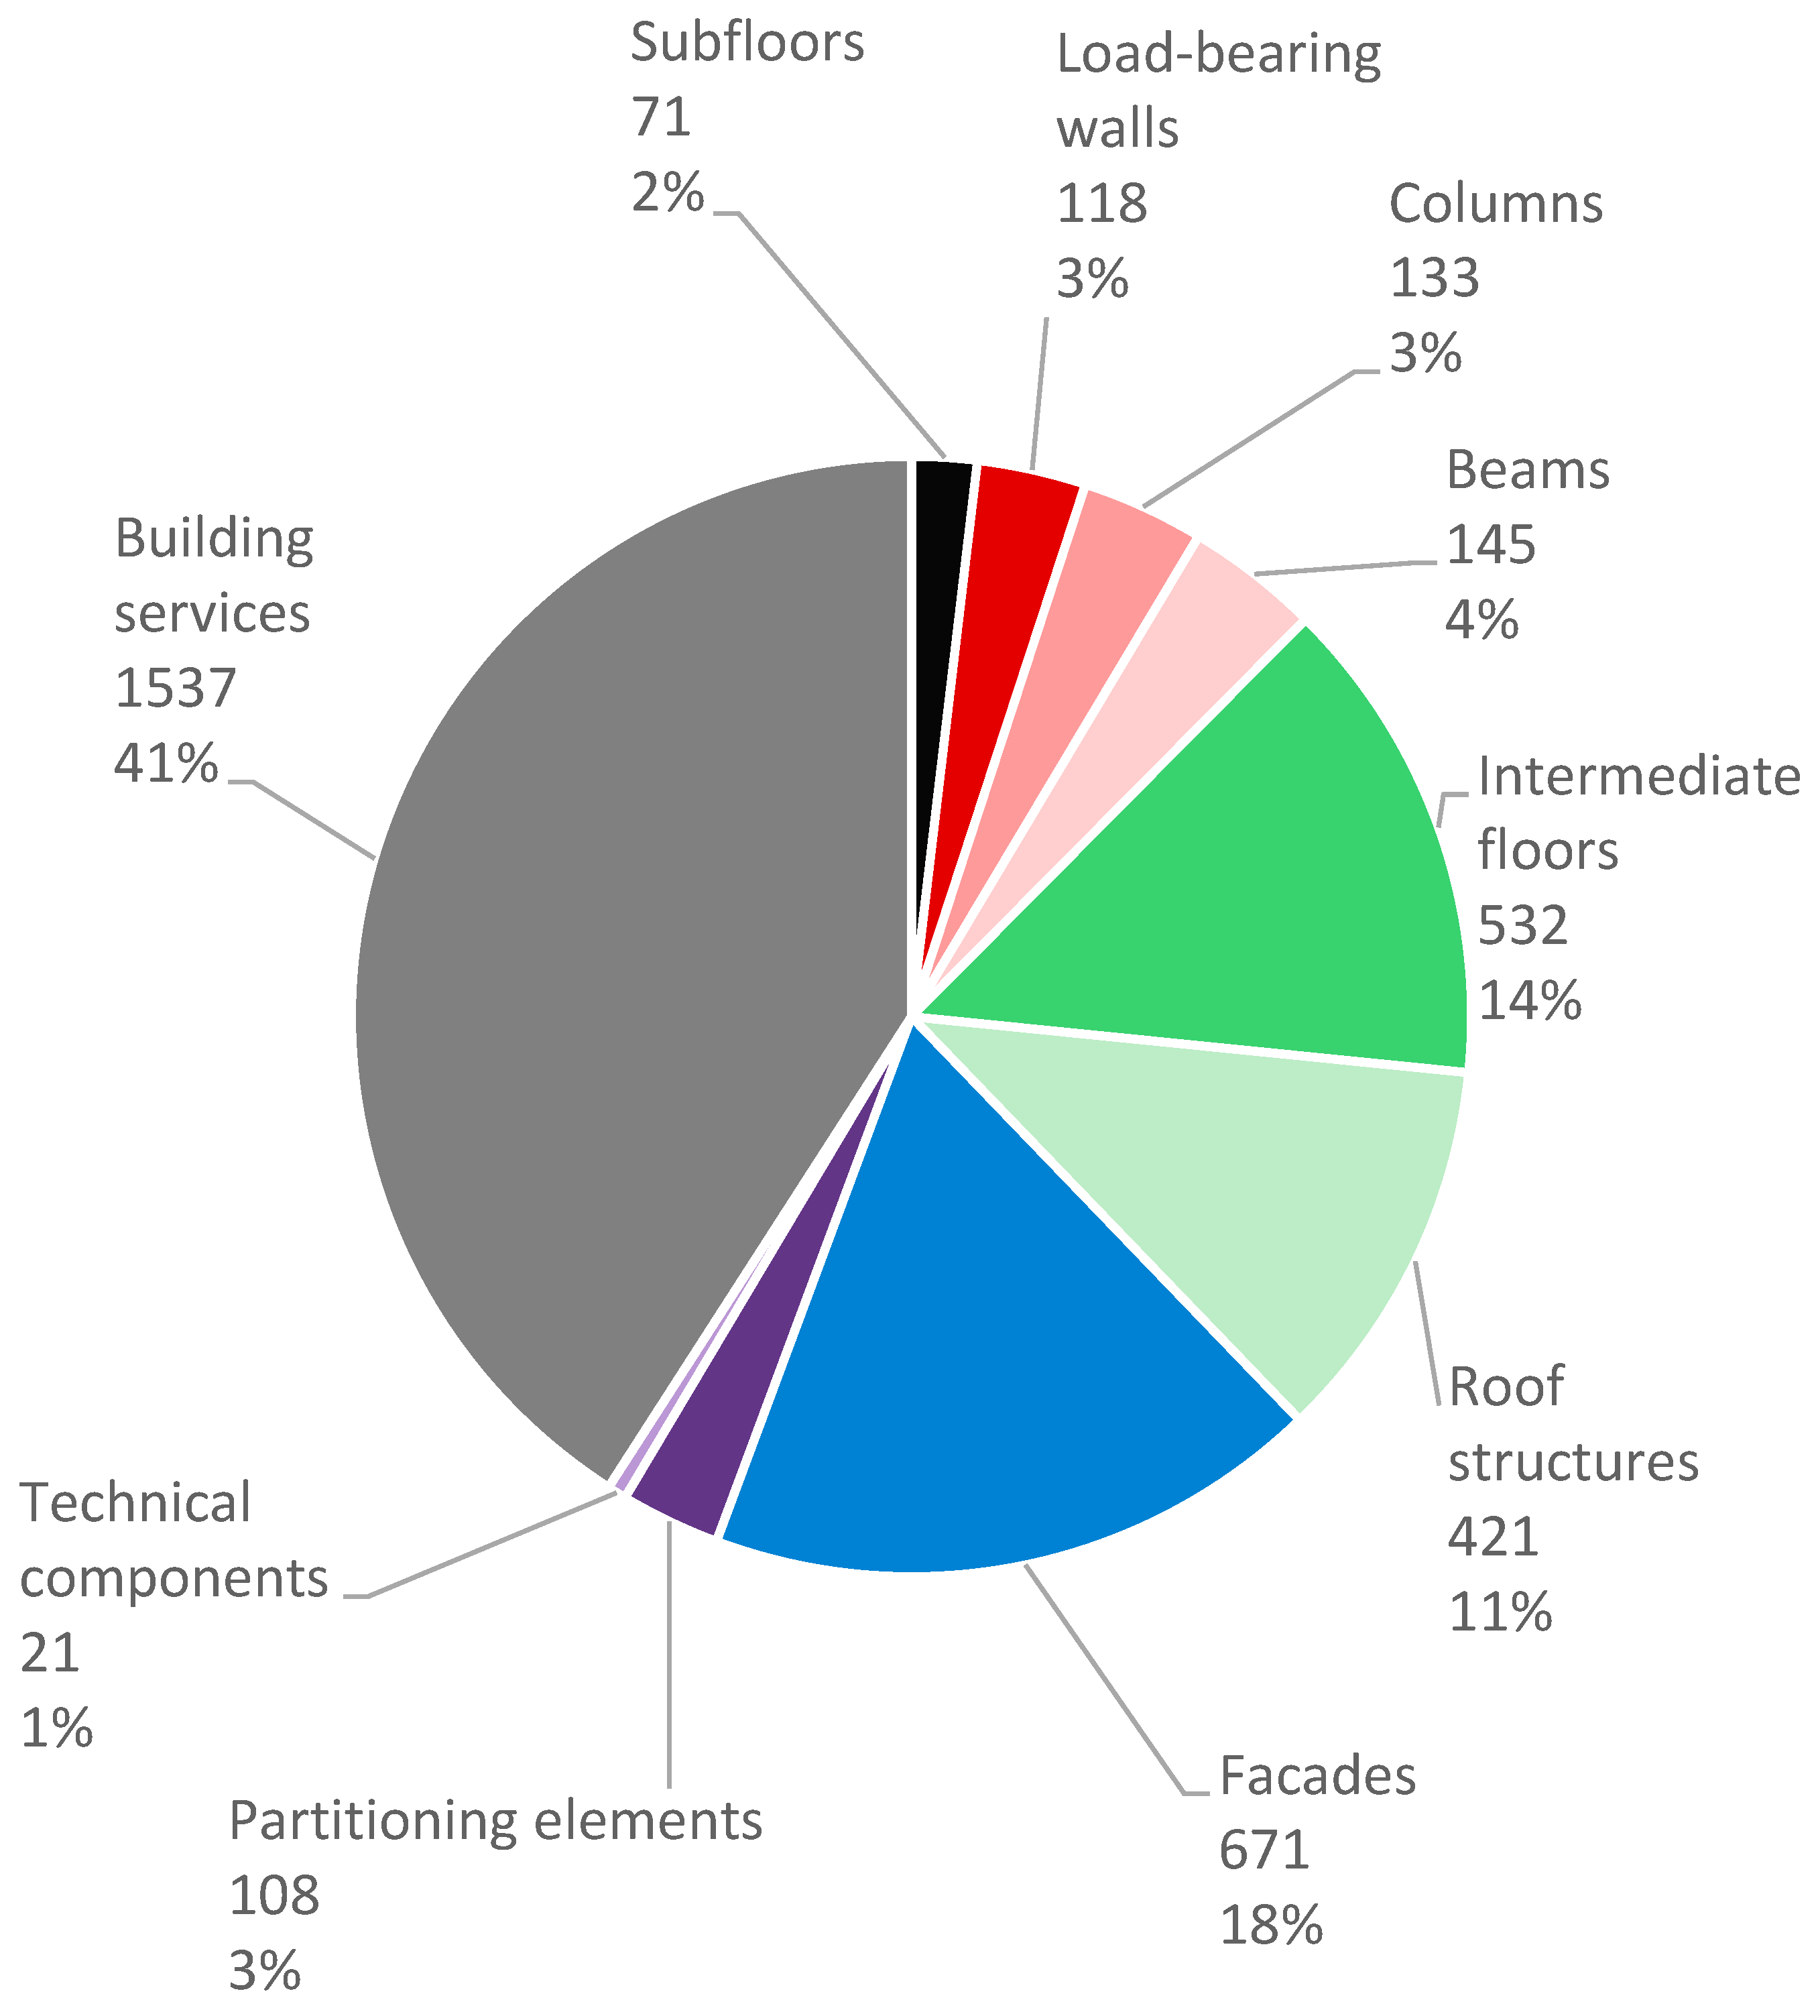
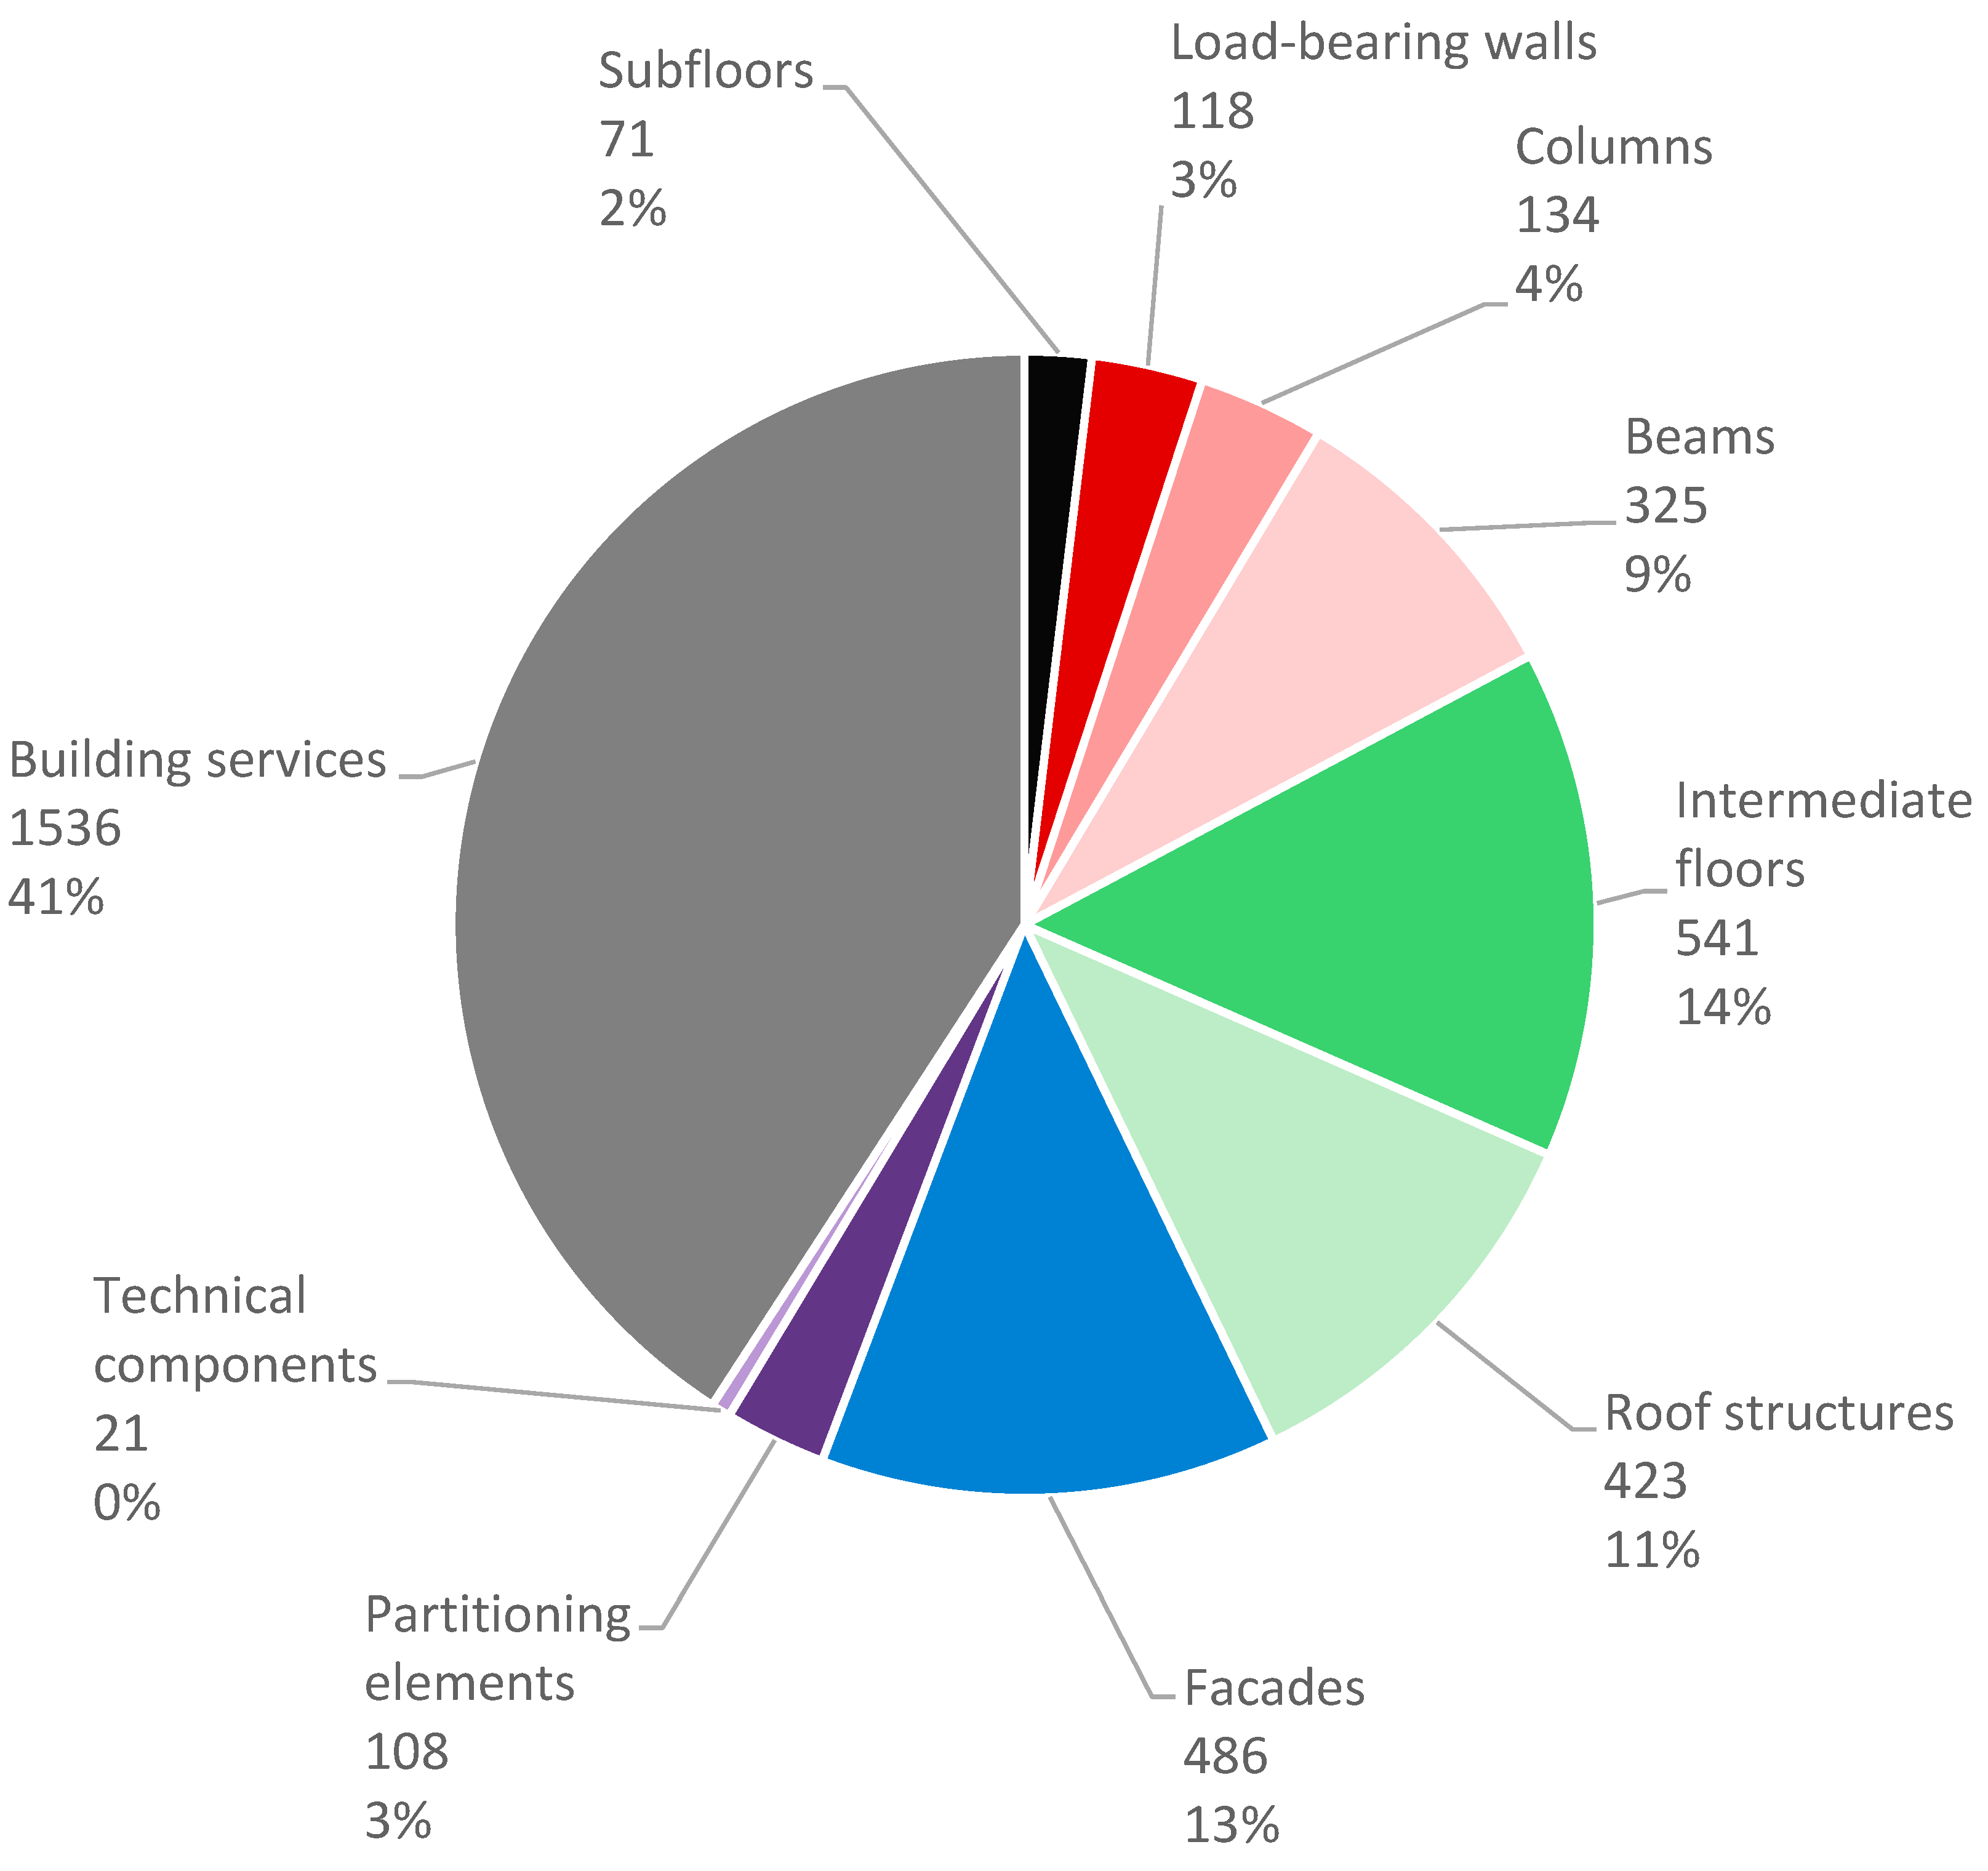
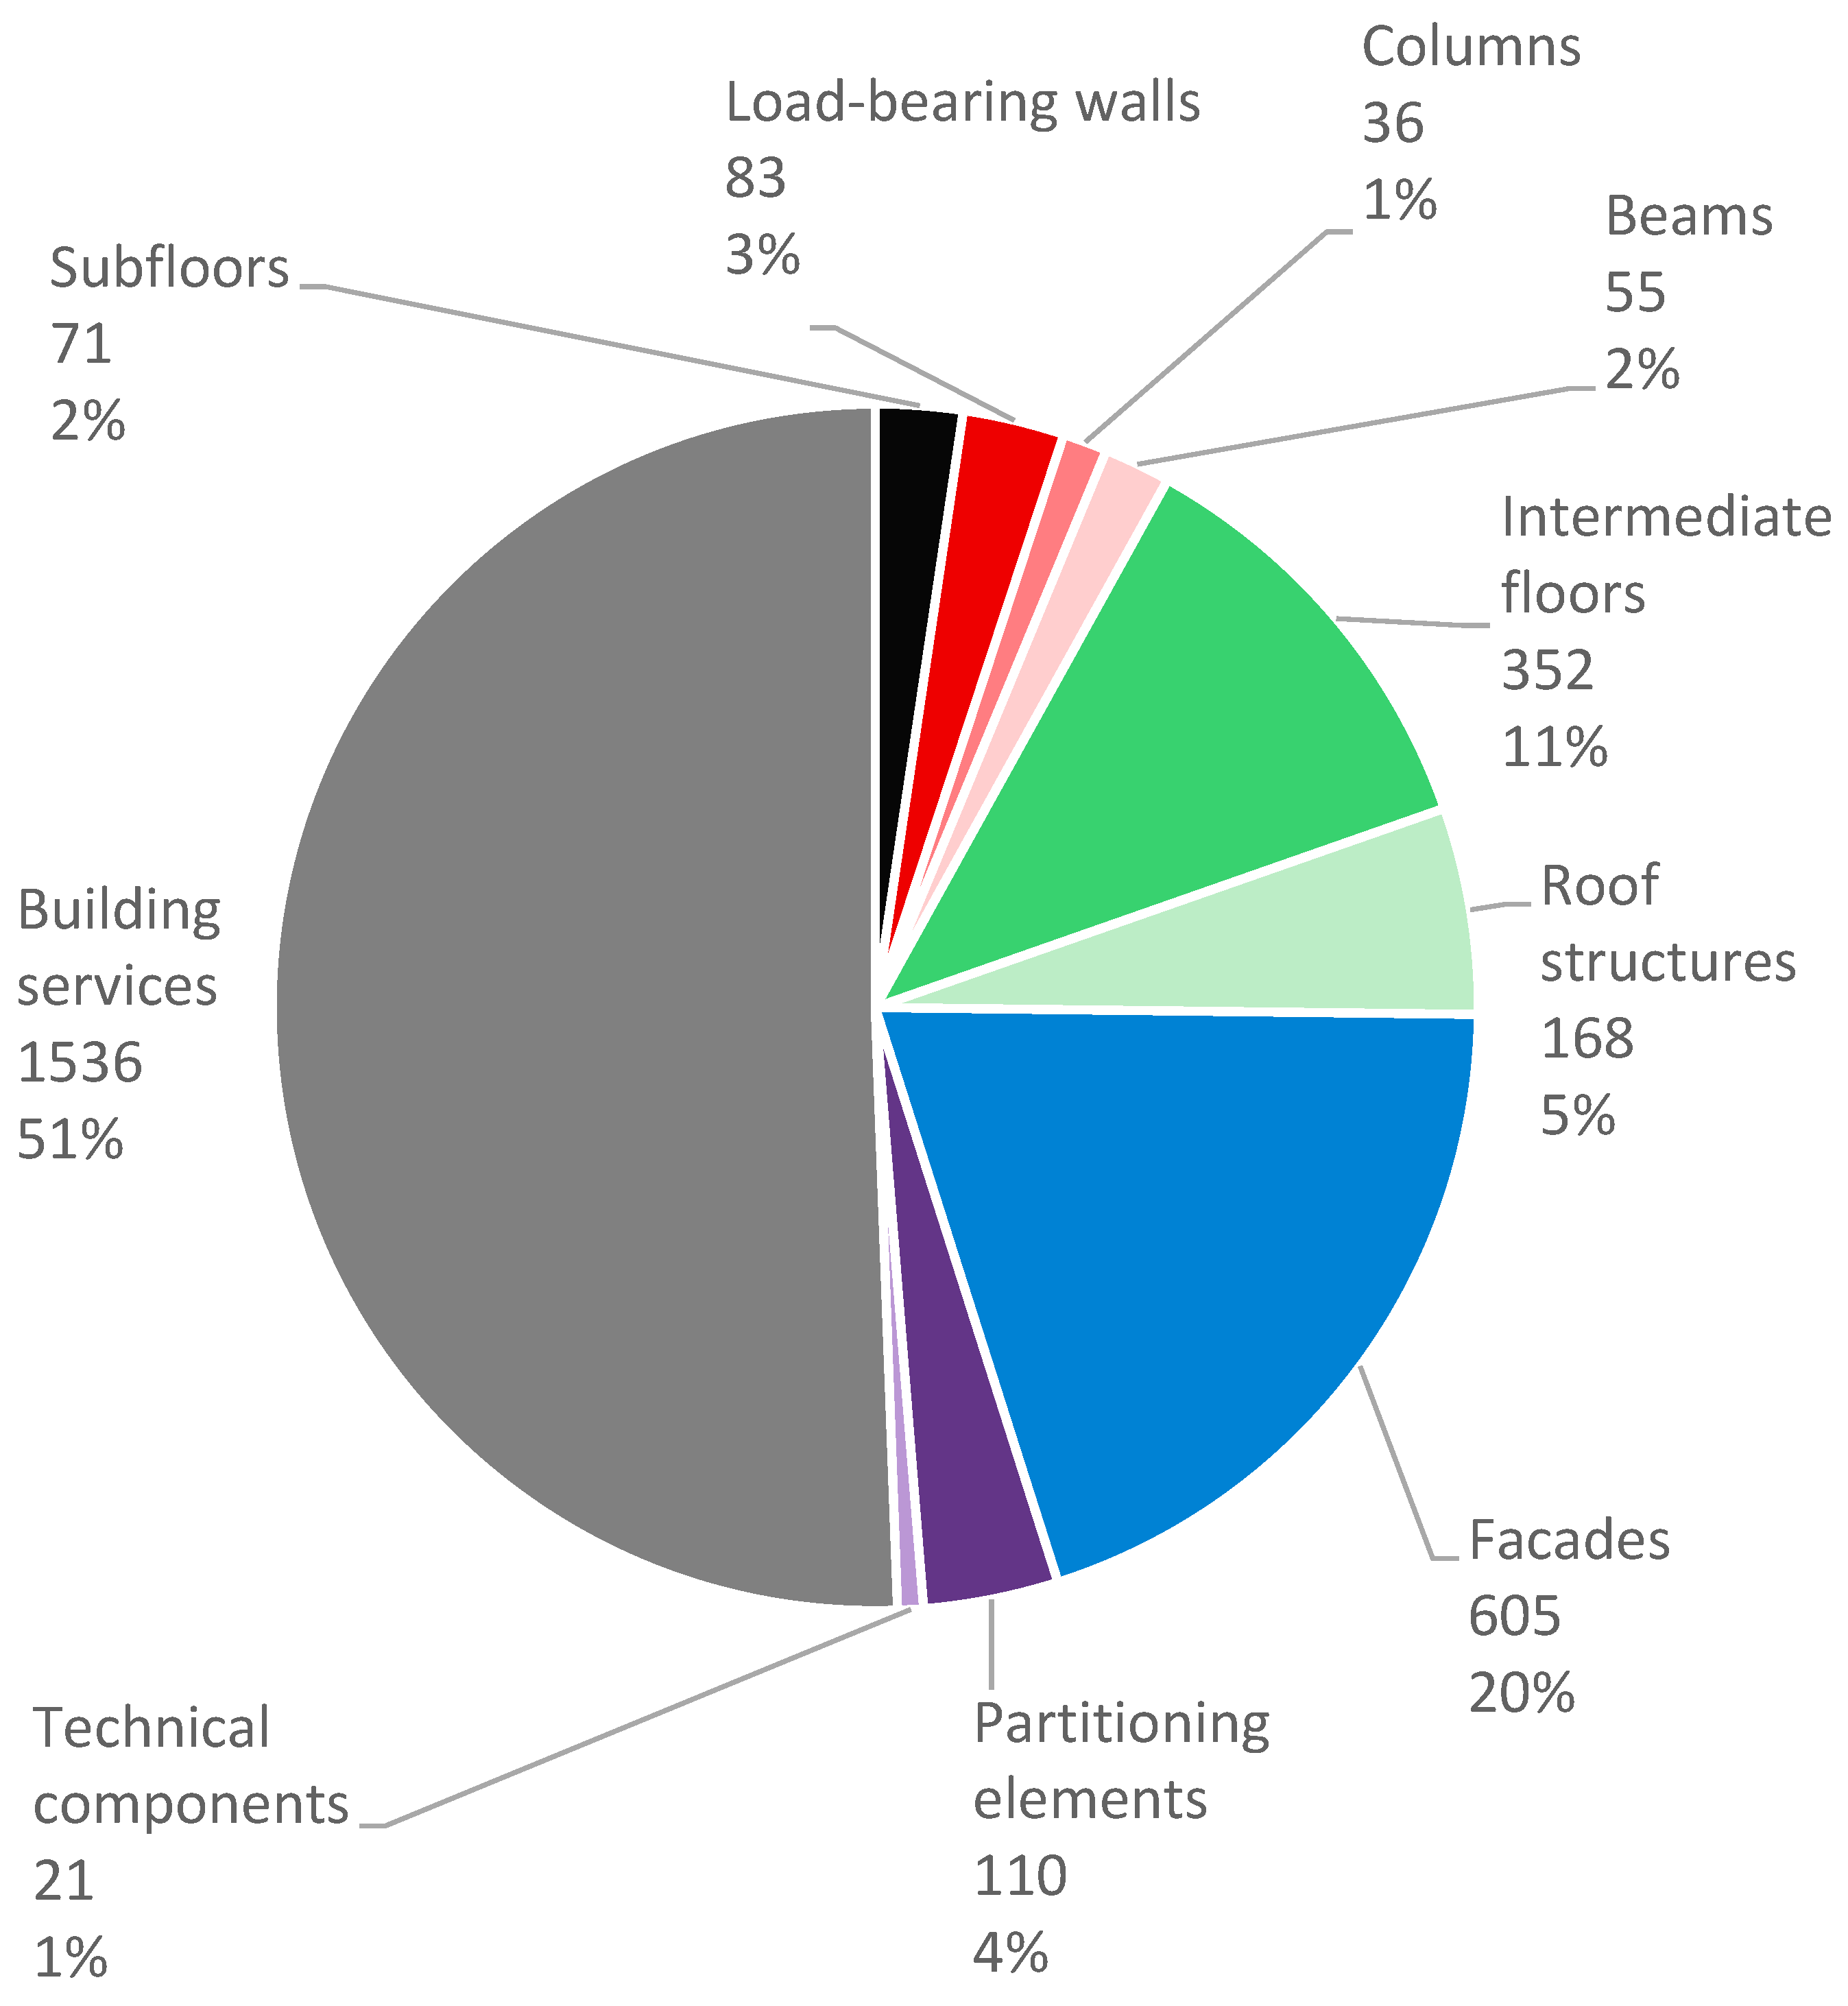
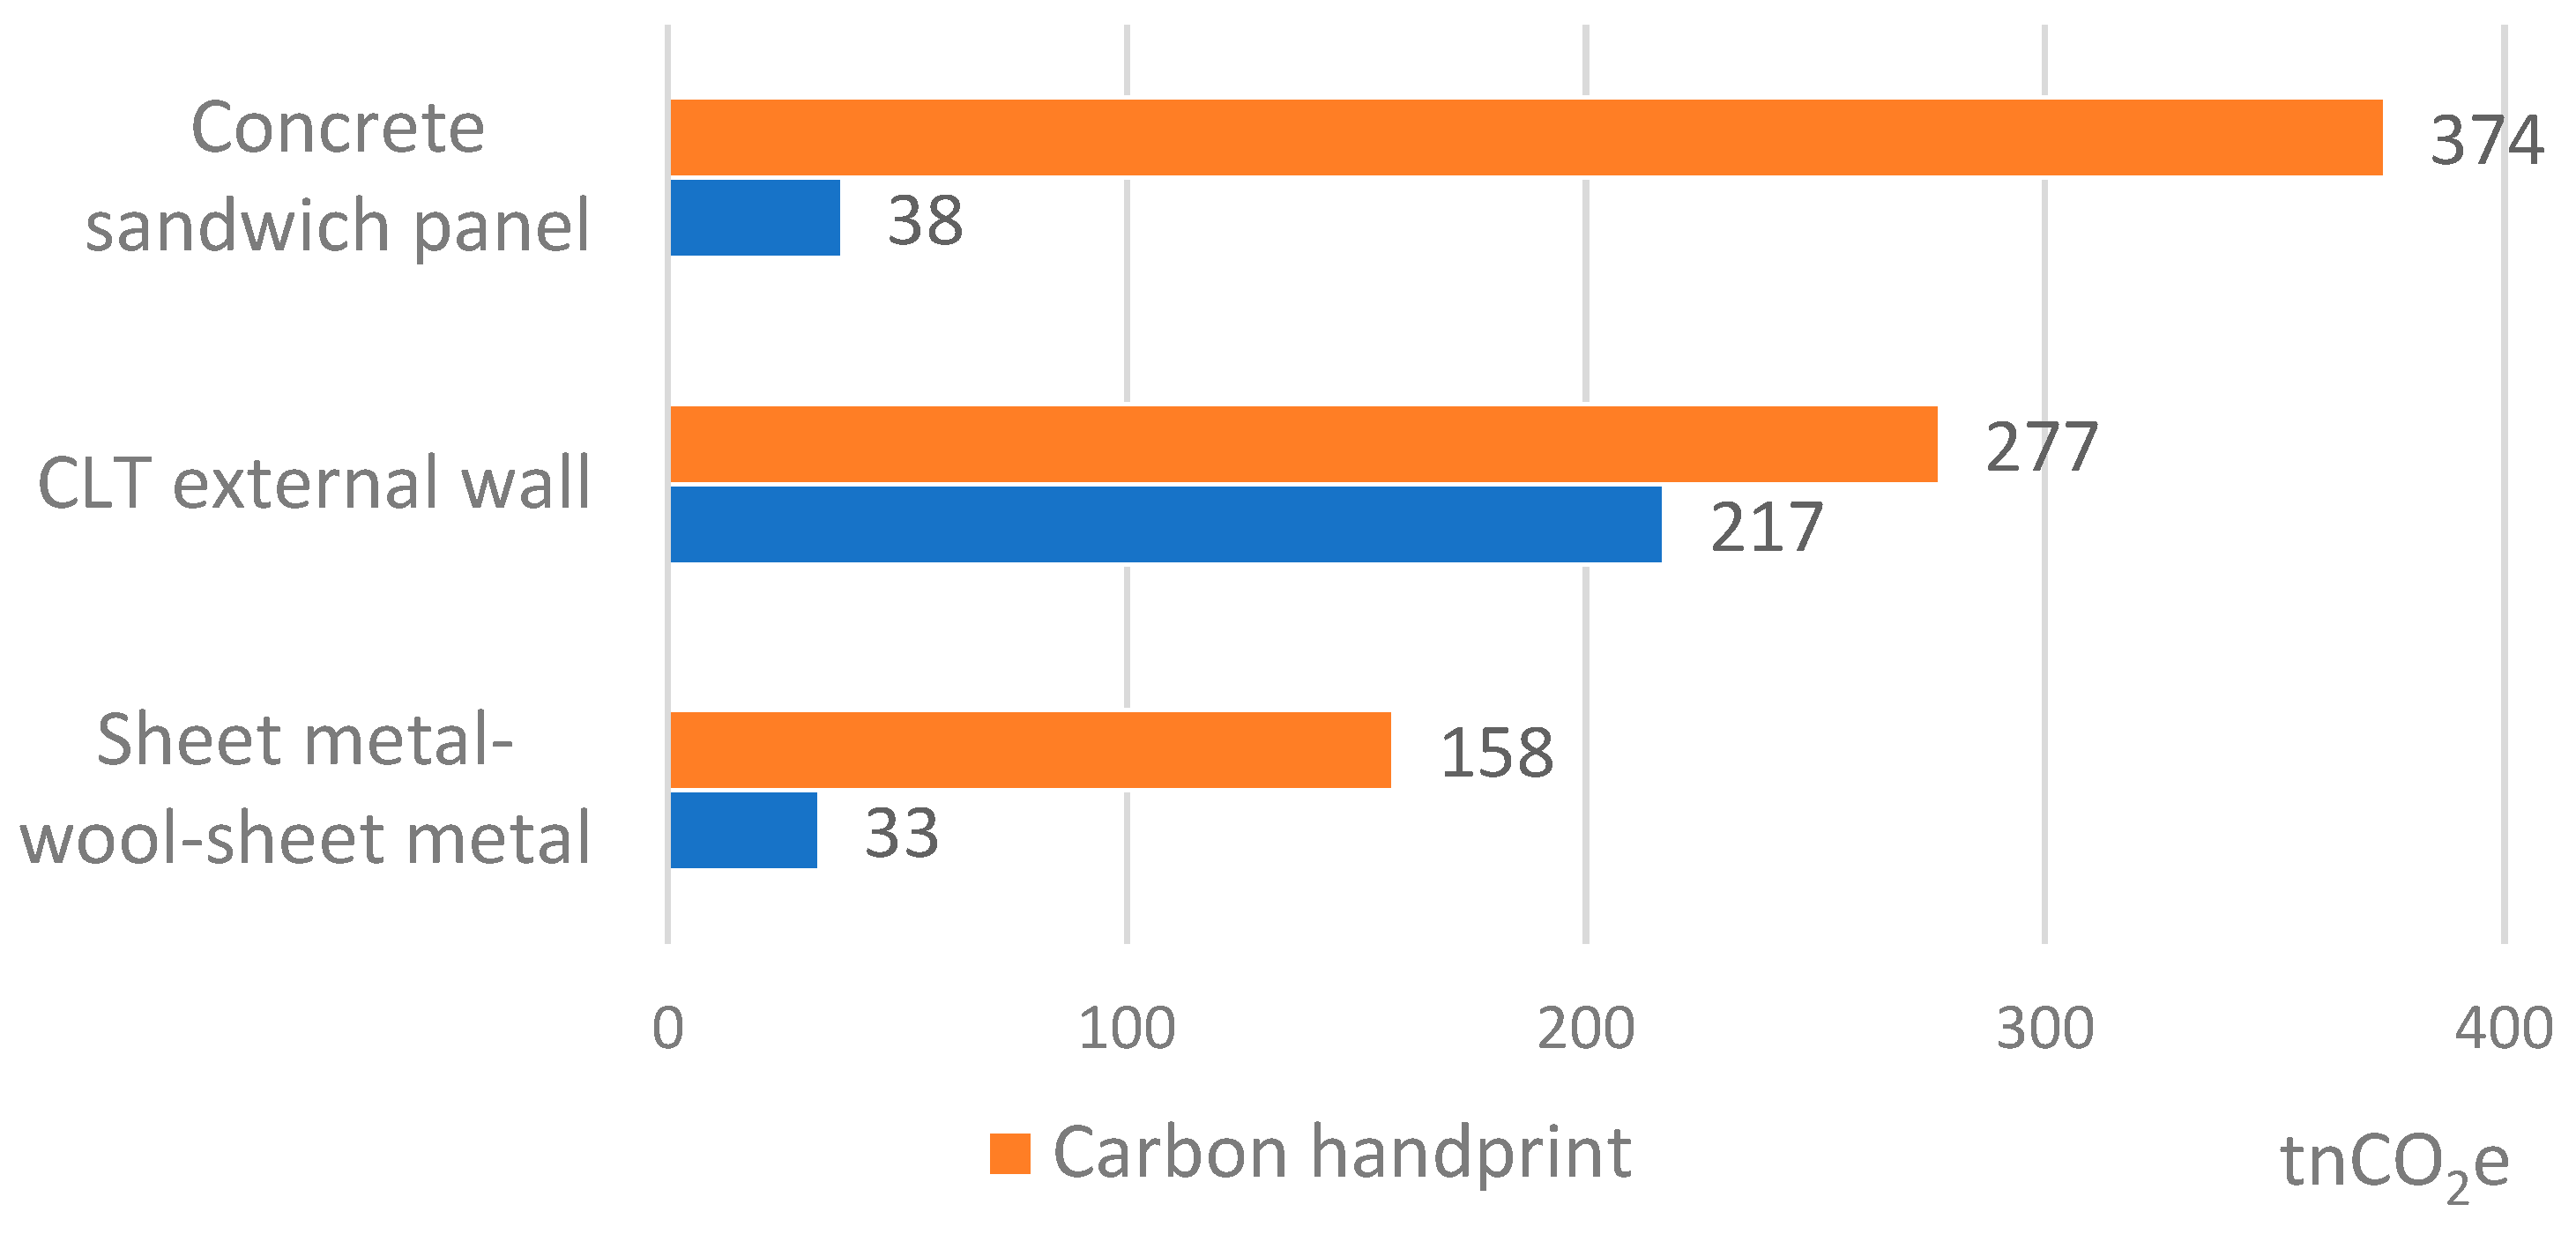
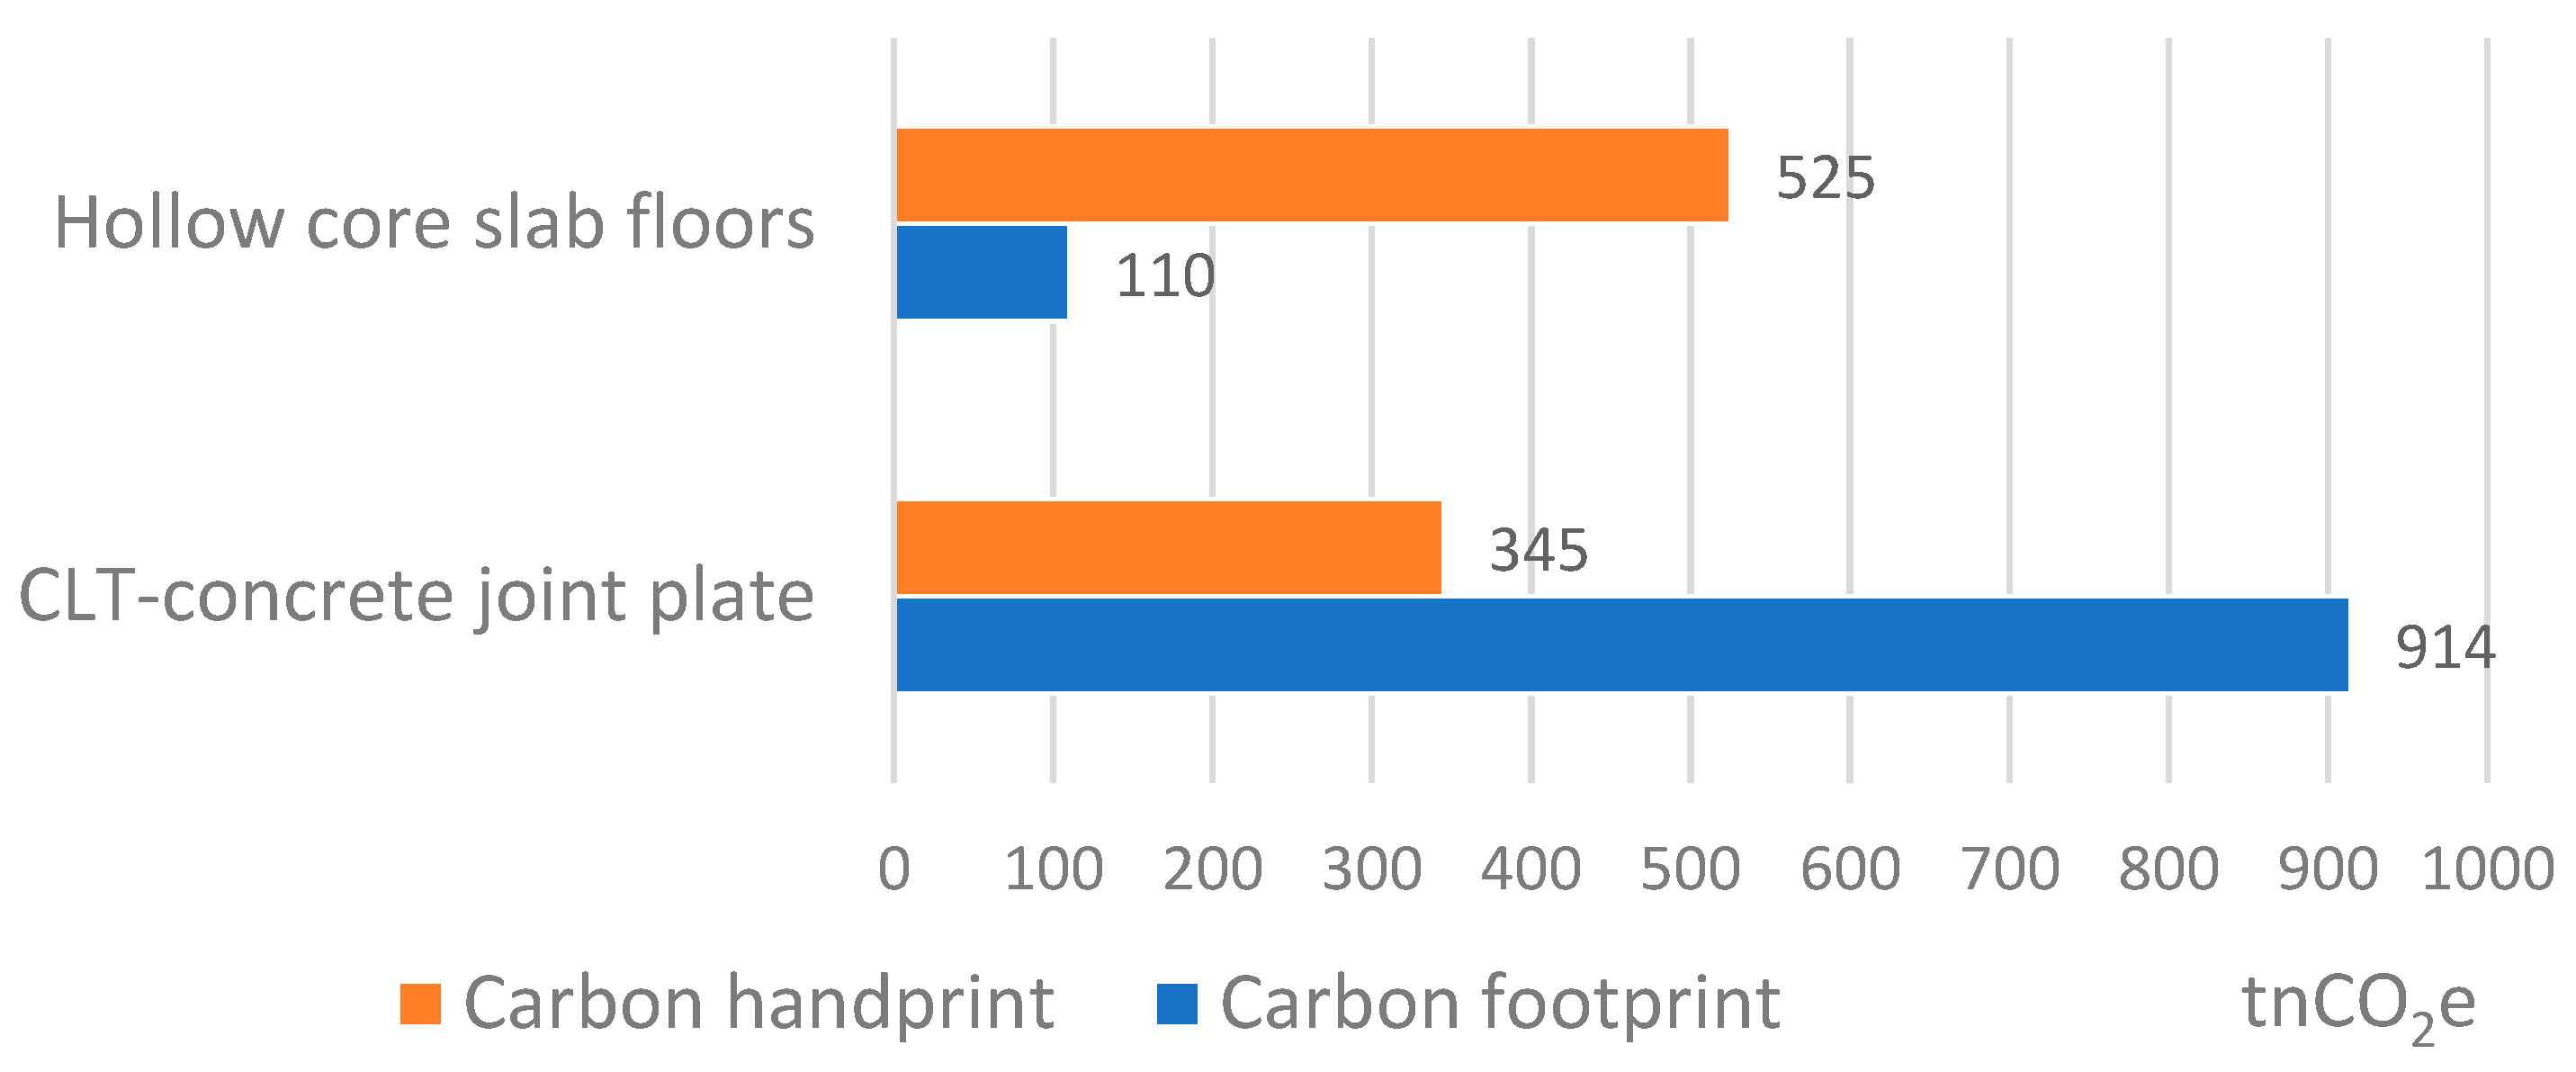
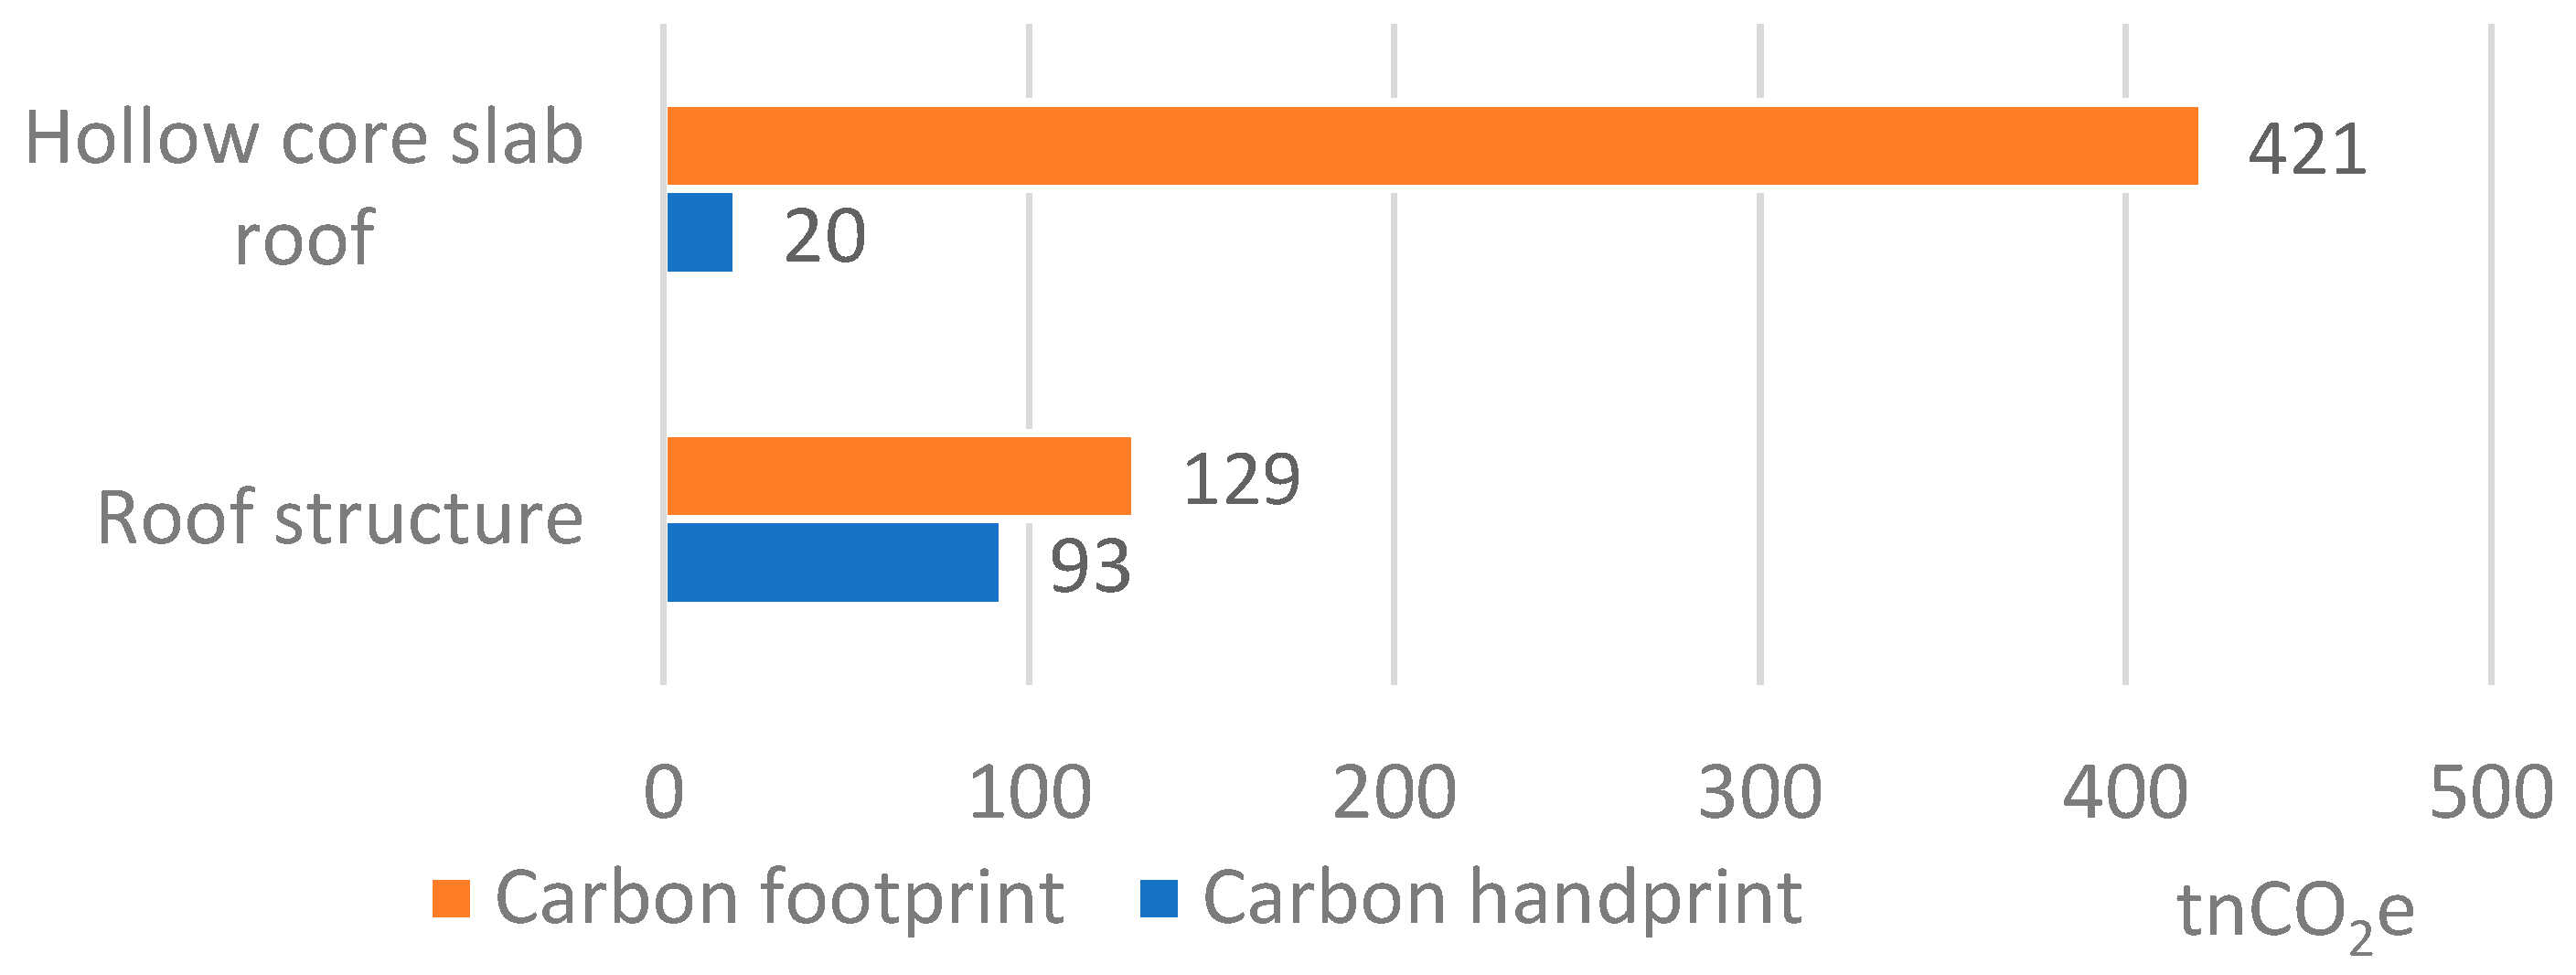
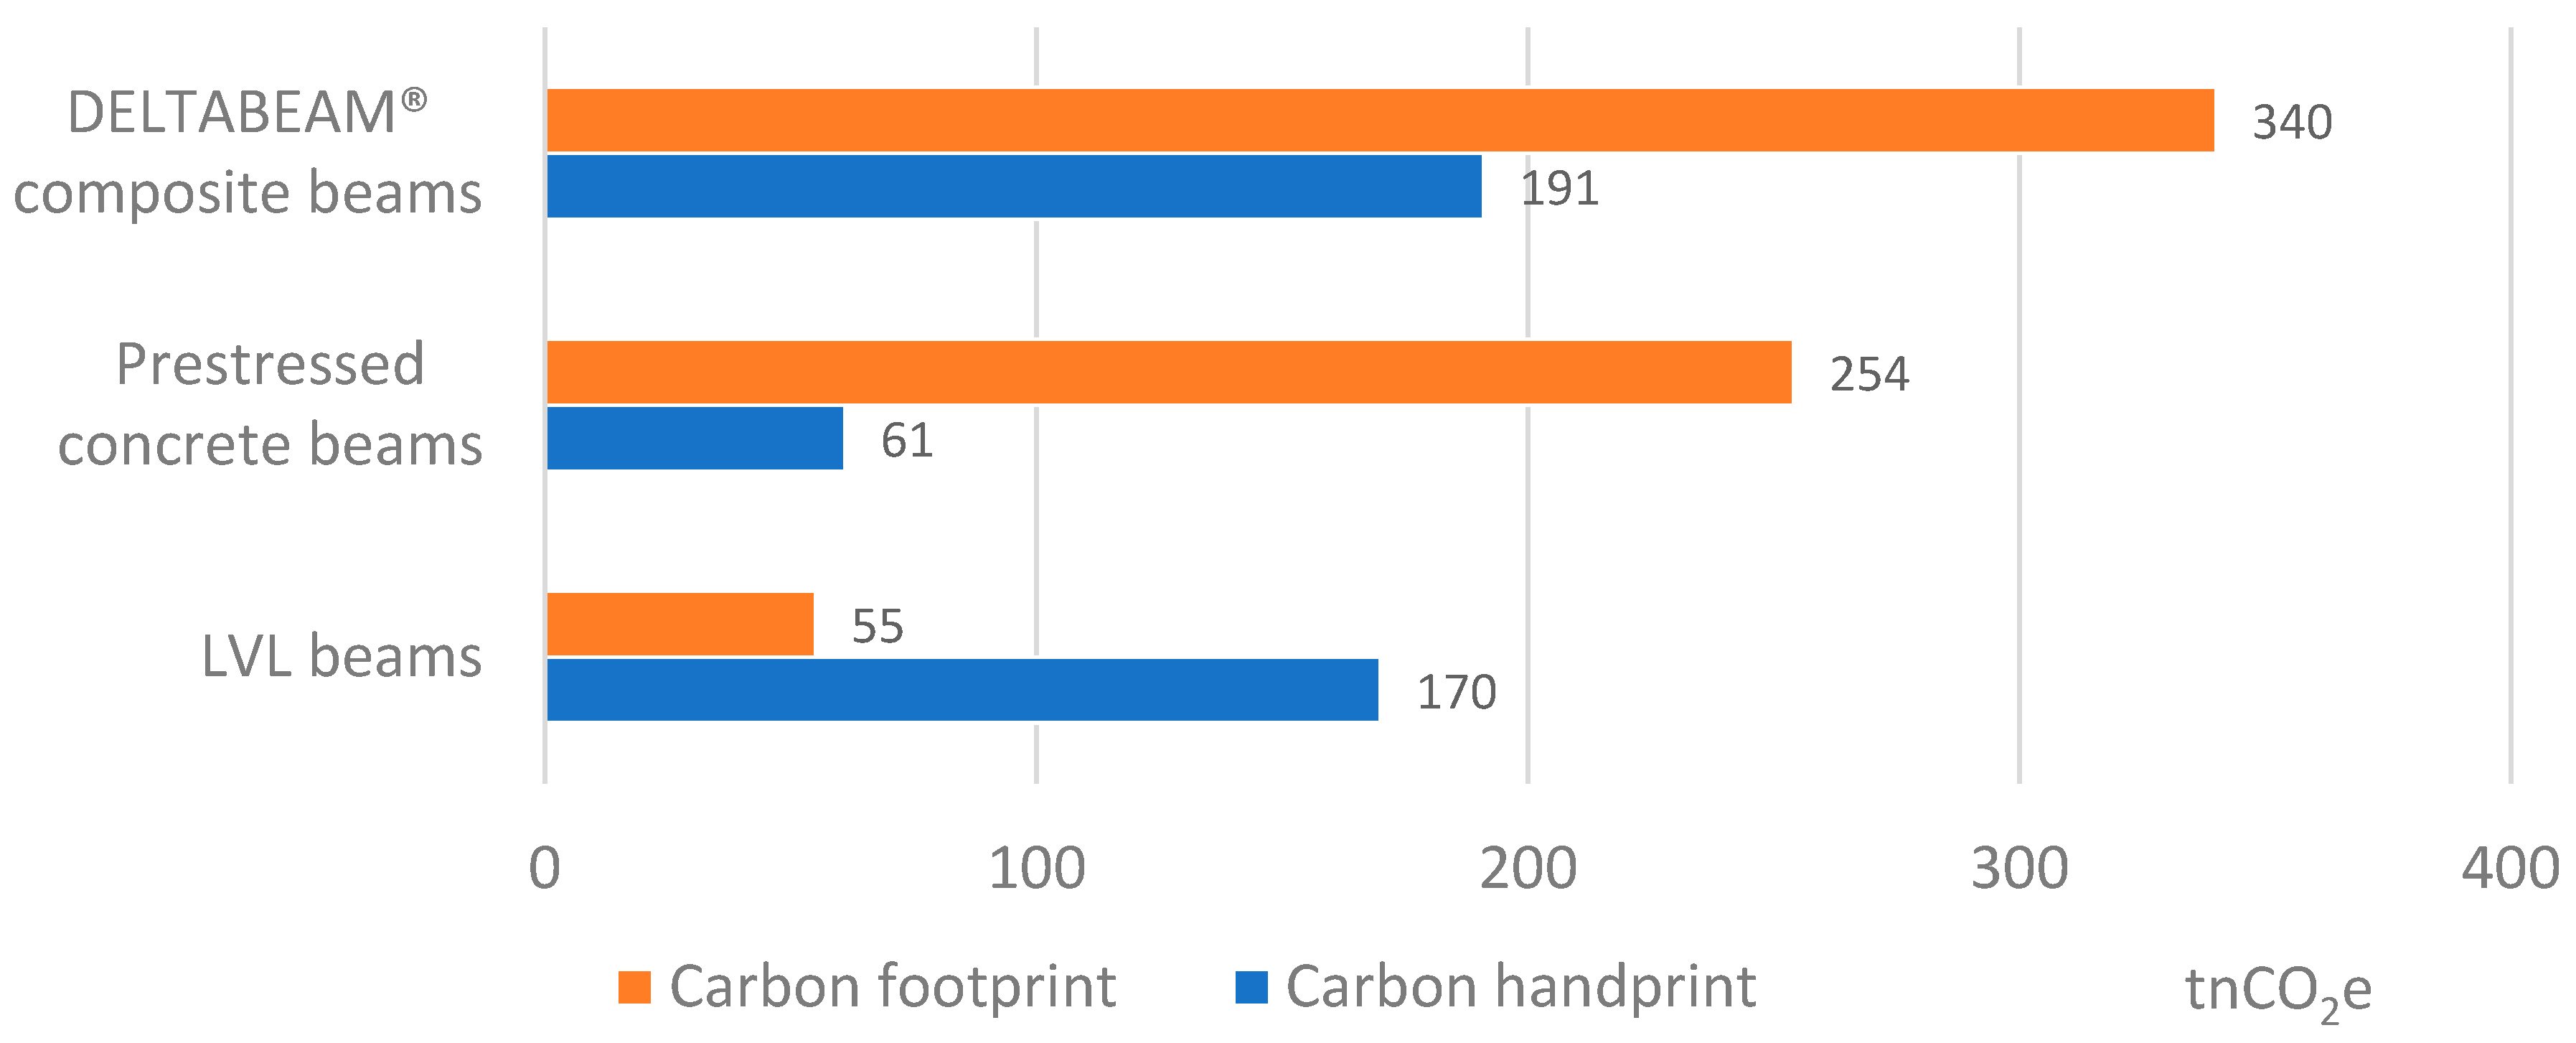
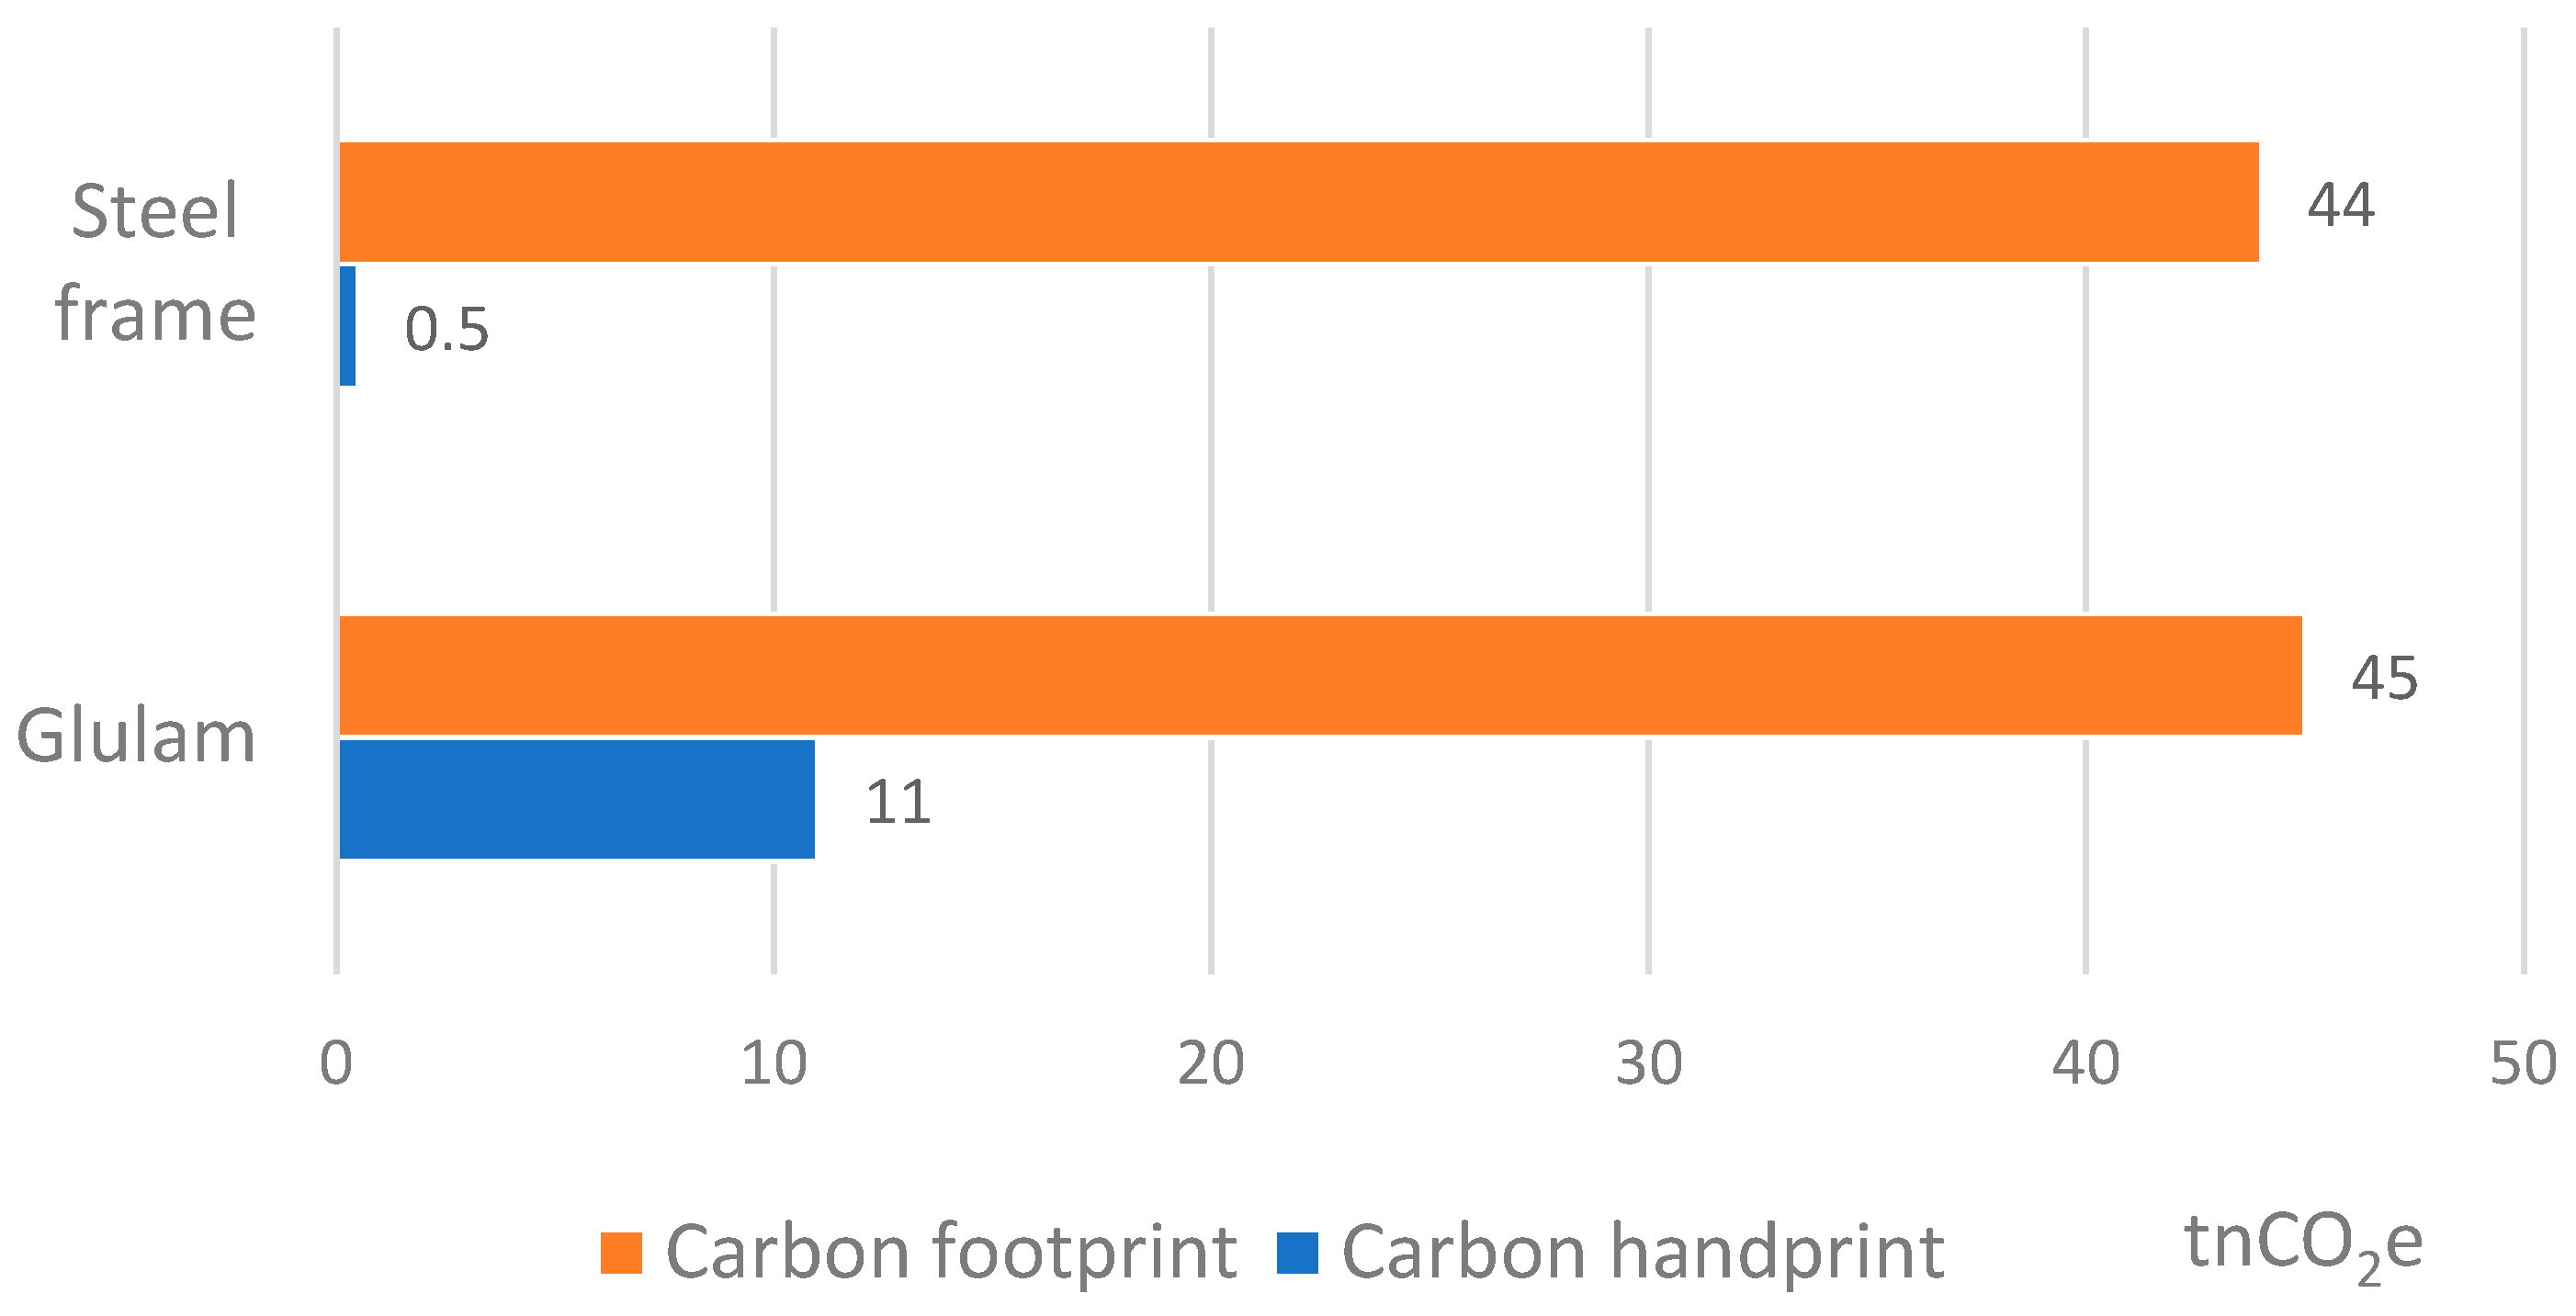
