1. Introduction
As integrated communities comprising education, science, and social services, universities have close linkages to both humans and the environment [
1]. With the implementation of the strategy to revitalize the nation through the advancement of science and education, the number of colleges and universities increases annually in China. According to the statistics of the Ministry of Education, there are 3072 higher education institutions in China with a total of 46.55 million students, and the construction area of school buildings increases by 4.0% per year [
2]. China’s campus energy consumption is over 17.9 million tec, accounting for approximately 8% of the national energy consumption [
3]. And college students consume four times as much energy per capita as ordinary residents [
4], making energy consumption on campus an issue that cannot be overlooked. It is indicated that the per capita energy consumption of universities is more than double that of secondary schools and six times that of elementary schools [
5]. On the one hand, universities have complex functions, including a variety of teaching, research, and testing equipment; on the other hand, teaching buildings have a high occupant’s density and activity frequency, relying heavily on air conditioning to create a comfortable indoor environment. Hence, university teaching buildings have high energy consumption and show a significant upward tendency.
There are seven cities with 467 institutions located in the hot summer and cold winter (HSCW) climate zones among the published 10 cities with the largest number of colleges and universities, accounting for 15% of the total number in China [
6]. Shanghai, a typical city in the HSCW zone, has 68 higher education institutions, including 41 undergraduate colleges and universities. It is the city with the highest density of undergraduate colleges and universities in China, approximately 0.7 per 100 square kilometers. Buildings in the HSCW zone need to consider the dilemma of regional climate during the operation stage, taking the demands of heating, cooling, and dehumidification into account. Due to the non-centralized heating in winter, the heating mode is frequently utilized, and the energy consumption composition is more complicated.
Educational buildings have specific usage patterns and energy consumption characteristics in order to fulfill the teaching requirements. First of all, the operation period of teaching buildings is cyclical, and the equipment works generally from 8:00 to 22:00, which is suitable for intermittent heating and cooling. Secondly, seasonal fluctuations are significant in educational structures. The traditional peak energy consumption period in the HSCW zone (January, February, July, and August) consumes the lowest energy instead, affected by winter and summer vacations on campus [
7]. Referring to energy-saving design strategies of public buildings may have little effect on the operation stage of educational buildings, but it will increase the investment in the embodied stage as well as the environmental impacts throughout the entire life cycle. Thirdly, the heat transfer coefficient of exterior windows has the greatest impact on buildings’ total energy consumption [
8]. Due to the indoor lighting requirement of classrooms, the size of windows is usually large, resulting in a greater number of positions with inadequate thermal insulation. Furthermore, high occupants’ density always leads to poor air quality in winter and increased heat radiation from human bodies in summer, contributing to considerable energy consumption for heating and cooling.
The occupants of university teaching buildings are mainly youth aged 17–22, and the indoor environment quality of classrooms has a vital impact on their physical and mental health and learning efficiency. Studies have pointed out that people of different ages have various feelings about indoor thermal comfort. The thermal neutral temperature and acceptable temperature range of primary and secondary school students and college students are distinct [
9]. Primary school students prefer a slightly cooler environment, while college students prefer a warmer environment [
10,
11,
12,
13]. Diverse subjective evaluations of indoor thermal comfort may also exist between students and teachers [
14]. It is suggested that the acceptability of an indoor thermal environment is influenced by gender, birthplace, and living habits [
15]. For example, occupants’ thermal neutral temperature in the HSCW zone is lower than that in the cold zone, as is their thermal expectation [
16]. Besides, the thermal comfort temperature is also affected by the building’s location and weather [
17], and the thermal preference of users differs between the heating season and transition season [
18]. The temperature and humidity are varying among different areas in classrooms [
19], and the university teaching buildings have several classroom units with different functions and scales, including ordinary classrooms, seminar classrooms, and lecture theatres, which further aggravate the gap in indoor environmental quality.
Many studies indicate that the built environment has an important impact on students’ learning efficiency [
20,
21,
22], and the indoor environment and energy consumption of buildings are highly associated with their functions, locations, and users [
23]. Therefore, it is essential to investigate the energy-saving optimization design of university teaching buildings in specific regions and climatic conditions.
This study simulates and analyzes the energy consumption of a teaching building in hot summer and cold winter areas. The rest of the study is organized as follows:
Section 2 introduces the studied building, methodology, and design parameters in the research, and
Section 3 explains the simulation results and energy consumption characteristics.
Section 4 compares the influence of window orientation and window-to-wall ratio parameters on energy consumption in classrooms of different scales and puts forward design suggestions. Finally, the limitations and conclusions are presented in
Section 5 and
Section 6.
3. Results
3.1. Seasonal Fluctuation of Teaching Buildings’ Energy Consumption in HSCW Zone
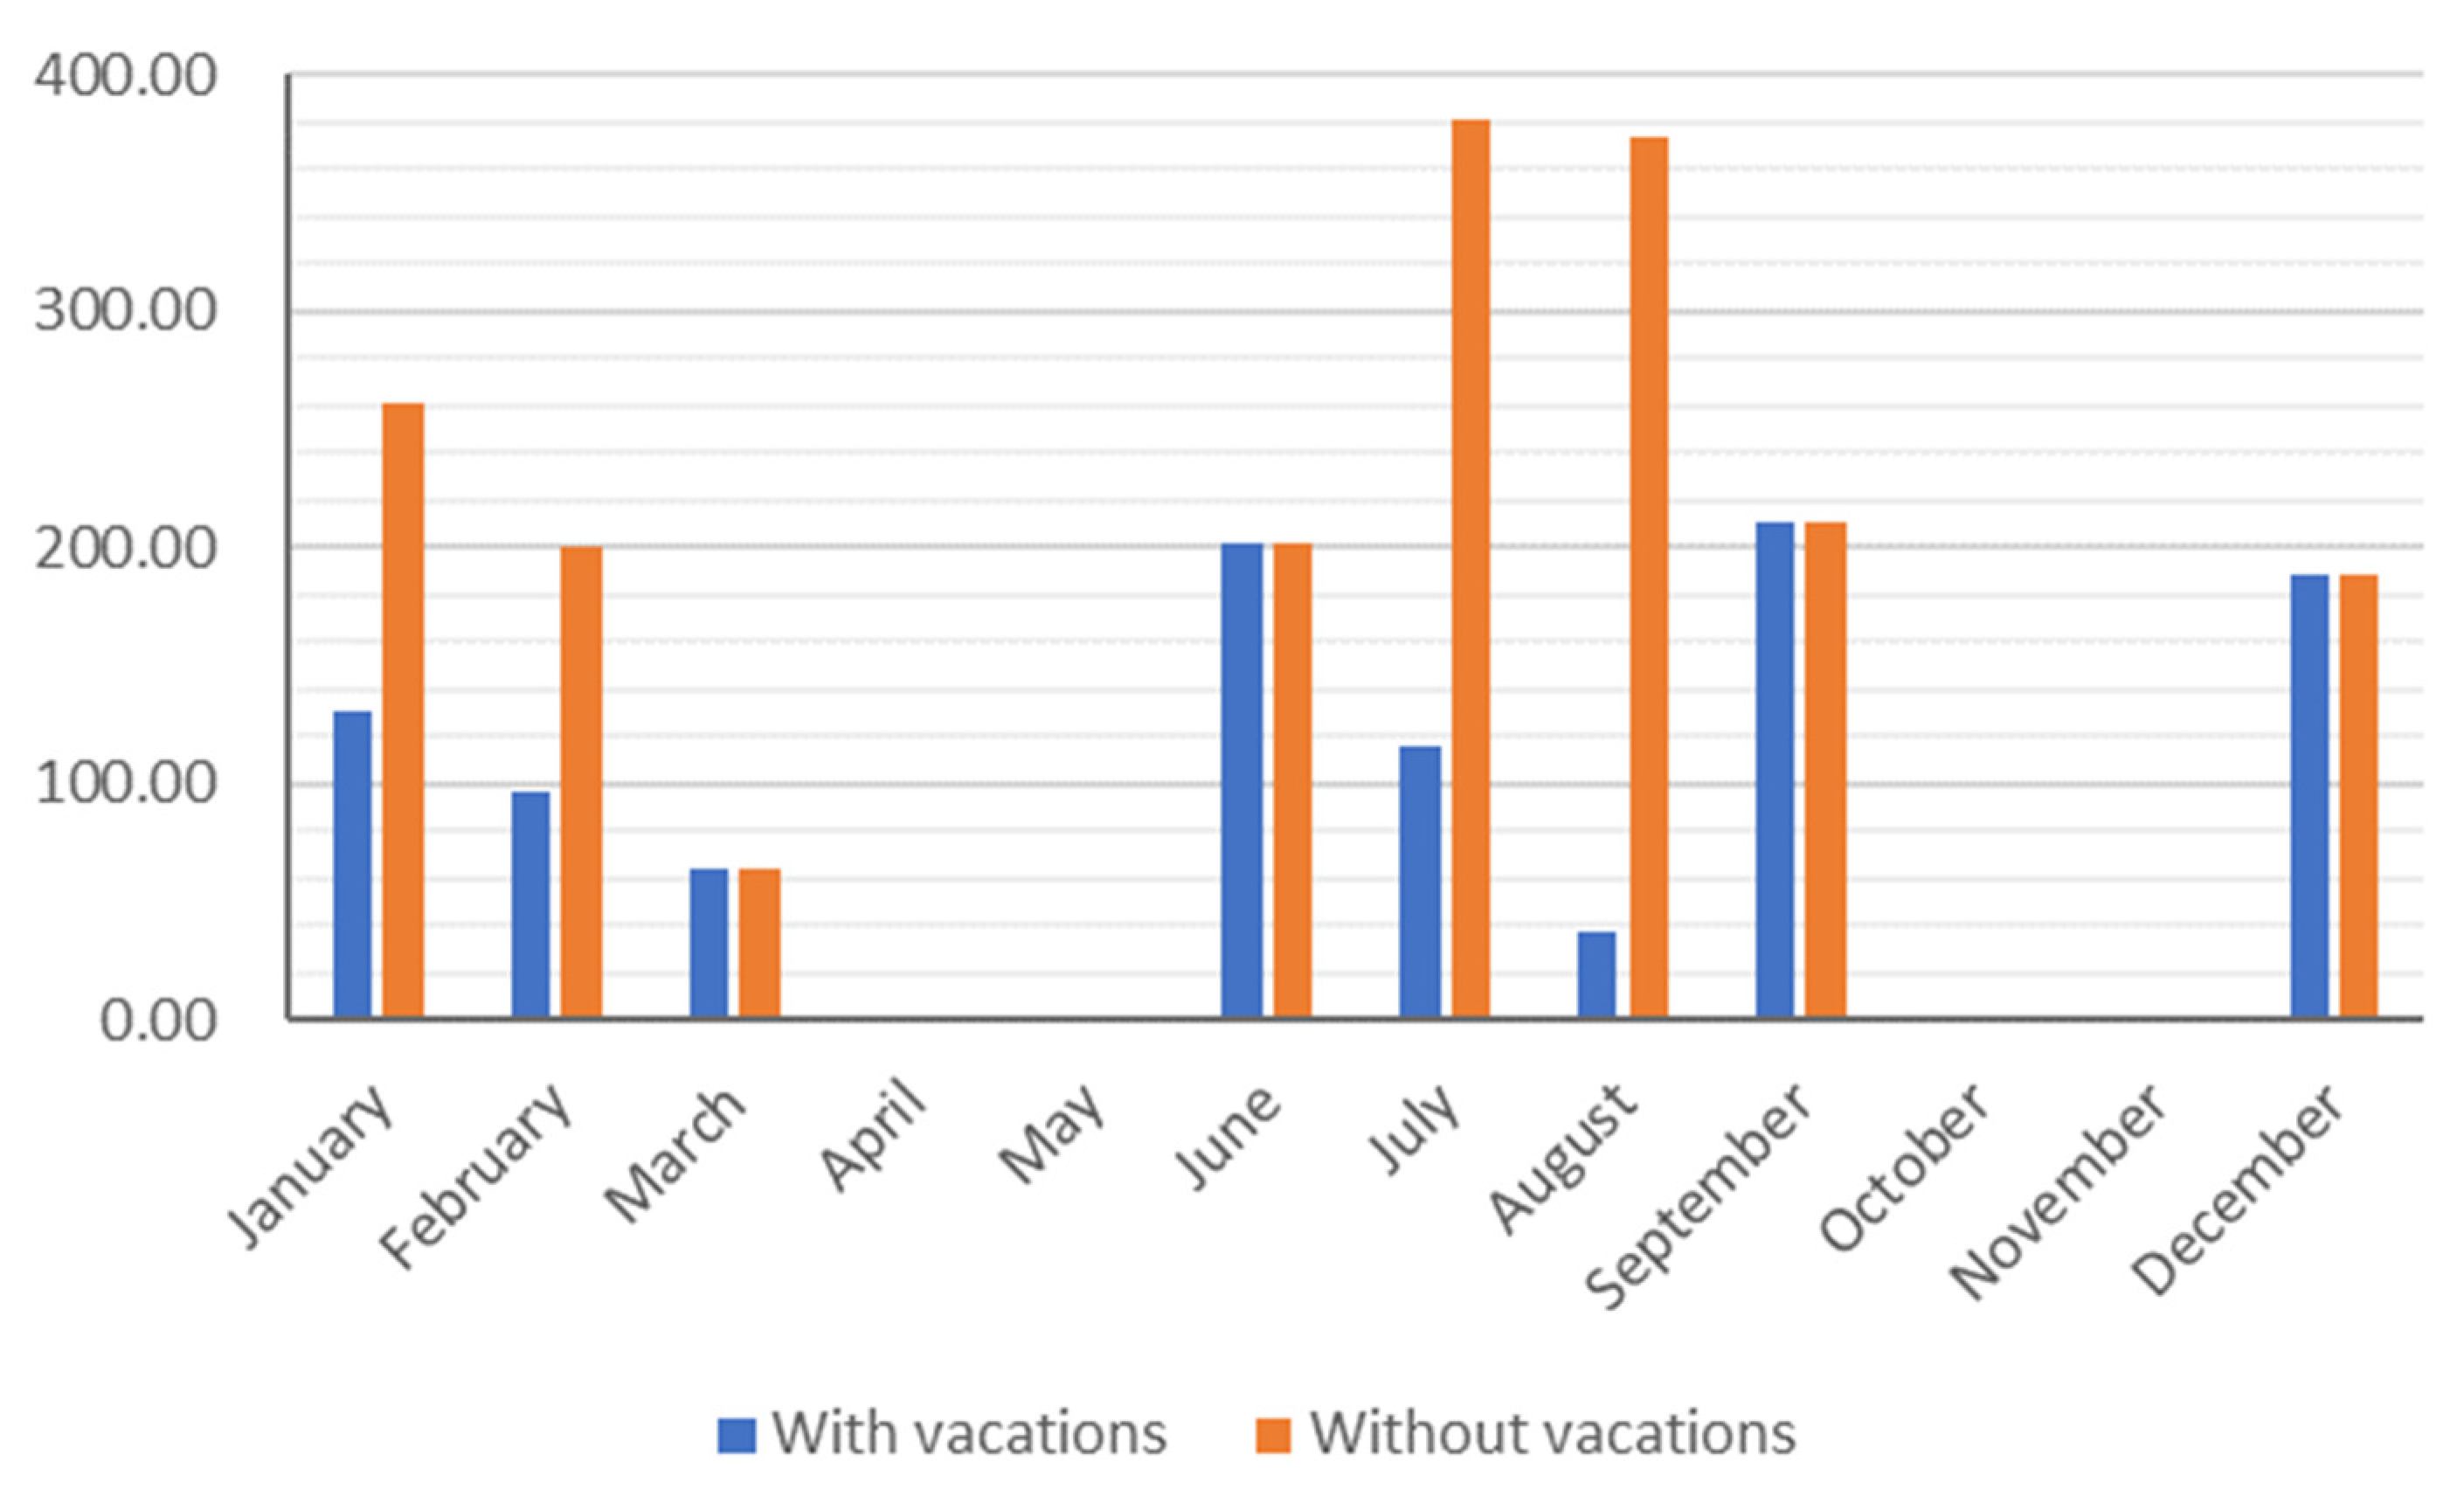
As mentioned above, educational buildings in the HSCW zone need to take into account the energy consumption of heating in winter, cooling in summer, and trough during vacations. The study compares the total energy consumption of the No. 4 teaching building under the current layout condition (west orientation) with or without vacations. As can be seen from
Table 3, when the building is running all year round without winter and summer vacations, the total energy consumption is 1911.6 GJ. Considering that the teaching building is closed during vacations, the total energy consumption is 1063.0 GJ, which is reduced by 848.6 GJ (44.4%). Among them, heating and cooling energy consumption is decreased by 235.0 GJ (32.7%) and 613.6 GJ (51.5%), respectively. The annual energy consumption per unit area with vacations is 99.8 MJ/m
2, which is significantly lower than that of other types of public buildings in the HSCW zone.
Figure 3 shows the monthly energy consumption of the two operation schedules. When the building is operating all year round, the peak energy consumption occurs in July and August, and the cooling energy consumption is approximately twice as much as that of June or September, resulting in considerable seasonal fluctuations. The amount of energy consumed in February, June, September, and December is comparable, slightly lower than the heating energy consumption in January. Affected by the winter and summer vacations at the university, the peak months for energy usage are June, September, and December. The cooling energy consumption has declined dramatically in July and August, while the heating energy consumption in January and February is less than half of that under all-year operation mode. It is clear that the educational buildings are a unique case of public buildings in the HSCW zone. During the winter and summer breaks, the energy consumption of teaching buildings in universities falls rather than rises. The regularly utilized energy-saving solutions for peak energy use in winter and summer, such as high-performance envelope structures, cannot have the expected significant effect, and may not be comparable to the input cost required.
3.2. Influence of Orientation
The plane of the No. 4 teaching building is close to symmetrical layout; therefore, the tendencies of total energy consumption for orientations 1–4 and 5–8 are comparable. However, the rooms on both sides of the corridor serve various purposes. One side is mainly used as teaching spaces, while there are offices, restrooms, and other auxiliary rooms along with the classrooms on the other side. The window area, space operating mode, and occupants’ demand for the indoor environment vary depending on the function; thus, the energy consumption in the opposite orientation differs.
The orientation of teaching spaces has an impact on the building’s overall energy usage, as shown in
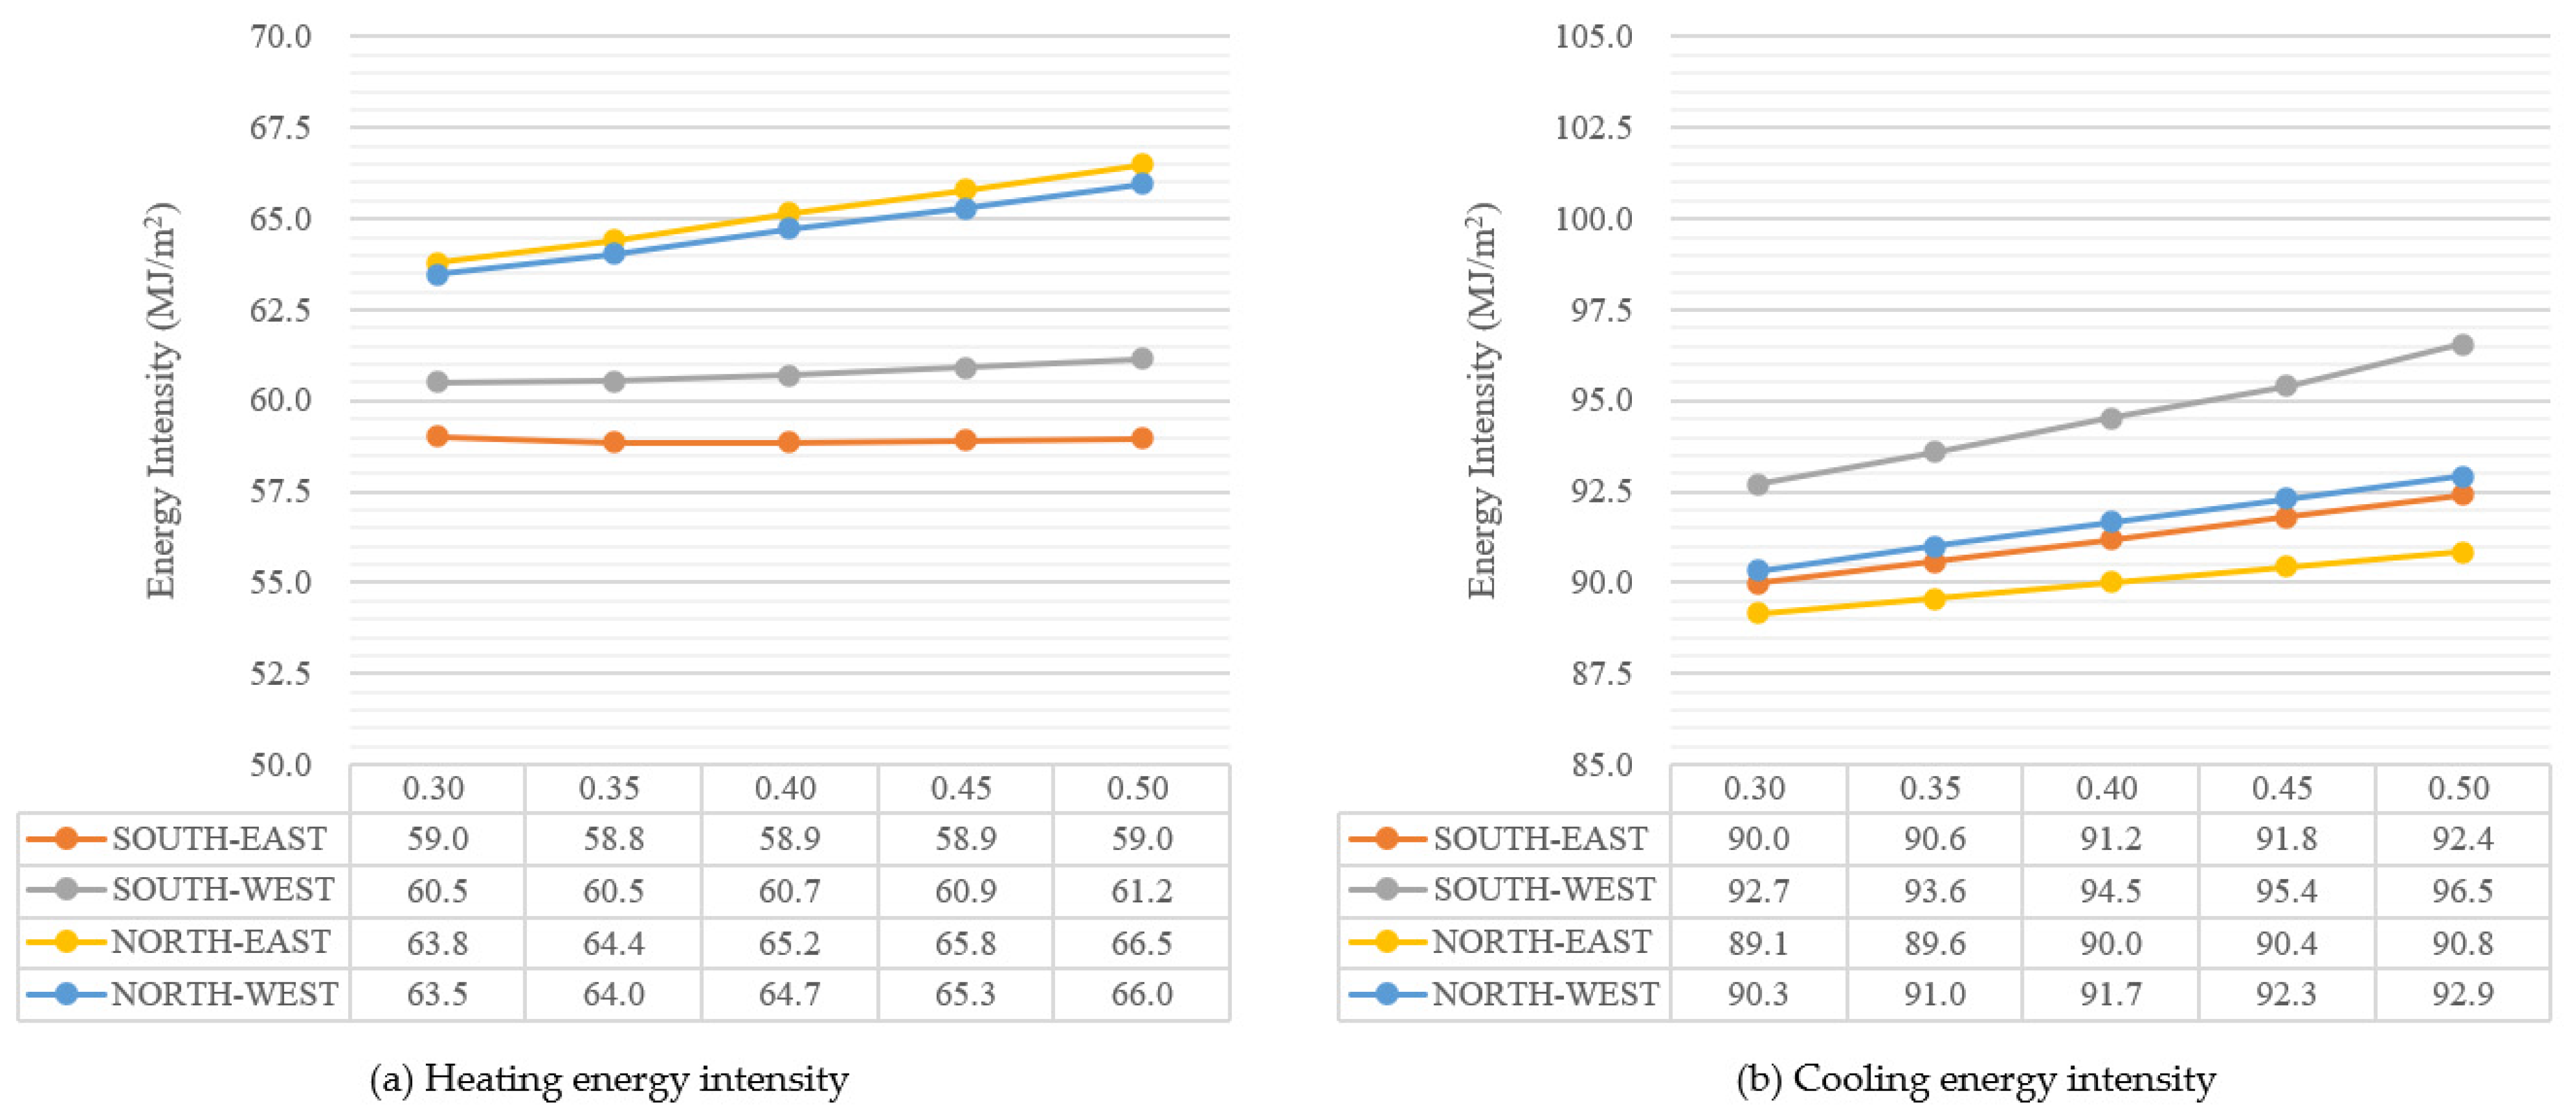
Figure 4a. When the majority of classrooms are in orientation 02 (northwest), the building’s total energy consumption is the highest (1065.1 GJ), followed by that in orientation 05 (east). Orientations 1 (west), 4 (northeast), and 6 (southeast) consume comparable amounts of energy, while orientation 08 (southwest) consumes marginally less (southwest). When the majority of the teaching area faces south or north, the yearly energy usage is significantly lower than that of other directions, with the energy consumption of the south orientation (orientation 7) being the lowest and able to reduce the total energy consumption by 2.1% (22.5 GJ) compared to the northwest (orientation 2).
The simulation results suggest that the energy consumption of cooling and heating in this teaching building varies slightly depending on the building’s orientation (
Figure 4b). First of all, the cooling energy consumption is always greater than the heating energy consumption by approximately 18.0–19.4% throughout the entire year. Under various orientation conditions, the difference between annual cooling and heating energy consumption ranges from 82.4 to 94.1 GJ. Secondly, in comparison to cooling energy consumption, the data deviation for heating energy consumption is smaller, with a floating range of 10.5 GJ versus 14.1 GJ for cooling energy consumption. In addition, different orientations demonstrate varying energy performance in winter and summer. The cooling and heating energy consumption in orientations 3 (north) and 7 (south) is lower than that in other orientations. The cooling energy consumption in both directions is virtually identical; however, the heating energy consumption in south-orientation is 4.3 GJ lower than that in north orientation. The heating energy consumption towards orientations 1 (west) and 8 (southwest) is relatively low, but the cooling energy consumption is extremely high, and the cooling energy consumption in the west orientation is the highest (578.5 GJ) of all orientations. This reflects the fact that in regions with hot summers and cold winters, the influence of the setting sun in the west is more pronounced, and it can be reasonably utilized in winter to reduce heating energy usage, whereas in summer it must be avoided as much as possible to reduce cooling energy usage.
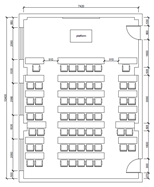
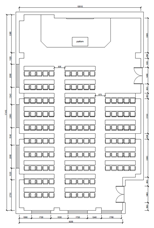
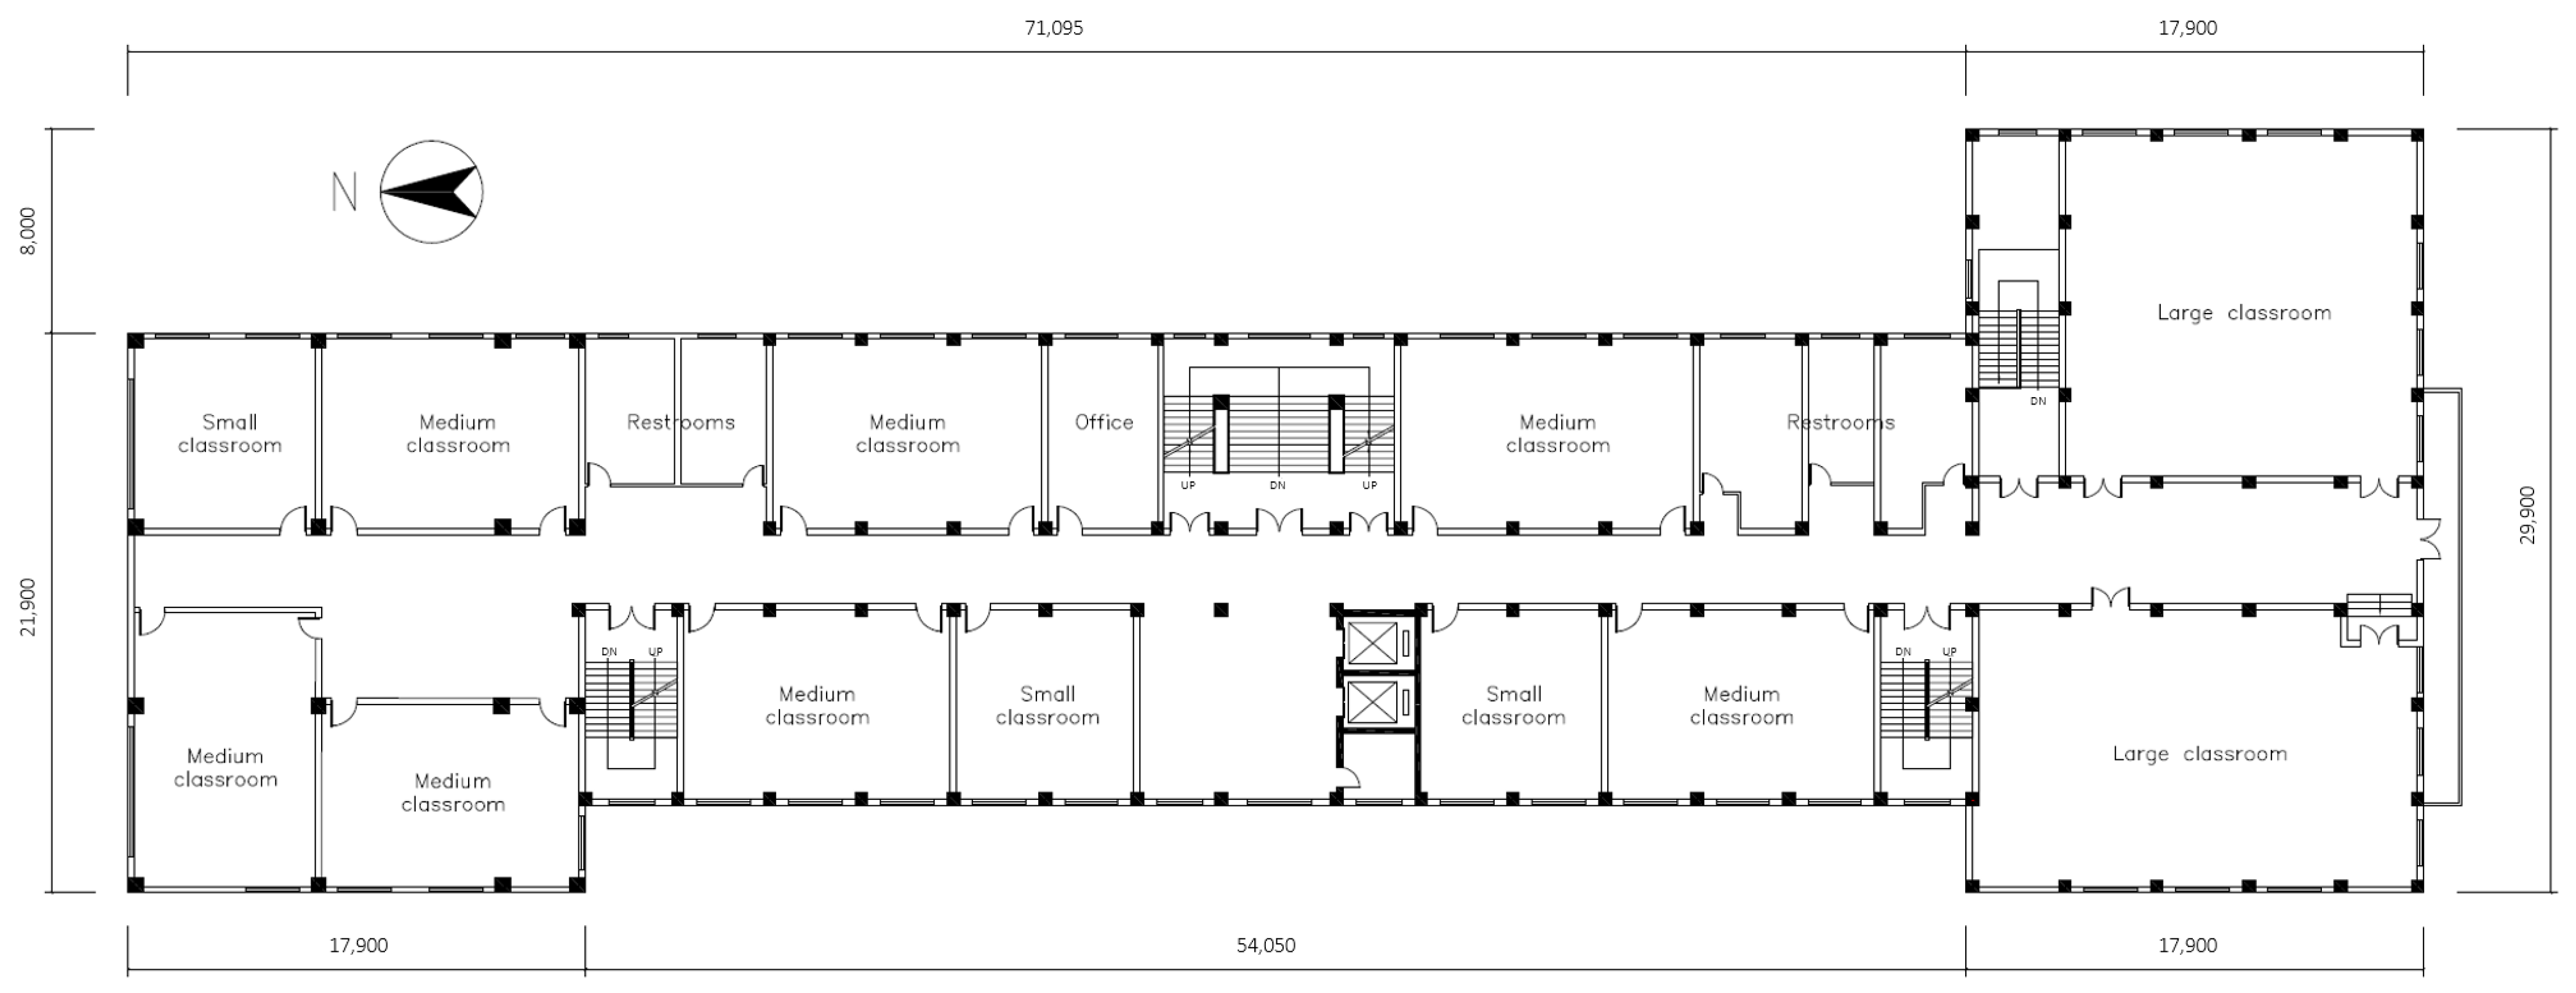
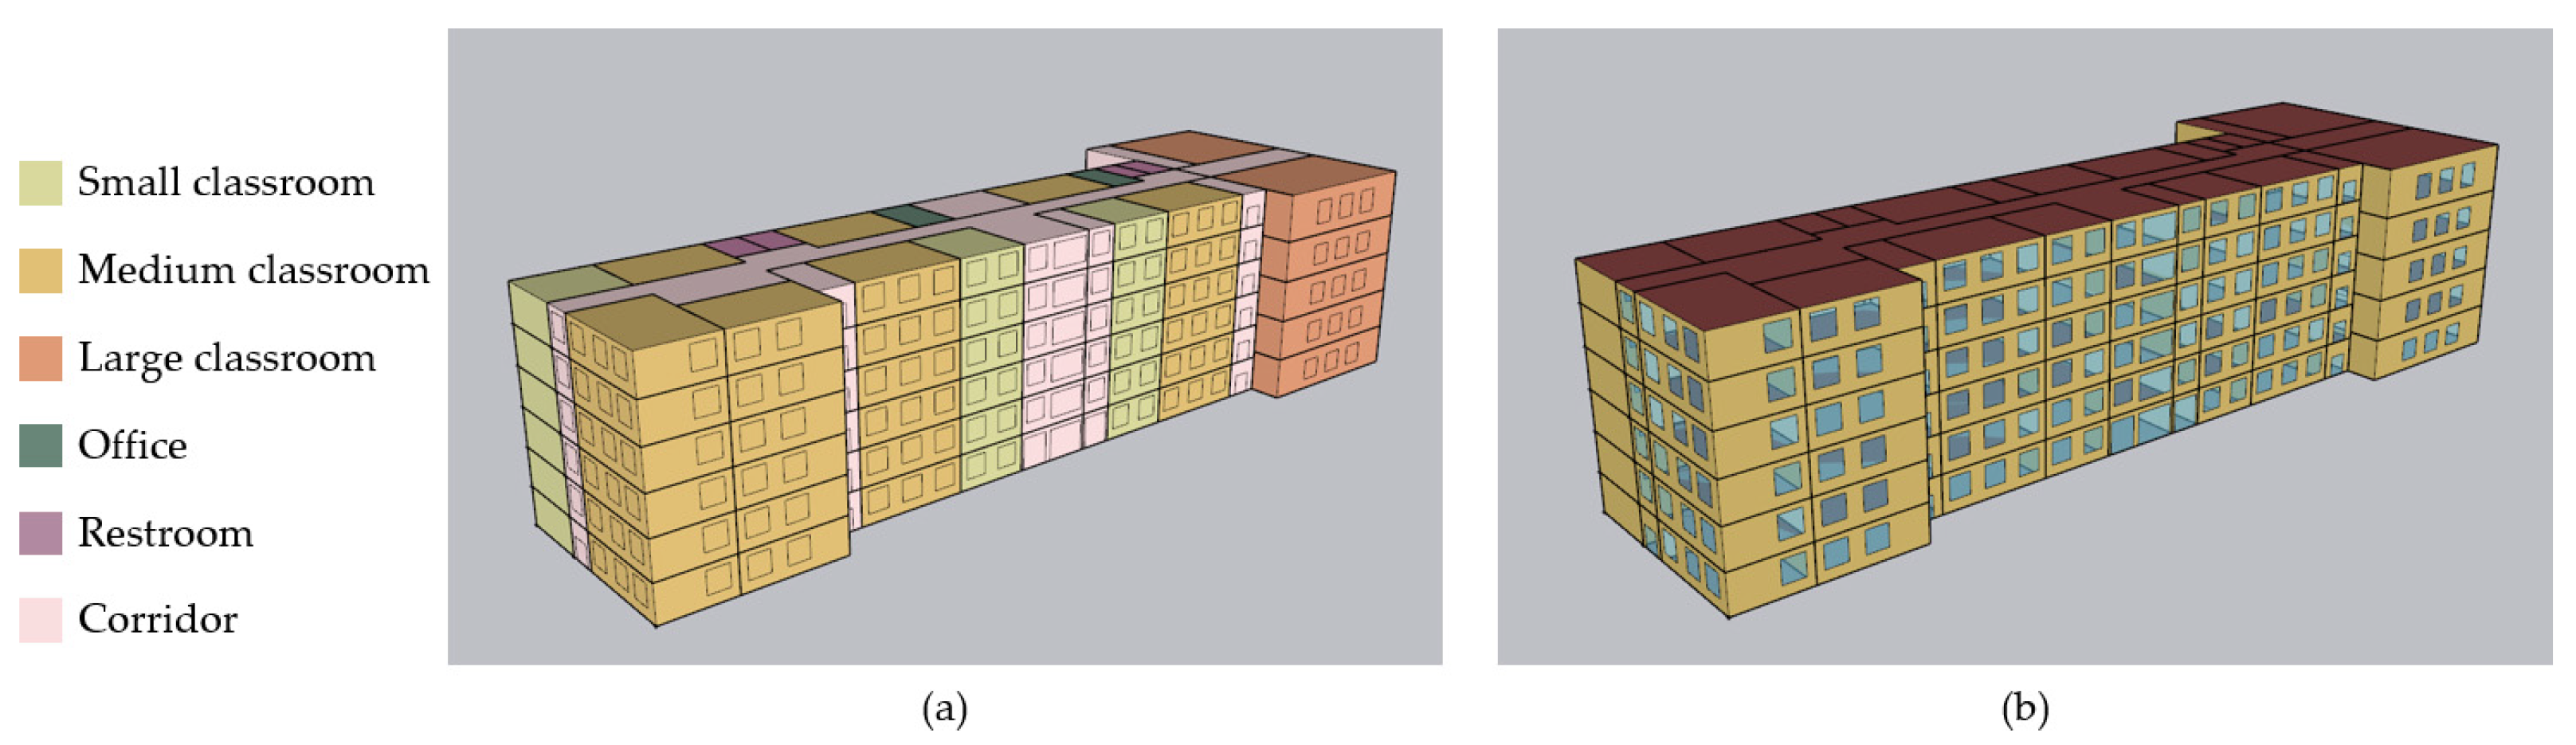
3.3. Differences in Energy Consumption among Classrooms
There are three types of classrooms in the building, with areas of 53 m
2, 80 m
2, and 188 m
2 (
Table 4). Small and medium-sized classrooms have one wall with windows, whereas large classrooms are placed at the end of the teaching building and have two walls with windows. It can be seen from the energy consumption data of each classroom that with the increase in the classroom area, the annual energy consumption intensity of the classroom gradually decreases, and the classrooms of different sizes exhibit distinct changing tendencies in orientations (
Figure 5 and
Table 5).
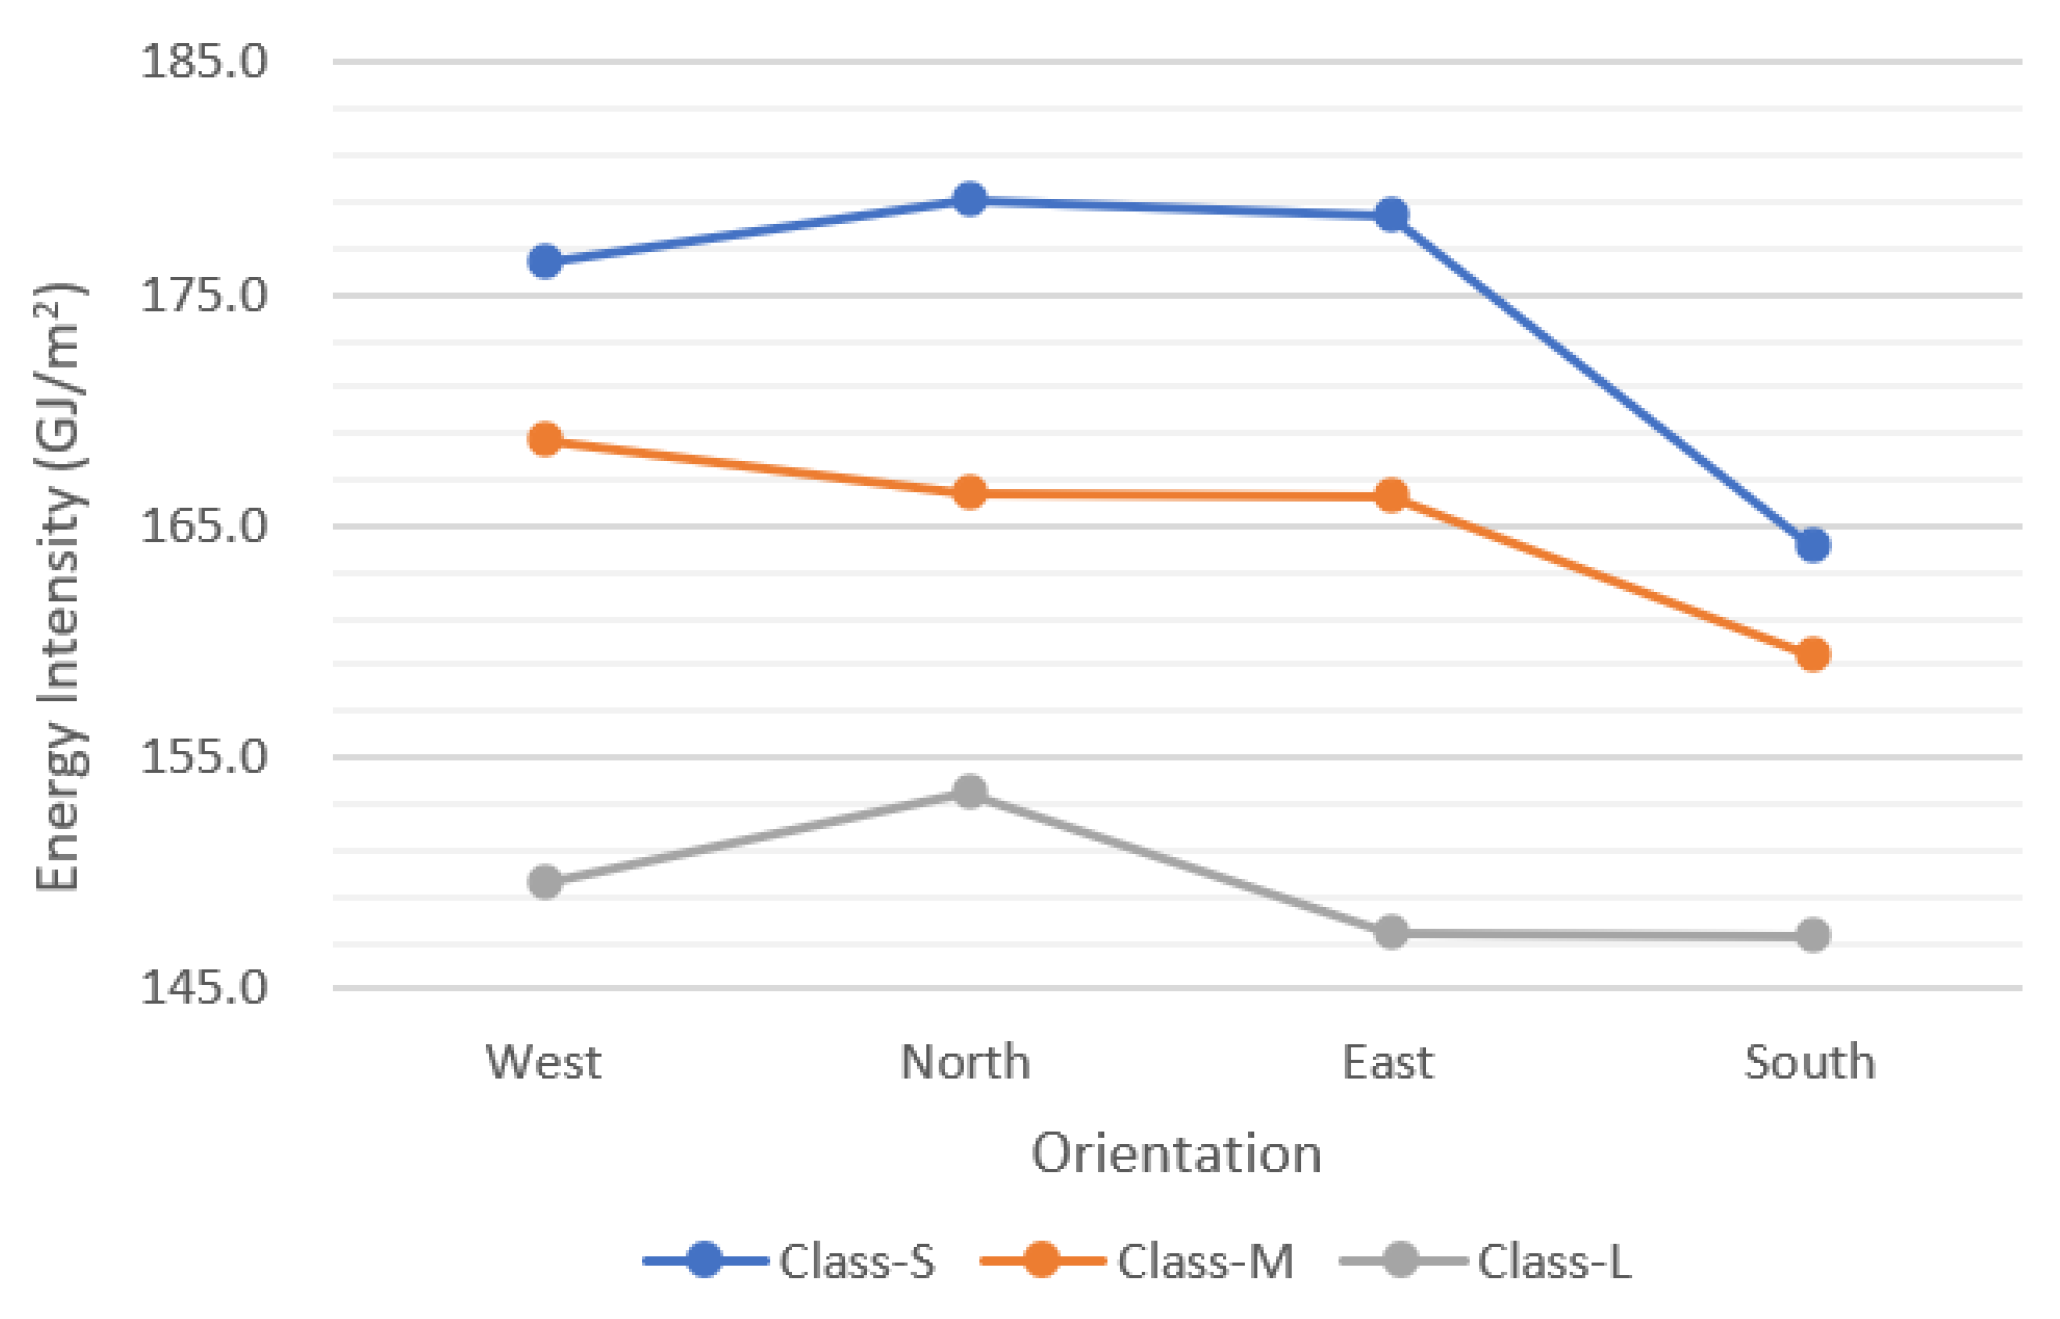
For small classrooms, the south-oriented layout has the lowest total energy consumption intensity as well as the lowest heating and cooling energy consumption intensity. The heating energy consumption intensity is the highest in the north-oriented layout, which increases by 19.9% (14.6 MJ/m2) compared with the south-oriented layout. The west-oriented layout has the maximum cooling energy consumption intensity, but the variance is small, increasing by only 4.1% (3.7 MJ/m2) compared with the south-oriented layout.
The total energy intensity of medium-sized classrooms is also lowest when the windows are opened to the south, although the intensity fluctuation range is about 5.8%, which is narrower than that of small classrooms (9.1%). The heating energy intensity is the lowest with southern windows, which is 15.8% less than that with northern windows. Compared with small classrooms, the cooling energy intensity was reduced, but the fluctuation range increased by approximately 6.1%, with the minimum variation occurring when the windows are open to the north and the other three orientations being similar.
Large classrooms have the lowest overall energy intensity, with the smallest fluctuation range of about 4.1%. The reduction in energy intensity is mostly attributable to the two-sided windows, which reduce heating energy consumption by a significant amount. In small and medium-sized classrooms, heating energy consumption accounts for about 46.2–47.1% of the total energy consumption, whereas in large classrooms, heating accounts for only 41.7%. When the window is opened in the south and east directions, the heating energy consumption in large classrooms is lower; however, it is higher when the window is opened in the north and east directions. Comparable energy consumption is required for cooling in various orientations.
In addition, according to the field survey, the window–wall ratio of different classrooms in the current building is slightly different. The small and medium-sized classrooms have similar window–wall ratios, both approximately 0.33; however, the large classrooms have low window–wall ratios, which may be one of the reasons for the low energy intensity. Furthermore, the window–wall ratio of different facades in large classrooms ranges from 0.18 to 0.26, a significant variance that may influence the data fluctuation of energy consumption intensity under various orientation conditions.
4. Discussion
According to the preliminary simulation data, the annual energy consumption of a building is affected by classroom size, window orientation, and window–wall ratio. In this section, three types of classrooms in the current building are selected as prototypes to simulate and evaluate the impact of the aforementioned three design aspects on classrooms’ energy consumption. The study alters the window area and analyzes the energy consumption tendency of classrooms with different orientation layouts when the window–wall ratio (WWR) ranges from 0.3 to 0.5, with a value interval of 0.05.
4.1. Small Classrooms (Class A)
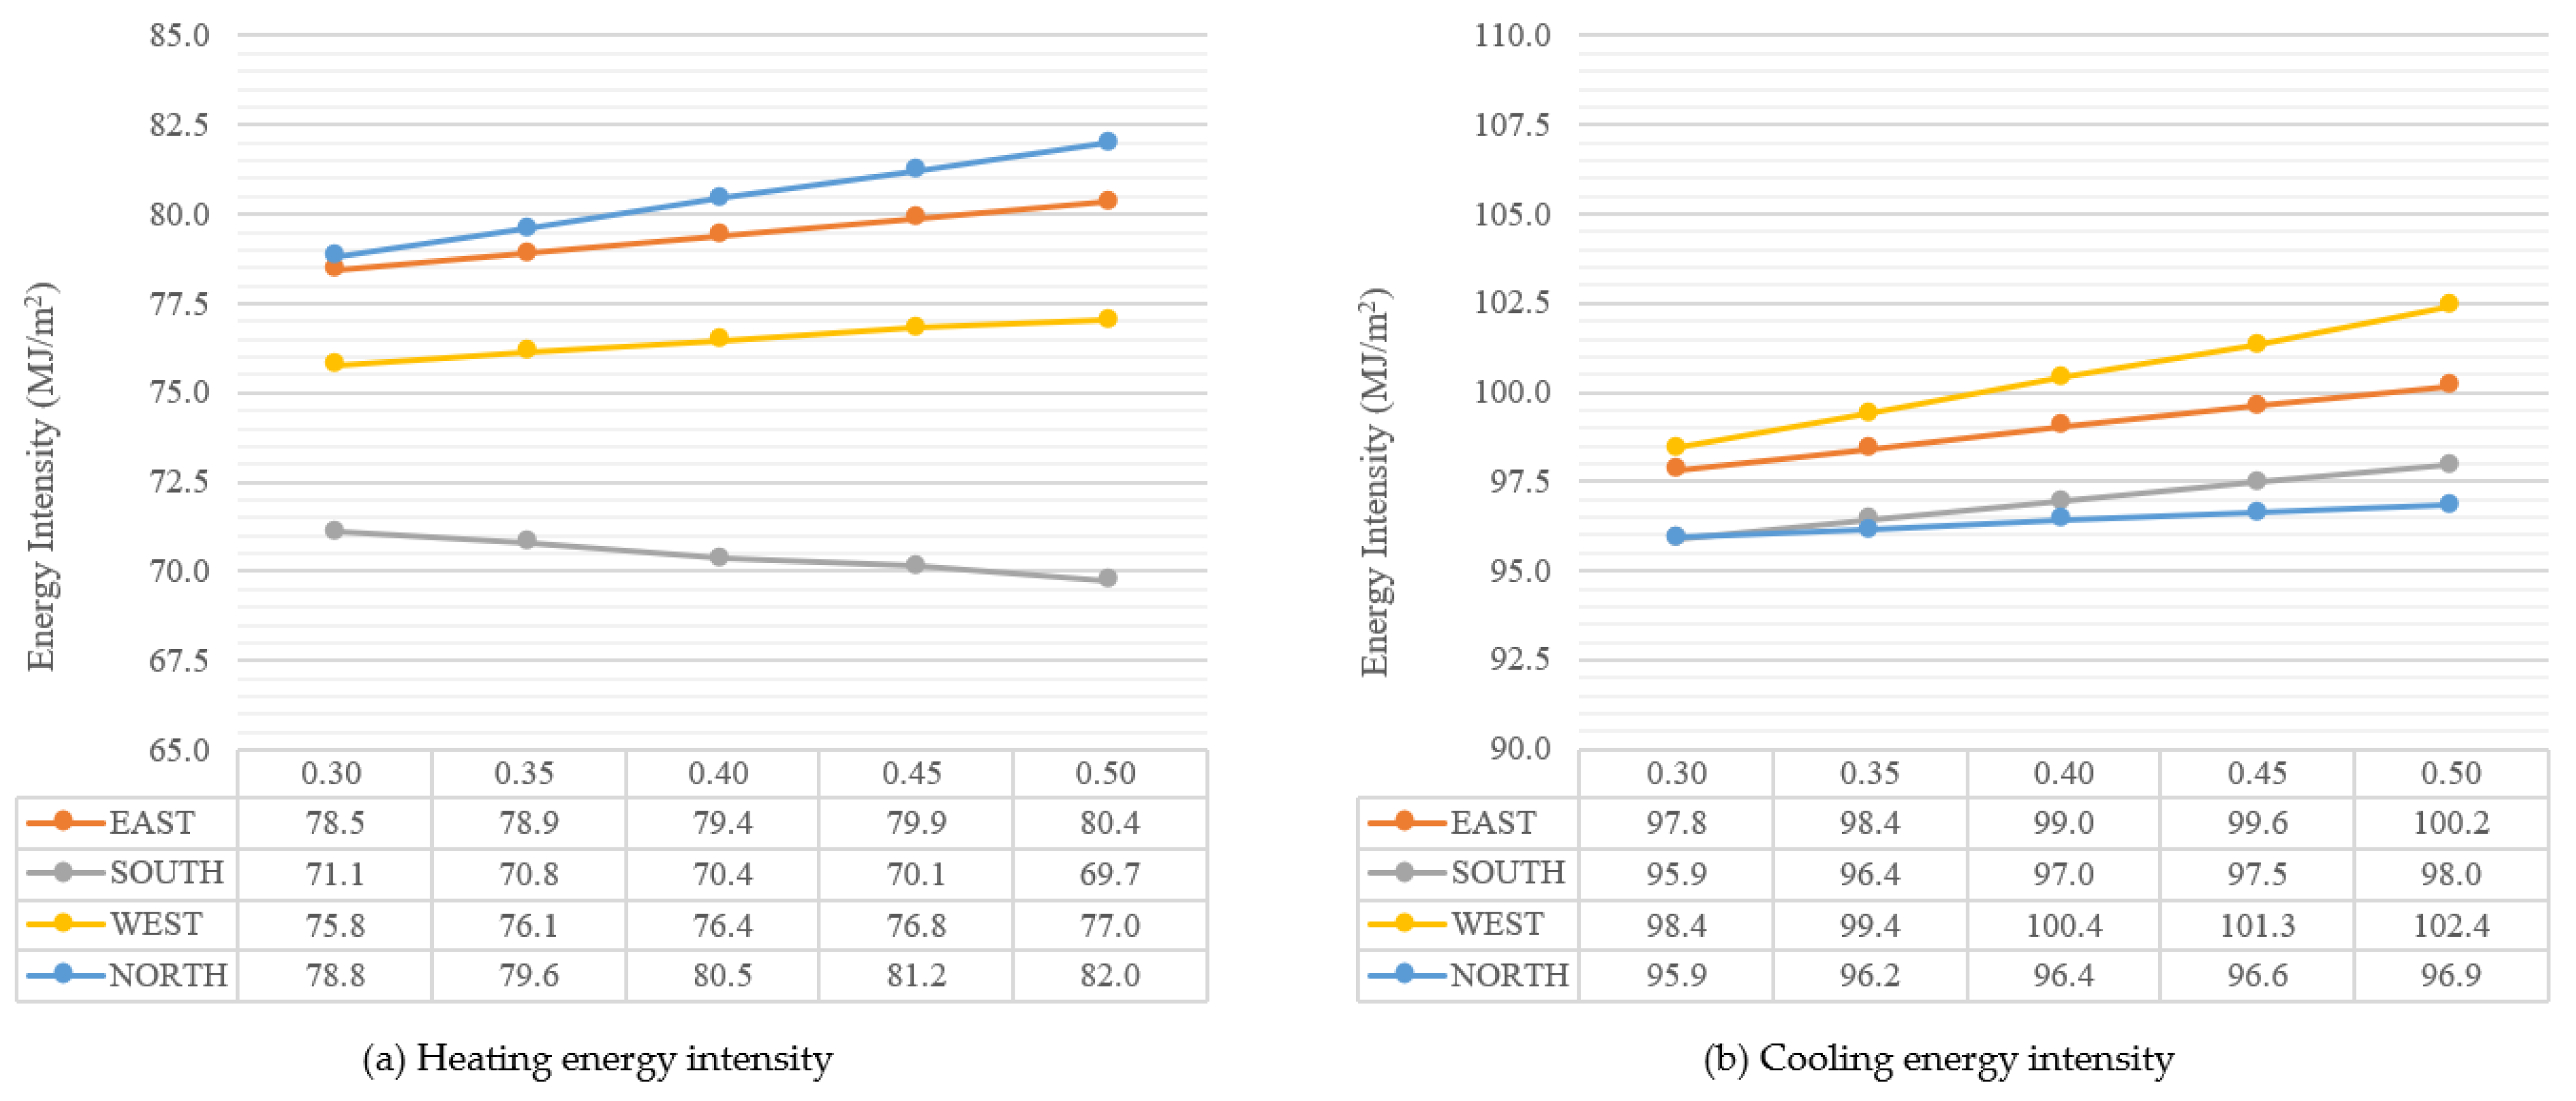
As shown in
Figure 6a, when the window in small classroom A is opened in the south direction, the classroom’s heating energy intensity is significantly lower than that in other directions. The heating energy intensity increases as the WWR rises in the west, east, and north directions, but decreases by approximately 2.0% in the south direction, from 71.1 to 69.7 MJ/m
2. When the north window is opened, both the heating energy intensity and the rise are greatest.
The tendency of cooling energy intensity is shown in
Figure 6b. The cooling energy intensity is highest when the window is opened in the west direction, followed by the east direction, and the south-facing and north-facing classrooms have lower cooling energy intensity. With the increase in the WWR, the cooling energy intensity in all directions increases, among which the west direction has the highest growth (4.1%), the east and south directions experience similar rises (2.2% and 2.4%, respectively), and the north direction has the smallest increase (0.9%). When the WWR is 0.3, the cooling energy intensity of the south and north orientations is roughly equivalent. When it reaches 0.5, the cooling energy intensity of the southern windows is 1.2% higher than that of the latter. Moreover, the west-facing windows have the largest cooling energy intensity, 5.8% higher than the north-facing windows.
Heating energy consumption accounts for 41.6–45.8% of the total energy usage, while cooling energy consumption accounts for a slightly higher proportion, approximately 54.2–58.4%. The proportion of cooling energy consumption is highest when the windows face south, whereas it is lower when the windows face west and north.
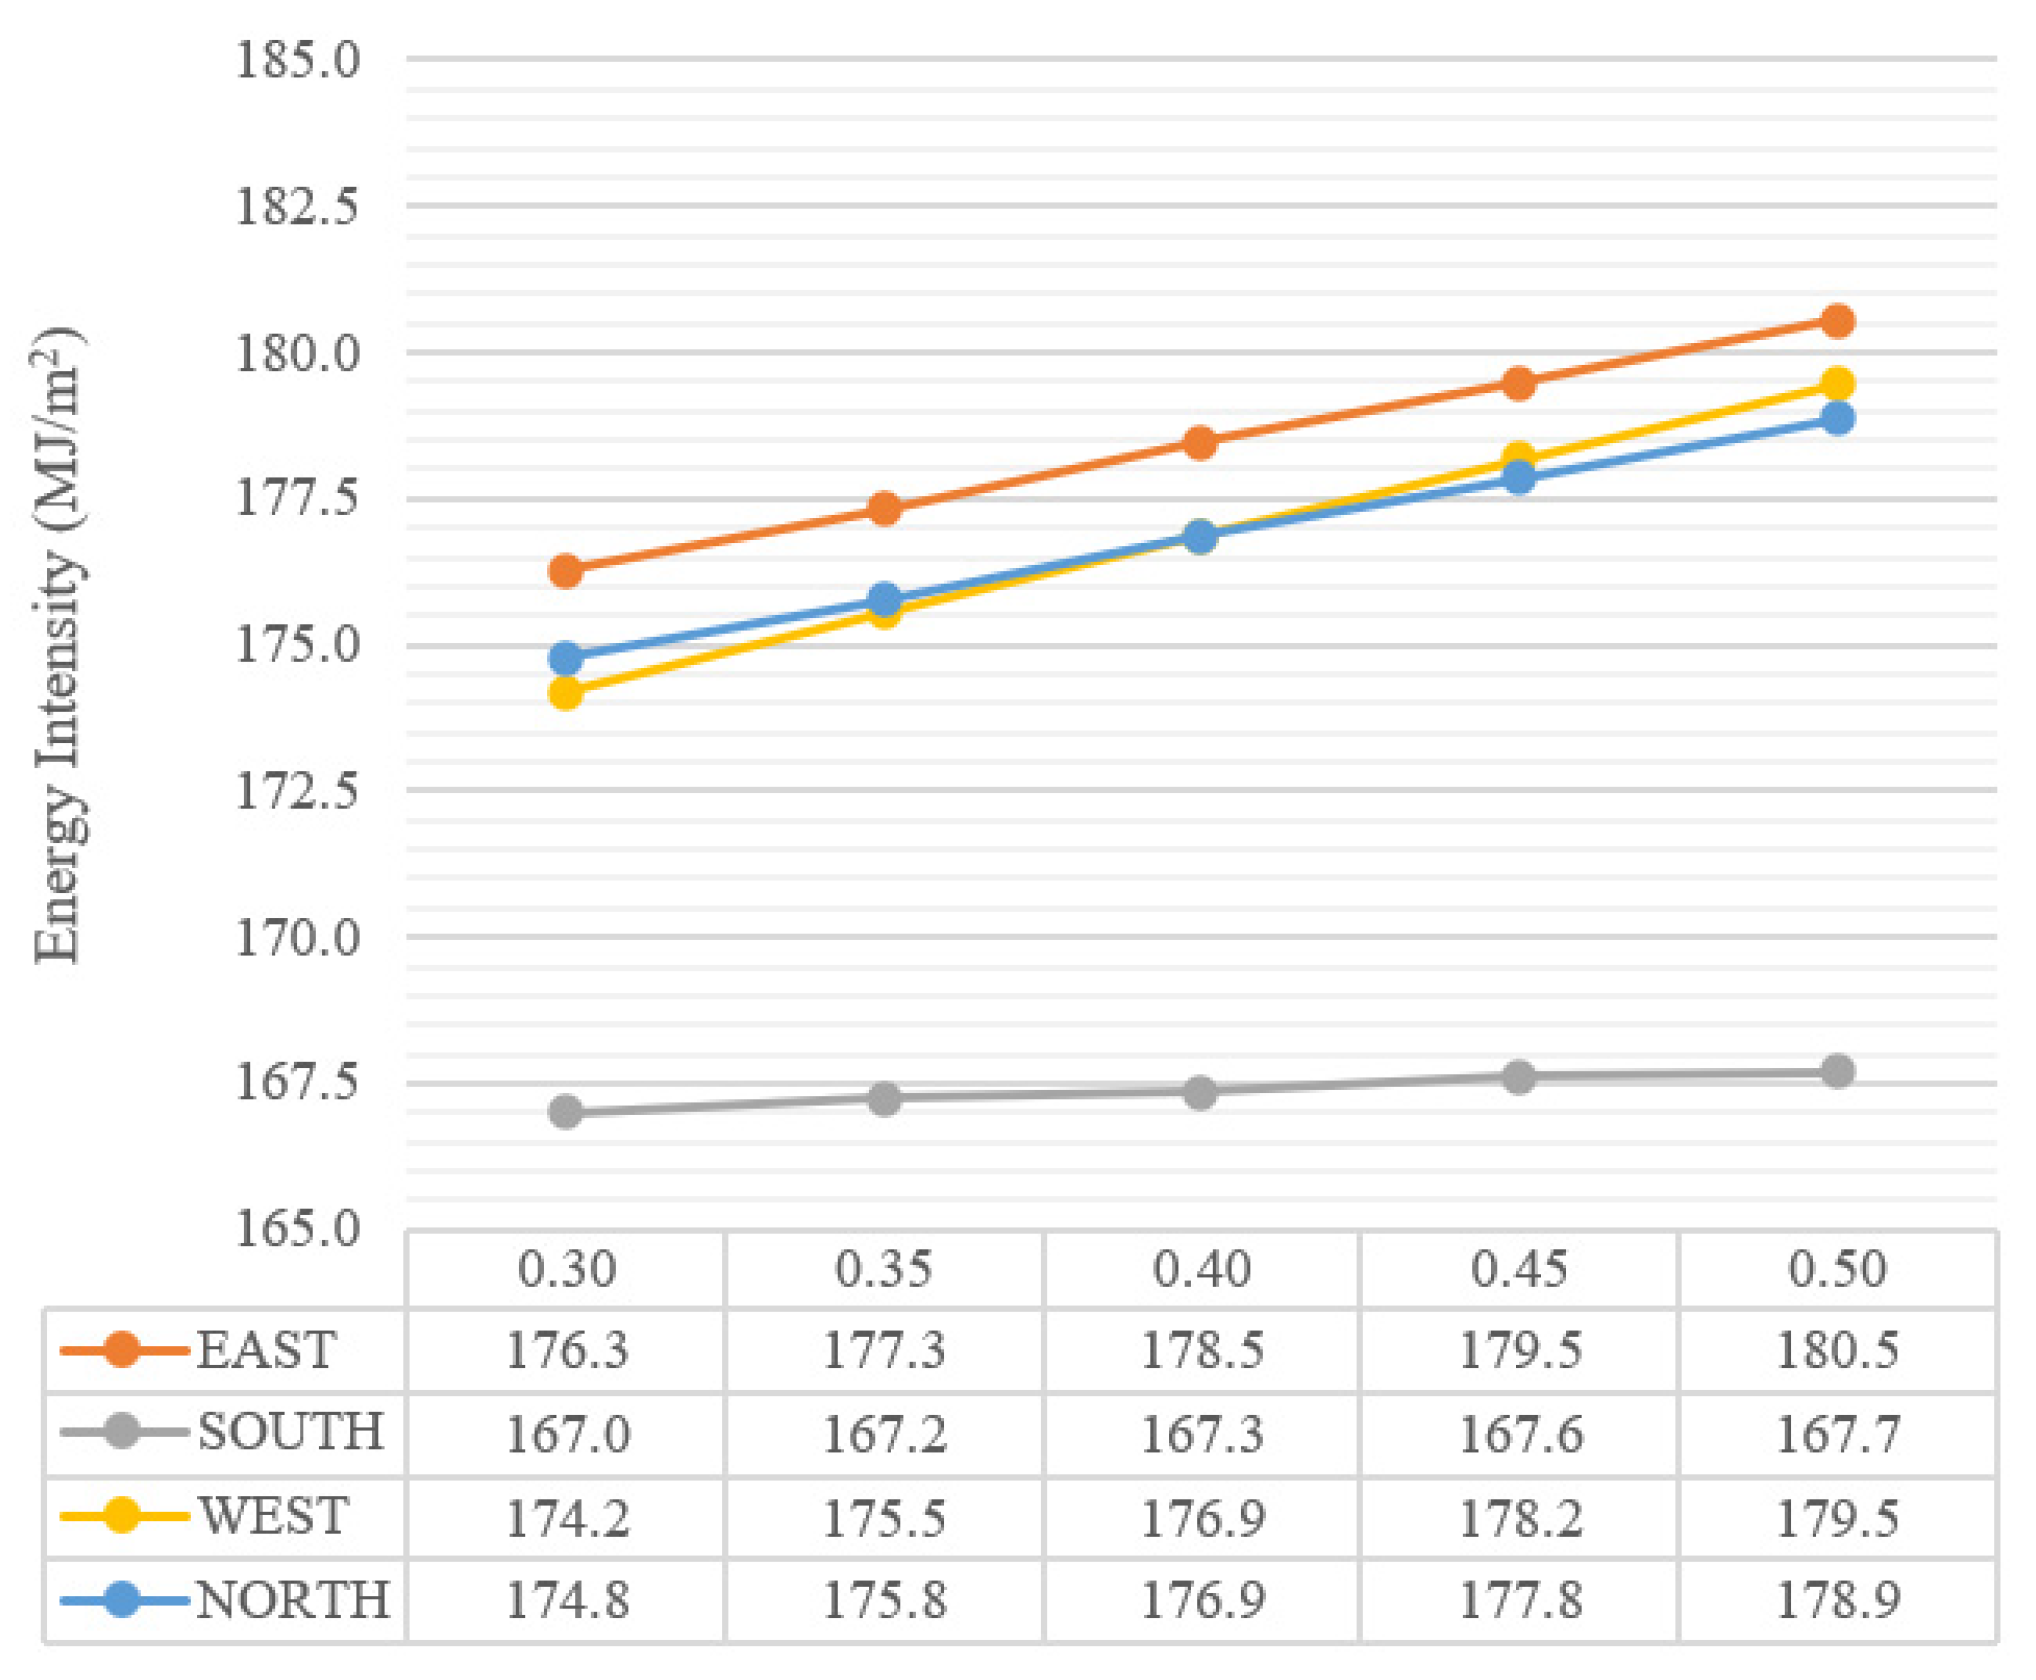
The overall yearly energy usage of the south-facing classroom is 167.0 MJ/m
2, significantly less than other orientations, as shown in
Figure 7. The east-facing classroom consumes the most energy, and the energy intensity is 5.6–7.7% greater than the south-facing classroom with the same WWR. West and north orientations have lower energy usage, and they are basically the same when the WWR is 0.40. When the ratio decreases, the energy intensity of the north orientation is higher; conversely, the west orientation has a greater energy intensity. Additionally, as WWR increases, the classroom’s overall energy usage changes little when the south-facing window is opened but rises when the window is opened in other directions. The area of windows has a significant impact on the rate of rise in energy consumption with west-facing windows.
4.2. Medium Classrooms (Class B)
The yearly heating energy consumption variation trend of classroom B, a medium-sized classroom, is comparable to that of classroom A, as shown in
Figure 8a. The heating energy intensity is lowest when the window is opened southward, and it decreases with the increase in window area. Adjusting the WWR from 0.3 to 0.5 reduces the heating energy intensity by approximately 1.7%. While the windows are opened to the east, west, or north, the heating energy intensity rises with the WWR, with the growth rate being slightly greater when the windows are opened to the north. When the WWR hits 0.5, the heating energy intensity of east and west orientations is similar.
As seen in
Figure 9, the annual cooling energy consumption increases as the WWR rises, with the growth rate being rather higher in the west and lower in the north. The north orientation has the lowest cooling energy usage, followed by the south orientation with an increase of 1.8%. Compared to north-facing windows, east, and west-facing windows enhance the cooling energy intensity by 4.2% and 5.6%, respectively.
In the annual energy consumption of classroom B, the proportion of heating and cooling energy consumption is similar to that of classroom A. The heating energy consumption accounts for 41.2–45.1% and will be lower for south-facing windows and higher for north-facing windows.
As presented in
Figure 9, classroom B with south windows consumes the least energy, followed by north and east windows, with which the energy consumption rises by 2.7–4.7% and 3.8–5.9%, respectively. The energy consumption is highest when windows are opened in the west, increasing by 4.7–7.3% compared with that in the south direction. When the WWR increases, the annual energy consumption rises, and the growth rate is roughly equivalent whether the windows are opened east, west, or north. For a classroom with south windows, due to the fact that the reduction rate of heating energy consumption is not as rapid as the increase rate of cooling energy consumption, and the proportion of heating energy consumption is relatively low, the total energy consumption will keep rising by a minor fraction. When the WWR changes from 0.30 to 0.50, the increase in total energy consumption is only 0.4%, which is considerably less than other directions (2.4–2.9%).
4.3. Large Classrooms (Class C)
Changes in orientation and WWR affect the annual heating energy consumption of large classrooms, showing divergent trends (
Figure 10a). When there are south-facing windows in classroom C, the heating energy consumption is lower, and it is affected little by the size of the windows. Classrooms with south- and east-facing windows have the lowest heating energy consumption, while a WWR of 0.30 results in the highest energy consumption. As the WWR increases, the energy consumption decreases to its minimum at 0.35 and then climbs slightly. When the windows are opened to the south and west, the heating energy intensity is 3.1% higher than that of the former on average. The heating energy usage is nearly identical when the WWR is between 0.3 and 0.35, increasing by 1.0% when the WWR reaches 0.50. If the classroom has north windows, the annual heating energy intensity is significantly higher, which grows as the WWR rises and is 7.5–12.7% greater than the classroom with south and east windows. The energy consumption performance of north-east windows and north-west windows is close, with increases of 4.2% and 3.9%, respectively, when the WWR is changed from 0.30 to 0.50.
Classroom C‘s cooling energy usage is comparable to that of the prior two classrooms, rising as WWR increases (
Figure 10b). The cooling energy performance of east windows is preferable to west windows, whereas north windows are better than south windows. Therefore, the large classroom with east and north windows has the lowest consumption and the slowest increase rate (1.9%), followed by simulations with east-south and west-north windows, which grew at equal rates of approximately 2.7–2.9%. When the windows are open to the west and south, the cooling energy intensity is significantly greater than in other orientations, 4.0–6.3% higher than that of north-east windows, and the growth rate (4.1%) is the biggest as well.
As shown in
Figure 11, Classroom C has the lowest annual energy consumption with south and east windows, as well as the lowest growth rate (1.6%) with WWR. Both the total energy usage and the increase rate (2.9%) are equivalent for the north-east and south-west orientations, approximately 3.4% higher than the south-east orientation. When the windows are open to the south and west, the classroom’s energy intensity is the highest, increasing by approximately 3.2–4.9% compared to the south-east orientation, with a growth rate of 3.3%.
4.4. Influence Patterns and Design Strategies
The teaching building in this study has an annual energy intensity of approximately 27.2–27.8 kWh/m
2 (with summer and winter vacations), with HEUI of 12.5–12.7 kWh/m
2 and CEUI of 14.7–15.1 kWh/m
2, as shown in
Table 6. The energy intensity of the classroom space ranges from 41.4 to 50.2 kWh/m
2, with 16.4–22.8 kWh/m
2 for heating and 24.8–28.4 kWh/m
2 for cooling. The results align well with the energy consumption data of other classroom studies, which falls within the range of 19.5–42.7 kWh/m
2 [
25,
26]. Despite the summer vacation being 1.8 times longer than the winter vacation, the teaching building’s cooling energy consumption remains 18.0–19.4% greater than its heating energy consumption, indicating that insulated cooling is more crucial and offers more possibilities for energy conservation in educational buildings in the HSCW area. Regarding the entire building, the optimal orientation is south and north, and the energy consumption in the south orientation is slightly lower compared to the north orientation. It is recommended to arrange the teaching space facing south and the auxiliary rooms facing other directions from an energy-saving standpoint.
The findings of the simulation indicate that the size of classrooms significantly affects the energy consumption in the space, with a bigger space scale corresponding to a lower energy intensity. According to the investigation, medium-sized classrooms make up the majority of teaching buildings at colleges and universities, accounting for around 60% of all teaching space. Considering that medium classrooms are highly utilized, it is crucial to prioritize the energy efficiency of such classrooms in the design phase.
Furthermore, it is vital to take into account both the optimal orientation and the window-to-wall ratio in classrooms of different sizes since these factors have varying effects on energy consumption. The south orientation is the most advantageous for small and medium-sized classrooms due to the significantly lower energy usage compared to other orientations. In contrast to other orientations where increasing the WWR will result in a rise in energy consumption, south-facing windows are comparatively unaffected by the WWR, allowing for an appropriate enlargement of the window area. Windows in the west direction contribute to higher energy consumption, mainly due to boosted cooling needs. This can be reduced by implementing measures such as sunshading boards and heat insulation during the summer, which helps mitigate the impact of the window-to-wall ratio. It is not advisable to utilize the east and north as the window opening surfaces due to the increased heating energy consumption in these directions, which will also grow when the window-to-wall ratio increases. However, it is not advisable to utilize the east and north as the window opening surfaces owing to the higher heating energy consumption in these directions, which will also grow when the WWR increases.
Large classrooms always have windows on both sides due to the scale. Simulation data reveals that the most energy-efficient orientation is towards the east and south, where the lowest energy consumption is observed. Heating energy consumption is lower in the west and south, whereas cooling energy consumption is greater. This discrepancy can be corrected year-round by implementing efficient sunshading and heat insulation techniques, as well as limiting the size of west-facing windows. As the overall energy consumption rises in tandem with the window-to-wall ratio, it becomes imperative to regulate the window aperture area so as to avoid excessive expansion.
6. Conclusions
This study evaluated the effects of building orientation and window–wall ratio on the energy consumption of university teaching buildings in China’s HSCW zone. The simulation indicated that the energy consumption of university teaching buildings in the HSCW zone has substantial seasonal fluctuation, and cooling energy consumption is higher than heating energy consumption even if the vacations avoid the conventional peak energy consumption. Meanwhile, orientation and WWR have distinct influences on the heating, cooling, and total energy intensity of classrooms of different scales, so it is necessary to make a comprehensive comparison of design parameters.
The energy consumption characteristics of various classrooms can be utilized in the design of teaching buildings. The main teaching space should be oriented toward the south as much as possible, while the auxiliary function rooms may be organized in other directions. Small and large classrooms can use west windows with effective shading and heat insulation techniques, whereas medium-sized classrooms can adopt north windows with suitable space.
Furthermore, there are two methods to reduce the energy usage of existing educational buildings. On the one hand, shading strategies could be implemented in an unfavorable direction to decrease cooling energy consumption. Alternatively, the utilization rate of low-energy-intensity classrooms could be improved in accordance with energy consumption characteristics and course requirements.


