Article

Enhancing Urban Living Convenience through Plot Patterns: A Quantitative Morphological Study

1
College of Architecture and Urban Planning, Tongji University, Shanghai 200092, China
2
Key Laboratory of Ecology and Energy-Saving Study of Dense Habitat, Tongji University, Shanghai 200092, China
3
The Architectural Association School of Architecture, 36 Bedford Square, London WC1B 3ES, UK
*
Author to whom correspondence should be addressed.
Buildings 2024, 14(5), 1408; https://doi.org/10.3390/buildings14051408
Submission received: 11 April 2024 / Revised: 6 May 2024 / Accepted: 9 May 2024 / Published: 14 May 2024
(This article belongs to the Section Architectural Design, Urban Science, and Real Estate)

Abstract

:
Living convenience in public service facilities has attracted significant attention as a crucial indicator of urban development and quality improvement. However, the performance of plot patterns—a fundamental unit for precise control when measuring urban quality—influencing living convenience requires in-depth exploration. This study integrates multiple urban datasets with quantitative urban morphology methods to investigate the impact of various plot pattern features on living convenience. Specifically, we investigate the Inner Ring area of Shanghai as an empirical case. The assessment considers the diverse effects of facilities at different distances, accounting for the life radiuses of both older individuals and the general population. Additionally, the analysis of plot patterns includes planar and three-dimensional aspects, controlling key variables such as road network accessibility and centrality. The results indicate that, for small-scale plots, shape has a strong impact, while, for large-scale plots, the division and construction intensity within a block has a stronger influence. Furthermore, plots of different area types have different recommended construction intensities. Notably, for large-scale blocks, it is advisable to maintain a building density of around 0.3. In short, this study contributes to human-centered planning by providing targeted recommendations to address the existing deficiencies in plot morphology regulation and control from the perspective of quantitative urban morphology.

1. Introduction

As the urbanization process continues to advance, the focus of new urban construction has shifted from “building cities” to “managing cities”, placing increasing emphasis on creating human-oriented built environments [1]. In this context, the efficient enhancement of urban space quality has become a key task in the development stages of cities. Various regions have put forward related measures dedicated to improving residents’ daily convenience, striving for high-quality urban development. The “Shanghai Urban Master Plan (2017–2035)” first proposed the pursuit of a more comfortable, convenient, and livable living environment, stating that improving the quality of urban life is an important means of enhancing global competitiveness. The convenience of daily life, as an important indicator of the fifteen-minute living circle and the quality of the built environment, can effectively reflect the interactive relationship between residents’ living space units and actual life [2,3,4], garnering increasing attention during the urbanization transformation process.
Plots serve as the spatial carriers of residents’ lives, and their rational planning and design can optimize the utilization of urban space by creating more livable, business-friendly, and industrially suitable environments. Efficient plot management and delineation play pivotal roles in urban planning, land-use regulation, and infrastructure development. By strategically dividing land into manageable plots, authorities can optimize resource allocation, promote sustainable urban growth, and enhance the overall livability of urban areas [5,6]. Using plots as the basic operational unit allows for a rational spatial form division based on a human-centric perspective and the transmission and implementation of related morphological criteria [7], thereby achieving improvement and optimization of the quality of built spaces. Based on this, exploring the performance of plot patterns is essential, as it directly influences how urban spaces can be utilized most effectively to benefit residents’ daily lives.
In recent years, with the emergence of new technologies and data, urban morphology research has shifted from subjective, experiential single-factor analysis to quantitative, objective multi-factor analysis [8,9]. The rise of quantitative urban morphology promotes the derivation and popularization of quantitative analysis tools, helping to analyze spatial performance into multiple quantifiable dimensions, thus constructing a refined measurement framework for the performance analysis of morphological features. Represented by plot forms, urban spatial forms can influence people’s travel behavior and spatial experience, thereby affecting their perception of public service facilities in daily life. Living convenience is based on people’s community usage needs and actual experiences, reflecting the spatial distribution and utilization of various public service facilities in the built environment. Living convenience is one of the key indicators for evaluating the performance of the built environment’s morphology. Current research on convenience mainly focuses on the detailed measurement of public service facilities within the living circle, with limited research on the mutual relationship between specific morphological features guided by plot divisions and convenience. By considering and leveraging the development of quantitative urban morphology, we can, on the one hand, measure convenience in a more detailed way and, on the other hand, extract morphological features more accurately, providing new possibilities for analyzing the relationship between plot morphology and living convenience.
In the pursuit of enhancing urban living through plot patterns, the objective of this study is to explore the performance of plot patterns in influencing living convenience. Specifically, the research focuses on addressing the following questions: Firstly, we seek to measure two unmeasurable perceptions, plot morphology and living convenience, using quantitative analysis techniques. Secondly, we aim to identify specific plot morphological features that are most conducive to enhancing living convenience. Finally, based on our findings, we provide construction guidelines and controlling recommendations tailored to different types of plots.
The remaining sections of this article are organized as follows: Section 2 reviews the current developments in quantitative urban morphology, discussing the advancements and limitations in quantifying plot patterns and living convenience, as well as the gaps our study seeks to fill. Section 3 details our research scope, design, and methodology. Section 4 presents our results, including the results of the measurements of living convenience and the association between plot patterns and living convenience. Section 5 discusses these results and future research directions. Finally, Section 6 presents the conclusions and highlights their significance.

2. Literature Review: Related Studies and Current Gaps

2.1. Quantitative Urban Morphology for Plot Performance Analysis

Compared with traditional studies that relied heavily on manual analysis and experiential interpretations, recent advancements in quantitative urban morphology have revolutionized the analysis of urban spatial elements. There are three primary research focuses: identifying elements of urban form, analyzing the performance of urban morphology, and examining the evolutionary processes of morphological elements [10]. Researchers have employed quantitative urban morphology to analyze spatial elements such as street networks, block units, building forms, and development intensity [11,12,13]. Quantitative methods such as Space Syntax [14] and the Spacematrix [15] have facilitated the analysis of urban features across multiple spatial scales, laying a solid foundation for systematic urban design and planning.
Since the late nineteenth century, plots have been considered a crucial component of urban morphology, and quantitative analysis from this perspective helps uncover the spatial structure and organizational patterns within a city [16]. Currently, research has achieved quantitative analysis of various aspects of plot morphology through a series of indicator measurements, including temporal and spatial evolution characteristics [17], morphological types [18], and scale levels [19]. Quantitative studies focusing on plots are transitioning from the “morphological evolution” of plot morphology to the analysis of “morphological types”. The analysis methods of quantitative urban morphology provide new opportunities for more accurate analysis of plot morphology.
Simultaneously, plots facilitate the transmission and implementation of morphological criteria [20], promoting a deeper understanding of the city’s internal spatial dynamics and contributing to the effective enforcement of design principles. The development of urban morphology is influenced by differentiated era backgrounds and control mechanisms. China’s plot morphology has transformed from the subdivided traditional period to the merged modernist period [21]. Guided by the awareness of property rights in traditional society, plots formed small-scale, multi-subject spatial patterns through subdivided autonomous renewal models [22,23]. In contemporary urban development and planning control, detailed construction planning fulfills spatial development requirements through plot consolidation. Kropf explored the concept of plots from multiple dimensions [24]. Based on the close connection with different control contents, plots are interpreted in terms of urban morphology, land property rights, and planning control.

2.2. Multi-Source Data for Measuring Living Convenience

The concept of living convenience in public service facilities revolves around the adaptability of planning facilities to the residents’ living, working, and leisure needs. At the macro-scale, studies have delved into the rationality of urban spatial layout, with a focus on aspects such as the job–housing balance and dynamics, emphasizing the geographical and functional alignment between living and working spaces [25,26]. At the micro-scale, research has focused on the utilization of community public facilities, residents’ satisfaction [27], accessibility [28], and the contact level with different facilities [29,30].
Hence, living convenience represents a subjective perception of quality of life rooted in individuals’ experiences. Traditional methods of measuring living convenience, primarily through surveys and observational studies, have been limited by their scale and infrequency of data updating. Advancements in technology have introduced a variety of new data sources, such as location-based services (LBSs), point-of-interest (PoI) data, and street view imagery. The use of various types of new data can more comprehensively characterize the performance and perception of spatial backgrounds, making it possible to measure subjective feelings at a human scale that were previously difficult to quantify [31,32]. Zhang et al. [33] utilized PoI data and segmentation methods to address individuals’ perceptions of living convenience across different cognitive scales. Zhong et al. [34] employed PoI data and distance decay functions to measure living convenience at the scale of individual buildings. These innovative approaches highlight the potential of multi-source data in refining our understanding of living convenience and its nuanced interactions within urban environments.

2.3. Research Gaps and Our Study

These advancements provide new support for the extraction and interpretation of urban morphology features and offer a more comprehensive analysis perspective for the performance analysis of urban morphology. Some studies have used theories and techniques from quantitative urban morphology to conduct in-depth analyses of plot morphology performance [35,36]. However, there are few relevant studies that have evaluated the performance of plot patterns from the perspective of living convenience. Our study aims to bridge this gap by integrating quantitative measurement methods with multi-source urban data to analyze the performance of urban spatial forms on a human-centric scale. This approach is expected to provide targeted recommendations to improve plot morphology regulation and control, thus contributing to human-centered urban planning and enhancing the overall quality of urban life.

3. Materials and Methods

3.1. Research Scope

3.1.1. Analysis Units

In the field of urban morphology, the connotative attributes of “plot” mainly include three dimensions: land-use control, property rights control, and street pattern control [24]. In different research contexts, the concept of “plot” often varies, due to the emphasis on different attributes. Subject to the comprehensive regulation of practical factors such as land development systems, urban development policies, planning regulations, and other institutional aspects [37], the generation and change mechanisms of property rights plots are more closely aligned with the continuously evolving situation of an area. Therefore, in this study, we mainly focus on the attributes of property rights and street patterns that are more closely related to quantifiable urban morphology.
This study involves two types of plot analysis units, namely parcels and blocks (Figure 1). Parcels are the smallest units, generated by ownership boundary demarcation in cadastral records, which are primarily aimed at defining property rights. At this scale, research indicators mainly focus on analyzing the inherent characteristics of unit parcels. Blocks refer to the basic units formed by public streets and play a role in influencing street patterns, containing one or more unit parcels internally. At this scale, attention should be paid not only to the morphological characteristics of blocks but also to the relationships between internal unit parcels.

3.1.2. Study Area

The area within the Inner Ring Road in Shanghai, encompassing the region inside the Shanghai Inner Ring Elevated Road, has evolved through multiple historical stages and changes in construction goals. It has developed into a stable and well-established urban core, encompassing different forms of plots representing each period. Therefore, this study selected the Inner Ring of Shanghai as the research focus, which serves as a representative and rich area for the research scope, facilitating the provision of recommendations for the construction of different types of parcels and blocks (Figure 1).

3.2. Research Framework

To analyze the correlation effects between plot morphology and living convenience, this study employed a research framework. On the one hand, it utilized the analytic hierarchy process (AHP) to quantitatively measure living convenience in terms of the relative number and diversity of facilities within the walking range [38]. On the other hand, key elements from classical urban morphology theory [39] were incorporated as control variables. These include spatial factors that are deemed to significantly influence living convenience in existing research [33,40], yet exhibit weaker correlations with plot patterns, such as street network accessibility and the relative spatial relationships between each parcel, block, and the center of Shanghai. Building upon this foundation, this study focused specifically on the morphological features related to plot division. This involved using quantitative measurement methods for planar geometric features of the plots [41] and analyzing three-dimensional building organizational patterns [42,43] as factors for plot morphological elements. The measurement was conducted on two analysis units: parcels and blocks, to assess both the two-dimensional and three-dimensional form of plots. Subsequently, the analysis examined the spatial distribution of living convenience and plot morphological features within the research area. This involved utilizing multivariate regression analysis and cluster analysis to identify significant influences of plot morphological elements, and then exploring the trends of these factors’ influence across different types through explanatory analysis. Finally, based on the analysis results, recommendations and strategies for optimizing plot morphology were proposed.
The specific research steps included the following five main stages: data collection, measurement of control variables, measurement of living convenience, measurement of plot morphological features, and analysis and discussion (Figure 2). Throughout the process, data required for analysis were collected from various sources, including built environment data (road data, building data, and plot boundary data), point-of-interest (PoI) data, and population density data [44].

3.3. Measurement of Control Variables

3.3.1. Street Network Accessibility

Street network accessibility includes pedestrian accessibility and community accessibility, both of which are measured using Space Syntax. The choice (betweenness) is calculated using the following equation [45]:
C b P i = j = 1 n k = 1 n g j k p i g j k j < k
where gjk(pi) is the number of geodesics between nodes pj and pk that contain node pi, and gjk is the number of all geodesics between pj and pk.
The analysis radii were set at 800 m (for pedestrian scale) and 9500 m (for community scale). Studies have shown that an 800 m walking radius is suitable for reflecting pedestrian accessibility in daily life, while 9500 m is based on typical commuting distances obtained from surveys conducted in Shanghai [46].

3.3.2. Centrality

An urban center serves as the nucleus of urban development, concentrating essential urban service functions and exerting significant cohesive influence [47]. The impact of an urban center on adjacent plots varies depending on the intensity of development. In this study, ArcMap 10.7 tools were employed to conduct distance analysis between the centroids of plots and the urban center. This analysis evaluated the degree of influence radiating from the urban center to each plot in response to varying levels of development intensity.

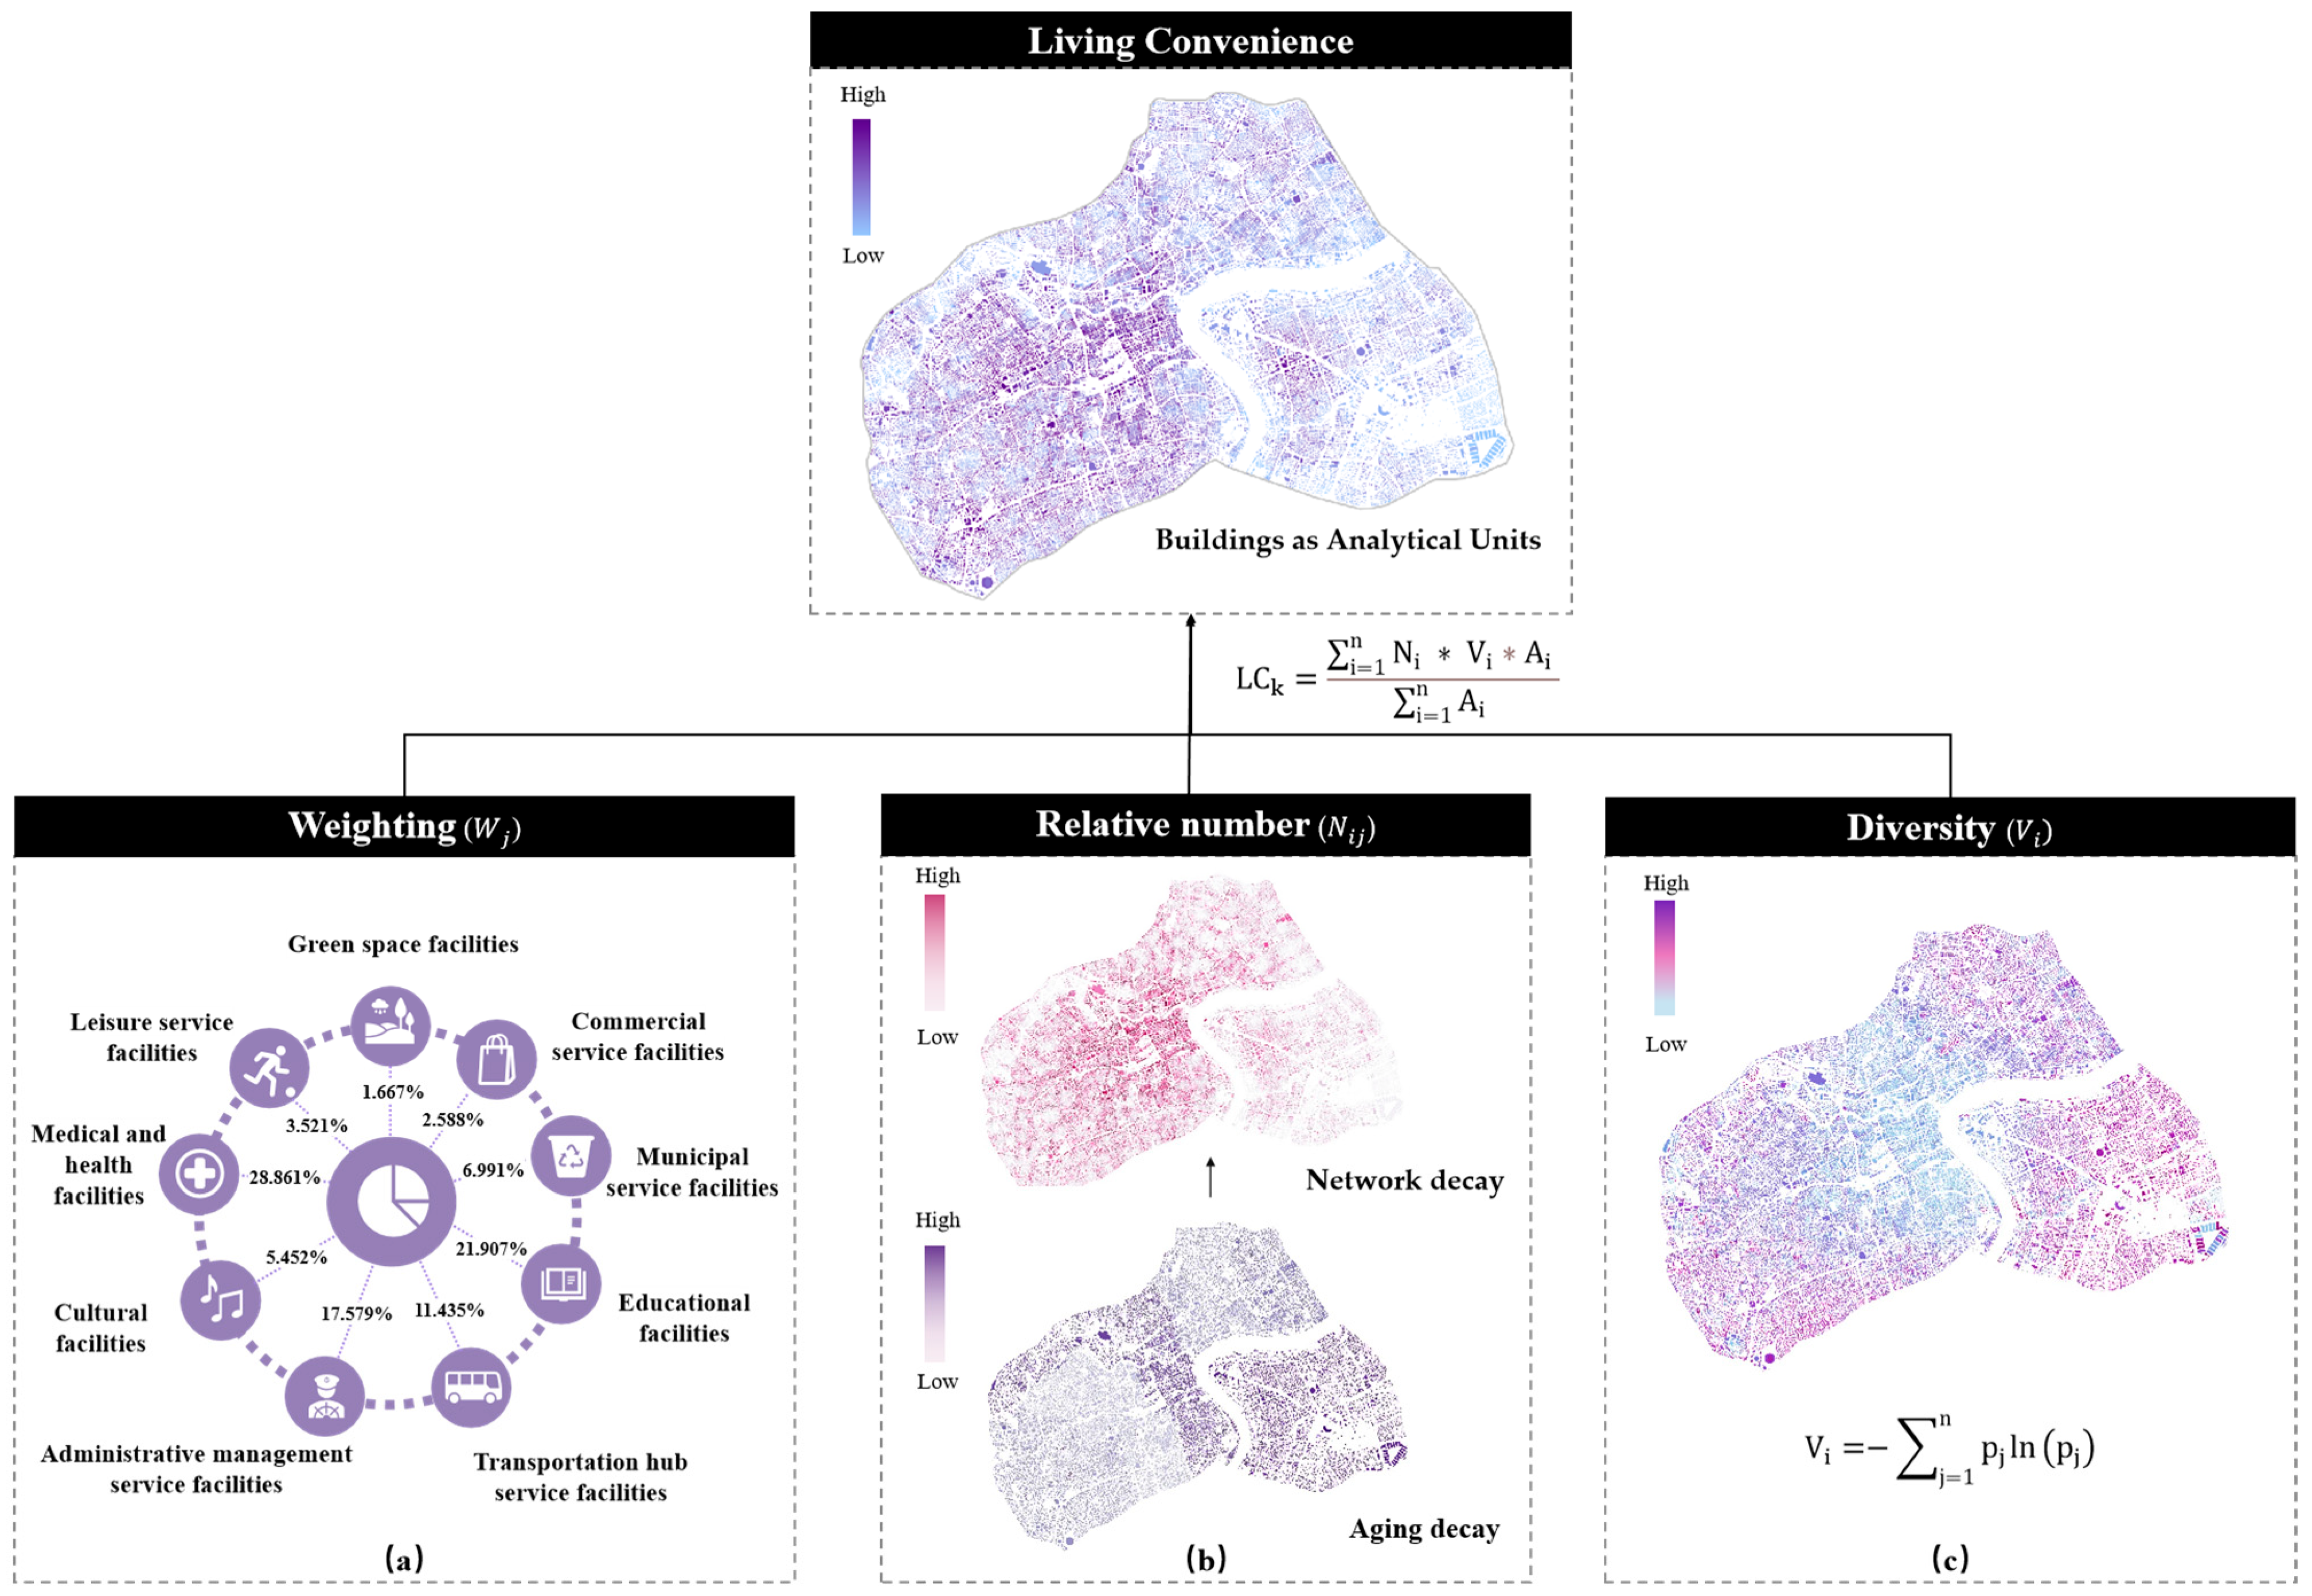
3.4. Measurement of Living Convenience

To address the need for a fine-grained and human-centric calculation of living convenience, it is necessary to quantify “unmeasurable” indicators into measurable index relationships. By expanding on the analysis framework previously proposed by our team [34], the deconstruction of the concept of living convenience reveals its correlation with the weighting, relative quantity, and diversity of public and commercial service facilities accessible within a certain travel radius from each building [48] (Figure 3).
Firstly, regarding the weighting ( W j ) of various facilities (Figure 3a), by referring to standards such as “DGTJ08-55-2019” [49], relevant analyses were employed to categorize facilities into nine major classes, totaling 22 subcategories. Then, the AHP was employed, whereby experts evaluated the importance of pairwise comparisons of basic facilities, and the weights of each type were calculated.
Secondly, for the relative number of accessible facilities ( N i j ), this study considered both aging decay and network decay (Figure 3b). On the one hand, considering that the daily travel radius of older people is relatively short, an aging decay index for each building was calculated based on the proportion of the elderly population in the age distribution data. The aging decay index represents the impact of a shorter daily travel radius on the population aged 60 and above, which is 30–60% of the regular travel radius. On the other hand, by introducing effective service radius and Gaussian distance decay functions, the actual resistance of geographical space was more comprehensively evaluated, thereby improving the accuracy of measuring facility accessibility.
The calculation of the relative number of accessible facilities is defined as follows:
N i = O i × j = 1 n W j × G a u s s D i s t i j
G a u s s x = e x 2 2 c 2     0 x r ; 0             o t h e r w i s e .  
c 2 = r 2 2 ln 2
where N i j represents the relative number of PoIs for building i, O i represents the aging decay index for building i, W j represents the weight of facility type j, Gauss(x) is the distance decay curve function, c is the adjustment factor, and D i s t i j indicates the distance (m) from building i to facility point j along the network.
Thirdly, to represent the richness of facility types within the daily accessible area, the PoI diversity ( V i ) was measured based on the Shannon–Wiener index (Figure 3c). The calculation formula of the PoI diversity is expressed as follows:
V i = j = 1 n p j ln ( p j )
where n is the number of facility types within the daily accessible area of building i, and p j indicates the proportion of facility type j in building i relative to all facility points within the daily accessible area.
Through spatial linkage tools in ArcGIS, the analysis results were transformed from buildings as analysis units to plots as analysis units, supporting subsequent morphological analyses. The calculation of living convenience is based on the following formula:
L C k = i = 1 n N i × V i × A i i = 1 n A i
where L C k represents the living convenience of the target plot k (a parcel or a block), n represents the total number of buildings in plot k, and Ai represents the gross floor area ( m 2 ) of building i.

3.5. Measurement of Plot Morphological Features

Plot morphology is determined not only by its planar shape but also the pattern of plot division, architectural form, and spatial layout within a plot [50]. In order to achieve a comprehensive and precise analysis of plot morphological features, this study integrated existing research outcomes [51,52] and measured plot morphology from the following two aspects: 1. Emphasis was placed on describing the geometric properties of the plots, utilizing classical morphological indicators such as area, quantity, and shape attributes (density, shape index, etc.) to depict the two-dimensional planar features of the plots. 2. By quantifying architectural characteristics such as building density and floor area ratio within the plots, an assessment of the organizational pattern of buildings in three-dimensional space was achieved.

3.5.1. Two-Dimensional Planar Features

① Size and shape: The size and shape of plots, as fundamental attributes describing their geometric shapes, are key features for intuitively understanding plot morphology. Simultaneously, size and shape play an important role in influencing the comprehensive division and organization of plots [50,53]. This dimension comprises six indicators: area (A), number of parcels (N), standard deviation of parcel areas (A_SD), length-to-width ratio (R_LW), Schumm shape index (SSI), and landscape shape index (LSI).
The first three indicators focus on describing the size of the plots. Specifically, area (A) represents the typical size characteristics of parcels and blocks, while the standard deviation of parcel areas (A_SD) reflects the diversity of parcel sizes within a block. The latter three indicators focus on measuring the shape of plots. The length-to-width ratio (R_LW) is used to describe the rectangularity of the bounding rectangle of the parcel shape. The Schumm shape index (SSI) is a metric for measuring the compactness of the shape, with higher values indicating a closer approximation to circular or square shapes [51]. The landscape shape index (LSI) measures the complexity of shapes by comparing the deviation between the shape of a plot and a square of equal area, as shown in the following expressions:
A _ S D = 1 N i = 1 N ( A i A _ M )
R _ L W i = W i L i
S S L i = 2 A i π ( W i 2 + L i 2 )
L S I = 0.25 P i A i
where A represents the gross area ( m 2 ) of plot I, A_M represents the average area ( m 2 ) of parcels in the block, N represents the number of parcels within the block, W i represents the short side length (m) of the bounding rectangle, L i represents the long side length (m) of the bounding rectangle, and P i represents the perimeter (m) of the plot.
② Centroid: The location of the centroid of plots within a block affects the distribution and concentration of plots, contributing to changes in the spatial layout and functional allocation within the block, thereby influencing the overall layout and organizational form [54]. This dimension in the study comprises two indicators, the centroid distance (CenD) and the standard deviation of centroid distance (CenD_SD), representing the degree of deviation of individual plots from the overall block and the degree of deviation variation, respectively, as follows:
C e n D M = i = 1 N C e n D i N
C e n D S D = 1 N i = 1 N C e n D i C e n D M
where C e n D i represents the distance (m) between the centroid of plot i and the centroid of the block it belongs to, and C e n D M represents the average distance (m) of the centroid within the block.
③ Boundary: Plots mutually define and constrain each other, and their spatial morphology is influenced by the adjacent spatial forms. The boundary reveals the edge features surrounding the plots, and when the interface is a street-facing boundary, it often possesses a higher economic value. In this study, the boundary includes two indicators: the street-facing perimeter proportion (SPP) and the total street perimeter proportion (TSP) [55], which, respectively, assess the coverage of street-facing boundaries for parcels and blocks, as follows:
S P P = S F i P e r
T S P = P e r i = 1 N P i
where SFi represents the gross length of the street-facing boundary (m) of parcel i, Per represents the perimeter (m) of the block, and Pi represents the perimeter (m) of parcel i.
④ Orientation: The orientation of a plot determines the orientation of the buildings. By determining the orientation of the plot rationally, it is possible to optimize natural lighting and ventilation conditions within the building to the greatest extent, thereby improving the comfort of interior spaces [56,57]. Through the measurement of orientation, this indicator describes the deviation of the orientation from the due south direction.

3.5.2. Three-Dimensional Architectural Features

The analysis of architectural features was conducted using Spacematrix [58]. This method works as a classification presenting both building density and various building types at the same time, which facilitates the quantitative comparison of urban textures across diverse regions. Spacematrix uses the floor space index (FSI) and ground space index (GSI) to classify plots into nine types, ranging from low-rise to multi-rise and high-rise, and from point-type to street-type and block-type [42]. The calculation of these two essential measurements is as follows:
F S I i = F i A i
G S I i = B i A i
where Fi represents the gross floor area ( m 2 ) within the analysis plot i, Bi represents the gross building footprint ( m 2 ) within the analysis plot i, and Ai represents the gross area of plot i ( m 2 ).

4. Results

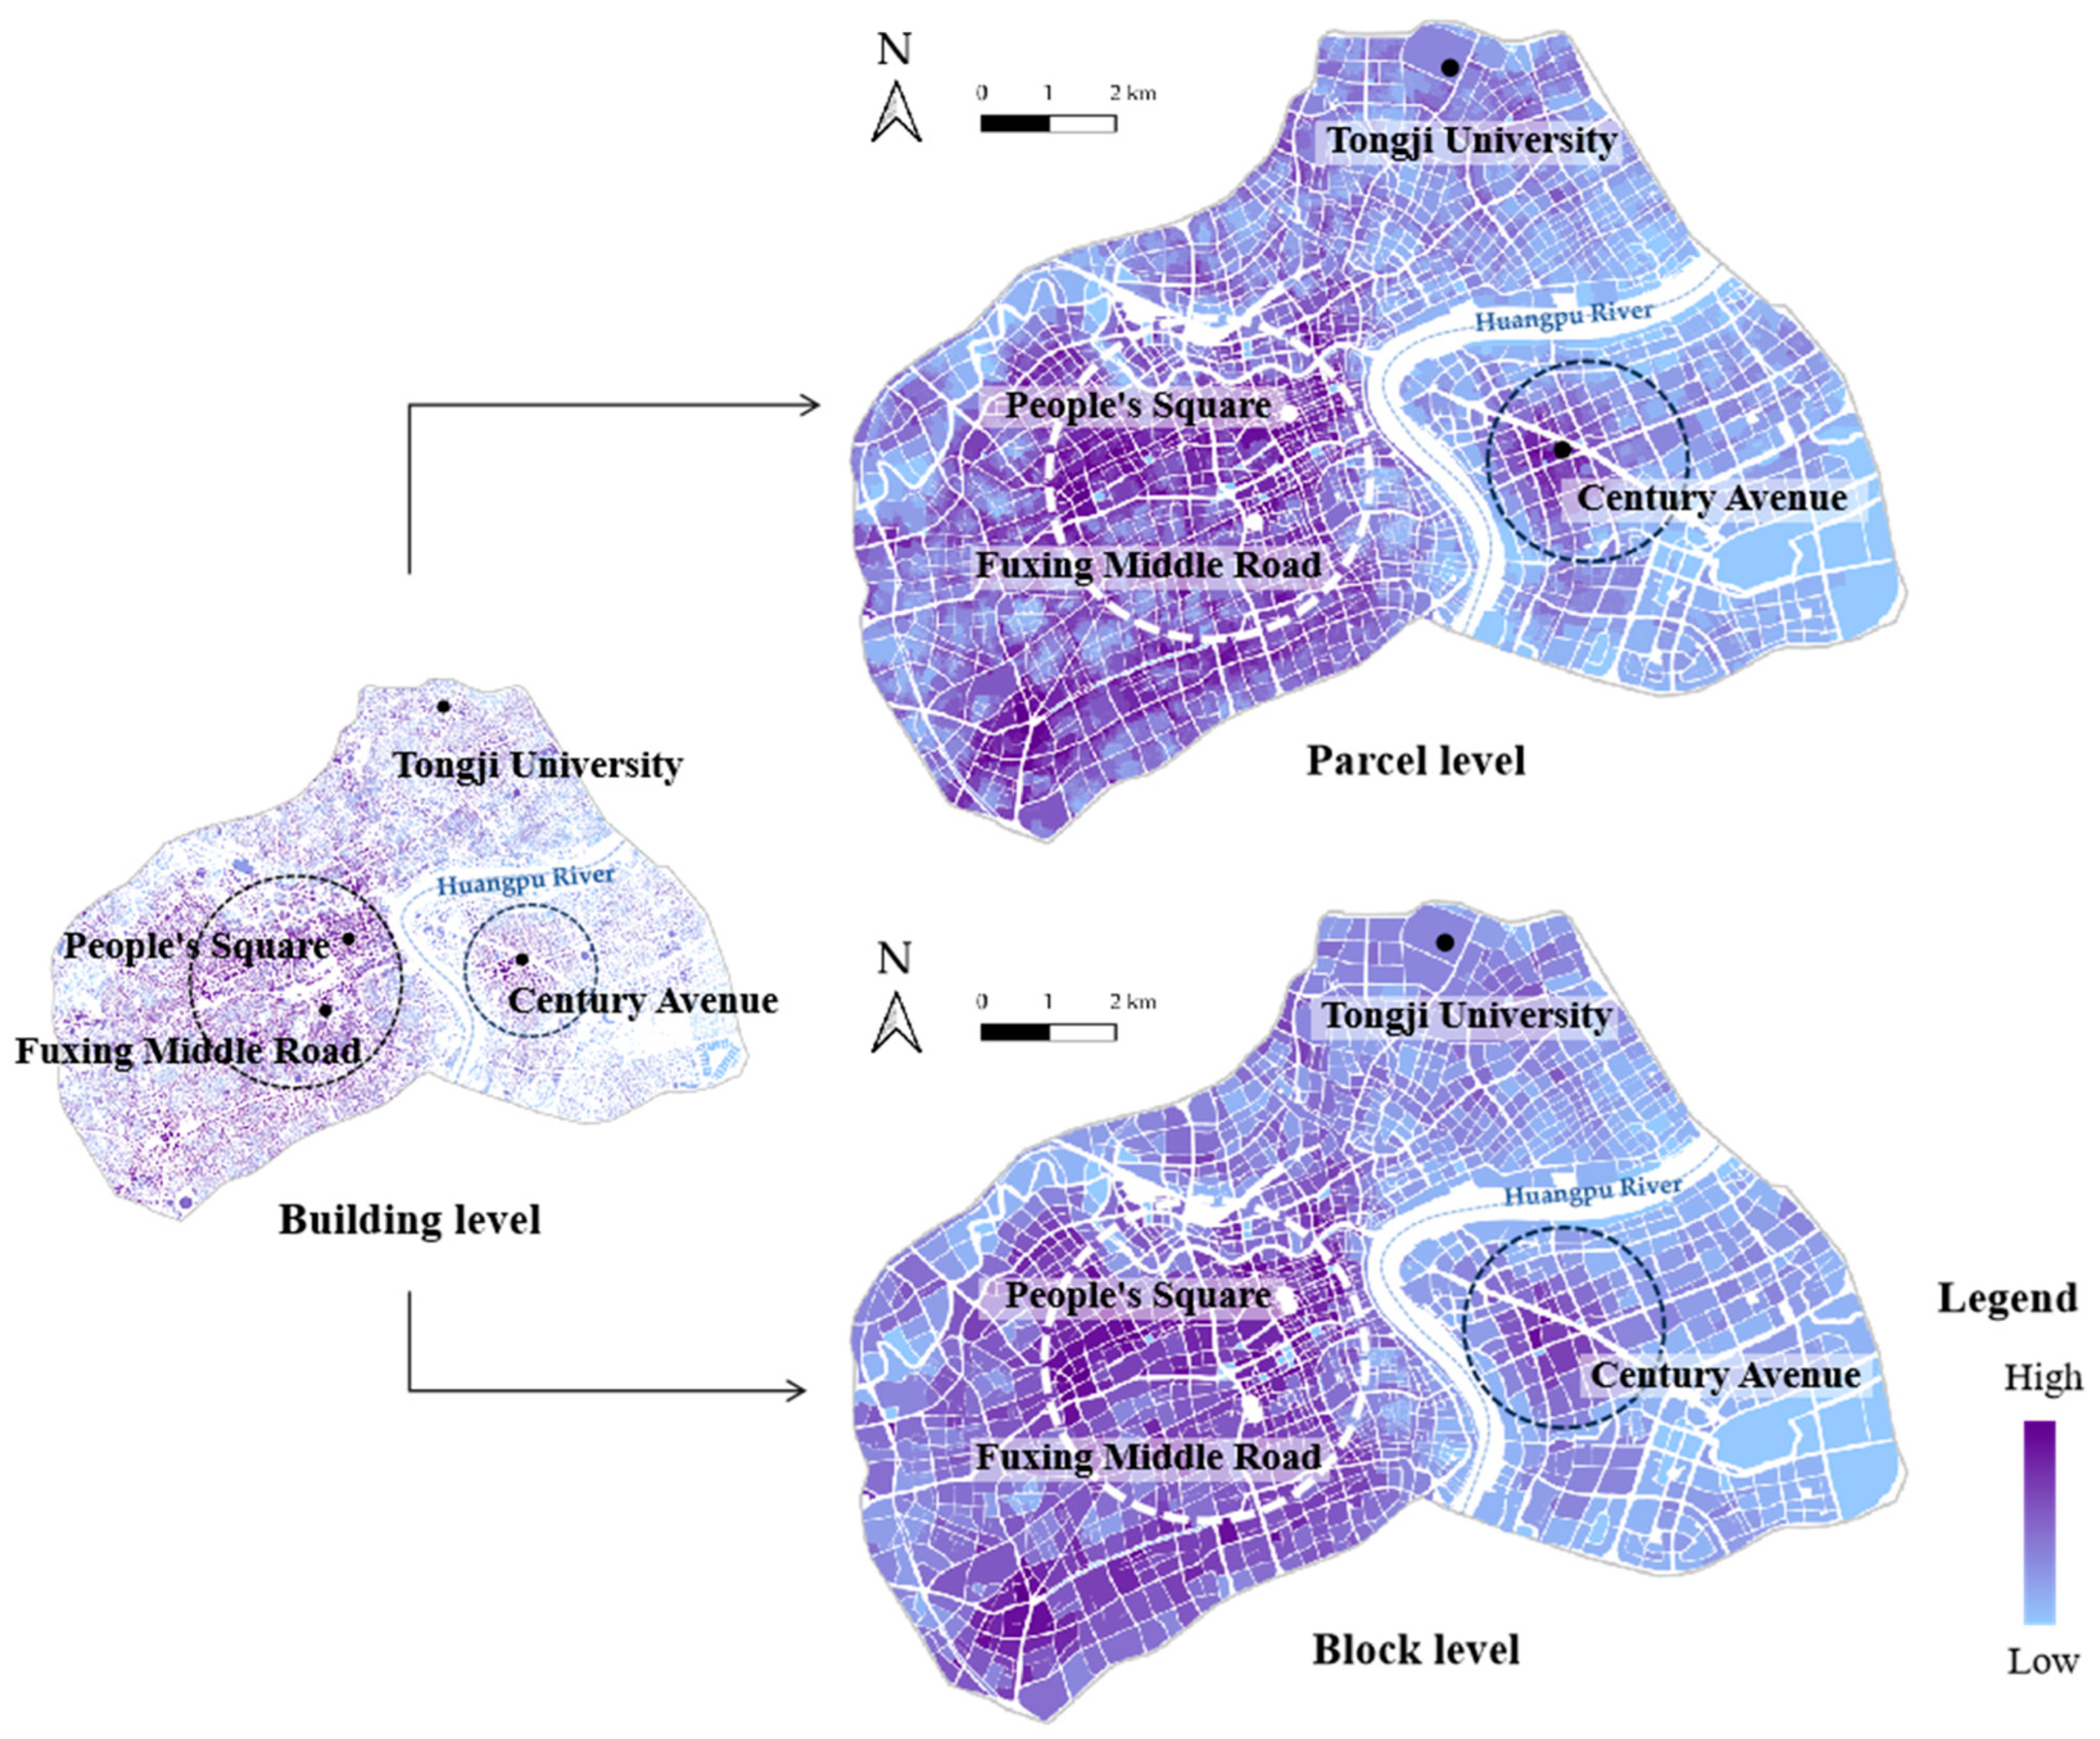
4.1. Living Convenience

As shown in Figure 4, after completing the assessment for each building, spatial analysis techniques were utilized. Specifically, within the Inner Ring of Shanghai, the overall living convenience in the west areas of the Huangpu River surpasses that in the east areas, especially around People’s Square, Fuxing Middle Road, and the Tongji University area. In contrast, the areas with high living convenience east of the Huangpu River are mainly concentrated around Century Avenue.
Upon comparing the factors influencing living convenience, the quantity of accessible facilities remains the primary determinant. Facility diversity exhibits a lower level around People’s Square but a higher value in the surrounding areas, with the average level east of the Huangpu River surpassing that of the west, contrasting with the overall scenario.

4.2. Correlation Analysis

We utilized multiple regression analysis to identify plot morphological features that exhibit significant correlations, rather than deriving a model predicting living convenience using morphological indicators. Our primary focus was on the standardized coefficients of each indicator, rather than the overall R-squared value of the model.
During the preliminary test for regression, data in which living convenience within the analysis units was zero were cleaned. The original distribution of both control and independent variables was examined using histograms in IBM SPSS Statistics 27 Additionally, Pearson’s correlation and multicollinearity analyses were conducted to assess the model’s reliability, allowing us to disregard the influence of multicollinearity.
Ultimately, Model 1 (parcel scale) and Model 2 (block scale) incorporated 15,042 and 2059 cases, respectively. The results of the regression models are presented in Table 1, illustrating the relationship between living convenience and each plot’s morphological feature.
At the parcel scale, Model 1 shows that both the floor space index (FSI) and orientation of the parcel (Orient) have noteworthy positive effects on living convenience. Conversely, the area (A) and ground space index (GSI) exhibit a certain degree of adverse impact on living convenience at this scale. Additionally, a moderate positive correlation is observed in the length-to-width ratio (R_WL) and Schumm shape index (SSI).
Regarding Model 2, it reveals that at the block scale, the floor space index (FSI) continues to have a significant positive influence on living convenience, alongside the number of parcels (N) within the block. However, indicators associated with shape, the landscape shape index (LSI), and Schumm shape index (SSI) demonstrate significant negative effects on living convenience at this scale. Furthermore, the total street perimeter proportion (TSP) and ground space index (GSI) also show a certain degree of correlation with living convenience at this scale.

4.3. Exploratory Analysis

4.3.1. Parcel Level

Based on local management directives and clustering outcomes, parcel area was selected as a criterion for further grouping analysis due to its representativeness. Parcels were categorized into three groups (labeled as small, medium, and large). Parcels in the small group have an area between 0 and 1500 m2; these areas are primarily used for standalone buildings with functions significantly different from the surrounding areas. The medium group’s parcels range from 1500 to 5000 m2, consisting mostly of medium-sized residential projects or mixed-use areas with commercial, educational, and medical facilities, which are closer to facilities and offer certain advantages. Parcels in the large group exceed 5000 m2, typically comprising comprehensive communities, industrial parks, and other large-scale projects.
A confidence interval analysis was then performed for these subgroups based on varying living convenience values, and the average values of various indicators were calculated for the small, medium, and high living convenience subgroups within each “area” category. This study investigated how key indicators—street-facing perimeter proportion (SPP), orientation (Orien), floor space index (FSI), and ground space index (GSI)—vary within different area groupings as living convenience increases. Through this analytical method, we could observe the morphological characteristics of parcels with high living convenience under different area conditions and understand how these key indicators need to be adjusted to improve living convenience.
As shown in Table 2, the street-facing perimeter proportion (SPP) exhibits slight fluctuations across all area groupings with an increase in living convenience, generally displaying an upward trend. Notably, orientation (Orien) significantly rises in the small area group with increased living convenience, while changing minimally in medium and large area groups, showing a relatively stable overall trend. The floor space index (FSI) increases across all area groups with living convenience, with the rise being particularly pronounced in the medium and large area groups. Similarly, the ground space index (GSI) enhances across all area groups with increased living convenience, which is especially notable in small and medium area groups.
The results indicate that, to adjust the indicators of the low-living convenience group to the same level as the high-living convenience group, the following different adjustments are required across area groups:
  • In the small area group, orientation (Orien) is very important at this scale and needs to be precisely controlled to improve convenience. Orientation needs to increase by approximately 12.93%, with a recommendation to maintain it within a deviation of no more than 60 degrees from true north or south. The suggested value for the floor space index (FSI) is around 4.6, and the recommended value for the ground space index (GSI) is relatively high, at about 0.6.
  • In the medium area group, the floor space index (FSI) is particularly important. Parcels with a higher FSI, especially those exceeding 5.1, are more likely to have a higher living convenience. Additionally, parcels with more street-facing interfaces tend to have higher living convenience in the medium area group.
  • In the large area group, parcels with high living convenience further increase the value of the floor space index (FSI) to a level of 5.9–6.5. Notably, the importance of the ground space index (GSI) becomes prominent in large parcel groups, where controlling it around 0.3 is likely to bring about higher living convenience.
These findings highlight the need for refined and differentiated adjustments of key indicators to enhance living convenience in different area groupings. Particularly, the floor space index (FSI) and ground space index (GSI) require significantly varied adjustments across area groups.

4.3.2. Block Level

Similarly, blocks are categorized based on area size into three groups: small, medium, and large. Blocks in the small group have an area between 0 and 20,000 m2. Blocks of this scale are mostly located in small blocks or dense road network areas, often clustered in the city center area where the region has undergone more detailed planning. The medium group’s blocks range from 20,000 to 50,000 m2. These blocks are mostly developed for mixed uses, offering higher flexibility. Blocks in the large group exceed 50,000 m2; these areas are possibly designated for future development or special functional areas.
The indicators considered for this analysis unit include the Schumm shape index (SSI), landscape shape index (LSI), floor space index (FSI), and number of parcels (N). The analysis results are presented in Table 3.
Our analysis showed that the number of parcels (N) indicator exhibited significant variability across different area groups: in medium and large area groups, the number of parcels (N) significantly increased with improved living convenience; however, in small area groups, the number of parcels (N) slightly decreased with an increase in living convenience. For the Schumm shape index (SSI), the average values showed slight fluctuations across all area groups from small to large, with no clear trend. The landscape shape index (LSI) exhibited a slight decrease in average values as living convenience improved in small and medium area groups, while changes in the large area group were minimal. The floor space index (FSI) increased with the enhancement of living convenience across all area groups, with the most pronounced increase observed in the small area group, suggesting that the floor space index (FSI) may be one of the most sensitive indicators of changes in living convenience.
Further analysis focused on determining the extent of adjustment required in the average values of indicators in the low-living-convenience group to reach the level of the high-living-convenience group. The results are as follows:
  • In the small area group, for small blocks, the impact of shape is quite evident. The analysis results of the Schumm shape index (SSI) and landscape shape index (LSI) show that blocks closer to a true rectangle often have higher living convenience. Additionally, a high floor space index (FSI) is crucial for small-area blocks, as it often leads to higher living convenience.
  • In the medium area group, the importance of block division gradually increases, with the number of parcels (N) needing to increase to around 10 to bring higher living convenience. The recommended value for the floor space index (FSI) is around 6.5.
  • In the large area group, the importance of detailed block division is further emphasized, with the confidence interval for the number of parcels (N) ranging between 21 and 27.
These findings reveal that, to effectively enhance living convenience, differentiated adjustments of the indicators are required across different area groupings. Particularly noteworthy is the significant difference in the adjustment amounts required for the floor space index (FSI) and the number of parcels (N) across different area groups, especially the pronounced need for construction and development of blocks, as well as shape adjustments, in the small area group. In contrast, there is a notably critical demand for an increase in the number of parcels (N) in the large area group.

5. Discussion

5.1. Optional Strategy for Case Study Area

This study focuses on the developed plots within the Inner Ring of Shanghai’s central urban area, which are characterized by a variety of plot types and varying degrees of maturity. Therefore, discussing enhancement strategies based on this site is representative of urban renewal. Two areas with potential for renewal were selected for elaboration. The first is the area near the cruise terminal on the west bank of the Huangpu River, close to the City God Temple, which represents the historical landscape of Shanghai. This block has relatively low living convenience compared with surrounding areas. In the current urban renewal process, there is a practice of merging smaller blocks into larger ones. However, our research has found that different scales of plots should adopt different strategies. For smaller blocks, it is also possible to increase their living convenience by adjusting the shape and development intensity of the plot, rather than simply merging them.
The second potential area is the Lujiazui area, a rapidly developing commercial complex in Shanghai. Due to the fast pace of early construction, the current block division appears “crude”. Therefore, for larger-scale blocks, enhancements can be made via a more detailed division of plots, matching different splitting strategies according to different areas; in three dimensions, it is possible to increase the ground space index of a block or parcel to enhance its living convenience. Such renewal methods can preserve the original texture of the plots while promoting rational use of plots through refined management.

5.2. Strategy for Plot Division Based on the Correlation Effects between Plot Morphology and Living Convenience

This research finds that the plot pattern elements of parcels and blocks are crucial to living convenience. Overall, the area of a plot can serve as a basic indicator for identifying plots, with different plot areas matching different control strategies. However, generally speaking, a compact layout can create a more convenient transportation network, shortening the distance between residents and necessary life facilities. This aligns with the classic urban design theories of Jacobs [59] and Montgomery [60], where smaller blocks and denser road networks, creating more compact urban layouts, are conducive to fostering communities with higher living convenience.
For planner features of plot morphology, the analysis results show that smaller parcels can often improve living convenience by controlling the orientation to be closer to the north–south direction, thus controlling the layout of buildings within the plot. For blocks, shape control is also more important for small-area blocks, facilitating blocks to be closer to true rectangles. In current practice, there is less consideration for the control of plot planar morphology, and there is a need to further strengthen this. For large-scale blocks, the importance of the relationship between parcels and blocks becomes more pronounced. It is evident that blocks with a higher number of parcels exhibit greater living convenience, especially in blocks where the area is inherently larger. This might be because large-scale blocks may be in undeveloped areas, so dividing can effectively improve the utilization of the block.
For three-dimensional architectural features, to enhance living convenience, indicators within different area groups require adjustments to varying degrees to suit different development needs. Generally speaking, larger plot areas can support more intensive development, having a significant positive impact on living convenience. An appropriate floor space index (FSI) is a prerequisite for ensuring the mixed use of buildings and plots, conducive to forming rich and diverse urban spaces that meet residents’ needs within a certain living radius. Notably, the ground space index (GSI) is often considered a negative factor that needs to be controlled in current regulations. However, this research shows that it has a significant positive impact on improving living convenience for larger-scale parcels. High building density and enclosed building forms can provide continuous street wall space, which helps create more open urban interfaces and promotes the enhancement of living convenience [61].
In summary, the elements of plot patterns in parcels and blocks play a pivotal role in enhancing living convenience, highlighting the importance of strategic adjustments in urban planning to cater to various area groups. Properly managing the division and the floor space index (FSI) within these blocks can significantly contribute to creating urban spaces that are not only efficient and functional but also conducive to a higher quality of life.

5.3. Quantitative Urban Morphology: A Novel Analytical Approach for Quality Enhancement

Currently, the field of quantifying urban morphology is progressively shifting toward an empirical and quantitative standpoint, driving the discovery and exploration of new cognition. On the one hand, the emergence of new data and technologies has facilitated the deepening of understanding of urban design theory. The application of these new tools makes it possible to explore urban morphological features that were previously difficult to observe, promoting the analysis of spatial form characteristics. On the other hand, supported by multi-source data, quantitative analysis not only accurately measures spatial morphological features but also further aids in discerning spatial non-material performances. Consequently, this fosters new theoretical insights through correlating plot morphology and spatial performance, thus heralding fresh opportunities for shaping and elevating future urban quality.

5.4. Limitations and Future Steps

In this study, the measurement of living convenience primarily fails to consider variations in psychological factors among diverse groups due to data accuracy constraints. Factors such as lifestyle among different demographics influence perceptions of living convenience. Subsequent research steps should account for divergent demands for living convenience among different demographics, achieved through integrating LBS user profile data and other methodologies for a more comprehensive assessment. Secondly, one of the limitations of the present study lies in its insufficient exploration and interpretation of plot control policies. The selection of plot morphology indicators could be combined with the control policies of various regions to propose more practical strategies and recommendations.

6. Conclusions

This study attempted to measure previously unmeasurable aspects of living convenience and plot form performance by integrating quantitative urban morphology with multi-source urban data. On the one hand, in measuring living convenience, we considered various factors such as the different weights of facility types, road network decay, and age-related activity ranges. This helped us understand “what” influences people’s satisfaction with and accessibility to facilities. On the other hand, analyzing the performance of plot forms from the perspective of living convenience aided in understanding the performance of spatial elements, including perceptions and behaviors. Therefore, this analytical approach enhances precise urban analysis and supports the development of 15 min community life circles.
On a human-centric scale, this study highlights the critical importance of plot form rather than the spatial distribution of facilities in enhancing living convenience. Moreover, this study provides new insights into the extraction and interpretation of urban form characteristics, thereby offering targeted recommendations not only for the case study area but also for other cities that require urban renewal. The results of this study contribute to the management of plot forms and the updating of urban design.

Author Contributions

Conceptualization, C.C. and Y.G.; methodology, C.C.; software, Y.L.; validation, C.C. and Y.G.; formal analysis, C.C.; investigation, Y.G.; resources, Y.L. and Y.Z; data curation, Y.L.; writing—original draft preparation, C.C.; writing—review and editing, Y.G., Y.L. and Y.Z.; visualization, Y.G.; supervision, Y.L.; project administration, Y.L.; funding acquisition, Y.L. All authors have read and agreed to the published version of the manuscript.

Funding

This research was funded by the National Natural Science Foundation of China, grant numbers 52078343 and 72361137008; Shanghai Pilot Program for Basic Research; Key Laboratory of High-Density Human Settlements Environment Ecology and Energy Conservation, and the Ministry of Education, in collaboration with Tongji Urban Planning and Design Institute Co., Ltd., independently funded project, grant number KY-2022-LH-A02.

Data Availability Statement

The data used to support the findings of this study are available from the authors upon request.

Conflicts of Interest

The authors declare no conflicts of interest.

References

  1. Duranton, G.; Puga, D. Chapter 5-The Growth of Cities. In Handbook of Economic Growth; Aghion, P., Durlauf, S.N., Eds.; Handbook of Economic Growth; Elsevier: Amsterdam, The Netherlands, 2014; Volume 2, pp. 781–853. [Google Scholar]
  2. Myers, D. Building Knowledge about Quality of Life for Urban Planning. J. Am. Plan. Assoc. 1988, 54, 347–358. [Google Scholar] [CrossRef]
  3. Tian, Y.; Kong, X.; Liu, Y. Combining Weighted Daily Life Circles and Land Suitability for Rural Settlement Reconstruction. Habitat Int. 2018, 76, 1–9. [Google Scholar] [CrossRef]
  4. Wu, H.; Wang, L.; Zhang, Z.; Gao, J. Analysis and Optimization of 15-Minute Community Life Circle Based on Supply and Demand Matching: A Case Study of Shanghai. PLoS ONE 2021, 16, e0256904. [Google Scholar] [CrossRef] [PubMed]
  5. Baker, T.R.; Vicuña Miñano, E.; Banda-R, K.; Del Castillo Torres, D.; Farfan-Rios, W.; Lawson, I.T.; Loja Alemán, E.; Pallqui Camacho, N.; Silman, M.R.; Roucoux, K.H.; et al. From Plots to Policy: How to Ensure Long-term Forest Plot Data Supports Environmental Management in Intact Tropical Forest Landscapes. Plants People Planet 2021, 3, 229–237. [Google Scholar] [CrossRef]
  6. Cordingley, J.E.; Snyder, K.A.; Rosendahl, J.; Kizito, F.; Bossio, D. Thinking Outside the Plot: Addressing Low Adoption of Sustainable Land Management in Sub-Saharan Africa. Curr. Opin. Environ. Sustain. 2015, 15, 35–40. [Google Scholar] [CrossRef]
  7. Araldi, A.; Fusco, G. From the Street to the Metropolitan Region: Pedestrian Perspective in Urban Fabric Analysis. Environ. Plan. B Urban Anal. City Sci. 2019, 46, 1243–1263. [Google Scholar] [CrossRef]
  8. Dibble, J.L. Urban Morphometrics: Towards a Quantitative Science of Urban Form. Ph.D. Thesis, University of Strathclyde, Glasgow, UK, 2016. [Google Scholar]
  9. Ye, Y.; van Nes Nes, A. Quantitative Tools in Urban Morphology: Combining Space Syntax, Spacematrix and Mixed-Use Index in a GIS Framework. Urban Morphol. 2014, 18, 97–118. [Google Scholar] [CrossRef]
  10. Oliveira, V. Urban Morphology; The Urban Book Series; Springer International Publishing: Cham, Switzerland, 2016; ISBN 978-3-319-32081-6. [Google Scholar]
  11. Schirmer, P.M.; Axhausen, K.W. A Multiscale Clustering of the Urban Morphology for Use in Quantitative Models. In The Mathematics of Urban Morphology; D’Acci, L., Ed.; Springer International Publishing: Cham, Switzerland, 2019; pp. 355–382. ISBN 978-3-030-12381-9. [Google Scholar]
  12. Oliveira, V. Morpho: A Methodology for Assessing Urban Form. Urban Morphol. 2013, 17, 21–33. [Google Scholar] [CrossRef]
  13. Boeing, G. Spatial Information and the Legibility of Urban Form: Big Data in Urban Morphology. Int. J. Inf. Manag. 2021, 56, 102013. [Google Scholar] [CrossRef]
  14. Hillier, B.; Leaman, A.; Stansall, P.; Bedford, M. Space Syntax. Environ. Plan. B 1976, 3, 147–185. [Google Scholar] [CrossRef]
  15. Pont, M.B.; Haupt, P. Spacematrix: Space, Density and Urban Form-Revised Edition; TU Delft OPEN Publishing: Delft, The Netherlands, 2023. [Google Scholar] [CrossRef]
  16. Conzen, M.R.G. Alnwick, Northumberland: A Study in Town-Plan Analysis. In Transactions and Papers (Institute of British Geographers); Wiley: Hoboken, NJ, USA, 1960; pp. 93–122. [Google Scholar]
  17. Whitehand, J.W.R.; Larkham, P.J. Urban Landscapes: International Perspectives; Psychology Press: London, UK, 1992. [Google Scholar]
  18. Kropf, K. Plot Types and Housing in Nineteenth Century Westminster. In Rethinking the XIXth Century City; Attilio, P., Ed.; Aga Khan Program for Islamic Architecture at Harvard University and the Massachusetts Institute of Technology: Cambridge, UK, 1998; pp. 113–119. [Google Scholar]
  19. Long, Y.; Ye, Y. Measuring Human-Scale Urban Form and Its Performance. Landsc. Urban Plan. 2019, 191, 103612. [Google Scholar] [CrossRef] [PubMed]
  20. Fleischmann, M.; Feliciotti, A.; Romice, O.; Porta, S. Morphological Tessellation as a Way of Partitioning Space: Improving Consistency in Urban Morphology at the Plot Scale. Comput. Environ. Urban Syst. 2020, 80, 101441. [Google Scholar] [CrossRef]
  21. Song, Y.; Zhang, Y.; Han, D. Deciphering Built Form Complexity of Chinese Cities through Plot Recognition: A Case Study of Nanjing, China. Front. Archit. Res. 2022, 11, 795–805. [Google Scholar] [CrossRef]
  22. Lin, C.L.; Chan, E.H.W.; Chiang, W.-H. Urban Renewal Governance and Manipulation of Plot Ratios: A Comparison between Taipei, Hong Kong and, Singapore. Land Use Policy 2022, 119, 106158. [Google Scholar] [CrossRef]
  23. Whitehand, J.W.R.; Gu, K. Research on Chinese Urban Form: Retrospect and Prospect. Prog. Hum. Geogr. 2006, 30, 337–355. [Google Scholar] [CrossRef]
  24. Kropf, K. Plots, Property and Behaviour. Urban Morphol. 2018, 22, 5–14. [Google Scholar] [CrossRef]
  25. Cervero, R. Jobs-Housing Balancing and Regional Mobility. J. Am. Plan. Assoc. 1989, 55, 136–150. [Google Scholar] [CrossRef]
  26. Horner, M.; Murray, A. A Multi-Objective Approach to Improving Regional Jobs-Housing Balance. Reg. Stud. 2003, 37, 135–146. [Google Scholar] [CrossRef]
  27. Lee, S.Y.; Kim, J.H. Effects of Servicescape on Perceived Service Quality, Satisfaction and Behavioral Outcomes in Public Service Facilities. J. Asian Archit. Build. Eng. 2014, 13, 125–131. [Google Scholar] [CrossRef]
  28. Tsou, K.-W.; Hung, Y.-T.; Chang, Y.-L. An Accessibility-Based Integrated Measure of Relative Spatial Equity in Urban Public Facilities. Cities 2005, 22, 424–435. [Google Scholar] [CrossRef]
  29. Chen, C. Discussion on the Optimization Method of Public Service Facility Layout from the Perspective of Spatial Equity: A Study Based on the Central City of Shanghai. Land 2023, 12, 1780. [Google Scholar] [CrossRef]
  30. Zhan, Y.; Sui, L.; Wang, M.; Huang, J.; Zhu, J.; Chen, D.; Fan, J. Multiperspective Evaluation Model for the Spatial Distribution of Public Service Facilities Based on Service Capability and Subjective Preferences. J. Urban Plann. Dev. 2022, 148, 04022015. [Google Scholar] [CrossRef]
  31. Ye, Y.; Richards, D.; Lu, Y.; Song, X.; Zhuang, Y.; Zeng, W.; Zhong, T. Measuring Daily Accessed Street Greenery: A Human-Scale Approach for Informing Better Urban Planning Practices. Landsc. Urban Plan. 2019, 191, 103434. [Google Scholar] [CrossRef]
  32. Wu, C.; Cui, J.; Xu, X.; Song, D. The Influence of Virtual Environment on Thermal Perception: Physical Reaction and Subjective Thermal Perception on Outdoor Scenarios in Virtual Reality. Int. J. Biometeorol. 2023, 67, 1291–1301. [Google Scholar] [CrossRef] [PubMed]
  33. Zhang, X.; Du, S.; Zhang, J. How Do People Understand Convenience-of-Living in Cities? A Multiscale Geographic Investigation in Beijing. ISPRS J. Photogramm. Remote Sens. 2019, 148, 87–102. [Google Scholar] [CrossRef]
  34. Zhong, T.; Lü, G.; Zhong, X.; Tang, H.; Ye, Y. Measuring Human-Scale Living Convenience through Multi-Sourced Urban Data and a Geodesign Approach: Buildings as Analytical Units. Sustainability 2020, 12, 4712. [Google Scholar] [CrossRef]
  35. Feliciotti, A.; Romice, O.; Porta, S. From System Ecology to Urban Morphology: Towards a Theory of Urban Form Resilience. In Proceedings of the International Forum on Urbanism, Barcelona, Spain, 10–12 December 2018. [Google Scholar]
  36. Jiang, Y.; Han, Y.; Liu, M.; Ye, Y. Street Vitality and Built Environment Features: A Data-Informed Approach from Fourteen Chinese Cities. Sustain. Cities Soc. 2022, 79, 103724. [Google Scholar] [CrossRef]
  37. Li, X.; Zhang, Y. Combining the Historico-Geographical and Configurational Approaches to Urban Morphology: The Historical Transformations of Ludlow, UK and Chinatown, Singapore. Urban Morphol. 2020, 25, 23–41. [Google Scholar] [CrossRef]
  38. Shi, H.; Tsai, S.-B.; Lin, X.; Zhang, T. How to Evaluate Smart Cities’ Construction? A Comparison of Chinese Smart City Evaluation Methods Based on PSF. Sustainability 2017, 10, 37. [Google Scholar] [CrossRef]
  39. Whitehand, J.W.R.; Samuels, I.; Conzen, M.P.; Conzen, M.R.G. 1960: Alnwick, Northumberland: A Study in Town-Plan Analysis. Institute of British Geographers Publication 27. London: George Philip. Prog. Hum. Geogr. 2009, 33, 859–864. [Google Scholar] [CrossRef]
  40. Zhang, X.; Pan, H. Community Resilience in Accessing Essential Service Facilities Considering Equity and Aging Demand: A Case of Shanghai, China. Land 2023, 12, 2167. [Google Scholar] [CrossRef]
  41. Cai, C.; Guo, Z.; Zhang, B.; Wang, X.; Li, B.; Tang, P. Urban Morphological Feature Extraction and Multi-Dimensional Similarity Analysis Based on Deep Learning Approaches. Sustainability 2021, 13, 6859. [Google Scholar] [CrossRef]
  42. Mohajeri, N. Spacematrix: Space, Density and Urban Form. Environ. Plan. B-Plan. Des. 2011, 38, 567–568. [Google Scholar]
  43. Zhang, C.; Ping, X.; Fan, Q.; Li, C. Measurement of 2D and 3D Fractal Features of Urban Morphology from an Architectural View and Its Influencing Factors. Fractal Fract. 2024, 8, 138. [Google Scholar] [CrossRef]
  44. Pezzulo, C.; Hornby, G.M.; Sorichetta, A.; Gaughan, A.E.; Linard, C.; Bird, T.J.; Kerr, D.; Lloyd, C.T.; Tatem, A.J. Sub-National Mapping of Population Pyramids and Dependency Ratios in Africa and Asia. Sci. Data 2017, 4, 170089. [Google Scholar] [CrossRef]
  45. Hillier, B.; Iida, S. Network and Psychological Effects in Urban Movement. In Spatial Information Theory; Cohn, A.G., Mark, D.M., Eds.; Lecture Notes in Computer Science; Springer: Berlin/Heidelberg, Germany, 2005; Volume 3693, pp. 475–490. ISBN 978-3-540-28964-7. [Google Scholar]
  46. China Academy of Urban Planning and Design Commuting Monitoring Report of Major Cities in China. 2022. Available online: http://www.chinajsb.cn/html/202207/29/28376_2.html (accessed on 7 February 2024).
  47. Yu, L.; Yu, T.; Wu, Y.; Wu, G. Rethinking the Identification of Urban Centers from the Perspective of Function Distribution: A Framework Based on Point-of-Interest Data. Sustainability 2020, 12, 1543. [Google Scholar] [CrossRef]
  48. Hewko, J.; Smoyer-Tomic, K.E.; Hodgson, M.J. Measuring Neighbourhood Spatial Accessibility to Urban Amenities: Does Aggregation Error Matter? Environ. Plan A 2002, 34, 1185–1206. [Google Scholar] [CrossRef]
  49. DGTJ08-55-2019; Standard for Public Facilities of Urban Residential Area and District. Shanghai Municipal Commission of Housing and Urban-Rural Development: Shanghai, China, 2020.
  50. Siksna, A. The Effects of Block Size and Form in North American and Australian City Centres. Urban Morphol. 1997, 1, 19–33. [Google Scholar] [CrossRef]
  51. Colaninno, N.; Roca, J.; Pfeffer, K. An Automatic Classification of Urban Texture: Form and Compactness of Morphological Homogeneous Structures in Barcelona. In Proceedings of the 51st Congress of the European Regional Science Association: “New Challenges for European Regions and Urban Areas in a Globalised World”, Barcelona, Spain, 30 August–3 September 2011. [Google Scholar]
  52. Gil, J.; Beirão, J.N.; Montenegro, N.; Duarte, J.P. On the Discovery of Urban Typologies: Data Mining the Many Dimensions of Urban Form. Urban Morphology. 2011, 16, 27–40. [Google Scholar] [CrossRef]
  53. Lupala, J.M. Urban Types in Rapidly Urbanising Cities. Ph.D. Thesis, KTH Royal Institute of Technology, Stockholm, Sweden, 2002. [Google Scholar]
  54. Zhuo, Y.; Zheng, H.; Wu, C.; Xu, Z.; Li, G.; Yu, Z. Compatibility Mix Degree Index: A Novel Measure to Characterize Urban Land Use Mix Pattern. Comput. Environ. Urban Syst. 2019, 75, 49–60. [Google Scholar] [CrossRef]
  55. Yoshida, H.; Omae, M. An Approach for Analysis of Urban Morphology: Methods to Derive Morphological Properties of City Blocks by Using an Urban Landscape Model and Their Interpretations. Comput. Environ. Urban Syst. 2005, 29, 223–247. [Google Scholar] [CrossRef]
  56. Zhang, L.; Ding, W. Density, Height Limitation and Plot Pattern: Quantitative Description of the Residential Plots in Nanjing, China. In New Urban Configurations; IOS Press: Amsterdam, The Netherlands, 2014; pp. 679–688. [Google Scholar]
  57. Liu, Q.; Ding, W. Morphological Study on Units of Urban Fabric That Constitute Contemporary Residential Plots in the Yangtze River Delta, China. In New Urban Configurations; IOS Press: Amsterdam, The Netherlands, 2014; pp. 689–694. [Google Scholar]
  58. Berghauser Pont, M.; Haupt, P. The Spacemate: Density and the Typomorphology of the Urban Fabric. In Urbanism Laboratory for Cities and Regions: Progress of Research Issues in Urbanism; IOS Press: Amsterdam, The Netherlands, 2007; pp. 11–26. [Google Scholar]
  59. Jacobs, J. The Death and Life of Great American Cities; Random House LLC: New York, NY, USA, 1961. [Google Scholar]
  60. Montgomery, J. Making a City: Urbanity, Vitality and Urban Design. J. Urban Des. 1998, 3, 93–116. [Google Scholar] [CrossRef]
  61. Ye, Y.; Li, D.; Liu, X. How Block Density and Typology Affect Urban Vitality: An Exploratory Analysis in Shenzhen, China. Urban Geogr. 2018, 39, 631–652. [Google Scholar] [CrossRef]
Figure 1. Study area and analysis units.
Buildings 14 01408 g001
Figure 2. Research framework.
Buildings 14 01408 g002
Figure 3. Illustration of calculation methods and key measurements of living convenience: (a) the weighting of various facilities; (b) the relative number of accessible facilities; and (c) the diversity of facilities in a daily accessible area.
Buildings 14 01408 g003
Figure 4. Living convenience at parcel level and block level.
Buildings 14 01408 g004
Table 1. Multiple regression analysis.
Model 1—ParcelsModel 2—Blocks
IndicatorsStandardized CoefficientIndicatorsStandardized Coefficient
Control variablesBtA8000.162 *** 1BtA8000.219 ***
BtA95000.242 ***BtA95000.260 ***
Centrality−0.401 ***Centrality−0.437 ***
Two-dimensional planar featuresArea (A)−0.031 ***Area (A)0.003
Number of parcels (N)0.088 ***
Standard deviation of parcel
areas (Area_SD)
−0.009
Length-to-width ratio (R_LW)0.019 **Length-to-width ratio (R_LW)0.011
Schumm shape index (SSI)0.030 **Schumm shape index (SSI)−0.076 ***
Landscape shape index (LSI)−0.007Landscape shape index (LSI)−0.141 ***
Centroid distance (CenD)−0.010Standard deviation of centroid distance (CenD_SD)−0.018
Street-facing perimeter
proportion (SPP)
−0.096 ***Total street perimeter proportion (TSP)−0.032 *
Orientation (Orien)0.033 ***Orientation (Orien)0.022
Three-dimensional architectural featuresFloor space index (FSI)0.079 ***Floor space index (FSI)0.087 ***
Ground space index (GSI)−0.075 ***Ground space index (GSI)−0.023 *
1 * p < 0.1, ** p < 0.05, *** p < 0.01.
Table 2. Confidence interval analysis at parcel level.
Area Small   Group :   0 1500   ( m 2 ) Medium   Group :   1500 5000   ( m 2 ) Large   Group :   Over   5000   ( m 2 )
Living Convenience GroupLowMediumHighLowMediumHighLowMediumHigh
Street-facing perimeter proportion (SPP)Lower0.22 0.21 0.22 0.27 0.27 0.30 0.41 0.37 0.40
Mean0.23 0.22 0.23 0.28 0.28 0.31 0.43 0.38 0.41
Upper0.24 0.23 0.24 0.30 0.29 0.32 0.44 0.39 0.42
Orientation (Orien)Lower101.37 109.57 115.03 97.94 102.41 108.02 94.46 94.75 104.09
Mean103.91 112.03 117.35 100.40 104.83 110.38 96.86 97.24 106.46
Upper106.45 114.49 119.67 102.85 107.26 112.73 99.25 99.72 108.84
Floor space index (FSI)Lower3.33 3.73 4.41 3.26 4.12 5.14 4.37 4.63 5.91
Mean3.50 3.91 4.64 3.42 4.33 5.41 4.61 4.87 6.22
Upper3.66 4.10 4.87 3.58 4.53 5.67 4.84 5.12 6.53
Ground space index (GSI)Lower0.57 0.57 0.58 0.36 0.38 0.39 0.27 0.30 0.32
Mean0.59 0.59 0.60 0.37 0.39 0.40 0.28 0.31 0.33
Upper0.61 0.61 0.63 0.38 0.40 0.41 0.29 0.31 0.34
Table 3. Confidence interval analysis at block level.
Area Small   Group :   0 20 , 000   ( m 2 ) Medium   Group :   20 , 000 50 , 000   ( m 2 ) Large   Group :   Over   50 , 000   ( m 2 )
Living Convenience GroupLowMediumHighLowMediumHighLowMediumHigh
Number of parcels (N)Lower4.07 3.91 3.60 5.98 8.70 9.53 9.35 17.62 21.93
Mean4.79 4.52 4.19 6.90 10.04 10.71 10.55 19.86 24.60
Upper5.52 5.13 4.78 7.81 11.37 11.90 11.74 22.11 27.26
Schumm shape index (SSI)Lower0.61 0.62 0.65 0.65 0.64 0.66 0.65 0.66 0.66
Mean0.63 0.64 0.66 0.66 0.65 0.67 0.66 0.67 0.67
Upper0.64 0.65 0.67 0.67 0.66 0.68 0.67 0.68 0.68
Landscape shape index (LSI)Lower1.14 1.11 1.07 1.08 1.10 1.07 1.14 1.10 1.10
Mean1.17 1.13 1.09 1.11 1.13 1.08 1.18 1.12 1.12
Upper1.20 1.15 1.11 1.14 1.15 1.10 1.22 1.14 1.14
Floor space index (FSI)Lower4.73 6.02 8.88 4.69 5.10 6.17 4.55 4.33 5.08
Mean5.29 6.73 10.05 5.26 5.58 6.65 4.95 4.70 5.47
Upper5.85 7.44 11.23 5.83 6.06 7.12 5.35 5.07 5.86
Disclaimer/Publisher’s Note: The statements, opinions and data contained in all publications are solely those of the individual author(s) and contributor(s) and not of MDPI and/or the editor(s). MDPI and/or the editor(s) disclaim responsibility for any injury to people or property resulting from any ideas, methods, instructions or products referred to in the content.

