
Indoor Light Environment Factors That Affect the Psychological Satisfaction of Occupants in Office Facilities

Abstract
1. Introduction
2. Methods
- The imperative and distinctiveness of the present study were evaluated by reviewing the prior literature that explored the influence of lighting environments on occupants’ work performance, physiological and psychological well-being, and level of satisfaction with the lighting conditions.
- Target spaces within an office facility were identified based on their unique lighting conditions and spatial configurations. Utilizing an illuminance meter, we quantitatively assessed the primary attributes of the light environment, with a particular emphasis on daylight influx and the resultant illuminance levels.
- A survey was administered to the occupants operating within the delineated spaces. The aim was to assess their psychological contentment with the prevailing indoor lighting conditions and to identify determinants of this satisfaction, including brightness, exposure, glare, and adjustment of the light environment.
- We conducted an analysis to discern the prevailing patterns and unique attributes of each designated area in relation to satisfaction with the indoor lighting environment, leveraging the feedback obtained from the occupants’ perspectives in the survey.
- Lastly, by integrating the measured characteristics of the light environment for each designated space with the satisfaction metrics and detailed elements identified through survey analysis, we systematically investigated the correlations among daylight-induced spatial lighting, occupant satisfaction, and the influential determinants of this satisfaction.
3. Previous Reviews
3.1. Quantitative Methodology on the Relationship between Light Environment and Human Response
3.2. Qualitative Methodology on the Relationship between Light Environment and Human Response
3.3. Purpose and Significance of the Study
4. Measurement of the Indoor Light Environment for Office Facilities
4.1. Standards for Illuminance of the Workplace
4.2. Selection and Method of Workplace for Indoor Light Environment Measurement
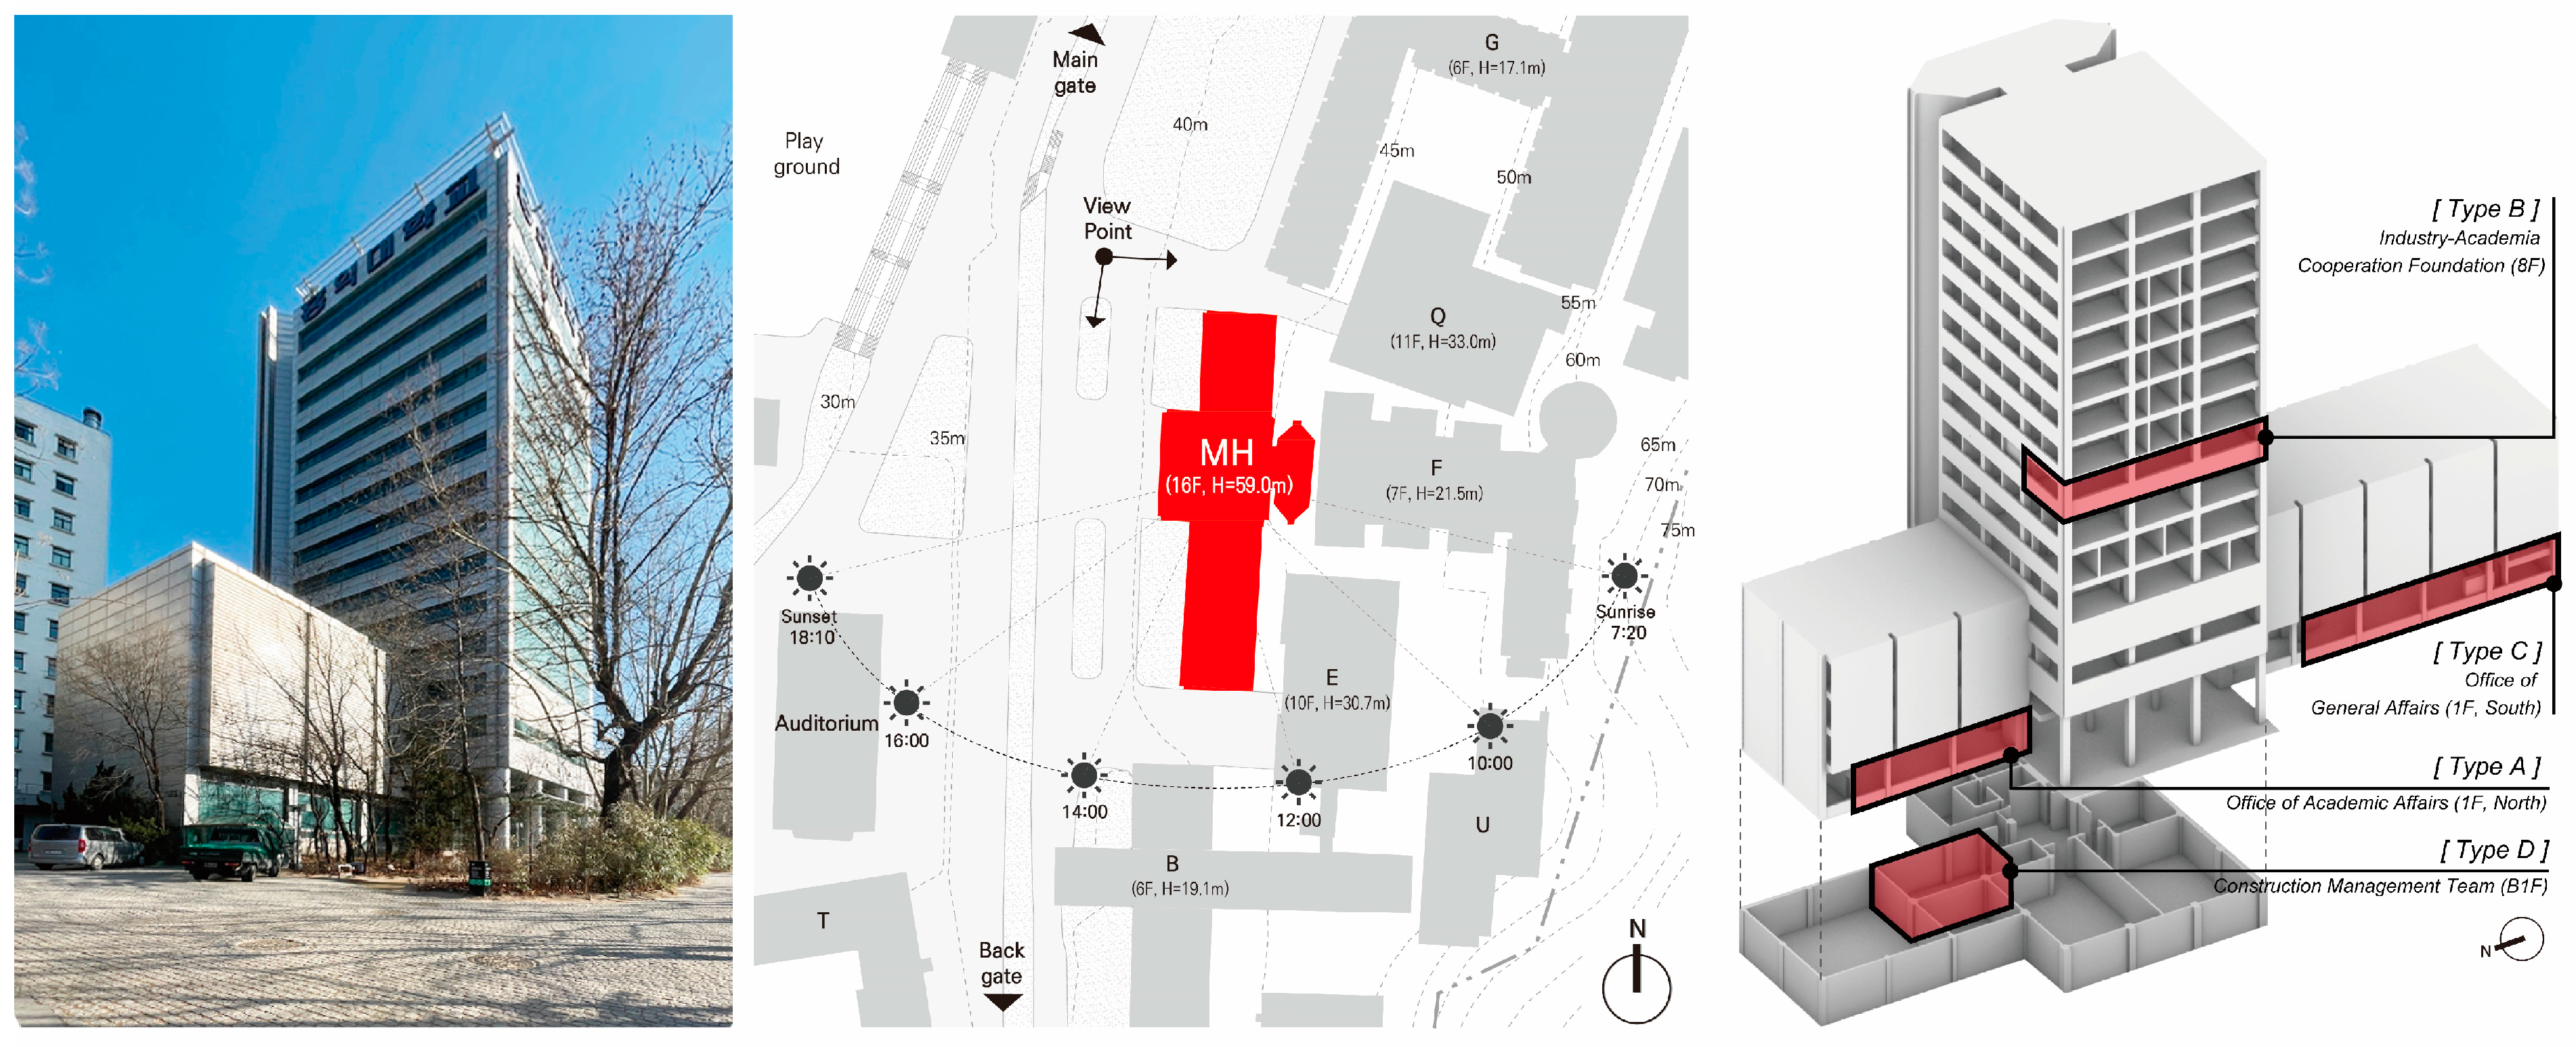
4.2.1. Selection for Target Space
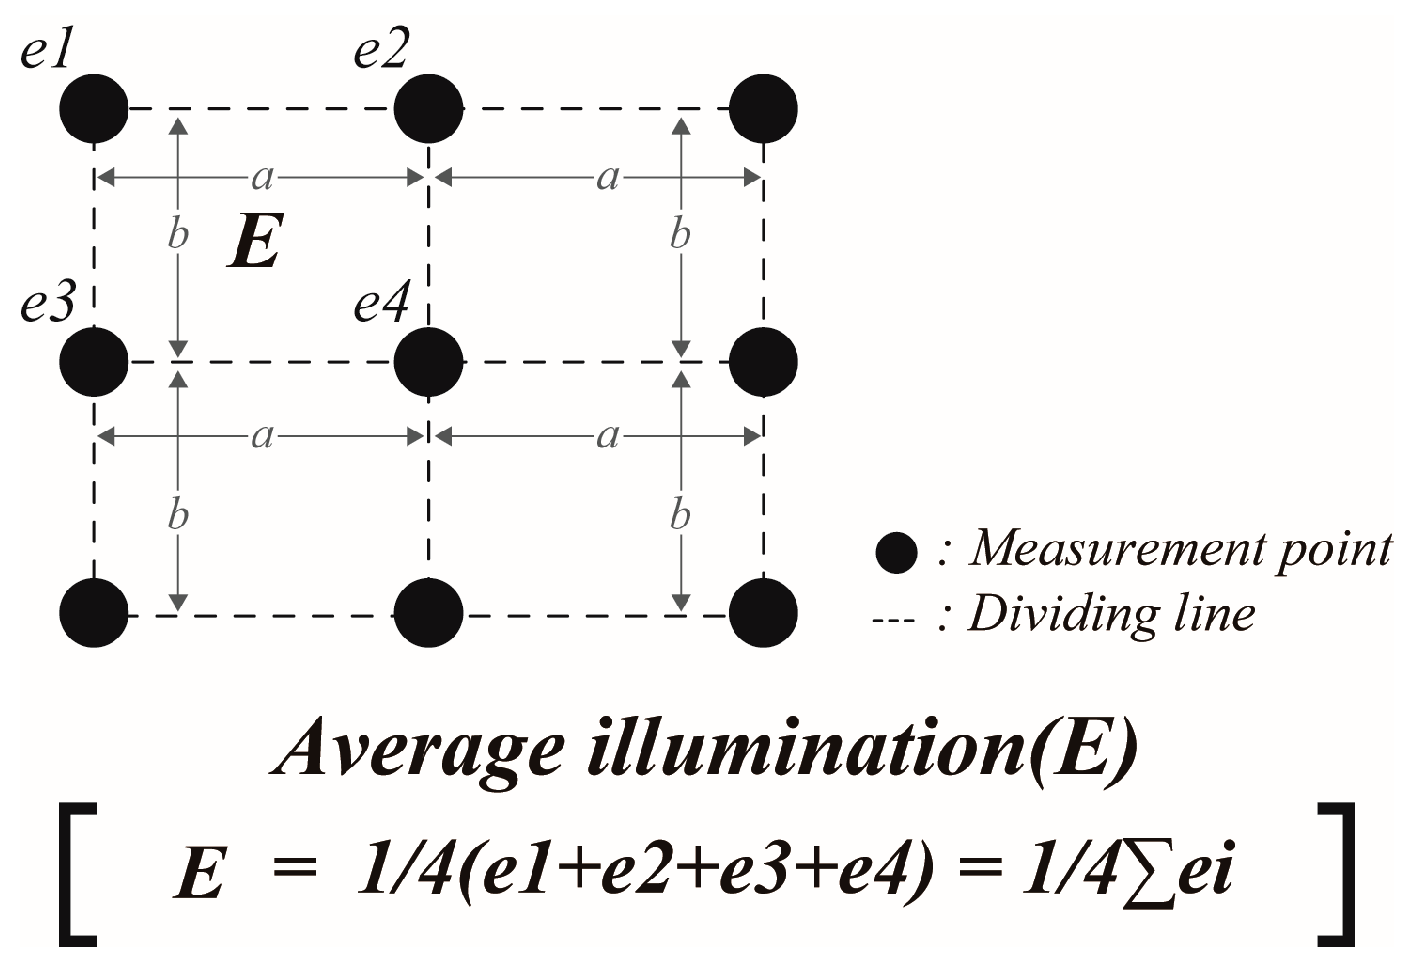
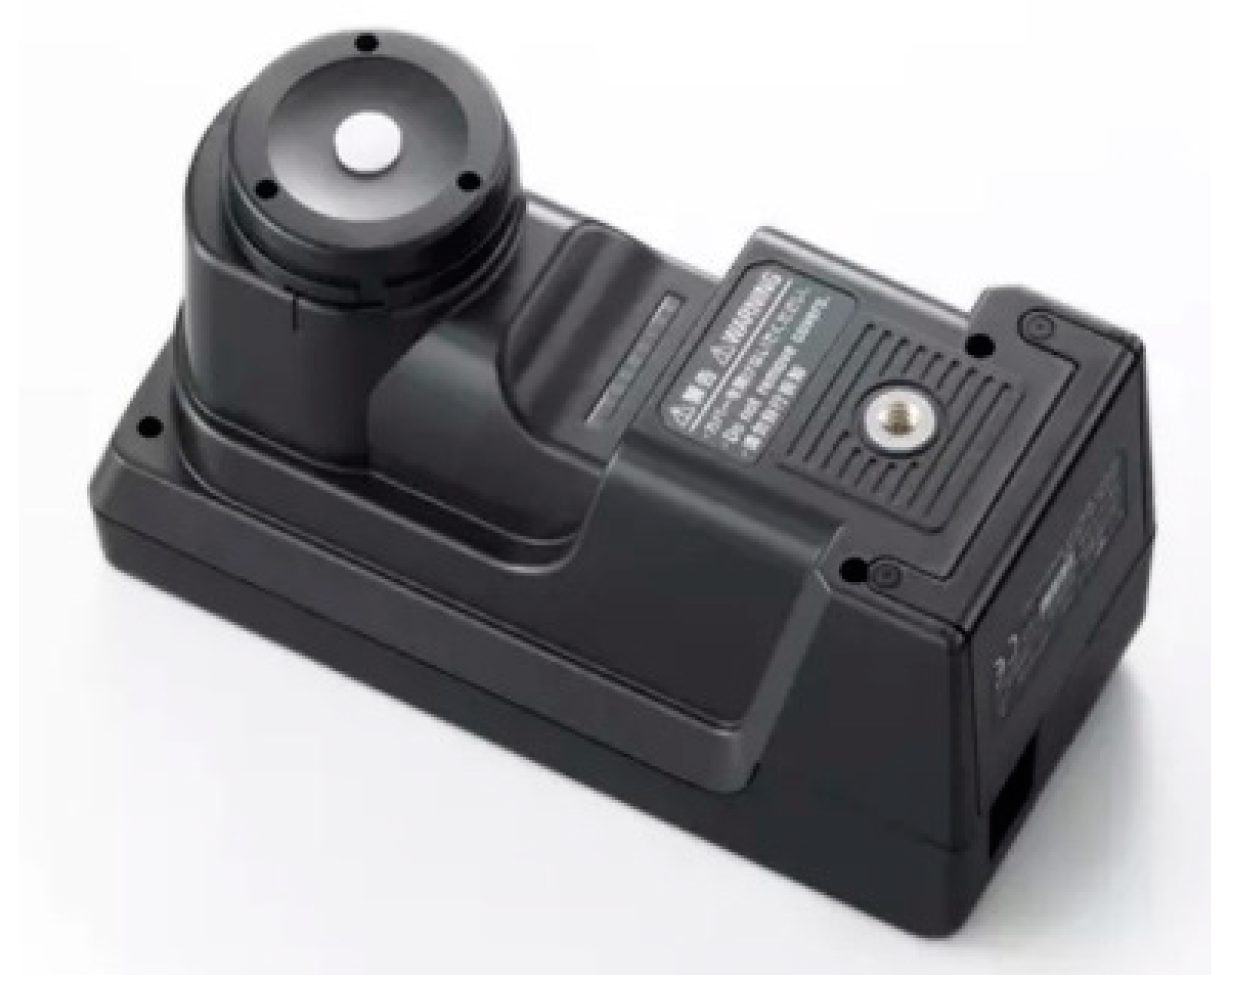
4.2.2. Indoor Light Environment Measurement Method
4.3. Measurement of the Indoor Light Environment of Target Spaces
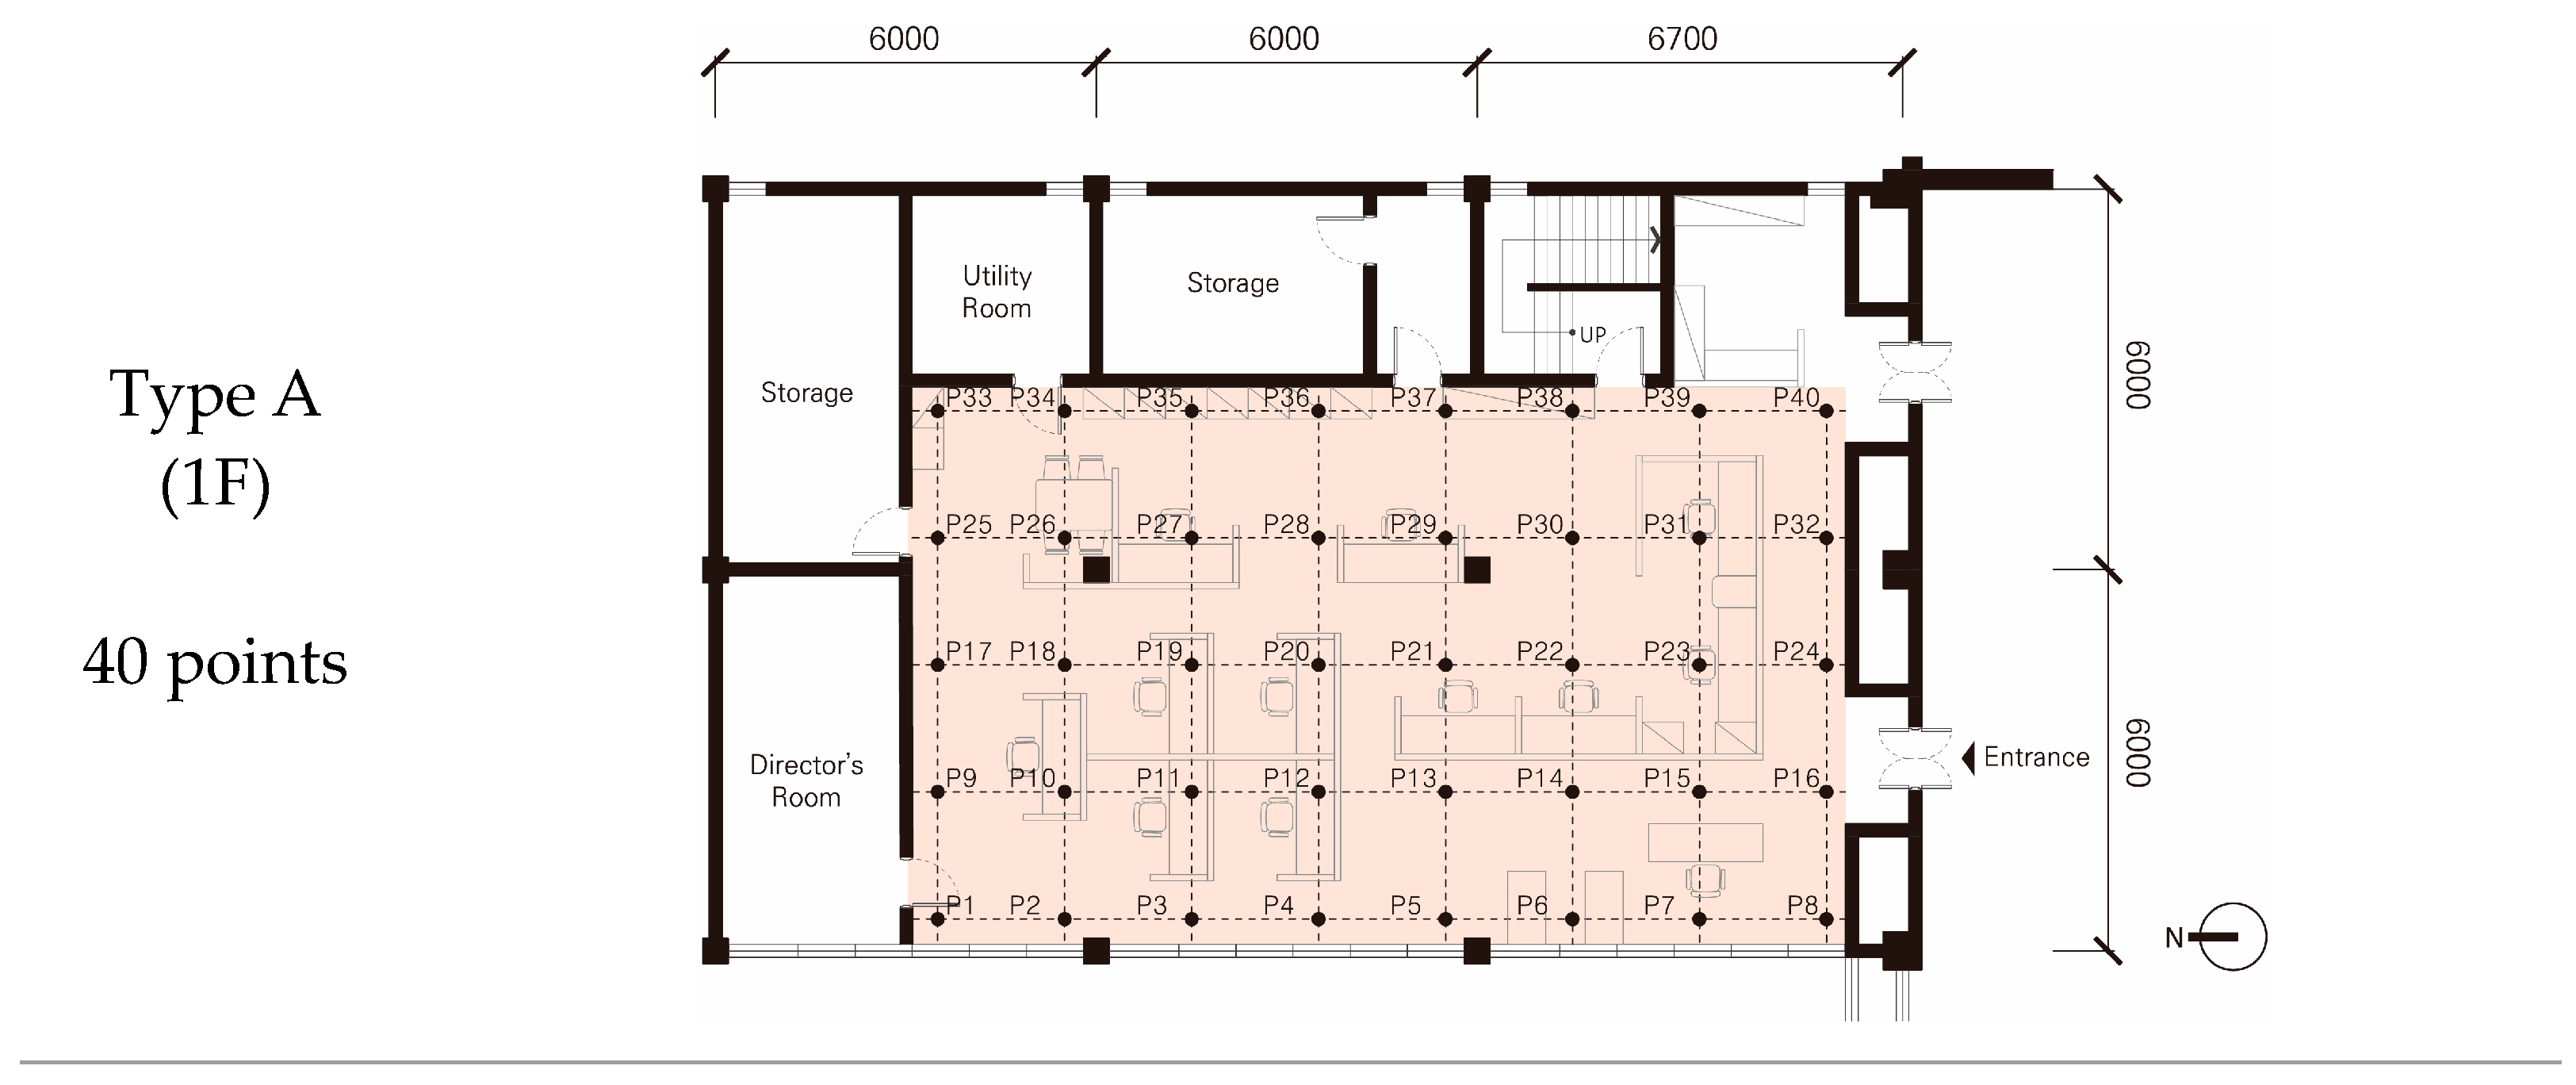
4.3.1. Type A (1F)
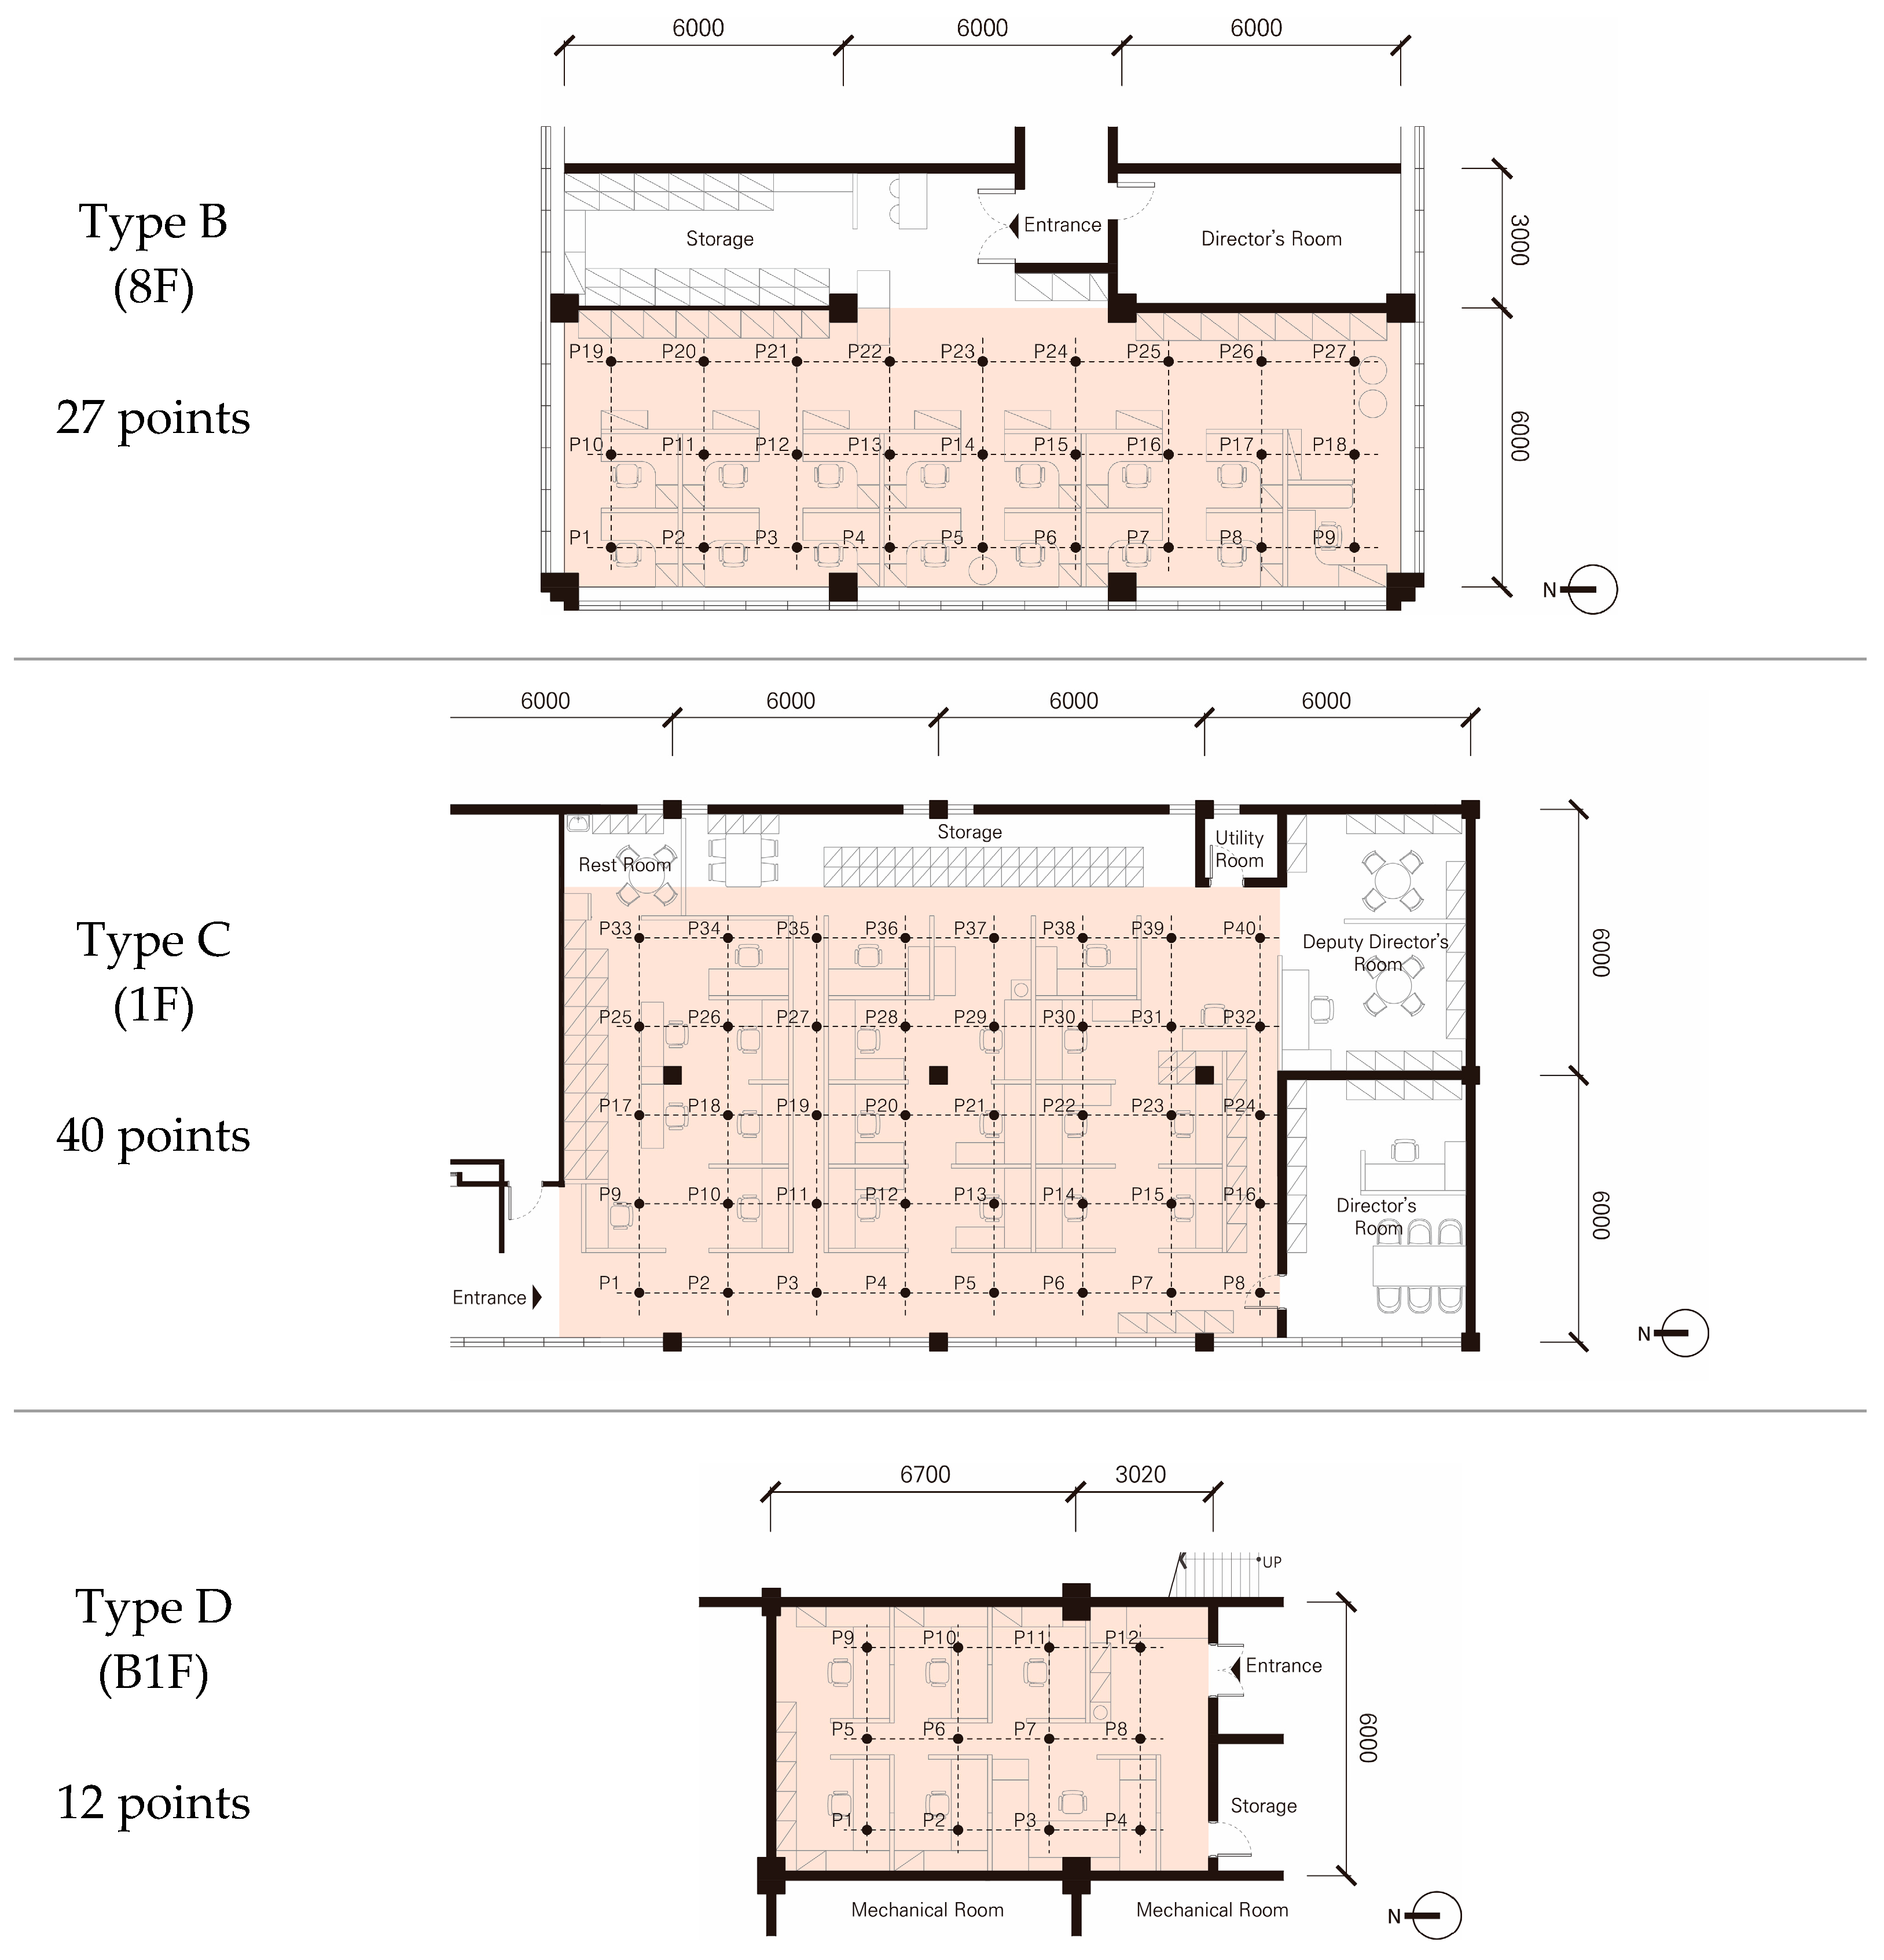
4.3.2. Type B (8F)
4.3.3. Type C (1F)
4.3.4. Type D (B1F)
4.4. Analysis of the Indoor Light Environment of Target Spaces through Measurement
- 1.
- Type A (First floor in the MH building)
- The average illuminance at 12:00 and 14:00 in this space was close to the illuminance standard for precision work (750 lx), but an excessive light environment was formed at 16:00. The inflow of daylight was concentrated around the northwest window, so it was expected that the influence of daylight on the occupants at that location would be high.
- 2.
- Type B (Eighth floor in the MH building)
- The Illuminance in this space were the highest among all other spaces and the values (917.8~1127.3 lx) exceeded the appropriate illuminance standard. Depending on the arrangement of the windows, the daylight in the space flowed in a U-shape, and the workplace with the window behind it was expected to have a high impact on work and light environment satisfaction.
- 3.
- Type C (First floor in the MH building)
- The average illuminance in this space was formed at a level similar to that of the IACF, which appeared to be excessive compared to the illuminance standard. Unlike the other spaces, daylight flowed in parallel to the arrangement of the west window, and it was expected that the occupants would be affected by daylight in proportion to their distance from the window.
- 4.
- Type D (First basement floor in the MH building)
- This space was appropriately maintained to the illuminance standard (600 lx) among the target spaces where the measurement was conducted. Due to the characteristics of the underground space, the light environment was maintained only by artificial light without the influence of daylight, and it had a uniform light environment regardless of the time of day.
5. Survey of Occupants’ Psychological Satisfaction with Their Indoor Light Environment
5.1. Survey Overview
5.2. Survey Progress and Analysis Method
5.3. Analysis of Patterns in the Occupants’ Satisfaction Responses for the Indoor Light Environment
5.3.1. Satisfaction with the Indoor Light Environment
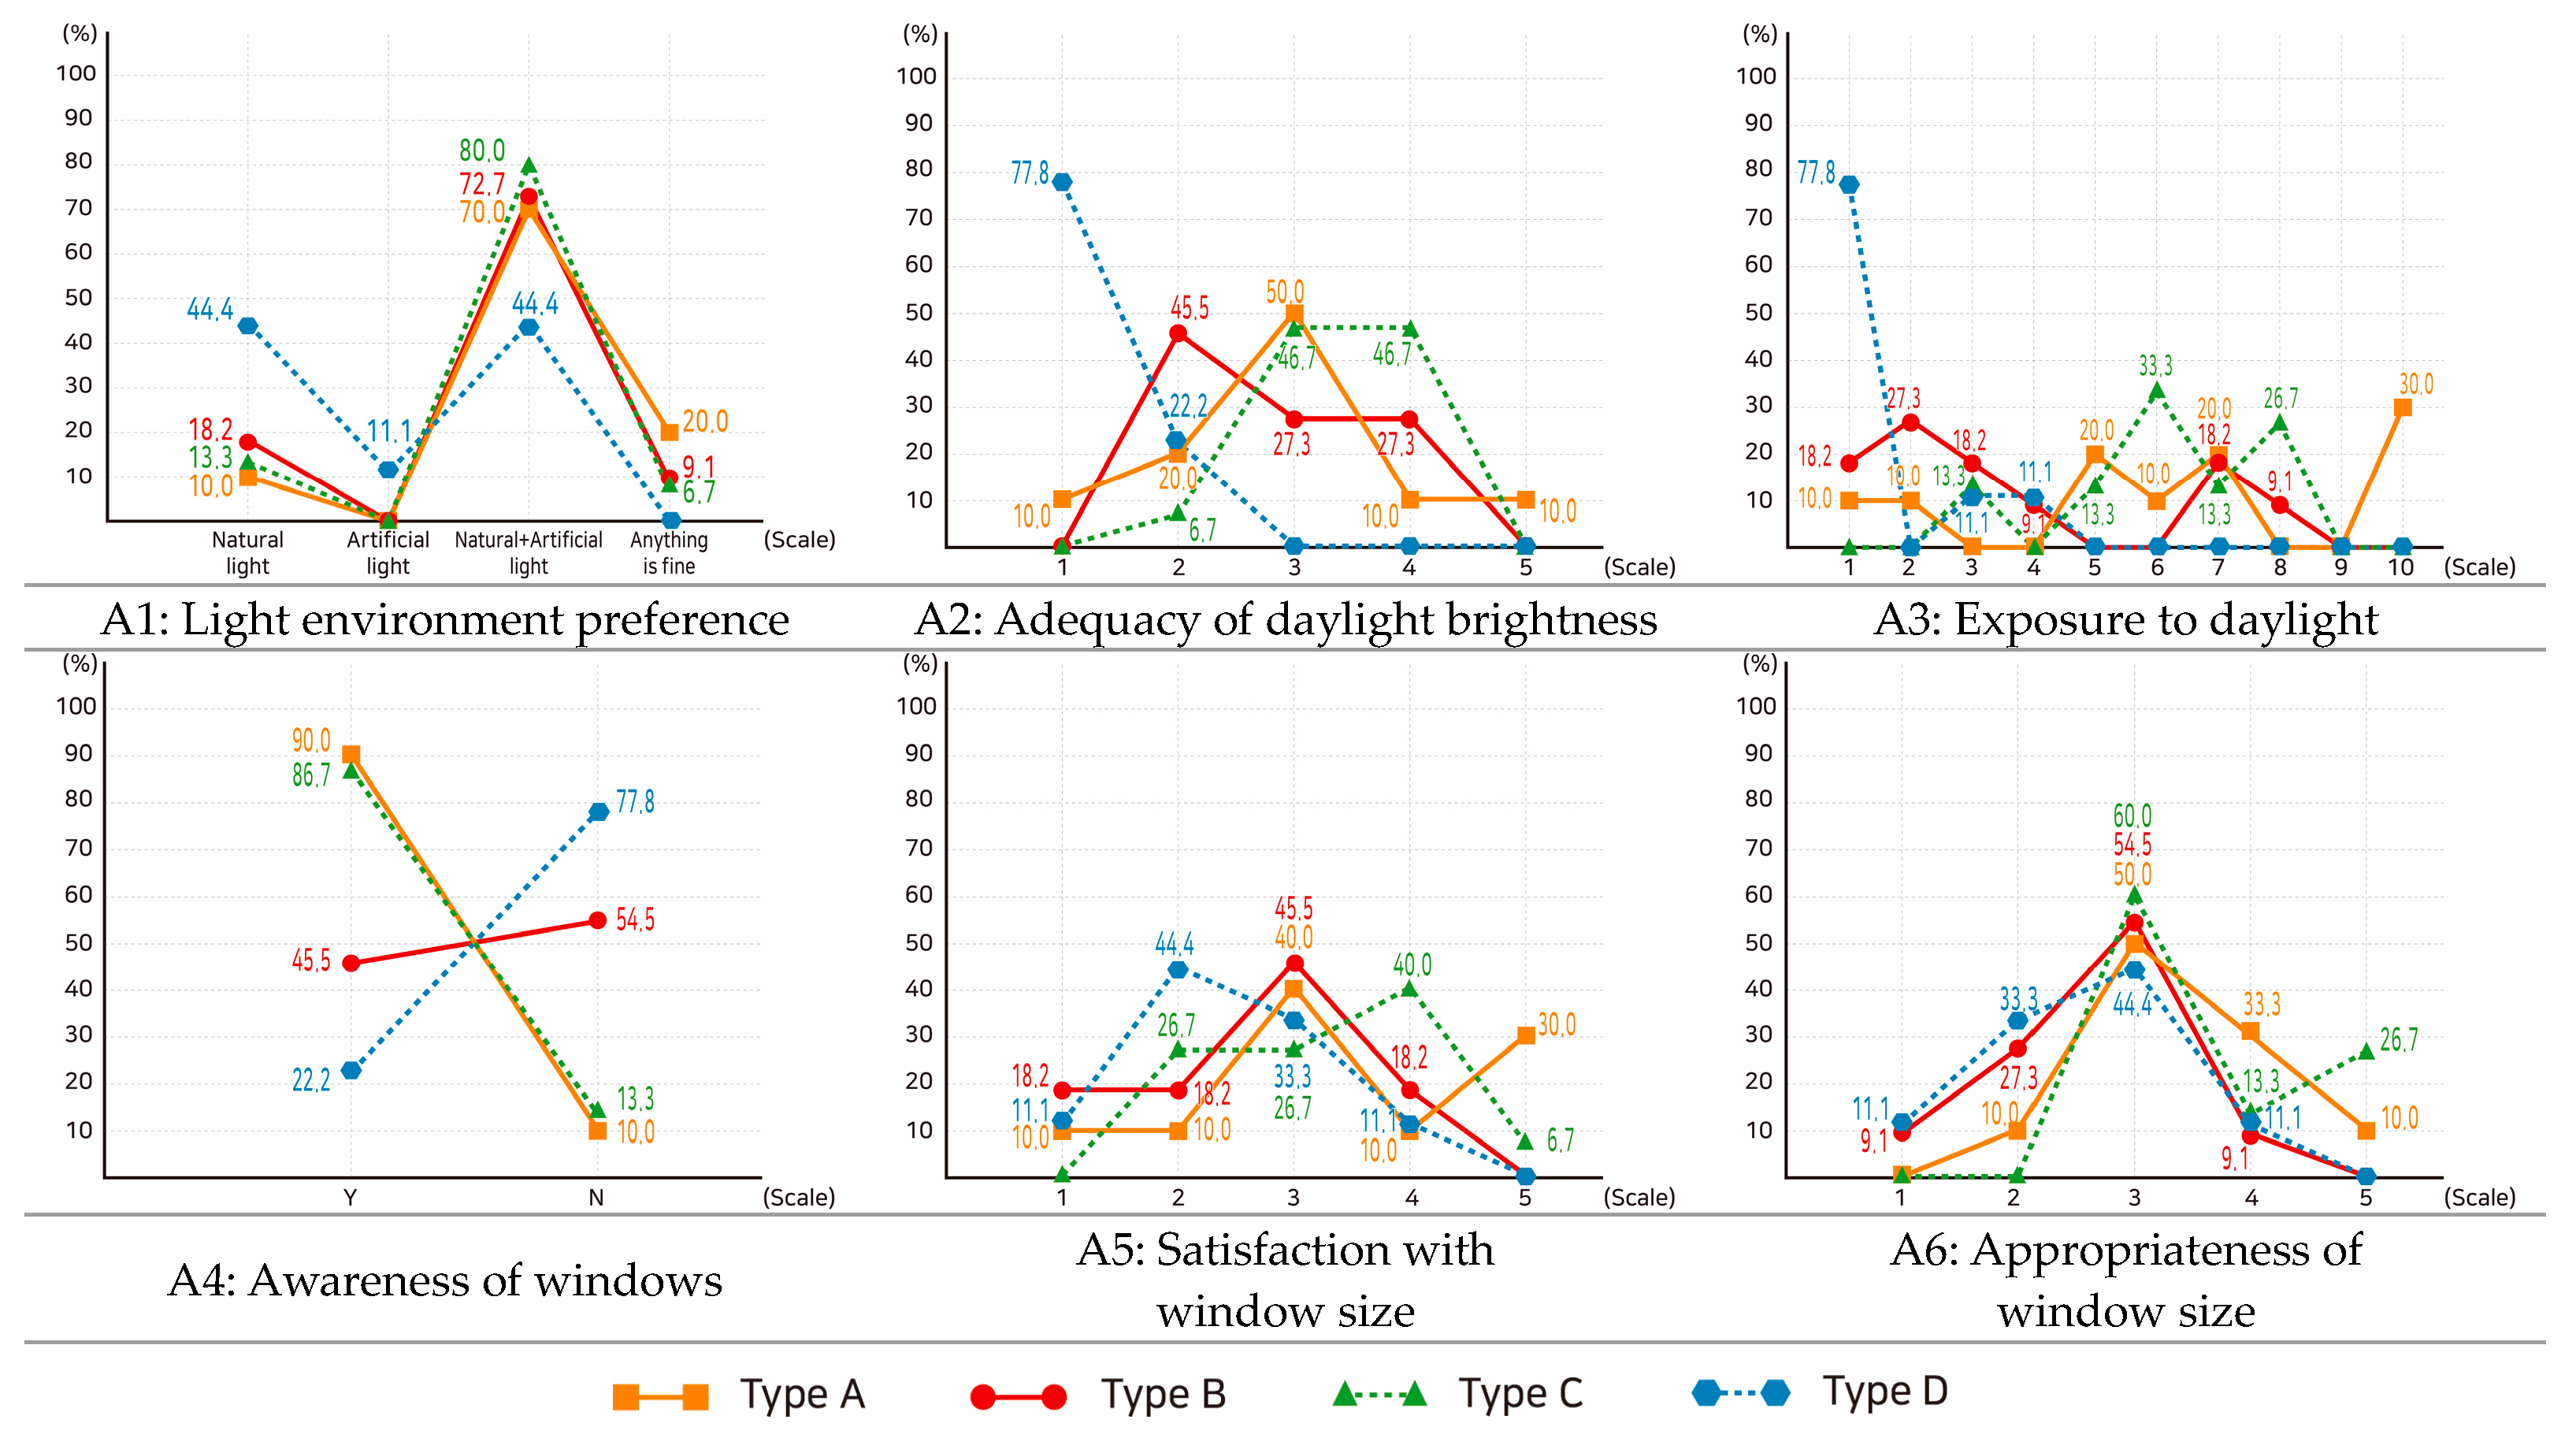
5.3.2. Daylight
5.3.3. Artificial Light
5.3.4. Glare
5.3.5. Light Environment Adjustment
5.4. Correlation of Psychological Satisfaction with Light Environment and Major Factors
5.4.1. Type A (First Floor in the MH Building)
5.4.2. Type B (Eighth Floor in the MH Building)
5.4.3. Type C (First Floor in the MH Building)
5.4.4. Type D (First Basement Floor in the MH Building)
5.5. Psychological Satisfaction and Factors According to the Characteristics of Light Environment by Space
- 1.
- Type A (First floor in the MH building)
- The Type A space had a window on the west side and showed a high level of illuminance at a specific time (16:00). In addition, the workspace was adjacent to the northwest window (P1), which was a location where a high inflow of natural light occurred, and the arrangement was also side facing. In this space, the overall light environment was found to be usually satisfying.
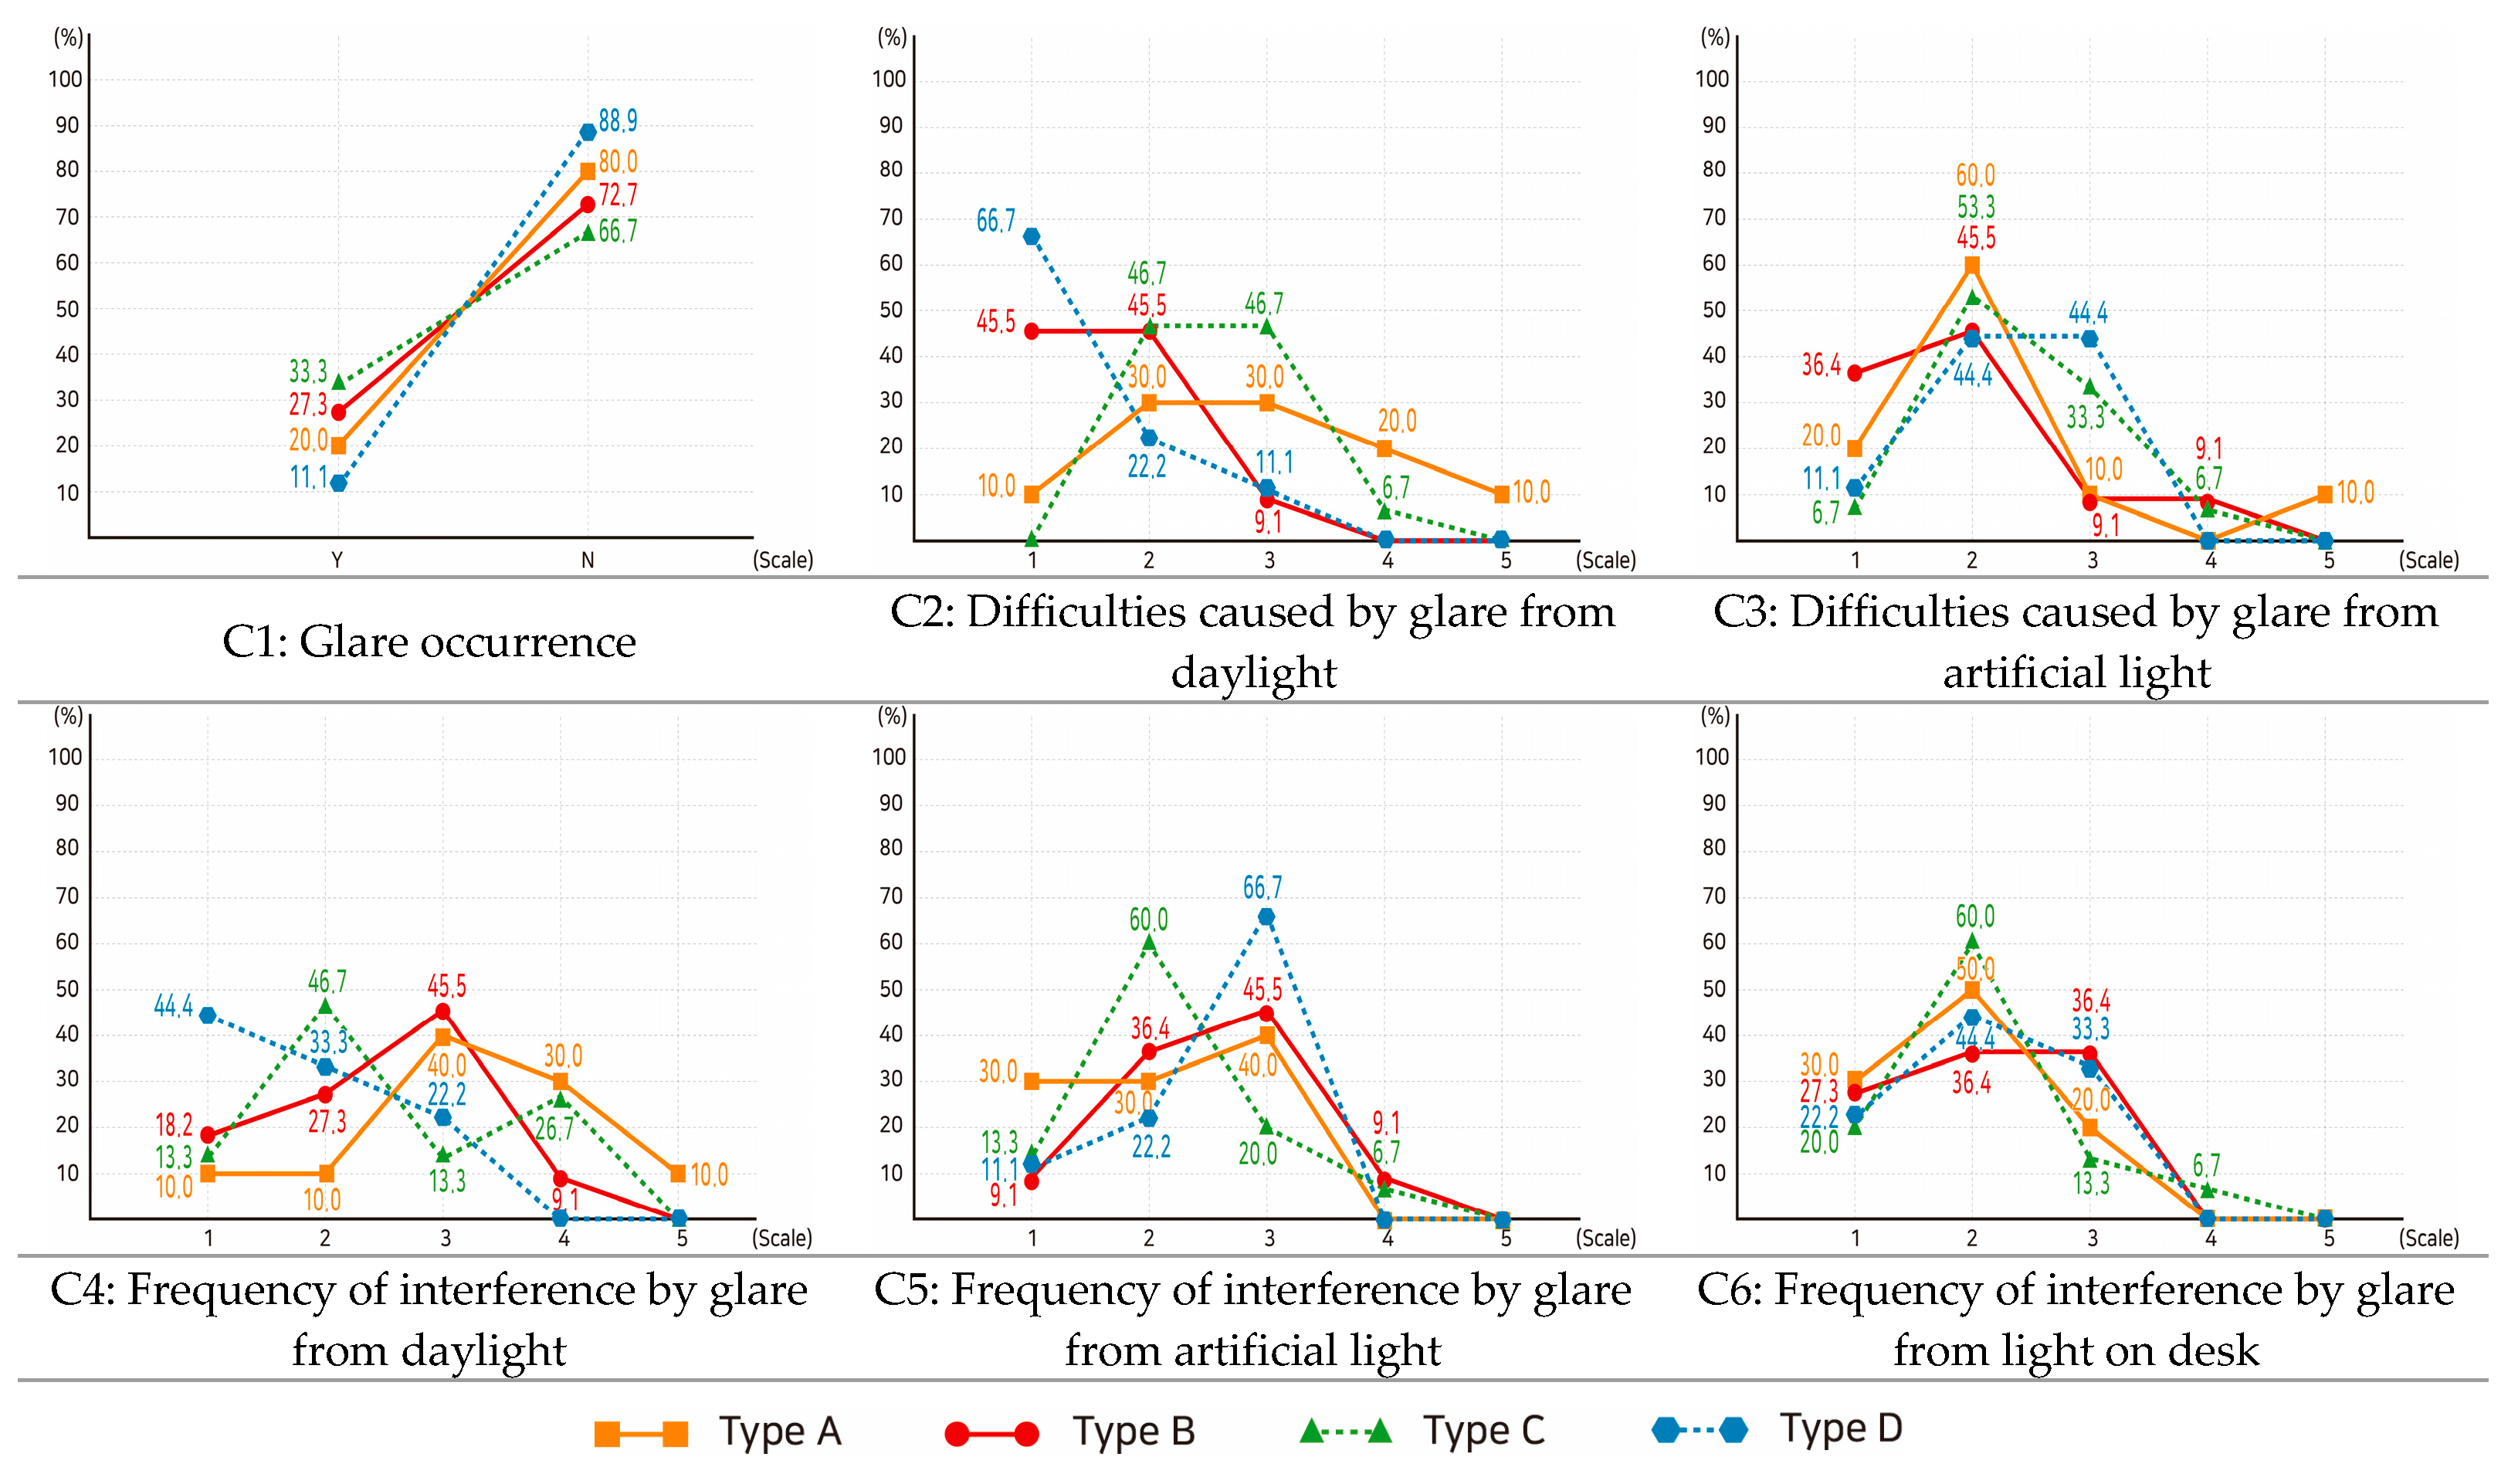
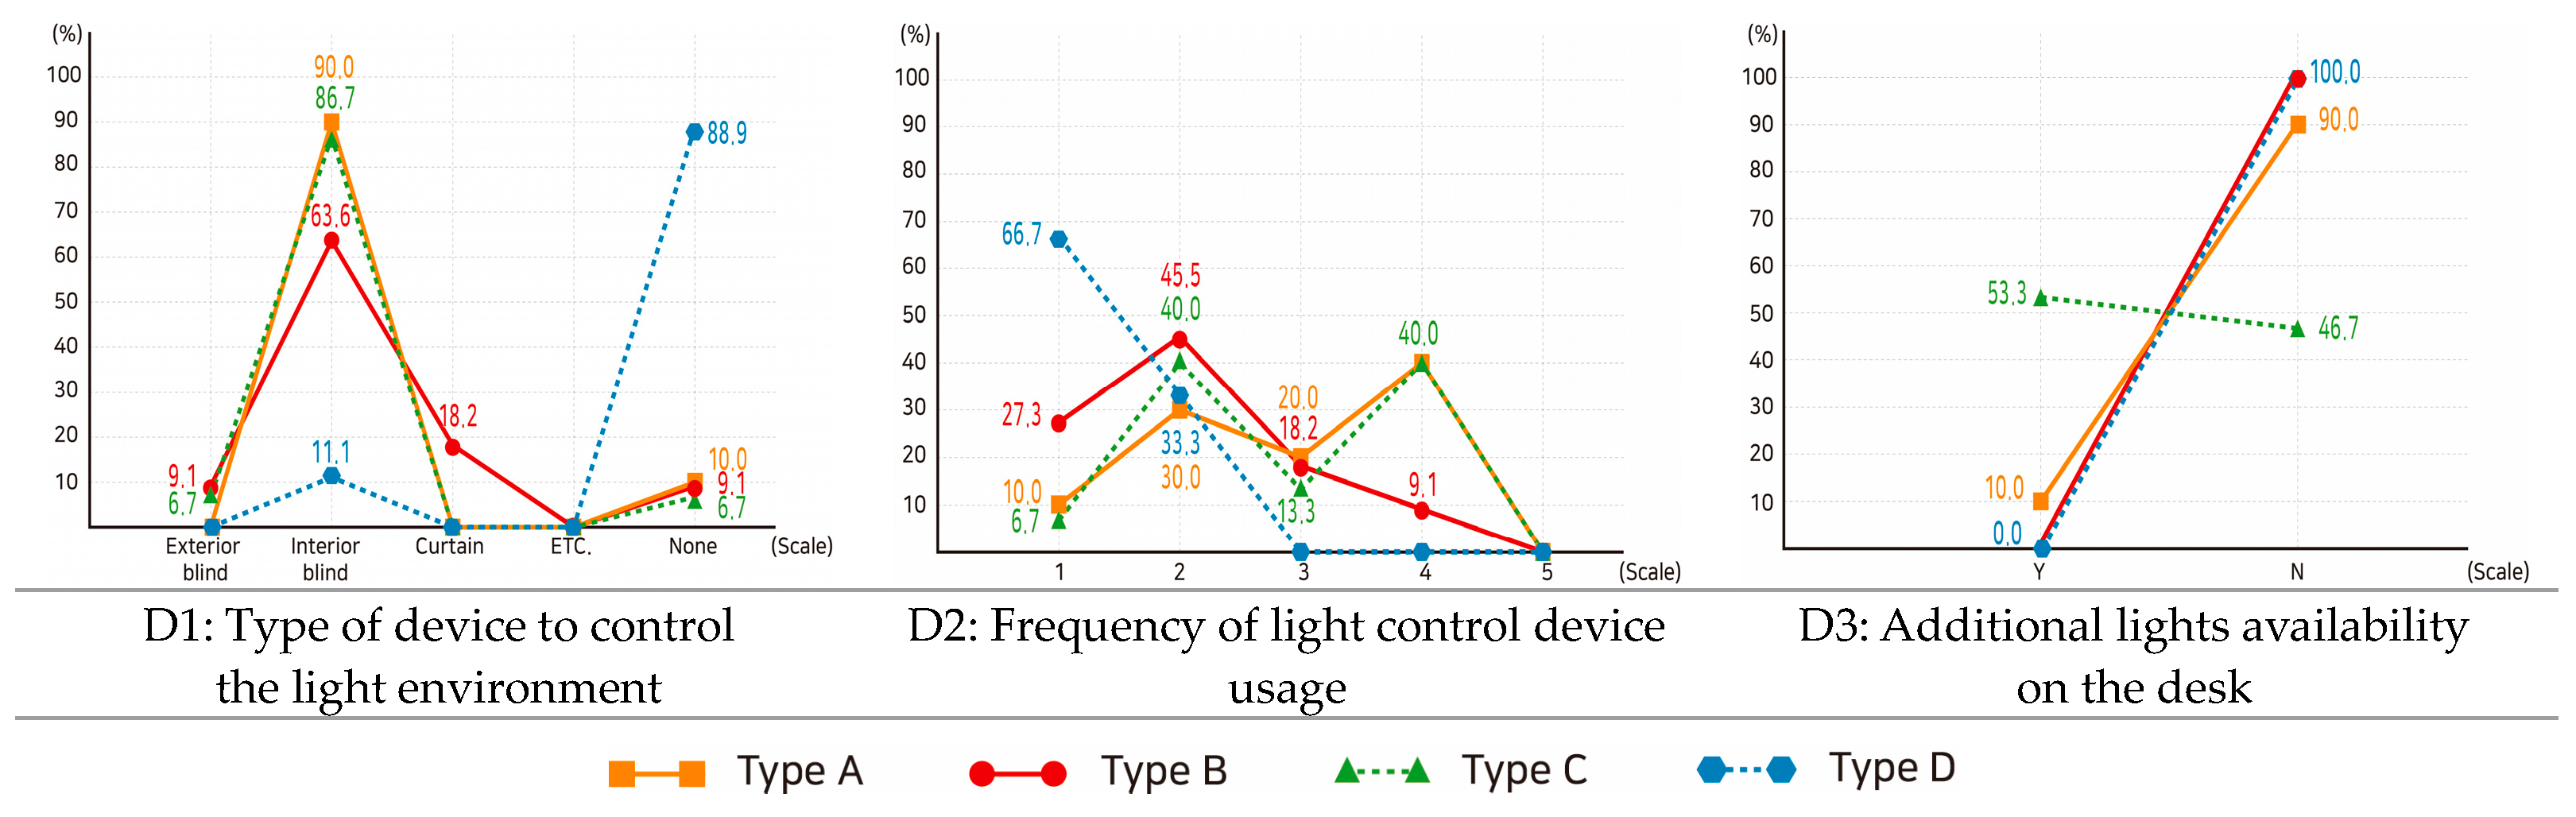
- It was identified that this was because of difficulties at work due to glare (C2) caused by high exposure to daylight (A3) which occurred with a high frequency (C4). In addition, although the size of the window (A5) was satisfying, the use of internal blinds (D2) was found to be high to reduce glare from excessive natural light. Based on this tendency, through statistical analysis, the factors affecting user satisfaction were the size of the window (A5) and the frequency of work interruption due to glare from natural light (C4).
- 2.
- Type B (Eighth floor in the MH building)
- Workers in the Type B space, which had three sides open with windows and showed the highest illuminance value, responded that the brightness of the daylight was not appropriate (A2), the exposure was low (A3), and they reported a low rate of window awareness (A4).
- At the time of the study, the Type B space had furniture and objects (documents) placed high on the west-side window with high daylight inflow, and work was carried out with the window behind them. The arrangement of furniture and objects and the type of work were identified as the cause of the occupants’ negative responses, and the light environment was reported as being usually satisfying. Similar to this pattern, the regression analysis determined that daylight exposure (A3), window size (A5), and frequency of light control device usage (D2) were major factors affecting satisfaction.
- 3.
- Type C (First floor in the MH building)
- The Type C space, which had a window on the west side and showed the second-highest average illuminance value, was found to have no major problems with daylight, artificial light, or glare.
- This resulted in satisfaction with the overall light environment. In particular, the occupants reported high satisfaction (A5), appropriateness (A6) of the size of the window, and users’ active adjustment to daylight exposure (A3). It was found that the occupant who worked adjacent to the window used internal blinds (D2) and additional lights on the desk (D3) at the rear, where there was low daylight inflow to create an appropriate light environment. The statistical analysis results found that daylight exposure (A3) and window size (A5) affected satisfaction.
- 4.
- Type D (First basement floor in the MH building)
- Finally, the Type D space maintained a light environment without daylight with artificial lighting, and the appropriate illuminance was measured according to the standard (300~600 lx, 750 lx for precision work) regardless of the time of day.
- However, it was found that the users were very dissatisfied with the light environment, even though the appropriate levels of illumination were maintained. Negative responses to the appropriateness of brightness for daylight (A2) and exposure (A3) and a high preference for daylight at work (A1) suggest the importance of daylight to occupants in the light environment design. Through multiple regression analysis, a factor that affected the light environment satisfaction of the Type D occupants was difficulties caused by the glare of artificial light (C3), reflecting the status of the light environment in the belowground spaces utilizing only artificial lighting.
6. Conclusions
Author Contributions
Funding
Data Availability Statement
Conflicts of Interest
References
- Beute, M.; de Kort, Y.A. Salutogenic effects of the environment: Review of health protective effects of nature and daylight. Health Well-Being 2014, 6, 69–95. [Google Scholar] [CrossRef] [PubMed]
- Boubekri, M. Daylighting, Architecture and Health: Building Design Strategies; Routledge: London, UK, 2008. [Google Scholar]
- Ellis, E.V.; Gonzalez, E.W.; Kratzer, D.A.; McEachron, D.L.; Yuetter, G. Auto-tuning daylight with LEDs: Sustainable lighting for health and wellbeing. In Proceedings of the ARCC Conference Repository, Charlotte, NC, USA, 27–30 March 2013. [Google Scholar]
- Leslie, R.P. Capturing the daylight dividend in buildings: Why and how? Build. Environ. 2003, 38, 381–385. [Google Scholar] [CrossRef]
- Boubekri, M. Daylighting Design: Planning Strategies and Best Practice Solutions; Birkhäuser: Basel, Switzerland, 2014. [Google Scholar]
- Seydolhosseini, A.; Masoumi, M.; Modarressi, M.; Karimian, N. Daylight adaptive smart indoor lighting control method using artificial neural networks. J. Build. Eng. 2020, 29, 101141. [Google Scholar] [CrossRef]
- Baker, N.; Steemers, K. Daylight Design of Buildings: A Handbook for Architects and Engineers; Routledge: London, UK, 2014. [Google Scholar]
- Zarrabi, M.; Yazdanfar, S.; Hosseini, S. COVID-19 and healthy home preferences: The case of apartment residents in Teheran. J. Build. Eng. 2021, 35, 102021. [Google Scholar] [CrossRef]
- Li, C.; Tang, H. Study on ventilation rates and assessment of infection risk of COVID-19 in an outpatient building. J. Build. Eng. 2021, 42, 103090. [Google Scholar] [CrossRef]
- Boyce, P.; Hunter, C.; Howlett, O. The Benefits of Daylight through Windows; Rensselaer Polytechnic Institute, Troy: New York, NY, USA, 2003. [Google Scholar]
- Tregenza, P.R.; Waters, I.M. Daylight coefficients. Light. Res. Technol. 1983, 15, 65–71. [Google Scholar] [CrossRef]
- Reinhart, C.F.; Mardaljevic, J.; Rogers, Z. Dynamic daylight performance metrics for sustainable building design. J. Illum. Eng. Soc. 2006, 3, 7–31. [Google Scholar] [CrossRef]
- World Green Building Council. Health, Wellbeing & Productivity in Offices. 2014. Available online: https://worldgbc.org/wp-content/uploads/2022/03/compressed_WorldGBC_Health_Wellbeing__Productivity_Full_Report_Dbl_Med_Res_Feb_2015-1.pdf (accessed on 20 February 2023).
- Brainard, J.; Gobel, M.; Scott, B.; Koeppen, M.; Eckle, T. Health implications of disrupted circadian rhythms and the potential for daylight as therapy. Anesthesiology 2015, 122, 1170–1175. [Google Scholar] [CrossRef]
- Konis, K. A novel circadian daylight metric for building design and evaluation. Build. Environ. 2017, 113, 22–38. [Google Scholar] [CrossRef]
- Bellia, L.; Pedace, A.; Barbato, G. Daylighting offices: A first step toward an analysis of photobiological effects for design practice purposes. Build. Environ. 2014, 74, 54–64. [Google Scholar] [CrossRef]
- Boubekri, M.; Lee, J.; MacNaughton, P.; Woo, M.; Schuyler, L.; Tinianov, B.; Satish, U. The impact of optimized daylight and views on the sleep duration and cognitive performance of office workers. Int. J. Environ. Res. Public Health 2020, 17, 3219. [Google Scholar] [CrossRef] [PubMed]
- Yu, H.; Akita, T. Effects of illuminance and color temperature of a general lighting system on psychophysiology while performing paper and computer tasks. Build. Environ. 2023, 228, 109796. [Google Scholar] [CrossRef]
- Konstantzos, I.; Tzempelikos, A.; Chan, Y. Experimental and simulation analysis of daylight glare probability in offices with dynamic window shades. Build. Environ. 2015, 87, 244–254. [Google Scholar] [CrossRef]
- Lee, J.; Boubekri, M. Impact of daylight exposure on health, well-being and sleep of office workers based on actigraphy, surveys, and computer simulation. J. Green Build. 2020, 15, 19–42. [Google Scholar] [CrossRef]
- Rea, M.S.; Figueiro, M.; Bullough, J.D. Circadian photobiology: An emerging framework for lighting practice and research. Light. Res. Technol. 2002, 34, 177–187. [Google Scholar] [CrossRef]
- Andersen, M.; Mardaljevic, J.; Lockley, S.W. A framework for predicting the non-visual effects of daylight—Part I: Photobiology-based model. Light. Res. Technol. 2012, 44, 37–53. [Google Scholar] [CrossRef]
- Castilla, N.; Higuera-Trujillo, J.L.; Llinares, C. The effect of illuminance on students’ memory. A neuroarchitecture study. Build. Environ. 2023, 228, 109833. [Google Scholar] [CrossRef]
- Zomorodian, Z.; Tahsildoost, M. Assessing the effectiveness of dynamic metrics in predicting daylight availability and visual comfort in classrooms. Renew. Energy 2019, 134, 669–680. [Google Scholar] [CrossRef]
- Figueiro, M.; Jarboe, C.; Sahin, L. The sleep maths: A strong correlation between more daytime light and better nighttime sleep. Light. Res. Technol. 2021, 53, 423–435. [Google Scholar] [CrossRef]
- Baird, G.; Thompson, J. Lighting conditions in sustainable buildings: Results of a survey of user’s perceptions. Archit. Sci. Rev. 2012, 55, 102–109. [Google Scholar] [CrossRef]
- Konis, K. Evaluating daylighting effectiveness and occupant visual comfort in a side-lit open-plan office building in San Francisco, California. Build. Environ. 2013, 59, 662–677. [Google Scholar] [CrossRef]
- Xue, P.; Mak, C.M.; Cheung, H.D. The effects of daylighting and human behavior on luminous comfort in residential buildings: A questionnaire survey. Build. Environ. 2014, 81, 51–59. [Google Scholar] [CrossRef]
- Alzubaidi, S.; Roaf, S.; Banfill, P.F.G.; Talib, R.A.; Al-Ansari, A. Survey of hospitals lighting: Daylight and staff preferences. Int. J. Energy Eng. 2013, 3, 287–293. [Google Scholar]
- Ferrante, T.; Villani, T. Pre-occupancy evaluation in hospital rooms for efficient use of natural light-improved proposals. Buildings 2022, 12, 2145. [Google Scholar] [CrossRef]
- Matterson, M.L.; Ferra, J.O.; Salom, J.; Portilla, J.H. Dynamic daylight simulation and visual comfort survey in Mediterranean climate. In Proceedings of the 13th Conference of International Building Performance Simulation Association, Chambery, France, 25–28 August 2013. [Google Scholar]
- Korean Agency for Technology and Standards. Recommended Levels of Illumination (Report No.: KS A 3011). Available online: https://standard.go.kr/KSCI/standardIntro/getStandardSearchView.do?ksNo=KSA3011&menuId=919&reformNo=09&tmprKsNo=KSA3011&topMenuId=502&upperMenuId=503 (accessed on 1 March 2023).
- ISO 8995; International Standard. Lighting of Indoor Workplaces. International Commission on Illumination: Vienna, Austria, 2022.
- Illuminating Engineering Society of North America. IESNA Lighting Handbook, 9th ed.; Illuminating Engineering Society: New York, NY, USA, 2000. [Google Scholar]
- Korean Agency for Technology and Standards. Illuminance Measurements for Lighting Installations (Report no.: KS C 7612). Available online: https://e-ks.kr/KSCI/standardIntro/getStandardSearchView.do (accessed on 1 March 2023).
- Konika Minolta Sensing Americas Inc. CL-500A Illuminance Spectrophotometer. Available online: https://sensing.konicaminolta.us/us/products/cl-500a-illuminance-spectrophotometer/ (accessed on 24 February 2023).
- Safranek, S.; Davis, R.G. Assessing the accuracy of emerging lighting simulation tools: Predicting spectral power distribution and illuminance. In Proceedings of the IES 2022 Annual Conference Proceedings, New Orleans, LA, USA, 18–20 August 2022. [Google Scholar]
- Chaiyakul, Y. Compare and contrast on varied illuminance meters. J. Build. Energy Environ. 2018, 1, 17–23. [Google Scholar]
- Korea Meteorological Administration. Observation by City. Available online: https://www.weather.go.kr/w/obs-climate/land/city-obs.do?auto_man=m&stn=0&dtm=&type=t99®=109&tm=2023.02.23.12%3A00 (accessed on 24 February 2023).
- Kim, K.; Lee, K.; Lee, J. A study on the evaluation methods of indoor light environment for occupant comfort and well-being. J. Green Build. 2023, 18, 99–128. [Google Scholar] [CrossRef]
- Park, J.; Lee, K.; Kim, K. Comparative validation of light environment simulation with actual measurements. Buildings 2023, 13, 2742. [Google Scholar] [CrossRef]
- Unwin, A.; Volinsky, C.; Winkler, S. Parallel coordinates for exploratory modelling analysis. Comput. Stat. Data Anal. 2003, 43, 553–564. [Google Scholar] [CrossRef]
- Inselberg, A. Parallel Coordinates: Visual Multidimensional Geometry and Its Applications; Springer: Berlin/Heidelberg, Germany, 2009. [Google Scholar]
- First, E.E.; Swallow, B.; Laramee, R.S. PCP-Ed: Parallel coordinate plots for ensemble data. Vis. Inform. 2023, 7, 56–65. [Google Scholar]
- Uyanik, G.K.; Güler, N. A study on multiple linear regression analysis. Procedia-Soc. Behav. Sci. 2013, 106, 234–240. [Google Scholar] [CrossRef]


| Time | Day | ||
|---|---|---|---|
| 21 February 2023 | 22 February 2023 | 23 February 2023 | |
| 12 p.m. | 60,083 | 55,063 | 51,523 |
| 14 p.m. | 70,310 | 68,006 | 60,840 |
| 16 p.m. | 33,147 | 24,886 | 27,247 |
| 19 p.m. | 1.2 | 1.3 | 1.3 |
| Target Space | Time | Daylight + Artificial Light | Daylight * | |
|---|---|---|---|---|
| Type A (1F) | 12 p.m. | Maximum | 984.2 (P35) | 289.4 (P6) |
| Minimum | 440.4 (P28) | 1.5 (P22) | ||
| Average | 712.5 | 93.1 | ||
| 14 p.m. | Maximum | 1498.0 (P1) | 1064.9 (P1) | |
| Minimum | 512.7 (P28) | 5.8 (P22) | ||
| Average | 798.1 | 178.7 | ||
| 16 p.m. | Maximum | 3791.0 (P9) | 3233.6 (P9) | |
| Minimum | 560.9 (P40) | 48.8 (P39) | ||
| Average | 1206.2 | 586.8 | ||
| Type B (8F) | 12 p.m. | Maximum | 2525.0 (P18) | 1550.3 (P18) |
| Minimum | 494.7 (P15) | 31.1 (P21) | ||
| Average | 917.8 | 240.5 | ||
| 14 p.m. | Maximum | 2736.0 (P18) | 1769.6 (P27) | |
| Minimum | 625.5 (P11) | 68.3 (P23) | ||
| Average | 1015.9 | 338.5 | ||
| 16 p.m. | Maximum | 2318.0 (P1) | 1848.3 (P1) | |
| Minimum | 661.3 (P11) | 83.7 (P24) | ||
| Average | 1127.3 | 449.9 | ||
| Type C (1F) | 12 p.m. | Maximum | 1316.0 (P2) | 602.4 (P2) |
| Minimum | 437.7 (P17) | 3.8 (P29) | ||
| Average | 842.3 | 194.1 | ||
| 14 p.m. | Maximum | 1726.0 (P2) | 1012.4 (P2) | |
| Minimum | 467.0 (P38) | 17.6 (P31) | ||
| Average | 935.7 | 287.6 | ||
| 16 p.m. | Maximum | 3884.0 (P5) | 3173.9 (P5) | |
| Minimum | 472.7 (P38) | 15.7 (P34) | ||
| Average | 1192.4 | 544.3 | ||
| Type D (B1F) | 12 p.m. | Maximum | 940.3 (P11) | - |
| Minimum | 386.6 (P6) | - | ||
| Average | 642.6 | - | ||
| 14 p.m. | Maximum | 969.7 (P11) | - | |
| Minimum | 388.5 (P6) | - | ||
| Average | 652.2 | - | ||
| 16 p.m. | Maximum | 957.2 (P11) | - | |
| Minimum | 384.8 (P6) | - | ||
| Average | 646.3 | - |
| Contents | Scale | ||
|---|---|---|---|
| Are you satisfied with the light environment in your workspace? | 5 points | ||
| Daylight (A) | 1 | Where do you prefer to work, in natural light, artificial light or mixed? (daylight + artificial light) | Nominal |
| 2 | Do you think natural light is appropriate for your work? | 5 points | |
| 3 | How much exposure do you have to natural light in your workspace? | 10 points | |
| 4 | Is there a window near you for the inflow of natural light? | Y/N | |
| 5 | How satisfied are you with the size of your workspace window? | 5 points | |
| 6 | What do you think about the size of the window in your workplace? | 5 points | |
| Artificial Light (B) | 1 | Do you think artificial light is appropriate for your work? | 5 points |
| 2 | Do you think artificial light in your workspace is evenly distributed? | 5 points | |
| 3 | Do you think the color of the artificial light is suitable for your work? | 5 points | |
| Glare (C) | 1 | Does the indoor light environment cause glare at your work? | Y/N |
| 2 | Does the natural light cause glare at your work? | 5 points | |
| 3 | Does the artificial light cause glare at your work? | 5 points | |
| 4 | Does the glare of natural light interfere with your work? | 5 points | |
| 5 | Does the glare of artificial light interfere with your work? | 5 points | |
| 6 | Does the glare of light on your desk (lamp, etc.) interfere with your work? | 5 points | |
| Light Environment Adjustment (D) | 1 | What device is installed in your workspace to control the indoor light environment? | Nominal |
| 2 | How often do you use a device selected in D1 to maintain a proper indoor light environment at your work? | 5 points | |
| 3 | Do you have any additional lights on your desk (lamp, etc.) for a proper light environment? | Y/N | |
| Target Space | Independent Variable | Unstandardized Coefficients | Standardized Coefficients | t | p | Collinearity Statistics | ||
|---|---|---|---|---|---|---|---|---|
| B | Std. Error | β | Tolerance | VIF | ||||
| Type A (1F) | A5 | 0.473 | 0.192 | 0.512 | 2.461 | 0.043 | 0.680 | 1.470 |
| C4 | 0.544 | 0.229 | 0.495 | 2.381 | 0.049 | 0.680 | 1.470 | |
| R (0.891)/R2 (0.794)/F (13.490)/p (0.004)/Durbin–Watson (2.548) | ||||||||
| Type B (8F) | A3 | 0.183 | 0.056 | 0.493 | 3.281 | 0.013 | 0.644 | 1.552 |
| A5 | 0.404 | 0.139 | 0.440 | 2.902 | 0.023 | 0.634 | 1.578 | |
| D2 | −0.549 | 0.122 | −0.549 | −4.503 | 0.003 | 0.979 | 1.021 | |
| R (0.948)/R2 (0.898)/F (20.560)/p (0.001)/Durbin–Watson (2.356) | ||||||||
| Type C (1F) | A3 | 0.352 | 0.113 | 0.559 | 3.099 | 0.009 | 0.959 | 1.043 |
| A5 | 0.492 | 0.194 | 0.458 | 2.538 | 0.026 | 0.959 | 1.043 | |
| R (0.791)/R2 (0.626)/F (10.024)/p (0.003)/Durbin–Watson (2.010) | ||||||||
| Type D (B1F) | C3 | 1.000 | 0.354 | 0.577 | 2.828 | 0.012 | 1.000 | 1.000 |
| R (0.577)/R2 (0.333)/F (8.000)/p (0.012)/Durbin–Watson (1.688) | ||||||||
| Target Space | Average Illuminance | Characteristics of Indoor Light Environment | Satisfaction and Major Factors with Light Environment | |||
|---|---|---|---|---|---|---|
| Items | Correlation | Satisfaction | ||||
| Type A (1F) | 12 p.m. | 712.5 lx | - 1 window on 1 side of the space (west) - High illuminance indoor light environment at specific time (16 p.m.) - Daylight is concentrated around the window in the northwest (P1) - Arrangement of workspace at the point where daylight inflow is high | A3, A5 C2, C4 D2 | A5, C4 | Usual |
| 14 p.m. | 798.1 lx | |||||
| 16 p.m. | 1206.2 lx | |||||
| Type B (8F) | 12 p.m. | 917.8 lx | - 3 windows on 3 sides of the space (north/south/west) - High illuminance indoor light environment - Furniture and items (documents, bookshelves) are arranged high by windows - Occupants work with their backs to the main window (west) | A2, A3, A4 | A3, A5, D2 | Usual |
| 14 p.m. | 1015.9 lx | |||||
| 16 p.m. | 1127.3 lx | |||||
| Type C (1F) | 12 p.m. | 842.3 lx | - 1 window on 1 side of the space (west) - High illuminance indoor light environment - Daylight flows parallel to the layout of the window - Occupants are affected by daylight in proportion to the distance from the window to the workplace | A3, A5, A6 D2, D3 | A3, A5 | Satisfied |
| 14 p.m. | 935.7 lx | |||||
| 16 p.m. | 1192.4 lx | |||||
| Type D (B1F) | 12 p.m. | 642.6 lx | - Indoor light environment is formed only by artificial light - There is no inflow of daylight - Maintain adequate illuminance regardless of time | A1, A2, A3 | C3 | Very Dissatisfied |
| 14 p.m. | 652.2 lx | |||||
| 16 p.m. | 646.3 lx | |||||
Disclaimer/Publisher’s Note: The statements, opinions and data contained in all publications are solely those of the individual author(s) and contributor(s) and not of MDPI and/or the editor(s). MDPI and/or the editor(s) disclaim responsibility for any injury to people or property resulting from any ideas, methods, instructions or products referred to in the content. |
© 2024 by the authors. Licensee MDPI, Basel, Switzerland. This article is an open access article distributed under the terms and conditions of the Creative Commons Attribution (CC BY) license (https://creativecommons.org/licenses/by/4.0/).
Share and Cite
Kim, K.; Lee, K. Indoor Light Environment Factors That Affect the Psychological Satisfaction of Occupants in Office Facilities. Buildings 2024, 14, 1248. https://doi.org/10.3390/buildings14051248
Kim K, Lee K. Indoor Light Environment Factors That Affect the Psychological Satisfaction of Occupants in Office Facilities. Buildings. 2024; 14(5):1248. https://doi.org/10.3390/buildings14051248
Chicago/Turabian StyleKim, Kirim, and Kyungsun Lee. 2024. "Indoor Light Environment Factors That Affect the Psychological Satisfaction of Occupants in Office Facilities" Buildings 14, no. 5: 1248. https://doi.org/10.3390/buildings14051248
APA StyleKim, K., & Lee, K. (2024). Indoor Light Environment Factors That Affect the Psychological Satisfaction of Occupants in Office Facilities. Buildings, 14(5), 1248. https://doi.org/10.3390/buildings14051248